0000744822fmr:C000053902_NoLoadClassMember_5YRMember2019-10-312024-10-310000744822fmr:C000105581Memberfmr:TH2Member2024-10-310000744822fmr:C000225964Memberfmr:TH4Member2024-10-31
UNITED STATES
SECURITIES AND EXCHANGE COMMISSION
Washington, D.C. 20549
FORM N-CSR
CERTIFIED SHAREHOLDER REPORT OF REGISTERED
MANAGEMENT INVESTMENT COMPANIES
Investment Company Act file number 811-04008
Fidelity Investment Trust
(Exact name of registrant as specified in charter)
245 Summer St., Boston, Massachusetts 02210
(Address of principal executive offices) (Zip code)
Nicole Macarchuk, Secretary
245 Summer St.
Boston, Massachusetts 02210
(Name and address of agent for service)
Registrant's telephone number, including area code:
617-563-7000
| |
Date of fiscal year end: | October 31 |
|
|
Date of reporting period: | October 31, 2024 |
This report on Form N-CSR relates solely to the Registrant’s Fidelity Canada Fund, Fidelity China Region Fund, Fidelity Diversified International Fund, Fidelity Diversified International K6 Fund, Fidelity Emerging Asia Fund, Fidelity Emerging Markets Discovery Fund, Fidelity Emerging Markets Fund, Fidelity Europe Fund, Fidelity Global Equity Income Fund, Fidelity International Capital Appreciation Fund, Fidelity International Capital Appreciation K6 Fund, Fidelity International Discovery Fund, Fidelity International Discovery K6 Fund, Fidelity International Growth Fund, Fidelity International Small Cap Fund, Fidelity International Small Cap Opportunities Fund, Fidelity International Value Fund, Fidelity Japan Fund, Fidelity Japan Smaller Companies Fund, Fidelity Nordic Fund, Fidelity Overseas Fund, Fidelity Pacific Basin Fund, Fidelity Total International Equity Fund, and Fidelity Worldwide Fund (the “Funds”).
Item 1.
Reports to Stockholders
| |
| | ANNUAL SHAREHOLDER REPORT | AS OF OCTOBER 31, 2024 | This report describes changes to the Fund that occurred during the reporting period. |
| | Fidelity® Total International Equity Fund Fidelity Advisor® Total International Equity Fund Class I : FTEIX |
| | | |
This annual shareholder report contains information about Fidelity® Total International Equity Fund for the period November 1, 2023 to October 31, 2024. You can find additional information about the Fund at fundresearch.fidelity.com/prospectus/sec. You can also request this information by contacting us at 1-877-208-0098 or by sending an e-mail to fidfunddocuments@fidelity.com.
What were your Fund costs for the last year?(based on hypothetical $10,000 investment)
FUND COST (PREVIOUS YEAR)
| | Costs of a $10,000 investment | Costs paid as a percentage of a $10,000 investment | |
| Class I | $ 109 | 0.97% | |
What affected the Fund's performance this period?
•International stocks achieved a strong gain for the 12 months ending October 31, 2024. Resilient global economic growth and a slowing in the pace of inflation in certain regions, as well as a shift to global monetary easing, contributed to a favorable backdrop, despite persistent geopolitical risk.
•Against this backdrop, an overweight in the United States and stock picks in Japan contributed to the fund's performance versus the MSCI All Country World ex US Index (Net MA) for the fiscal year.
•By sector, the biggest contributor to performance versus the benchmark was stock selection in materials. An underweight in consumer staples also boosted relative performance. Also bolstering our relative result were picks and an overweight in industrials, primarily within the capital goods industry.
•The top individual relative contributor was an overweight in Taiwan Semiconductor (+100%). The company was the fund's largest holding. The second-largest relative contributor was an overweight in CRH (+83%). The stock was among our largest holdings. An overweight in China Life Insurance (+65%) also contributed.
•In contrast, from a regional standpoint, stock picks in Canada and the United States detracted from the fund's relative result.
•By sector, the biggest detractor from performance versus the benchmark was stock selection in financials. Also hurting our result was security selection in information technology, primarily within the technology hardware & equipment industry, and consumer staples, primarily within the consumer staples distribution & retail industry. Lastly, the fund's position in cash detracted.
•The largest individual relative detractor was an overweight in Samsung Electronics (-13%). The stock was among our biggest holdings. The second-largest relative detractor was an overweight in Wal Mart De Mexico (-21%). This period we increased our stake in Wal Mart De Mexico. An overweight in Edenred (-38%) also detracted.
•Notable changes in positioning include higher allocations to Germany and the United Kingdom. By sector, meaningful changes in positioning include decreased exposure to consumer discretionary and energy.
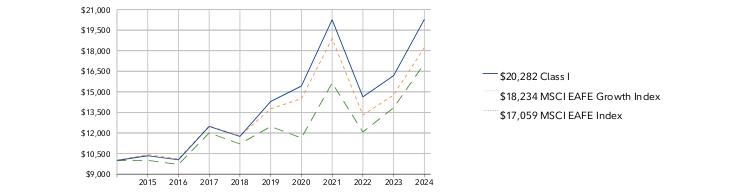
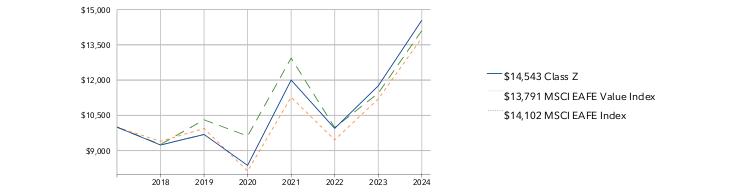
How did the Fund perform over the past 10 years?
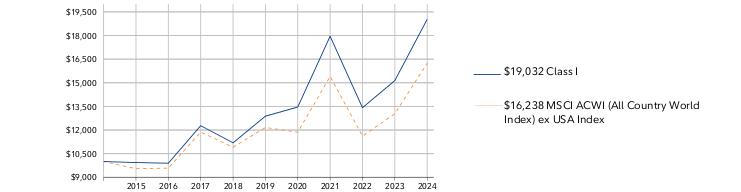
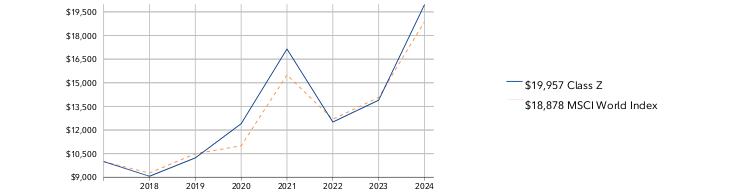
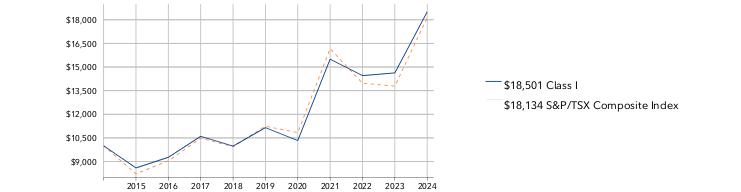
CUMULATIVE PERFORMANCE
October 31, 2014 through October 31, 2024.
Initial investment of $10,000.
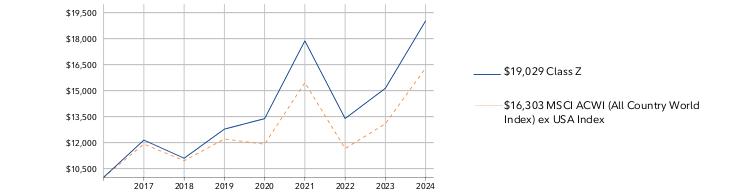
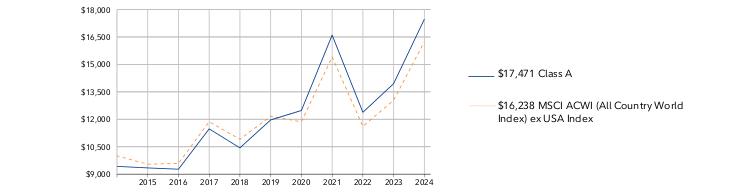
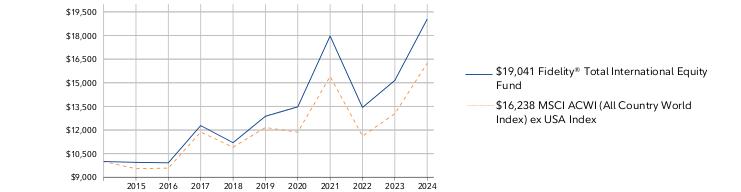
Class I | $10,000 | $9,936 | $9,894 | $12,276 | $11,189 | $12,880 | $13,460 | $17,956 | $13,416 | $15,142 | $19,032 |
MSCI ACWI (All Country World Index) ex USA Index | $10,000 | $9,545 | $9,583 | $11,868 | $10,910 | $12,161 | $11,862 | $15,403 | $11,613 | $13,038 | $16,238 |
| | 2014 | 2015 | 2016 | 2017 | 2018 | 2019 | 2020 | 2021 | 2022 | 2023 | 2024 |
AVERAGE ANNUAL TOTAL RETURNS:| | 1 Year | 5 Year | 10 Year |
| Class I | 25.69% | 8.12% | 6.65% |
| MSCI ACWI (All Country World Index) ex USA Index | 24.55% | 5.95% | 4.97% |
Visit institutional.fidelity.com for more recent performance information. |
The Fund's past performance is not a good predictor of the Fund's future performance. The graph and table do not reflect the deduction of taxes that a shareholder would pay on fund distributions or redemption of fund shares. |
Key Fund Statistics(as of October 31, 2024)
KEY FACTS | | |
| Fund Size | $319,759,338 | |
| Number of Holdings | 305 | |
| Total Advisory Fee | $2,246,403 | |
| Portfolio Turnover | 33% | |
What did the Fund invest in?
(as of October 31, 2024)
MARKET SECTORS (% of Fund's net assets) | | |
| Financials | 23.8 | |
| Industrials | 20.0 | |
| Information Technology | 14.0 | |
| Materials | 10.5 | |
| Consumer Discretionary | 9.5 | |
| Health Care | 5.5 | |
| Energy | 5.0 | |
| Communication Services | 4.2 | |
| Consumer Staples | 3.6 | |
| Real Estate | 0.3 | |
| Utilities | 0.2 | |
| |
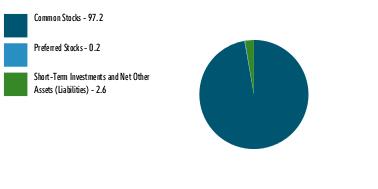
| Common Stocks | 96.4 |
| Preferred Stocks | 0.2 |
| Short-Term Investments and Net Other Assets (Liabilities) | 3.4 |
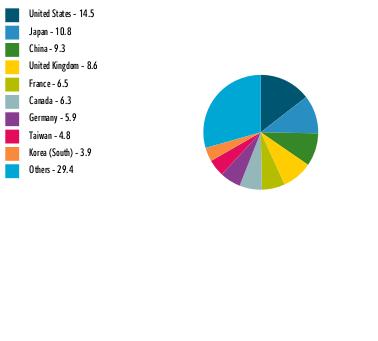
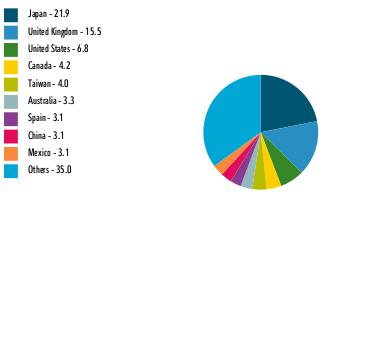
ASSET ALLOCATION (% of Fund's net assets) |
|
|
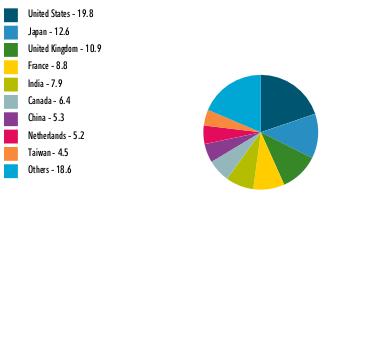
| United States | 14.5 |
| Japan | 10.8 |
| China | 9.3 |
| United Kingdom | 8.6 |
| France | 6.5 |
| Canada | 6.3 |
| Germany | 5.9 |
| Taiwan | 4.8 |
| Korea (South) | 3.9 |
| Others | 29.4 |
GEOGRAPHIC DIVERSIFICATION (% of Fund's net assets) |
|
| |
|
TOP HOLDINGS(% of Fund's net assets) | | |
| Taiwan Semiconductor Manufacturing Co Ltd | 3.4 | |
| Tencent Holdings Ltd | 2.5 | |
| CRH PLC | 1.8 | |
| Samsung Electronics Co Ltd | 1.8 | |
| SAP SE | 1.6 | |
| Novo Nordisk A/S Series B | 1.6 | |
| Linde PLC | 1.6 | |
| ASML Holding NV | 1.5 | |
| Canadian Pacific Kansas City Ltd | 1.5 | |
| BAE Systems PLC | 1.3 | |
| | 18.6 | |
How has the Fund changed?
This is a summary of certain changes to the Fund since November 1, 2023. For more complete information, you may review the Fund's next prospectus, which we expect to be available by December 30, 2024 at fundresearch.fidelity.com/prospectus/sec or upon request at 1-877-208-0098 or by sending an e-mail to fidfunddocuments@fidelity.com.
The fees associated with this class changed during the reporting year.The variations in class fees are primarily the result of the following changes: - Management fee
- Operating expenses
- Performance adjustment fee
- Expense reductions
The fund's transfer agent and pricing & bookkeeping fees were changed to a fixed rate effective December 1, 2023, through February 29, 2024, in anticipation of the transition to a new management fee structure. Effective March 1, 2024, the fund's management contract was amended to incorporate administrative services previously covered under separate services agreements (transfer agent and pricing & bookkeeping). The amended contract incorporates a basic fee rate that may vary by class (subject to a performance adjustment). The Adviser or an affiliate pays certain expenses of managing and operating the fund out of each class's management fee. The class reduced its contractual expense cap during the reporting period. |
|
The fund's sub-advisory agreement with FIL Investments (Japan) Limited was not renewed. | |
| Fidelity, the Fidelity Investments Logo and all other Fidelity trademarks or service marks used herein are trademarks or service marks of FMR LLC. Any third-party marks that are used herein are trademarks or service marks of their respective owners. © 2024 FMR LLC. All rights reserved. |
| | For additional information about the Fund; including its prospectus, financial information, holdings and proxy information, scan the QR code or visit fundresearch.fidelity.com/prospectus/sec 1.9913946.100 1984-TSRA-1224 |
| |
| | ANNUAL SHAREHOLDER REPORT | AS OF OCTOBER 31, 2024 | This report describes changes to the Fund that occurred during the reporting period. |
| | Fidelity® Europe Fund Fidelity Advisor® Europe Fund Class A : FHJUX |
| | | |
This annual shareholder report contains information about Fidelity® Europe Fund for the period November 1, 2023 to October 31, 2024. You can find additional information about the Fund at fundresearch.fidelity.com/prospectus/sec. You can also request this information by contacting us at 1-877-208-0098 or by sending an e-mail to fidfunddocuments@fidelity.com.
What were your Fund costs for the last year?(based on hypothetical $10,000 investment)
FUND COST (PREVIOUS YEAR)
| | Costs of a $10,000 investment | Costs paid as a percentage of a $10,000 investment | |
| Class A | $ 103 | 0.93% | |
What affected the Fund's performance this period?
•International stocks achieved a strong gain for the 12 months ending October 31, 2024. Resilient global economic growth and a slowing in the pace of inflation in certain regions, as well as a shift to global monetary easing, contributed to a favorable backdrop, despite persistent geopolitical risk.
•Against this backdrop, stock picks in Europe ex U.K., primarily in France, and the U.K. detracted from the fund's performance versus the MSCI Europe Index (Net MA) for the fiscal year.
•By sector, security selection was the primary detractor, especially within consumer staples. Picks and an underweight in financials, primarily within the banks industry, also hampered the fund's result. Also hurting our result was stock selection in materials.
•The biggest individual relative detractor was an overweight in Davide Campari Milano (-39%). The second-largest relative detractor was an overweight in Diageo (-16%). Not owning Schneider Electric, a benchmark component that gained roughly 71%, was another notable relative detractor.
•In contrast, from a regional standpoint, an underweight in Europe ex U.K., along with stock selection in Belgium and in Sweden, contributed to the fund's relative result.
•By sector, the biggest contributor to performance versus the benchmark was stock selection in health care, primarily within the pharmaceuticals, biotechnology & life sciences industry. Stock picks in communication services, primarily within the media & entertainment industry, also boosted the fund's relative performance.
•The top individual relative contributor was an overweight in UCB (+165%). Although we reduced the fund's exposure to the stock, it was among the fund's biggest holdings at period end. A second notable relative contributor was an overweight in SAP (+76%). The stock was among our largest holdings, even though we trimmed the position. A non-benchmark stake in Hemnet gained 81% and notably helped.
•Notable changes in positioning include decreased exposure to France and a higher allocation to Italy. By sector, meaningful changes in positioning include increased exposure to communication services and a lower allocation to consumer staples.
How did the Fund perform over the past 10 years?
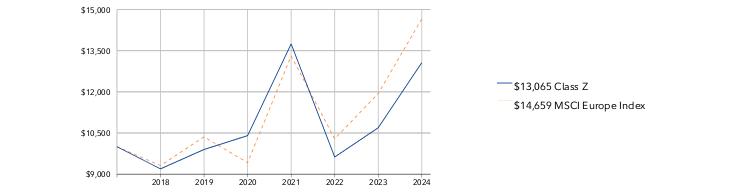
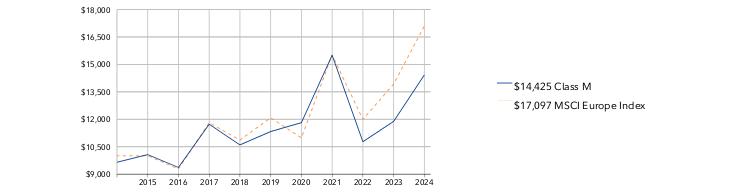
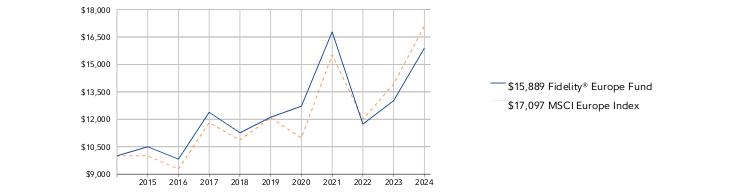
CUMULATIVE PERFORMANCE
October 31, 2014 through October 31, 2024.
Initial investment of $10,000 and the current sales charge was paid.
Class A | $9,425 | $9,861 | $9,201 | $11,558 | $10,481 | $11,237 | $11,756 | $15,471 | $10,784 | $11,926 | $14,517 |
MSCI Europe Index | $10,000 | $10,004 | $9,281 | $11,817 | $10,862 | $12,081 | $10,984 | $15,520 | $11,998 | $13,925 | $17,097 |
| | 2014 | 2015 | 2016 | 2017 | 2018 | 2019 | 2020 | 2021 | 2022 | 2023 | 2024 |
AVERAGE ANNUAL TOTAL RETURNS:| | 1 Year | 5 Year | 10 Year |
| Class A (incl. 5.75% sales charge) | 14.73% | 4.02% | 3.80% |
| Class A (without 5.75% sales charge) | 21.73% | 5.26% | 4.41% |
| MSCI Europe Index | 22.78% | 7.19% | 5.51% |
Visit institutional.fidelity.com for more recent performance information. |
The Fund's past performance is not a good predictor of the Fund's future performance. The graph and table do not reflect the deduction of taxes that a shareholder would pay on fund distributions or redemption of fund shares. |
Key Fund Statistics(as of October 31, 2024)
KEY FACTS | | |
| Fund Size | $580,672,025 | |
| Number of Holdings | 101 | |
| Total Advisory Fee | $3,255,111 | |
| Portfolio Turnover | 31% | |
What did the Fund invest in?
(as of October 31, 2024)
MARKET SECTORS (% of Fund's net assets) | | |
| Financials | 18.9 | |
| Health Care | 16.4 | |
| Industrials | 14.6 | |
| Consumer Discretionary | 12.3 | |
| Information Technology | 11.2 | |
| Consumer Staples | 8.4 | |
| Communication Services | 4.7 | |
| Energy | 4.4 | |
| Materials | 4.1 | |
| Real Estate | 1.0 | |
| Utilities | 0.8 | |
| |
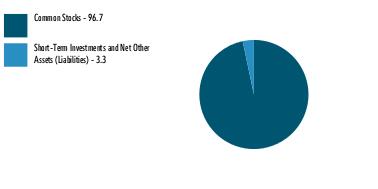
| Common Stocks | 96.7 |
| Preferred Stocks | 0.1 |
| Short-Term Investments and Net Other Assets (Liabilities) | 3.2 |
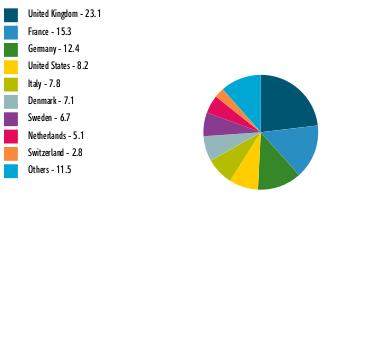
ASSET ALLOCATION (% of Fund's net assets) |
|
|
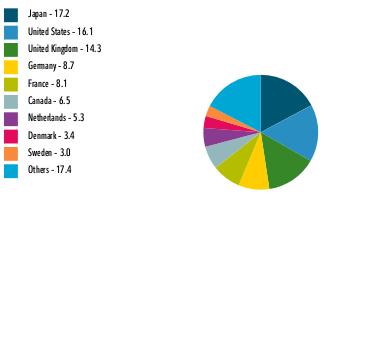
| United Kingdom | 23.1 |
| France | 15.3 |
| Germany | 12.4 |
| United States | 8.2 |
| Italy | 7.8 |
| Denmark | 7.1 |
| Sweden | 6.7 |
| Netherlands | 5.1 |
| Switzerland | 2.8 |
| Others | 11.5 |
GEOGRAPHIC DIVERSIFICATION (% of Fund's net assets) |
|
| |
|
TOP HOLDINGS(% of Fund's net assets) | | |
| Novo Nordisk A/S Series B | 5.6 | |
| SAP SE | 3.9 | |
| ASML Holding NV | 3.8 | |
| Astrazeneca PLC | 3.7 | |
| Shell PLC | 2.7 | |
| RELX PLC | 2.5 | |
| Air Liquide SA | 2.3 | |
| UCB SA | 2.2 | |
| LVMH Moet Hennessy Louis Vuitton SE | 2.1 | |
| UniCredit SpA | 1.7 | |
| | 30.5 | |
How has the Fund changed?
This is a summary of certain changes to the Fund since November 1, 2023. For more complete information, you may review the Fund's next prospectus, which we expect to be available by December 30, 2024 at fundresearch.fidelity.com/prospectus/sec or upon request at 1-877-208-0098 or by sending an e-mail to fidfunddocuments@fidelity.com.
The fees associated with this class changed during the reporting year.The variations in class fees are primarily the result of the following changes: - Management fee
- Operating expenses
The fund's transfer agent and pricing & bookkeeping fees were changed to a fixed rate effective December 1, 2023, through February 29, 2024, in anticipation of the transition to a new management fee structure. Effective March 1, 2024, the fund's management contract was amended to incorporate administrative services previously covered under separate services agreements (transfer agent and pricing & bookkeeping). The amended contract incorporates a basic fee rate that may vary by class (subject to a performance adjustment). The Adviser or an affiliate pays certain expenses of managing and operating the fund out of each class's management fee. | |
| Fidelity, the Fidelity Investments Logo and all other Fidelity trademarks or service marks used herein are trademarks or service marks of FMR LLC. Any third-party marks that are used herein are trademarks or service marks of their respective owners. © 2024 FMR LLC. All rights reserved. |
| | For additional information about the Fund; including its prospectus, financial information, holdings and proxy information, scan the QR code or visit fundresearch.fidelity.com/prospectus/sec 1.9913828.100 2632-TSRA-1224 |
| |
| | ANNUAL SHAREHOLDER REPORT | AS OF OCTOBER 31, 2024 | This report describes changes to the Fund that occurred during the reporting period. |
| | Fidelity® Total International Equity Fund Fidelity Advisor® Total International Equity Fund Class M : FTTEX |
| | | |
This annual shareholder report contains information about Fidelity® Total International Equity Fund for the period November 1, 2023 to October 31, 2024. You can find additional information about the Fund at fundresearch.fidelity.com/prospectus/sec. You can also request this information by contacting us at 1-877-208-0098 or by sending an e-mail to fidfunddocuments@fidelity.com.
What were your Fund costs for the last year?(based on hypothetical $10,000 investment)
FUND COST (PREVIOUS YEAR)
| | Costs of a $10,000 investment | Costs paid as a percentage of a $10,000 investment | |
| Class M | $ 167 | 1.48% | |
What affected the Fund's performance this period?
•International stocks achieved a strong gain for the 12 months ending October 31, 2024. Resilient global economic growth and a slowing in the pace of inflation in certain regions, as well as a shift to global monetary easing, contributed to a favorable backdrop, despite persistent geopolitical risk.
•Against this backdrop, an overweight in the United States and stock picks in Japan contributed to the fund's performance versus the MSCI All Country World ex US Index (Net MA) for the fiscal year.
•By sector, the biggest contributor to performance versus the benchmark was stock selection in materials. An underweight in consumer staples also boosted relative performance. Also bolstering our relative result were picks and an overweight in industrials, primarily within the capital goods industry.
•The top individual relative contributor was an overweight in Taiwan Semiconductor (+100%). The company was the fund's largest holding. The second-largest relative contributor was an overweight in CRH (+83%). The stock was among our largest holdings. An overweight in China Life Insurance (+65%) also contributed.
•In contrast, from a regional standpoint, stock picks in Canada and the United States detracted from the fund's relative result.
•By sector, the biggest detractor from performance versus the benchmark was stock selection in financials. Also hurting our result was security selection in information technology, primarily within the technology hardware & equipment industry, and consumer staples, primarily within the consumer staples distribution & retail industry. Lastly, the fund's position in cash detracted.
•The largest individual relative detractor was an overweight in Samsung Electronics (-13%). The stock was among our biggest holdings. The second-largest relative detractor was an overweight in Wal Mart De Mexico (-21%). This period we increased our stake in Wal Mart De Mexico. An overweight in Edenred (-38%) also detracted.
•Notable changes in positioning include higher allocations to Germany and the United Kingdom. By sector, meaningful changes in positioning include decreased exposure to consumer discretionary and energy.
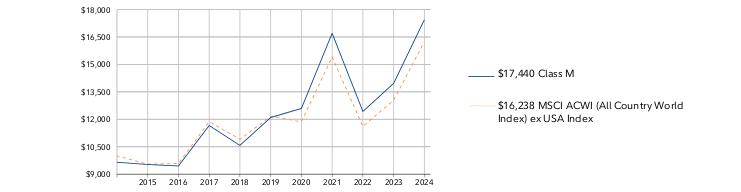
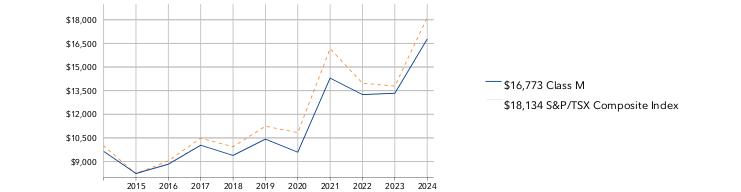
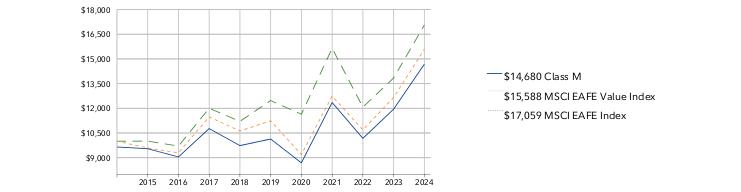
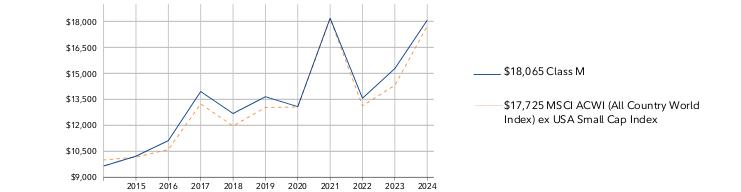
How did the Fund perform over the past 10 years?
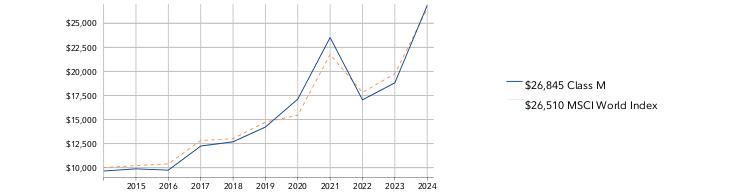
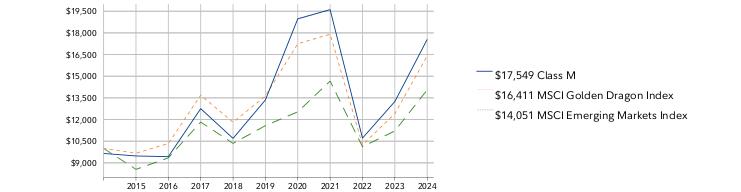
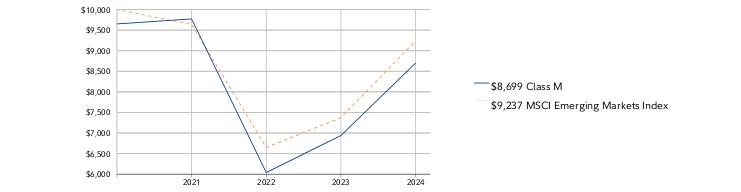
CUMULATIVE PERFORMANCE
October 31, 2014 through October 31, 2024.
Initial investment of $10,000 and the current sales charge was paid.
Class M | $9,650 | $9,528 | $9,446 | $11,657 | $10,573 | $12,094 | $12,593 | $16,702 | $12,427 | $13,962 | $17,440 |
MSCI ACWI (All Country World Index) ex USA Index | $10,000 | $9,545 | $9,583 | $11,868 | $10,910 | $12,161 | $11,862 | $15,403 | $11,613 | $13,038 | $16,238 |
| | 2014 | 2015 | 2016 | 2017 | 2018 | 2019 | 2020 | 2021 | 2022 | 2023 | 2024 |
AVERAGE ANNUAL TOTAL RETURNS:| | 1 Year | 5 Year | 10 Year |
| Class M (incl. 3.50% sales charge) | 20.54% | 6.83% | 5.72% |
| Class M (without 3.50% sales charge) | 24.91% | 7.60% | 6.10% |
| MSCI ACWI (All Country World Index) ex USA Index | 24.55% | 5.95% | 4.97% |
Visit institutional.fidelity.com for more recent performance information. |
The Fund's past performance is not a good predictor of the Fund's future performance. The graph and table do not reflect the deduction of taxes that a shareholder would pay on fund distributions or redemption of fund shares. |
Key Fund Statistics(as of October 31, 2024)
KEY FACTS | | |
| Fund Size | $319,759,338 | |
| Number of Holdings | 305 | |
| Total Advisory Fee | $2,246,403 | |
| Portfolio Turnover | 33% | |
What did the Fund invest in?
(as of October 31, 2024)
MARKET SECTORS (% of Fund's net assets) | | |
| Financials | 23.8 | |
| Industrials | 20.0 | |
| Information Technology | 14.0 | |
| Materials | 10.5 | |
| Consumer Discretionary | 9.5 | |
| Health Care | 5.5 | |
| Energy | 5.0 | |
| Communication Services | 4.2 | |
| Consumer Staples | 3.6 | |
| Real Estate | 0.3 | |
| Utilities | 0.2 | |
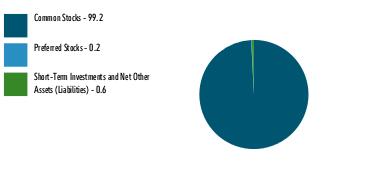
| |
| Common Stocks | 96.4 |
| Preferred Stocks | 0.2 |
| Short-Term Investments and Net Other Assets (Liabilities) | 3.4 |
ASSET ALLOCATION (% of Fund's net assets) |
|
|
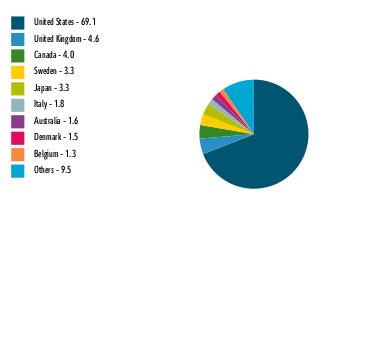
| United States | 14.5 |
| Japan | 10.8 |
| China | 9.3 |
| United Kingdom | 8.6 |
| France | 6.5 |
| Canada | 6.3 |
| Germany | 5.9 |
| Taiwan | 4.8 |
| Korea (South) | 3.9 |
| Others | 29.4 |
GEOGRAPHIC DIVERSIFICATION (% of Fund's net assets) |
|
| |
|
TOP HOLDINGS(% of Fund's net assets) | | |
| Taiwan Semiconductor Manufacturing Co Ltd | 3.4 | |
| Tencent Holdings Ltd | 2.5 | |
| CRH PLC | 1.8 | |
| Samsung Electronics Co Ltd | 1.8 | |
| SAP SE | 1.6 | |
| Novo Nordisk A/S Series B | 1.6 | |
| Linde PLC | 1.6 | |
| ASML Holding NV | 1.5 | |
| Canadian Pacific Kansas City Ltd | 1.5 | |
| BAE Systems PLC | 1.3 | |
| | 18.6 | |
How has the Fund changed?
This is a summary of certain changes to the Fund since November 1, 2023. For more complete information, you may review the Fund's next prospectus, which we expect to be available by December 30, 2024 at fundresearch.fidelity.com/prospectus/sec or upon request at 1-877-208-0098 or by sending an e-mail to fidfunddocuments@fidelity.com.
The fees associated with this class changed during the reporting year.The variations in class fees are primarily the result of the following changes: - Management fee
- Operating expenses
- Performance adjustment fee
- Expense reductions
The fund's transfer agent and pricing & bookkeeping fees were changed to a fixed rate effective December 1, 2023, through February 29, 2024, in anticipation of the transition to a new management fee structure. Effective March 1, 2024, the fund's management contract was amended to incorporate administrative services previously covered under separate services agreements (transfer agent and pricing & bookkeeping). The amended contract incorporates a basic fee rate that may vary by class (subject to a performance adjustment). The Adviser or an affiliate pays certain expenses of managing and operating the fund out of each class's management fee. The class reduced its contractual expense cap during the reporting period. |
|
The fund's sub-advisory agreement with FIL Investments (Japan) Limited was not renewed. | |
| Fidelity, the Fidelity Investments Logo and all other Fidelity trademarks or service marks used herein are trademarks or service marks of FMR LLC. Any third-party marks that are used herein are trademarks or service marks of their respective owners. © 2024 FMR LLC. All rights reserved. |
| | For additional information about the Fund; including its prospectus, financial information, holdings and proxy information, scan the QR code or visit fundresearch.fidelity.com/prospectus/sec 1.9913945.100 1983-TSRA-1224 |
| |
| | ANNUAL SHAREHOLDER REPORT | AS OF OCTOBER 31, 2024 | This report describes changes to the Fund that occurred during the reporting period. |
| | Fidelity® International Discovery Fund Fidelity Advisor® International Discovery Fund Class A : FAIDX |
| | | |
This annual shareholder report contains information about Fidelity® International Discovery Fund for the period November 1, 2023 to October 31, 2024. You can find additional information about the Fund at fundresearch.fidelity.com/prospectus/sec. You can also request this information by contacting us at 1-877-208-0098 or by sending an e-mail to fidfunddocuments@fidelity.com.
What were your Fund costs for the last year?(based on hypothetical $10,000 investment)
FUND COST (PREVIOUS YEAR)
| | Costs of a $10,000 investment | Costs paid as a percentage of a $10,000 investment | |
| Class A | $ 100 | 0.87% | |
What affected the Fund's performance this period?
•International stocks achieved a strong gain for the 12 months ending October 31, 2024. Resilient global economic growth and a slowing in the pace of inflation in certain regions, as well as a shift to global monetary easing, contributed to a favorable backdrop, despite persistent geopolitical risk.
•Against this backdrop, picks in Europe ex U.K. and Japan contributed to the fund's performance versus the MSCI EAFE Index (Net MA) for the fiscal year.
•By sector, the biggest contributor to performance versus the benchmark was stock picking in industrials, primarily within the capital goods industry. Stock picking and an overweight in information technology, primarily within the semiconductors & semiconductor equipment industry, also boosted the fund's relative performance, as did stock picking in consumer discretionary.
•The top individual relative contributor was our non-benchmark stake in Nvidia (+121%). This period we decreased our investment in Nvidia. A second notable relative contributor was our non-benchmark stake in Taiwan Semiconductor (+96%). The company was one of our largest holdings. Another notable relative contributor was an overweight in Hitachi (+109%), the fund's biggest holding at period end.
•In contrast, from a regional standpoint, a non-benchmark allocation to Canada and an underweight in Asia Pacific ex Japan detracted from the fund's relative result.
•By sector, the biggest detractor from performance versus the benchmark was stock selection in consumer staples. Security selection in financials also hampered the fund's result. Also hurting our result were stock picks and an underweight in communication services, primarily within the media & entertainment industry. Lastly, the fund's position in cash detracted.
•The fund's non-benchmark stake in PDD returned -47% and was the largest individual relative detractor. This was a position we established this period. A second notable relative detractor was an overweight in L'Oréal (-9%), which was among the fund's biggest holdings this period. A non-benchmark stake in One97 Communications returned about -29% and notably hurt. The stock was not held at period end.
•Notable changes in positioning include increased exposure to Germany and a lower allocation to India. By sector, meaningful changes in positioning include increased exposure to industrials and a lower allocation to consumer staples.
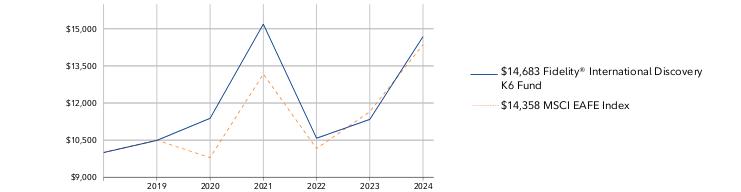
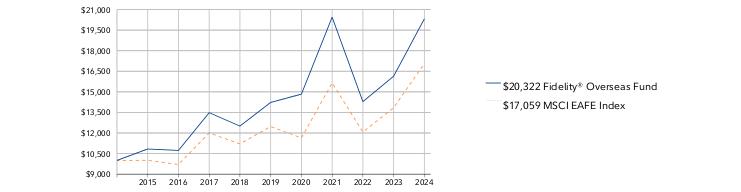
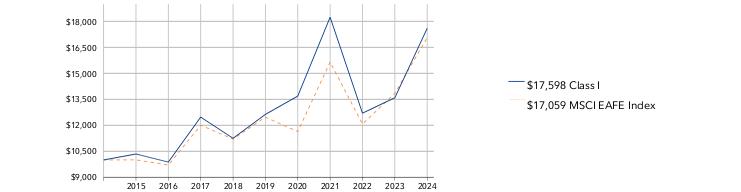
How did the Fund perform over the past 10 years?
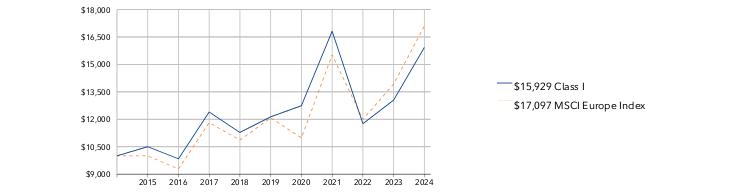
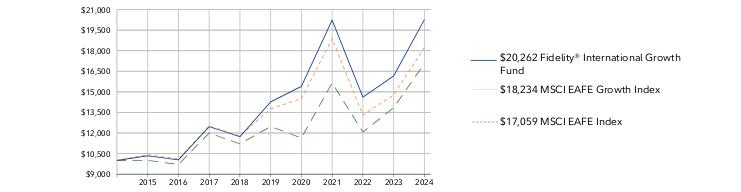
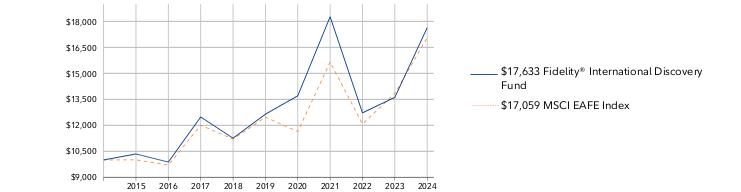
CUMULATIVE PERFORMANCE
October 31, 2014 through October 31, 2024.
Initial investment of $10,000 and the current sales charge was paid.
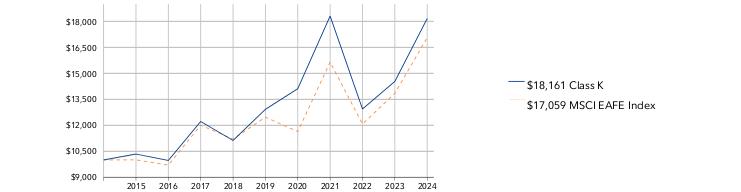
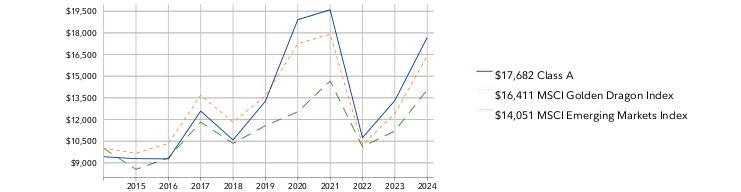
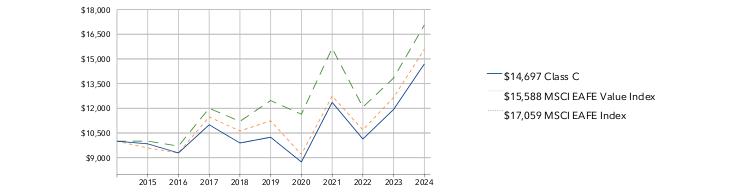
Class A | $9,425 | $9,716 | $9,247 | $11,639 | $10,463 | $11,708 | $12,647 | $16,803 | $11,666 | $12,442 | $16,068 |
MSCI EAFE Index | $10,000 | $10,008 | $9,705 | $12,004 | $11,206 | $12,472 | $11,638 | $15,647 | $12,073 | $13,841 | $17,059 |
| | 2014 | 2015 | 2016 | 2017 | 2018 | 2019 | 2020 | 2021 | 2022 | 2023 | 2024 |
AVERAGE ANNUAL TOTAL RETURNS:| | 1 Year | 5 Year | 10 Year |
| Class A (incl. 5.75% sales charge) | 21.72% | 5.28% | 4.86% |
| Class A (without 5.75% sales charge) | 29.14% | 6.54% | 5.48% |
| MSCI EAFE Index | 23.25% | 6.46% | 5.49% |
Visit institutional.fidelity.com for more recent performance information. |
The Fund's past performance is not a good predictor of the Fund's future performance. The graph and table do not reflect the deduction of taxes that a shareholder would pay on fund distributions or redemption of fund shares. |
Key Fund Statistics(as of October 31, 2024)
KEY FACTS | | |
| Fund Size | $9,841,033,775 | |
| Number of Holdings | 142 | |
| Total Advisory Fee | $45,667,963 | |
| Portfolio Turnover | 44% | |
What did the Fund invest in?
(as of October 31, 2024)
MARKET SECTORS (% of Fund's net assets) | | |
| Financials | 22.3 | |
| Industrials | 22.0 | |
| Consumer Discretionary | 14.1 | |
| Information Technology | 11.8 | |
| Health Care | 9.8 | |
| Materials | 5.4 | |
| Consumer Staples | 4.1 | |
| Communication Services | 3.3 | |
| Energy | 3.1 | |
| Real Estate | 1.0 | |
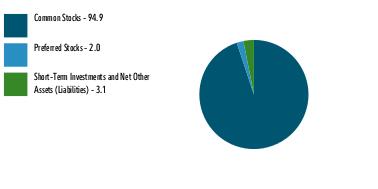
| |
| Common Stocks | 96.2 |
| Preferred Stocks | 0.7 |
| Short-Term Investments and Net Other Assets (Liabilities) | 3.1 |
ASSET ALLOCATION (% of Fund's net assets) |
|
|
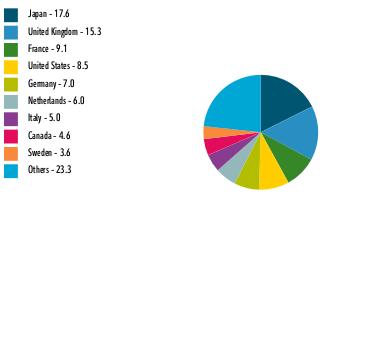
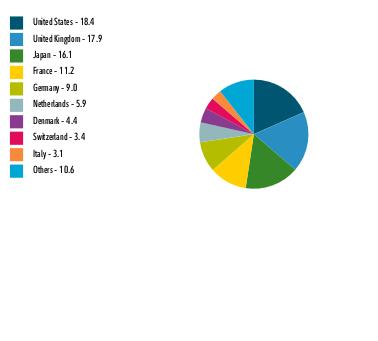
| Japan | 17.6 |
| United Kingdom | 15.3 |
| France | 9.1 |
| United States | 8.5 |
| Germany | 7.0 |
| Netherlands | 6.0 |
| Italy | 5.0 |
| Canada | 4.6 |
| Sweden | 3.6 |
| Others | 23.3 |
GEOGRAPHIC DIVERSIFICATION (% of Fund's net assets) |
|
| |
|
TOP HOLDINGS(% of Fund's net assets) | | |
| Hitachi Ltd | 3.1 | |
| UniCredit SpA | 2.7 | |
| Novo Nordisk A/S Series B | 2.7 | |
| ASML Holding NV | 2.1 | |
| Taiwan Semiconductor Manufacturing Co Ltd | 2.0 | |
| Constellation Software Inc/Canada | 2.0 | |
| Unilever PLC | 2.0 | |
| Compass Group PLC | 1.7 | |
| UCB SA | 1.7 | |
| ITOCHU Corp | 1.6 | |
| | 21.6 | |
How has the Fund changed?
This is a summary of certain changes to the Fund since November 1, 2023. For more complete information, you may review the Fund's next prospectus, which we expect to be available by December 30, 2024 at fundresearch.fidelity.com/prospectus/sec or upon request at 1-877-208-0098 or by sending an e-mail to fidfunddocuments@fidelity.com.
The fees associated with this class changed during the reporting year.The variations in class fees are primarily the result of the following changes: - Management fee
- Performance adjustment fee
- Operating expenses
The fund's transfer agent and pricing & bookkeeping fees were changed to a fixed rate effective December 1, 2023, through February 29, 2024, in anticipation of the transition to a new management fee structure. Effective March 1, 2024, the fund's management contract was amended to incorporate administrative services previously covered under separate services agreements (transfer agent and pricing & bookkeeping). The amended contract incorporates a basic fee rate that may vary by class (subject to a performance adjustment). The Adviser or an affiliate pays certain expenses of managing and operating the fund out of each class's management fee. | The fund's sub-advisory agreement with FIL Investments (Japan) Limited was not renewed.
|
| Fidelity, the Fidelity Investments Logo and all other Fidelity trademarks or service marks used herein are trademarks or service marks of FMR LLC. Any third-party marks that are used herein are trademarks or service marks of their respective owners. © 2024 FMR LLC. All rights reserved. |
| | For additional information about the Fund; including its prospectus, financial information, holdings and proxy information, scan the QR code or visit fundresearch.fidelity.com/prospectus/sec 1.9913835.100 1397-TSRA-1224 |
| |
| | ANNUAL SHAREHOLDER REPORT | AS OF OCTOBER 31, 2024 | This report describes changes to the Fund that occurred during the reporting period. |
| | Fidelity® International Discovery Fund Fidelity® International Discovery Fund Class K : FIDKX |
| | | |
This annual shareholder report contains information about Fidelity® International Discovery Fund for the period November 1, 2023 to October 31, 2024. You can find additional information about the Fund at fundresearch.fidelity.com/prospectus/sec. You can also request this information by contacting us at 1-800-835-5092 or by sending an e-mail to fidfunddocuments@fidelity.com.
What were your Fund costs for the last year?(based on hypothetical $10,000 investment)
FUND COST (PREVIOUS YEAR)
| | Costs of a $10,000 investment | Costs paid as a percentage of a $10,000 investment | |
| Class K | $ 58 | 0.51% | |
What affected the Fund's performance this period?
•International stocks achieved a strong gain for the 12 months ending October 31, 2024. Resilient global economic growth and a slowing in the pace of inflation in certain regions, as well as a shift to global monetary easing, contributed to a favorable backdrop, despite persistent geopolitical risk.
•Against this backdrop, picks in Europe ex U.K. and Japan contributed to the fund's performance versus the MSCI EAFE Index (Net MA) for the fiscal year.
•By sector, the biggest contributor to performance versus the benchmark was stock picking in industrials, primarily within the capital goods industry. Stock picking and an overweight in information technology, primarily within the semiconductors & semiconductor equipment industry, also boosted the fund's relative performance, as did stock picking in consumer discretionary.
•The top individual relative contributor was our non-benchmark stake in Nvidia (+121%). This period we decreased our investment in Nvidia. A second notable relative contributor was our non-benchmark stake in Taiwan Semiconductor (+96%). The company was one of our largest holdings. Another notable relative contributor was an overweight in Hitachi (+109%), the fund's biggest holding at period end.
•In contrast, from a regional standpoint, a non-benchmark allocation to Canada and an underweight in Asia Pacific ex Japan detracted from the fund's relative result.
•By sector, the biggest detractor from performance versus the benchmark was stock selection in consumer staples. Security selection in financials also hampered the fund's result. Also hurting our result were stock picks and an underweight in communication services, primarily within the media & entertainment industry. Lastly, the fund's position in cash detracted.
•The fund's non-benchmark stake in PDD returned -47% and was the largest individual relative detractor. This was a position we established this period. A second notable relative detractor was an overweight in L'Oréal (-9%), which was among the fund's biggest holdings this period. A non-benchmark stake in One97 Communications returned about -29% and notably hurt. The stock was not held at period end.
•Notable changes in positioning include increased exposure to Germany and a lower allocation to India. By sector, meaningful changes in positioning include increased exposure to industrials and a lower allocation to consumer staples.
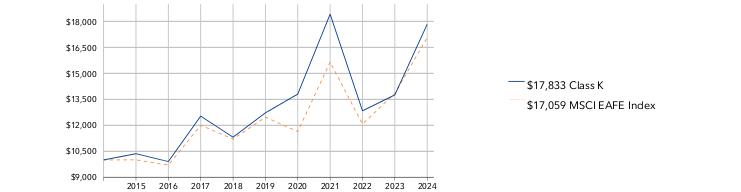
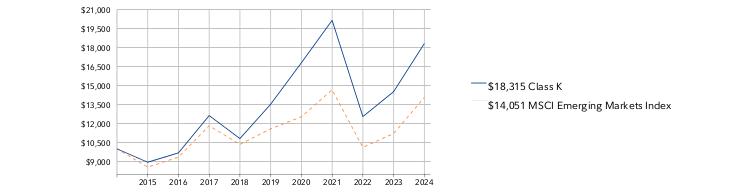
How did the Fund perform over the past 10 years?
CUMULATIVE PERFORMANCE
October 31, 2014 through October 31, 2024.
Initial investment of $10,000.
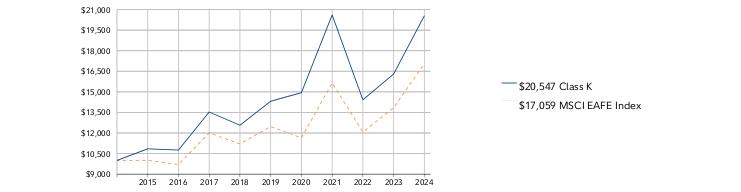
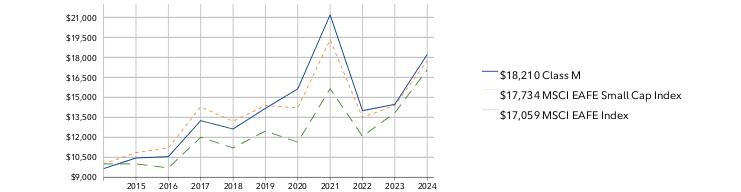
Class K | $10,000 | $10,361 | $9,907 | $12,530 | $11,315 | $12,718 | $13,802 | $18,413 | $12,838 | $13,755 | $17,833 |
MSCI EAFE Index | $10,000 | $10,008 | $9,705 | $12,004 | $11,206 | $12,472 | $11,638 | $15,647 | $12,073 | $13,841 | $17,059 |
| | 2014 | 2015 | 2016 | 2017 | 2018 | 2019 | 2020 | 2021 | 2022 | 2023 | 2024 |
AVERAGE ANNUAL TOTAL RETURNS:| | 1 Year | 5 Year | 10 Year |
| Class K | 29.64% | 6.99% | 5.96% |
| MSCI EAFE Index | 23.25% | 6.46% | 5.49% |
Visit www.401k.com for more recent performance information. |
The Fund's past performance is not a good predictor of the Fund's future performance. The graph and table do not reflect the deduction of taxes that a shareholder would pay on fund distributions or redemption of fund shares. |
Key Fund Statistics(as of October 31, 2024)
KEY FACTS | | |
| Fund Size | $9,841,033,775 | |
| Number of Holdings | 142 | |
| Total Advisory Fee | $45,667,963 | |
| Portfolio Turnover | 44% | |
What did the Fund invest in?
(as of October 31, 2024)
MARKET SECTORS (% of Fund's net assets) | | |
| Financials | 22.3 | |
| Industrials | 22.0 | |
| Consumer Discretionary | 14.1 | |
| Information Technology | 11.8 | |
| Health Care | 9.8 | |
| Materials | 5.4 | |
| Consumer Staples | 4.1 | |
| Communication Services | 3.3 | |
| Energy | 3.1 | |
| Real Estate | 1.0 | |
| |
| Common Stocks | 96.2 |
| Preferred Stocks | 0.7 |
| Short-Term Investments and Net Other Assets (Liabilities) | 3.1 |
ASSET ALLOCATION (% of Fund's net assets) |
|
|
| Japan | 17.6 |
| United Kingdom | 15.3 |
| France | 9.1 |
| United States | 8.5 |
| Germany | 7.0 |
| Netherlands | 6.0 |
| Italy | 5.0 |
| Canada | 4.6 |
| Sweden | 3.6 |
| Others | 23.3 |
GEOGRAPHIC DIVERSIFICATION (% of Fund's net assets) |
|
| |
|
TOP HOLDINGS(% of Fund's net assets) | | |
| Hitachi Ltd | 3.1 | |
| UniCredit SpA | 2.7 | |
| Novo Nordisk A/S Series B | 2.7 | |
| ASML Holding NV | 2.1 | |
| Taiwan Semiconductor Manufacturing Co Ltd | 2.0 | |
| Constellation Software Inc/Canada | 2.0 | |
| Unilever PLC | 2.0 | |
| Compass Group PLC | 1.7 | |
| UCB SA | 1.7 | |
| ITOCHU Corp | 1.6 | |
| | 21.6 | |
How has the Fund changed?
This is a summary of certain changes to the Fund since November 1, 2023. For more complete information, you may review the Fund's next prospectus, which we expect to be available by December 30, 2024 at fundresearch.fidelity.com/prospectus/sec or upon request at 1-800-835-5092 or by sending an e-mail to fidfunddocuments@fidelity.com.
The fees associated with this class changed during the reporting year.The variations in class fees are primarily the result of the following changes: - Management fee
- Performance adjustment fee
The fund's transfer agent and pricing & bookkeeping fees were changed to a fixed rate effective December 1, 2023, through February 29, 2024, in anticipation of the transition to a new management fee structure. Effective March 1, 2024, the fund's management contract was amended to incorporate administrative services previously covered under separate services agreements (transfer agent and pricing & bookkeeping). The amended contract incorporates a basic fee rate that may vary by class (subject to a performance adjustment). The Adviser or an affiliate pays certain expenses of managing and operating the fund out of each class's management fee. | The fund's sub-advisory agreement with FIL Investments (Japan) Limited was not renewed.
|
| Fidelity, the Fidelity Investments Logo and all other Fidelity trademarks or service marks used herein are trademarks or service marks of FMR LLC. Any third-party marks that are used herein are trademarks or service marks of their respective owners. © 2024 FMR LLC. All rights reserved. |
| | For additional information about the Fund; including its prospectus, financial information, holdings and proxy information, scan the QR code or visit fundresearch.fidelity.com/prospectus/sec 1.9913839.100 2093-TSRA-1224 |
| |
| | ANNUAL SHAREHOLDER REPORT | AS OF OCTOBER 31, 2024 | |
| | Fidelity® International Capital Appreciation K6 Fund Fidelity® International Capital Appreciation K6 Fund : FAPCX |
| | | |
This annual shareholder report contains information about Fidelity® International Capital Appreciation K6 Fund for the period November 1, 2023 to October 31, 2024. You can find additional information about the Fund at fundresearch.fidelity.com/prospectus/sec. You can also request this information by contacting us at 1-800-835-5092 or by sending an e-mail to fidfunddocuments@fidelity.com.
What were your Fund costs for the last year?(based on hypothetical $10,000 investment)
FUND COST (PREVIOUS YEAR)
| | Costs of a $10,000 investment | Costs paid as a percentage of a $10,000 investment | |
| Fidelity® International Capital Appreciation K6 Fund | $ 75 | 0.66% | |
What affected the Fund's performance this period?
•International stocks achieved a strong gain for the 12 months ending October 31, 2024. Resilient global economic growth and a slowing in the pace of inflation in certain regions, as well as a shift to global monetary easing, contributed to a favorable backdrop, despite persistent geopolitical risk.
•Against this backdrop, security selection and an underweight in emerging markets and stock selection in Europe ex U.K. contributed to the fund's performance versus the MSCI All Country World ex US Index (Net MA) for the fiscal year.
•By sector, market selection was the primary contributor, led by an overweight in information technology, where an overweight in semiconductors & semiconductor equipment helped most. Picks and an overweight in industrials also boosted relative performance. Also contributing to our result was a lack of exposure to the lagging energy sector.
•The fund's non-benchmark stake in Nvidia gained 221% and was the top individual relative contributor. The stock was not held at period end. A second notable relative contributor was an overweight in Taiwan Semiconductor Manufacturing (+99%). The company was the fund's largest holding. Another notable relative contributor was an overweight in Brookfield Asset Management (+91%).
•In contrast, from a regional standpoint, security selection in Canada and an overweight in Europe ex U.K., primarily in France, detracted from the fund's relative result.
•By sector, the biggest detractor from performance versus the benchmark was stock selection in information technology, primarily within the software & services industry. Also hurting our result were stock picks in consumer staples and health care.
•The biggest individual relative detractor was our stake in OBIC (-23%). A second notable relative detractor was an underweight in Shopify (+66%). An overweight in LVMH Moet Hennessy Louis Vuitton (-5%) also hurt. The stock was among our largest holdings.
•Notable changes in positioning include increased exposure to China and Japan. By sector, meaningful changes in positioning include increased exposure to communication services and a lower allocation to consumer staples, where we liquidated all of the fund's holdings.
How did the Fund perform over the life of Fund?
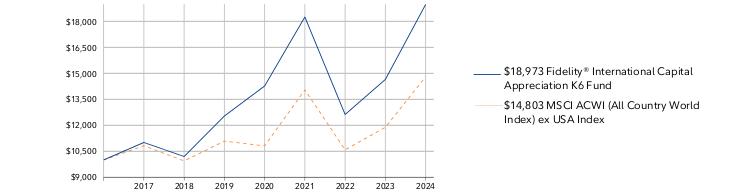
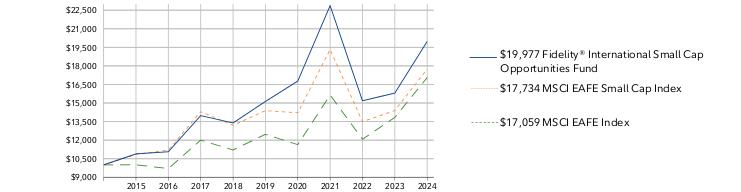
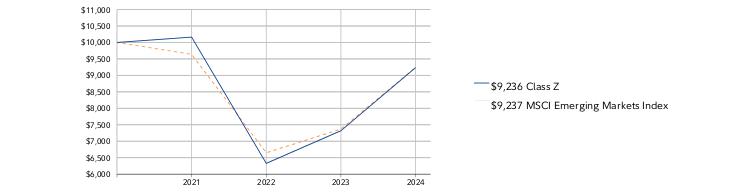
CUMULATIVE PERFORMANCE
May 25, 2017 through October 31, 2024.
Initial investment of $10,000.
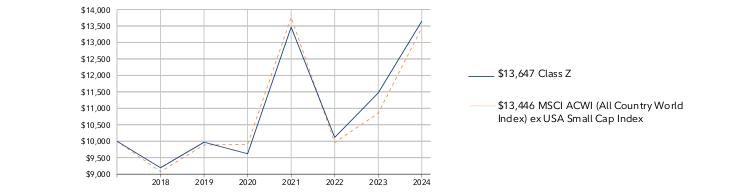
Fidelity® International Capital Appreciation K6 Fund | $10,000 | $11,010 | $10,199 | $12,535 | $14,267 | $18,252 | $12,624 | $14,646 |
MSCI ACWI (All Country World Index) ex USA Index | $10,000 | $10,820 | $9,946 | $11,087 | $10,814 | $14,042 | $10,587 | $11,886 |
| | 2017 | 2018 | 2019 | 2020 | 2021 | 2022 | 2023 | 2024 |
AVERAGE ANNUAL TOTAL RETURNS:| | 1 Year | 5 Year | Life of Fund A |
| Fidelity® International Capital Appreciation K6 Fund | 29.54% | 8.64% | 8.99% |
| MSCI ACWI (All Country World Index) ex USA Index | 24.55% | 5.95% | 5.41% |
A From May 25, 2017
Visit www.401k.com for more recent performance information. |
The Fund's past performance is not a good predictor of the Fund's future performance. The graph and table do not reflect the deduction of taxes that a shareholder would pay on fund distributions or redemption of fund shares. |
Key Fund Statistics(as of October 31, 2024)
KEY FACTS | | |
| Fund Size | $1,620,633,433 | |
| Number of Holdings | 62 | |
| Total Advisory Fee | $10,484,013 | |
| Portfolio Turnover | 84% | |
What did the Fund invest in?
(as of October 31, 2024)
MARKET SECTORS (% of Fund's net assets) | | |
| Industrials | 30.5 | |
| Financials | 21.2 | |
| Information Technology | 18.1 | |
| Consumer Discretionary | 11.5 | |
| Materials | 8.7 | |
| Health Care | 4.5 | |
| Communication Services | 4.1 | |
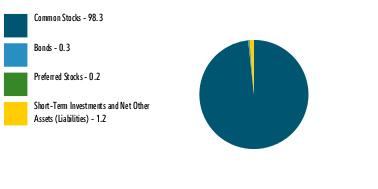
| |
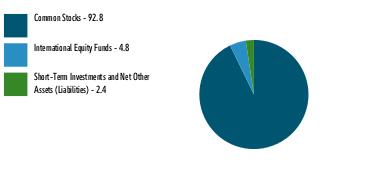
| Common Stocks | 98.6 |
| Short-Term Investments and Net Other Assets (Liabilities) | 1.4 |
ASSET ALLOCATION (% of Fund's net assets) |
|
|
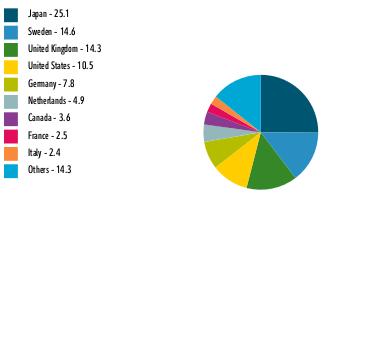
| United States | 20.2 |
| Japan | 12.6 |
| United Kingdom | 11.1 |
| France | 8.8 |
| India | 7.8 |
| Canada | 6.2 |
| China | 5.3 |
| Netherlands | 5.1 |
| Taiwan | 4.5 |
| Others | 18.4 |
GEOGRAPHIC DIVERSIFICATION (% of Fund's net assets) |
|
| |
|
TOP HOLDINGS(% of Fund's net assets) | | |
| Taiwan Semiconductor Manufacturing Co Ltd | 4.5 | |
| Novo Nordisk A/S Series B | 2.9 | |
| Tencent Holdings Ltd | 2.5 | |
| SAP SE | 2.5 | |
| ASML Holding NV | 2.3 | |
| LVMH Moet Hennessy Louis Vuitton SE | 2.3 | |
| Schneider Electric SE | 2.1 | |
| Hitachi Ltd | 1.9 | |
| ABB Ltd | 1.8 | |
| Keyence Corp | 1.7 | |
| | 24.5 | |
| Fidelity, the Fidelity Investments Logo and all other Fidelity trademarks or service marks used herein are trademarks or service marks of FMR LLC. Any third-party marks that are used herein are trademarks or service marks of their respective owners. © 2024 FMR LLC. All rights reserved. |
| | For additional information about the Fund; including its prospectus, financial information, holdings and proxy information, scan the QR code or visit fundresearch.fidelity.com/prospectus/sec 1.9913993.100 2953-TSRA-1224 |
| |
| | ANNUAL SHAREHOLDER REPORT | AS OF OCTOBER 31, 2024 | This report describes changes to the Fund that occurred during the reporting period. |
| | Fidelity® International Discovery Fund Fidelity Advisor® International Discovery Fund Class C : FCADX |
| | | |
This annual shareholder report contains information about Fidelity® International Discovery Fund for the period November 1, 2023 to October 31, 2024. You can find additional information about the Fund at fundresearch.fidelity.com/prospectus/sec. You can also request this information by contacting us at 1-877-208-0098 or by sending an e-mail to fidfunddocuments@fidelity.com.
What were your Fund costs for the last year?(based on hypothetical $10,000 investment)
FUND COST (PREVIOUS YEAR)
| | Costs of a $10,000 investment | Costs paid as a percentage of a $10,000 investment | |
| Class C | $ 184 | 1.62% | |
What affected the Fund's performance this period?
•International stocks achieved a strong gain for the 12 months ending October 31, 2024. Resilient global economic growth and a slowing in the pace of inflation in certain regions, as well as a shift to global monetary easing, contributed to a favorable backdrop, despite persistent geopolitical risk.
•Against this backdrop, picks in Europe ex U.K. and Japan contributed to the fund's performance versus the MSCI EAFE Index (Net MA) for the fiscal year.
•By sector, the biggest contributor to performance versus the benchmark was stock picking in industrials, primarily within the capital goods industry. Stock picking and an overweight in information technology, primarily within the semiconductors & semiconductor equipment industry, also boosted the fund's relative performance, as did stock picking in consumer discretionary.
•The top individual relative contributor was our non-benchmark stake in Nvidia (+121%). This period we decreased our investment in Nvidia. A second notable relative contributor was our non-benchmark stake in Taiwan Semiconductor (+96%). The company was one of our largest holdings. Another notable relative contributor was an overweight in Hitachi (+109%), the fund's biggest holding at period end.
•In contrast, from a regional standpoint, a non-benchmark allocation to Canada and an underweight in Asia Pacific ex Japan detracted from the fund's relative result.
•By sector, the biggest detractor from performance versus the benchmark was stock selection in consumer staples. Security selection in financials also hampered the fund's result. Also hurting our result were stock picks and an underweight in communication services, primarily within the media & entertainment industry. Lastly, the fund's position in cash detracted.
•The fund's non-benchmark stake in PDD returned -47% and was the largest individual relative detractor. This was a position we established this period. A second notable relative detractor was an overweight in L'Oréal (-9%), which was among the fund's biggest holdings this period. A non-benchmark stake in One97 Communications returned about -29% and notably hurt. The stock was not held at period end.
•Notable changes in positioning include increased exposure to Germany and a lower allocation to India. By sector, meaningful changes in positioning include increased exposure to industrials and a lower allocation to consumer staples.
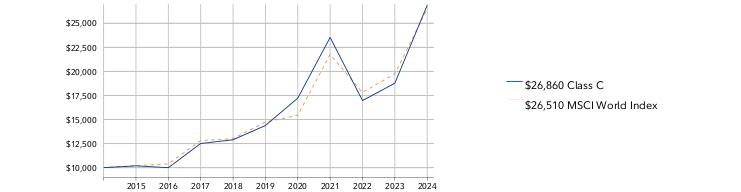
How did the Fund perform over the past 10 years?
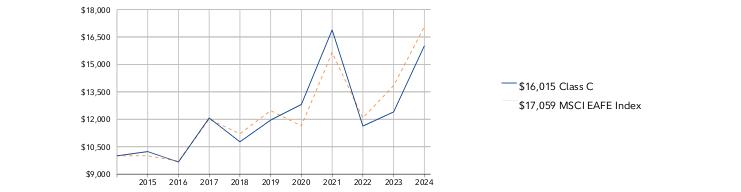
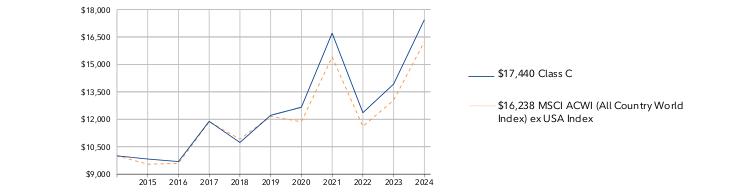
CUMULATIVE PERFORMANCE
October 31, 2014 through October 31, 2024.
Initial investment of $10,000.
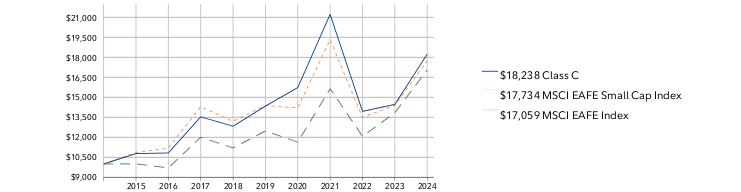
Class C | $10,000 | $10,233 | $9,663 | $12,072 | $10,767 | $11,954 | $12,813 | $16,886 | $11,628 | $12,401 | $16,015 |
MSCI EAFE Index | $10,000 | $10,008 | $9,705 | $12,004 | $11,206 | $12,472 | $11,638 | $15,647 | $12,073 | $13,841 | $17,059 |
| | 2014 | 2015 | 2016 | 2017 | 2018 | 2019 | 2020 | 2021 | 2022 | 2023 | 2024 |
AVERAGE ANNUAL TOTAL RETURNS:| | 1 Year | 5 Year | 10 Year |
| Class C (incl. contingent deferred sales charge) | 27.20% | 5.71% | 4.82% |
| Class C | 28.20% | 5.71% | 4.82% |
| MSCI EAFE Index | 23.25% | 6.46% | 5.49% |
Visit institutional.fidelity.com for more recent performance information. |
The Fund's past performance is not a good predictor of the Fund's future performance. The graph and table do not reflect the deduction of taxes that a shareholder would pay on fund distributions or redemption of fund shares. |
Key Fund Statistics(as of October 31, 2024)
KEY FACTS | | |
| Fund Size | $9,841,033,775 | |
| Number of Holdings | 142 | |
| Total Advisory Fee | $45,667,963 | |
| Portfolio Turnover | 44% | |
What did the Fund invest in?
(as of October 31, 2024)
MARKET SECTORS (% of Fund's net assets) | | |
| Financials | 22.3 | |
| Industrials | 22.0 | |
| Consumer Discretionary | 14.1 | |
| Information Technology | 11.8 | |
| Health Care | 9.8 | |
| Materials | 5.4 | |
| Consumer Staples | 4.1 | |
| Communication Services | 3.3 | |
| Energy | 3.1 | |
| Real Estate | 1.0 | |
| |
| Common Stocks | 96.2 |
| Preferred Stocks | 0.7 |
| Short-Term Investments and Net Other Assets (Liabilities) | 3.1 |
ASSET ALLOCATION (% of Fund's net assets) |
|
|
| Japan | 17.6 |
| United Kingdom | 15.3 |
| France | 9.1 |
| United States | 8.5 |
| Germany | 7.0 |
| Netherlands | 6.0 |
| Italy | 5.0 |
| Canada | 4.6 |
| Sweden | 3.6 |
| Others | 23.3 |
GEOGRAPHIC DIVERSIFICATION (% of Fund's net assets) |
|
| |
|
TOP HOLDINGS(% of Fund's net assets) | | |
| Hitachi Ltd | 3.1 | |
| UniCredit SpA | 2.7 | |
| Novo Nordisk A/S Series B | 2.7 | |
| ASML Holding NV | 2.1 | |
| Taiwan Semiconductor Manufacturing Co Ltd | 2.0 | |
| Constellation Software Inc/Canada | 2.0 | |
| Unilever PLC | 2.0 | |
| Compass Group PLC | 1.7 | |
| UCB SA | 1.7 | |
| ITOCHU Corp | 1.6 | |
| | 21.6 | |
How has the Fund changed?
This is a summary of certain changes to the Fund since November 1, 2023. For more complete information, you may review the Fund's next prospectus, which we expect to be available by December 30, 2024 at fundresearch.fidelity.com/prospectus/sec or upon request at 1-877-208-0098 or by sending an e-mail to fidfunddocuments@fidelity.com.
The fees associated with this class changed during the reporting year.The variations in class fees are primarily the result of the following changes: - Management fee
- Performance adjustment fee
- Operating expenses
The fund's transfer agent and pricing & bookkeeping fees were changed to a fixed rate effective December 1, 2023, through February 29, 2024, in anticipation of the transition to a new management fee structure. Effective March 1, 2024, the fund's management contract was amended to incorporate administrative services previously covered under separate services agreements (transfer agent and pricing & bookkeeping). The amended contract incorporates a basic fee rate that may vary by class (subject to a performance adjustment). The Adviser or an affiliate pays certain expenses of managing and operating the fund out of each class's management fee. | The fund's sub-advisory agreement with FIL Investments (Japan) Limited was not renewed.
|
| Fidelity, the Fidelity Investments Logo and all other Fidelity trademarks or service marks used herein are trademarks or service marks of FMR LLC. Any third-party marks that are used herein are trademarks or service marks of their respective owners. © 2024 FMR LLC. All rights reserved. |
| | For additional information about the Fund; including its prospectus, financial information, holdings and proxy information, scan the QR code or visit fundresearch.fidelity.com/prospectus/sec 1.9913836.100 1399-TSRA-1224 |
| |
| | ANNUAL SHAREHOLDER REPORT | AS OF OCTOBER 31, 2024 | This report describes changes to the Fund that occurred during the reporting period. |
| | Fidelity® Emerging Markets Discovery Fund Fidelity® Emerging Markets Discovery Fund : FEDDX |
| | | |
This annual shareholder report contains information about Fidelity® Emerging Markets Discovery Fund for the period November 1, 2023 to October 31, 2024. You can find additional information about the Fund at fundresearch.fidelity.com/prospectus/sec. You can also request this information by contacting us at 1-800-544-8544 or by sending an e-mail to fidfunddocuments@fidelity.com.
What were your Fund costs for the last year?(based on hypothetical $10,000 investment)
FUND COST (PREVIOUS YEAR)
| | Costs of a $10,000 investment | Costs paid as a percentage of a $10,000 investment | |
| Fidelity® Emerging Markets Discovery Fund | $ 107 | 1.00% | |
What affected the Fund's performance this period?
•International stocks achieved a strong gain for the 12 months ending October 31, 2024. Resilient global economic growth and a slowing in the pace of inflation in certain regions, as well as a shift to global monetary easing, contributed to a favorable backdrop, despite persistent geopolitical risk.
•Against this backdrop, an underweight in Emerging Asia, primarily in India, and stock picking and an overweight in Latin America, primarily in Brazil, detracted from the fund's performance versus the MSCI Emerging Markets SMID Index (Net MA) for the fiscal year.
•By sector, security selection was the primary detractor, especially within financials. Also hurting our result were stock picks in health care, primarily within the pharmaceuticals, biotechnology & life sciences industry, and consumer staples.
•The largest individual relative detractor was our stake in Pharmaron Beijing (-48%). The second-largest relative detractor was Hanon Systems (-52%). The stock was not held at period end. Another notable relative detractor was an overweight in Nanya Technology (-34%).
•In contrast, from a regional standpoint, stock selection in Africa, primarily in South Africa, and stock picks and an underweight in the Middle East, primarily in United Arab Emirates, contributed to the fund's relative result.
•By sector, the biggest contributor to performance versus the benchmark was security selection in communication services, primarily within the media & entertainment industry. Stock picks and an underweight in materials and stock selection and an overweight in industrials, primarily within the capital goods industry, also boosted the fund's relative performance.
•The top individual relative contributor was an overweight in International Games System (+243%). This period we decreased our investment in the stock, which was nonetheless one of our largest holdings as of October 31. The second-largest relative contributor was a non-benchmark stake in Hindustan Aeronautics (+136%), where we decreased our investment this period. Another notable relative contributor was an overweight in Bharat Electronics (+111%).
•Notable changes in positioning include increased exposure to Taiwan and South Africa. By sector, meaningful changes in positioning include lower allocations to health care and utilities.
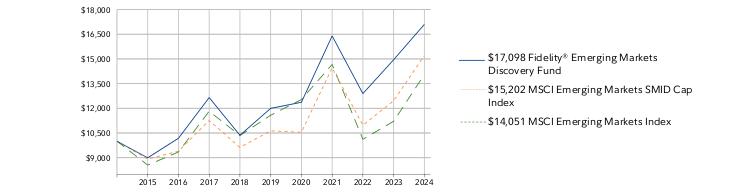
How did the Fund perform over the past 10 years?
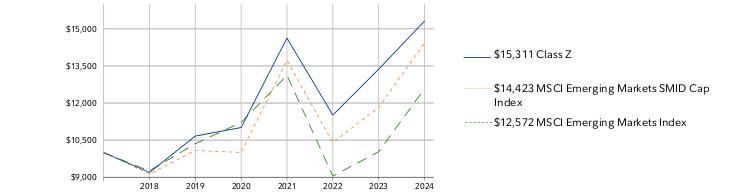
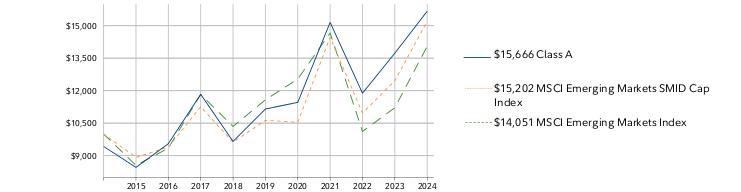
CUMULATIVE PERFORMANCE
October 31, 2014 through October 31, 2024.
Initial investment of $10,000.
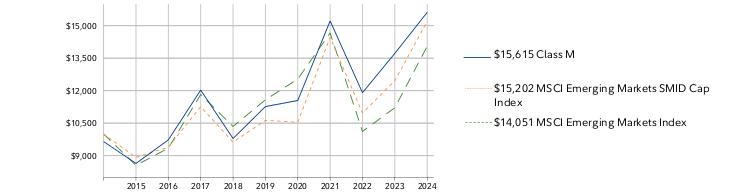
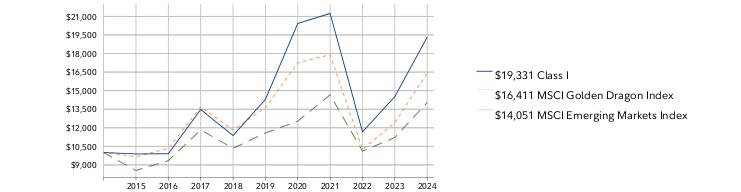
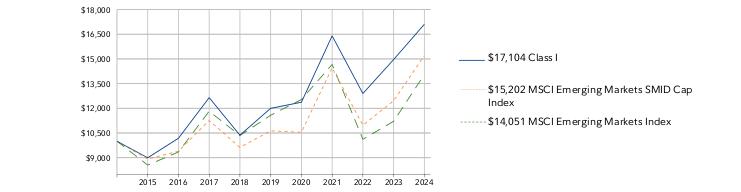
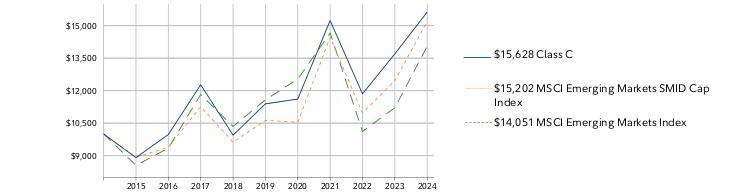
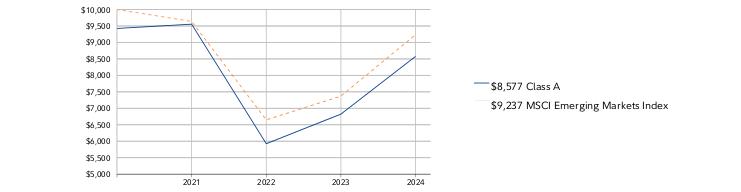
Fidelity® Emerging Markets Discovery Fund | $10,000 | $8,993 | $10,178 | $12,652 | $10,361 | $11,996 | $12,364 | $16,398 | $12,893 | $14,948 | $17,098 |
MSCI Emerging Markets SMID Cap Index | $10,000 | $8,919 | $9,391 | $11,258 | $9,624 | $10,629 | $10,543 | $14,461 | $10,969 | $12,456 | $15,202 |
MSCI Emerging Markets Index | $10,000 | $8,550 | $9,346 | $11,823 | $10,347 | $11,577 | $12,535 | $14,663 | $10,115 | $11,211 | $14,051 |
| | 2014 | 2015 | 2016 | 2017 | 2018 | 2019 | 2020 | 2021 | 2022 | 2023 | 2024 |
AVERAGE ANNUAL TOTAL RETURNS:| | 1 Year | 5 Year | 10 Year |
| Fidelity® Emerging Markets Discovery Fund | 14.38% | 7.35% | 5.51% |
| MSCI Emerging Markets SMID Cap Index | 22.04% | 7.42% | 4.28% |
| MSCI Emerging Markets Index | 25.33% | 3.95% | 3.46% |
Visit www.fidelity.com for more recent performance information. |
The Fund's past performance is not a good predictor of the Fund's future performance. The graph and table do not reflect the deduction of taxes that a shareholder would pay on fund distributions or redemption of fund shares. |
Key Fund Statistics(as of October 31, 2024)
KEY FACTS | | |
| Fund Size | $1,183,237,609 | |
| Number of Holdings | 111 | |
| Total Advisory Fee | $10,611,763 | |
| Portfolio Turnover | 29% | |
What did the Fund invest in?
(as of October 31, 2024)
MARKET SECTORS (% of Fund's net assets) | | |
| Industrials | 21.0 | |
| Consumer Discretionary | 18.3 | |
| Financials | 14.5 | |
| Information Technology | 10.9 | |
| Consumer Staples | 7.8 | |
| Real Estate | 7.4 | |
| Health Care | 4.6 | |
| Materials | 4.6 | |
| Utilities | 3.9 | |
| Energy | 3.3 | |
| Communication Services | 3.2 | |
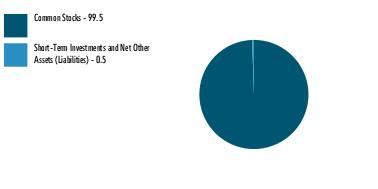
| |
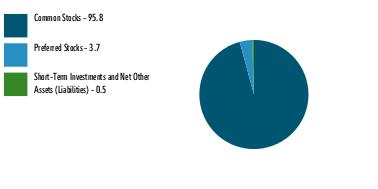
| Common Stocks | 99.5 |
| Short-Term Investments and Net Other Assets (Liabilities) | 0.5 |
ASSET ALLOCATION (% of Fund's net assets) |
|
|
| China | 21.4 |
| Taiwan | 17.6 |
| India | 13.3 |
| Brazil | 11.7 |
| Korea (South) | 6.2 |
| South Africa | 5.4 |
| Mexico | 4.8 |
| Saudi Arabia | 2.3 |
| Hong Kong | 2.2 |
| Others | 15.1 |
GEOGRAPHIC DIVERSIFICATION (% of Fund's net assets) |
|
| |
|
TOP HOLDINGS(% of Fund's net assets) | | |
| Impala Platinum Holdings Ltd | 1.8 | |
| Shriram Finance Ltd | 1.4 | |
| SITC International Holdings Co Ltd | 1.4 | |
| Bizlink Holding Inc | 1.4 | |
| Yageo Corp | 1.4 | |
| Torrent Pharmaceuticals Ltd | 1.3 | |
| Mr Price Group Ltd | 1.3 | |
| International Games System Co Ltd | 1.3 | |
| Nien Made Enterprise Co Ltd | 1.3 | |
| Coway Co Ltd | 1.3 | |
| | 13.9 | |
How has the Fund changed?
This is a summary of certain changes to the Fund since November 1, 2023. For more complete information, you may review the Fund's next prospectus, which we expect to be available by December 30, 2024 at fundresearch.fidelity.com/prospectus/sec or upon request at 1-800-544-8544 or by sending an e-mail to fidfunddocuments@fidelity.com.
The fees associated with this class changed during the reporting year.The variations in class fees are primarily the result of the following changes: - Management fee
- Operating expenses
The fund's transfer agent and pricing & bookkeeping fees were changed to a fixed rate effective December 1, 2023, through February 29, 2024, in anticipation of the transition to a new management fee structure. Effective March 1, 2024, the fund's management contract was amended to incorporate administrative services previously covered under separate services agreements (transfer agent and pricing & bookkeeping). The amended contract incorporates a management fee rate that may vary by class. The Adviser or an affiliate pays certain expenses of managing and operating the fund out of each class's management fee. | The fund's sub-advisory agreement with FIL Investments (Japan) Limited was not renewed
|
| Fidelity, the Fidelity Investments Logo and all other Fidelity trademarks or service marks used herein are trademarks or service marks of FMR LLC. Any third-party marks that are used herein are trademarks or service marks of their respective owners. © 2024 FMR LLC. All rights reserved. |
| | For additional information about the Fund; including its prospectus, financial information, holdings and proxy information, scan the QR code or visit fundresearch.fidelity.com/prospectus/sec 1.9913973.100 2374-TSRA-1224 |
| |
| | ANNUAL SHAREHOLDER REPORT | AS OF OCTOBER 31, 2024 | This report describes changes to the Fund that occurred during the reporting period. |
| | Fidelity® Japan Fund Fidelity® Japan Fund : FJPNX |
| | | |
This annual shareholder report contains information about Fidelity® Japan Fund for the period November 1, 2023 to October 31, 2024. You can find additional information about the Fund at fundresearch.fidelity.com/prospectus/sec. You can also request this information by contacting us at 1-800-544-8544 or by sending an e-mail to fidfunddocuments@fidelity.com.
What were your Fund costs for the last year?(based on hypothetical $10,000 investment)
FUND COST (PREVIOUS YEAR)
| | Costs of a $10,000 investment | Costs paid as a percentage of a $10,000 investment | |
| Fidelity® Japan Fund | $ 76 | 0.68% | |
What affected the Fund's performance this period?
•International stocks achieved a strong gain for the 12 months ending October 31, 2024. Resilient global economic growth and a slowing in the pace of inflation in certain regions, as well as a shift to global monetary easing, contributed to a favorable backdrop, despite persistent geopolitical risk.
•With that said, in March 2024, the Bank of Japan raised short-term interest rates for the first time in 17 years, ending its negative interest rate policy.
•Against this backdrop, stock selection in Japan and a non-benchmark allocation to the United States contributed to the fund's performance versus the TOPIX Total Return Index for the fiscal year.
•By sector, security selection was the primary contributor, led by industrials, where our stock picks in capital goods helped most. Stock picking in financials and consumer discretionary also boosted the fund's relative performance.
•The top individual relative contributor was an overweight in IHI (+196%). The second-largest relative contributor was an overweight in Hitachi (+109%). The stock was among the fund's largest holdings. An overweight in Dexerials (+115%) also helped. We trimmed our stakes in all three stocks.
•In contrast, from a regional standpoint, non-benchmark allocations to emerging markets and Asia Pacific ex Japan modestly detracted from the fund's relative result.
•By sector, the biggest detractor from performance versus the benchmark was stock selection in information technology, primarily within the semiconductors & semiconductor equipment industry. Security selection in energy also hampered the fund's result. Also hurting our result was an underweight in industrials, primarily within the capital goods industry.
•The largest individual relative detractor this period was avoiding Recruit Holdings, a benchmark component that gained 120%. The second-largest relative detractor was our non-benchmark stake in JTOWER (-31%). The stock was not held at period end. An overweight in TechnoPro Holdings (-4%) also hurt, and we reduced our exposure to the stock.
•By sector, meaningful changes in positioning include increased exposure to materials and industrials.
How did the Fund perform over the past 10 years?
CUMULATIVE PERFORMANCE
October 31, 2014 through October 31, 2024.
Initial investment of $10,000.
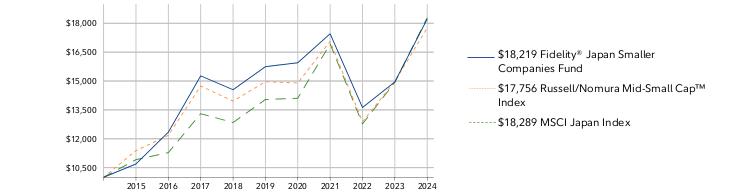
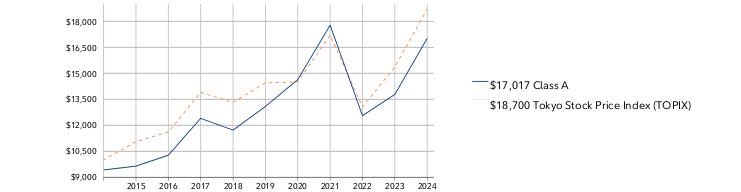
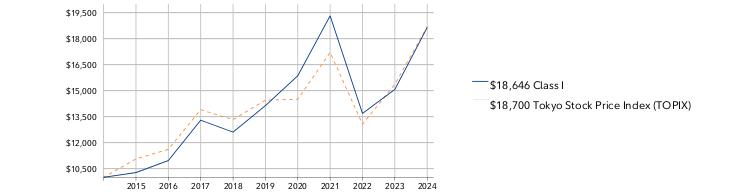
Fidelity® Japan Fund | $10,000 | $10,266 | $10,964 | $13,280 | $12,579 | $14,101 | $15,816 | $19,257 | $13,642 | $15,012 | $18,581 |
Tokyo Stock Price Index (TOPIX) | $10,000 | $11,061 | $11,611 | $13,898 | $13,325 | $14,450 | $14,503 | $17,203 | $13,066 | $15,363 | $18,700 |
| | 2014 | 2015 | 2016 | 2017 | 2018 | 2019 | 2020 | 2021 | 2022 | 2023 | 2024 |
AVERAGE ANNUAL TOTAL RETURNS:| | 1 Year | 5 Year | 10 Year |
| Fidelity® Japan Fund | 23.78% | 5.67% | 6.39% |
| Tokyo Stock Price Index (TOPIX) | 21.72% | 5.29% | 6.46% |
Visit www.fidelity.com for more recent performance information. |
The Fund's past performance is not a good predictor of the Fund's future performance. The graph and table do not reflect the deduction of taxes that a shareholder would pay on fund distributions or redemption of fund shares. |
Key Fund Statistics(as of October 31, 2024)
KEY FACTS | | |
| Fund Size | $692,986,086 | |
| Number of Holdings | 89 | |
| Total Advisory Fee | $3,522,427 | |
| Portfolio Turnover | 21% | |
What did the Fund invest in?
(as of October 31, 2024)
MARKET SECTORS (% of Fund's net assets) | | |
| Industrials | 25.1 | |
| Information Technology | 18.9 | |
| Consumer Discretionary | 14.7 | |
| Financials | 13.4 | |
| Materials | 7.8 | |
| Health Care | 7.1 | |
| Communication Services | 4.2 | |
| Consumer Staples | 3.2 | |
| Energy | 1.9 | |
| Utilities | 1.9 | |
| Real Estate | 1.1 | |
| |
| Common Stocks | 99.3 |
| Short-Term Investments and Net Other Assets (Liabilities) | 0.7 |
ASSET ALLOCATION (% of Fund's net assets) |
|
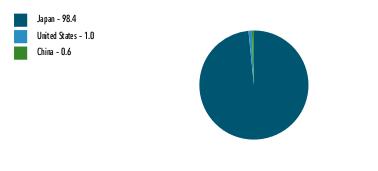
|
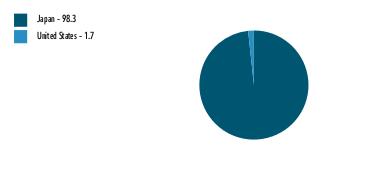
| Japan | 98.4 |
| United States | 1.0 |
| China | 0.6 |
GEOGRAPHIC DIVERSIFICATION (% of Fund's net assets) |
|
| |
|
TOP HOLDINGS(% of Fund's net assets) | | |
| Sumitomo Mitsui Financial Group Inc | 6.0 | |
| Hitachi Ltd | 5.0 | |
| Sony Group Corp | 3.8 | |
| Shin-Etsu Chemical Co Ltd | 3.3 | |
| Hoya Corp | 3.3 | |
| ORIX Corp | 3.1 | |
| Renesas Electronics Corp | 2.7 | |
| Fujitsu Ltd | 2.6 | |
| FUJIFILM Holdings Corp | 2.4 | |
| Denso Corp | 2.3 | |
| | 34.5 | |
How has the Fund changed?
This is a summary of certain changes to the Fund since November 1, 2023. For more complete information, you may review the Fund's next prospectus, which we expect to be available by December 30, 2024 at fundresearch.fidelity.com/prospectus/sec or upon request at 1-800-544-8544 or by sending an e-mail to fidfunddocuments@fidelity.com.
The fees associated with this class changed during the reporting year.The variations in class fees are primarily the result of the following changes: - Management fee
- Performance adjustment fee
- Operating expenses
The fund's transfer agent and pricing & bookkeeping fees were changed to a fixed rate effective December 1, 2023, through February 29, 2024, in anticipation of the transition to a new management fee structure. Effective March 1, 2024, the fund's management contract was amended to incorporate administrative services previously covered under separate services agreements (transfer agent and pricing & bookkeeping). The amended contract incorporates a basic fee rate that may vary by class (subject to a performance adjustment). The Adviser or an affiliate pays certain expenses of managing and operating the fund out of each class's management fee. | The fund's sub-advisory agreement with FIL Investments (Japan) Limited was not renewed.
|
| Fidelity, the Fidelity Investments Logo and all other Fidelity trademarks or service marks used herein are trademarks or service marks of FMR LLC. Any third-party marks that are used herein are trademarks or service marks of their respective owners. © 2024 FMR LLC. All rights reserved. |
| | For additional information about the Fund; including its prospectus, financial information, holdings and proxy information, scan the QR code or visit fundresearch.fidelity.com/prospectus/sec 1.9913887.100 350-TSRA-1224 |
| |
| | ANNUAL SHAREHOLDER REPORT | AS OF OCTOBER 31, 2024 | This report describes changes to the Fund that occurred during the reporting period. |
| | Fidelity® Japan Fund Fidelity Advisor® Japan Fund Class M : FJPTX |
| | | |
This annual shareholder report contains information about Fidelity® Japan Fund for the period November 1, 2023 to October 31, 2024. You can find additional information about the Fund at fundresearch.fidelity.com/prospectus/sec. You can also request this information by contacting us at 1-877-208-0098 or by sending an e-mail to fidfunddocuments@fidelity.com.
What were your Fund costs for the last year?(based on hypothetical $10,000 investment)
FUND COST (PREVIOUS YEAR)
| | Costs of a $10,000 investment | Costs paid as a percentage of a $10,000 investment | |
| Class M | $ 136 | 1.22% | |
What affected the Fund's performance this period?
•International stocks achieved a strong gain for the 12 months ending October 31, 2024. Resilient global economic growth and a slowing in the pace of inflation in certain regions, as well as a shift to global monetary easing, contributed to a favorable backdrop, despite persistent geopolitical risk.
•With that said, in March 2024, the Bank of Japan raised short-term interest rates for the first time in 17 years, ending its negative interest rate policy.
•Against this backdrop, stock selection in Japan and a non-benchmark allocation to the United States contributed to the fund's performance versus the TOPIX Total Return Index for the fiscal year.
•By sector, security selection was the primary contributor, led by industrials, where our stock picks in capital goods helped most. Stock picking in financials and consumer discretionary also boosted the fund's relative performance.
•The top individual relative contributor was an overweight in IHI (+196%). The second-largest relative contributor was an overweight in Hitachi (+109%). The stock was among the fund's largest holdings. An overweight in Dexerials (+115%) also helped. We trimmed our stakes in all three stocks.
•In contrast, from a regional standpoint, non-benchmark allocations to emerging markets and Asia Pacific ex Japan modestly detracted from the fund's relative result.
•By sector, the biggest detractor from performance versus the benchmark was stock selection in information technology, primarily within the semiconductors & semiconductor equipment industry. Security selection in energy also hampered the fund's result. Also hurting our result was an underweight in industrials, primarily within the capital goods industry.
•The largest individual relative detractor this period was avoiding Recruit Holdings, a benchmark component that gained 120%. The second-largest relative detractor was our non-benchmark stake in JTOWER (-31%). The stock was not held at period end. An overweight in TechnoPro Holdings (-4%) also hurt, and we reduced our exposure to the stock.
•By sector, meaningful changes in positioning include increased exposure to materials and industrials.
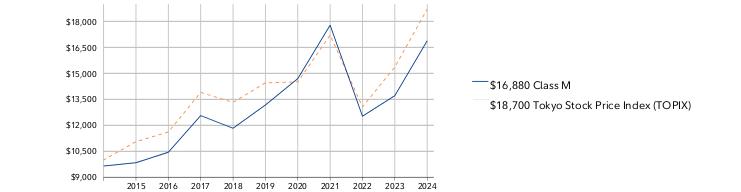
How did the Fund perform over the past 10 years?
CUMULATIVE PERFORMANCE
October 31, 2014 through October 31, 2024.
Initial investment of $10,000 and the current sales charge was paid.
Class M | $9,650 | $9,841 | $10,446 | $12,560 | $11,831 | $13,172 | $14,693 | $17,779 | $12,525 | $13,712 | $16,880 |
Tokyo Stock Price Index (TOPIX) | $10,000 | $11,061 | $11,611 | $13,898 | $13,325 | $14,450 | $14,503 | $17,203 | $13,066 | $15,363 | $18,700 |
| | 2014 | 2015 | 2016 | 2017 | 2018 | 2019 | 2020 | 2021 | 2022 | 2023 | 2024 |
AVERAGE ANNUAL TOTAL RETURNS:| | 1 Year | 5 Year | 10 Year |
| Class M (incl. 3.50% sales charge) | 18.79% | 4.34% | 5.37% |
| Class M (without 3.50% sales charge) | 23.10% | 5.09% | 5.75% |
| Tokyo Stock Price Index (TOPIX) | 21.72% | 5.29% | 6.46% |
Visit institutional.fidelity.com for more recent performance information. |
The Fund's past performance is not a good predictor of the Fund's future performance. The graph and table do not reflect the deduction of taxes that a shareholder would pay on fund distributions or redemption of fund shares. |
Key Fund Statistics(as of October 31, 2024)
KEY FACTS | | |
| Fund Size | $692,986,086 | |
| Number of Holdings | 89 | |
| Total Advisory Fee | $3,522,427 | |
| Portfolio Turnover | 21% | |
What did the Fund invest in?
(as of October 31, 2024)
MARKET SECTORS (% of Fund's net assets) | | |
| Industrials | 25.1 | |
| Information Technology | 18.9 | |
| Consumer Discretionary | 14.7 | |
| Financials | 13.4 | |
| Materials | 7.8 | |
| Health Care | 7.1 | |
| Communication Services | 4.2 | |
| Consumer Staples | 3.2 | |
| Energy | 1.9 | |
| Utilities | 1.9 | |
| Real Estate | 1.1 | |
| |
| Common Stocks | 99.3 |
| Short-Term Investments and Net Other Assets (Liabilities) | 0.7 |
ASSET ALLOCATION (% of Fund's net assets) |
|
|
| Japan | 98.4 |
| United States | 1.0 |
| China | 0.6 |
GEOGRAPHIC DIVERSIFICATION (% of Fund's net assets) |
|
| |
|
TOP HOLDINGS(% of Fund's net assets) | | |
| Sumitomo Mitsui Financial Group Inc | 6.0 | |
| Hitachi Ltd | 5.0 | |
| Sony Group Corp | 3.8 | |
| Shin-Etsu Chemical Co Ltd | 3.3 | |
| Hoya Corp | 3.3 | |
| ORIX Corp | 3.1 | |
| Renesas Electronics Corp | 2.7 | |
| Fujitsu Ltd | 2.6 | |
| FUJIFILM Holdings Corp | 2.4 | |
| Denso Corp | 2.3 | |
| | 34.5 | |
How has the Fund changed?
This is a summary of certain changes to the Fund since November 1, 2023. For more complete information, you may review the Fund's next prospectus, which we expect to be available by December 30, 2024 at fundresearch.fidelity.com/prospectus/sec or upon request at 1-877-208-0098 or by sending an e-mail to fidfunddocuments@fidelity.com.
The fees associated with this class changed during the reporting year.The variations in class fees are primarily the result of the following changes: - Management fee
- Performance adjustment fee
- Operating expenses
- Expense reductions
The fund's transfer agent and pricing & bookkeeping fees were changed to a fixed rate effective December 1, 2023, through February 29, 2024, in anticipation of the transition to a new management fee structure. Effective March 1, 2024, the fund's management contract was amended to incorporate administrative services previously covered under separate services agreements (transfer agent and pricing & bookkeeping). The amended contract incorporates a basic fee rate that may vary by class (subject to a performance adjustment). The Adviser or an affiliate pays certain expenses of managing and operating the fund out of each class's management fee. | The fund's sub-advisory agreement with FIL Investments (Japan) Limited was not renewed.
|
| Fidelity, the Fidelity Investments Logo and all other Fidelity trademarks or service marks used herein are trademarks or service marks of FMR LLC. Any third-party marks that are used herein are trademarks or service marks of their respective owners. © 2024 FMR LLC. All rights reserved. |
| | For additional information about the Fund; including its prospectus, financial information, holdings and proxy information, scan the QR code or visit fundresearch.fidelity.com/prospectus/sec 1.9913884.100 2259-TSRA-1224 |
| |
| | ANNUAL SHAREHOLDER REPORT | AS OF OCTOBER 31, 2024 | This report describes changes to the Fund that occurred during the reporting period. |
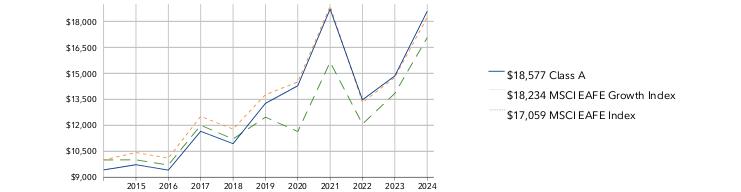
| | Fidelity® International Value Fund Fidelity Advisor® International Value Fund Class A : FIVMX |
| | | |
This annual shareholder report contains information about Fidelity® International Value Fund for the period November 1, 2023 to October 31, 2024. You can find additional information about the Fund at fundresearch.fidelity.com/prospectus/sec. You can also request this information by contacting us at 1-877-208-0098 or by sending an e-mail to fidfunddocuments@fidelity.com.
What were your Fund costs for the last year?(based on hypothetical $10,000 investment)
FUND COST (PREVIOUS YEAR)
| | Costs of a $10,000 investment | Costs paid as a percentage of a $10,000 investment | |
| Class A | $ 128 | 1.14% | |
What affected the Fund's performance this period?
•International stocks achieved a strong gain for the 12 months ending October 31, 2024. Resilient global economic growth and a slowing in the pace of inflation in certain regions, as well as a shift to global monetary easing, contributed to a favorable backdrop, despite persistent geopolitical risk.
•Against this backdrop, stock selection in Japan and security selection and an overweight in the United States contributed to the fund's performance versus the MSCI EAFE Value Index (Net MA) for the fiscal year.
•By sector, security selection was the primary contributor, especially within industrials, where our stock picks in capital goods helped most. Security selection in materials also boosted the fund's relative performance. Also contributing to our result was an overweight in financials.
•The top individual relative contributor was an overweight in Hitachi (+110%). The company was among the fund's biggest holdings. A second notable relative contributor was an overweight in Mitsubishi Heavy Industries (+162%). This was a stake we established this period. Another notable relative contributor was our non-benchmark stake in Rheinmetall (+82%). The stock was among our biggest holdings this period.
•In contrast, from a regional standpoint, stock picks in the U.K. and Asia Pacific ex Japan, primarily in Australia, detracted from the fund's relative result.
•By sector, the biggest detractor from performance versus the benchmark was stock selection in information technology. Stock picking in financials also hampered the fund's result. Also hurting our result was an overweight in energy.
•The largest individual relative detractor was an overweight in BHP (+5%). The stock was among the fund's biggest holdings. A second notable relative detractor was an overweight in GSK (-11%). This was a stake we established this period. A non-benchmark stake in Prudential returned -19% and notably hurt.
•Notable changes in positioning include decreased exposure to France and Australia. By sector, meaningful changes in positioning include lower allocations to consumer discretionary and energy.
How did the Fund perform over the past 10 years?
CUMULATIVE PERFORMANCE
October 31, 2014 through October 31, 2024.
Initial investment of $10,000 and the current sales charge was paid.
Class A | $9,425 | $9,348 | $8,889 | $10,610 | $9,624 | $10,045 | $8,638 | $12,314 | $10,167 | $11,969 | $14,744 |
MSCI EAFE Value Index | $10,000 | $9,591 | $9,294 | $11,477 | $10,621 | $11,237 | $9,189 | $12,742 | $10,687 | $12,659 | $15,588 |
MSCI EAFE Index | $10,000 | $10,008 | $9,705 | $12,004 | $11,206 | $12,472 | $11,638 | $15,647 | $12,073 | $13,841 | $17,059 |
| | 2014 | 2015 | 2016 | 2017 | 2018 | 2019 | 2020 | 2021 | 2022 | 2023 | 2024 |
AVERAGE ANNUAL TOTAL RETURNS:| | 1 Year | 5 Year | 10 Year |
| Class A (incl. 5.75% sales charge) | 16.10% | 6.71% | 3.96% |
| Class A (without 5.75% sales charge) | 23.18% | 7.98% | 4.58% |
| MSCI EAFE Value Index | 23.14% | 6.76% | 4.54% |
| MSCI EAFE Index | 23.25% | 6.46% | 5.49% |
Visit institutional.fidelity.com for more recent performance information. |
The Fund's past performance is not a good predictor of the Fund's future performance. The graph and table do not reflect the deduction of taxes that a shareholder would pay on fund distributions or redemption of fund shares. |
Key Fund Statistics(as of October 31, 2024)
KEY FACTS | | |
| Fund Size | $1,472,284,197 | |
| Number of Holdings | 101 | |
| Total Advisory Fee | $8,618,481 | |
| Portfolio Turnover | 29% | |
What did the Fund invest in?
(as of October 31, 2024)
MARKET SECTORS (% of Fund's net assets) | | |
| Financials | 35.1 | |
| Industrials | 18.0 | |
| Materials | 13.0 | |
| Energy | 8.4 | |
| Consumer Discretionary | 5.0 | |
| Health Care | 4.7 | |
| Information Technology | 4.3 | |
| Consumer Staples | 3.9 | |
| Communication Services | 3.0 | |
| Real Estate | 0.9 | |
| Utilities | 0.6 | |
| |
| Common Stocks | 96.5 |
| Preferred Stocks | 0.4 |
| Short-Term Investments and Net Other Assets (Liabilities) | 3.1 |
ASSET ALLOCATION (% of Fund's net assets) |
|
|
| Japan | 22.8 |
| United Kingdom | 14.8 |
| United States | 13.1 |
| Germany | 11.4 |
| France | 9.8 |
| Australia | 6.1 |
| Italy | 5.0 |
| Spain | 3.4 |
| Switzerland | 3.3 |
| Others | 10.3 |
GEOGRAPHIC DIVERSIFICATION (% of Fund's net assets) |
|
| |
|
TOP HOLDINGS(% of Fund's net assets) | | |
| Shell PLC ADR | 3.7 | |
| Hitachi Ltd | 2.8 | |
| Banco Santander SA | 2.4 | |
| AXA SA | 2.3 | |
| CRH PLC | 2.2 | |
| BAE Systems PLC | 2.1 | |
| BHP Group Ltd | 2.1 | |
| Rheinmetall AG | 2.1 | |
| TotalEnergies SE | 2.0 | |
| Mitsubishi UFJ Financial Group Inc | 2.0 | |
| | 23.7 | |
How has the Fund changed?
This is a summary of certain changes to the Fund since November 1, 2023. For more complete information, you may review the Fund's next prospectus, which we expect to be available by December 30, 2024 at fundresearch.fidelity.com/prospectus/sec or upon request at 1-877-208-0098 or by sending an e-mail to fidfunddocuments@fidelity.com.
The fees associated with this class changed during the reporting year.The variations in class fees are primarily the result of the following changes: - Management fee
- Operating expenses
- Performance adjustment fee
- Expense reductions
The fund's transfer agent and pricing & bookkeeping fees were changed to a fixed rate effective December 1, 2023, through February 29, 2024, in anticipation of the transition to a new management fee structure. Effective March 1, 2024, the fund's management contract was amended to incorporate administrative services previously covered under separate services agreements (transfer agent and pricing & bookkeeping). The amended contract incorporates a basic fee rate that may vary by class (subject to a performance adjustment). The Adviser or an affiliate pays certain expenses of managing and operating the fund out of each class's management fee. | The fund's sub-advisory agreement with FIL Investments (Japan) Limited was not renewed.
|
| Fidelity, the Fidelity Investments Logo and all other Fidelity trademarks or service marks used herein are trademarks or service marks of FMR LLC. Any third-party marks that are used herein are trademarks or service marks of their respective owners. © 2024 FMR LLC. All rights reserved. |
| | For additional information about the Fund; including its prospectus, financial information, holdings and proxy information, scan the QR code or visit fundresearch.fidelity.com/prospectus/sec 1.9913937.100 1612-TSRA-1224 |
| |
| | ANNUAL SHAREHOLDER REPORT | AS OF OCTOBER 31, 2024 | This report describes changes to the Fund that occurred during the reporting period. |
| | Fidelity® Europe Fund Fidelity Advisor® Europe Fund Class Z : FIQHX |
| | | |
This annual shareholder report contains information about Fidelity® Europe Fund for the period November 1, 2023 to October 31, 2024. You can find additional information about the Fund at fundresearch.fidelity.com/prospectus/sec. You can also request this information by contacting us at 1-877-208-0098 or by sending an e-mail to fidfunddocuments@fidelity.com.
What were your Fund costs for the last year?(based on hypothetical $10,000 investment)
FUND COST (PREVIOUS YEAR)
| | Costs of a $10,000 investment | Costs paid as a percentage of a $10,000 investment | |
| Class Z | $ 60 | 0.54% | |
What affected the Fund's performance this period?
•International stocks achieved a strong gain for the 12 months ending October 31, 2024. Resilient global economic growth and a slowing in the pace of inflation in certain regions, as well as a shift to global monetary easing, contributed to a favorable backdrop, despite persistent geopolitical risk.
•Against this backdrop, stock picks in Europe ex U.K., primarily in France, and the U.K. detracted from the fund's performance versus the MSCI Europe Index (Net MA) for the fiscal year.
•By sector, security selection was the primary detractor, especially within consumer staples. Picks and an underweight in financials, primarily within the banks industry, also hampered the fund's result. Also hurting our result was stock selection in materials.
•The biggest individual relative detractor was an overweight in Davide Campari Milano (-39%). The second-largest relative detractor was an overweight in Diageo (-16%). Not owning Schneider Electric, a benchmark component that gained roughly 71%, was another notable relative detractor.
•In contrast, from a regional standpoint, an underweight in Europe ex U.K., along with stock selection in Belgium and in Sweden, contributed to the fund's relative result.
•By sector, the biggest contributor to performance versus the benchmark was stock selection in health care, primarily within the pharmaceuticals, biotechnology & life sciences industry. Stock picks in communication services, primarily within the media & entertainment industry, also boosted the fund's relative performance.
•The top individual relative contributor was an overweight in UCB (+165%). Although we reduced the fund's exposure to the stock, it was among the fund's biggest holdings at period end. A second notable relative contributor was an overweight in SAP (+76%). The stock was among our largest holdings, even though we trimmed the position. A non-benchmark stake in Hemnet gained 81% and notably helped.
•Notable changes in positioning include decreased exposure to France and a higher allocation to Italy. By sector, meaningful changes in positioning include increased exposure to communication services and a lower allocation to consumer staples.
How did the Fund perform over the life of Fund?
CUMULATIVE PERFORMANCE
October 2, 2018 through October 31, 2024.
Initial investment of $10,000.
Class Z | $10,000 | $9,193 | $9,899 | $10,404 | $13,747 | $9,623 | $10,691 |
MSCI Europe Index | $10,000 | $9,314 | $10,359 | $9,418 | $13,307 | $10,288 | $11,939 |
| | 2018 | 2019 | 2020 | 2021 | 2022 | 2023 | 2024 |
AVERAGE ANNUAL TOTAL RETURNS:| | 1 Year | 5 Year | Life of Fund A |
| Class Z | 22.20% | 5.71% | 4.49% |
| MSCI Europe Index | 22.78% | 7.19% | 6.49% |
A From October 2, 2018
Visit institutional.fidelity.com for more recent performance information. |
The Fund's past performance is not a good predictor of the Fund's future performance. The graph and table do not reflect the deduction of taxes that a shareholder would pay on fund distributions or redemption of fund shares. |
Key Fund Statistics(as of October 31, 2024)
KEY FACTS | | |
| Fund Size | $580,672,025 | |
| Number of Holdings | 101 | |
| Total Advisory Fee | $3,255,111 | |
| Portfolio Turnover | 31% | |
What did the Fund invest in?
(as of October 31, 2024)
MARKET SECTORS (% of Fund's net assets) | | |
| Financials | 18.9 | |
| Health Care | 16.4 | |
| Industrials | 14.6 | |
| Consumer Discretionary | 12.3 | |
| Information Technology | 11.2 | |
| Consumer Staples | 8.4 | |
| Communication Services | 4.7 | |
| Energy | 4.4 | |
| Materials | 4.1 | |
| Real Estate | 1.0 | |
| Utilities | 0.8 | |
| |
| Common Stocks | 96.7 |
| Preferred Stocks | 0.1 |
| Short-Term Investments and Net Other Assets (Liabilities) | 3.2 |
ASSET ALLOCATION (% of Fund's net assets) |
|
|
| United Kingdom | 23.1 |
| France | 15.3 |
| Germany | 12.4 |
| United States | 8.2 |
| Italy | 7.8 |
| Denmark | 7.1 |
| Sweden | 6.7 |
| Netherlands | 5.1 |
| Switzerland | 2.8 |
| Others | 11.5 |
GEOGRAPHIC DIVERSIFICATION (% of Fund's net assets) |
|
| |
|
TOP HOLDINGS(% of Fund's net assets) | | |
| Novo Nordisk A/S Series B | 5.6 | |
| SAP SE | 3.9 | |
| ASML Holding NV | 3.8 | |
| Astrazeneca PLC | 3.7 | |
| Shell PLC | 2.7 | |
| RELX PLC | 2.5 | |
| Air Liquide SA | 2.3 | |
| UCB SA | 2.2 | |
| LVMH Moet Hennessy Louis Vuitton SE | 2.1 | |
| UniCredit SpA | 1.7 | |
| | 30.5 | |
How has the Fund changed?
This is a summary of certain changes to the Fund since November 1, 2023. For more complete information, you may review the Fund's next prospectus, which we expect to be available by December 30, 2024 at fundresearch.fidelity.com/prospectus/sec or upon request at 1-877-208-0098 or by sending an e-mail to fidfunddocuments@fidelity.com.
The fund's transfer agent and pricing & bookkeeping fees were changed to a fixed rate effective December 1, 2023, through February 29, 2024, in anticipation of the transition to a new management fee structure. Effective March 1, 2024, the fund's management contract was amended to incorporate administrative services previously covered under separate services agreements (transfer agent and pricing & bookkeeping). The amended contract incorporates a basic fee rate that may vary by class (subject to a performance adjustment). The Adviser or an affiliate pays certain expenses of managing and operating the fund out of each class's management fee. | |
| Fidelity, the Fidelity Investments Logo and all other Fidelity trademarks or service marks used herein are trademarks or service marks of FMR LLC. Any third-party marks that are used herein are trademarks or service marks of their respective owners. © 2024 FMR LLC. All rights reserved. |
| | For additional information about the Fund; including its prospectus, financial information, holdings and proxy information, scan the QR code or visit fundresearch.fidelity.com/prospectus/sec 1.9913833.100 3266-TSRA-1224 |
| |
| | ANNUAL SHAREHOLDER REPORT | AS OF OCTOBER 31, 2024 | This report describes changes to the Fund that occurred during the reporting period. |
| | Fidelity® Emerging Markets Discovery Fund Fidelity Advisor® Emerging Markets Discovery Fund Class Z : FIQGX |
| | | |
This annual shareholder report contains information about Fidelity® Emerging Markets Discovery Fund for the period November 1, 2023 to October 31, 2024. You can find additional information about the Fund at fundresearch.fidelity.com/prospectus/sec. You can also request this information by contacting us at 1-877-208-0098 or by sending an e-mail to fidfunddocuments@fidelity.com.
What were your Fund costs for the last year?(based on hypothetical $10,000 investment)
FUND COST (PREVIOUS YEAR)
| | Costs of a $10,000 investment | Costs paid as a percentage of a $10,000 investment | |
| Class Z | $ 99 | 0.92% | |
What affected the Fund's performance this period?
•International stocks achieved a strong gain for the 12 months ending October 31, 2024. Resilient global economic growth and a slowing in the pace of inflation in certain regions, as well as a shift to global monetary easing, contributed to a favorable backdrop, despite persistent geopolitical risk.
•Against this backdrop, an underweight in Emerging Asia, primarily in India, and stock picking and an overweight in Latin America, primarily in Brazil, detracted from the fund's performance versus the MSCI Emerging Markets SMID Index (Net MA) for the fiscal year.
•By sector, security selection was the primary detractor, especially within financials. Also hurting our result were stock picks in health care, primarily within the pharmaceuticals, biotechnology & life sciences industry, and consumer staples.
•The largest individual relative detractor was our stake in Pharmaron Beijing (-48%). The second-largest relative detractor was Hanon Systems (-52%). The stock was not held at period end. Another notable relative detractor was an overweight in Nanya Technology (-34%).
•In contrast, from a regional standpoint, stock selection in Africa, primarily in South Africa, and stock picks and an underweight in the Middle East, primarily in United Arab Emirates, contributed to the fund's relative result.
•By sector, the biggest contributor to performance versus the benchmark was security selection in communication services, primarily within the media & entertainment industry. Stock picks and an underweight in materials and stock selection and an overweight in industrials, primarily within the capital goods industry, also boosted the fund's relative performance.
•The top individual relative contributor was an overweight in International Games System (+243%). This period we decreased our investment in the stock, which was nonetheless one of our largest holdings as of October 31. The second-largest relative contributor was a non-benchmark stake in Hindustan Aeronautics (+136%), where we decreased our investment this period. Another notable relative contributor was an overweight in Bharat Electronics (+111%).
•Notable changes in positioning include increased exposure to Taiwan and South Africa. By sector, meaningful changes in positioning include lower allocations to health care and utilities.
How did the Fund perform over the life of Fund?
CUMULATIVE PERFORMANCE
October 2, 2018 through October 31, 2024.
Initial investment of $10,000.
Class Z | $10,000 | $9,196 | $10,665 | $11,011 | $14,624 | $11,513 | $13,367 |
MSCI Emerging Markets SMID Cap Index | $10,000 | $9,131 | $10,084 | $10,003 | $13,720 | $10,407 | $11,818 |
MSCI Emerging Markets Index | $10,000 | $9,258 | $10,359 | $11,216 | $13,120 | $9,051 | $10,032 |
| | 2018 | 2019 | 2020 | 2021 | 2022 | 2023 | 2024 |
AVERAGE ANNUAL TOTAL RETURNS:| | 1 Year | 5 Year | Life of Fund A |
| Class Z | 14.54% | 7.50% | 7.25% |
| MSCI Emerging Markets SMID Cap Index | 22.04% | 7.42% | 6.20% |
| MSCI Emerging Markets Index | 25.33% | 3.95% | 3.83% |
A From October 2, 2018
Visit institutional.fidelity.com for more recent performance information. |
The Fund's past performance is not a good predictor of the Fund's future performance. The graph and table do not reflect the deduction of taxes that a shareholder would pay on fund distributions or redemption of fund shares. |
Key Fund Statistics(as of October 31, 2024)
KEY FACTS | | |
| Fund Size | $1,183,237,609 | |
| Number of Holdings | 111 | |
| Total Advisory Fee | $10,611,763 | |
| Portfolio Turnover | 29% | |
What did the Fund invest in?
(as of October 31, 2024)
MARKET SECTORS (% of Fund's net assets) | | |
| Industrials | 21.0 | |
| Consumer Discretionary | 18.3 | |
| Financials | 14.5 | |
| Information Technology | 10.9 | |
| Consumer Staples | 7.8 | |
| Real Estate | 7.4 | |
| Health Care | 4.6 | |
| Materials | 4.6 | |
| Utilities | 3.9 | |
| Energy | 3.3 | |
| Communication Services | 3.2 | |
| |
| Common Stocks | 99.5 |
| Short-Term Investments and Net Other Assets (Liabilities) | 0.5 |
ASSET ALLOCATION (% of Fund's net assets) |
|
|
| China | 21.4 |
| Taiwan | 17.6 |
| India | 13.3 |
| Brazil | 11.7 |
| Korea (South) | 6.2 |
| South Africa | 5.4 |
| Mexico | 4.8 |
| Saudi Arabia | 2.3 |
| Hong Kong | 2.2 |
| Others | 15.1 |
GEOGRAPHIC DIVERSIFICATION (% of Fund's net assets) |
|
| |
|
TOP HOLDINGS(% of Fund's net assets) | | |
| Impala Platinum Holdings Ltd | 1.8 | |
| Shriram Finance Ltd | 1.4 | |
| SITC International Holdings Co Ltd | 1.4 | |
| Bizlink Holding Inc | 1.4 | |
| Yageo Corp | 1.4 | |
| Torrent Pharmaceuticals Ltd | 1.3 | |
| Mr Price Group Ltd | 1.3 | |
| International Games System Co Ltd | 1.3 | |
| Nien Made Enterprise Co Ltd | 1.3 | |
| Coway Co Ltd | 1.3 | |
| | 13.9 | |
How has the Fund changed?
This is a summary of certain changes to the Fund since November 1, 2023. For more complete information, you may review the Fund's next prospectus, which we expect to be available by December 30, 2024 at fundresearch.fidelity.com/prospectus/sec or upon request at 1-877-208-0098 or by sending an e-mail to fidfunddocuments@fidelity.com.
The fees associated with this class changed during the reporting year.The variations in class fees are primarily the result of the following changes: - Management fee
- Operating expenses
The fund's transfer agent and pricing & bookkeeping fees were changed to a fixed rate effective December 1, 2023, through February 29, 2024, in anticipation of the transition to a new management fee structure. Effective March 1, 2024, the fund's management contract was amended to incorporate administrative services previously covered under separate services agreements (transfer agent and pricing & bookkeeping). The amended contract incorporates a management fee rate that may vary by class. The Adviser or an affiliate pays certain expenses of managing and operating the fund out of each class's management fee. | The fund's sub-advisory agreement with FIL Investments (Japan) Limited was not renewed
|
| Fidelity, the Fidelity Investments Logo and all other Fidelity trademarks or service marks used herein are trademarks or service marks of FMR LLC. Any third-party marks that are used herein are trademarks or service marks of their respective owners. © 2024 FMR LLC. All rights reserved. |
| | For additional information about the Fund; including its prospectus, financial information, holdings and proxy information, scan the QR code or visit fundresearch.fidelity.com/prospectus/sec 1.9913978.100 3265-TSRA-1224 |
| |
| | ANNUAL SHAREHOLDER REPORT | AS OF OCTOBER 31, 2024 | |
| | Fidelity® Diversified International K6 Fund Fidelity® Diversified International K6 Fund : FKIDX |
| | | |
This annual shareholder report contains information about Fidelity® Diversified International K6 Fund for the period November 1, 2023 to October 31, 2024. You can find additional information about the Fund at fundresearch.fidelity.com/prospectus/sec. You can also request this information by contacting us at 1-800-835-5092 or by sending an e-mail to fidfunddocuments@fidelity.com.
What were your Fund costs for the last year?(based on hypothetical $10,000 investment)
FUND COST (PREVIOUS YEAR)
| | Costs of a $10,000 investment | Costs paid as a percentage of a $10,000 investment | |
| Fidelity® Diversified International K6 Fund | $ 68 | 0.60% | |
What affected the Fund's performance this period?
•International stocks achieved a strong gain for the 12 months ending October 31, 2024. Resilient global economic growth and a slowing in the pace of inflation in certain regions, as well as a shift to global monetary easing, contributed to a favorable backdrop, despite persistent geopolitical risk.
•Against this backdrop, stock picks in Japan and a non-benchmark allocation to emerging markets contributed to the fund's performance versus the MSCI EAFE Index (Net MA) for the fiscal year.
•By sector, the biggest contributors to performance versus the benchmark were stock picks and an overweight in industrials, primarily within the capital goods industry. Picks in materials also boosted relative performance. Also helping our relative result was an underweight in consumer staples.
•The top individual relative contributor was our non-benchmark stake in Taiwan Semiconductor Manufacturing (+124%). The stock was among our biggest holdings. A second notable relative contributor was an overweight in Hitachi (+109%). Although we trimmed our stake, the company was the fund's largest holding at period end. Another notable relative contributor was an overweight in Mitsubishi Heavy Industries (+126%). This was a stake we established this period.
•In contrast, from a regional standpoint, a non-benchmark allocation to both the United States and Canada detracted from the fund's relative result.
•By sector, the biggest detractor from performance versus the benchmark was stock picking in financials. Stock picks in consumer staples also hampered the fund's result. Also detracting from our result was an overweight in energy. Lastly, the fund's position in cash detracted.
•The fund's non-benchmark stake in Schlumberger returned -20% and was the largest individual relative detractor. The stock was not held at period end. A second notable relative detractor this period was avoiding Recruit Holdings, a benchmark component that gained roughly 119%. Our stake in Pernod-Ricard (-27%) also detracted. This period we decreased our position in Pernod-Ricard.
•Notable changes in positioning include increased exposure to Germany and Switzerland. By sector, meaningful changes in positioning include decreased exposure to consumer staples and a higher allocation to industrials.
How did the Fund perform over the life of Fund?
CUMULATIVE PERFORMANCE
May 25, 2017 through October 31, 2024.
Initial investment of $10,000.
Fidelity® Diversified International K6 Fund | $10,000 | $10,650 | $9,709 | $11,252 | $12,343 | $16,045 | $11,423 | $12,808 |
MSCI EAFE Index | $10,000 | $10,678 | $9,968 | $11,094 | $10,353 | $13,919 | $10,740 | $12,313 |
| | 2017 | 2018 | 2019 | 2020 | 2021 | 2022 | 2023 | 2024 |
AVERAGE ANNUAL TOTAL RETURNS:| | 1 Year | 5 Year | Life of Fund A |
| Fidelity® Diversified International K6 Fund | 24.70% | 7.26% | 6.49% |
| MSCI EAFE Index | 23.25% | 6.46% | 5.77% |
A From May 25, 2017
Visit www.401k.com for more recent performance information. |
The Fund's past performance is not a good predictor of the Fund's future performance. The graph and table do not reflect the deduction of taxes that a shareholder would pay on fund distributions or redemption of fund shares. |
Key Fund Statistics(as of October 31, 2024)
KEY FACTS | | |
| Fund Size | $4,831,943,062 | |
| Number of Holdings | 135 | |
| Total Advisory Fee | $28,022,546 | |
| Portfolio Turnover | 37% | |
What did the Fund invest in?
(as of October 31, 2024)
MARKET SECTORS (% of Fund's net assets) | | |
| Industrials | 24.6 | |
| Financials | 22.6 | |
| Information Technology | 15.6 | |
| Health Care | 10.4 | |
| Materials | 8.4 | |
| Consumer Discretionary | 7.3 | |
| Energy | 5.0 | |
| Consumer Staples | 1.9 | |
| Communication Services | 0.5 | |
| Real Estate | 0.2 | |
| |
| Common Stocks | 96.1 |
| Preferred Stocks | 0.4 |
| Short-Term Investments and Net Other Assets (Liabilities) | 3.5 |
ASSET ALLOCATION (% of Fund's net assets) |
|
|
| Japan | 17.2 |
| United States | 16.1 |
| United Kingdom | 14.3 |
| Germany | 8.7 |
| France | 8.1 |
| Canada | 6.5 |
| Netherlands | 5.3 |
| Denmark | 3.4 |
| Sweden | 3.0 |
| Others | 17.4 |
GEOGRAPHIC DIVERSIFICATION (% of Fund's net assets) |
|
| |
|
TOP HOLDINGS(% of Fund's net assets) | | |
| Hitachi Ltd | 2.9 | |
| ASML Holding NV depository receipt | 2.8 | |
| Taiwan Semiconductor Manufacturing Co Ltd ADR | 2.5 | |
| Novo Nordisk A/S Series B | 2.5 | |
| SAP SE | 2.4 | |
| Astrazeneca PLC | 1.9 | |
| RELX PLC (Netherlands) | 1.8 | |
| Wolters Kluwer NV | 1.6 | |
| London Stock Exchange Group PLC | 1.6 | |
| Shell PLC | 1.6 | |
| | 21.6 | |
| Fidelity, the Fidelity Investments Logo and all other Fidelity trademarks or service marks used herein are trademarks or service marks of FMR LLC. Any third-party marks that are used herein are trademarks or service marks of their respective owners. © 2024 FMR LLC. All rights reserved. |
| | For additional information about the Fund; including its prospectus, financial information, holdings and proxy information, scan the QR code or visit fundresearch.fidelity.com/prospectus/sec 1.9913992.100 2947-TSRA-1224 |
| |
| | ANNUAL SHAREHOLDER REPORT | AS OF OCTOBER 31, 2024 | This report describes changes to the Fund that occurred during the reporting period. |
| | Fidelity® Europe Fund Fidelity Advisor® Europe Fund Class I : FHJMX |
| | | |
This annual shareholder report contains information about Fidelity® Europe Fund for the period November 1, 2023 to October 31, 2024. You can find additional information about the Fund at fundresearch.fidelity.com/prospectus/sec. You can also request this information by contacting us at 1-877-208-0098 or by sending an e-mail to fidfunddocuments@fidelity.com.
What were your Fund costs for the last year?(based on hypothetical $10,000 investment)
FUND COST (PREVIOUS YEAR)
| | Costs of a $10,000 investment | Costs paid as a percentage of a $10,000 investment | |
| Class I | $ 68 | 0.61% | |
What affected the Fund's performance this period?
•International stocks achieved a strong gain for the 12 months ending October 31, 2024. Resilient global economic growth and a slowing in the pace of inflation in certain regions, as well as a shift to global monetary easing, contributed to a favorable backdrop, despite persistent geopolitical risk.
•Against this backdrop, stock picks in Europe ex U.K., primarily in France, and the U.K. detracted from the fund's performance versus the MSCI Europe Index (Net MA) for the fiscal year.
•By sector, security selection was the primary detractor, especially within consumer staples. Picks and an underweight in financials, primarily within the banks industry, also hampered the fund's result. Also hurting our result was stock selection in materials.
•The biggest individual relative detractor was an overweight in Davide Campari Milano (-39%). The second-largest relative detractor was an overweight in Diageo (-16%). Not owning Schneider Electric, a benchmark component that gained roughly 71%, was another notable relative detractor.
•In contrast, from a regional standpoint, an underweight in Europe ex U.K., along with stock selection in Belgium and in Sweden, contributed to the fund's relative result.
•By sector, the biggest contributor to performance versus the benchmark was stock selection in health care, primarily within the pharmaceuticals, biotechnology & life sciences industry. Stock picks in communication services, primarily within the media & entertainment industry, also boosted the fund's relative performance.
•The top individual relative contributor was an overweight in UCB (+165%). Although we reduced the fund's exposure to the stock, it was among the fund's biggest holdings at period end. A second notable relative contributor was an overweight in SAP (+76%). The stock was among our largest holdings, even though we trimmed the position. A non-benchmark stake in Hemnet gained 81% and notably helped.
•Notable changes in positioning include decreased exposure to France and a higher allocation to Italy. By sector, meaningful changes in positioning include increased exposure to communication services and a lower allocation to consumer staples.
How did the Fund perform over the past 10 years?
CUMULATIVE PERFORMANCE
October 31, 2014 through October 31, 2024.
Initial investment of $10,000.
Class I | $10,000 | $10,502 | $9,837 | $12,398 | $11,279 | $12,135 | $12,740 | $16,816 | $11,758 | $13,047 | $15,929 |
MSCI Europe Index | $10,000 | $10,004 | $9,281 | $11,817 | $10,862 | $12,081 | $10,984 | $15,520 | $11,998 | $13,925 | $17,097 |
| | 2014 | 2015 | 2016 | 2017 | 2018 | 2019 | 2020 | 2021 | 2022 | 2023 | 2024 |
AVERAGE ANNUAL TOTAL RETURNS:| | 1 Year | 5 Year | 10 Year |
| Class I | 22.09% | 5.59% | 4.77% |
| MSCI Europe Index | 22.78% | 7.19% | 5.51% |
Visit institutional.fidelity.com for more recent performance information. |
The Fund's past performance is not a good predictor of the Fund's future performance. The graph and table do not reflect the deduction of taxes that a shareholder would pay on fund distributions or redemption of fund shares. |
Key Fund Statistics(as of October 31, 2024)
KEY FACTS | | |
| Fund Size | $580,672,025 | |
| Number of Holdings | 101 | |
| Total Advisory Fee | $3,255,111 | |
| Portfolio Turnover | 31% | |
What did the Fund invest in?
(as of October 31, 2024)
MARKET SECTORS (% of Fund's net assets) | | |
| Financials | 18.9 | |
| Health Care | 16.4 | |
| Industrials | 14.6 | |
| Consumer Discretionary | 12.3 | |
| Information Technology | 11.2 | |
| Consumer Staples | 8.4 | |
| Communication Services | 4.7 | |
| Energy | 4.4 | |
| Materials | 4.1 | |
| Real Estate | 1.0 | |
| Utilities | 0.8 | |
| |
| Common Stocks | 96.7 |
| Preferred Stocks | 0.1 |
| Short-Term Investments and Net Other Assets (Liabilities) | 3.2 |
ASSET ALLOCATION (% of Fund's net assets) |
|
|
| United Kingdom | 23.1 |
| France | 15.3 |
| Germany | 12.4 |
| United States | 8.2 |
| Italy | 7.8 |
| Denmark | 7.1 |
| Sweden | 6.7 |
| Netherlands | 5.1 |
| Switzerland | 2.8 |
| Others | 11.5 |
GEOGRAPHIC DIVERSIFICATION (% of Fund's net assets) |
|
| |
|
TOP HOLDINGS(% of Fund's net assets) | | |
| Novo Nordisk A/S Series B | 5.6 | |
| SAP SE | 3.9 | |
| ASML Holding NV | 3.8 | |
| Astrazeneca PLC | 3.7 | |
| Shell PLC | 2.7 | |
| RELX PLC | 2.5 | |
| Air Liquide SA | 2.3 | |
| UCB SA | 2.2 | |
| LVMH Moet Hennessy Louis Vuitton SE | 2.1 | |
| UniCredit SpA | 1.7 | |
| | 30.5 | |
How has the Fund changed?
This is a summary of certain changes to the Fund since November 1, 2023. For more complete information, you may review the Fund's next prospectus, which we expect to be available by December 30, 2024 at fundresearch.fidelity.com/prospectus/sec or upon request at 1-877-208-0098 or by sending an e-mail to fidfunddocuments@fidelity.com.
The fees associated with this class changed during the reporting year.The variations in class fees are primarily the result of the following changes: - Management fee
- Operating expenses
The fund's transfer agent and pricing & bookkeeping fees were changed to a fixed rate effective December 1, 2023, through February 29, 2024, in anticipation of the transition to a new management fee structure. Effective March 1, 2024, the fund's management contract was amended to incorporate administrative services previously covered under separate services agreements (transfer agent and pricing & bookkeeping). The amended contract incorporates a basic fee rate that may vary by class (subject to a performance adjustment). The Adviser or an affiliate pays certain expenses of managing and operating the fund out of each class's management fee. | |
| Fidelity, the Fidelity Investments Logo and all other Fidelity trademarks or service marks used herein are trademarks or service marks of FMR LLC. Any third-party marks that are used herein are trademarks or service marks of their respective owners. © 2024 FMR LLC. All rights reserved. |
| | For additional information about the Fund; including its prospectus, financial information, holdings and proxy information, scan the QR code or visit fundresearch.fidelity.com/prospectus/sec 1.9913831.100 2636-TSRA-1224 |
| |
| | ANNUAL SHAREHOLDER REPORT | AS OF OCTOBER 31, 2024 | This report describes changes to the Fund that occurred during the reporting period. |
| | Fidelity® International Small Cap Fund Fidelity Advisor® International Small Cap Fund Class C : FICSX |
| | | |
This annual shareholder report contains information about Fidelity® International Small Cap Fund for the period November 1, 2023 to October 31, 2024. You can find additional information about the Fund at fundresearch.fidelity.com/prospectus/sec. You can also request this information by contacting us at 1-877-208-0098 or by sending an e-mail to fidfunddocuments@fidelity.com.
What were your Fund costs for the last year?(based on hypothetical $10,000 investment)
FUND COST (PREVIOUS YEAR)
| | Costs of a $10,000 investment | Costs paid as a percentage of a $10,000 investment | |
| Class C | $ 224 | 2.06% | |
What affected the Fund's performance this period?
•International stocks achieved a strong gain for the 12 months ending October 31, 2024. Resilient global economic growth and a slowing in the pace of inflation in certain regions, as well as a shift to global monetary easing, contributed to a favorable backdrop, despite persistent geopolitical risk.
•Against this backdrop, an underweight in emerging markets, primarily in India, and picks in the U.K. and Brazil detracted from the fund's performance versus the Fidelity International Small Cap Fund Linked Index for the fiscal year.
•By sector, security selection in financials was the largest detractor. However, picks in industrials, health care and consumer discretionary also meaningfully weighed on the fund's relative result.
•The largest individual relative detractor was our non-benchmark stake in Hypera Pharma (-35%). A non-benchmark stake in Mayr-Melnhof Karton returned roughly -24% and was the second-largest relative detractor. An overweight in Stabilus (-36%) also hurt.
•In contrast, from a regional standpoint, picks in emerging markets, primarily in Taiwan and China, contributed to the fund's relative result. In Europe ex U.K., investment choices in Germany proved rewarding.
•By sector, the biggest contributor to performance versus the benchmark was stock selection in communication services, primarily within the media & entertainment industry. Security selection in information technology, primarily within the technology hardware & equipment industry, also boosted the fund's relative performance.
•The top individual relative contributor was an overweight in International Games System (+238%). This period we decreased our position in International Games System. The company was among our biggest holdings. The second-largest relative contributor was our non-benchmark stake in Rheinmetall (+81%). The company was the fund's biggest holding. Another notable relative contributor was an overweight in Test Research (+131%).
•Notable changes in positioning include decreased exposure to Germany and a higher allocation to Japan and Taiwan. By sector, meaningful changes in positioning include increased exposure to communication services and a lower allocation to consumer discretionary.
How did the Fund perform over the past 10 years?
CUMULATIVE PERFORMANCE
October 31, 2014 through October 31, 2024.
Initial investment of $10,000.
Class C | $10,000 | $10,537 | $11,407 | $14,242 | $12,888 | $13,812 | $13,170 | $18,222 | $13,526 | $15,267 | $18,105 |
MSCI ACWI (All Country World Index) ex USA Small Cap Index | $10,000 | $10,162 | $10,602 | $13,236 | $11,963 | $13,030 | $13,055 | $18,144 | $13,127 | $14,305 | $17,725 |
| | 2014 | 2015 | 2016 | 2017 | 2018 | 2019 | 2020 | 2021 | 2022 | 2023 | 2024 |
AVERAGE ANNUAL TOTAL RETURNS:| | 1 Year | 5 Year | 10 Year |
| Class C (incl. contingent deferred sales charge) | 16.68% | 5.25% | 6.12% |
| Class C | 17.68% | 5.25% | 6.12% |
| MSCI ACWI (All Country World Index) ex USA Small Cap Index | 23.90% | 6.35% | 5.89% |
Visit institutional.fidelity.com for more recent performance information. |
The Fund's past performance is not a good predictor of the Fund's future performance. The graph and table do not reflect the deduction of taxes that a shareholder would pay on fund distributions or redemption of fund shares. |
Key Fund Statistics(as of October 31, 2024)
KEY FACTS | | |
| Fund Size | $4,778,290,407 | |
| Number of Holdings | 197 | |
| Total Advisory Fee | $43,346,727 | |
| Portfolio Turnover | 17% | |
What did the Fund invest in?
(as of October 31, 2024)
MARKET SECTORS (% of Fund's net assets) | | |
| Industrials | 22.4 | |
| Financials | 13.2 | |
| Consumer Discretionary | 11.0 | |
| Consumer Staples | 10.4 | |
| Information Technology | 9.4 | |
| Materials | 8.2 | |
| Real Estate | 5.9 | |
| Health Care | 5.4 | |
| Communication Services | 4.8 | |
| Energy | 3.7 | |
| Utilities | 1.5 | |
| |
| Common Stocks | 95.9 |
| Short-Term Investments and Net Other Assets (Liabilities) | 4.1 |
ASSET ALLOCATION (% of Fund's net assets) |
|
|
| Japan | 21.9 |
| United Kingdom | 15.5 |
| United States | 6.8 |
| Canada | 4.2 |
| Taiwan | 4.0 |
| Australia | 3.3 |
| Spain | 3.1 |
| China | 3.1 |
| Mexico | 3.1 |
| Others | 35.0 |
GEOGRAPHIC DIVERSIFICATION (% of Fund's net assets) |
|
| |
|
TOP HOLDINGS(% of Fund's net assets) | | |
| Rheinmetall AG | 1.3 | |
| Premier Foods PLC | 1.2 | |
| Century Pacific Food Inc | 1.1 | |
| Logista Integral SA | 1.0 | |
| North West Co Inc/The | 1.0 | |
| Ashtead Technology Holdings plc | 1.0 | |
| Shriram Finance Ltd | 0.9 | |
| RHI Magnesita NV | 0.9 | |
| BayCurrent Inc | 0.9 | |
| Richter Gedeon Nyrt | 0.9 | |
| | 10.2 | |
How has the Fund changed?
This is a summary of certain changes to the Fund since November 1, 2023. For more complete information, you may review the Fund's next prospectus, which we expect to be available by December 30, 2024 at fundresearch.fidelity.com/prospectus/sec or upon request at 1-877-208-0098 or by sending an e-mail to fidfunddocuments@fidelity.com.
The fees associated with this class changed during the reporting year.The variations in class fees are primarily the result of the following changes: - Management fee
- Operating expenses
- Performance adjustment fee
The fund's transfer agent and pricing & bookkeeping fees were changed to a fixed rate effective December 1, 2023, through February 29, 2024, in anticipation of the transition to a new management fee structure. Effective March 1, 2024, the fund's management contract was amended to incorporate administrative services previously covered under separate services agreements (transfer agent and pricing & bookkeeping). The amended contract incorporates a basic fee rate that may vary by class (subject to a performance adjustment). The Adviser or an affiliate pays certain expenses of managing and operating the fund out of each class's management fee. | The fund's sub-advisory agreement with FIL Investments (Japan) Limited was not renewed.
|
| Fidelity, the Fidelity Investments Logo and all other Fidelity trademarks or service marks used herein are trademarks or service marks of FMR LLC. Any third-party marks that are used herein are trademarks or service marks of their respective owners. © 2024 FMR LLC. All rights reserved. |
| | For additional information about the Fund; including its prospectus, financial information, holdings and proxy information, scan the QR code or visit fundresearch.fidelity.com/prospectus/sec 1.9913911.100 1260-TSRA-1224 |
| |
| | ANNUAL SHAREHOLDER REPORT | AS OF OCTOBER 31, 2024 | This report describes changes to the Fund that occurred during the reporting period. |
| | Fidelity® Europe Fund Fidelity Advisor® Europe Fund Class M : FHJVX |
| | | |
This annual shareholder report contains information about Fidelity® Europe Fund for the period November 1, 2023 to October 31, 2024. You can find additional information about the Fund at fundresearch.fidelity.com/prospectus/sec. You can also request this information by contacting us at 1-877-208-0098 or by sending an e-mail to fidfunddocuments@fidelity.com.
What were your Fund costs for the last year?(based on hypothetical $10,000 investment)
FUND COST (PREVIOUS YEAR)
| | Costs of a $10,000 investment | Costs paid as a percentage of a $10,000 investment | |
| Class M | $ 132 | 1.19% | |
What affected the Fund's performance this period?
•International stocks achieved a strong gain for the 12 months ending October 31, 2024. Resilient global economic growth and a slowing in the pace of inflation in certain regions, as well as a shift to global monetary easing, contributed to a favorable backdrop, despite persistent geopolitical risk.
•Against this backdrop, stock picks in Europe ex U.K., primarily in France, and the U.K. detracted from the fund's performance versus the MSCI Europe Index (Net MA) for the fiscal year.
•By sector, security selection was the primary detractor, especially within consumer staples. Picks and an underweight in financials, primarily within the banks industry, also hampered the fund's result. Also hurting our result was stock selection in materials.
•The biggest individual relative detractor was an overweight in Davide Campari Milano (-39%). The second-largest relative detractor was an overweight in Diageo (-16%). Not owning Schneider Electric, a benchmark component that gained roughly 71%, was another notable relative detractor.
•In contrast, from a regional standpoint, an underweight in Europe ex U.K., along with stock selection in Belgium and in Sweden, contributed to the fund's relative result.
•By sector, the biggest contributor to performance versus the benchmark was stock selection in health care, primarily within the pharmaceuticals, biotechnology & life sciences industry. Stock picks in communication services, primarily within the media & entertainment industry, also boosted the fund's relative performance.
•The top individual relative contributor was an overweight in UCB (+165%). Although we reduced the fund's exposure to the stock, it was among the fund's biggest holdings at period end. A second notable relative contributor was an overweight in SAP (+76%). The stock was among our largest holdings, even though we trimmed the position. A non-benchmark stake in Hemnet gained 81% and notably helped.
•Notable changes in positioning include decreased exposure to France and a higher allocation to Italy. By sector, meaningful changes in positioning include increased exposure to communication services and a lower allocation to consumer staples.
How did the Fund perform over the past 10 years?
CUMULATIVE PERFORMANCE
October 31, 2014 through October 31, 2024.
Initial investment of $10,000 and the current sales charge was paid.
Class M | $9,650 | $10,068 | $9,365 | $11,729 | $10,599 | $11,328 | $11,815 | $15,502 | $10,773 | $11,883 | $14,425 |
MSCI Europe Index | $10,000 | $10,004 | $9,281 | $11,817 | $10,862 | $12,081 | $10,984 | $15,520 | $11,998 | $13,925 | $17,097 |
| | 2014 | 2015 | 2016 | 2017 | 2018 | 2019 | 2020 | 2021 | 2022 | 2023 | 2024 |
AVERAGE ANNUAL TOTAL RETURNS:| | 1 Year | 5 Year | 10 Year |
| Class M (incl. 3.50% sales charge) | 17.14% | 4.21% | 3.73% |
| Class M (without 3.50% sales charge) | 21.39% | 4.95% | 4.10% |
| MSCI Europe Index | 22.78% | 7.19% | 5.51% |
Visit institutional.fidelity.com for more recent performance information. |
The Fund's past performance is not a good predictor of the Fund's future performance. The graph and table do not reflect the deduction of taxes that a shareholder would pay on fund distributions or redemption of fund shares. |
Key Fund Statistics(as of October 31, 2024)
KEY FACTS | | |
| Fund Size | $580,672,025 | |
| Number of Holdings | 101 | |
| Total Advisory Fee | $3,255,111 | |
| Portfolio Turnover | 31% | |
What did the Fund invest in?
(as of October 31, 2024)
MARKET SECTORS (% of Fund's net assets) | | |
| Financials | 18.9 | |
| Health Care | 16.4 | |
| Industrials | 14.6 | |
| Consumer Discretionary | 12.3 | |
| Information Technology | 11.2 | |
| Consumer Staples | 8.4 | |
| Communication Services | 4.7 | |
| Energy | 4.4 | |
| Materials | 4.1 | |
| Real Estate | 1.0 | |
| Utilities | 0.8 | |
| |
| Common Stocks | 96.7 |
| Preferred Stocks | 0.1 |
| Short-Term Investments and Net Other Assets (Liabilities) | 3.2 |
ASSET ALLOCATION (% of Fund's net assets) |
|
|
| United Kingdom | 23.1 |
| France | 15.3 |
| Germany | 12.4 |
| United States | 8.2 |
| Italy | 7.8 |
| Denmark | 7.1 |
| Sweden | 6.7 |
| Netherlands | 5.1 |
| Switzerland | 2.8 |
| Others | 11.5 |
GEOGRAPHIC DIVERSIFICATION (% of Fund's net assets) |
|
| |
|
TOP HOLDINGS(% of Fund's net assets) | | |
| Novo Nordisk A/S Series B | 5.6 | |
| SAP SE | 3.9 | |
| ASML Holding NV | 3.8 | |
| Astrazeneca PLC | 3.7 | |
| Shell PLC | 2.7 | |
| RELX PLC | 2.5 | |
| Air Liquide SA | 2.3 | |
| UCB SA | 2.2 | |
| LVMH Moet Hennessy Louis Vuitton SE | 2.1 | |
| UniCredit SpA | 1.7 | |
| | 30.5 | |
How has the Fund changed?
This is a summary of certain changes to the Fund since November 1, 2023. For more complete information, you may review the Fund's next prospectus, which we expect to be available by December 30, 2024 at fundresearch.fidelity.com/prospectus/sec or upon request at 1-877-208-0098 or by sending an e-mail to fidfunddocuments@fidelity.com.
The fees associated with this class changed during the reporting year.The variations in class fees are primarily the result of the following changes: - Management fee
- Operating expenses
- Expense reductions
The fund's transfer agent and pricing & bookkeeping fees were changed to a fixed rate effective December 1, 2023, through February 29, 2024, in anticipation of the transition to a new management fee structure. Effective March 1, 2024, the fund's management contract was amended to incorporate administrative services previously covered under separate services agreements (transfer agent and pricing & bookkeeping). The amended contract incorporates a basic fee rate that may vary by class (subject to a performance adjustment). The Adviser or an affiliate pays certain expenses of managing and operating the fund out of each class's management fee. | |
| Fidelity, the Fidelity Investments Logo and all other Fidelity trademarks or service marks used herein are trademarks or service marks of FMR LLC. Any third-party marks that are used herein are trademarks or service marks of their respective owners. © 2024 FMR LLC. All rights reserved. |
| | For additional information about the Fund; including its prospectus, financial information, holdings and proxy information, scan the QR code or visit fundresearch.fidelity.com/prospectus/sec 1.9913830.100 2635-TSRA-1224 |
| |
| | ANNUAL SHAREHOLDER REPORT | AS OF OCTOBER 31, 2024 | This report describes changes to the Fund that occurred during the reporting period. |
| | Fidelity® International Growth Fund Fidelity® International Growth Fund : FIGFX |
| | | |
This annual shareholder report contains information about Fidelity® International Growth Fund for the period November 1, 2023 to October 31, 2024. You can find additional information about the Fund at fundresearch.fidelity.com/prospectus/sec. You can also request this information by contacting us at 1-800-544-8544 or by sending an e-mail to fidfunddocuments@fidelity.com.
What were your Fund costs for the last year?(based on hypothetical $10,000 investment)
FUND COST (PREVIOUS YEAR)
| | Costs of a $10,000 investment | Costs paid as a percentage of a $10,000 investment | |
| Fidelity® International Growth Fund | $ 100 | 0.89% | |
What affected the Fund's performance this period?
•International stocks achieved a strong gain for the 12 months ending October 31, 2024. Resilient global economic growth and a slowing in the pace of inflation in certain regions, as well as a shift to global monetary easing, contributed to a favorable backdrop, despite persistent geopolitical risk.
•Against this backdrop, stock picks and an overweight in the United States and security selection in the U.K. contributed to the fund's performance versus the MSCI EAFE Growth Index (Net MA) for the fiscal year.
•By sector, an underweight in consumer staples was the primary contributor. Stock selection in materials also boosted the fund's relative performance. Also helping our relative result was an overweight in industrials, primarily within the capital goods industry.
•The fund's non-benchmark stake in Taiwan Semiconductor gained 99% and was the top individual relative contributor. The stock was among our largest holdings. A second notable relative contributor was an overweight in CRH (+83%). The stock was among the fund's biggest holdings. Another notable relative contributor was our non-benchmark stake in GE Vernova (+100%). This was a position we established this period.
•In contrast, from a regional standpoint, an underweight in Asia Pacific ex Japan and a non-benchmark allocation to Canada detracted from the fund's relative result.
•By sector, the biggest detractor from performance versus the benchmark was stock picking in financials. Also hurting our result was security selection in industrials, primarily within the capital goods industry, and energy. Lastly, the fund's position in cash detracted.
•The biggest individual relative detractor was an overweight in Edenred (-38%). Not owning Schneider Electric, a benchmark component that gained approximately 71%, was the second-largest relative detractor. Not owning Commonwealth Bank of Australia, a benchmark component that gained roughly 59%, was another notable relative detractor.
•Notable changes in positioning include increased exposure to Germany and the United Kingdom. By sector, meaningful changes in positioning include decreased exposure to consumer staples and health care.
How did the Fund perform over the past 10 years?
CUMULATIVE PERFORMANCE
October 31, 2014 through October 31, 2024.
Initial investment of $10,000.
Fidelity® International Growth Fund | $10,000 | $10,336 | $10,040 | $12,463 | $11,729 | $14,269 | $15,400 | $20,232 | $14,610 | $16,157 | $20,262 |
MSCI EAFE Growth Index | $10,000 | $10,428 | $10,108 | $12,517 | $11,783 | $13,766 | $14,502 | $18,876 | $13,312 | $14,769 | $18,234 |
MSCI EAFE Index | $10,000 | $10,008 | $9,705 | $12,004 | $11,206 | $12,472 | $11,638 | $15,647 | $12,073 | $13,841 | $17,059 |
| | 2014 | 2015 | 2016 | 2017 | 2018 | 2019 | 2020 | 2021 | 2022 | 2023 | 2024 |
AVERAGE ANNUAL TOTAL RETURNS:| | 1 Year | 5 Year | 10 Year |
| Fidelity® International Growth Fund | 25.41% | 7.27% | 7.32% |
| MSCI EAFE Growth Index | 23.46% | 5.78% | 6.19% |
| MSCI EAFE Index | 23.25% | 6.46% | 5.49% |
Visit www.fidelity.com for more recent performance information. |
The Fund's past performance is not a good predictor of the Fund's future performance. The graph and table do not reflect the deduction of taxes that a shareholder would pay on fund distributions or redemption of fund shares. |
Key Fund Statistics(as of October 31, 2024)
KEY FACTS | | |
| Fund Size | $6,046,615,302 | |
| Number of Holdings | 73 | |
| Total Advisory Fee | $43,926,728 | |
| Portfolio Turnover | 31% | |
What did the Fund invest in?
(as of October 31, 2024)
MARKET SECTORS (% of Fund's net assets) | | |
| Industrials | 31.9 | |
| Information Technology | 19.7 | |
| Financials | 16.0 | |
| Materials | 10.7 | |
| Consumer Discretionary | 10.3 | |
| Health Care | 6.1 | |
| Consumer Staples | 1.1 | |
| Energy | 0.7 | |
| Communication Services | 0.5 | |
| |
| Common Stocks | 96.7 |
| Preferred Stocks | 0.3 |
| Short-Term Investments and Net Other Assets (Liabilities) | 3.0 |
ASSET ALLOCATION (% of Fund's net assets) |
|
|
| United States | 29.1 |
| United Kingdom | 11.7 |
| France | 11.2 |
| Japan | 9.6 |
| Sweden | 7.5 |
| Germany | 6.6 |
| Netherlands | 6.1 |
| Denmark | 5.1 |
| Taiwan | 3.3 |
| Others | 9.8 |
GEOGRAPHIC DIVERSIFICATION (% of Fund's net assets) |
|
| |
|
TOP HOLDINGS(% of Fund's net assets) | | |
| SAP SE | 5.3 | |
| Novo Nordisk A/S Series B | 5.1 | |
| ASML Holding NV | 4.8 | |
| Safran SA | 4.0 | |
| CRH PLC | 3.9 | |
| Linde PLC | 3.8 | |
| Atlas Copco AB A Shares | 3.4 | |
| Taiwan Semiconductor Manufacturing Co Ltd | 3.3 | |
| Recruit Holdings Co Ltd | 3.0 | |
| LVMH Moet Hennessy Louis Vuitton SE | 2.7 | |
| | 39.3 | |
How has the Fund changed?
This is a summary of certain changes to the Fund since November 1, 2023. For more complete information, you may review the Fund's next prospectus, which we expect to be available by December 30, 2024 at fundresearch.fidelity.com/prospectus/sec or upon request at 1-800-544-8544 or by sending an e-mail to fidfunddocuments@fidelity.com.
The fund's transfer agent and pricing & bookkeeping fees were changed to a fixed rate effective December 1, 2023, through February 29, 2024, in anticipation of the transition to a new management fee structure. Effective March 1, 2024, the fund's management contract was amended to incorporate administrative services previously covered under separate services agreements (transfer agent and pricing & bookkeeping). The amended contract incorporates a basic fee rate that may vary by class (subject to a performance adjustment). The Adviser or an affiliate pays certain expenses of managing and operating the fund out of each class's management fee. | The fund's sub-advisory agreement with FIL Investments (Japan) Limited was not renewed.
|
| Fidelity, the Fidelity Investments Logo and all other Fidelity trademarks or service marks used herein are trademarks or service marks of FMR LLC. Any third-party marks that are used herein are trademarks or service marks of their respective owners. © 2024 FMR LLC. All rights reserved. |
| | For additional information about the Fund; including its prospectus, financial information, holdings and proxy information, scan the QR code or visit fundresearch.fidelity.com/prospectus/sec 1.9913948.100 1979-TSRA-1224 |
| |
| | ANNUAL SHAREHOLDER REPORT | AS OF OCTOBER 31, 2024 | This report describes changes to the Fund that occurred during the reporting period. |
| | Fidelity® China Region Fund Fidelity Advisor® China Region Fund Class Z : FIQFX |
| | | |
This annual shareholder report contains information about Fidelity® China Region Fund for the period November 1, 2023 to October 31, 2024. You can find additional information about the Fund at fundresearch.fidelity.com/prospectus/sec. You can also request this information by contacting us at 1-877-208-0098 or by sending an e-mail to fidfunddocuments@fidelity.com.
What were your Fund costs for the last year?(based on hypothetical $10,000 investment)
FUND COST (PREVIOUS YEAR)
| | Costs of a $10,000 investment | Costs paid as a percentage of a $10,000 investment | |
| Class Z | $ 90 | 0.77% | |
What affected the Fund's performance this period?
•International stocks achieved a strong gain for the 12 months ending October 31, 2024. Resilient global economic growth and a slowing in the pace of inflation in certain regions, as well as a shift to global monetary easing, contributed to a favorable backdrop, despite persistent geopolitical risk.
•After trailing for most of the period, stocks in the China region got a boost in September from the Chinese government's announcement of aggressive monetary stimulus measures.
•Against this backdrop, picks in Taiwan had, by far, the biggest positive impact on the fund's performance versus the MSCI Golden Dragon (Net MA) Index for the fiscal year.
•By sector, security selection in information technology was the primary contributor, where our stock picks in semiconductors & semiconductor equipment helped most. Stock picks in materials and consumer discretionary also boosted the fund's relative performance.
•The top individual relative contributor was an overweight in Taiwan Semiconductor (+101%). The stock was the fund's biggest holding. A non-benchmark stake in Sea gained roughly 118% and was a second notable relative contributor. An overweight in Trip.com (+89%) also contributed. The stock was among our largest holdings.
•In contrast, from a geographical standpoint, an underweight in Taiwan, stock selection in Hong Kong and non-benchmark exposure to South Korea detracted from the fund's relative result.
•By sector, the biggest detractor from performance versus the benchmark was security selection in financials, primarily within the insurance industry. Stock selection and an overweight in health care also hampered the fund's result, as did picks in energy. Lastly, the fund's position in cash detracted.
•The biggest individual relative detractor was an overweight in NetEase (-25%). The company was among our largest holdings this period. The second-largest relative detractor was our non-benchmark stake in Samsung Electronics (-10%). Another notable relative detractor was our stake in Asymchem Laboratories (-54%), which was not held by the fund at period end.
•Notable changes in positioning include increased exposure to Taiwan and a lower allocation to Hong Kong. By sector, meaningful changes in positioning include lower allocations to health care and consumer staples.
How did the Fund perform over the life of Fund?
CUMULATIVE PERFORMANCE
October 2, 2018 through October 31, 2024.
Initial investment of $10,000.
Class Z | $10,000 | $8,860 | $11,151 | $15,960 | $16,613 | $9,142 | $11,387 |
MSCI Golden Dragon Index | $10,000 | $9,059 | $10,451 | $13,228 | $13,731 | $7,859 | $9,513 |
MSCI Emerging Markets Index | $10,000 | $9,258 | $10,359 | $11,216 | $13,120 | $9,051 | $10,032 |
| | 2018 | 2019 | 2020 | 2021 | 2022 | 2023 | 2024 |
AVERAGE ANNUAL TOTAL RETURNS:| | 1 Year | 5 Year | Life of Fund A |
| Class Z | 33.34% | 6.37% | 7.10% |
| MSCI Golden Dragon Index | 32.29% | 3.79% | 3.85% |
| MSCI Emerging Markets Index | 25.33% | 3.95% | 3.83% |
A From October 2, 2018
Visit institutional.fidelity.com for more recent performance information. |
The Fund's past performance is not a good predictor of the Fund's future performance. The graph and table do not reflect the deduction of taxes that a shareholder would pay on fund distributions or redemption of fund shares. |
Key Fund Statistics(as of October 31, 2024)
KEY FACTS | | |
| Fund Size | $1,209,670,065 | |
| Number of Holdings | 86 | |
| Total Advisory Fee | $8,069,000 | |
| Portfolio Turnover | 30% | |
What did the Fund invest in?
(as of October 31, 2024)
MARKET SECTORS (% of Fund's net assets) | | |
| Information Technology | 31.3 | |
| Consumer Discretionary | 23.9 | |
| Communication Services | 13.8 | |
| Financials | 13.1 | |
| Industrials | 4.2 | |
| Health Care | 3.3 | |
| Materials | 3.2 | |
| Consumer Staples | 2.6 | |
| Real Estate | 1.0 | |
| Energy | 0.5 | |
| |
| Common Stocks | 94.9 |
| Preferred Stocks | 2.0 |
| Short-Term Investments and Net Other Assets (Liabilities) | 3.1 |
ASSET ALLOCATION (% of Fund's net assets) |
|
|
| China | 57.8 |
| Taiwan | 30.2 |
| Hong Kong | 5.0 |
| United States | 3.6 |
| Korea (South) | 1.3 |
| Singapore | 0.9 |
| Macau | 0.5 |
| France | 0.4 |
| Japan | 0.3 |
GEOGRAPHIC DIVERSIFICATION (% of Fund's net assets) |
|
| |
|
TOP HOLDINGS(% of Fund's net assets) | | |
| Taiwan Semiconductor Manufacturing Co Ltd | 22.8 | |
| Tencent Holdings Ltd | 10.3 | |
| Alibaba Group Holding Ltd | 5.5 | |
| Meituan B Shares | 4.0 | |
| PDD Holdings Inc Class A ADR | 3.4 | |
| China Construction Bank Corp H Shares | 3.1 | |
| AIA Group Ltd | 3.0 | |
| Hon Hai Precision Industry Co Ltd | 2.4 | |
| Zijin Mining Group Co Ltd H Shares | 2.1 | |
| JD.com Inc A Shares | 1.5 | |
| | 58.1 | |
How has the Fund changed?
This is a summary of certain changes to the Fund since November 1, 2023. For more complete information, you may review the Fund's next prospectus, which we expect to be available by December 30, 2024 at fundresearch.fidelity.com/prospectus/sec or upon request at 1-877-208-0098 or by sending an e-mail to fidfunddocuments@fidelity.com.
The fund's transfer agent and pricing & bookkeeping fees were changed to a fixed rate effective December 1, 2023, through February 29, 2024, in anticipation of the transition to a new management fee structure. Effective March 1, 2024, the fund's management contract was amended to incorporate administrative services previously covered under separate services agreements (transfer agent and pricing & bookkeeping). The amended contract incorporates a management fee rate that may vary by class. The Adviser or an affiliate pays certain expenses of managing and operating the fund out of each class's management fee. | The fund's sub-advisory agreement with FIL Investments (Japan) Limited was not renewed.
|
| Fidelity, the Fidelity Investments Logo and all other Fidelity trademarks or service marks used herein are trademarks or service marks of FMR LLC. Any third-party marks that are used herein are trademarks or service marks of their respective owners. © 2024 FMR LLC. All rights reserved. |
| | For additional information about the Fund; including its prospectus, financial information, holdings and proxy information, scan the QR code or visit fundresearch.fidelity.com/prospectus/sec 1.9913893.100 3264-TSRA-1224 |
| |
| | ANNUAL SHAREHOLDER REPORT | AS OF OCTOBER 31, 2024 | This report describes changes to the Fund that occurred during the reporting period. |
| | Fidelity® Emerging Markets Fund Fidelity® Emerging Markets Fund Class K : FKEMX |
| | | |
This annual shareholder report contains information about Fidelity® Emerging Markets Fund for the period November 1, 2023 to October 31, 2024. You can find additional information about the Fund at fundresearch.fidelity.com/prospectus/sec. You can also request this information by contacting us at 1-800-835-5092 or by sending an e-mail to fidfunddocuments@fidelity.com.
What were your Fund costs for the last year?(based on hypothetical $10,000 investment)
FUND COST (PREVIOUS YEAR)
| | Costs of a $10,000 investment | Costs paid as a percentage of a $10,000 investment | |
| Class K | $ 84 | 0.74% | |
What affected the Fund's performance this period?
•International stocks achieved a strong gain for the 12 months ending October 31, 2024. Resilient global economic growth and a slowing in the pace of inflation in certain regions, as well as a shift to global monetary easing, contributed to a favorable backdrop, despite persistent geopolitical risk.
•Against this backdrop, a non-benchmark allocation to developed markets - especially the U.S. - and stock picks in Taiwan contributed to the fund's performance versus the MSCI Emerging Markets (Net MA) Index for the fiscal year.
•By sector, the biggest contributors to performance versus the benchmark were stock picking and an overweight in information technology, primarily within the semiconductors & semiconductor equipment industry. An underweight in materials also boosted the fund's relative performance. Also bolstering our relative result was stock picking in consumer discretionary.
•The fund's non-benchmark stake in Nvidia gained 223% and was the top individual relative contributor. This period we decreased our investment in Nvidia. The stock was among our largest holdings. A second notable relative contributor was our non-benchmark stake in International Games System (+242%). This period we decreased our investment in International Games System. An overweight in Taiwan Semiconductor Manufacturing (+99%) also helped. The stock was the fund's largest holding.
•In contrast, from a geographical standpoint, stock picks in India and South Korea detracted from the fund's relative result.
•By sector, the biggest detractor from performance versus the benchmark was stock picking in financials. Also hurting our result were picks and overweights in consumer staples and health care.
•The largest individual relative detractor was an underweight in Alibaba (+23%). The stock was not held at period end. The second-largest relative detractor was an overweight in Kweichow Moutai (-4%). The company was among the fund's largest holdings this period. Another notable relative detractor this period was avoiding Hon Hai Precision Industry, a benchmark component that gained approximately 128%.
•Notable changes in positioning include decreased exposure to India and Saudi Arabia, and a higher allocation to China and Taiwan. By sector, meaningful changes in positioning include decreased exposure to materials and a higher allocation to industrials.
How did the Fund perform over the past 10 years?
CUMULATIVE PERFORMANCE
October 31, 2014 through October 31, 2024.
Initial investment of $10,000.
Class K | $10,000 | $8,940 | $9,679 | $12,626 | $10,809 | $13,521 | $16,797 | $20,147 | $12,545 | $14,512 | $18,315 |
MSCI Emerging Markets Index | $10,000 | $8,550 | $9,346 | $11,823 | $10,347 | $11,577 | $12,535 | $14,663 | $10,115 | $11,211 | $14,051 |
| | 2014 | 2015 | 2016 | 2017 | 2018 | 2019 | 2020 | 2021 | 2022 | 2023 | 2024 |
AVERAGE ANNUAL TOTAL RETURNS:| | 1 Year | 5 Year | 10 Year |
| Class K | 26.20% | 6.26% | 6.24% |
| MSCI Emerging Markets Index | 25.33% | 3.95% | 3.46% |
Visit www.401k.com for more recent performance information. |
The Fund's past performance is not a good predictor of the Fund's future performance. The graph and table do not reflect the deduction of taxes that a shareholder would pay on fund distributions or redemption of fund shares. |
Key Fund Statistics(as of October 31, 2024)
KEY FACTS | | |
| Fund Size | $8,930,817,606 | |
| Number of Holdings | 86 | |
| Total Advisory Fee | $66,535,420 | |
| Portfolio Turnover | 46% | |
What did the Fund invest in?
(as of October 31, 2024)
MARKET SECTORS (% of Fund's net assets) | | |
| Information Technology | 28.4 | |
| Financials | 17.2 | |
| Consumer Discretionary | 12.9 | |
| Industrials | 9.5 | |
| Communication Services | 9.3 | |
| Energy | 6.2 | |
| Consumer Staples | 5.4 | |
| Health Care | 5.3 | |
| Materials | 2.0 | |
| Utilities | 1.7 | |
| Real Estate | 0.6 | |
| |
| Common Stocks | 98.3 |
| Bonds | 0.3 |
| Preferred Stocks | 0.2 |
| Short-Term Investments and Net Other Assets (Liabilities) | 1.2 |
ASSET ALLOCATION (% of Fund's net assets) |
|
|
| China | 24.6 |
| India | 18.4 |
| Taiwan | 16.2 |
| Brazil | 6.6 |
| Korea (South) | 6.4 |
| United States | 6.3 |
| Indonesia | 3.8 |
| Saudi Arabia | 3.0 |
| Mexico | 2.8 |
| Others | 11.9 |
GEOGRAPHIC DIVERSIFICATION (% of Fund's net assets) |
|
| |
|
TOP HOLDINGS(% of Fund's net assets) | | |
| Taiwan Semiconductor Manufacturing Co Ltd | 13.5 | |
| Tencent Holdings Ltd | 6.6 | |
| NVIDIA Corp | 4.0 | |
| Meituan B Shares | 3.1 | |
| PDD Holdings Inc Class A ADR | 3.1 | |
| Samsung Electronics Co Ltd | 3.0 | |
| Bank Central Asia Tbk PT | 2.9 | |
| HDFC Bank Ltd | 2.6 | |
| SK Hynix Inc | 2.2 | |
| JD.com Inc ADR | 2.1 | |
| | 43.1 | |
How has the Fund changed?
This is a summary of certain changes to the Fund since November 1, 2023. For more complete information, you may review the Fund's next prospectus, which we expect to be available by December 30, 2024 at fundresearch.fidelity.com/prospectus/sec or upon request at 1-800-835-5092 or by sending an e-mail to fidfunddocuments@fidelity.com.
Fidelity® Latin America Fund merged into Fidelity® Emerging Markets Fund on September 13, 2024. | The fund's transfer agent and pricing & bookkeeping fees were changed to a fixed rate effective December 1, 2023, through February 29, 2024, in anticipation of the transition to a new management fee structure. Effective March 1, 2024, the fund's management contract was amended to incorporate administrative services previously covered under separate services agreements (transfer agent and pricing & bookkeeping). The amended contract incorporates a management fee rate that may vary by class. The Adviser or an affiliate pays certain expenses of managing and operating the fund out of each class's management fee.
|
The fund's sub-advisory agreement with FIL Investments (Japan) Limited was not renewed. | |
| Fidelity, the Fidelity Investments Logo and all other Fidelity trademarks or service marks used herein are trademarks or service marks of FMR LLC. Any third-party marks that are used herein are trademarks or service marks of their respective owners. © 2024 FMR LLC. All rights reserved. |
| | For additional information about the Fund; including its prospectus, financial information, holdings and proxy information, scan the QR code or visit fundresearch.fidelity.com/prospectus/sec 1.9913858.100 2084-TSRA-1224 |
| |
| | ANNUAL SHAREHOLDER REPORT | AS OF OCTOBER 31, 2024 | This report describes changes to the Fund that occurred during the reporting period. |
| | Fidelity® International Capital Appreciation Fund Fidelity® International Capital Appreciation Fund : FIVFX |
| | | |
This annual shareholder report contains information about Fidelity® International Capital Appreciation Fund for the period November 1, 2023 to October 31, 2024. You can find additional information about the Fund at fundresearch.fidelity.com/prospectus/sec. You can also request this information by contacting us at 1-800-544-8544 or by sending an e-mail to fidfunddocuments@fidelity.com.
What were your Fund costs for the last year?(based on hypothetical $10,000 investment)
FUND COST (PREVIOUS YEAR)
| | Costs of a $10,000 investment | Costs paid as a percentage of a $10,000 investment | |
| Fidelity® International Capital Appreciation Fund | $ 98 | 0.86% | |
What affected the Fund's performance this period?
•International stocks achieved a strong gain for the 12 months ending October 31, 2024. Resilient global economic growth and a slowing in the pace of inflation in certain regions, as well as a shift to global monetary easing, contributed to a favorable backdrop, despite persistent geopolitical risk.
•Against this backdrop, security selection and an underweight in emerging markets and stock selection in Europe ex U.K. contributed to the fund's performance versus the MSCI All Country World ex US Index (Net MA) for the fiscal year.
•By sector, market selection was the primary contributor, led by an overweight in information technology, where an overweight in semiconductors & semiconductor equipment helped most. Picks and an overweight in industrials also boosted relative performance. Also contributing to our result was a lack of exposure to the lagging energy sector.
•The fund's non-benchmark stake in Nvidia gained 221% and was the top individual relative contributor. The stock was not held at period end. A second notable relative contributor was an overweight in Taiwan Semiconductor Manufacturing (+99%). The company was the fund's largest holding. Another notable relative contributor was an overweight in Brookfield Asset Management (+91%).
•In contrast, from a regional standpoint, security selection in Canada and an overweight in Europe ex U.K., primarily in France, detracted from the fund's relative result.
•By sector, the biggest detractor from performance versus the benchmark was stock selection in information technology, primarily within the software & services industry. Also hurting our result were stock picks in consumer staples and health care.
•The biggest individual relative detractor was our stake in OBIC (-23%). A second notable relative detractor was an underweight in Shopify (+66%). An overweight in LVMH Moet Hennessy Louis Vuitton (-5%) also hurt. The stock was among our largest holdings.
•Notable changes in positioning include increased exposure to China and Japan. By sector, meaningful changes in positioning include increased exposure to communication services and a lower allocation to consumer staples, where we liquidated all of the fund's holdings.
How did the Fund perform over the past 10 years?
CUMULATIVE PERFORMANCE
October 31, 2014 through October 31, 2024.
Initial investment of $10,000.
Fidelity® International Capital Appreciation Fund | $10,000 | $10,396 | $10,451 | $13,181 | $12,192 | $14,929 | $16,921 | $21,585 | $14,901 | $17,269 | $22,323 |
MSCI ACWI (All Country World Index) ex USA Index | $10,000 | $9,545 | $9,583 | $11,868 | $10,910 | $12,161 | $11,862 | $15,403 | $11,613 | $13,038 | $16,238 |
| | 2014 | 2015 | 2016 | 2017 | 2018 | 2019 | 2020 | 2021 | 2022 | 2023 | 2024 |
AVERAGE ANNUAL TOTAL RETURNS:| | 1 Year | 5 Year | 10 Year |
| Fidelity® International Capital Appreciation Fund | 29.27% | 8.38% | 8.36% |
| MSCI ACWI (All Country World Index) ex USA Index | 24.55% | 5.95% | 4.97% |
Visit www.fidelity.com for more recent performance information. |
The Fund's past performance is not a good predictor of the Fund's future performance. The graph and table do not reflect the deduction of taxes that a shareholder would pay on fund distributions or redemption of fund shares. |
Key Fund Statistics(as of October 31, 2024)
KEY FACTS | | |
| Fund Size | $3,596,498,901 | |
| Number of Holdings | 62 | |
| Total Advisory Fee | $41,870,301 | |
| Portfolio Turnover | 78% | |
What did the Fund invest in?
(as of October 31, 2024)
MARKET SECTORS (% of Fund's net assets) | | |
| Industrials | 31.0 | |
| Financials | 21.7 | |
| Information Technology | 18.3 | |
| Consumer Discretionary | 11.4 | |
| Materials | 8.8 | |
| Health Care | 4.5 | |
| Communication Services | 4.0 | |
| |
| Common Stocks | 99.7 |
| Short-Term Investments and Net Other Assets (Liabilities) | 0.3 |
ASSET ALLOCATION (% of Fund's net assets) |
|
|
| United States | 19.8 |
| Japan | 12.6 |
| United Kingdom | 10.9 |
| France | 8.8 |
| India | 7.9 |
| Canada | 6.4 |
| China | 5.3 |
| Netherlands | 5.2 |
| Taiwan | 4.5 |
| Others | 18.6 |
GEOGRAPHIC DIVERSIFICATION (% of Fund's net assets) |
|
| |
|
TOP HOLDINGS(% of Fund's net assets) | | |
| Taiwan Semiconductor Manufacturing Co Ltd | 4.5 | |
| Novo Nordisk A/S Series B | 2.9 | |
| SAP SE | 2.5 | |
| Tencent Holdings Ltd | 2.4 | |
| ASML Holding NV | 2.3 | |
| LVMH Moet Hennessy Louis Vuitton SE | 2.3 | |
| Schneider Electric SE | 2.1 | |
| Hitachi Ltd | 1.9 | |
| ABB Ltd | 1.8 | |
| Keyence Corp | 1.7 | |
| | 24.4 | |
How has the Fund changed?
This is a summary of certain changes to the Fund since November 1, 2023. For more complete information, you may review the Fund's next prospectus, which we expect to be available by December 30, 2024 at fundresearch.fidelity.com/prospectus/sec or upon request at 1-800-544-8544 or by sending an e-mail to fidfunddocuments@fidelity.com.
The fees associated with this class changed during the reporting year.The variations in class fees are primarily the result of the following changes: - Management fee
- Performance adjustment fee
The fund's transfer agent and pricing & bookkeeping fees were changed to a fixed rate effective December 1, 2023, through February 29, 2024, in anticipation of the transition to a new management fee structure. Effective March 1, 2024, the fund's management contract was amended to incorporate administrative services previously covered under separate services agreements (transfer agent and pricing & bookkeeping). The amended contract incorporates a basic fee rate that may vary by class (subject to a performance adjustment). The Adviser or an affiliate pays certain expenses of managing and operating the fund out of each class's management fee. | The fund's sub-advisory agreement with FIL Investments (Japan) Limited was not renewed.
|
| Fidelity, the Fidelity Investments Logo and all other Fidelity trademarks or service marks used herein are trademarks or service marks of FMR LLC. Any third-party marks that are used herein are trademarks or service marks of their respective owners. © 2024 FMR LLC. All rights reserved. |
| | For additional information about the Fund; including its prospectus, financial information, holdings and proxy information, scan the QR code or visit fundresearch.fidelity.com/prospectus/sec 1.9913868.100 335-TSRA-1224 |
| |
| | ANNUAL SHAREHOLDER REPORT | AS OF OCTOBER 31, 2024 | This report describes changes to the Fund that occurred during the reporting period. |
| | Fidelity® Global Equity Income Fund Fidelity Advisor® Global Equity Income Fund Class M : FGEGX |
| | | |
This annual shareholder report contains information about Fidelity® Global Equity Income Fund for the period October 18, 2024 to October 31, 2024. You can find additional information about the Fund at fundresearch.fidelity.com/prospectus/sec. You can also request this information by contacting us at 1-877-208-0098 or by sending an e-mail to fidfunddocuments@fidelity.com.
What were your Fund costs for the last year?(based on hypothetical $10,000 investment)
FUND COST (PREVIOUS YEAR)
| | Costs of a $10,000 investment | Costs paid as a percentage of a $10,000 investment | |
Class M A | $ 5 | 1.31% | |
AExpenses for the full reporting period would be higher.
What affected the Fund's performance this period?
•Global equities posted a strong advance for the 12 months ending October 31, 2024. Resilient economic growth and a slowing in the pace of inflation in certain regions, as well as a shift to global monetary easing, contributed to a favorable backdrop, despite persistent geopolitical risk.
•Against this backdrop, stock picking in the United States and picks and an overweight in the U.K. detracted from the fund's performance versus the MSCI All Country World Index (Net MA) for the fiscal year.
•By sector, the biggest detractor from performance versus the benchmark was stock selection in information technology. Also hurting our result was stock selection in consumer discretionary and communication services, primarily within the media & entertainment industry. Lastly, the fund's position in cash detracted.
•The biggest individual relative detractor this period was avoiding Nvidia, a benchmark component that gained about 226%. Not owning Meta Platforms, a benchmark component that gained 89%, was the second-largest relative detractor. An overweight in Dollar Tree (-41%) also hurt.
•In contrast, from a regional standpoint, an underweight in emerging markets and picks in Europe ex U.K., primarily in Germany, contributed to the fund's relative result.
•By sector, the biggest contributor to performance versus the benchmark was security selection in industrials, primarily within the capital goods industry. Stock picks in utilities and health care, primarily within the pharmaceuticals, biotechnology & life sciences industry, also boosted the fund's relative result.
•The top individual relative contributor was an overweight in Vistra (+290%). The second-largest relative contributor was an overweight in Taiwan Semiconductor (+97%), which was among the largest holdings. Another notable relative contributor was an overweight in Rheinmetall (+82%), also among the biggest holdings.
•Notable changes in positioning include a lower allocation to France. By sector, meaningful changes in positioning include increased exposure to industrials and a lower allocation to consumer staples.
Key Fund Statistics(as of October 31, 2024)
KEY FACTS | | |
| Fund Size | $257,697,453 | |
| Number of Holdings | 153 | |
| Total Advisory Fee | $1,240,182 | |
| Portfolio Turnover | 29% | |
What did the Fund invest in?
(as of October 31, 2024)
MARKET SECTORS (% of Fund's net assets) | | |
| Information Technology | 20.5 | |
| Financials | 13.5 | |
| Industrials | 12.1 | |
| Health Care | 11.8 | |
| Consumer Discretionary | 9.4 | |
| Consumer Staples | 8.8 | |
| Communication Services | 6.2 | |
| Energy | 4.8 | |
| Utilities | 4.6 | |
| Materials | 4.3 | |
| Real Estate | 1.1 | |
| |
| Common Stocks | 97.1 |
| Short-Term Investments and Net Other Assets (Liabilities) | 2.9 |
ASSET ALLOCATION (% of Fund's net assets) |
|
|
| United States | 63.6 |
| United Kingdom | 7.4 |
| Japan | 5.5 |
| Canada | 5.2 |
| Germany | 3.8 |
| Taiwan | 2.7 |
| France | 2.6 |
| China | 2.0 |
| Italy | 1.2 |
| Others | 6.0 |
GEOGRAPHIC DIVERSIFICATION (% of Fund's net assets) |
|
| |
|
TOP HOLDINGS(% of Fund's net assets) | | |
| Apple Inc | 5.4 | |
| Microsoft Corp | 4.6 | |
| Taiwan Semiconductor Manufacturing Co Ltd | 2.7 | |
| Rheinmetall AG | 2.2 | |
| NXP Semiconductors NV | 2.0 | |
| JPMorgan Chase & Co | 1.7 | |
| Linde PLC | 1.5 | |
| Eli Lilly & Co | 1.4 | |
| UnitedHealth Group Inc | 1.4 | |
| AbbVie Inc | 1.4 | |
| | 24.3 | |
How has the Fund changed?
This is a summary of certain changes to the Fund since October 18, 2024. For more complete information, you may review the Fund's next prospectus, which we expect to be available by December 30, 2024 at fundresearch.fidelity.com/prospectus/sec or upon request at 1-877-208-0098 or by sending an e-mail to fidfunddocuments@fidelity.com.
Fidelity Advisor® Global Equity Income Fund merged into Fidelity® Global Equity Income Fund on October 25, 2024. | The fund changed its investment objective from non-fundamental to fundamental effective July 26, 2024.
|
The fund's sub-advisory agreement with FIL Investments (Japan) Limited was not renewed. | |
| Fidelity, the Fidelity Investments Logo and all other Fidelity trademarks or service marks used herein are trademarks or service marks of FMR LLC. Any third-party marks that are used herein are trademarks or service marks of their respective owners. © 2024 FMR LLC. All rights reserved. |
| | For additional information about the Fund; including its prospectus, financial information, holdings and proxy information, scan the QR code or visit fundresearch.fidelity.com/prospectus/sec 1.9918442.100 7767-TSRA-1224 |
| |
| | ANNUAL SHAREHOLDER REPORT | AS OF OCTOBER 31, 2024 | This report describes changes to the Fund that occurred during the reporting period. |
| | Fidelity® International Small Cap Opportunities Fund Fidelity® International Small Cap Opportunities Fund : FSCOX |
| | | |
This annual shareholder report contains information about Fidelity® International Small Cap Opportunities Fund for the period November 1, 2023 to October 31, 2024. You can find additional information about the Fund at fundresearch.fidelity.com/prospectus/sec. You can also request this information by contacting us at 1-800-544-8544 or by sending an e-mail to fidfunddocuments@fidelity.com.
What were your Fund costs for the last year?(based on hypothetical $10,000 investment)
FUND COST (PREVIOUS YEAR)
| | Costs of a $10,000 investment | Costs paid as a percentage of a $10,000 investment | |
| Fidelity® International Small Cap Opportunities Fund | $ 111 | 0.98% | |
What affected the Fund's performance this period?
•International stocks achieved a strong gain for the 12 months ending October 31, 2024. Resilient global economic growth and a slowing in the pace of inflation in certain regions, as well as a shift to global monetary easing, contributed to a favorable backdrop, despite persistent geopolitical risk.
•Against this backdrop, stock picking in Europe ex U.K. and a non-benchmark allocation to the United States contributed to the fund's performance versus the MSCI EAFE Small Cap Index (Net MA) for the fiscal year.
•By sector, security selection was the primary contributor, especially within communication services, where our picks in media & entertainment helped most. Stock selection and an overweight in industrials, primarily within the capital goods industry, and security selection and an underweight in consumer discretionary also boosted the fund's relative performance.
•The fund's non-benchmark stake in Lagercrantz gained 116% and was the top individual relative contributor. The stock was the fund's largest holding. The second-largest relative contributor was an overweight in Addtech (+91%). The company was among the fund's largest holdings. A non-benchmark stake in Kongsberg Gruppen gained approximately 158% and notably helped. The stock was one of the fund's biggest holdings this period.
•In contrast, from a regional standpoint, stock selection in the U.K. and a non-benchmark allocation to Canada detracted from the fund's relative result.
•By sector, the biggest detractor from performance versus the benchmark was an underweight in financials. Also hurting our result was security selection in health care and consumer staples. Lastly, the fund's position in cash detracted.
•The largest individual relative detractor was an overweight in Spectris (-11%). The stock was one of our biggest holdings. The second-largest relative detractor was our non-benchmark stake in Richelieu Hardware (-11%). An overweight in SHO-BOND Holdings (-7%) also detracted.
•Notable changes in positioning include a higher allocation to Europe. By sector, meaningful changes in positioning include higher allocations to multi-sector holdings and materials.
How did the Fund perform over the past 10 years?
CUMULATIVE PERFORMANCE
October 31, 2014 through October 31, 2024.
Initial investment of $10,000.
Fidelity® International Small Cap Opportunities Fund | $10,000 | $10,892 | $11,064 | $13,983 | $13,389 | $15,125 | $16,773 | $22,870 | $15,181 | $15,806 | $19,977 |
MSCI EAFE Small Cap Index | $10,000 | $10,855 | $11,194 | $14,295 | $13,198 | $14,385 | $14,210 | $19,320 | $13,494 | $14,394 | $17,734 |
MSCI EAFE Index | $10,000 | $10,008 | $9,705 | $12,004 | $11,206 | $12,472 | $11,638 | $15,647 | $12,073 | $13,841 | $17,059 |
| | 2014 | 2015 | 2016 | 2017 | 2018 | 2019 | 2020 | 2021 | 2022 | 2023 | 2024 |
AVERAGE ANNUAL TOTAL RETURNS:| | 1 Year | 5 Year | 10 Year |
| Fidelity® International Small Cap Opportunities Fund | 26.39% | 5.72% | 7.17% |
| MSCI EAFE Small Cap Index | 23.20% | 4.27% | 5.90% |
| MSCI EAFE Index | 23.25% | 6.46% | 5.49% |
Visit www.fidelity.com for more recent performance information. |
The Fund's past performance is not a good predictor of the Fund's future performance. The graph and table do not reflect the deduction of taxes that a shareholder would pay on fund distributions or redemption of fund shares. |
Key Fund Statistics(as of October 31, 2024)
KEY FACTS | | |
| Fund Size | $1,271,531,943 | |
| Number of Holdings | 111 | |
| Total Advisory Fee | $10,572,915 | |
| Portfolio Turnover | 27% | |
What did the Fund invest in?
(as of October 31, 2024)
MARKET SECTORS (% of Fund's net assets) | | |
| Industrials | 30.2 | |
| Information Technology | 19.8 | |
| Consumer Discretionary | 10.2 | |
| Communication Services | 9.3 | |
| Financials | 6.5 | |
| Health Care | 5.1 | |
| Materials | 4.3 | |
| Consumer Staples | 3.3 | |
| Real Estate | 2.4 | |
| Energy | 1.7 | |
| |
| Common Stocks | 92.8 |
| International Equity Funds | 4.8 |
| Short-Term Investments and Net Other Assets (Liabilities) | 2.4 |
ASSET ALLOCATION (% of Fund's net assets) |
|
|
| Japan | 25.1 |
| Sweden | 14.6 |
| United Kingdom | 14.3 |
| United States | 10.5 |
| Germany | 7.8 |
| Netherlands | 4.9 |
| Canada | 3.6 |
| France | 2.5 |
| Italy | 2.4 |
| Others | 14.3 |
GEOGRAPHIC DIVERSIFICATION (% of Fund's net assets) |
|
| |
|
TOP HOLDINGS(% of Fund's net assets) | | |
| Lagercrantz Group AB B Shares | 5.1 | |
| iShares MSCI EAFE Small-Cap ETF | 4.8 | |
| CTS Eventim AG & Co KGaA | 4.1 | |
| AddTech AB B Shares | 4.1 | |
| Azbil Corp | 3.2 | |
| Morningstar Inc | 2.7 | |
| Spectris PLC | 2.6 | |
| Interpump Group SpA | 2.4 | |
| Aalberts NV | 2.2 | |
| Howden Joinery Group PLC | 2.0 | |
| | 33.2 | |
How has the Fund changed?
This is a summary of certain changes to the Fund since November 1, 2023. For more complete information, you may review the Fund's next prospectus, which we expect to be available by December 30, 2024 at fundresearch.fidelity.com/prospectus/sec or upon request at 1-800-544-8544 or by sending an e-mail to fidfunddocuments@fidelity.com.
The fund's transfer agent and pricing & bookkeeping fees were changed to a fixed rate effective December 1, 2023, through February 29, 2024, in anticipation of the transition to a new management fee structure. Effective March 1, 2024, the fund's management contract was amended to incorporate administrative services previously covered under separate services agreements (transfer agent and pricing & bookkeeping). The amended contract incorporates a basic fee rate that may vary by class (subject to a performance adjustment). The Adviser or an affiliate pays certain expenses of managing and operating the fund out of each class's management fee. | The fund's sub-advisory agreement with FIL Investments (Japan) Limited was not renewed.
|
| Fidelity, the Fidelity Investments Logo and all other Fidelity trademarks or service marks used herein are trademarks or service marks of FMR LLC. Any third-party marks that are used herein are trademarks or service marks of their respective owners. © 2024 FMR LLC. All rights reserved. |
| | For additional information about the Fund; including its prospectus, financial information, holdings and proxy information, scan the QR code or visit fundresearch.fidelity.com/prospectus/sec 1.9913934.100 1504-TSRA-1224 |
| |
| | ANNUAL SHAREHOLDER REPORT | AS OF OCTOBER 31, 2024 | This report describes changes to the Fund that occurred during the reporting period. |
| | Fidelity® Total International Equity Fund Fidelity Advisor® Total International Equity Fund Class Z : FIEZX |
| | | |
This annual shareholder report contains information about Fidelity® Total International Equity Fund for the period November 1, 2023 to October 31, 2024. You can find additional information about the Fund at fundresearch.fidelity.com/prospectus/sec. You can also request this information by contacting us at 1-877-208-0098 or by sending an e-mail to fidfunddocuments@fidelity.com.
What were your Fund costs for the last year?(based on hypothetical $10,000 investment)
FUND COST (PREVIOUS YEAR)
| | Costs of a $10,000 investment | Costs paid as a percentage of a $10,000 investment | |
| Class Z | $ 95 | 0.85% | |
What affected the Fund's performance this period?
•International stocks achieved a strong gain for the 12 months ending October 31, 2024. Resilient global economic growth and a slowing in the pace of inflation in certain regions, as well as a shift to global monetary easing, contributed to a favorable backdrop, despite persistent geopolitical risk.
•Against this backdrop, an overweight in the United States and stock picks in Japan contributed to the fund's performance versus the MSCI All Country World ex US Index (Net MA) for the fiscal year.
•By sector, the biggest contributor to performance versus the benchmark was stock selection in materials. An underweight in consumer staples also boosted relative performance. Also bolstering our relative result were picks and an overweight in industrials, primarily within the capital goods industry.
•The top individual relative contributor was an overweight in Taiwan Semiconductor (+100%). The company was the fund's largest holding. The second-largest relative contributor was an overweight in CRH (+83%). The stock was among our largest holdings. An overweight in China Life Insurance (+65%) also contributed.
•In contrast, from a regional standpoint, stock picks in Canada and the United States detracted from the fund's relative result.
•By sector, the biggest detractor from performance versus the benchmark was stock selection in financials. Also hurting our result was security selection in information technology, primarily within the technology hardware & equipment industry, and consumer staples, primarily within the consumer staples distribution & retail industry. Lastly, the fund's position in cash detracted.
•The largest individual relative detractor was an overweight in Samsung Electronics (-13%). The stock was among our biggest holdings. The second-largest relative detractor was an overweight in Wal Mart De Mexico (-21%). This period we increased our stake in Wal Mart De Mexico. An overweight in Edenred (-38%) also detracted.
•Notable changes in positioning include higher allocations to Germany and the United Kingdom. By sector, meaningful changes in positioning include decreased exposure to consumer discretionary and energy.
How did the Fund perform over the life of Fund?
CUMULATIVE PERFORMANCE
February 1, 2017 through October 31, 2024.
Initial investment of $10,000.
Class Z | $10,000 | $12,147 | $11,099 | $12,779 | $13,385 | $17,874 | $13,390 | $15,135 |
MSCI ACWI (All Country World Index) ex USA Index | $10,000 | $11,916 | $10,954 | $12,210 | $11,910 | $15,465 | $11,660 | $13,090 |
| | 2017 | 2018 | 2019 | 2020 | 2021 | 2022 | 2023 | 2024 |
AVERAGE ANNUAL TOTAL RETURNS:| | 1 Year | 5 Year | Life of Fund A |
| Class Z | 25.73% | 8.29% | 8.66% |
| MSCI ACWI (All Country World Index) ex USA Index | 24.55% | 5.95% | 6.51% |
A From February 1, 2017
Visit institutional.fidelity.com for more recent performance information. |
The Fund's past performance is not a good predictor of the Fund's future performance. The graph and table do not reflect the deduction of taxes that a shareholder would pay on fund distributions or redemption of fund shares. |
Key Fund Statistics(as of October 31, 2024)
KEY FACTS | | |
| Fund Size | $319,759,338 | |
| Number of Holdings | 305 | |
| Total Advisory Fee | $2,246,403 | |
| Portfolio Turnover | 33% | |
What did the Fund invest in?
(as of October 31, 2024)
MARKET SECTORS (% of Fund's net assets) | | |
| Financials | 23.8 | |
| Industrials | 20.0 | |
| Information Technology | 14.0 | |
| Materials | 10.5 | |
| Consumer Discretionary | 9.5 | |
| Health Care | 5.5 | |
| Energy | 5.0 | |
| Communication Services | 4.2 | |
| Consumer Staples | 3.6 | |
| Real Estate | 0.3 | |
| Utilities | 0.2 | |
| |
| Common Stocks | 96.4 |
| Preferred Stocks | 0.2 |
| Short-Term Investments and Net Other Assets (Liabilities) | 3.4 |
ASSET ALLOCATION (% of Fund's net assets) |
|
|
| United States | 14.5 |
| Japan | 10.8 |
| China | 9.3 |
| United Kingdom | 8.6 |
| France | 6.5 |
| Canada | 6.3 |
| Germany | 5.9 |
| Taiwan | 4.8 |
| Korea (South) | 3.9 |
| Others | 29.4 |
GEOGRAPHIC DIVERSIFICATION (% of Fund's net assets) |
|
| |
|
TOP HOLDINGS(% of Fund's net assets) | | |
| Taiwan Semiconductor Manufacturing Co Ltd | 3.4 | |
| Tencent Holdings Ltd | 2.5 | |
| CRH PLC | 1.8 | |
| Samsung Electronics Co Ltd | 1.8 | |
| SAP SE | 1.6 | |
| Novo Nordisk A/S Series B | 1.6 | |
| Linde PLC | 1.6 | |
| ASML Holding NV | 1.5 | |
| Canadian Pacific Kansas City Ltd | 1.5 | |
| BAE Systems PLC | 1.3 | |
| | 18.6 | |
How has the Fund changed?
This is a summary of certain changes to the Fund since November 1, 2023. For more complete information, you may review the Fund's next prospectus, which we expect to be available by December 30, 2024 at fundresearch.fidelity.com/prospectus/sec or upon request at 1-877-208-0098 or by sending an e-mail to fidfunddocuments@fidelity.com.
| The fund's transfer agent and pricing & bookkeeping fees were changed to a fixed rate effective December 1, 2023, through February 29, 2024, in anticipation of the transition to a new management fee structure. Effective March 1, 2024, the fund's management contract was amended to incorporate administrative services previously covered under separate services agreements (transfer agent and pricing & bookkeeping). The amended contract incorporates a basic fee rate that may vary by class (subject to a performance adjustment). The Adviser or an affiliate pays certain expenses of managing and operating the fund out of each class's management fee. The class reduced its contractual expense cap during the reporting period.
|
The fund's sub-advisory agreement with FIL Investments (Japan) Limited was not renewed. | |
| Fidelity, the Fidelity Investments Logo and all other Fidelity trademarks or service marks used herein are trademarks or service marks of FMR LLC. Any third-party marks that are used herein are trademarks or service marks of their respective owners. © 2024 FMR LLC. All rights reserved. |
| | For additional information about the Fund; including its prospectus, financial information, holdings and proxy information, scan the QR code or visit fundresearch.fidelity.com/prospectus/sec 1.9913947.100 2892-TSRA-1224 |
| |
| | ANNUAL SHAREHOLDER REPORT | AS OF OCTOBER 31, 2024 | This report describes changes to the Fund that occurred during the reporting period. |
| | Fidelity® Overseas Fund Fidelity® Overseas Fund Class K : FOSKX |
| | | |
This annual shareholder report contains information about Fidelity® Overseas Fund for the period November 1, 2023 to October 31, 2024. You can find additional information about the Fund at fundresearch.fidelity.com/prospectus/sec. You can also request this information by contacting us at 1-800-835-5092 or by sending an e-mail to fidfunddocuments@fidelity.com.
What were your Fund costs for the last year?(based on hypothetical $10,000 investment)
FUND COST (PREVIOUS YEAR)
| | Costs of a $10,000 investment | Costs paid as a percentage of a $10,000 investment | |
| Class K | $ 71 | 0.63% | |
What affected the Fund's performance this period?
•International stocks achieved a strong gain for the 12 months ending October 31, 2024. Resilient global economic growth and a slowing in the pace of inflation in certain regions, as well as a shift to global monetary easing, contributed to a favorable backdrop, despite persistent geopolitical risk.
•Against this backdrop, stock picking in the U.K. and Japan contributed to the fund's performance versus the MSCI EAFE Index (Net MA) for the fiscal year.
•By sector, market selection was the primary contributor, led by an underweights in energy and consumer staples. Stock picks and an overweight in industrials, primarily within the capital goods industry, also boosted the fund's relative performance.
•The top individual relative contributor was an overweight in Mitsubishi Heavy Industries (+156%). This was a stake we established this period. The second-largest relative contributor was an overweight in Tokio Marine Holdings (+70%). Although we reduced the fund's stake, the company was one of our largest holdings. Another notable relative contributor was our non-benchmark stake in Taiwan Semiconductor Manufacturing (+101%).
•In contrast, from a regional standpoint, stock selection in the United States and underweights in Japan and Asia Pacific ex Japan detracted from the fund's relative result.
•By sector, the biggest detractor from performance versus the benchmark was stock selection in consumer staples. Also hurting our result were stock picks in consumer discretionary, primarily within the consumer durables & apparel industry. Choices in information technology, primarily within the software & services industry, also hurt. Lastly, the fund's position in cash detracted.
•The largest individual relative detractor was our stake in Diageo (-11%). The stock was not held at period end. A non-benchmark stake in Alten returned approximately -27% and was the second-largest relative detractor. Our overweight stake in Sony Group (+1%) also hurt. The stock was not held at period end.
•Notable changes in positioning include increased exposure to Japan and the United States, and a lower allocation to Sweden. By sector, meaningful changes in positioning include decreased exposure to consumer staples and energy, and a higher allocation to industrials and materials.
How did the Fund perform over the past 10 years?
CUMULATIVE PERFORMANCE
October 31, 2014 through October 31, 2024.
Initial investment of $10,000.
Class K | $10,000 | $10,847 | $10,756 | $13,531 | $12,567 | $14,314 | $14,938 | $20,609 | $14,418 | $16,301 | $20,547 |
MSCI EAFE Index | $10,000 | $10,008 | $9,705 | $12,004 | $11,206 | $12,472 | $11,638 | $15,647 | $12,073 | $13,841 | $17,059 |
| | 2014 | 2015 | 2016 | 2017 | 2018 | 2019 | 2020 | 2021 | 2022 | 2023 | 2024 |
AVERAGE ANNUAL TOTAL RETURNS:| | 1 Year | 5 Year | 10 Year |
| Class K | 26.04% | 7.50% | 7.47% |
| MSCI EAFE Index | 23.25% | 6.46% | 5.49% |
Visit www.401k.com for more recent performance information. |
The Fund's past performance is not a good predictor of the Fund's future performance. The graph and table do not reflect the deduction of taxes that a shareholder would pay on fund distributions or redemption of fund shares. |
Key Fund Statistics(as of October 31, 2024)
KEY FACTS | | |
| Fund Size | $6,293,832,474 | |
| Number of Holdings | 93 | |
| Total Advisory Fee | $53,545,452 | |
| Portfolio Turnover | 35% | |
What did the Fund invest in?
(as of October 31, 2024)
MARKET SECTORS (% of Fund's net assets) | | |
| Industrials | 25.5 | |
| Financials | 22.8 | |
| Information Technology | 16.2 | |
| Health Care | 13.4 | |
| Materials | 9.4 | |
| Consumer Discretionary | 7.1 | |
| Consumer Staples | 2.3 | |
| Communication Services | 0.5 | |
| |
| Common Stocks | 97.2 |
| Short-Term Investments and Net Other Assets (Liabilities) | 2.8 |
ASSET ALLOCATION (% of Fund's net assets) |
|
|
| United States | 18.4 |
| United Kingdom | 17.9 |
| Japan | 16.1 |
| France | 11.2 |
| Germany | 9.0 |
| Netherlands | 5.9 |
| Denmark | 4.4 |
| Switzerland | 3.4 |
| Italy | 3.1 |
| Others | 10.6 |
GEOGRAPHIC DIVERSIFICATION (% of Fund's net assets) |
|
| |
|
TOP HOLDINGS(% of Fund's net assets) | | |
| Novo Nordisk A/S Series B | 3.0 | |
| SAP SE | 3.0 | |
| ASML Holding NV | 3.0 | |
| Hitachi Ltd | 2.3 | |
| RELX PLC | 2.2 | |
| Astrazeneca PLC | 2.2 | |
| Safran SA | 2.1 | |
| Compass Group PLC | 2.1 | |
| Wolters Kluwer NV | 2.0 | |
| London Stock Exchange Group PLC | 1.9 | |
| | 23.8 | |
How has the Fund changed?
This is a summary of certain changes to the Fund since November 1, 2023. For more complete information, you may review the Fund's next prospectus, which we expect to be available by December 30, 2024 at fundresearch.fidelity.com/prospectus/sec or upon request at 1-800-835-5092 or by sending an e-mail to fidfunddocuments@fidelity.com.
The fund's transfer agent and pricing & bookkeeping fees were changed to a fixed rate effective December 1, 2023, through February 29, 2024, in anticipation of the transition to a new management fee structure. Effective March 1, 2024, the fund's management contract was amended to incorporate administrative services previously covered under separate services agreements (transfer agent and pricing & bookkeeping). The amended contract incorporates a basic fee rate that may vary by class (subject to a performance adjustment). The Adviser or an affiliate pays certain expenses of managing and operating the fund out of each class's management fee. | The fund's sub-advisory agreement with FIL Investments (Japan) Limited was not renewed.
|
| Fidelity, the Fidelity Investments Logo and all other Fidelity trademarks or service marks used herein are trademarks or service marks of FMR LLC. Any third-party marks that are used herein are trademarks or service marks of their respective owners. © 2024 FMR LLC. All rights reserved. |
| | For additional information about the Fund; including its prospectus, financial information, holdings and proxy information, scan the QR code or visit fundresearch.fidelity.com/prospectus/sec 1.9913805.100 2099-TSRA-1224 |
| |
| | ANNUAL SHAREHOLDER REPORT | AS OF OCTOBER 31, 2024 | This report describes changes to the Fund that occurred during the reporting period. |
| | Fidelity® Diversified International Fund Fidelity® Diversified International Fund Class K : FDIKX |
| | | |
This annual shareholder report contains information about Fidelity® Diversified International Fund for the period November 1, 2023 to October 31, 2024. You can find additional information about the Fund at fundresearch.fidelity.com/prospectus/sec. You can also request this information by contacting us at 1-800-835-5092 or by sending an e-mail to fidfunddocuments@fidelity.com.
What were your Fund costs for the last year?(based on hypothetical $10,000 investment)
FUND COST (PREVIOUS YEAR)
| | Costs of a $10,000 investment | Costs paid as a percentage of a $10,000 investment | |
| Class K | $ 56 | 0.50% | |
What affected the Fund's performance this period?
•International stocks achieved a strong gain for the 12 months ending October 31, 2024. Resilient global economic growth and a slowing in the pace of inflation in certain regions, as well as a shift to global monetary easing, contributed to a favorable backdrop, despite persistent geopolitical risk.
•Against this backdrop, stock picks in Japan and a non-benchmark allocation to emerging markets contributed to the fund's performance versus the MSCI EAFE Index (Net MA) for the fiscal year.
•By sector, the biggest contributors to performance versus the benchmark were picks and an overweight in industrials, primarily within the capital goods industry. Picks in materials also boosted relative performance. Also helping our relative result was an underweight in consumer staples.
•The top individual relative contributor was our non-benchmark stake in Taiwan Semiconductor Manufacturing (+124%). The stock was among our biggest holdings. A second notable relative contributor was an overweight in Hitachi (+109%). Although we trimmed our stake, the company was the fund's largest holding at period end. Another notable relative contributor was an overweight in Mitsubishi Heavy Industries (+127%). This was a stake we established this period.
•In contrast, from a regional standpoint, a non-benchmark allocation to both the United States and Canada detracted from the fund's relative result.
•By sector, the biggest detractor from performance versus the benchmark was stock picking in financials. Stock picks in consumer staples also hampered the fund's result. Also detracting from our result was an overweight in energy. Lastly, the fund's position in cash detracted.
•The fund's non-benchmark stake in Schlumberger returned -20% and was the largest individual relative detractor. The stock was not held at period end. A non-benchmark stake in HDFC Bank gained 18% and was a second notable relative detractor. We reduced the position. Our stake in Pernod-Ricard (-27%) also detracted. This period we decreased our position in Pernod-Ricard.
•Notable changes in positioning include increased exposure to Germany and Switzerland. By sector, meaningful changes in positioning include decreased exposure to consumer staples and a higher allocation to industrials.
How did the Fund perform over the past 10 years?
CUMULATIVE PERFORMANCE
October 31, 2014 through October 31, 2024.
Initial investment of $10,000.
Class K | $10,000 | $10,340 | $9,971 | $12,219 | $11,126 | $12,922 | $14,113 | $18,306 | $12,941 | $14,532 | $18,161 |
MSCI EAFE Index | $10,000 | $10,008 | $9,705 | $12,004 | $11,206 | $12,472 | $11,638 | $15,647 | $12,073 | $13,841 | $17,059 |
| | 2014 | 2015 | 2016 | 2017 | 2018 | 2019 | 2020 | 2021 | 2022 | 2023 | 2024 |
AVERAGE ANNUAL TOTAL RETURNS:| | 1 Year | 5 Year | 10 Year |
| Class K | 24.97% | 7.04% | 6.15% |
| MSCI EAFE Index | 23.25% | 6.46% | 5.49% |
Visit www.401k.com for more recent performance information. |
The Fund's past performance is not a good predictor of the Fund's future performance. The graph and table do not reflect the deduction of taxes that a shareholder would pay on fund distributions or redemption of fund shares. |
Key Fund Statistics(as of October 31, 2024)
KEY FACTS | | |
| Fund Size | $11,018,162,405 | |
| Number of Holdings | 134 | |
| Total Advisory Fee | $55,332,153 | |
| Portfolio Turnover | 35% | |
What did the Fund invest in?
(as of October 31, 2024)
MARKET SECTORS (% of Fund's net assets) | | |
| Industrials | 24.2 | |
| Financials | 22.5 | |
| Information Technology | 15.6 | |
| Health Care | 10.3 | |
| Materials | 8.3 | |
| Consumer Discretionary | 7.2 | |
| Energy | 4.9 | |
| Consumer Staples | 1.8 | |
| Communication Services | 0.5 | |
| Real Estate | 0.2 | |
| |
| Common Stocks | 95.0 |
| Preferred Stocks | 0.5 |
| Short-Term Investments and Net Other Assets (Liabilities) | 4.5 |
ASSET ALLOCATION (% of Fund's net assets) |
|
|
| United States | 17.0 |
| Japan | 17.0 |
| United Kingdom | 14.3 |
| Germany | 8.6 |
| France | 8.0 |
| Canada | 6.4 |
| Netherlands | 5.2 |
| Denmark | 3.4 |
| Sweden | 2.9 |
| Others | 17.2 |
GEOGRAPHIC DIVERSIFICATION (% of Fund's net assets) |
|
| |
|
TOP HOLDINGS(% of Fund's net assets) | | |
| Hitachi Ltd | 2.8 | |
| ASML Holding NV depository receipt | 2.7 | |
| Novo Nordisk A/S Series B | 2.5 | |
| Taiwan Semiconductor Manufacturing Co Ltd ADR | 2.4 | |
| SAP SE | 2.4 | |
| Astrazeneca PLC | 1.8 | |
| RELX PLC (Netherlands) | 1.8 | |
| Wolters Kluwer NV | 1.6 | |
| London Stock Exchange Group PLC | 1.6 | |
| Shell PLC | 1.5 | |
| | 21.1 | |
How has the Fund changed?
This is a summary of certain changes to the Fund since November 1, 2023. For more complete information, you may review the Fund's next prospectus, which we expect to be available by December 30, 2024 at fundresearch.fidelity.com/prospectus/sec or upon request at 1-800-835-5092 or by sending an e-mail to fidfunddocuments@fidelity.com.
The fees associated with this class changed during the reporting year.The variations in class fees are primarily the result of the following changes: - Management fee
- Performance adjustment fee
The fund's transfer agent and pricing & bookkeeping fees were changed to a fixed rate effective December 1, 2023, through February 29, 2024, in anticipation of the transition to a new management fee structure. Effective March 1, 2024, the fund's management contract was amended to incorporate administrative services previously covered under separate services agreements (transfer agent and pricing & bookkeeping). The amended contract incorporates a basic fee rate that may vary by class (subject to a performance adjustment). The Adviser or an affiliate pays certain expenses of managing and operating the fund out of each class's management fee. | The fund's sub-advisory agreement with FIL Investments (Japan) Limited was not renewed.
|
| Fidelity, the Fidelity Investments Logo and all other Fidelity trademarks or service marks used herein are trademarks or service marks of FMR LLC. Any third-party marks that are used herein are trademarks or service marks of their respective owners. © 2024 FMR LLC. All rights reserved. |
| | For additional information about the Fund; including its prospectus, financial information, holdings and proxy information, scan the QR code or visit fundresearch.fidelity.com/prospectus/sec 1.9913865.100 2082-TSRA-1224 |
| |
| | ANNUAL SHAREHOLDER REPORT | AS OF OCTOBER 31, 2024 | This report describes changes to the Fund that occurred during the reporting period. |
| | Fidelity® Canada Fund Fidelity Advisor® Canada Fund Class C : FCCNX |
| | | |
This annual shareholder report contains information about Fidelity® Canada Fund for the period November 1, 2023 to October 31, 2024. You can find additional information about the Fund at fundresearch.fidelity.com/prospectus/sec. You can also request this information by contacting us at 1-877-208-0098 or by sending an e-mail to fidfunddocuments@fidelity.com.
What were your Fund costs for the last year?(based on hypothetical $10,000 investment)
FUND COST (PREVIOUS YEAR)
| | Costs of a $10,000 investment | Costs paid as a percentage of a $10,000 investment | |
| Class C | $ 235 | 2.09% | |
What affected the Fund's performance this period?
•International stocks achieved a strong gain for the 12 months ending October 31, 2024. Resilient global economic growth and a slowing in the pace of inflation in certain regions, as well as a shift to global monetary easing, contributed to a favorable backdrop, despite persistent geopolitical risk.
•Against this backdrop, stock picking in Canada's materials sector, and stock selection and an underweight in financials, primarily within the banking industry, detracted most from the fund's performance versus the S&P/TSX Composite Index for the fiscal year.
•The largest individual relative detractor was an overweight in Alimentation Couche-Tard (-3%). The stock was among the fund's largest holdings. Not owning Canadian Imperial Bank of Commerce, a benchmark component that gained 87%, was the second-largest relative detractor. An overweight in Canadian Pacific Kansas City Limited (+9%) - another of the fund's largest holdings - also hurt.
•By sector, the biggest contributors to performance versus the benchmark were picks and an overweight in information technology, primarily within the software & services industry. Stock choices in consumer discretionary and communication services also boosted the fund's relative performance.
•The top individual relative contributor this period was avoiding BCE, a benchmark component that returned about -6%. Not owning Cenovus Energy, a benchmark component that returned -13%, was the second-largest relative contributor. An overweight in Brookfield Asset Management (+91%) also helped.
•By sector, meaningful changes in positioning include increased exposure to information technology.
How did the Fund perform over the past 10 years?
CUMULATIVE PERFORMANCE
October 31, 2014 through October 31, 2024.
Initial investment of $10,000.
Class C | $10,000 | $8,504 | $9,071 | $10,264 | $9,561 | $10,568 | $9,681 | $14,358 | $13,240 | $13,356 | $16,844 |
S&P/TSX Composite Index | $10,000 | $8,219 | $9,044 | $10,482 | $9,938 | $11,246 | $10,831 | $16,167 | $13,973 | $13,788 | $18,134 |
| | 2014 | 2015 | 2016 | 2017 | 2018 | 2019 | 2020 | 2021 | 2022 | 2023 | 2024 |
AVERAGE ANNUAL TOTAL RETURNS:| | 1 Year | 5 Year | 10 Year |
| Class C (incl. contingent deferred sales charge) | 24.19% | 9.44% | 5.35% |
| Class C | 25.19% | 9.44% | 5.35% |
| S&P/TSX Composite Index | 31.52% | 10.03% | 6.13% |
Visit institutional.fidelity.com for more recent performance information. |
The Fund's past performance is not a good predictor of the Fund's future performance. The graph and table do not reflect the deduction of taxes that a shareholder would pay on fund distributions or redemption of fund shares. |
Key Fund Statistics(as of October 31, 2024)
KEY FACTS | | |
| Fund Size | $942,476,918 | |
| Number of Holdings | 63 | |
| Total Advisory Fee | $8,782,874 | |
| Portfolio Turnover | 8% | |
What did the Fund invest in?
(as of October 31, 2024)
MARKET SECTORS (% of Fund's net assets) | | |
| Financials | 27.5 | |
| Energy | 17.5 | |
| Industrials | 13.0 | |
| Information Technology | 11.1 | |
| Materials | 11.1 | |
| Consumer Staples | 8.6 | |
| Consumer Discretionary | 7.0 | |
| Communication Services | 2.8 | |
| Health Care | 0.7 | |
| |
| Common Stocks | 99.3 |
| Bonds | 0.2 |
| Preferred Stocks | 0.0 |
| Short-Term Investments and Net Other Assets (Liabilities) | 0.5 |
ASSET ALLOCATION (% of Fund's net assets) |
|
|
| Canada | 94.0 |
| United States | 2.7 |
| Brazil | 2.6 |
| Chile | 0.7 |
GEOGRAPHIC DIVERSIFICATION (% of Fund's net assets) |
|
| |
|
TOP HOLDINGS(% of Fund's net assets) | | |
| Royal Bank of Canada | 8.6 | |
| Canadian Pacific Kansas City Ltd | 5.7 | |
| Constellation Software Inc/Canada | 5.6 | |
| Alimentation Couche-Tard Inc | 4.9 | |
| Canadian Natural Resources Ltd | 4.8 | |
| PrairieSky Royalty Ltd | 4.0 | |
| Franco-Nevada Corp | 3.8 | |
| Suncor Energy Inc | 3.5 | |
| Dollarama Inc | 3.5 | |
| Shopify Inc Class A | 3.4 | |
| | 47.8 | |
How has the Fund changed?
This is a summary of certain changes to the Fund since November 1, 2023. For more complete information, you may review the Fund's next prospectus, which we expect to be available by December 30, 2024 at fundresearch.fidelity.com/prospectus/sec or upon request at 1-877-208-0098 or by sending an e-mail to fidfunddocuments@fidelity.com.
The fund's transfer agent and pricing & bookkeeping fees were changed to a fixed rate effective December 1, 2023, through February 29, 2024, in anticipation of the transition to a new management fee structure. Effective March 1, 2024, the fund's management contract was amended to incorporate administrative services previously covered under separate services agreements (transfer agent and pricing & bookkeeping). The amended contract incorporates a basic fee rate that may vary by class (subject to a performance adjustment). The Adviser or an affiliate pays certain expenses of managing and operating the fund out of each class's management fee. | |
| Fidelity, the Fidelity Investments Logo and all other Fidelity trademarks or service marks used herein are trademarks or service marks of FMR LLC. Any third-party marks that are used herein are trademarks or service marks of their respective owners. © 2024 FMR LLC. All rights reserved. |
| | For additional information about the Fund; including its prospectus, financial information, holdings and proxy information, scan the QR code or visit fundresearch.fidelity.com/prospectus/sec 1.9913845.100 1858-TSRA-1224 |
| |
| | ANNUAL SHAREHOLDER REPORT | AS OF OCTOBER 31, 2024 | This report describes changes to the Fund that occurred during the reporting period. |
| | Fidelity® International Growth Fund Fidelity Advisor® International Growth Fund Class I : FIIIX |
| | | |
This annual shareholder report contains information about Fidelity® International Growth Fund for the period November 1, 2023 to October 31, 2024. You can find additional information about the Fund at fundresearch.fidelity.com/prospectus/sec. You can also request this information by contacting us at 1-877-208-0098 or by sending an e-mail to fidfunddocuments@fidelity.com.
What were your Fund costs for the last year?(based on hypothetical $10,000 investment)
FUND COST (PREVIOUS YEAR)
| | Costs of a $10,000 investment | Costs paid as a percentage of a $10,000 investment | |
| Class I | $ 104 | 0.92% | |
What affected the Fund's performance this period?
•International stocks achieved a strong gain for the 12 months ending October 31, 2024. Resilient global economic growth and a slowing in the pace of inflation in certain regions, as well as a shift to global monetary easing, contributed to a favorable backdrop, despite persistent geopolitical risk.
•Against this backdrop, stock picks and an overweight in the United States and security selection in the U.K. contributed to the fund's performance versus the MSCI EAFE Growth Index (Net MA) for the fiscal year.
•By sector, an underweight in consumer staples was the primary contributor. Stock selection in materials also boosted the fund's relative performance. Also helping our relative result was an overweight in industrials, primarily within the capital goods industry.
•The fund's non-benchmark stake in Taiwan Semiconductor gained 99% and was the top individual relative contributor. The stock was among our largest holdings. A second notable relative contributor was an overweight in CRH (+83%). The stock was among the fund's biggest holdings. Another notable relative contributor was our non-benchmark stake in GE Vernova (+100%). This was a position we established this period.
•In contrast, from a regional standpoint, an underweight in Asia Pacific ex Japan and a non-benchmark allocation to Canada detracted from the fund's relative result.
•By sector, the biggest detractor from performance versus the benchmark was stock picking in financials. Also hurting our result was security selection in industrials, primarily within the capital goods industry, and energy. Lastly, the fund's position in cash detracted.
•The biggest individual relative detractor was an overweight in Edenred (-38%). Not owning Schneider Electric, a benchmark component that gained approximately 71%, was the second-largest relative detractor. Not owning Commonwealth Bank of Australia, a benchmark component that gained roughly 59%, was another notable relative detractor.
•Notable changes in positioning include increased exposure to Germany and the United Kingdom. By sector, meaningful changes in positioning include decreased exposure to consumer staples and health care.
How did the Fund perform over the past 10 years?
CUMULATIVE PERFORMANCE
October 31, 2014 through October 31, 2024.
Initial investment of $10,000.
Class I | $10,000 | $10,341 | $10,044 | $12,478 | $11,750 | $14,293 | $15,423 | $20,259 | $14,631 | $16,182 | $20,282 |
MSCI EAFE Growth Index | $10,000 | $10,428 | $10,108 | $12,517 | $11,783 | $13,766 | $14,502 | $18,876 | $13,312 | $14,769 | $18,234 |
MSCI EAFE Index | $10,000 | $10,008 | $9,705 | $12,004 | $11,206 | $12,472 | $11,638 | $15,647 | $12,073 | $13,841 | $17,059 |
| | 2014 | 2015 | 2016 | 2017 | 2018 | 2019 | 2020 | 2021 | 2022 | 2023 | 2024 |
AVERAGE ANNUAL TOTAL RETURNS:| | 1 Year | 5 Year | 10 Year |
| Class I | 25.34% | 7.25% | 7.33% |
| MSCI EAFE Growth Index | 23.46% | 5.78% | 6.19% |
| MSCI EAFE Index | 23.25% | 6.46% | 5.49% |
Visit institutional.fidelity.com for more recent performance information. |
The Fund's past performance is not a good predictor of the Fund's future performance. The graph and table do not reflect the deduction of taxes that a shareholder would pay on fund distributions or redemption of fund shares. |
Key Fund Statistics(as of October 31, 2024)
KEY FACTS | | |
| Fund Size | $6,046,615,302 | |
| Number of Holdings | 73 | |
| Total Advisory Fee | $43,926,728 | |
| Portfolio Turnover | 31% | |
What did the Fund invest in?
(as of October 31, 2024)
MARKET SECTORS (% of Fund's net assets) | | |
| Industrials | 31.9 | |
| Information Technology | 19.7 | |
| Financials | 16.0 | |
| Materials | 10.7 | |
| Consumer Discretionary | 10.3 | |
| Health Care | 6.1 | |
| Consumer Staples | 1.1 | |
| Energy | 0.7 | |
| Communication Services | 0.5 | |
| |
| Common Stocks | 96.7 |
| Preferred Stocks | 0.3 |
| Short-Term Investments and Net Other Assets (Liabilities) | 3.0 |
ASSET ALLOCATION (% of Fund's net assets) |
|
|
| United States | 29.1 |
| United Kingdom | 11.7 |
| France | 11.2 |
| Japan | 9.6 |
| Sweden | 7.5 |
| Germany | 6.6 |
| Netherlands | 6.1 |
| Denmark | 5.1 |
| Taiwan | 3.3 |
| Others | 9.8 |
GEOGRAPHIC DIVERSIFICATION (% of Fund's net assets) |
|
| |
|
TOP HOLDINGS(% of Fund's net assets) | | |
| SAP SE | 5.3 | |
| Novo Nordisk A/S Series B | 5.1 | |
| ASML Holding NV | 4.8 | |
| Safran SA | 4.0 | |
| CRH PLC | 3.9 | |
| Linde PLC | 3.8 | |
| Atlas Copco AB A Shares | 3.4 | |
| Taiwan Semiconductor Manufacturing Co Ltd | 3.3 | |
| Recruit Holdings Co Ltd | 3.0 | |
| LVMH Moet Hennessy Louis Vuitton SE | 2.7 | |
| | 39.3 | |
How has the Fund changed?
This is a summary of certain changes to the Fund since November 1, 2023. For more complete information, you may review the Fund's next prospectus, which we expect to be available by December 30, 2024 at fundresearch.fidelity.com/prospectus/sec or upon request at 1-877-208-0098 or by sending an e-mail to fidfunddocuments@fidelity.com.
The fund's transfer agent and pricing & bookkeeping fees were changed to a fixed rate effective December 1, 2023, through February 29, 2024, in anticipation of the transition to a new management fee structure. Effective March 1, 2024, the fund's management contract was amended to incorporate administrative services previously covered under separate services agreements (transfer agent and pricing & bookkeeping). The amended contract incorporates a basic fee rate that may vary by class (subject to a performance adjustment). The Adviser or an affiliate pays certain expenses of managing and operating the fund out of each class's management fee. | The fund's sub-advisory agreement with FIL Investments (Japan) Limited was not renewed.
|
| Fidelity, the Fidelity Investments Logo and all other Fidelity trademarks or service marks used herein are trademarks or service marks of FMR LLC. Any third-party marks that are used herein are trademarks or service marks of their respective owners. © 2024 FMR LLC. All rights reserved. |
| | For additional information about the Fund; including its prospectus, financial information, holdings and proxy information, scan the QR code or visit fundresearch.fidelity.com/prospectus/sec 1.9913952.100 1989-TSRA-1224 |
| |
| | ANNUAL SHAREHOLDER REPORT | AS OF OCTOBER 31, 2024 | This report describes changes to the Fund that occurred during the reporting period. |
| | Fidelity® Global Equity Income Fund Fidelity® Global Equity Income Fund : FGILX |
| | | |
This annual shareholder report contains information about Fidelity® Global Equity Income Fund for the period November 1, 2023 to October 31, 2024. You can find additional information about the Fund at fundresearch.fidelity.com/prospectus/sec. You can also request this information by contacting us at 1-800-544-8544 or by sending an e-mail to fidfunddocuments@fidelity.com.
What were your Fund costs for the last year?(based on hypothetical $10,000 investment)
FUND COST (PREVIOUS YEAR)
| | Costs of a $10,000 investment | Costs paid as a percentage of a $10,000 investment | |
| Fidelity® Global Equity Income Fund | $ 105 | 0.92% | |
What affected the Fund's performance this period?
•Global equities posted a strong advance for the 12 months ending October 31, 2024. Resilient economic growth and a slowing in the pace of inflation in certain regions, as well as a shift to global monetary easing, contributed to a favorable backdrop, despite persistent geopolitical risk.
•Against this backdrop, stock picking in the United States and picks and an overweight in the U.K. detracted from the fund's performance versus the MSCI All Country World Index (Net MA) for the fiscal year.
•By sector, the biggest detractor from performance versus the benchmark was stock selection in information technology. Also hurting our result was stock selection in consumer discretionary and communication services, primarily within the media & entertainment industry. Lastly, the fund's position in cash detracted.
•The biggest individual relative detractor this period was avoiding Nvidia, a benchmark component that gained about 226%. Not owning Meta Platforms, a benchmark component that gained 89%, was the second-largest relative detractor. An overweight in Dollar Tree (-41%) also hurt.
•In contrast, from a regional standpoint, an underweight in emerging markets and picks in Europe ex U.K., primarily in Germany, contributed to the fund's relative result.
•By sector, the biggest contributor to performance versus the benchmark was security selection in industrials, primarily within the capital goods industry. Stock picks in utilities and health care, primarily within the pharmaceuticals, biotechnology & life sciences industry, also boosted the fund's relative result.
•The top individual relative contributor was an overweight in Vistra (+290%). The second-largest relative contributor was an overweight in Taiwan Semiconductor (+97%), which was among the largest holdings. Another notable relative contributor was an overweight in Rheinmetall (+82%), also among the biggest holdings.
•Notable changes in positioning include a lower allocation to France. By sector, meaningful changes in positioning include increased exposure to industrials and a lower allocation to consumer staples.
How did the Fund perform over the past 10 years?
CUMULATIVE PERFORMANCE
October 31, 2014 through October 31, 2024.
Initial investment of $10,000.
Fidelity® Global Equity Income Fund | $10,000 | $10,293 | $10,512 | $12,542 | $12,307 | $14,103 | $14,730 | $19,898 | $17,620 | $18,564 | $23,609 |
MSCI ACWI (All Country World Index) Index | $10,000 | $10,035 | $10,284 | $12,721 | $12,703 | $14,362 | $15,121 | $20,822 | $16,723 | $18,547 | $24,710 |
| | 2014 | 2015 | 2016 | 2017 | 2018 | 2019 | 2020 | 2021 | 2022 | 2023 | 2024 |
AVERAGE ANNUAL TOTAL RETURNS:| | 1 Year | 5 Year | 10 Year |
| Fidelity® Global Equity Income Fund | 27.18% | 10.85% | 8.97% |
| MSCI ACWI (All Country World Index) Index | 33.23% | 11.46% | 9.47% |
Visit www.fidelity.com for more recent performance information. |
The Fund's past performance is not a good predictor of the Fund's future performance. The graph and table do not reflect the deduction of taxes that a shareholder would pay on fund distributions or redemption of fund shares. |
Key Fund Statistics(as of October 31, 2024)
KEY FACTS | | |
| Fund Size | $257,697,453 | |
| Number of Holdings | 153 | |
| Total Advisory Fee | $1,240,182 | |
| Portfolio Turnover | 29% | |
What did the Fund invest in?
(as of October 31, 2024)
MARKET SECTORS (% of Fund's net assets) | | |
| Information Technology | 20.5 | |
| Financials | 13.5 | |
| Industrials | 12.1 | |
| Health Care | 11.8 | |
| Consumer Discretionary | 9.4 | |
| Consumer Staples | 8.8 | |
| Communication Services | 6.2 | |
| Energy | 4.8 | |
| Utilities | 4.6 | |
| Materials | 4.3 | |
| Real Estate | 1.1 | |
| |
| Common Stocks | 97.1 |
| Short-Term Investments and Net Other Assets (Liabilities) | 2.9 |
ASSET ALLOCATION (% of Fund's net assets) |
|
|
| United States | 63.6 |
| United Kingdom | 7.4 |
| Japan | 5.5 |
| Canada | 5.2 |
| Germany | 3.8 |
| Taiwan | 2.7 |
| France | 2.6 |
| China | 2.0 |
| Italy | 1.2 |
| Others | 6.0 |
GEOGRAPHIC DIVERSIFICATION (% of Fund's net assets) |
|
| |
|
TOP HOLDINGS(% of Fund's net assets) | | |
| Apple Inc | 5.4 | |
| Microsoft Corp | 4.6 | |
| Taiwan Semiconductor Manufacturing Co Ltd | 2.7 | |
| Rheinmetall AG | 2.2 | |
| NXP Semiconductors NV | 2.0 | |
| JPMorgan Chase & Co | 1.7 | |
| Linde PLC | 1.5 | |
| Eli Lilly & Co | 1.4 | |
| UnitedHealth Group Inc | 1.4 | |
| AbbVie Inc | 1.4 | |
| | 24.3 | |
How has the Fund changed?
This is a summary of certain changes to the Fund since November 1, 2023. For more complete information, you may review the Fund's next prospectus, which we expect to be available by December 30, 2024 at fundresearch.fidelity.com/prospectus/sec or upon request at 1-800-544-8544 or by sending an e-mail to fidfunddocuments@fidelity.com.
The fees associated with this class changed during the reporting year.The variations in class fees are primarily the result of the following changes: - Management fee
- Operating expenses
The fund's transfer agent and pricing & bookkeeping fees were changed to a fixed rate effective December 1, 2023, through February 29, 2024, in anticipation of the transition to a new management fee structure. Effective March 1, 2024, the fund's management contract was amended to incorporate administrative services previously covered under separate services agreements (transfer agent and pricing & bookkeeping). The amended contract incorporates a management fee rate that may vary by class. The Adviser or an affiliate pays certain expenses of managing and operating the fund out of each class's management fee. | Fidelity Advisor® Global Equity Income Fund merged into Fidelity® Global Equity Income Fund on October 25, 2024.
|
The fund changed its investment objective from non-fundamental to fundamental effective July 26, 2024. | The fund's sub-advisory agreement with FIL Investments (Japan) Limited was not renewed.
|
| Fidelity, the Fidelity Investments Logo and all other Fidelity trademarks or service marks used herein are trademarks or service marks of FMR LLC. Any third-party marks that are used herein are trademarks or service marks of their respective owners. © 2024 FMR LLC. All rights reserved. |
| | For additional information about the Fund; including its prospectus, financial information, holdings and proxy information, scan the QR code or visit fundresearch.fidelity.com/prospectus/sec 1.9913979.100 2406-TSRA-1224 |
| |
| | ANNUAL SHAREHOLDER REPORT | AS OF OCTOBER 31, 2024 | This report describes changes to the Fund that occurred during the reporting period. |
| | Fidelity® Canada Fund Fidelity Advisor® Canada Fund Class M : FTCNX |
| | | |
This annual shareholder report contains information about Fidelity® Canada Fund for the period November 1, 2023 to October 31, 2024. You can find additional information about the Fund at fundresearch.fidelity.com/prospectus/sec. You can also request this information by contacting us at 1-877-208-0098 or by sending an e-mail to fidfunddocuments@fidelity.com.
What were your Fund costs for the last year?(based on hypothetical $10,000 investment)
FUND COST (PREVIOUS YEAR)
| | Costs of a $10,000 investment | Costs paid as a percentage of a $10,000 investment | |
| Class M | $ 179 | 1.58% | |
What affected the Fund's performance this period?
•International stocks achieved a strong gain for the 12 months ending October 31, 2024. Resilient global economic growth and a slowing in the pace of inflation in certain regions, as well as a shift to global monetary easing, contributed to a favorable backdrop, despite persistent geopolitical risk.
•Against this backdrop, stock picking in Canada's materials sector, and stock selection and an underweight in financials, primarily within the banking industry, detracted most from the fund's performance versus the S&P/TSX Composite Index for the fiscal year.
•The largest individual relative detractor was an overweight in Alimentation Couche-Tard (-3%). The stock was among the fund's largest holdings. Not owning Canadian Imperial Bank of Commerce, a benchmark component that gained 87%, was the second-largest relative detractor. An overweight in Canadian Pacific Kansas City Limited (+9%) - another of the fund's largest holdings - also hurt.
•By sector, the biggest contributors to performance versus the benchmark were picks and an overweight in information technology, primarily within the software & services industry. Stock choices in consumer discretionary and communication services also boosted the fund's relative performance.
•The top individual relative contributor this period was avoiding BCE, a benchmark component that returned about -6%. Not owning Cenovus Energy, a benchmark component that returned -13%, was the second-largest relative contributor. An overweight in Brookfield Asset Management (+91%) also helped.
•By sector, meaningful changes in positioning include increased exposure to information technology.
How did the Fund perform over the past 10 years?
CUMULATIVE PERFORMANCE
October 31, 2014 through October 31, 2024.
Initial investment of $10,000 and the current sales charge was paid.
Class M | $9,650 | $8,243 | $8,832 | $10,036 | $9,388 | $10,422 | $9,593 | $14,298 | $13,251 | $13,333 | $16,773 |
S&P/TSX Composite Index | $10,000 | $8,219 | $9,044 | $10,482 | $9,938 | $11,246 | $10,831 | $16,167 | $13,973 | $13,788 | $18,134 |
| | 2014 | 2015 | 2016 | 2017 | 2018 | 2019 | 2020 | 2021 | 2022 | 2023 | 2024 |
AVERAGE ANNUAL TOTAL RETURNS:| | 1 Year | 5 Year | 10 Year |
| Class M (incl. 3.50% sales charge) | 21.39% | 9.20% | 5.31% |
| Class M (without 3.50% sales charge) | 25.80% | 9.98% | 5.68% |
| S&P/TSX Composite Index | 31.52% | 10.03% | 6.13% |
Visit institutional.fidelity.com for more recent performance information. |
The Fund's past performance is not a good predictor of the Fund's future performance. The graph and table do not reflect the deduction of taxes that a shareholder would pay on fund distributions or redemption of fund shares. |
Key Fund Statistics(as of October 31, 2024)
KEY FACTS | | |
| Fund Size | $942,476,918 | |
| Number of Holdings | 63 | |
| Total Advisory Fee | $8,782,874 | |
| Portfolio Turnover | 8% | |
What did the Fund invest in?
(as of October 31, 2024)
MARKET SECTORS (% of Fund's net assets) | | |
| Financials | 27.5 | |
| Energy | 17.5 | |
| Industrials | 13.0 | |
| Information Technology | 11.1 | |
| Materials | 11.1 | |
| Consumer Staples | 8.6 | |
| Consumer Discretionary | 7.0 | |
| Communication Services | 2.8 | |
| Health Care | 0.7 | |
| |
| Common Stocks | 99.3 |
| Bonds | 0.2 |
| Preferred Stocks | 0.0 |
| Short-Term Investments and Net Other Assets (Liabilities) | 0.5 |
ASSET ALLOCATION (% of Fund's net assets) |
|
|
| Canada | 94.0 |
| United States | 2.7 |
| Brazil | 2.6 |
| Chile | 0.7 |
GEOGRAPHIC DIVERSIFICATION (% of Fund's net assets) |
|
| |
|
TOP HOLDINGS(% of Fund's net assets) | | |
| Royal Bank of Canada | 8.6 | |
| Canadian Pacific Kansas City Ltd | 5.7 | |
| Constellation Software Inc/Canada | 5.6 | |
| Alimentation Couche-Tard Inc | 4.9 | |
| Canadian Natural Resources Ltd | 4.8 | |
| PrairieSky Royalty Ltd | 4.0 | |
| Franco-Nevada Corp | 3.8 | |
| Suncor Energy Inc | 3.5 | |
| Dollarama Inc | 3.5 | |
| Shopify Inc Class A | 3.4 | |
| | 47.8 | |
How has the Fund changed?
This is a summary of certain changes to the Fund since November 1, 2023. For more complete information, you may review the Fund's next prospectus, which we expect to be available by December 30, 2024 at fundresearch.fidelity.com/prospectus/sec or upon request at 1-877-208-0098 or by sending an e-mail to fidfunddocuments@fidelity.com.
The fund's transfer agent and pricing & bookkeeping fees were changed to a fixed rate effective December 1, 2023, through February 29, 2024, in anticipation of the transition to a new management fee structure. Effective March 1, 2024, the fund's management contract was amended to incorporate administrative services previously covered under separate services agreements (transfer agent and pricing & bookkeeping). The amended contract incorporates a basic fee rate that may vary by class (subject to a performance adjustment). The Adviser or an affiliate pays certain expenses of managing and operating the fund out of each class's management fee. | |
| Fidelity, the Fidelity Investments Logo and all other Fidelity trademarks or service marks used herein are trademarks or service marks of FMR LLC. Any third-party marks that are used herein are trademarks or service marks of their respective owners. © 2024 FMR LLC. All rights reserved. |
| | For additional information about the Fund; including its prospectus, financial information, holdings and proxy information, scan the QR code or visit fundresearch.fidelity.com/prospectus/sec 1.9913846.100 1859-TSRA-1224 |
| |
| | ANNUAL SHAREHOLDER REPORT | AS OF OCTOBER 31, 2024 | This report describes changes to the Fund that occurred during the reporting period. |
| | Fidelity® International Small Cap Fund Fidelity® International Small Cap Fund : FISMX |
| | | |
This annual shareholder report contains information about Fidelity® International Small Cap Fund for the period November 1, 2023 to October 31, 2024. You can find additional information about the Fund at fundresearch.fidelity.com/prospectus/sec. You can also request this information by contacting us at 1-800-544-8544 or by sending an e-mail to fidfunddocuments@fidelity.com.
What were your Fund costs for the last year?(based on hypothetical $10,000 investment)
FUND COST (PREVIOUS YEAR)
| | Costs of a $10,000 investment | Costs paid as a percentage of a $10,000 investment | |
| Fidelity® International Small Cap Fund | $ 114 | 1.04% | |
What affected the Fund's performance this period?
•International stocks achieved a strong gain for the 12 months ending October 31, 2024. Resilient global economic growth and a slowing in the pace of inflation in certain regions, as well as a shift to global monetary easing, contributed to a favorable backdrop, despite persistent geopolitical risk.
•Against this backdrop, an underweight in emerging markets, primarily in India, and picks in the U.K. and Brazil detracted from the fund's performance versus the Fidelity International Small Cap Fund Linked Index for the fiscal year.
•By sector, security selection in financials was the largest detractor. However, picks in industrials, health care and consumer discretionary also meaningfully weighed on the fund's relative result.
•The largest individual relative detractor was our non-benchmark stake in Hypera Pharma (-35%). A non-benchmark stake in Mayr-Melnhof Karton returned roughly -24% and was the second-largest relative detractor. An overweight in Stabilus (-36%) also hurt.
•In contrast, from a regional standpoint, picks in emerging markets, primarily in Taiwan and China, contributed to the fund's relative result. In Europe ex U.K., investment choices in Germany proved rewarding.
•By sector, the biggest contributor to performance versus the benchmark was stock selection in communication services, primarily within the media & entertainment industry. Security selection in information technology, primarily within the technology hardware & equipment industry, also boosted the fund's relative performance.
•The top individual relative contributor was an overweight in International Games System (+238%). This period we decreased our position in International Games System. The company was among our biggest holdings. The second-largest relative contributor was our non-benchmark stake in Rheinmetall (+81%). The company was the fund's biggest holding. Another notable relative contributor was an overweight in Test Research (+131%).
•Notable changes in positioning include decreased exposure to Germany and a higher allocation to Japan and Taiwan. By sector, meaningful changes in positioning include increased exposure to communication services and a lower allocation to consumer discretionary.
How did the Fund perform over the past 10 years?
CUMULATIVE PERFORMANCE
October 31, 2014 through October 31, 2024.
Initial investment of $10,000.
Fidelity® International Small Cap Fund | $10,000 | $10,653 | $11,653 | $14,704 | $13,448 | $14,559 | $14,033 | $19,622 | $14,714 | $16,655 | $19,808 |
MSCI ACWI (All Country World Index) ex USA Small Cap Index | $10,000 | $10,162 | $10,602 | $13,236 | $11,963 | $13,030 | $13,055 | $18,144 | $13,127 | $14,305 | $17,725 |
| | 2014 | 2015 | 2016 | 2017 | 2018 | 2019 | 2020 | 2021 | 2022 | 2023 | 2024 |
AVERAGE ANNUAL TOTAL RETURNS:| | 1 Year | 5 Year | 10 Year |
| Fidelity® International Small Cap Fund | 18.93% | 6.35% | 7.07% |
| MSCI ACWI (All Country World Index) ex USA Small Cap Index | 23.90% | 6.35% | 5.89% |
Visit www.fidelity.com for more recent performance information. |
The Fund's past performance is not a good predictor of the Fund's future performance. The graph and table do not reflect the deduction of taxes that a shareholder would pay on fund distributions or redemption of fund shares. |
Key Fund Statistics(as of October 31, 2024)
KEY FACTS | | |
| Fund Size | $4,778,290,407 | |
| Number of Holdings | 197 | |
| Total Advisory Fee | $43,346,727 | |
| Portfolio Turnover | 17% | |
What did the Fund invest in?
(as of October 31, 2024)
MARKET SECTORS (% of Fund's net assets) | | |
| Industrials | 22.4 | |
| Financials | 13.2 | |
| Consumer Discretionary | 11.0 | |
| Consumer Staples | 10.4 | |
| Information Technology | 9.4 | |
| Materials | 8.2 | |
| Real Estate | 5.9 | |
| Health Care | 5.4 | |
| Communication Services | 4.8 | |
| Energy | 3.7 | |
| Utilities | 1.5 | |
| |
| Common Stocks | 95.9 |
| Short-Term Investments and Net Other Assets (Liabilities) | 4.1 |
ASSET ALLOCATION (% of Fund's net assets) |
|
|
| Japan | 21.9 |
| United Kingdom | 15.5 |
| United States | 6.8 |
| Canada | 4.2 |
| Taiwan | 4.0 |
| Australia | 3.3 |
| Spain | 3.1 |
| China | 3.1 |
| Mexico | 3.1 |
| Others | 35.0 |
GEOGRAPHIC DIVERSIFICATION (% of Fund's net assets) |
|
| |
|
TOP HOLDINGS(% of Fund's net assets) | | |
| Rheinmetall AG | 1.3 | |
| Premier Foods PLC | 1.2 | |
| Century Pacific Food Inc | 1.1 | |
| Logista Integral SA | 1.0 | |
| North West Co Inc/The | 1.0 | |
| Ashtead Technology Holdings plc | 1.0 | |
| Shriram Finance Ltd | 0.9 | |
| RHI Magnesita NV | 0.9 | |
| BayCurrent Inc | 0.9 | |
| Richter Gedeon Nyrt | 0.9 | |
| | 10.2 | |
How has the Fund changed?
This is a summary of certain changes to the Fund since November 1, 2023. For more complete information, you may review the Fund's next prospectus, which we expect to be available by December 30, 2024 at fundresearch.fidelity.com/prospectus/sec or upon request at 1-800-544-8544 or by sending an e-mail to fidfunddocuments@fidelity.com.
The fees associated with this class changed during the reporting year.The variations in class fees are primarily the result of the following changes: - Management fee
- Operating expenses
- Performance adjustment fee
The fund's transfer agent and pricing & bookkeeping fees were changed to a fixed rate effective December 1, 2023, through February 29, 2024, in anticipation of the transition to a new management fee structure. Effective March 1, 2024, the fund's management contract was amended to incorporate administrative services previously covered under separate services agreements (transfer agent and pricing & bookkeeping). The amended contract incorporates a basic fee rate that may vary by class (subject to a performance adjustment). The Adviser or an affiliate pays certain expenses of managing and operating the fund out of each class's management fee. | The fund's sub-advisory agreement with FIL Investments (Japan) Limited was not renewed.
|
| Fidelity, the Fidelity Investments Logo and all other Fidelity trademarks or service marks used herein are trademarks or service marks of FMR LLC. Any third-party marks that are used herein are trademarks or service marks of their respective owners. © 2024 FMR LLC. All rights reserved. |
| | For additional information about the Fund; including its prospectus, financial information, holdings and proxy information, scan the QR code or visit fundresearch.fidelity.com/prospectus/sec 1.9913915.100 818-TSRA-1224 |
| |
| | ANNUAL SHAREHOLDER REPORT | AS OF OCTOBER 31, 2024 | This report describes changes to the Fund that occurred during the reporting period. |
| | Fidelity® Worldwide Fund Fidelity Advisor® Worldwide Fund Class M : FWTFX |
| | | |
This annual shareholder report contains information about Fidelity® Worldwide Fund for the period November 1, 2023 to October 31, 2024. You can find additional information about the Fund at fundresearch.fidelity.com/prospectus/sec. You can also request this information by contacting us at 1-877-208-0098 or by sending an e-mail to fidfunddocuments@fidelity.com.
What were your Fund costs for the last year?(based on hypothetical $10,000 investment)
FUND COST (PREVIOUS YEAR)
| | Costs of a $10,000 investment | Costs paid as a percentage of a $10,000 investment | |
| Class M | $ 150 | 1.24% | |
What affected the Fund's performance this period?
•Global equities posted a strong advance for the 12 months ending October 31, 2024. Resilient economic growth and a slowing in the pace of inflation in certain regions, as well as a shift to global monetary easing, contributed to a favorable backdrop, despite persistent geopolitical risk.
•Against this backdrop, by region, security selection in the United States was the primary contributor to the fund's performance versus the MSCI World Index for the fiscal year.
•By sector, security selection was the primary contributor, especially within consumer discretionary. Stock picking in information technology, primarily within the semiconductors & semiconductor equipment industry, and industrials, primarily within the capital goods industry, also boosted the fund's relative performance.
•The top individual relative contributor was an overweight in Nvidia (+219%). We decreased our position in Nvidia during the period, but the company was the fund's largest holding at period end. The second-largest relative contributor was an overweight in Constellation Energy (+138%). This period we increased our investment in the stock. An overweight in Meta Platforms (+89%), which was one of the fund's largest holdings, also helped.
•In contrast, from a regional standpoint, an overweight in emerging markets, and stock selection and an overweight in the U.K., detracted from the fund's relative result.
•By sector, the biggest detractors from performance versus the benchmark were stock picking and an underweight in financials. Also modestly hurting our result were overweights in consumer discretionary, primarily within the consumer durables & apparel industry, and information technology.
•The biggest individual relative detractor was a stake in Jabil (-8%). The stock was not held at period end. The second-largest relative detractor was an overweight in Coinbase Global (-25%). This was a position we established this period. An overweight in Oracle (+8%) also hurt. We notably decreased our stake in Oracle by period end.
•Notable changes in positioning by region include a lower allocation to Japan. By sector, meaningful changes in positioning include decreased exposure to energy and a higher allocation to consumer discretionary.
How did the Fund perform over the past 10 years?
CUMULATIVE PERFORMANCE
October 31, 2014 through October 31, 2024.
Initial investment of $10,000 and the current sales charge was paid.
Class M | $9,650 | $9,878 | $9,741 | $12,243 | $12,690 | $14,219 | $17,120 | $23,517 | $17,043 | $18,814 | $26,845 |
MSCI World Index | $10,000 | $10,220 | $10,390 | $12,813 | $13,016 | $14,736 | $15,446 | $21,766 | $17,811 | $19,758 | $26,510 |
| | 2014 | 2015 | 2016 | 2017 | 2018 | 2019 | 2020 | 2021 | 2022 | 2023 | 2024 |
AVERAGE ANNUAL TOTAL RETURNS:| | 1 Year | 5 Year | 10 Year |
| Class M (incl. 3.50% sales charge) | 37.69% | 12.75% | 10.38% |
| Class M (without 3.50% sales charge) | 42.69% | 13.55% | 10.77% |
| MSCI World Index | 34.17% | 12.46% | 10.24% |
Visit institutional.fidelity.com for more recent performance information. |
The Fund's past performance is not a good predictor of the Fund's future performance. The graph and table do not reflect the deduction of taxes that a shareholder would pay on fund distributions or redemption of fund shares. |
Key Fund Statistics(as of October 31, 2024)
KEY FACTS | | |
| Fund Size | $3,143,670,063 | |
| Number of Holdings | 189 | |
| Total Advisory Fee | $19,608,125 | |
| Portfolio Turnover | 108% | |
What did the Fund invest in?
(as of October 31, 2024)
MARKET SECTORS (% of Fund's net assets) | | |
| Information Technology | 21.6 | |
| Consumer Discretionary | 16.6 | |
| Industrials | 16.3 | |
| Financials | 14.4 | |
| Communication Services | 10.4 | |
| Health Care | 8.5 | |
| Energy | 3.1 | |
| Utilities | 2.4 | |
| Real Estate | 2.2 | |
| Consumer Staples | 2.0 | |
| Materials | 1.9 | |
| |
| Common Stocks | 99.2 |
| Preferred Stocks | 0.2 |
| Short-Term Investments and Net Other Assets (Liabilities) | 0.6 |
ASSET ALLOCATION (% of Fund's net assets) |
|
|
| United States | 69.1 |
| United Kingdom | 4.6 |
| Canada | 4.0 |
| Sweden | 3.3 |
| Japan | 3.3 |
| Italy | 1.8 |
| Australia | 1.6 |
| Denmark | 1.5 |
| Belgium | 1.3 |
| Others | 9.5 |
GEOGRAPHIC DIVERSIFICATION (% of Fund's net assets) |
|
| |
|
TOP HOLDINGS(% of Fund's net assets) | | |
| NVIDIA Corp | 5.6 | |
| Meta Platforms Inc Class A | 4.7 | |
| Microsoft Corp | 4.1 | |
| Apple Inc | 3.8 | |
| Modine Manufacturing Co | 3.1 | |
| Eli Lilly & Co | 3.1 | |
| Amazon.com Inc | 2.7 | |
| Fiserv Inc | 2.5 | |
| Alphabet Inc Class A | 2.4 | |
| Deckers Outdoor Corp | 2.4 | |
| | 34.4 | |
How has the Fund changed?
This is a summary of certain changes to the Fund since November 1, 2023. For more complete information, you may review the Fund's next prospectus, which we expect to be available by December 30, 2024 at fundresearch.fidelity.com/prospectus/sec or upon request at 1-877-208-0098 or by sending an e-mail to fidfunddocuments@fidelity.com.
The fund's transfer agent and pricing & bookkeeping fees were changed to a fixed rate effective December 1, 2023, through February 29, 2024, in anticipation of the transition to a new management fee structure. Effective March 1, 2024, the fund's management contract was amended to incorporate administrative services previously covered under separate services agreements (transfer agent and pricing & bookkeeping). The amended contract incorporates a basic fee rate that may vary by class (subject to a performance adjustment). The Adviser or an affiliate pays certain expenses of managing and operating the fund out of each class's management fee. | The fund's sub-advisory agreement with FIL Investments (Japan) Limited was not renewed.
|
| Fidelity, the Fidelity Investments Logo and all other Fidelity trademarks or service marks used herein are trademarks or service marks of FMR LLC. Any third-party marks that are used herein are trademarks or service marks of their respective owners. © 2024 FMR LLC. All rights reserved. |
| | For additional information about the Fund; including its prospectus, financial information, holdings and proxy information, scan the QR code or visit fundresearch.fidelity.com/prospectus/sec 1.9913854.100 2146-TSRA-1224 |
| |
| | ANNUAL SHAREHOLDER REPORT | AS OF OCTOBER 31, 2024 | This report describes changes to the Fund that occurred during the reporting period. |
| | Fidelity® Emerging Markets Fund Fidelity Advisor® Emerging Markets Fund Class Z : FZEMX |
| | | |
This annual shareholder report contains information about Fidelity® Emerging Markets Fund for the period November 1, 2023 to October 31, 2024. You can find additional information about the Fund at fundresearch.fidelity.com/prospectus/sec. You can also request this information by contacting us at 1-877-208-0098 or by sending an e-mail to fidfunddocuments@fidelity.com.
What were your Fund costs for the last year?(based on hypothetical $10,000 investment)
FUND COST (PREVIOUS YEAR)
| | Costs of a $10,000 investment | Costs paid as a percentage of a $10,000 investment | |
| Class Z | $ 83 | 0.74% | |
What affected the Fund's performance this period?
•International stocks achieved a strong gain for the 12 months ending October 31, 2024. Resilient global economic growth and a slowing in the pace of inflation in certain regions, as well as a shift to global monetary easing, contributed to a favorable backdrop, despite persistent geopolitical risk.
•Against this backdrop, a non-benchmark allocation to developed markets - especially the U.S. - and stock picks in Taiwan contributed to the fund's performance versus the MSCI Emerging Markets (Net MA) Index for the fiscal year.
•By sector, the biggest contributors to performance versus the benchmark were stock picking and an overweight in information technology, primarily within the semiconductors & semiconductor equipment industry. An underweight in materials also boosted the fund's relative performance. Also bolstering our relative result was stock picking in consumer discretionary.
•The fund's non-benchmark stake in Nvidia gained 223% and was the top individual relative contributor. This period we decreased our investment in Nvidia. The stock was among our largest holdings. A second notable relative contributor was our non-benchmark stake in International Games System (+242%). This period we decreased our investment in International Games System. An overweight in Taiwan Semiconductor Manufacturing (+99%) also helped. The stock was the fund's largest holding.
•In contrast, from a geographical standpoint, stock picks in India and South Korea detracted from the fund's relative result.
•By sector, the biggest detractor from performance versus the benchmark was stock picking in financials. Also hurting our result were picks and overweights in consumer staples and health care.
•The largest individual relative detractor was an underweight in Alibaba (+23%). The stock was not held at period end. The second-largest relative detractor was an overweight in Kweichow Moutai (-4%). The company was among the fund's largest holdings this period. Another notable relative detractor this period was avoiding Hon Hai Precision Industry, a benchmark component that gained approximately 128%.
•Notable changes in positioning include decreased exposure to India and Saudi Arabia, and a higher allocation to China and Taiwan. By sector, meaningful changes in positioning include decreased exposure to materials and a higher allocation to industrials.
How did the Fund perform over the life of Fund?
CUMULATIVE PERFORMANCE
May 11, 2021 through October 31, 2024.
Initial investment of $10,000.
Class Z | $10,000 | $10,162 | $6,327 | $7,319 |
MSCI Emerging Markets Index | $10,000 | $9,639 | $6,649 | $7,370 |
| | 2021 | 2022 | 2023 | 2024 |
AVERAGE ANNUAL TOTAL RETURNS:| | 1 Year | Life of Fund A |
| Class Z | 26.20% | -2.26% |
| MSCI Emerging Markets Index | 25.33% | -2.26% |
A From May 11, 2021
Visit institutional.fidelity.com for more recent performance information. |
The Fund's past performance is not a good predictor of the Fund's future performance. The graph and table do not reflect the deduction of taxes that a shareholder would pay on fund distributions or redemption of fund shares. |
Key Fund Statistics(as of October 31, 2024)
KEY FACTS | | |
| Fund Size | $8,930,817,606 | |
| Number of Holdings | 86 | |
| Total Advisory Fee | $66,535,420 | |
| Portfolio Turnover | 46% | |
What did the Fund invest in?
(as of October 31, 2024)
MARKET SECTORS (% of Fund's net assets) | | |
| Information Technology | 28.4 | |
| Financials | 17.2 | |
| Consumer Discretionary | 12.9 | |
| Industrials | 9.5 | |
| Communication Services | 9.3 | |
| Energy | 6.2 | |
| Consumer Staples | 5.4 | |
| Health Care | 5.3 | |
| Materials | 2.0 | |
| Utilities | 1.7 | |
| Real Estate | 0.6 | |
| |
| Common Stocks | 98.3 |
| Bonds | 0.3 |
| Preferred Stocks | 0.2 |
| Short-Term Investments and Net Other Assets (Liabilities) | 1.2 |
ASSET ALLOCATION (% of Fund's net assets) |
|
|
| China | 24.6 |
| India | 18.4 |
| Taiwan | 16.2 |
| Brazil | 6.6 |
| Korea (South) | 6.4 |
| United States | 6.3 |
| Indonesia | 3.8 |
| Saudi Arabia | 3.0 |
| Mexico | 2.8 |
| Others | 11.9 |
GEOGRAPHIC DIVERSIFICATION (% of Fund's net assets) |
|
| |
|
TOP HOLDINGS(% of Fund's net assets) | | |
| Taiwan Semiconductor Manufacturing Co Ltd | 13.5 | |
| Tencent Holdings Ltd | 6.6 | |
| NVIDIA Corp | 4.0 | |
| Meituan B Shares | 3.1 | |
| PDD Holdings Inc Class A ADR | 3.1 | |
| Samsung Electronics Co Ltd | 3.0 | |
| Bank Central Asia Tbk PT | 2.9 | |
| HDFC Bank Ltd | 2.6 | |
| SK Hynix Inc | 2.2 | |
| JD.com Inc ADR | 2.1 | |
| | 43.1 | |
How has the Fund changed?
This is a summary of certain changes to the Fund since November 1, 2023. For more complete information, you may review the Fund's next prospectus, which we expect to be available by December 30, 2024 at fundresearch.fidelity.com/prospectus/sec or upon request at 1-877-208-0098 or by sending an e-mail to fidfunddocuments@fidelity.com.
Fidelity® Latin America Fund merged into Fidelity® Emerging Markets Fund on September 13, 2024. | The fund's transfer agent and pricing & bookkeeping fees were changed to a fixed rate effective December 1, 2023, through February 29, 2024, in anticipation of the transition to a new management fee structure. Effective March 1, 2024, the fund's management contract was amended to incorporate administrative services previously covered under separate services agreements (transfer agent and pricing & bookkeeping). The amended contract incorporates a management fee rate that may vary by class. The Adviser or an affiliate pays certain expenses of managing and operating the fund out of each class's management fee.
|
The fund's sub-advisory agreement with FIL Investments (Japan) Limited was not renewed. | |
| Fidelity, the Fidelity Investments Logo and all other Fidelity trademarks or service marks used herein are trademarks or service marks of FMR LLC. Any third-party marks that are used herein are trademarks or service marks of their respective owners. © 2024 FMR LLC. All rights reserved. |
| | For additional information about the Fund; including its prospectus, financial information, holdings and proxy information, scan the QR code or visit fundresearch.fidelity.com/prospectus/sec 1.9913864.100 6359-TSRA-1224 |
| |
| | ANNUAL SHAREHOLDER REPORT | AS OF OCTOBER 31, 2024 | This report describes changes to the Fund that occurred during the reporting period. |
| | Fidelity® Nordic Fund Fidelity® Nordic Fund : FNORX |
| | | |
This annual shareholder report contains information about Fidelity® Nordic Fund for the period November 1, 2023 to October 31, 2024. You can find additional information about the Fund at fundresearch.fidelity.com/prospectus/sec. You can also request this information by contacting us at 1-800-544-8544 or by sending an e-mail to fidfunddocuments@fidelity.com.
What were your Fund costs for the last year?(based on hypothetical $10,000 investment)
FUND COST (PREVIOUS YEAR)
| | Costs of a $10,000 investment | Costs paid as a percentage of a $10,000 investment | |
| Fidelity® Nordic Fund | $ 98 | 0.88% | |
What affected the Fund's performance this period?
•International stocks achieved a strong gain for the 12 months ending October 31, 2024. Resilient global economic growth and a slowing in the pace of inflation in certain regions, as well as a shift to global monetary easing, contributed to a favorable backdrop, despite persistent geopolitical risk.
•Against this backdrop, stock selection in Europe ex U.K., primarily in Denmark, detracted from the fund's performance versus the FTSE Capped Nordic Index for the fiscal year.
•By sector, security selection was the primary detractor, especially within consumer staples. Also hurting our result was stock picking in health care and communication services, primarily within the media & entertainment industry. Lastly, the fund's position in cash detracted.
•The biggest individual relative detractor this period was avoiding Ericsson, a benchmark component that gained roughly 94%. A second notable relative detractor this period was avoiding Volvo, a benchmark component that gained approximately 39%. An overweight in Equinor (-22%) also detracted. The company was one of our largest holdings this period.
•In contrast, from a regional standpoint, an underweight in Europe ex U.K. and a non-benchmark allocation to the United States contributed to the fund's relative result.
•By sector, the biggest contributor to performance versus the benchmark was stock picking in industrials, primarily within the capital goods industry. Picks in information technology, primarily within the technology hardware & equipment industry, also boosted relative performance. Also bolstering our relative result was an overweight in health care, primarily within the pharmaceuticals, biotechnology & life sciences industry.
•The top individual relative contributor was our non-benchmark stake in Lagercrantz Group (+116%). The second-largest relative contributor was an overweight in Kongsberg Gruppen (+158%), and we reduced exposure to the stock. A non-benchmark stake in Hemnet Group gained approximately 82% and notably helped. The company was one of the fund's largest holdings.
•Notable changes in positioning include increased exposure to Norway and a lower allocation to Denmark. By sector, meaningful changes in positioning include increased exposure to information technology and a lower allocation to energy.
How did the Fund perform over the past 10 years?
CUMULATIVE PERFORMANCE
October 31, 2014 through October 31, 2024.
Initial investment of $10,000.
Fidelity® Nordic Fund | $10,000 | $10,376 | $10,580 | $12,922 | $12,301 | $12,788 | $16,206 | $22,427 | $15,849 | $18,398 | $22,532 |
FTSE® Capped Nordic Index | $10,000 | $9,875 | $9,481 | $12,417 | $11,351 | $12,350 | $14,163 | $20,323 | $14,664 | $16,994 | $21,040 |
| | 2014 | 2015 | 2016 | 2017 | 2018 | 2019 | 2020 | 2021 | 2022 | 2023 | 2024 |
AVERAGE ANNUAL TOTAL RETURNS:| | 1 Year | 5 Year | 10 Year |
| Fidelity® Nordic Fund | 22.47% | 11.99% | 8.46% |
| FTSE® Capped Nordic Index | 23.81% | 11.24% | 7.72% |
Visit www.fidelity.com for more recent performance information. |
The Fund's past performance is not a good predictor of the Fund's future performance. The graph and table do not reflect the deduction of taxes that a shareholder would pay on fund distributions or redemption of fund shares. |
Key Fund Statistics(as of October 31, 2024)
KEY FACTS | | |
| Fund Size | $332,594,164 | |
| Number of Holdings | 49 | |
| Total Advisory Fee | $2,652,231 | |
| Portfolio Turnover | 21% | |
What did the Fund invest in?
(as of October 31, 2024)
MARKET SECTORS (% of Fund's net assets) | | |
| Industrials | 29.7 | |
| Health Care | 22.3 | |
| Financials | 20.8 | |
| Communication Services | 5.1 | |
| Materials | 4.6 | |
| Information Technology | 4.0 | |
| Consumer Discretionary | 3.4 | |
| Consumer Staples | 2.9 | |
| Energy | 2.4 | |
| Utilities | 1.0 | |
| Real Estate | 0.5 | |
| |
| Common Stocks | 96.7 |
| Short-Term Investments and Net Other Assets (Liabilities) | 3.3 |
ASSET ALLOCATION (% of Fund's net assets) |
|
|
| Sweden | 43.9 |
| Denmark | 31.5 |
| Finland | 10.8 |
| Norway | 10.5 |
| United States | 3.3 |
GEOGRAPHIC DIVERSIFICATION (% of Fund's net assets) |
|
| |
|
TOP HOLDINGS(% of Fund's net assets) | | |
| Novo Nordisk A/S Series B | 19.7 | |
| Nordea Bank Abp (Sweden) | 5.4 | |
| Investor AB B Shares | 5.2 | |
| Atlas Copco AB B Shares | 4.9 | |
| DSV A/S | 4.1 | |
| Assa Abloy AB B Shares | 3.3 | |
| Sandvik AB | 2.9 | |
| Hemnet Group AB | 2.9 | |
| Alfa Laval AB | 2.6 | |
| Tryg A/S | 2.4 | |
| | 53.4 | |
How has the Fund changed?
This is a summary of certain changes to the Fund since November 1, 2023. For more complete information, you may review the Fund's next prospectus, which we expect to be available by December 30, 2024 at fundresearch.fidelity.com/prospectus/sec or upon request at 1-800-544-8544 or by sending an e-mail to fidfunddocuments@fidelity.com.
The fees associated with this class changed during the reporting year.The variations in class fees are primarily the result of the following changes: - Management fee
- Operating expenses
The fund's transfer agent and pricing & bookkeeping fees were changed to a fixed rate effective December 1, 2023, through February 29, 2024, in anticipation of the transition to a new management fee structure. Effective March 1, 2024, the fund's management contract was amended to incorporate administrative services previously covered under separate services agreements (transfer agent and pricing & bookkeeping). The amended contract incorporates a management fee rate that may vary by class. The Adviser or an affiliate pays certain expenses of managing and operating the fund out of each class's management fee. | |
| Fidelity, the Fidelity Investments Logo and all other Fidelity trademarks or service marks used herein are trademarks or service marks of FMR LLC. Any third-party marks that are used herein are trademarks or service marks of their respective owners. © 2024 FMR LLC. All rights reserved. |
| | For additional information about the Fund; including its prospectus, financial information, holdings and proxy information, scan the QR code or visit fundresearch.fidelity.com/prospectus/sec 1.9913875.100 342-TSRA-1224 |
| |
| | ANNUAL SHAREHOLDER REPORT | AS OF OCTOBER 31, 2024 | This report describes changes to the Fund that occurred during the reporting period. |
| | Fidelity® International Small Cap Fund Fidelity Advisor® International Small Cap Fund Class I : FIXIX |
| | | |
This annual shareholder report contains information about Fidelity® International Small Cap Fund for the period November 1, 2023 to October 31, 2024. You can find additional information about the Fund at fundresearch.fidelity.com/prospectus/sec. You can also request this information by contacting us at 1-877-208-0098 or by sending an e-mail to fidfunddocuments@fidelity.com.
What were your Fund costs for the last year?(based on hypothetical $10,000 investment)
FUND COST (PREVIOUS YEAR)
| | Costs of a $10,000 investment | Costs paid as a percentage of a $10,000 investment | |
| Class I | $ 118 | 1.08% | |
What affected the Fund's performance this period?
•International stocks achieved a strong gain for the 12 months ending October 31, 2024. Resilient global economic growth and a slowing in the pace of inflation in certain regions, as well as a shift to global monetary easing, contributed to a favorable backdrop, despite persistent geopolitical risk.
•Against this backdrop, an underweight in emerging markets, primarily in India, and picks in the U.K. and Brazil detracted from the fund's performance versus the Fidelity International Small Cap Fund Linked Index for the fiscal year.
•By sector, security selection in financials was the largest detractor. However, picks in industrials, health care and consumer discretionary also meaningfully weighed on the fund's relative result.
•The largest individual relative detractor was our non-benchmark stake in Hypera Pharma (-35%). A non-benchmark stake in Mayr-Melnhof Karton returned roughly -24% and was the second-largest relative detractor. An overweight in Stabilus (-36%) also hurt.
•In contrast, from a regional standpoint, picks in emerging markets, primarily in Taiwan and China, contributed to the fund's relative result. In Europe ex U.K., investment choices in Germany proved rewarding.
•By sector, the biggest contributor to performance versus the benchmark was stock selection in communication services, primarily within the media & entertainment industry. Security selection in information technology, primarily within the technology hardware & equipment industry, also boosted the fund's relative performance.
•The top individual relative contributor was an overweight in International Games System (+238%). This period we decreased our position in International Games System. The company was among our biggest holdings. The second-largest relative contributor was our non-benchmark stake in Rheinmetall (+81%). The company was the fund's biggest holding. Another notable relative contributor was an overweight in Test Research (+131%).
•Notable changes in positioning include decreased exposure to Germany and a higher allocation to Japan and Taiwan. By sector, meaningful changes in positioning include increased exposure to communication services and a lower allocation to consumer discretionary.
How did the Fund perform over the past 10 years?
CUMULATIVE PERFORMANCE
October 31, 2014 through October 31, 2024.
Initial investment of $10,000.
Class I | $10,000 | $10,660 | $11,666 | $14,719 | $13,455 | $14,570 | $14,043 | $19,633 | $14,728 | $16,672 | $19,822 |
MSCI ACWI (All Country World Index) ex USA Small Cap Index | $10,000 | $10,162 | $10,602 | $13,236 | $11,963 | $13,030 | $13,055 | $18,144 | $13,127 | $14,305 | $17,725 |
| | 2014 | 2015 | 2016 | 2017 | 2018 | 2019 | 2020 | 2021 | 2022 | 2023 | 2024 |
AVERAGE ANNUAL TOTAL RETURNS:| | 1 Year | 5 Year | 10 Year |
| Class I | 18.90% | 6.35% | 7.08% |
| MSCI ACWI (All Country World Index) ex USA Small Cap Index | 23.90% | 6.35% | 5.89% |
Visit institutional.fidelity.com for more recent performance information. |
The Fund's past performance is not a good predictor of the Fund's future performance. The graph and table do not reflect the deduction of taxes that a shareholder would pay on fund distributions or redemption of fund shares. |
Key Fund Statistics(as of October 31, 2024)
KEY FACTS | | |
| Fund Size | $4,778,290,407 | |
| Number of Holdings | 197 | |
| Total Advisory Fee | $43,346,727 | |
| Portfolio Turnover | 17% | |
What did the Fund invest in?
(as of October 31, 2024)
MARKET SECTORS (% of Fund's net assets) | | |
| Industrials | 22.4 | |
| Financials | 13.2 | |
| Consumer Discretionary | 11.0 | |
| Consumer Staples | 10.4 | |
| Information Technology | 9.4 | |
| Materials | 8.2 | |
| Real Estate | 5.9 | |
| Health Care | 5.4 | |
| Communication Services | 4.8 | |
| Energy | 3.7 | |
| Utilities | 1.5 | |
| |
| Common Stocks | 95.9 |
| Short-Term Investments and Net Other Assets (Liabilities) | 4.1 |
ASSET ALLOCATION (% of Fund's net assets) |
|
|
| Japan | 21.9 |
| United Kingdom | 15.5 |
| United States | 6.8 |
| Canada | 4.2 |
| Taiwan | 4.0 |
| Australia | 3.3 |
| Spain | 3.1 |
| China | 3.1 |
| Mexico | 3.1 |
| Others | 35.0 |
GEOGRAPHIC DIVERSIFICATION (% of Fund's net assets) |
|
| |
|
TOP HOLDINGS(% of Fund's net assets) | | |
| Rheinmetall AG | 1.3 | |
| Premier Foods PLC | 1.2 | |
| Century Pacific Food Inc | 1.1 | |
| Logista Integral SA | 1.0 | |
| North West Co Inc/The | 1.0 | |
| Ashtead Technology Holdings plc | 1.0 | |
| Shriram Finance Ltd | 0.9 | |
| RHI Magnesita NV | 0.9 | |
| BayCurrent Inc | 0.9 | |
| Richter Gedeon Nyrt | 0.9 | |
| | 10.2 | |
How has the Fund changed?
This is a summary of certain changes to the Fund since November 1, 2023. For more complete information, you may review the Fund's next prospectus, which we expect to be available by December 30, 2024 at fundresearch.fidelity.com/prospectus/sec or upon request at 1-877-208-0098 or by sending an e-mail to fidfunddocuments@fidelity.com.
The fees associated with this class changed during the reporting year.The variations in class fees are primarily the result of the following changes: - Management fee
- Operating expenses
- Performance adjustment fee
The fund's transfer agent and pricing & bookkeeping fees were changed to a fixed rate effective December 1, 2023, through February 29, 2024, in anticipation of the transition to a new management fee structure. Effective March 1, 2024, the fund's management contract was amended to incorporate administrative services previously covered under separate services agreements (transfer agent and pricing & bookkeeping). The amended contract incorporates a basic fee rate that may vary by class (subject to a performance adjustment). The Adviser or an affiliate pays certain expenses of managing and operating the fund out of each class's management fee. | The fund's sub-advisory agreement with FIL Investments (Japan) Limited was not renewed.
|
| Fidelity, the Fidelity Investments Logo and all other Fidelity trademarks or service marks used herein are trademarks or service marks of FMR LLC. Any third-party marks that are used herein are trademarks or service marks of their respective owners. © 2024 FMR LLC. All rights reserved. |
| | For additional information about the Fund; including its prospectus, financial information, holdings and proxy information, scan the QR code or visit fundresearch.fidelity.com/prospectus/sec 1.9913913.100 1262-TSRA-1224 |
| |
| | ANNUAL SHAREHOLDER REPORT | AS OF OCTOBER 31, 2024 | |
| | Fidelity® International Discovery K6 Fund Fidelity® International Discovery K6 Fund : FDKFX |
| | | |
This annual shareholder report contains information about Fidelity® International Discovery K6 Fund for the period November 1, 2023 to October 31, 2024. You can find additional information about the Fund at fundresearch.fidelity.com/prospectus/sec. You can also request this information by contacting us at 1-800-835-5092 or by sending an e-mail to fidfunddocuments@fidelity.com.
What were your Fund costs for the last year?(based on hypothetical $10,000 investment)
FUND COST (PREVIOUS YEAR)
| | Costs of a $10,000 investment | Costs paid as a percentage of a $10,000 investment | |
| Fidelity® International Discovery K6 Fund | $ 69 | 0.60% | |
What affected the Fund's performance this period?
•International stocks achieved a strong gain for the 12 months ending October 31, 2024. Resilient global economic growth and a slowing in the pace of inflation in certain regions, as well as a shift to global monetary easing, contributed to a favorable backdrop, despite persistent geopolitical risk.
•Against this backdrop, stock picks in Europe ex U.K. and Japan contributed to the fund's performance versus the MSCI EAFE Index (Net MA) for the fiscal year.
•By sector, the biggest contributor to performance versus the benchmark was stock picking in industrials, primarily within the capital goods industry. Stock picks and an overweight in information technology, primarily within the semiconductors & semiconductor equipment industry, also boosted relative performance. Security selection in health care, primarily within the pharmaceuticals, biotechnology & life sciences industry, also contributed.
•The fund's non-benchmark stake in Nvidia gained 122% and was the top individual relative contributor. This period we decreased our position in Nvidia. A second notable relative contributor was our non-benchmark stake in Taiwan Semiconductor (+95%). The company was one of the fund's largest holdings. Another notable relative contributor was an overweight in Hitachi (+109%), the fund's largest holding at period end.
•In contrast, from a regional standpoint, an underweight in Asia Pacific ex Japan and an overweight in the UK detracted from the fund's relative result.
•By sector, the biggest detractor from performance versus the benchmark was stock picking in consumer staples. Picks in financials also hampered the fund's result, as did an overweight in consumer discretionary, primarily within the consumer durables & apparel industry. Lastly, the fund's position in cash detracted.
•The largest individual relative detractor was our non-benchmark stake in PDD (-46%), an investment we established this period. The second-largest relative detractor was an overweight in L'Oréal (-8%). The stock was among our biggest holdings this period. Another notable relative detractor was our non-benchmark stake in Samsung Electronics (-12%). The stock was not held at period end.
•Notable changes in positioning include increased exposure to Germany and a lower allocation to India. By sector, meaningful changes in positioning include increased exposure to industrials and a lower allocation to consumer staples.
How did the Fund perform over the life of Fund?
CUMULATIVE PERFORMANCE
June 13, 2019 through October 31, 2024.
Initial investment of $10,000.
Fidelity® International Discovery K6 Fund | $10,000 | $10,490 | $11,383 | $15,188 | $10,578 | $11,338 |
MSCI EAFE Index | $10,000 | $10,497 | $9,795 | $13,170 | $10,161 | $11,650 |
| | 2019 | 2020 | 2021 | 2022 | 2023 | 2024 |
AVERAGE ANNUAL TOTAL RETURNS:| | 1 Year | 5 Year | Life of Fund A |
| Fidelity® International Discovery K6 Fund | 29.50% | 6.96% | 7.39% |
| MSCI EAFE Index | 23.25% | 6.46% | 6.94% |
A From June 13, 2019
Visit www.401k.com for more recent performance information. |
The Fund's past performance is not a good predictor of the Fund's future performance. The graph and table do not reflect the deduction of taxes that a shareholder would pay on fund distributions or redemption of fund shares. |
Key Fund Statistics(as of October 31, 2024)
KEY FACTS | | |
| Fund Size | $550,651,138 | |
| Number of Holdings | 133 | |
| Total Advisory Fee | $3,891,394 | |
| Portfolio Turnover | 48% | |
What did the Fund invest in?
(as of October 31, 2024)
MARKET SECTORS (% of Fund's net assets) | | |
| Industrials | 22.5 | |
| Financials | 21.9 | |
| Consumer Discretionary | 13.8 | |
| Information Technology | 12.7 | |
| Health Care | 9.9 | |
| Materials | 5.4 | |
| Consumer Staples | 3.9 | |
| Communication Services | 3.4 | |
| Energy | 3.0 | |
| Real Estate | 0.9 | |
| |
| Common Stocks | 97.2 |
| Preferred Stocks | 0.2 |
| Short-Term Investments and Net Other Assets (Liabilities) | 2.6 |
ASSET ALLOCATION (% of Fund's net assets) |
|
|
| Japan | 17.3 |
| United Kingdom | 15.3 |
| France | 8.8 |
| United States | 7.9 |
| Germany | 7.3 |
| Netherlands | 6.6 |
| Italy | 5.1 |
| Canada | 4.5 |
| Sweden | 3.8 |
| Others | 23.4 |
GEOGRAPHIC DIVERSIFICATION (% of Fund's net assets) |
|
| |
|
TOP HOLDINGS(% of Fund's net assets) | | |
| Hitachi Ltd | 2.9 | |
| UniCredit SpA | 2.7 | |
| Novo Nordisk A/S Series B | 2.6 | |
| ASML Holding NV | 2.4 | |
| Taiwan Semiconductor Manufacturing Co Ltd | 2.2 | |
| Constellation Software Inc/Canada | 2.0 | |
| Unilever PLC | 1.9 | |
| Rheinmetall AG | 1.8 | |
| UCB SA | 1.8 | |
| RELX PLC | 1.8 | |
| | 22.1 | |
| Fidelity, the Fidelity Investments Logo and all other Fidelity trademarks or service marks used herein are trademarks or service marks of FMR LLC. Any third-party marks that are used herein are trademarks or service marks of their respective owners. © 2024 FMR LLC. All rights reserved. |
| | For additional information about the Fund; including its prospectus, financial information, holdings and proxy information, scan the QR code or visit fundresearch.fidelity.com/prospectus/sec 1.9914009.100 3461-TSRA-1224 |
| |
| | ANNUAL SHAREHOLDER REPORT | AS OF OCTOBER 31, 2024 | This report describes changes to the Fund that occurred during the reporting period. |
| | Fidelity® Europe Fund Fidelity Advisor® Europe Fund Class C : FHJTX |
| | | |
This annual shareholder report contains information about Fidelity® Europe Fund for the period November 1, 2023 to October 31, 2024. You can find additional information about the Fund at fundresearch.fidelity.com/prospectus/sec. You can also request this information by contacting us at 1-877-208-0098 or by sending an e-mail to fidfunddocuments@fidelity.com.
What were your Fund costs for the last year?(based on hypothetical $10,000 investment)
FUND COST (PREVIOUS YEAR)
| | Costs of a $10,000 investment | Costs paid as a percentage of a $10,000 investment | |
| Class C | $ 184 | 1.67% | |
What affected the Fund's performance this period?
•International stocks achieved a strong gain for the 12 months ending October 31, 2024. Resilient global economic growth and a slowing in the pace of inflation in certain regions, as well as a shift to global monetary easing, contributed to a favorable backdrop, despite persistent geopolitical risk.
•Against this backdrop, stock picks in Europe ex U.K., primarily in France, and the U.K. detracted from the fund's performance versus the MSCI Europe Index (Net MA) for the fiscal year.
•By sector, security selection was the primary detractor, especially within consumer staples. Picks and an underweight in financials, primarily within the banks industry, also hampered the fund's result. Also hurting our result was stock selection in materials.
•The biggest individual relative detractor was an overweight in Davide Campari Milano (-39%). The second-largest relative detractor was an overweight in Diageo (-16%). Not owning Schneider Electric, a benchmark component that gained roughly 71%, was another notable relative detractor.
•In contrast, from a regional standpoint, an underweight in Europe ex U.K., along with stock selection in Belgium and in Sweden, contributed to the fund's relative result.
•By sector, the biggest contributor to performance versus the benchmark was stock selection in health care, primarily within the pharmaceuticals, biotechnology & life sciences industry. Stock picks in communication services, primarily within the media & entertainment industry, also boosted the fund's relative performance.
•The top individual relative contributor was an overweight in UCB (+165%). Although we reduced the fund's exposure to the stock, it was among the fund's biggest holdings at period end. A second notable relative contributor was an overweight in SAP (+76%). The stock was among our largest holdings, even though we trimmed the position. A non-benchmark stake in Hemnet gained 81% and notably helped.
•Notable changes in positioning include decreased exposure to France and a higher allocation to Italy. By sector, meaningful changes in positioning include increased exposure to communication services and a lower allocation to consumer staples.
How did the Fund perform over the past 10 years?
CUMULATIVE PERFORMANCE
October 31, 2014 through October 31, 2024.
Initial investment of $10,000.
Class C | $10,000 | $10,379 | $9,608 | $11,975 | $10,773 | $11,457 | $11,893 | $15,524 | $10,734 | $11,871 | $14,450 |
MSCI Europe Index | $10,000 | $10,004 | $9,281 | $11,817 | $10,862 | $12,081 | $10,984 | $15,520 | $11,998 | $13,925 | $17,097 |
| | 2014 | 2015 | 2016 | 2017 | 2018 | 2019 | 2020 | 2021 | 2022 | 2023 | 2024 |
AVERAGE ANNUAL TOTAL RETURNS:| | 1 Year | 5 Year | 10 Year |
| Class C (incl. contingent deferred sales charge) | 19.80% | 4.43% | 3.75% |
| Class C | 20.80% | 4.43% | 3.75% |
| MSCI Europe Index | 22.78% | 7.19% | 5.51% |
Visit institutional.fidelity.com for more recent performance information. |
The Fund's past performance is not a good predictor of the Fund's future performance. The graph and table do not reflect the deduction of taxes that a shareholder would pay on fund distributions or redemption of fund shares. |
Key Fund Statistics(as of October 31, 2024)
KEY FACTS | | |
| Fund Size | $580,672,025 | |
| Number of Holdings | 101 | |
| Total Advisory Fee | $3,255,111 | |
| Portfolio Turnover | 31% | |
What did the Fund invest in?
(as of October 31, 2024)
MARKET SECTORS (% of Fund's net assets) | | |
| Financials | 18.9 | |
| Health Care | 16.4 | |
| Industrials | 14.6 | |
| Consumer Discretionary | 12.3 | |
| Information Technology | 11.2 | |
| Consumer Staples | 8.4 | |
| Communication Services | 4.7 | |
| Energy | 4.4 | |
| Materials | 4.1 | |
| Real Estate | 1.0 | |
| Utilities | 0.8 | |
| |
| Common Stocks | 96.7 |
| Preferred Stocks | 0.1 |
| Short-Term Investments and Net Other Assets (Liabilities) | 3.2 |
ASSET ALLOCATION (% of Fund's net assets) |
|
|
| United Kingdom | 23.1 |
| France | 15.3 |
| Germany | 12.4 |
| United States | 8.2 |
| Italy | 7.8 |
| Denmark | 7.1 |
| Sweden | 6.7 |
| Netherlands | 5.1 |
| Switzerland | 2.8 |
| Others | 11.5 |
GEOGRAPHIC DIVERSIFICATION (% of Fund's net assets) |
|
| |
|
TOP HOLDINGS(% of Fund's net assets) | | |
| Novo Nordisk A/S Series B | 5.6 | |
| SAP SE | 3.9 | |
| ASML Holding NV | 3.8 | |
| Astrazeneca PLC | 3.7 | |
| Shell PLC | 2.7 | |
| RELX PLC | 2.5 | |
| Air Liquide SA | 2.3 | |
| UCB SA | 2.2 | |
| LVMH Moet Hennessy Louis Vuitton SE | 2.1 | |
| UniCredit SpA | 1.7 | |
| | 30.5 | |
How has the Fund changed?
This is a summary of certain changes to the Fund since November 1, 2023. For more complete information, you may review the Fund's next prospectus, which we expect to be available by December 30, 2024 at fundresearch.fidelity.com/prospectus/sec or upon request at 1-877-208-0098 or by sending an e-mail to fidfunddocuments@fidelity.com.
The fees associated with this class changed during the reporting year.The variations in class fees are primarily the result of the following changes: - Management fee
- Operating expenses
The fund's transfer agent and pricing & bookkeeping fees were changed to a fixed rate effective December 1, 2023, through February 29, 2024, in anticipation of the transition to a new management fee structure. Effective March 1, 2024, the fund's management contract was amended to incorporate administrative services previously covered under separate services agreements (transfer agent and pricing & bookkeeping). The amended contract incorporates a basic fee rate that may vary by class (subject to a performance adjustment). The Adviser or an affiliate pays certain expenses of managing and operating the fund out of each class's management fee. | |
| Fidelity, the Fidelity Investments Logo and all other Fidelity trademarks or service marks used herein are trademarks or service marks of FMR LLC. Any third-party marks that are used herein are trademarks or service marks of their respective owners. © 2024 FMR LLC. All rights reserved. |
| | For additional information about the Fund; including its prospectus, financial information, holdings and proxy information, scan the QR code or visit fundresearch.fidelity.com/prospectus/sec 1.9913829.100 2634-TSRA-1224 |
| |
| | ANNUAL SHAREHOLDER REPORT | AS OF OCTOBER 31, 2024 | This report describes changes to the Fund that occurred during the reporting period. |
| | Fidelity® China Region Fund Fidelity® China Region Fund : FHKCX |
| | | |
This annual shareholder report contains information about Fidelity® China Region Fund for the period November 1, 2023 to October 31, 2024. You can find additional information about the Fund at fundresearch.fidelity.com/prospectus/sec. You can also request this information by contacting us at 1-800-544-8544 or by sending an e-mail to fidfunddocuments@fidelity.com.
What were your Fund costs for the last year?(based on hypothetical $10,000 investment)
FUND COST (PREVIOUS YEAR)
| | Costs of a $10,000 investment | Costs paid as a percentage of a $10,000 investment | |
| Fidelity® China Region Fund | $ 107 | 0.92% | |
What affected the Fund's performance this period?
•International stocks achieved a strong gain for the 12 months ending October 31, 2024. Resilient global economic growth and a slowing in the pace of inflation in certain regions, as well as a shift to global monetary easing, contributed to a favorable backdrop, despite persistent geopolitical risk.
•After trailing for most of the period, stocks in the China region got a boost in September from the Chinese government's announcement of aggressive monetary stimulus measures.
•Against this backdrop, picks in Taiwan had, by far, the biggest positive impact on the fund's performance versus the MSCI Golden Dragon (Net MA) Index for the fiscal year.
•By sector, security selection in information technology was the primary contributor, where our stock picks in semiconductors & semiconductor equipment helped most. Stock picks in materials and consumer discretionary also boosted the fund's relative performance.
•The top individual relative contributor was an overweight in Taiwan Semiconductor (+101%). The stock was the fund's biggest holding. A non-benchmark stake in Sea gained roughly 118% and was a second notable relative contributor. An overweight in Trip.com (+89%) also contributed. The stock was among our largest holdings.
•In contrast, from a geographical standpoint, an underweight in Taiwan, stock selection in Hong Kong and non-benchmark exposure to South Korea detracted from the fund's relative result.
•By sector, the biggest detractor from performance versus the benchmark was security selection in financials, primarily within the insurance industry. Stock selection and an overweight in health care also hampered the fund's result, as did picks in energy. Lastly, the fund's position in cash detracted.
•The biggest individual relative detractor was an overweight in NetEase (-25%). The company was among our largest holdings this period. The second-largest relative detractor was our non-benchmark stake in Samsung Electronics (-10%). Another notable relative detractor was our stake in Asymchem Laboratories (-54%), which was not held by the fund at period end.
•Notable changes in positioning include increased exposure to Taiwan and a lower allocation to Hong Kong. By sector, meaningful changes in positioning include lower allocations to health care and consumer staples.
How did the Fund perform over the past 10 years?
CUMULATIVE PERFORMANCE
October 31, 2014 through October 31, 2024.
Initial investment of $10,000.
Fidelity® China Region Fund | $10,000 | $9,886 | $9,901 | $13,476 | $11,371 | $14,296 | $20,436 | $21,248 | $11,677 | $14,520 | $19,333 |
MSCI Golden Dragon Index | $10,000 | $9,667 | $10,337 | $13,689 | $11,813 | $13,628 | $17,249 | $17,905 | $10,248 | $12,405 | $16,411 |
MSCI Emerging Markets Index | $10,000 | $8,550 | $9,346 | $11,823 | $10,347 | $11,577 | $12,535 | $14,663 | $10,115 | $11,211 | $14,051 |
| | 2014 | 2015 | 2016 | 2017 | 2018 | 2019 | 2020 | 2021 | 2022 | 2023 | 2024 |
AVERAGE ANNUAL TOTAL RETURNS:| | 1 Year | 5 Year | 10 Year |
| Fidelity® China Region Fund | 33.15% | 6.22% | 6.81% |
| MSCI Golden Dragon Index | 32.29% | 3.79% | 5.08% |
| MSCI Emerging Markets Index | 25.33% | 3.95% | 3.46% |
Visit www.fidelity.com for more recent performance information. |
The Fund's past performance is not a good predictor of the Fund's future performance. The graph and table do not reflect the deduction of taxes that a shareholder would pay on fund distributions or redemption of fund shares. |
Key Fund Statistics(as of October 31, 2024)
KEY FACTS | | |
| Fund Size | $1,209,670,065 | |
| Number of Holdings | 86 | |
| Total Advisory Fee | $8,069,000 | |
| Portfolio Turnover | 30% | |
What did the Fund invest in?
(as of October 31, 2024)
MARKET SECTORS (% of Fund's net assets) | | |
| Information Technology | 31.3 | |
| Consumer Discretionary | 23.9 | |
| Communication Services | 13.8 | |
| Financials | 13.1 | |
| Industrials | 4.2 | |
| Health Care | 3.3 | |
| Materials | 3.2 | |
| Consumer Staples | 2.6 | |
| Real Estate | 1.0 | |
| Energy | 0.5 | |
| |
| Common Stocks | 94.9 |
| Preferred Stocks | 2.0 |
| Short-Term Investments and Net Other Assets (Liabilities) | 3.1 |
ASSET ALLOCATION (% of Fund's net assets) |
|
|
| China | 57.8 |
| Taiwan | 30.2 |
| Hong Kong | 5.0 |
| United States | 3.6 |
| Korea (South) | 1.3 |
| Singapore | 0.9 |
| Macau | 0.5 |
| France | 0.4 |
| Japan | 0.3 |
GEOGRAPHIC DIVERSIFICATION (% of Fund's net assets) |
|
| |
|
TOP HOLDINGS(% of Fund's net assets) | | |
| Taiwan Semiconductor Manufacturing Co Ltd | 22.8 | |
| Tencent Holdings Ltd | 10.3 | |
| Alibaba Group Holding Ltd | 5.5 | |
| Meituan B Shares | 4.0 | |
| PDD Holdings Inc Class A ADR | 3.4 | |
| China Construction Bank Corp H Shares | 3.1 | |
| AIA Group Ltd | 3.0 | |
| Hon Hai Precision Industry Co Ltd | 2.4 | |
| Zijin Mining Group Co Ltd H Shares | 2.1 | |
| JD.com Inc A Shares | 1.5 | |
| | 58.1 | |
How has the Fund changed?
This is a summary of certain changes to the Fund since November 1, 2023. For more complete information, you may review the Fund's next prospectus, which we expect to be available by December 30, 2024 at fundresearch.fidelity.com/prospectus/sec or upon request at 1-800-544-8544 or by sending an e-mail to fidfunddocuments@fidelity.com.
The fund's transfer agent and pricing & bookkeeping fees were changed to a fixed rate effective December 1, 2023, through February 29, 2024, in anticipation of the transition to a new management fee structure. Effective March 1, 2024, the fund's management contract was amended to incorporate administrative services previously covered under separate services agreements (transfer agent and pricing & bookkeeping). The amended contract incorporates a management fee rate that may vary by class. The Adviser or an affiliate pays certain expenses of managing and operating the fund out of each class's management fee. | The fund's sub-advisory agreement with FIL Investments (Japan) Limited was not renewed.
|
| Fidelity, the Fidelity Investments Logo and all other Fidelity trademarks or service marks used herein are trademarks or service marks of FMR LLC. Any third-party marks that are used herein are trademarks or service marks of their respective owners. © 2024 FMR LLC. All rights reserved. |
| | For additional information about the Fund; including its prospectus, financial information, holdings and proxy information, scan the QR code or visit fundresearch.fidelity.com/prospectus/sec 1.9913894.100 352-TSRA-1224 |
| |
| | ANNUAL SHAREHOLDER REPORT | AS OF OCTOBER 31, 2024 | This report describes changes to the Fund that occurred during the reporting period. |
| | Fidelity® Global Equity Income Fund Fidelity Advisor® Global Equity Income Fund Class A : FGEEX |
| | | |
This annual shareholder report contains information about Fidelity® Global Equity Income Fund for the period October 18, 2024 to October 31, 2024. You can find additional information about the Fund at fundresearch.fidelity.com/prospectus/sec. You can also request this information by contacting us at 1-877-208-0098 or by sending an e-mail to fidfunddocuments@fidelity.com.
What were your Fund costs for the last year?(based on hypothetical $10,000 investment)
FUND COST (PREVIOUS YEAR)
| | Costs of a $10,000 investment | Costs paid as a percentage of a $10,000 investment | |
Class A A | $ 4 | 1.05% | |
AExpenses for the full reporting period would be higher.
What affected the Fund's performance this period?
•Global equities posted a strong advance for the 12 months ending October 31, 2024. Resilient economic growth and a slowing in the pace of inflation in certain regions, as well as a shift to global monetary easing, contributed to a favorable backdrop, despite persistent geopolitical risk.
•Against this backdrop, stock picking in the United States and picks and an overweight in the U.K. detracted from the fund's performance versus the MSCI All Country World Index (Net MA) for the fiscal year.
•By sector, the biggest detractor from performance versus the benchmark was stock selection in information technology. Also hurting our result was stock selection in consumer discretionary and communication services, primarily within the media & entertainment industry. Lastly, the fund's position in cash detracted.
•The biggest individual relative detractor this period was avoiding Nvidia, a benchmark component that gained about 226%. Not owning Meta Platforms, a benchmark component that gained 89%, was the second-largest relative detractor. An overweight in Dollar Tree (-41%) also hurt.
•In contrast, from a regional standpoint, an underweight in emerging markets and picks in Europe ex U.K., primarily in Germany, contributed to the fund's relative result.
•By sector, the biggest contributor to performance versus the benchmark was security selection in industrials, primarily within the capital goods industry. Stock picks in utilities and health care, primarily within the pharmaceuticals, biotechnology & life sciences industry, also boosted the fund's relative result.
•The top individual relative contributor was an overweight in Vistra (+290%). The second-largest relative contributor was an overweight in Taiwan Semiconductor (+97%), which was among the largest holdings. Another notable relative contributor was an overweight in Rheinmetall (+82%), also among the biggest holdings.
•Notable changes in positioning include a lower allocation to France. By sector, meaningful changes in positioning include increased exposure to industrials and a lower allocation to consumer staples.
Key Fund Statistics(as of October 31, 2024)
KEY FACTS | | |
| Fund Size | $257,697,453 | |
| Number of Holdings | 153 | |
| Total Advisory Fee | $1,240,182 | |
| Portfolio Turnover | 29% | |
What did the Fund invest in?
(as of October 31, 2024)
MARKET SECTORS (% of Fund's net assets) | | |
| Information Technology | 20.5 | |
| Financials | 13.5 | |
| Industrials | 12.1 | |
| Health Care | 11.8 | |
| Consumer Discretionary | 9.4 | |
| Consumer Staples | 8.8 | |
| Communication Services | 6.2 | |
| Energy | 4.8 | |
| Utilities | 4.6 | |
| Materials | 4.3 | |
| Real Estate | 1.1 | |
| |
| Common Stocks | 97.1 |
| Short-Term Investments and Net Other Assets (Liabilities) | 2.9 |
ASSET ALLOCATION (% of Fund's net assets) |
|
|
| United States | 63.6 |
| United Kingdom | 7.4 |
| Japan | 5.5 |
| Canada | 5.2 |
| Germany | 3.8 |
| Taiwan | 2.7 |
| France | 2.6 |
| China | 2.0 |
| Italy | 1.2 |
| Others | 6.0 |
GEOGRAPHIC DIVERSIFICATION (% of Fund's net assets) |
|
| |
|
TOP HOLDINGS(% of Fund's net assets) | | |
| Apple Inc | 5.4 | |
| Microsoft Corp | 4.6 | |
| Taiwan Semiconductor Manufacturing Co Ltd | 2.7 | |
| Rheinmetall AG | 2.2 | |
| NXP Semiconductors NV | 2.0 | |
| JPMorgan Chase & Co | 1.7 | |
| Linde PLC | 1.5 | |
| Eli Lilly & Co | 1.4 | |
| UnitedHealth Group Inc | 1.4 | |
| AbbVie Inc | 1.4 | |
| | 24.3 | |
How has the Fund changed?
This is a summary of certain changes to the Fund since October 18, 2024. For more complete information, you may review the Fund's next prospectus, which we expect to be available by December 30, 2024 at fundresearch.fidelity.com/prospectus/sec or upon request at 1-877-208-0098 or by sending an e-mail to fidfunddocuments@fidelity.com.
Fidelity Advisor® Global Equity Income Fund merged into Fidelity® Global Equity Income Fund on October 25, 2024. | The fund changed its investment objective from non-fundamental to fundamental effective July 26, 2024.
|
The fund's sub-advisory agreement with FIL Investments (Japan) Limited was not renewed. | |
| Fidelity, the Fidelity Investments Logo and all other Fidelity trademarks or service marks used herein are trademarks or service marks of FMR LLC. Any third-party marks that are used herein are trademarks or service marks of their respective owners. © 2024 FMR LLC. All rights reserved. |
| | For additional information about the Fund; including its prospectus, financial information, holdings and proxy information, scan the QR code or visit fundresearch.fidelity.com/prospectus/sec 1.9918438.100 7766-TSRA-1224 |
| |
| | ANNUAL SHAREHOLDER REPORT | AS OF OCTOBER 31, 2024 | This report describes changes to the Fund that occurred during the reporting period. |
| | Fidelity® Emerging Asia Fund Fidelity® Emerging Asia Fund : FSEAX |
| | | |
This annual shareholder report contains information about Fidelity® Emerging Asia Fund for the period November 1, 2023 to October 31, 2024. You can find additional information about the Fund at fundresearch.fidelity.com/prospectus/sec. You can also request this information by contacting us at 1-800-544-8544 or by sending an e-mail to fidfunddocuments@fidelity.com.
What were your Fund costs for the last year?(based on hypothetical $10,000 investment)
FUND COST (PREVIOUS YEAR)
| | Costs of a $10,000 investment | Costs paid as a percentage of a $10,000 investment | |
| Fidelity® Emerging Asia Fund | $ 78 | 0.65% | |
What affected the Fund's performance this period?
•International stocks achieved a strong gain for the 12 months ending October 31, 2024. Resilient global economic growth and a slowing in the pace of inflation in certain regions, as well as a shift to global monetary easing, contributed to a favorable backdrop, despite persistent geopolitical risk.
•Against this backdrop, stock picking and an overweight in Asia Pacific ex Japan, primarily in Singapore, contributed to the fund's performance versus the MSCI AC Asia Ex Japan (Net Mass) Linked Index for the fiscal year. Within emerging markets, stock selection and an overweight in India helped.
•By sector, security selection in consumer discretionary - notably the consumer services segment - was the primary contributor. Stock picking in communication services, primarily within the media & entertainment industry, also boosted the fund's relative performance. Also lifting the fund's relative result were stock picks and an overweight in information technology, primarily within the semiconductors & semiconductor equipment industry.
•The top individual relative contributor was an overweight in Sea (+126%). The company was one of the fund's biggest holdings. A non-benchmark stake in MakeMyTrip gained about 160% and was a second notable relative contributor. The company was among our biggest holdings. Another notable relative contributor was an overweight in Zomato (+125%). This period we decreased our stake in Zomato. The stock was one of our largest holdings.
•In contrast, from a regional standpoint, stock selection in China had the largest negative impact on relative performance. A non-benchmark allocation to the U.K. also detracted from the fund's relative result.
•By sector, the biggest detractors from performance versus the benchmark were stock picks and an overweight in health care. Security selection in financials also hampered the fund's result.
•The largest and third-largest individual relative detractors, respectively, were the fund's overweight positions in WuXi AppTec (-43%) and WuXi Biologics (-75%). We reduced the former and sold out of the latter. Another notable relative detractor was our stake in One97 Communications (-51%). The stock was not held at period end.
•Notable changes in positioning include increased exposure to China, Hong Kong and Singapore, and reduced stakes in India and South Korea. By sector, meaningful changes in positioning include increased exposure to communication services and industrials, and a lower allocation to health care.
How did the Fund perform over the past 10 years?
CUMULATIVE PERFORMANCE
October 31, 2014 through October 31, 2024.
Initial investment of $10,000.
Fidelity® Emerging Asia Fund | $10,000 | $9,531 | $10,238 | $13,645 | $11,496 | $14,594 | $21,959 | $25,696 | $13,679 | $16,276 | $22,497 |
MSCI AC (All Country) Asia ex Japan Index | $10,000 | $9,278 | $9,890 | $12,902 | $11,144 | $12,620 | $14,620 | $16,494 | $10,886 | $12,358 | $15,813 |
| | 2014 | 2015 | 2016 | 2017 | 2018 | 2019 | 2020 | 2021 | 2022 | 2023 | 2024 |
AVERAGE ANNUAL TOTAL RETURNS:| | 1 Year | 5 Year | 10 Year |
| Fidelity® Emerging Asia Fund | 38.22% | 9.04% | 8.45% |
| MSCI AC (All Country) Asia ex Japan Index | 27.96% | 4.61% | 4.69% |
Visit www.fidelity.com for more recent performance information. |
The Fund's past performance is not a good predictor of the Fund's future performance. The graph and table do not reflect the deduction of taxes that a shareholder would pay on fund distributions or redemption of fund shares. |
Key Fund Statistics(as of October 31, 2024)
KEY FACTS | | |
| Fund Size | $1,025,551,649 | |
| Number of Holdings | 132 | |
| Total Advisory Fee | $5,002,381 | |
| Portfolio Turnover | 57% | |
What did the Fund invest in?
(as of October 31, 2024)
MARKET SECTORS (% of Fund's net assets) | | |
| Consumer Discretionary | 28.8 | |
| Information Technology | 26.7 | |
| Communication Services | 12.3 | |
| Financials | 11.5 | |
| Industrials | 8.7 | |
| Health Care | 8.1 | |
| Energy | 1.3 | |
| Real Estate | 0.9 | |
| Consumer Staples | 0.6 | |
| Materials | 0.3 | |
| |
| Common Stocks | 98.1 |
| Preferred Stocks | 1.1 |
| Short-Term Investments and Net Other Assets (Liabilities) | 0.8 |
ASSET ALLOCATION (% of Fund's net assets) |
|
|
| China | 41.3 |
| India | 22.0 |
| Taiwan | 12.8 |
| Singapore | 7.5 |
| Korea (South) | 7.1 |
| Hong Kong | 4.2 |
| United States | 1.6 |
| Indonesia | 1.0 |
| South Africa | 0.9 |
| Others | 1.6 |
GEOGRAPHIC DIVERSIFICATION (% of Fund's net assets) |
|
| |
|
TOP HOLDINGS(% of Fund's net assets) | | |
| Taiwan Semiconductor Manufacturing Co Ltd | 10.7 | |
| Sea Ltd Class A ADR | 6.9 | |
| PDD Holdings Inc Class A ADR | 4.7 | |
| Zomato Ltd | 4.2 | |
| MakeMyTrip Ltd | 3.9 | |
| Meituan B Shares | 3.2 | |
| Samsung Electronics Co Ltd | 3.0 | |
| Alibaba Group Holding Ltd | 2.8 | |
| Tencent Holdings Ltd | 2.6 | |
| Advanced Micro-Fabrication Equipment Inc China A Shares (China) | 2.0 | |
| | 44.0 | |
How has the Fund changed?
This is a summary of certain changes to the Fund since November 1, 2023. For more complete information, you may review the Fund's next prospectus, which we expect to be available by December 30, 2024 at fundresearch.fidelity.com/prospectus/sec or upon request at 1-800-544-8544 or by sending an e-mail to fidfunddocuments@fidelity.com.
The fees associated with this class changed during the reporting year.The variations in class fees are primarily the result of the following changes: - Management fee
- Performance adjustment fee
The fund's transfer agent and pricing & bookkeeping fees were changed to a fixed rate effective December 1, 2023, through February 29, 2024, in anticipation of the transition to a new management fee structure. Effective March 1, 2024, the fund's management contract was amended to incorporate administrative services previously covered under separate services agreements (transfer agent and pricing & bookkeeping). The amended contract incorporates a basic fee rate that may vary by class (subject to a performance adjustment). The Adviser or an affiliate pays certain expenses of managing and operating the fund out of each class's management fee. | The fund's sub-advisory agreement with FIL Investments (Japan) Limited was not renewed.
|
| Fidelity, the Fidelity Investments Logo and all other Fidelity trademarks or service marks used herein are trademarks or service marks of FMR LLC. Any third-party marks that are used herein are trademarks or service marks of their respective owners. © 2024 FMR LLC. All rights reserved. |
| | For additional information about the Fund; including its prospectus, financial information, holdings and proxy information, scan the QR code or visit fundresearch.fidelity.com/prospectus/sec 1.9913888.100 351-TSRA-1224 |
| |
| | ANNUAL SHAREHOLDER REPORT | AS OF OCTOBER 31, 2024 | This report describes changes to the Fund that occurred during the reporting period. |
| | Fidelity® Diversified International Fund Fidelity® Diversified International Fund : FDIVX |
| | | |
This annual shareholder report contains information about Fidelity® Diversified International Fund for the period November 1, 2023 to October 31, 2024. You can find additional information about the Fund at fundresearch.fidelity.com/prospectus/sec. You can also request this information by contacting us at 1-800-544-8544 or by sending an e-mail to fidfunddocuments@fidelity.com.
What were your Fund costs for the last year?(based on hypothetical $10,000 investment)
FUND COST (PREVIOUS YEAR)
| | Costs of a $10,000 investment | Costs paid as a percentage of a $10,000 investment | |
| Fidelity® Diversified International Fund | $ 68 | 0.60% | |
What affected the Fund's performance this period?
•International stocks achieved a strong gain for the 12 months ending October 31, 2024. Resilient global economic growth and a slowing in the pace of inflation in certain regions, as well as a shift to global monetary easing, contributed to a favorable backdrop, despite persistent geopolitical risk.
•Against this backdrop, stock picks in Japan and a non-benchmark allocation to emerging markets contributed to the fund's performance versus the MSCI EAFE Index (Net MA) for the fiscal year.
•By sector, the biggest contributors to performance versus the benchmark were picks and an overweight in industrials, primarily within the capital goods industry. Picks in materials also boosted relative performance. Also helping our relative result was an underweight in consumer staples.
•The top individual relative contributor was our non-benchmark stake in Taiwan Semiconductor Manufacturing (+124%). The stock was among our biggest holdings. A second notable relative contributor was an overweight in Hitachi (+109%). Although we trimmed our stake, the company was the fund's largest holding at period end. Another notable relative contributor was an overweight in Mitsubishi Heavy Industries (+127%). This was a stake we established this period.
•In contrast, from a regional standpoint, a non-benchmark allocation to both the United States and Canada detracted from the fund's relative result.
•By sector, the biggest detractor from performance versus the benchmark was stock picking in financials. Stock picks in consumer staples also hampered the fund's result. Also detracting from our result was an overweight in energy. Lastly, the fund's position in cash detracted.
•The fund's non-benchmark stake in Schlumberger returned -20% and was the largest individual relative detractor. The stock was not held at period end. A non-benchmark stake in HDFC Bank gained 18% and was a second notable relative detractor. We reduced the position. Our stake in Pernod-Ricard (-27%) also detracted. This period we decreased our position in Pernod-Ricard.
•Notable changes in positioning include increased exposure to Germany and Switzerland. By sector, meaningful changes in positioning include decreased exposure to consumer staples and a higher allocation to industrials.
How did the Fund perform over the past 10 years?
CUMULATIVE PERFORMANCE
October 31, 2014 through October 31, 2024.
Initial investment of $10,000.
Fidelity® Diversified International Fund | $10,000 | $10,329 | $9,946 | $12,173 | $11,071 | $12,845 | $14,009 | $18,153 | $12,822 | $14,381 | $17,954 |
MSCI EAFE Index | $10,000 | $10,008 | $9,705 | $12,004 | $11,206 | $12,472 | $11,638 | $15,647 | $12,073 | $13,841 | $17,059 |
| | 2014 | 2015 | 2016 | 2017 | 2018 | 2019 | 2020 | 2021 | 2022 | 2023 | 2024 |
AVERAGE ANNUAL TOTAL RETURNS:| | 1 Year | 5 Year | 10 Year |
| Fidelity® Diversified International Fund | 24.85% | 6.93% | 6.03% |
| MSCI EAFE Index | 23.25% | 6.46% | 5.49% |
Visit www.fidelity.com for more recent performance information. |
The Fund's past performance is not a good predictor of the Fund's future performance. The graph and table do not reflect the deduction of taxes that a shareholder would pay on fund distributions or redemption of fund shares. |
Key Fund Statistics(as of October 31, 2024)
KEY FACTS | | |
| Fund Size | $11,018,162,405 | |
| Number of Holdings | 134 | |
| Total Advisory Fee | $55,332,153 | |
| Portfolio Turnover | 35% | |
What did the Fund invest in?
(as of October 31, 2024)
MARKET SECTORS (% of Fund's net assets) | | |
| Industrials | 24.2 | |
| Financials | 22.5 | |
| Information Technology | 15.6 | |
| Health Care | 10.3 | |
| Materials | 8.3 | |
| Consumer Discretionary | 7.2 | |
| Energy | 4.9 | |
| Consumer Staples | 1.8 | |
| Communication Services | 0.5 | |
| Real Estate | 0.2 | |
| |
| Common Stocks | 95.0 |
| Preferred Stocks | 0.5 |
| Short-Term Investments and Net Other Assets (Liabilities) | 4.5 |
ASSET ALLOCATION (% of Fund's net assets) |
|
|
| United States | 17.0 |
| Japan | 17.0 |
| United Kingdom | 14.3 |
| Germany | 8.6 |
| France | 8.0 |
| Canada | 6.4 |
| Netherlands | 5.2 |
| Denmark | 3.4 |
| Sweden | 2.9 |
| Others | 17.2 |
GEOGRAPHIC DIVERSIFICATION (% of Fund's net assets) |
|
| |
|
TOP HOLDINGS(% of Fund's net assets) | | |
| Hitachi Ltd | 2.8 | |
| ASML Holding NV depository receipt | 2.7 | |
| Novo Nordisk A/S Series B | 2.5 | |
| Taiwan Semiconductor Manufacturing Co Ltd ADR | 2.4 | |
| SAP SE | 2.4 | |
| Astrazeneca PLC | 1.8 | |
| RELX PLC (Netherlands) | 1.8 | |
| Wolters Kluwer NV | 1.6 | |
| London Stock Exchange Group PLC | 1.6 | |
| Shell PLC | 1.5 | |
| | 21.1 | |
How has the Fund changed?
This is a summary of certain changes to the Fund since November 1, 2023. For more complete information, you may review the Fund's next prospectus, which we expect to be available by December 30, 2024 at fundresearch.fidelity.com/prospectus/sec or upon request at 1-800-544-8544 or by sending an e-mail to fidfunddocuments@fidelity.com.
The fees associated with this class changed during the reporting year.The variations in class fees are primarily the result of the following changes: - Management fee
- Performance adjustment fee
The fund's transfer agent and pricing & bookkeeping fees were changed to a fixed rate effective December 1, 2023, through February 29, 2024, in anticipation of the transition to a new management fee structure. Effective March 1, 2024, the fund's management contract was amended to incorporate administrative services previously covered under separate services agreements (transfer agent and pricing & bookkeeping). The amended contract incorporates a basic fee rate that may vary by class (subject to a performance adjustment). The Adviser or an affiliate pays certain expenses of managing and operating the fund out of each class's management fee. | The fund's sub-advisory agreement with FIL Investments (Japan) Limited was not renewed.
|
| Fidelity, the Fidelity Investments Logo and all other Fidelity trademarks or service marks used herein are trademarks or service marks of FMR LLC. Any third-party marks that are used herein are trademarks or service marks of their respective owners. © 2024 FMR LLC. All rights reserved. |
| | For additional information about the Fund; including its prospectus, financial information, holdings and proxy information, scan the QR code or visit fundresearch.fidelity.com/prospectus/sec 1.9913866.100 325-TSRA-1224 |
| |
| | ANNUAL SHAREHOLDER REPORT | AS OF OCTOBER 31, 2024 | This report describes changes to the Fund that occurred during the reporting period. |
| | Fidelity® Emerging Markets Discovery Fund Fidelity Advisor® Emerging Markets Discovery Fund Class M : FEDTX |
| | | |
This annual shareholder report contains information about Fidelity® Emerging Markets Discovery Fund for the period November 1, 2023 to October 31, 2024. You can find additional information about the Fund at fundresearch.fidelity.com/prospectus/sec. You can also request this information by contacting us at 1-877-208-0098 or by sending an e-mail to fidfunddocuments@fidelity.com.
What were your Fund costs for the last year?(based on hypothetical $10,000 investment)
FUND COST (PREVIOUS YEAR)
| | Costs of a $10,000 investment | Costs paid as a percentage of a $10,000 investment | |
| Class M | $ 160 | 1.50% | |
What affected the Fund's performance this period?
•International stocks achieved a strong gain for the 12 months ending October 31, 2024. Resilient global economic growth and a slowing in the pace of inflation in certain regions, as well as a shift to global monetary easing, contributed to a favorable backdrop, despite persistent geopolitical risk.
•Against this backdrop, an underweight in Emerging Asia, primarily in India, and stock picking and an overweight in Latin America, primarily in Brazil, detracted from the fund's performance versus the MSCI Emerging Markets SMID Index (Net MA) for the fiscal year.
•By sector, security selection was the primary detractor, especially within financials. Also hurting our result were stock picks in health care, primarily within the pharmaceuticals, biotechnology & life sciences industry, and consumer staples.
•The largest individual relative detractor was our stake in Pharmaron Beijing (-48%). The second-largest relative detractor was Hanon Systems (-52%). The stock was not held at period end. Another notable relative detractor was an overweight in Nanya Technology (-34%).
•In contrast, from a regional standpoint, stock selection in Africa, primarily in South Africa, and stock picks and an underweight in the Middle East, primarily in United Arab Emirates, contributed to the fund's relative result.
•By sector, the biggest contributor to performance versus the benchmark was security selection in communication services, primarily within the media & entertainment industry. Stock picks and an underweight in materials and stock selection and an overweight in industrials, primarily within the capital goods industry, also boosted the fund's relative performance.
•The top individual relative contributor was an overweight in International Games System (+243%). This period we decreased our investment in the stock, which was nonetheless one of our largest holdings as of October 31. The second-largest relative contributor was a non-benchmark stake in Hindustan Aeronautics (+136%), where we decreased our investment this period. Another notable relative contributor was an overweight in Bharat Electronics (+111%).
•Notable changes in positioning include increased exposure to Taiwan and South Africa. By sector, meaningful changes in positioning include lower allocations to health care and utilities.
How did the Fund perform over the past 10 years?
CUMULATIVE PERFORMANCE
October 31, 2014 through October 31, 2024.
Initial investment of $10,000 and the current sales charge was paid.
Class M | $9,650 | $8,640 | $9,727 | $12,025 | $9,791 | $11,266 | $11,546 | $15,219 | $11,905 | $13,721 | $15,615 |
MSCI Emerging Markets SMID Cap Index | $10,000 | $8,919 | $9,391 | $11,258 | $9,624 | $10,629 | $10,543 | $14,461 | $10,969 | $12,456 | $15,202 |
MSCI Emerging Markets Index | $10,000 | $8,550 | $9,346 | $11,823 | $10,347 | $11,577 | $12,535 | $14,663 | $10,115 | $11,211 | $14,051 |
| | 2014 | 2015 | 2016 | 2017 | 2018 | 2019 | 2020 | 2021 | 2022 | 2023 | 2024 |
AVERAGE ANNUAL TOTAL RETURNS:| | 1 Year | 5 Year | 10 Year |
| Class M (incl. 3.50% sales charge) | 9.82% | 5.99% | 4.56% |
| Class M (without 3.50% sales charge) | 13.80% | 6.75% | 4.93% |
| MSCI Emerging Markets SMID Cap Index | 22.04% | 7.42% | 4.28% |
| MSCI Emerging Markets Index | 25.33% | 3.95% | 3.46% |
Visit institutional.fidelity.com for more recent performance information. |
The Fund's past performance is not a good predictor of the Fund's future performance. The graph and table do not reflect the deduction of taxes that a shareholder would pay on fund distributions or redemption of fund shares. |
Key Fund Statistics(as of October 31, 2024)
KEY FACTS | | |
| Fund Size | $1,183,237,609 | |
| Number of Holdings | 111 | |
| Total Advisory Fee | $10,611,763 | |
| Portfolio Turnover | 29% | |
What did the Fund invest in?
(as of October 31, 2024)
MARKET SECTORS (% of Fund's net assets) | | |
| Industrials | 21.0 | |
| Consumer Discretionary | 18.3 | |
| Financials | 14.5 | |
| Information Technology | 10.9 | |
| Consumer Staples | 7.8 | |
| Real Estate | 7.4 | |
| Health Care | 4.6 | |
| Materials | 4.6 | |
| Utilities | 3.9 | |
| Energy | 3.3 | |
| Communication Services | 3.2 | |
| |
| Common Stocks | 99.5 |
| Short-Term Investments and Net Other Assets (Liabilities) | 0.5 |
ASSET ALLOCATION (% of Fund's net assets) |
|
|
| China | 21.4 |
| Taiwan | 17.6 |
| India | 13.3 |
| Brazil | 11.7 |
| Korea (South) | 6.2 |
| South Africa | 5.4 |
| Mexico | 4.8 |
| Saudi Arabia | 2.3 |
| Hong Kong | 2.2 |
| Others | 15.1 |
GEOGRAPHIC DIVERSIFICATION (% of Fund's net assets) |
|
| |
|
TOP HOLDINGS(% of Fund's net assets) | | |
| Impala Platinum Holdings Ltd | 1.8 | |
| Shriram Finance Ltd | 1.4 | |
| SITC International Holdings Co Ltd | 1.4 | |
| Bizlink Holding Inc | 1.4 | |
| Yageo Corp | 1.4 | |
| Torrent Pharmaceuticals Ltd | 1.3 | |
| Mr Price Group Ltd | 1.3 | |
| International Games System Co Ltd | 1.3 | |
| Nien Made Enterprise Co Ltd | 1.3 | |
| Coway Co Ltd | 1.3 | |
| | 13.9 | |
How has the Fund changed?
This is a summary of certain changes to the Fund since November 1, 2023. For more complete information, you may review the Fund's next prospectus, which we expect to be available by December 30, 2024 at fundresearch.fidelity.com/prospectus/sec or upon request at 1-877-208-0098 or by sending an e-mail to fidfunddocuments@fidelity.com.
The fees associated with this class changed during the reporting year.The variations in class fees are primarily the result of the following changes: - Management fee
- Operating expenses
- Expense reductions
The fund's transfer agent and pricing & bookkeeping fees were changed to a fixed rate effective December 1, 2023, through February 29, 2024, in anticipation of the transition to a new management fee structure. Effective March 1, 2024, the fund's management contract was amended to incorporate administrative services previously covered under separate services agreements (transfer agent and pricing & bookkeeping). The amended contract incorporates a management fee rate that may vary by class. The Adviser or an affiliate pays certain expenses of managing and operating the fund out of each class's management fee. | The fund's sub-advisory agreement with FIL Investments (Japan) Limited was not renewed
|
| Fidelity, the Fidelity Investments Logo and all other Fidelity trademarks or service marks used herein are trademarks or service marks of FMR LLC. Any third-party marks that are used herein are trademarks or service marks of their respective owners. © 2024 FMR LLC. All rights reserved. |
| | For additional information about the Fund; including its prospectus, financial information, holdings and proxy information, scan the QR code or visit fundresearch.fidelity.com/prospectus/sec 1.9913976.100 2377-TSRA-1224 |
| |
| | ANNUAL SHAREHOLDER REPORT | AS OF OCTOBER 31, 2024 | This report describes changes to the Fund that occurred during the reporting period. |
| | Fidelity® International Small Cap Opportunities Fund Fidelity Advisor® International Small Cap Opportunities Fund Class M : FOPTX |
| | | |
This annual shareholder report contains information about Fidelity® International Small Cap Opportunities Fund for the period November 1, 2023 to October 31, 2024. You can find additional information about the Fund at fundresearch.fidelity.com/prospectus/sec. You can also request this information by contacting us at 1-877-208-0098 or by sending an e-mail to fidfunddocuments@fidelity.com.
What were your Fund costs for the last year?(based on hypothetical $10,000 investment)
FUND COST (PREVIOUS YEAR)
| | Costs of a $10,000 investment | Costs paid as a percentage of a $10,000 investment | |
| Class M | $ 172 | 1.52% | |
What affected the Fund's performance this period?
•International stocks achieved a strong gain for the 12 months ending October 31, 2024. Resilient global economic growth and a slowing in the pace of inflation in certain regions, as well as a shift to global monetary easing, contributed to a favorable backdrop, despite persistent geopolitical risk.
•Against this backdrop, stock picking in Europe ex U.K. and a non-benchmark allocation to the United States contributed to the fund's performance versus the MSCI EAFE Small Cap Index (Net MA) for the fiscal year.
•By sector, security selection was the primary contributor, especially within communication services, where our picks in media & entertainment helped most. Stock selection and an overweight in industrials, primarily within the capital goods industry, and security selection and an underweight in consumer discretionary also boosted the fund's relative performance.
•The fund's non-benchmark stake in Lagercrantz gained 116% and was the top individual relative contributor. The stock was the fund's largest holding. The second-largest relative contributor was an overweight in Addtech (+91%). The company was among the fund's largest holdings. A non-benchmark stake in Kongsberg Gruppen gained approximately 158% and notably helped. The stock was one of the fund's biggest holdings this period.
•In contrast, from a regional standpoint, stock selection in the U.K. and a non-benchmark allocation to Canada detracted from the fund's relative result.
•By sector, the biggest detractor from performance versus the benchmark was an underweight in financials. Also hurting our result was security selection in health care and consumer staples. Lastly, the fund's position in cash detracted.
•The largest individual relative detractor was an overweight in Spectris (-11%). The stock was one of our biggest holdings. The second-largest relative detractor was our non-benchmark stake in Richelieu Hardware (-11%). An overweight in SHO-BOND Holdings (-7%) also detracted.
•Notable changes in positioning include a higher allocation to Europe. By sector, meaningful changes in positioning include higher allocations to multi-sector holdings and materials.
How did the Fund perform over the past 10 years?
CUMULATIVE PERFORMANCE
October 31, 2014 through October 31, 2024.
Initial investment of $10,000 and the current sales charge was paid.
Class M | $9,650 | $10,448 | $10,548 | $13,251 | $12,623 | $14,173 | $15,632 | $21,191 | $13,996 | $14,476 | $18,210 |
MSCI EAFE Small Cap Index | $10,000 | $10,855 | $11,194 | $14,295 | $13,198 | $14,385 | $14,210 | $19,320 | $13,494 | $14,394 | $17,734 |
MSCI EAFE Index | $10,000 | $10,008 | $9,705 | $12,004 | $11,206 | $12,472 | $11,638 | $15,647 | $12,073 | $13,841 | $17,059 |
| | 2014 | 2015 | 2016 | 2017 | 2018 | 2019 | 2020 | 2021 | 2022 | 2023 | 2024 |
AVERAGE ANNUAL TOTAL RETURNS:| | 1 Year | 5 Year | 10 Year |
| Class M (incl. 3.50% sales charge) | 21.39% | 4.39% | 6.18% |
| Class M (without 3.50% sales charge) | 25.80% | 5.14% | 6.56% |
| MSCI EAFE Small Cap Index | 23.20% | 4.27% | 5.90% |
| MSCI EAFE Index | 23.25% | 6.46% | 5.49% |
Visit institutional.fidelity.com for more recent performance information. |
The Fund's past performance is not a good predictor of the Fund's future performance. The graph and table do not reflect the deduction of taxes that a shareholder would pay on fund distributions or redemption of fund shares. |
Key Fund Statistics(as of October 31, 2024)
KEY FACTS | | |
| Fund Size | $1,271,531,943 | |
| Number of Holdings | 111 | |
| Total Advisory Fee | $10,572,915 | |
| Portfolio Turnover | 27% | |
What did the Fund invest in?
(as of October 31, 2024)
MARKET SECTORS (% of Fund's net assets) | | |
| Industrials | 30.2 | |
| Information Technology | 19.8 | |
| Consumer Discretionary | 10.2 | |
| Communication Services | 9.3 | |
| Financials | 6.5 | |
| Health Care | 5.1 | |
| Materials | 4.3 | |
| Consumer Staples | 3.3 | |
| Real Estate | 2.4 | |
| Energy | 1.7 | |
| |
| Common Stocks | 92.8 |
| International Equity Funds | 4.8 |
| Short-Term Investments and Net Other Assets (Liabilities) | 2.4 |
ASSET ALLOCATION (% of Fund's net assets) |
|
|
| Japan | 25.1 |
| Sweden | 14.6 |
| United Kingdom | 14.3 |
| United States | 10.5 |
| Germany | 7.8 |
| Netherlands | 4.9 |
| Canada | 3.6 |
| France | 2.5 |
| Italy | 2.4 |
| Others | 14.3 |
GEOGRAPHIC DIVERSIFICATION (% of Fund's net assets) |
|
| |
|
TOP HOLDINGS(% of Fund's net assets) | | |
| Lagercrantz Group AB B Shares | 5.1 | |
| iShares MSCI EAFE Small-Cap ETF | 4.8 | |
| CTS Eventim AG & Co KGaA | 4.1 | |
| AddTech AB B Shares | 4.1 | |
| Azbil Corp | 3.2 | |
| Morningstar Inc | 2.7 | |
| Spectris PLC | 2.6 | |
| Interpump Group SpA | 2.4 | |
| Aalberts NV | 2.2 | |
| Howden Joinery Group PLC | 2.0 | |
| | 33.2 | |
How has the Fund changed?
This is a summary of certain changes to the Fund since November 1, 2023. For more complete information, you may review the Fund's next prospectus, which we expect to be available by December 30, 2024 at fundresearch.fidelity.com/prospectus/sec or upon request at 1-877-208-0098 or by sending an e-mail to fidfunddocuments@fidelity.com.
The fund's transfer agent and pricing & bookkeeping fees were changed to a fixed rate effective December 1, 2023, through February 29, 2024, in anticipation of the transition to a new management fee structure. Effective March 1, 2024, the fund's management contract was amended to incorporate administrative services previously covered under separate services agreements (transfer agent and pricing & bookkeeping). The amended contract incorporates a basic fee rate that may vary by class (subject to a performance adjustment). The Adviser or an affiliate pays certain expenses of managing and operating the fund out of each class's management fee. | The fund's sub-advisory agreement with FIL Investments (Japan) Limited was not renewed.
|
| Fidelity, the Fidelity Investments Logo and all other Fidelity trademarks or service marks used herein are trademarks or service marks of FMR LLC. Any third-party marks that are used herein are trademarks or service marks of their respective owners. © 2024 FMR LLC. All rights reserved. |
| | For additional information about the Fund; including its prospectus, financial information, holdings and proxy information, scan the QR code or visit fundresearch.fidelity.com/prospectus/sec 1.9913932.100 1484-TSRA-1224 |
| |
| | ANNUAL SHAREHOLDER REPORT | AS OF OCTOBER 31, 2024 | This report describes changes to the Fund that occurred during the reporting period. |
| | Fidelity® Japan Smaller Companies Fund Fidelity® Japan Smaller Companies Fund : FJSCX |
| | | |
This annual shareholder report contains information about Fidelity® Japan Smaller Companies Fund for the period November 1, 2023 to October 31, 2024. You can find additional information about the Fund at fundresearch.fidelity.com/prospectus/sec. You can also request this information by contacting us at 1-800-544-8544 or by sending an e-mail to fidfunddocuments@fidelity.com.
What were your Fund costs for the last year?(based on hypothetical $10,000 investment)
FUND COST (PREVIOUS YEAR)
| | Costs of a $10,000 investment | Costs paid as a percentage of a $10,000 investment | |
| Fidelity® Japan Smaller Companies Fund | $ 97 | 0.87% | |
What affected the Fund's performance this period?
•International stocks achieved a strong gain for the 12 months ending October 31, 2024. Resilient global economic growth and a slowing in the pace of inflation in certain regions, as well as a shift to global monetary easing, contributed to a favorable backdrop, despite persistent geopolitical risk.
•Against this backdrop, security selection was the primary contributor versus the Russell/Nomura Mid Small Cap Japan Index (Gross) for the fiscal year, led by choices in Japan's industrials sector, where our picks in capital goods helped most. Stock picks in information technology, primarily within the technology hardware & equipment industry, and materials also boosted the fund's relative performance.
•The top individual relative contributor was an overweight in SWCC (+166%). The company was the fund's largest holding at period end. A second notable relative contributor was an overweight in IHI (+189%). An overweight in Dexerials (+114%) also helped.
•In contrast, by sector, the biggest detractor from performance versus the benchmark was stock picking in energy. Choices in utilities also hampered the fund's result, as did an overweight in materials.
•The biggest individual relative detractor was an overweight in INPEX (-5%). The stock was the fund's biggest holding during the period; we reduced the position by period end. A second notable relative detractor this period was avoiding MS&AD Insurance Group, a benchmark component that gained 95%. An overweight in SUMCO (-22%) also detracted.
•By sector, meaningful changes in positioning include decreased exposure to communication services and a higher allocation to consumer staples.
How did the Fund perform over the past 10 years?
CUMULATIVE PERFORMANCE
October 31, 2014 through October 31, 2024.
Initial investment of $10,000.
Fidelity® Japan Smaller Companies Fund | $10,000 | $10,693 | $12,344 | $15,268 | $14,548 | $15,744 | $15,949 | $17,455 | $13,623 | $14,953 | $18,219 |
Russell/Nomura Mid-Small Cap™ Index | $10,000 | $11,383 | $12,179 | $14,740 | $13,957 | $14,962 | $14,899 | $17,057 | $12,889 | $14,975 | $17,756 |
MSCI Japan Index | $10,000 | $10,918 | $11,280 | $13,303 | $12,844 | $14,040 | $14,105 | $16,928 | $12,770 | $14,933 | $18,289 |
| | 2014 | 2015 | 2016 | 2017 | 2018 | 2019 | 2020 | 2021 | 2022 | 2023 | 2024 |
AVERAGE ANNUAL TOTAL RETURNS:| | 1 Year | 5 Year | 10 Year |
| Fidelity® Japan Smaller Companies Fund | 21.84% | 2.96% | 6.18% |
| Russell/Nomura Mid-Small Cap™ Index | 18.58% | 3.48% | 5.91% |
| MSCI Japan Index | 22.47% | 5.43% | 6.22% |
Visit www.fidelity.com for more recent performance information. |
The Fund's past performance is not a good predictor of the Fund's future performance. The graph and table do not reflect the deduction of taxes that a shareholder would pay on fund distributions or redemption of fund shares. |
Key Fund Statistics(as of October 31, 2024)
KEY FACTS | | |
| Fund Size | $409,901,323 | |
| Number of Holdings | 83 | |
| Total Advisory Fee | $3,398,714 | |
| Portfolio Turnover | 21% | |
What did the Fund invest in?
(as of October 31, 2024)
MARKET SECTORS (% of Fund's net assets) | | |
| Industrials | 23.1 | |
| Information Technology | 20.0 | |
| Consumer Discretionary | 11.9 | |
| Financials | 11.1 | |
| Materials | 10.9 | |
| Consumer Staples | 8.4 | |
| Energy | 4.0 | |
| Utilities | 3.8 | |
| Health Care | 2.1 | |
| Communication Services | 1.6 | |
| Real Estate | 1.4 | |
| |
| Common Stocks | 98.3 |
| Short-Term Investments and Net Other Assets (Liabilities) | 1.7 |
ASSET ALLOCATION (% of Fund's net assets) |
|
|
| Japan | 98.3 |
| United States | 1.7 |
GEOGRAPHIC DIVERSIFICATION (% of Fund's net assets) |
|
| |
|
TOP HOLDINGS(% of Fund's net assets) | | |
| SWCC Corp | 2.7 | |
| Inpex Corp | 2.6 | |
| Mitsubishi Heavy Industries Ltd | 2.5 | |
| Money Forward Inc | 2.2 | |
| Argo Graphics Inc | 2.2 | |
| Yamato Kogyo Co Ltd | 2.2 | |
| Kansai Electric Power Co Inc/The | 2.1 | |
| Maruwa Co Ltd/Aichi | 1.9 | |
| Sompo Holdings Inc | 1.8 | |
| Koshidaka Holdings Co Ltd | 1.8 | |
| | 22.0 | |
How has the Fund changed?
This is a summary of certain changes to the Fund since November 1, 2023. For more complete information, you may review the Fund's next prospectus, which we expect to be available by December 30, 2024 at fundresearch.fidelity.com/prospectus/sec or upon request at 1-800-544-8544 or by sending an e-mail to fidfunddocuments@fidelity.com.
The fund's transfer agent and pricing & bookkeeping fees were changed to a fixed rate effective December 1, 2023, through February 29, 2024, in anticipation of the transition to a new management fee structure. Effective March 1, 2024, the fund's management contract was amended to incorporate administrative services previously covered under separate services agreements (transfer agent and pricing & bookkeeping). The amended contract incorporates a management fee rate that may vary by class. The Adviser or an affiliate pays certain expenses of managing and operating the fund out of each class's management fee. | The fund's sub-advisory agreement with FIL Investments (Japan) Limited was not renewed.
|
| Fidelity, the Fidelity Investments Logo and all other Fidelity trademarks or service marks used herein are trademarks or service marks of FMR LLC. Any third-party marks that are used herein are trademarks or service marks of their respective owners. © 2024 FMR LLC. All rights reserved. |
| | For additional information about the Fund; including its prospectus, financial information, holdings and proxy information, scan the QR code or visit fundresearch.fidelity.com/prospectus/sec 1.9913895.100 360-TSRA-1224 |
| |
| | ANNUAL SHAREHOLDER REPORT | AS OF OCTOBER 31, 2024 | This report describes changes to the Fund that occurred during the reporting period. |
| | Fidelity® International Growth Fund Fidelity Advisor® International Growth Fund Class Z : FZAJX |
| | | |
This annual shareholder report contains information about Fidelity® International Growth Fund for the period November 1, 2023 to October 31, 2024. You can find additional information about the Fund at fundresearch.fidelity.com/prospectus/sec. You can also request this information by contacting us at 1-877-208-0098 or by sending an e-mail to fidfunddocuments@fidelity.com.
What were your Fund costs for the last year?(based on hypothetical $10,000 investment)
FUND COST (PREVIOUS YEAR)
| | Costs of a $10,000 investment | Costs paid as a percentage of a $10,000 investment | |
| Class Z | $ 89 | 0.79% | |
What affected the Fund's performance this period?
•International stocks achieved a strong gain for the 12 months ending October 31, 2024. Resilient global economic growth and a slowing in the pace of inflation in certain regions, as well as a shift to global monetary easing, contributed to a favorable backdrop, despite persistent geopolitical risk.
•Against this backdrop, stock picks and an overweight in the United States and security selection in the U.K. contributed to the fund's performance versus the MSCI EAFE Growth Index (Net MA) for the fiscal year.
•By sector, an underweight in consumer staples was the primary contributor. Stock selection in materials also boosted the fund's relative performance. Also helping our relative result was an overweight in industrials, primarily within the capital goods industry.
•The fund's non-benchmark stake in Taiwan Semiconductor gained 99% and was the top individual relative contributor. The stock was among our largest holdings. A second notable relative contributor was an overweight in CRH (+83%). The stock was among the fund's biggest holdings. Another notable relative contributor was our non-benchmark stake in GE Vernova (+100%). This was a position we established this period.
•In contrast, from a regional standpoint, an underweight in Asia Pacific ex Japan and a non-benchmark allocation to Canada detracted from the fund's relative result.
•By sector, the biggest detractor from performance versus the benchmark was stock picking in financials. Also hurting our result was security selection in industrials, primarily within the capital goods industry, and energy. Lastly, the fund's position in cash detracted.
•The biggest individual relative detractor was an overweight in Edenred (-38%). Not owning Schneider Electric, a benchmark component that gained approximately 71%, was the second-largest relative detractor. Not owning Commonwealth Bank of Australia, a benchmark component that gained roughly 59%, was another notable relative detractor.
•Notable changes in positioning include increased exposure to Germany and the United Kingdom. By sector, meaningful changes in positioning include decreased exposure to consumer staples and health care.
How did the Fund perform over the past 10 years?
CUMULATIVE PERFORMANCE
October 31, 2014 through October 31, 2024.
Initial investment of $10,000.
Class Z | $10,000 | $10,352 | $10,069 | $12,519 | $11,804 | $14,383 | $15,534 | $20,435 | $14,778 | $16,365 | $20,543 |
MSCI EAFE Growth Index | $10,000 | $10,428 | $10,108 | $12,517 | $11,783 | $13,766 | $14,502 | $18,876 | $13,312 | $14,769 | $18,234 |
MSCI EAFE Index | $10,000 | $10,008 | $9,705 | $12,004 | $11,206 | $12,472 | $11,638 | $15,647 | $12,073 | $13,841 | $17,059 |
| | 2014 | 2015 | 2016 | 2017 | 2018 | 2019 | 2020 | 2021 | 2022 | 2023 | 2024 |
AVERAGE ANNUAL TOTAL RETURNS:| | 1 Year | 5 Year | 10 Year |
| Class Z | 25.53% | 7.39% | 7.46% |
| MSCI EAFE Growth Index | 23.46% | 5.78% | 6.19% |
| MSCI EAFE Index | 23.25% | 6.46% | 5.49% |
Visit institutional.fidelity.com for more recent performance information. |
The Fund's past performance is not a good predictor of the Fund's future performance. The graph and table do not reflect the deduction of taxes that a shareholder would pay on fund distributions or redemption of fund shares. |
Key Fund Statistics(as of October 31, 2024)
KEY FACTS | | |
| Fund Size | $6,046,615,302 | |
| Number of Holdings | 73 | |
| Total Advisory Fee | $43,926,728 | |
| Portfolio Turnover | 31% | |
What did the Fund invest in?
(as of October 31, 2024)
MARKET SECTORS (% of Fund's net assets) | | |
| Industrials | 31.9 | |
| Information Technology | 19.7 | |
| Financials | 16.0 | |
| Materials | 10.7 | |
| Consumer Discretionary | 10.3 | |
| Health Care | 6.1 | |
| Consumer Staples | 1.1 | |
| Energy | 0.7 | |
| Communication Services | 0.5 | |
| |
| Common Stocks | 96.7 |
| Preferred Stocks | 0.3 |
| Short-Term Investments and Net Other Assets (Liabilities) | 3.0 |
ASSET ALLOCATION (% of Fund's net assets) |
|
|
| United States | 29.1 |
| United Kingdom | 11.7 |
| France | 11.2 |
| Japan | 9.6 |
| Sweden | 7.5 |
| Germany | 6.6 |
| Netherlands | 6.1 |
| Denmark | 5.1 |
| Taiwan | 3.3 |
| Others | 9.8 |
GEOGRAPHIC DIVERSIFICATION (% of Fund's net assets) |
|
| |
|
TOP HOLDINGS(% of Fund's net assets) | | |
| SAP SE | 5.3 | |
| Novo Nordisk A/S Series B | 5.1 | |
| ASML Holding NV | 4.8 | |
| Safran SA | 4.0 | |
| CRH PLC | 3.9 | |
| Linde PLC | 3.8 | |
| Atlas Copco AB A Shares | 3.4 | |
| Taiwan Semiconductor Manufacturing Co Ltd | 3.3 | |
| Recruit Holdings Co Ltd | 3.0 | |
| LVMH Moet Hennessy Louis Vuitton SE | 2.7 | |
| | 39.3 | |
How has the Fund changed?
This is a summary of certain changes to the Fund since November 1, 2023. For more complete information, you may review the Fund's next prospectus, which we expect to be available by December 30, 2024 at fundresearch.fidelity.com/prospectus/sec or upon request at 1-877-208-0098 or by sending an e-mail to fidfunddocuments@fidelity.com.
The fund's transfer agent and pricing & bookkeeping fees were changed to a fixed rate effective December 1, 2023, through February 29, 2024, in anticipation of the transition to a new management fee structure. Effective March 1, 2024, the fund's management contract was amended to incorporate administrative services previously covered under separate services agreements (transfer agent and pricing & bookkeeping). The amended contract incorporates a basic fee rate that may vary by class (subject to a performance adjustment). The Adviser or an affiliate pays certain expenses of managing and operating the fund out of each class's management fee. | The fund's sub-advisory agreement with FIL Investments (Japan) Limited was not renewed.
|
| Fidelity, the Fidelity Investments Logo and all other Fidelity trademarks or service marks used herein are trademarks or service marks of FMR LLC. Any third-party marks that are used herein are trademarks or service marks of their respective owners. © 2024 FMR LLC. All rights reserved. |
| | For additional information about the Fund; including its prospectus, financial information, holdings and proxy information, scan the QR code or visit fundresearch.fidelity.com/prospectus/sec 1.9913953.100 2535-TSRA-1224 |
| |
| | ANNUAL SHAREHOLDER REPORT | AS OF OCTOBER 31, 2024 | This report describes changes to the Fund that occurred during the reporting period. |
| | Fidelity® China Region Fund Fidelity Advisor® China Region Fund Class I : FHKIX |
| | | |
This annual shareholder report contains information about Fidelity® China Region Fund for the period November 1, 2023 to October 31, 2024. You can find additional information about the Fund at fundresearch.fidelity.com/prospectus/sec. You can also request this information by contacting us at 1-877-208-0098 or by sending an e-mail to fidfunddocuments@fidelity.com.
What were your Fund costs for the last year?(based on hypothetical $10,000 investment)
FUND COST (PREVIOUS YEAR)
| | Costs of a $10,000 investment | Costs paid as a percentage of a $10,000 investment | |
| Class I | $ 106 | 0.91% | |
What affected the Fund's performance this period?
•International stocks achieved a strong gain for the 12 months ending October 31, 2024. Resilient global economic growth and a slowing in the pace of inflation in certain regions, as well as a shift to global monetary easing, contributed to a favorable backdrop, despite persistent geopolitical risk.
•After trailing for most of the period, stocks in the China region got a boost in September from the Chinese government's announcement of aggressive monetary stimulus measures.
•Against this backdrop, picks in Taiwan had, by far, the biggest positive impact on the fund's performance versus the MSCI Golden Dragon (Net MA) Index for the fiscal year.
•By sector, security selection in information technology was the primary contributor, where our stock picks in semiconductors & semiconductor equipment helped most. Stock picks in materials and consumer discretionary also boosted the fund's relative performance.
•The top individual relative contributor was an overweight in Taiwan Semiconductor (+101%). The stock was the fund's biggest holding. A non-benchmark stake in Sea gained roughly 118% and was a second notable relative contributor. An overweight in Trip.com (+89%) also contributed. The stock was among our largest holdings.
•In contrast, from a geographical standpoint, an underweight in Taiwan, stock selection in Hong Kong and non-benchmark exposure to South Korea detracted from the fund's relative result.
•By sector, the biggest detractor from performance versus the benchmark was security selection in financials, primarily within the insurance industry. Stock selection and an overweight in health care also hampered the fund's result, as did picks in energy. Lastly, the fund's position in cash detracted.
•The biggest individual relative detractor was an overweight in NetEase (-25%). The company was among our largest holdings this period. The second-largest relative detractor was our non-benchmark stake in Samsung Electronics (-10%). Another notable relative detractor was our stake in Asymchem Laboratories (-54%), which was not held by the fund at period end.
•Notable changes in positioning include increased exposure to Taiwan and a lower allocation to Hong Kong. By sector, meaningful changes in positioning include lower allocations to health care and consumer staples.
How did the Fund perform over the past 10 years?
CUMULATIVE PERFORMANCE
October 31, 2014 through October 31, 2024.
Initial investment of $10,000.
Class I | $10,000 | $9,886 | $9,902 | $13,478 | $11,371 | $14,295 | $20,429 | $21,237 | $11,670 | $14,518 | $19,331 |
MSCI Golden Dragon Index | $10,000 | $9,667 | $10,337 | $13,689 | $11,813 | $13,628 | $17,249 | $17,905 | $10,248 | $12,405 | $16,411 |
MSCI Emerging Markets Index | $10,000 | $8,550 | $9,346 | $11,823 | $10,347 | $11,577 | $12,535 | $14,663 | $10,115 | $11,211 | $14,051 |
| | 2014 | 2015 | 2016 | 2017 | 2018 | 2019 | 2020 | 2021 | 2022 | 2023 | 2024 |
AVERAGE ANNUAL TOTAL RETURNS:| | 1 Year | 5 Year | 10 Year |
| Class I | 33.15% | 6.22% | 6.81% |
| MSCI Golden Dragon Index | 32.29% | 3.79% | 5.08% |
| MSCI Emerging Markets Index | 25.33% | 3.95% | 3.46% |
Visit institutional.fidelity.com for more recent performance information. |
The Fund's past performance is not a good predictor of the Fund's future performance. The graph and table do not reflect the deduction of taxes that a shareholder would pay on fund distributions or redemption of fund shares. |
Key Fund Statistics(as of October 31, 2024)
KEY FACTS | | |
| Fund Size | $1,209,670,065 | |
| Number of Holdings | 86 | |
| Total Advisory Fee | $8,069,000 | |
| Portfolio Turnover | 30% | |
What did the Fund invest in?
(as of October 31, 2024)
MARKET SECTORS (% of Fund's net assets) | | |
| Information Technology | 31.3 | |
| Consumer Discretionary | 23.9 | |
| Communication Services | 13.8 | |
| Financials | 13.1 | |
| Industrials | 4.2 | |
| Health Care | 3.3 | |
| Materials | 3.2 | |
| Consumer Staples | 2.6 | |
| Real Estate | 1.0 | |
| Energy | 0.5 | |
| |
| Common Stocks | 94.9 |
| Preferred Stocks | 2.0 |
| Short-Term Investments and Net Other Assets (Liabilities) | 3.1 |
ASSET ALLOCATION (% of Fund's net assets) |
|
|
| China | 57.8 |
| Taiwan | 30.2 |
| Hong Kong | 5.0 |
| United States | 3.6 |
| Korea (South) | 1.3 |
| Singapore | 0.9 |
| Macau | 0.5 |
| France | 0.4 |
| Japan | 0.3 |
GEOGRAPHIC DIVERSIFICATION (% of Fund's net assets) |
|
| |
|
TOP HOLDINGS(% of Fund's net assets) | | |
| Taiwan Semiconductor Manufacturing Co Ltd | 22.8 | |
| Tencent Holdings Ltd | 10.3 | |
| Alibaba Group Holding Ltd | 5.5 | |
| Meituan B Shares | 4.0 | |
| PDD Holdings Inc Class A ADR | 3.4 | |
| China Construction Bank Corp H Shares | 3.1 | |
| AIA Group Ltd | 3.0 | |
| Hon Hai Precision Industry Co Ltd | 2.4 | |
| Zijin Mining Group Co Ltd H Shares | 2.1 | |
| JD.com Inc A Shares | 1.5 | |
| | 58.1 | |
How has the Fund changed?
This is a summary of certain changes to the Fund since November 1, 2023. For more complete information, you may review the Fund's next prospectus, which we expect to be available by December 30, 2024 at fundresearch.fidelity.com/prospectus/sec or upon request at 1-877-208-0098 or by sending an e-mail to fidfunddocuments@fidelity.com.
The fund's transfer agent and pricing & bookkeeping fees were changed to a fixed rate effective December 1, 2023, through February 29, 2024, in anticipation of the transition to a new management fee structure. Effective March 1, 2024, the fund's management contract was amended to incorporate administrative services previously covered under separate services agreements (transfer agent and pricing & bookkeeping). The amended contract incorporates a management fee rate that may vary by class. The Adviser or an affiliate pays certain expenses of managing and operating the fund out of each class's management fee. | The fund's sub-advisory agreement with FIL Investments (Japan) Limited was not renewed.
|
| Fidelity, the Fidelity Investments Logo and all other Fidelity trademarks or service marks used herein are trademarks or service marks of FMR LLC. Any third-party marks that are used herein are trademarks or service marks of their respective owners. © 2024 FMR LLC. All rights reserved. |
| | For additional information about the Fund; including its prospectus, financial information, holdings and proxy information, scan the QR code or visit fundresearch.fidelity.com/prospectus/sec 1.9913892.100 2068-TSRA-1224 |
| |
| | ANNUAL SHAREHOLDER REPORT | AS OF OCTOBER 31, 2024 | This report describes changes to the Fund that occurred during the reporting period. |
| | Fidelity® International Value Fund Fidelity® International Value Fund : FIVLX |
| | | |
This annual shareholder report contains information about Fidelity® International Value Fund for the period November 1, 2023 to October 31, 2024. You can find additional information about the Fund at fundresearch.fidelity.com/prospectus/sec. You can also request this information by contacting us at 1-800-544-8544 or by sending an e-mail to fidfunddocuments@fidelity.com.
What were your Fund costs for the last year?(based on hypothetical $10,000 investment)
FUND COST (PREVIOUS YEAR)
| | Costs of a $10,000 investment | Costs paid as a percentage of a $10,000 investment | |
| Fidelity® International Value Fund | $ 99 | 0.89% | |
What affected the Fund's performance this period?
•International stocks achieved a strong gain for the 12 months ending October 31, 2024. Resilient global economic growth and a slowing in the pace of inflation in certain regions, as well as a shift to global monetary easing, contributed to a favorable backdrop, despite persistent geopolitical risk.
•Against this backdrop, stock selection in Japan and security selection and an overweight in the United States contributed to the fund's performance versus the MSCI EAFE Value Index (Net MA) for the fiscal year.
•By sector, security selection was the primary contributor, especially within industrials, where our stock picks in capital goods helped most. Security selection in materials also boosted the fund's relative performance. Also contributing to our result was an overweight in financials.
•The top individual relative contributor was an overweight in Hitachi (+110%). The company was among the fund's biggest holdings. A second notable relative contributor was an overweight in Mitsubishi Heavy Industries (+162%). This was a stake we established this period. Another notable relative contributor was our non-benchmark stake in Rheinmetall (+82%). The stock was among our biggest holdings this period.
•In contrast, from a regional standpoint, stock picks in the U.K. and Asia Pacific ex Japan, primarily in Australia, detracted from the fund's relative result.
•By sector, the biggest detractor from performance versus the benchmark was stock selection in information technology. Stock picking in financials also hampered the fund's result. Also hurting our result was an overweight in energy.
•The largest individual relative detractor was an overweight in BHP (+5%). The stock was among the fund's biggest holdings. A second notable relative detractor was an overweight in GSK (-11%). This was a stake we established this period. A non-benchmark stake in Prudential returned -19% and notably hurt.
•Notable changes in positioning include decreased exposure to France and Australia. By sector, meaningful changes in positioning include lower allocations to consumer discretionary and energy.
How did the Fund perform over the past 10 years?
CUMULATIVE PERFORMANCE
October 31, 2014 through October 31, 2024.
Initial investment of $10,000.
Fidelity® International Value Fund | $10,000 | $9,959 | $9,492 | $11,374 | $10,356 | $10,838 | $9,353 | $13,383 | $11,080 | $13,071 | $16,153 |
MSCI EAFE Value Index | $10,000 | $9,591 | $9,294 | $11,477 | $10,621 | $11,237 | $9,189 | $12,742 | $10,687 | $12,659 | $15,588 |
MSCI EAFE Index | $10,000 | $10,008 | $9,705 | $12,004 | $11,206 | $12,472 | $11,638 | $15,647 | $12,073 | $13,841 | $17,059 |
| | 2014 | 2015 | 2016 | 2017 | 2018 | 2019 | 2020 | 2021 | 2022 | 2023 | 2024 |
AVERAGE ANNUAL TOTAL RETURNS:| | 1 Year | 5 Year | 10 Year |
| Fidelity® International Value Fund | 23.58% | 8.31% | 4.91% |
| MSCI EAFE Value Index | 23.14% | 6.76% | 4.54% |
| MSCI EAFE Index | 23.25% | 6.46% | 5.49% |
Visit www.fidelity.com for more recent performance information. |
The Fund's past performance is not a good predictor of the Fund's future performance. The graph and table do not reflect the deduction of taxes that a shareholder would pay on fund distributions or redemption of fund shares. |
Key Fund Statistics(as of October 31, 2024)
KEY FACTS | | |
| Fund Size | $1,472,284,197 | |
| Number of Holdings | 101 | |
| Total Advisory Fee | $8,618,481 | |
| Portfolio Turnover | 29% | |
What did the Fund invest in?
(as of October 31, 2024)
MARKET SECTORS (% of Fund's net assets) | | |
| Financials | 35.1 | |
| Industrials | 18.0 | |
| Materials | 13.0 | |
| Energy | 8.4 | |
| Consumer Discretionary | 5.0 | |
| Health Care | 4.7 | |
| Information Technology | 4.3 | |
| Consumer Staples | 3.9 | |
| Communication Services | 3.0 | |
| Real Estate | 0.9 | |
| Utilities | 0.6 | |
| |
| Common Stocks | 96.5 |
| Preferred Stocks | 0.4 |
| Short-Term Investments and Net Other Assets (Liabilities) | 3.1 |
ASSET ALLOCATION (% of Fund's net assets) |
|
|
| Japan | 22.8 |
| United Kingdom | 14.8 |
| United States | 13.1 |
| Germany | 11.4 |
| France | 9.8 |
| Australia | 6.1 |
| Italy | 5.0 |
| Spain | 3.4 |
| Switzerland | 3.3 |
| Others | 10.3 |
GEOGRAPHIC DIVERSIFICATION (% of Fund's net assets) |
|
| |
|
TOP HOLDINGS(% of Fund's net assets) | | |
| Shell PLC ADR | 3.7 | |
| Hitachi Ltd | 2.8 | |
| Banco Santander SA | 2.4 | |
| AXA SA | 2.3 | |
| CRH PLC | 2.2 | |
| BAE Systems PLC | 2.1 | |
| BHP Group Ltd | 2.1 | |
| Rheinmetall AG | 2.1 | |
| TotalEnergies SE | 2.0 | |
| Mitsubishi UFJ Financial Group Inc | 2.0 | |
| | 23.7 | |
How has the Fund changed?
This is a summary of certain changes to the Fund since November 1, 2023. For more complete information, you may review the Fund's next prospectus, which we expect to be available by December 30, 2024 at fundresearch.fidelity.com/prospectus/sec or upon request at 1-800-544-8544 or by sending an e-mail to fidfunddocuments@fidelity.com.
The fees associated with this class changed during the reporting year.The variations in class fees are primarily the result of the following changes: - Management fee
- Operating expenses
- Performance adjustment fee
The fund's transfer agent and pricing & bookkeeping fees were changed to a fixed rate effective December 1, 2023, through February 29, 2024, in anticipation of the transition to a new management fee structure. Effective March 1, 2024, the fund's management contract was amended to incorporate administrative services previously covered under separate services agreements (transfer agent and pricing & bookkeeping). The amended contract incorporates a basic fee rate that may vary by class (subject to a performance adjustment). The Adviser or an affiliate pays certain expenses of managing and operating the fund out of each class's management fee. | The fund's sub-advisory agreement with FIL Investments (Japan) Limited was not renewed.
|
| Fidelity, the Fidelity Investments Logo and all other Fidelity trademarks or service marks used herein are trademarks or service marks of FMR LLC. Any third-party marks that are used herein are trademarks or service marks of their respective owners. © 2024 FMR LLC. All rights reserved. |
| | For additional information about the Fund; including its prospectus, financial information, holdings and proxy information, scan the QR code or visit fundresearch.fidelity.com/prospectus/sec 1.9913936.100 1597-TSRA-1224 |
| |
| | ANNUAL SHAREHOLDER REPORT | AS OF OCTOBER 31, 2024 | This report describes changes to the Fund that occurred during the reporting period. |
| | Fidelity® International Small Cap Opportunities Fund Fidelity Advisor® International Small Cap Opportunities Fund Class C : FOPCX |
| | | |
This annual shareholder report contains information about Fidelity® International Small Cap Opportunities Fund for the period November 1, 2023 to October 31, 2024. You can find additional information about the Fund at fundresearch.fidelity.com/prospectus/sec. You can also request this information by contacting us at 1-877-208-0098 or by sending an e-mail to fidfunddocuments@fidelity.com.
What were your Fund costs for the last year?(based on hypothetical $10,000 investment)
FUND COST (PREVIOUS YEAR)
| | Costs of a $10,000 investment | Costs paid as a percentage of a $10,000 investment | |
| Class C | $ 227 | 2.02% | |
What affected the Fund's performance this period?
•International stocks achieved a strong gain for the 12 months ending October 31, 2024. Resilient global economic growth and a slowing in the pace of inflation in certain regions, as well as a shift to global monetary easing, contributed to a favorable backdrop, despite persistent geopolitical risk.
•Against this backdrop, stock picking in Europe ex U.K. and a non-benchmark allocation to the United States contributed to the fund's performance versus the MSCI EAFE Small Cap Index (Net MA) for the fiscal year.
•By sector, security selection was the primary contributor, especially within communication services, where our picks in media & entertainment helped most. Stock selection and an overweight in industrials, primarily within the capital goods industry, and security selection and an underweight in consumer discretionary also boosted the fund's relative performance.
•The fund's non-benchmark stake in Lagercrantz gained 116% and was the top individual relative contributor. The stock was the fund's largest holding. The second-largest relative contributor was an overweight in Addtech (+91%). The company was among the fund's largest holdings. A non-benchmark stake in Kongsberg Gruppen gained approximately 158% and notably helped. The stock was one of the fund's biggest holdings this period.
•In contrast, from a regional standpoint, stock selection in the U.K. and a non-benchmark allocation to Canada detracted from the fund's relative result.
•By sector, the biggest detractor from performance versus the benchmark was an underweight in financials. Also hurting our result was security selection in health care and consumer staples. Lastly, the fund's position in cash detracted.
•The largest individual relative detractor was an overweight in Spectris (-11%). The stock was one of our biggest holdings. The second-largest relative detractor was our non-benchmark stake in Richelieu Hardware (-11%). An overweight in SHO-BOND Holdings (-7%) also detracted.
•Notable changes in positioning include a higher allocation to Europe. By sector, meaningful changes in positioning include higher allocations to multi-sector holdings and materials.
How did the Fund perform over the past 10 years?
CUMULATIVE PERFORMANCE
October 31, 2014 through October 31, 2024.
Initial investment of $10,000.
Class C | $10,000 | $10,779 | $10,826 | $13,534 | $12,832 | $14,338 | $15,732 | $21,221 | $13,945 | $14,467 | $18,238 |
MSCI EAFE Small Cap Index | $10,000 | $10,855 | $11,194 | $14,295 | $13,198 | $14,385 | $14,210 | $19,320 | $13,494 | $14,394 | $17,734 |
MSCI EAFE Index | $10,000 | $10,008 | $9,705 | $12,004 | $11,206 | $12,472 | $11,638 | $15,647 | $12,073 | $13,841 | $17,059 |
| | 2014 | 2015 | 2016 | 2017 | 2018 | 2019 | 2020 | 2021 | 2022 | 2023 | 2024 |
AVERAGE ANNUAL TOTAL RETURNS:| | 1 Year | 5 Year | 10 Year |
| Class C (incl. contingent deferred sales charge) | 24.11% | 4.61% | 6.19% |
| Class C | 25.11% | 4.61% | 6.19% |
| MSCI EAFE Small Cap Index | 23.20% | 4.27% | 5.90% |
| MSCI EAFE Index | 23.25% | 6.46% | 5.49% |
Visit institutional.fidelity.com for more recent performance information. |
The Fund's past performance is not a good predictor of the Fund's future performance. The graph and table do not reflect the deduction of taxes that a shareholder would pay on fund distributions or redemption of fund shares. |
Key Fund Statistics(as of October 31, 2024)
KEY FACTS | | |
| Fund Size | $1,271,531,943 | |
| Number of Holdings | 111 | |
| Total Advisory Fee | $10,572,915 | |
| Portfolio Turnover | 27% | |
What did the Fund invest in?
(as of October 31, 2024)
MARKET SECTORS (% of Fund's net assets) | | |
| Industrials | 30.2 | |
| Information Technology | 19.8 | |
| Consumer Discretionary | 10.2 | |
| Communication Services | 9.3 | |
| Financials | 6.5 | |
| Health Care | 5.1 | |
| Materials | 4.3 | |
| Consumer Staples | 3.3 | |
| Real Estate | 2.4 | |
| Energy | 1.7 | |
| |
| Common Stocks | 92.8 |
| International Equity Funds | 4.8 |
| Short-Term Investments and Net Other Assets (Liabilities) | 2.4 |
ASSET ALLOCATION (% of Fund's net assets) |
|
|
| Japan | 25.1 |
| Sweden | 14.6 |
| United Kingdom | 14.3 |
| United States | 10.5 |
| Germany | 7.8 |
| Netherlands | 4.9 |
| Canada | 3.6 |
| France | 2.5 |
| Italy | 2.4 |
| Others | 14.3 |
GEOGRAPHIC DIVERSIFICATION (% of Fund's net assets) |
|
| |
|
TOP HOLDINGS(% of Fund's net assets) | | |
| Lagercrantz Group AB B Shares | 5.1 | |
| iShares MSCI EAFE Small-Cap ETF | 4.8 | |
| CTS Eventim AG & Co KGaA | 4.1 | |
| AddTech AB B Shares | 4.1 | |
| Azbil Corp | 3.2 | |
| Morningstar Inc | 2.7 | |
| Spectris PLC | 2.6 | |
| Interpump Group SpA | 2.4 | |
| Aalberts NV | 2.2 | |
| Howden Joinery Group PLC | 2.0 | |
| | 33.2 | |
How has the Fund changed?
This is a summary of certain changes to the Fund since November 1, 2023. For more complete information, you may review the Fund's next prospectus, which we expect to be available by December 30, 2024 at fundresearch.fidelity.com/prospectus/sec or upon request at 1-877-208-0098 or by sending an e-mail to fidfunddocuments@fidelity.com.
The fees associated with this class changed during the reporting year.The variations in class fees are primarily the result of the following changes: - Management fee
- Performance adjustment fee
- Operating expenses
The fund's transfer agent and pricing & bookkeeping fees were changed to a fixed rate effective December 1, 2023, through February 29, 2024, in anticipation of the transition to a new management fee structure. Effective March 1, 2024, the fund's management contract was amended to incorporate administrative services previously covered under separate services agreements (transfer agent and pricing & bookkeeping). The amended contract incorporates a basic fee rate that may vary by class (subject to a performance adjustment). The Adviser or an affiliate pays certain expenses of managing and operating the fund out of each class's management fee. | The fund's sub-advisory agreement with FIL Investments (Japan) Limited was not renewed.
|
| Fidelity, the Fidelity Investments Logo and all other Fidelity trademarks or service marks used herein are trademarks or service marks of FMR LLC. Any third-party marks that are used herein are trademarks or service marks of their respective owners. © 2024 FMR LLC. All rights reserved. |
| | For additional information about the Fund; including its prospectus, financial information, holdings and proxy information, scan the QR code or visit fundresearch.fidelity.com/prospectus/sec 1.9913931.100 1483-TSRA-1224 |
| |
| | ANNUAL SHAREHOLDER REPORT | AS OF OCTOBER 31, 2024 | This report describes changes to the Fund that occurred during the reporting period. |
| | Fidelity® International Small Cap Opportunities Fund Fidelity Advisor® International Small Cap Opportunities Fund Class A : FOPAX |
| | | |
This annual shareholder report contains information about Fidelity® International Small Cap Opportunities Fund for the period November 1, 2023 to October 31, 2024. You can find additional information about the Fund at fundresearch.fidelity.com/prospectus/sec. You can also request this information by contacting us at 1-877-208-0098 or by sending an e-mail to fidfunddocuments@fidelity.com.
What were your Fund costs for the last year?(based on hypothetical $10,000 investment)
FUND COST (PREVIOUS YEAR)
| | Costs of a $10,000 investment | Costs paid as a percentage of a $10,000 investment | |
| Class A | $ 143 | 1.26% | |
What affected the Fund's performance this period?
•International stocks achieved a strong gain for the 12 months ending October 31, 2024. Resilient global economic growth and a slowing in the pace of inflation in certain regions, as well as a shift to global monetary easing, contributed to a favorable backdrop, despite persistent geopolitical risk.
•Against this backdrop, stock picking in Europe ex U.K. and a non-benchmark allocation to the United States contributed to the fund's performance versus the MSCI EAFE Small Cap Index (Net MA) for the fiscal year.
•By sector, security selection was the primary contributor, especially within communication services, where our picks in media & entertainment helped most. Stock selection and an overweight in industrials, primarily within the capital goods industry, and security selection and an underweight in consumer discretionary also boosted the fund's relative performance.
•The fund's non-benchmark stake in Lagercrantz gained 116% and was the top individual relative contributor. The stock was the fund's largest holding. The second-largest relative contributor was an overweight in Addtech (+91%). The company was among the fund's largest holdings. A non-benchmark stake in Kongsberg Gruppen gained approximately 158% and notably helped. The stock was one of the fund's biggest holdings this period.
•In contrast, from a regional standpoint, stock selection in the U.K. and a non-benchmark allocation to Canada detracted from the fund's relative result.
•By sector, the biggest detractor from performance versus the benchmark was an underweight in financials. Also hurting our result was security selection in health care and consumer staples. Lastly, the fund's position in cash detracted.
•The largest individual relative detractor was an overweight in Spectris (-11%). The stock was one of our biggest holdings. The second-largest relative detractor was our non-benchmark stake in Richelieu Hardware (-11%). An overweight in SHO-BOND Holdings (-7%) also detracted.
•Notable changes in positioning include a higher allocation to Europe. By sector, meaningful changes in positioning include higher allocations to multi-sector holdings and materials.
How did the Fund perform over the past 10 years?
CUMULATIVE PERFORMANCE
October 31, 2014 through October 31, 2024.
Initial investment of $10,000 and the current sales charge was paid.
Class A | $9,425 | $10,238 | $10,371 | $13,067 | $12,482 | $14,056 | $15,544 | $21,125 | $13,986 | $14,510 | $18,291 |
MSCI EAFE Small Cap Index | $10,000 | $10,855 | $11,194 | $14,295 | $13,198 | $14,385 | $14,210 | $19,320 | $13,494 | $14,394 | $17,734 |
MSCI EAFE Index | $10,000 | $10,008 | $9,705 | $12,004 | $11,206 | $12,472 | $11,638 | $15,647 | $12,073 | $13,841 | $17,059 |
| | 2014 | 2015 | 2016 | 2017 | 2018 | 2019 | 2020 | 2021 | 2022 | 2023 | 2024 |
AVERAGE ANNUAL TOTAL RETURNS:| | 1 Year | 5 Year | 10 Year |
| Class A (incl. 5.75% sales charge) | 18.81% | 4.17% | 6.22% |
| Class A (without 5.75% sales charge) | 26.06% | 5.41% | 6.86% |
| MSCI EAFE Small Cap Index | 23.20% | 4.27% | 5.90% |
| MSCI EAFE Index | 23.25% | 6.46% | 5.49% |
Visit institutional.fidelity.com for more recent performance information. |
The Fund's past performance is not a good predictor of the Fund's future performance. The graph and table do not reflect the deduction of taxes that a shareholder would pay on fund distributions or redemption of fund shares. |
Key Fund Statistics(as of October 31, 2024)
KEY FACTS | | |
| Fund Size | $1,271,531,943 | |
| Number of Holdings | 111 | |
| Total Advisory Fee | $10,572,915 | |
| Portfolio Turnover | 27% | |
What did the Fund invest in?
(as of October 31, 2024)
MARKET SECTORS (% of Fund's net assets) | | |
| Industrials | 30.2 | |
| Information Technology | 19.8 | |
| Consumer Discretionary | 10.2 | |
| Communication Services | 9.3 | |
| Financials | 6.5 | |
| Health Care | 5.1 | |
| Materials | 4.3 | |
| Consumer Staples | 3.3 | |
| Real Estate | 2.4 | |
| Energy | 1.7 | |
| |
| Common Stocks | 92.8 |
| International Equity Funds | 4.8 |
| Short-Term Investments and Net Other Assets (Liabilities) | 2.4 |
ASSET ALLOCATION (% of Fund's net assets) |
|
|
| Japan | 25.1 |
| Sweden | 14.6 |
| United Kingdom | 14.3 |
| United States | 10.5 |
| Germany | 7.8 |
| Netherlands | 4.9 |
| Canada | 3.6 |
| France | 2.5 |
| Italy | 2.4 |
| Others | 14.3 |
GEOGRAPHIC DIVERSIFICATION (% of Fund's net assets) |
|
| |
|
TOP HOLDINGS(% of Fund's net assets) | | |
| Lagercrantz Group AB B Shares | 5.1 | |
| iShares MSCI EAFE Small-Cap ETF | 4.8 | |
| CTS Eventim AG & Co KGaA | 4.1 | |
| AddTech AB B Shares | 4.1 | |
| Azbil Corp | 3.2 | |
| Morningstar Inc | 2.7 | |
| Spectris PLC | 2.6 | |
| Interpump Group SpA | 2.4 | |
| Aalberts NV | 2.2 | |
| Howden Joinery Group PLC | 2.0 | |
| | 33.2 | |
How has the Fund changed?
This is a summary of certain changes to the Fund since November 1, 2023. For more complete information, you may review the Fund's next prospectus, which we expect to be available by December 30, 2024 at fundresearch.fidelity.com/prospectus/sec or upon request at 1-877-208-0098 or by sending an e-mail to fidfunddocuments@fidelity.com.
The fees associated with this class changed during the reporting year.The variations in class fees are primarily the result of the following changes: - Management fee
- Performance adjustment fee
- Operating expenses
The fund's transfer agent and pricing & bookkeeping fees were changed to a fixed rate effective December 1, 2023, through February 29, 2024, in anticipation of the transition to a new management fee structure. Effective March 1, 2024, the fund's management contract was amended to incorporate administrative services previously covered under separate services agreements (transfer agent and pricing & bookkeeping). The amended contract incorporates a basic fee rate that may vary by class (subject to a performance adjustment). The Adviser or an affiliate pays certain expenses of managing and operating the fund out of each class's management fee. | The fund's sub-advisory agreement with FIL Investments (Japan) Limited was not renewed.
|
| Fidelity, the Fidelity Investments Logo and all other Fidelity trademarks or service marks used herein are trademarks or service marks of FMR LLC. Any third-party marks that are used herein are trademarks or service marks of their respective owners. © 2024 FMR LLC. All rights reserved. |
| | For additional information about the Fund; including its prospectus, financial information, holdings and proxy information, scan the QR code or visit fundresearch.fidelity.com/prospectus/sec 1.9913930.100 1481-TSRA-1224 |
| |
| | ANNUAL SHAREHOLDER REPORT | AS OF OCTOBER 31, 2024 | This report describes changes to the Fund that occurred during the reporting period. |
| | Fidelity® China Region Fund Fidelity Advisor® China Region Fund Class A : FHKAX |
| | | |
This annual shareholder report contains information about Fidelity® China Region Fund for the period November 1, 2023 to October 31, 2024. You can find additional information about the Fund at fundresearch.fidelity.com/prospectus/sec. You can also request this information by contacting us at 1-877-208-0098 or by sending an e-mail to fidfunddocuments@fidelity.com.
What were your Fund costs for the last year?(based on hypothetical $10,000 investment)
FUND COST (PREVIOUS YEAR)
| | Costs of a $10,000 investment | Costs paid as a percentage of a $10,000 investment | |
| Class A | $ 139 | 1.19% | |
What affected the Fund's performance this period?
•International stocks achieved a strong gain for the 12 months ending October 31, 2024. Resilient global economic growth and a slowing in the pace of inflation in certain regions, as well as a shift to global monetary easing, contributed to a favorable backdrop, despite persistent geopolitical risk.
•After trailing for most of the period, stocks in the China region got a boost in September from the Chinese government's announcement of aggressive monetary stimulus measures.
•Against this backdrop, picks in Taiwan had, by far, the biggest positive impact on the fund's performance versus the MSCI Golden Dragon (Net MA) Index for the fiscal year.
•By sector, security selection in information technology was the primary contributor, where our stock picks in semiconductors & semiconductor equipment helped most. Stock picks in materials and consumer discretionary also boosted the fund's relative performance.
•The top individual relative contributor was an overweight in Taiwan Semiconductor (+101%). The stock was the fund's biggest holding. A non-benchmark stake in Sea gained roughly 118% and was a second notable relative contributor. An overweight in Trip.com (+89%) also contributed. The stock was among our largest holdings.
•In contrast, from a geographical standpoint, an underweight in Taiwan, stock selection in Hong Kong and non-benchmark exposure to South Korea detracted from the fund's relative result.
•By sector, the biggest detractor from performance versus the benchmark was security selection in financials, primarily within the insurance industry. Stock selection and an overweight in health care also hampered the fund's result, as did picks in energy. Lastly, the fund's position in cash detracted.
•The biggest individual relative detractor was an overweight in NetEase (-25%). The company was among our largest holdings this period. The second-largest relative detractor was our non-benchmark stake in Samsung Electronics (-10%). Another notable relative detractor was our stake in Asymchem Laboratories (-54%), which was not held by the fund at period end.
•Notable changes in positioning include increased exposure to Taiwan and a lower allocation to Hong Kong. By sector, meaningful changes in positioning include lower allocations to health care and consumer staples.
How did the Fund perform over the past 10 years?
CUMULATIVE PERFORMANCE
October 31, 2014 through October 31, 2024.
Initial investment of $10,000 and the current sales charge was paid.
Class A | $9,425 | $9,288 | $9,276 | $12,585 | $10,589 | $13,268 | $18,909 | $19,600 | $10,741 | $13,317 | $17,682 |
MSCI Golden Dragon Index | $10,000 | $9,667 | $10,337 | $13,689 | $11,813 | $13,628 | $17,249 | $17,905 | $10,248 | $12,405 | $16,411 |
MSCI Emerging Markets Index | $10,000 | $8,550 | $9,346 | $11,823 | $10,347 | $11,577 | $12,535 | $14,663 | $10,115 | $11,211 | $14,051 |
| | 2014 | 2015 | 2016 | 2017 | 2018 | 2019 | 2020 | 2021 | 2022 | 2023 | 2024 |
AVERAGE ANNUAL TOTAL RETURNS:| | 1 Year | 5 Year | 10 Year |
| Class A (incl. 5.75% sales charge) | 25.15% | 4.67% | 5.87% |
| Class A (without 5.75% sales charge) | 32.78% | 5.91% | 6.49% |
| MSCI Golden Dragon Index | 32.29% | 3.79% | 5.08% |
| MSCI Emerging Markets Index | 25.33% | 3.95% | 3.46% |
Visit institutional.fidelity.com for more recent performance information. |
The Fund's past performance is not a good predictor of the Fund's future performance. The graph and table do not reflect the deduction of taxes that a shareholder would pay on fund distributions or redemption of fund shares. |
Key Fund Statistics(as of October 31, 2024)
KEY FACTS | | |
| Fund Size | $1,209,670,065 | |
| Number of Holdings | 86 | |
| Total Advisory Fee | $8,069,000 | |
| Portfolio Turnover | 30% | |
What did the Fund invest in?
(as of October 31, 2024)
MARKET SECTORS (% of Fund's net assets) | | |
| Information Technology | 31.3 | |
| Consumer Discretionary | 23.9 | |
| Communication Services | 13.8 | |
| Financials | 13.1 | |
| Industrials | 4.2 | |
| Health Care | 3.3 | |
| Materials | 3.2 | |
| Consumer Staples | 2.6 | |
| Real Estate | 1.0 | |
| Energy | 0.5 | |
| |
| Common Stocks | 94.9 |
| Preferred Stocks | 2.0 |
| Short-Term Investments and Net Other Assets (Liabilities) | 3.1 |
ASSET ALLOCATION (% of Fund's net assets) |
|
|
| China | 57.8 |
| Taiwan | 30.2 |
| Hong Kong | 5.0 |
| United States | 3.6 |
| Korea (South) | 1.3 |
| Singapore | 0.9 |
| Macau | 0.5 |
| France | 0.4 |
| Japan | 0.3 |
GEOGRAPHIC DIVERSIFICATION (% of Fund's net assets) |
|
| |
|
TOP HOLDINGS(% of Fund's net assets) | | |
| Taiwan Semiconductor Manufacturing Co Ltd | 22.8 | |
| Tencent Holdings Ltd | 10.3 | |
| Alibaba Group Holding Ltd | 5.5 | |
| Meituan B Shares | 4.0 | |
| PDD Holdings Inc Class A ADR | 3.4 | |
| China Construction Bank Corp H Shares | 3.1 | |
| AIA Group Ltd | 3.0 | |
| Hon Hai Precision Industry Co Ltd | 2.4 | |
| Zijin Mining Group Co Ltd H Shares | 2.1 | |
| JD.com Inc A Shares | 1.5 | |
| | 58.1 | |
How has the Fund changed?
This is a summary of certain changes to the Fund since November 1, 2023. For more complete information, you may review the Fund's next prospectus, which we expect to be available by December 30, 2024 at fundresearch.fidelity.com/prospectus/sec or upon request at 1-877-208-0098 or by sending an e-mail to fidfunddocuments@fidelity.com.
The fees associated with this class changed during the reporting year.The variations in class fees are primarily the result of the following changes: - Management fee
- Operating expenses
The fund's transfer agent and pricing & bookkeeping fees were changed to a fixed rate effective December 1, 2023, through February 29, 2024, in anticipation of the transition to a new management fee structure. Effective March 1, 2024, the fund's management contract was amended to incorporate administrative services previously covered under separate services agreements (transfer agent and pricing & bookkeeping). The amended contract incorporates a management fee rate that may vary by class. The Adviser or an affiliate pays certain expenses of managing and operating the fund out of each class's management fee. | The fund's sub-advisory agreement with FIL Investments (Japan) Limited was not renewed.
|
| Fidelity, the Fidelity Investments Logo and all other Fidelity trademarks or service marks used herein are trademarks or service marks of FMR LLC. Any third-party marks that are used herein are trademarks or service marks of their respective owners. © 2024 FMR LLC. All rights reserved. |
| | For additional information about the Fund; including its prospectus, financial information, holdings and proxy information, scan the QR code or visit fundresearch.fidelity.com/prospectus/sec 1.9913889.100 2064-TSRA-1224 |
| |
| | ANNUAL SHAREHOLDER REPORT | AS OF OCTOBER 31, 2024 | This report describes changes to the Fund that occurred during the reporting period. |
| | Fidelity® International Discovery Fund Fidelity Advisor® International Discovery Fund Class Z : FZAIX |
| | | |
This annual shareholder report contains information about Fidelity® International Discovery Fund for the period November 1, 2023 to October 31, 2024. You can find additional information about the Fund at fundresearch.fidelity.com/prospectus/sec. You can also request this information by contacting us at 1-877-208-0098 or by sending an e-mail to fidfunddocuments@fidelity.com.
What were your Fund costs for the last year?(based on hypothetical $10,000 investment)
FUND COST (PREVIOUS YEAR)
| | Costs of a $10,000 investment | Costs paid as a percentage of a $10,000 investment | |
| Class Z | $ 59 | 0.51% | |
What affected the Fund's performance this period?
•International stocks achieved a strong gain for the 12 months ending October 31, 2024. Resilient global economic growth and a slowing in the pace of inflation in certain regions, as well as a shift to global monetary easing, contributed to a favorable backdrop, despite persistent geopolitical risk.
•Against this backdrop, picks in Europe ex U.K. and Japan contributed to the fund's performance versus the MSCI EAFE Index (Net MA) for the fiscal year.
•By sector, the biggest contributor to performance versus the benchmark was stock picking in industrials, primarily within the capital goods industry. Stock picking and an overweight in information technology, primarily within the semiconductors & semiconductor equipment industry, also boosted the fund's relative performance, as did stock picking in consumer discretionary.
•The top individual relative contributor was our non-benchmark stake in Nvidia (+121%). This period we decreased our investment in Nvidia. A second notable relative contributor was our non-benchmark stake in Taiwan Semiconductor (+96%). The company was one of our largest holdings. Another notable relative contributor was an overweight in Hitachi (+109%), the fund's biggest holding at period end.
•In contrast, from a regional standpoint, a non-benchmark allocation to Canada and an underweight in Asia Pacific ex Japan detracted from the fund's relative result.
•By sector, the biggest detractor from performance versus the benchmark was stock selection in consumer staples. Security selection in financials also hampered the fund's result. Also hurting our result were stock picks and an underweight in communication services, primarily within the media & entertainment industry. Lastly, the fund's position in cash detracted.
•The fund's non-benchmark stake in PDD returned -47% and was the largest individual relative detractor. This was a position we established this period. A second notable relative detractor was an overweight in L'Oréal (-9%), which was among the fund's biggest holdings this period. A non-benchmark stake in One97 Communications returned about -29% and notably hurt. The stock was not held at period end.
•Notable changes in positioning include increased exposure to Germany and a lower allocation to India. By sector, meaningful changes in positioning include increased exposure to industrials and a lower allocation to consumer staples.
How did the Fund perform over the past 10 years?
CUMULATIVE PERFORMANCE
October 31, 2014 through October 31, 2024.
Initial investment of $10,000.
Class Z | $10,000 | $10,358 | $9,906 | $12,526 | $11,313 | $12,718 | $13,802 | $18,412 | $12,836 | $13,752 | $17,829 |
MSCI EAFE Index | $10,000 | $10,008 | $9,705 | $12,004 | $11,206 | $12,472 | $11,638 | $15,647 | $12,073 | $13,841 | $17,059 |
| | 2014 | 2015 | 2016 | 2017 | 2018 | 2019 | 2020 | 2021 | 2022 | 2023 | 2024 |
AVERAGE ANNUAL TOTAL RETURNS:| | 1 Year | 5 Year | 10 Year |
| Class Z | 29.65% | 6.99% | 5.95% |
| MSCI EAFE Index | 23.25% | 6.46% | 5.49% |
Visit institutional.fidelity.com for more recent performance information. |
The Fund's past performance is not a good predictor of the Fund's future performance. The graph and table do not reflect the deduction of taxes that a shareholder would pay on fund distributions or redemption of fund shares. |
Key Fund Statistics(as of October 31, 2024)
KEY FACTS | | |
| Fund Size | $9,841,033,775 | |
| Number of Holdings | 142 | |
| Total Advisory Fee | $45,667,963 | |
| Portfolio Turnover | 44% | |
What did the Fund invest in?
(as of October 31, 2024)
MARKET SECTORS (% of Fund's net assets) | | |
| Financials | 22.3 | |
| Industrials | 22.0 | |
| Consumer Discretionary | 14.1 | |
| Information Technology | 11.8 | |
| Health Care | 9.8 | |
| Materials | 5.4 | |
| Consumer Staples | 4.1 | |
| Communication Services | 3.3 | |
| Energy | 3.1 | |
| Real Estate | 1.0 | |
| |
| Common Stocks | 96.2 |
| Preferred Stocks | 0.7 |
| Short-Term Investments and Net Other Assets (Liabilities) | 3.1 |
ASSET ALLOCATION (% of Fund's net assets) |
|
|
| Japan | 17.6 |
| United Kingdom | 15.3 |
| France | 9.1 |
| United States | 8.5 |
| Germany | 7.0 |
| Netherlands | 6.0 |
| Italy | 5.0 |
| Canada | 4.6 |
| Sweden | 3.6 |
| Others | 23.3 |
GEOGRAPHIC DIVERSIFICATION (% of Fund's net assets) |
|
| |
|
TOP HOLDINGS(% of Fund's net assets) | | |
| Hitachi Ltd | 3.1 | |
| UniCredit SpA | 2.7 | |
| Novo Nordisk A/S Series B | 2.7 | |
| ASML Holding NV | 2.1 | |
| Taiwan Semiconductor Manufacturing Co Ltd | 2.0 | |
| Constellation Software Inc/Canada | 2.0 | |
| Unilever PLC | 2.0 | |
| Compass Group PLC | 1.7 | |
| UCB SA | 1.7 | |
| ITOCHU Corp | 1.6 | |
| | 21.6 | |
How has the Fund changed?
This is a summary of certain changes to the Fund since November 1, 2023. For more complete information, you may review the Fund's next prospectus, which we expect to be available by December 30, 2024 at fundresearch.fidelity.com/prospectus/sec or upon request at 1-877-208-0098 or by sending an e-mail to fidfunddocuments@fidelity.com.
The fees associated with this class changed during the reporting year.The variations in class fees are primarily the result of the following changes: - Management fee
- Performance adjustment fee
The fund's transfer agent and pricing & bookkeeping fees were changed to a fixed rate effective December 1, 2023, through February 29, 2024, in anticipation of the transition to a new management fee structure. Effective March 1, 2024, the fund's management contract was amended to incorporate administrative services previously covered under separate services agreements (transfer agent and pricing & bookkeeping). The amended contract incorporates a basic fee rate that may vary by class (subject to a performance adjustment). The Adviser or an affiliate pays certain expenses of managing and operating the fund out of each class's management fee. | The fund's sub-advisory agreement with FIL Investments (Japan) Limited was not renewed.
|
| Fidelity, the Fidelity Investments Logo and all other Fidelity trademarks or service marks used herein are trademarks or service marks of FMR LLC. Any third-party marks that are used herein are trademarks or service marks of their respective owners. © 2024 FMR LLC. All rights reserved. |
| | For additional information about the Fund; including its prospectus, financial information, holdings and proxy information, scan the QR code or visit fundresearch.fidelity.com/prospectus/sec 1.9913840.100 2534-TSRA-1224 |
| |
| | ANNUAL SHAREHOLDER REPORT | AS OF OCTOBER 31, 2024 | This report describes changes to the Fund that occurred during the reporting period. |
| | Fidelity® Emerging Markets Discovery Fund Fidelity Advisor® Emerging Markets Discovery Fund Class I : FEDIX |
| | | |
This annual shareholder report contains information about Fidelity® Emerging Markets Discovery Fund for the period November 1, 2023 to October 31, 2024. You can find additional information about the Fund at fundresearch.fidelity.com/prospectus/sec. You can also request this information by contacting us at 1-877-208-0098 or by sending an e-mail to fidfunddocuments@fidelity.com.
What were your Fund costs for the last year?(based on hypothetical $10,000 investment)
FUND COST (PREVIOUS YEAR)
| | Costs of a $10,000 investment | Costs paid as a percentage of a $10,000 investment | |
| Class I | $ 111 | 1.04% | |
What affected the Fund's performance this period?
•International stocks achieved a strong gain for the 12 months ending October 31, 2024. Resilient global economic growth and a slowing in the pace of inflation in certain regions, as well as a shift to global monetary easing, contributed to a favorable backdrop, despite persistent geopolitical risk.
•Against this backdrop, an underweight in Emerging Asia, primarily in India, and stock picking and an overweight in Latin America, primarily in Brazil, detracted from the fund's performance versus the MSCI Emerging Markets SMID Index (Net MA) for the fiscal year.
•By sector, security selection was the primary detractor, especially within financials. Also hurting our result were stock picks in health care, primarily within the pharmaceuticals, biotechnology & life sciences industry, and consumer staples.
•The largest individual relative detractor was our stake in Pharmaron Beijing (-48%). The second-largest relative detractor was Hanon Systems (-52%). The stock was not held at period end. Another notable relative detractor was an overweight in Nanya Technology (-34%).
•In contrast, from a regional standpoint, stock selection in Africa, primarily in South Africa, and stock picks and an underweight in the Middle East, primarily in United Arab Emirates, contributed to the fund's relative result.
•By sector, the biggest contributor to performance versus the benchmark was security selection in communication services, primarily within the media & entertainment industry. Stock picks and an underweight in materials and stock selection and an overweight in industrials, primarily within the capital goods industry, also boosted the fund's relative performance.
•The top individual relative contributor was an overweight in International Games System (+243%). This period we decreased our investment in the stock, which was nonetheless one of our largest holdings as of October 31. The second-largest relative contributor was a non-benchmark stake in Hindustan Aeronautics (+136%), where we decreased our investment this period. Another notable relative contributor was an overweight in Bharat Electronics (+111%).
•Notable changes in positioning include increased exposure to Taiwan and South Africa. By sector, meaningful changes in positioning include lower allocations to health care and utilities.
How did the Fund perform over the past 10 years?
CUMULATIVE PERFORMANCE
October 31, 2014 through October 31, 2024.
Initial investment of $10,000.
Class I | $10,000 | $8,996 | $10,180 | $12,648 | $10,364 | $12,000 | $12,368 | $16,402 | $12,897 | $14,959 | $17,104 |
MSCI Emerging Markets SMID Cap Index | $10,000 | $8,919 | $9,391 | $11,258 | $9,624 | $10,629 | $10,543 | $14,461 | $10,969 | $12,456 | $15,202 |
MSCI Emerging Markets Index | $10,000 | $8,550 | $9,346 | $11,823 | $10,347 | $11,577 | $12,535 | $14,663 | $10,115 | $11,211 | $14,051 |
| | 2014 | 2015 | 2016 | 2017 | 2018 | 2019 | 2020 | 2021 | 2022 | 2023 | 2024 |
AVERAGE ANNUAL TOTAL RETURNS:| | 1 Year | 5 Year | 10 Year |
| Class I | 14.34% | 7.35% | 5.51% |
| MSCI Emerging Markets SMID Cap Index | 22.04% | 7.42% | 4.28% |
| MSCI Emerging Markets Index | 25.33% | 3.95% | 3.46% |
Visit institutional.fidelity.com for more recent performance information. |
The Fund's past performance is not a good predictor of the Fund's future performance. The graph and table do not reflect the deduction of taxes that a shareholder would pay on fund distributions or redemption of fund shares. |
Key Fund Statistics(as of October 31, 2024)
KEY FACTS | | |
| Fund Size | $1,183,237,609 | |
| Number of Holdings | 111 | |
| Total Advisory Fee | $10,611,763 | |
| Portfolio Turnover | 29% | |
What did the Fund invest in?
(as of October 31, 2024)
MARKET SECTORS (% of Fund's net assets) | | |
| Industrials | 21.0 | |
| Consumer Discretionary | 18.3 | |
| Financials | 14.5 | |
| Information Technology | 10.9 | |
| Consumer Staples | 7.8 | |
| Real Estate | 7.4 | |
| Health Care | 4.6 | |
| Materials | 4.6 | |
| Utilities | 3.9 | |
| Energy | 3.3 | |
| Communication Services | 3.2 | |
| |
| Common Stocks | 99.5 |
| Short-Term Investments and Net Other Assets (Liabilities) | 0.5 |
ASSET ALLOCATION (% of Fund's net assets) |
|
|
| China | 21.4 |
| Taiwan | 17.6 |
| India | 13.3 |
| Brazil | 11.7 |
| Korea (South) | 6.2 |
| South Africa | 5.4 |
| Mexico | 4.8 |
| Saudi Arabia | 2.3 |
| Hong Kong | 2.2 |
| Others | 15.1 |
GEOGRAPHIC DIVERSIFICATION (% of Fund's net assets) |
|
| |
|
TOP HOLDINGS(% of Fund's net assets) | | |
| Impala Platinum Holdings Ltd | 1.8 | |
| Shriram Finance Ltd | 1.4 | |
| SITC International Holdings Co Ltd | 1.4 | |
| Bizlink Holding Inc | 1.4 | |
| Yageo Corp | 1.4 | |
| Torrent Pharmaceuticals Ltd | 1.3 | |
| Mr Price Group Ltd | 1.3 | |
| International Games System Co Ltd | 1.3 | |
| Nien Made Enterprise Co Ltd | 1.3 | |
| Coway Co Ltd | 1.3 | |
| | 13.9 | |
How has the Fund changed?
This is a summary of certain changes to the Fund since November 1, 2023. For more complete information, you may review the Fund's next prospectus, which we expect to be available by December 30, 2024 at fundresearch.fidelity.com/prospectus/sec or upon request at 1-877-208-0098 or by sending an e-mail to fidfunddocuments@fidelity.com.
The fees associated with this class changed during the reporting year.The variations in class fees are primarily the result of the following changes: - Management fee
- Operating expenses
The fund's transfer agent and pricing & bookkeeping fees were changed to a fixed rate effective December 1, 2023, through February 29, 2024, in anticipation of the transition to a new management fee structure. Effective March 1, 2024, the fund's management contract was amended to incorporate administrative services previously covered under separate services agreements (transfer agent and pricing & bookkeeping). The amended contract incorporates a management fee rate that may vary by class. The Adviser or an affiliate pays certain expenses of managing and operating the fund out of each class's management fee. | The fund's sub-advisory agreement with FIL Investments (Japan) Limited was not renewed
|
| Fidelity, the Fidelity Investments Logo and all other Fidelity trademarks or service marks used herein are trademarks or service marks of FMR LLC. Any third-party marks that are used herein are trademarks or service marks of their respective owners. © 2024 FMR LLC. All rights reserved. |
| | For additional information about the Fund; including its prospectus, financial information, holdings and proxy information, scan the QR code or visit fundresearch.fidelity.com/prospectus/sec 1.9913977.100 2378-TSRA-1224 |
| |
| | ANNUAL SHAREHOLDER REPORT | AS OF OCTOBER 31, 2024 | This report describes changes to the Fund that occurred during the reporting period. |
| | Fidelity® Worldwide Fund Fidelity Advisor® Worldwide Fund Class Z : FIQOX |
| | | |
This annual shareholder report contains information about Fidelity® Worldwide Fund for the period November 1, 2023 to October 31, 2024. You can find additional information about the Fund at fundresearch.fidelity.com/prospectus/sec. You can also request this information by contacting us at 1-877-208-0098 or by sending an e-mail to fidfunddocuments@fidelity.com.
What were your Fund costs for the last year?(based on hypothetical $10,000 investment)
FUND COST (PREVIOUS YEAR)
| | Costs of a $10,000 investment | Costs paid as a percentage of a $10,000 investment | |
| Class Z | $ 75 | 0.61% | |
What affected the Fund's performance this period?
•Global equities posted a strong advance for the 12 months ending October 31, 2024. Resilient economic growth and a slowing in the pace of inflation in certain regions, as well as a shift to global monetary easing, contributed to a favorable backdrop, despite persistent geopolitical risk.
•Against this backdrop, by region, security selection in the United States was the primary contributor to the fund's performance versus the MSCI World Index for the fiscal year.
•By sector, security selection was the primary contributor, especially within consumer discretionary. Stock picking in information technology, primarily within the semiconductors & semiconductor equipment industry, and industrials, primarily within the capital goods industry, also boosted the fund's relative performance.
•The top individual relative contributor was an overweight in Nvidia (+219%). We decreased our position in Nvidia during the period, but the company was the fund's largest holding at period end. The second-largest relative contributor was an overweight in Constellation Energy (+138%). This period we increased our investment in the stock. An overweight in Meta Platforms (+89%), which was one of the fund's largest holdings, also helped.
•In contrast, from a regional standpoint, an overweight in emerging markets, and stock selection and an overweight in the U.K., detracted from the fund's relative result.
•By sector, the biggest detractors from performance versus the benchmark were stock picking and an underweight in financials. Also modestly hurting our result were overweights in consumer discretionary, primarily within the consumer durables & apparel industry, and information technology.
•The biggest individual relative detractor was a stake in Jabil (-8%). The stock was not held at period end. The second-largest relative detractor was an overweight in Coinbase Global (-25%). This was a position we established this period. An overweight in Oracle (+8%) also hurt. We notably decreased our stake in Oracle by period end.
•Notable changes in positioning by region include a lower allocation to Japan. By sector, meaningful changes in positioning include decreased exposure to energy and a higher allocation to consumer discretionary.
How did the Fund perform over the life of Fund?
CUMULATIVE PERFORMANCE
October 2, 2018 through October 31, 2024.
Initial investment of $10,000.
Class Z | $10,000 | $9,066 | $10,231 | $12,399 | $17,144 | $12,507 | $13,895 |
MSCI World Index | $10,000 | $9,269 | $10,494 | $10,999 | $15,500 | $12,684 | $14,070 |
| | 2018 | 2019 | 2020 | 2021 | 2022 | 2023 | 2024 |
AVERAGE ANNUAL TOTAL RETURNS:| | 1 Year | 5 Year | Life of Fund A |
| Class Z | 43.63% | 14.30% | 12.03% |
| MSCI World Index | 34.17% | 12.46% | 11.01% |
A From October 2, 2018
Visit institutional.fidelity.com for more recent performance information. |
The Fund's past performance is not a good predictor of the Fund's future performance. The graph and table do not reflect the deduction of taxes that a shareholder would pay on fund distributions or redemption of fund shares. |
Key Fund Statistics(as of October 31, 2024)
KEY FACTS | | |
| Fund Size | $3,143,670,063 | |
| Number of Holdings | 189 | |
| Total Advisory Fee | $19,608,125 | |
| Portfolio Turnover | 108% | |
What did the Fund invest in?
(as of October 31, 2024)
MARKET SECTORS (% of Fund's net assets) | | |
| Information Technology | 21.6 | |
| Consumer Discretionary | 16.6 | |
| Industrials | 16.3 | |
| Financials | 14.4 | |
| Communication Services | 10.4 | |
| Health Care | 8.5 | |
| Energy | 3.1 | |
| Utilities | 2.4 | |
| Real Estate | 2.2 | |
| Consumer Staples | 2.0 | |
| Materials | 1.9 | |
| |
| Common Stocks | 99.2 |
| Preferred Stocks | 0.2 |
| Short-Term Investments and Net Other Assets (Liabilities) | 0.6 |
ASSET ALLOCATION (% of Fund's net assets) |
|
|
| United States | 69.1 |
| United Kingdom | 4.6 |
| Canada | 4.0 |
| Sweden | 3.3 |
| Japan | 3.3 |
| Italy | 1.8 |
| Australia | 1.6 |
| Denmark | 1.5 |
| Belgium | 1.3 |
| Others | 9.5 |
GEOGRAPHIC DIVERSIFICATION (% of Fund's net assets) |
|
| |
|
TOP HOLDINGS(% of Fund's net assets) | | |
| NVIDIA Corp | 5.6 | |
| Meta Platforms Inc Class A | 4.7 | |
| Microsoft Corp | 4.1 | |
| Apple Inc | 3.8 | |
| Modine Manufacturing Co | 3.1 | |
| Eli Lilly & Co | 3.1 | |
| Amazon.com Inc | 2.7 | |
| Fiserv Inc | 2.5 | |
| Alphabet Inc Class A | 2.4 | |
| Deckers Outdoor Corp | 2.4 | |
| | 34.4 | |
How has the Fund changed?
This is a summary of certain changes to the Fund since November 1, 2023. For more complete information, you may review the Fund's next prospectus, which we expect to be available by December 30, 2024 at fundresearch.fidelity.com/prospectus/sec or upon request at 1-877-208-0098 or by sending an e-mail to fidfunddocuments@fidelity.com.
The fees associated with this class changed during the reporting year.The variations in class fees are primarily the result of the following changes: - Management fee
- Operating expenses
- Performance adjustment fee
The fund's transfer agent and pricing & bookkeeping fees were changed to a fixed rate effective December 1, 2023, through February 29, 2024, in anticipation of the transition to a new management fee structure. Effective March 1, 2024, the fund's management contract was amended to incorporate administrative services previously covered under separate services agreements (transfer agent and pricing & bookkeeping). The amended contract incorporates a basic fee rate that may vary by class (subject to a performance adjustment). The Adviser or an affiliate pays certain expenses of managing and operating the fund out of each class's management fee. | The fund's sub-advisory agreement with FIL Investments (Japan) Limited was not renewed.
|
| Fidelity, the Fidelity Investments Logo and all other Fidelity trademarks or service marks used herein are trademarks or service marks of FMR LLC. Any third-party marks that are used herein are trademarks or service marks of their respective owners. © 2024 FMR LLC. All rights reserved. |
| | For additional information about the Fund; including its prospectus, financial information, holdings and proxy information, scan the QR code or visit fundresearch.fidelity.com/prospectus/sec 1.9913857.100 3273-TSRA-1224 |
| |
| | ANNUAL SHAREHOLDER REPORT | AS OF OCTOBER 31, 2024 | This report describes changes to the Fund that occurred during the reporting period. |
| | Fidelity® International Growth Fund Fidelity Advisor® International Growth Fund Class C : FIGCX |
| | | |
This annual shareholder report contains information about Fidelity® International Growth Fund for the period November 1, 2023 to October 31, 2024. You can find additional information about the Fund at fundresearch.fidelity.com/prospectus/sec. You can also request this information by contacting us at 1-877-208-0098 or by sending an e-mail to fidfunddocuments@fidelity.com.
What were your Fund costs for the last year?(based on hypothetical $10,000 investment)
FUND COST (PREVIOUS YEAR)
| | Costs of a $10,000 investment | Costs paid as a percentage of a $10,000 investment | |
| Class C | $ 217 | 1.94% | |
What affected the Fund's performance this period?
•International stocks achieved a strong gain for the 12 months ending October 31, 2024. Resilient global economic growth and a slowing in the pace of inflation in certain regions, as well as a shift to global monetary easing, contributed to a favorable backdrop, despite persistent geopolitical risk.
•Against this backdrop, stock picks and an overweight in the United States and security selection in the U.K. contributed to the fund's performance versus the MSCI EAFE Growth Index (Net MA) for the fiscal year.
•By sector, an underweight in consumer staples was the primary contributor. Stock selection in materials also boosted the fund's relative performance. Also helping our relative result was an overweight in industrials, primarily within the capital goods industry.
•The fund's non-benchmark stake in Taiwan Semiconductor gained 99% and was the top individual relative contributor. The stock was among our largest holdings. A second notable relative contributor was an overweight in CRH (+83%). The stock was among the fund's biggest holdings. Another notable relative contributor was our non-benchmark stake in GE Vernova (+100%). This was a position we established this period.
•In contrast, from a regional standpoint, an underweight in Asia Pacific ex Japan and a non-benchmark allocation to Canada detracted from the fund's relative result.
•By sector, the biggest detractor from performance versus the benchmark was stock picking in financials. Also hurting our result was security selection in industrials, primarily within the capital goods industry, and energy. Lastly, the fund's position in cash detracted.
•The biggest individual relative detractor was an overweight in Edenred (-38%). Not owning Schneider Electric, a benchmark component that gained approximately 71%, was the second-largest relative detractor. Not owning Commonwealth Bank of Australia, a benchmark component that gained roughly 59%, was another notable relative detractor.
•Notable changes in positioning include increased exposure to Germany and the United Kingdom. By sector, meaningful changes in positioning include decreased exposure to consumer staples and health care.
How did the Fund perform over the past 10 years?
CUMULATIVE PERFORMANCE
October 31, 2014 through October 31, 2024.
Initial investment of $10,000.
Class C | $10,000 | $10,230 | $9,823 | $12,079 | $11,249 | $13,536 | $14,458 | $18,800 | $13,427 | $14,805 | $18,518 |
MSCI EAFE Growth Index | $10,000 | $10,428 | $10,108 | $12,517 | $11,783 | $13,766 | $14,502 | $18,876 | $13,312 | $14,769 | $18,234 |
MSCI EAFE Index | $10,000 | $10,008 | $9,705 | $12,004 | $11,206 | $12,472 | $11,638 | $15,647 | $12,073 | $13,841 | $17,059 |
| | 2014 | 2015 | 2016 | 2017 | 2018 | 2019 | 2020 | 2021 | 2022 | 2023 | 2024 |
AVERAGE ANNUAL TOTAL RETURNS:| | 1 Year | 5 Year | 10 Year |
| Class C (incl. contingent deferred sales charge) | 23.13% | 6.15% | 6.36% |
| Class C | 24.13% | 6.15% | 6.36% |
| MSCI EAFE Growth Index | 23.46% | 5.78% | 6.19% |
| MSCI EAFE Index | 23.25% | 6.46% | 5.49% |
Visit institutional.fidelity.com for more recent performance information. |
The Fund's past performance is not a good predictor of the Fund's future performance. The graph and table do not reflect the deduction of taxes that a shareholder would pay on fund distributions or redemption of fund shares. |
Key Fund Statistics(as of October 31, 2024)
KEY FACTS | | |
| Fund Size | $6,046,615,302 | |
| Number of Holdings | 73 | |
| Total Advisory Fee | $43,926,728 | |
| Portfolio Turnover | 31% | |
What did the Fund invest in?
(as of October 31, 2024)
MARKET SECTORS (% of Fund's net assets) | | |
| Industrials | 31.9 | |
| Information Technology | 19.7 | |
| Financials | 16.0 | |
| Materials | 10.7 | |
| Consumer Discretionary | 10.3 | |
| Health Care | 6.1 | |
| Consumer Staples | 1.1 | |
| Energy | 0.7 | |
| Communication Services | 0.5 | |
| |
| Common Stocks | 96.7 |
| Preferred Stocks | 0.3 |
| Short-Term Investments and Net Other Assets (Liabilities) | 3.0 |
ASSET ALLOCATION (% of Fund's net assets) |
|
|
| United States | 29.1 |
| United Kingdom | 11.7 |
| France | 11.2 |
| Japan | 9.6 |
| Sweden | 7.5 |
| Germany | 6.6 |
| Netherlands | 6.1 |
| Denmark | 5.1 |
| Taiwan | 3.3 |
| Others | 9.8 |
GEOGRAPHIC DIVERSIFICATION (% of Fund's net assets) |
|
| |
|
TOP HOLDINGS(% of Fund's net assets) | | |
| SAP SE | 5.3 | |
| Novo Nordisk A/S Series B | 5.1 | |
| ASML Holding NV | 4.8 | |
| Safran SA | 4.0 | |
| CRH PLC | 3.9 | |
| Linde PLC | 3.8 | |
| Atlas Copco AB A Shares | 3.4 | |
| Taiwan Semiconductor Manufacturing Co Ltd | 3.3 | |
| Recruit Holdings Co Ltd | 3.0 | |
| LVMH Moet Hennessy Louis Vuitton SE | 2.7 | |
| | 39.3 | |
How has the Fund changed?
This is a summary of certain changes to the Fund since November 1, 2023. For more complete information, you may review the Fund's next prospectus, which we expect to be available by December 30, 2024 at fundresearch.fidelity.com/prospectus/sec or upon request at 1-877-208-0098 or by sending an e-mail to fidfunddocuments@fidelity.com.
The fund's transfer agent and pricing & bookkeeping fees were changed to a fixed rate effective December 1, 2023, through February 29, 2024, in anticipation of the transition to a new management fee structure. Effective March 1, 2024, the fund's management contract was amended to incorporate administrative services previously covered under separate services agreements (transfer agent and pricing & bookkeeping). The amended contract incorporates a basic fee rate that may vary by class (subject to a performance adjustment). The Adviser or an affiliate pays certain expenses of managing and operating the fund out of each class's management fee. | The fund's sub-advisory agreement with FIL Investments (Japan) Limited was not renewed.
|
| Fidelity, the Fidelity Investments Logo and all other Fidelity trademarks or service marks used herein are trademarks or service marks of FMR LLC. Any third-party marks that are used herein are trademarks or service marks of their respective owners. © 2024 FMR LLC. All rights reserved. |
| | For additional information about the Fund; including its prospectus, financial information, holdings and proxy information, scan the QR code or visit fundresearch.fidelity.com/prospectus/sec 1.9913950.100 1987-TSRA-1224 |
| |
| | ANNUAL SHAREHOLDER REPORT | AS OF OCTOBER 31, 2024 | This report describes changes to the Fund that occurred during the reporting period. |
| | Fidelity® Overseas Fund Fidelity® Overseas Fund : FOSFX |
| | | |
This annual shareholder report contains information about Fidelity® Overseas Fund for the period November 1, 2023 to October 31, 2024. You can find additional information about the Fund at fundresearch.fidelity.com/prospectus/sec. You can also request this information by contacting us at 1-800-544-8544 or by sending an e-mail to fidfunddocuments@fidelity.com.
What were your Fund costs for the last year?(based on hypothetical $10,000 investment)
FUND COST (PREVIOUS YEAR)
| | Costs of a $10,000 investment | Costs paid as a percentage of a $10,000 investment | |
| Fidelity® Overseas Fund | $ 77 | 0.69% | |
What affected the Fund's performance this period?
•International stocks achieved a strong gain for the 12 months ending October 31, 2024. Resilient global economic growth and a slowing in the pace of inflation in certain regions, as well as a shift to global monetary easing, contributed to a favorable backdrop, despite persistent geopolitical risk.
•Against this backdrop, stock picking in the U.K. and Japan contributed to the fund's performance versus the MSCI EAFE Index (Net MA) for the fiscal year.
•By sector, market selection was the primary contributor, led by an underweights in energy and consumer staples. Stock picks and an overweight in industrials, primarily within the capital goods industry, also boosted the fund's relative performance.
•The top individual relative contributor was an overweight in Mitsubishi Heavy Industries (+156%). This was a stake we established this period. The second-largest relative contributor was an overweight in Tokio Marine Holdings (+70%). Although we reduced the fund's stake, the company was one of our largest holdings. Another notable relative contributor was our non-benchmark stake in Taiwan Semiconductor Manufacturing (+101%).
•In contrast, from a regional standpoint, stock selection in the United States and underweights in Japan and Asia Pacific ex Japan detracted from the fund's relative result.
•By sector, the biggest detractor from performance versus the benchmark was stock selection in consumer staples. Also hurting our result were stock picks in consumer discretionary, primarily within the consumer durables & apparel industry. Choices in information technology, primarily within the software & services industry, also hurt. Lastly, the fund's position in cash detracted.
•The largest individual relative detractor was our stake in Diageo (-11%). The stock was not held at period end. A non-benchmark stake in Alten returned approximately -27% and was the second-largest relative detractor. Our overweight stake in Sony Group (+1%) also hurt. The stock was not held at period end.
•Notable changes in positioning include increased exposure to Japan and the United States, and a lower allocation to Sweden. By sector, meaningful changes in positioning include decreased exposure to consumer staples and energy, and a higher allocation to industrials and materials.
How did the Fund perform over the past 10 years?
CUMULATIVE PERFORMANCE
October 31, 2014 through October 31, 2024.
Initial investment of $10,000.
Fidelity® Overseas Fund | $10,000 | $10,834 | $10,729 | $13,479 | $12,504 | $14,227 | $14,833 | $20,444 | $14,286 | $16,136 | $20,322 |
MSCI EAFE Index | $10,000 | $10,008 | $9,705 | $12,004 | $11,206 | $12,472 | $11,638 | $15,647 | $12,073 | $13,841 | $17,059 |
| | 2014 | 2015 | 2016 | 2017 | 2018 | 2019 | 2020 | 2021 | 2022 | 2023 | 2024 |
AVERAGE ANNUAL TOTAL RETURNS:| | 1 Year | 5 Year | 10 Year |
| Fidelity® Overseas Fund | 25.94% | 7.39% | 7.35% |
| MSCI EAFE Index | 23.25% | 6.46% | 5.49% |
Visit www.fidelity.com for more recent performance information. |
The Fund's past performance is not a good predictor of the Fund's future performance. The graph and table do not reflect the deduction of taxes that a shareholder would pay on fund distributions or redemption of fund shares. |
Key Fund Statistics(as of October 31, 2024)
KEY FACTS | | |
| Fund Size | $6,293,832,474 | |
| Number of Holdings | 93 | |
| Total Advisory Fee | $53,545,452 | |
| Portfolio Turnover | 35% | |
What did the Fund invest in?
(as of October 31, 2024)
MARKET SECTORS (% of Fund's net assets) | | |
| Industrials | 25.5 | |
| Financials | 22.8 | |
| Information Technology | 16.2 | |
| Health Care | 13.4 | |
| Materials | 9.4 | |
| Consumer Discretionary | 7.1 | |
| Consumer Staples | 2.3 | |
| Communication Services | 0.5 | |
| |
| Common Stocks | 97.2 |
| Short-Term Investments and Net Other Assets (Liabilities) | 2.8 |
ASSET ALLOCATION (% of Fund's net assets) |
|
|
| United States | 18.4 |
| United Kingdom | 17.9 |
| Japan | 16.1 |
| France | 11.2 |
| Germany | 9.0 |
| Netherlands | 5.9 |
| Denmark | 4.4 |
| Switzerland | 3.4 |
| Italy | 3.1 |
| Others | 10.6 |
GEOGRAPHIC DIVERSIFICATION (% of Fund's net assets) |
|
| |
|
TOP HOLDINGS(% of Fund's net assets) | | |
| Novo Nordisk A/S Series B | 3.0 | |
| SAP SE | 3.0 | |
| ASML Holding NV | 3.0 | |
| Hitachi Ltd | 2.3 | |
| RELX PLC | 2.2 | |
| Astrazeneca PLC | 2.2 | |
| Safran SA | 2.1 | |
| Compass Group PLC | 2.1 | |
| Wolters Kluwer NV | 2.0 | |
| London Stock Exchange Group PLC | 1.9 | |
| | 23.8 | |
How has the Fund changed?
This is a summary of certain changes to the Fund since November 1, 2023. For more complete information, you may review the Fund's next prospectus, which we expect to be available by December 30, 2024 at fundresearch.fidelity.com/prospectus/sec or upon request at 1-800-544-8544 or by sending an e-mail to fidfunddocuments@fidelity.com.
The fund's transfer agent and pricing & bookkeeping fees were changed to a fixed rate effective December 1, 2023, through February 29, 2024, in anticipation of the transition to a new management fee structure. Effective March 1, 2024, the fund's management contract was amended to incorporate administrative services previously covered under separate services agreements (transfer agent and pricing & bookkeeping). The amended contract incorporates a basic fee rate that may vary by class (subject to a performance adjustment). The Adviser or an affiliate pays certain expenses of managing and operating the fund out of each class's management fee. | The fund's sub-advisory agreement with FIL Investments (Japan) Limited was not renewed.
|
| Fidelity, the Fidelity Investments Logo and all other Fidelity trademarks or service marks used herein are trademarks or service marks of FMR LLC. Any third-party marks that are used herein are trademarks or service marks of their respective owners. © 2024 FMR LLC. All rights reserved. |
| | For additional information about the Fund; including its prospectus, financial information, holdings and proxy information, scan the QR code or visit fundresearch.fidelity.com/prospectus/sec 1.9913806.100 94-TSRA-1224 |
| |
| | ANNUAL SHAREHOLDER REPORT | AS OF OCTOBER 31, 2024 | This report describes changes to the Fund that occurred during the reporting period. |
| | Fidelity® Canada Fund Fidelity® Canada Fund : FICDX |
| | | |
This annual shareholder report contains information about Fidelity® Canada Fund for the period November 1, 2023 to October 31, 2024. You can find additional information about the Fund at fundresearch.fidelity.com/prospectus/sec. You can also request this information by contacting us at 1-800-544-8544 or by sending an e-mail to fidfunddocuments@fidelity.com.
What were your Fund costs for the last year?(based on hypothetical $10,000 investment)
FUND COST (PREVIOUS YEAR)
| | Costs of a $10,000 investment | Costs paid as a percentage of a $10,000 investment | |
| Fidelity® Canada Fund | $ 118 | 1.04% | |
What affected the Fund's performance this period?
•International stocks achieved a strong gain for the 12 months ending October 31, 2024. Resilient global economic growth and a slowing in the pace of inflation in certain regions, as well as a shift to global monetary easing, contributed to a favorable backdrop, despite persistent geopolitical risk.
•Against this backdrop, stock picking in Canada's materials sector, and stock selection and an underweight in financials, primarily within the banking industry, detracted most from the fund's performance versus the S&P/TSX Composite Index for the fiscal year.
•The largest individual relative detractor was an overweight in Alimentation Couche-Tard (-3%). The stock was among the fund's largest holdings. Not owning Canadian Imperial Bank of Commerce, a benchmark component that gained 87%, was the second-largest relative detractor. An overweight in Canadian Pacific Kansas City Limited (+9%) - another of the fund's largest holdings - also hurt.
•By sector, the biggest contributors to performance versus the benchmark were picks and an overweight in information technology, primarily within the software & services industry. Stock choices in consumer discretionary and communication services also boosted the fund's relative performance.
•The top individual relative contributor this period was avoiding BCE, a benchmark component that returned about -6%. Not owning Cenovus Energy, a benchmark component that returned -13%, was the second-largest relative contributor. An overweight in Brookfield Asset Management (+91%) also helped.
•By sector, meaningful changes in positioning include increased exposure to information technology.
How did the Fund perform over the past 10 years?
CUMULATIVE PERFORMANCE
October 31, 2014 through October 31, 2024.
Initial investment of $10,000.
Fidelity® Canada Fund | $10,000 | $8,592 | $9,261 | $10,589 | $9,966 | $11,132 | $10,308 | $15,454 | $14,408 | $14,578 | $18,440 |
S&P/TSX Composite Index | $10,000 | $8,219 | $9,044 | $10,482 | $9,938 | $11,246 | $10,831 | $16,167 | $13,973 | $13,788 | $18,134 |
| | 2014 | 2015 | 2016 | 2017 | 2018 | 2019 | 2020 | 2021 | 2022 | 2023 | 2024 |
AVERAGE ANNUAL TOTAL RETURNS:| | 1 Year | 5 Year | 10 Year |
| Fidelity® Canada Fund | 26.49% | 10.62% | 6.31% |
| S&P/TSX Composite Index | 31.52% | 10.03% | 6.13% |
Visit www.fidelity.com for more recent performance information. |
The Fund's past performance is not a good predictor of the Fund's future performance. The graph and table do not reflect the deduction of taxes that a shareholder would pay on fund distributions or redemption of fund shares. |
Key Fund Statistics(as of October 31, 2024)
KEY FACTS | | |
| Fund Size | $942,476,918 | |
| Number of Holdings | 63 | |
| Total Advisory Fee | $8,782,874 | |
| Portfolio Turnover | 8% | |
What did the Fund invest in?
(as of October 31, 2024)
MARKET SECTORS (% of Fund's net assets) | | |
| Financials | 27.5 | |
| Energy | 17.5 | |
| Industrials | 13.0 | |
| Information Technology | 11.1 | |
| Materials | 11.1 | |
| Consumer Staples | 8.6 | |
| Consumer Discretionary | 7.0 | |
| Communication Services | 2.8 | |
| Health Care | 0.7 | |
| |
| Common Stocks | 99.3 |
| Bonds | 0.2 |
| Preferred Stocks | 0.0 |
| Short-Term Investments and Net Other Assets (Liabilities) | 0.5 |
ASSET ALLOCATION (% of Fund's net assets) |
|
|
| Canada | 94.0 |
| United States | 2.7 |
| Brazil | 2.6 |
| Chile | 0.7 |
GEOGRAPHIC DIVERSIFICATION (% of Fund's net assets) |
|
| |
|
TOP HOLDINGS(% of Fund's net assets) | | |
| Royal Bank of Canada | 8.6 | |
| Canadian Pacific Kansas City Ltd | 5.7 | |
| Constellation Software Inc/Canada | 5.6 | |
| Alimentation Couche-Tard Inc | 4.9 | |
| Canadian Natural Resources Ltd | 4.8 | |
| PrairieSky Royalty Ltd | 4.0 | |
| Franco-Nevada Corp | 3.8 | |
| Suncor Energy Inc | 3.5 | |
| Dollarama Inc | 3.5 | |
| Shopify Inc Class A | 3.4 | |
| | 47.8 | |
How has the Fund changed?
This is a summary of certain changes to the Fund since November 1, 2023. For more complete information, you may review the Fund's next prospectus, which we expect to be available by December 30, 2024 at fundresearch.fidelity.com/prospectus/sec or upon request at 1-800-544-8544 or by sending an e-mail to fidfunddocuments@fidelity.com.
The fund's transfer agent and pricing & bookkeeping fees were changed to a fixed rate effective December 1, 2023, through February 29, 2024, in anticipation of the transition to a new management fee structure. Effective March 1, 2024, the fund's management contract was amended to incorporate administrative services previously covered under separate services agreements (transfer agent and pricing & bookkeeping). The amended contract incorporates a basic fee rate that may vary by class (subject to a performance adjustment). The Adviser or an affiliate pays certain expenses of managing and operating the fund out of each class's management fee. | |
| Fidelity, the Fidelity Investments Logo and all other Fidelity trademarks or service marks used herein are trademarks or service marks of FMR LLC. Any third-party marks that are used herein are trademarks or service marks of their respective owners. © 2024 FMR LLC. All rights reserved. |
| | For additional information about the Fund; including its prospectus, financial information, holdings and proxy information, scan the QR code or visit fundresearch.fidelity.com/prospectus/sec 1.9913848.100 309-TSRA-1224 |
| |
| | ANNUAL SHAREHOLDER REPORT | AS OF OCTOBER 31, 2024 | This report describes changes to the Fund that occurred during the reporting period. |
| | Fidelity® International Value Fund Fidelity Advisor® International Value Fund Class M : FIVPX |
| | | |
This annual shareholder report contains information about Fidelity® International Value Fund for the period November 1, 2023 to October 31, 2024. You can find additional information about the Fund at fundresearch.fidelity.com/prospectus/sec. You can also request this information by contacting us at 1-877-208-0098 or by sending an e-mail to fidfunddocuments@fidelity.com.
What were your Fund costs for the last year?(based on hypothetical $10,000 investment)
FUND COST (PREVIOUS YEAR)
| | Costs of a $10,000 investment | Costs paid as a percentage of a $10,000 investment | |
| Class M | $ 155 | 1.39% | |
What affected the Fund's performance this period?
•International stocks achieved a strong gain for the 12 months ending October 31, 2024. Resilient global economic growth and a slowing in the pace of inflation in certain regions, as well as a shift to global monetary easing, contributed to a favorable backdrop, despite persistent geopolitical risk.
•Against this backdrop, stock selection in Japan and security selection and an overweight in the United States contributed to the fund's performance versus the MSCI EAFE Value Index (Net MA) for the fiscal year.
•By sector, security selection was the primary contributor, especially within industrials, where our stock picks in capital goods helped most. Security selection in materials also boosted the fund's relative performance. Also contributing to our result was an overweight in financials.
•The top individual relative contributor was an overweight in Hitachi (+110%). The company was among the fund's biggest holdings. A second notable relative contributor was an overweight in Mitsubishi Heavy Industries (+162%). This was a stake we established this period. Another notable relative contributor was our non-benchmark stake in Rheinmetall (+82%). The stock was among our biggest holdings this period.
•In contrast, from a regional standpoint, stock picks in the U.K. and Asia Pacific ex Japan, primarily in Australia, detracted from the fund's relative result.
•By sector, the biggest detractor from performance versus the benchmark was stock selection in information technology. Stock picking in financials also hampered the fund's result. Also hurting our result was an overweight in energy.
•The largest individual relative detractor was an overweight in BHP (+5%). The stock was among the fund's biggest holdings. A second notable relative detractor was an overweight in GSK (-11%). This was a stake we established this period. A non-benchmark stake in Prudential returned -19% and notably hurt.
•Notable changes in positioning include decreased exposure to France and Australia. By sector, meaningful changes in positioning include lower allocations to consumer discretionary and energy.
How did the Fund perform over the past 10 years?
CUMULATIVE PERFORMANCE
October 31, 2014 through October 31, 2024.
Initial investment of $10,000 and the current sales charge was paid.
Class M | $9,650 | $9,545 | $9,045 | $10,768 | $9,735 | $10,135 | $8,687 | $12,353 | $10,172 | $11,948 | $14,680 |
MSCI EAFE Value Index | $10,000 | $9,591 | $9,294 | $11,477 | $10,621 | $11,237 | $9,189 | $12,742 | $10,687 | $12,659 | $15,588 |
MSCI EAFE Index | $10,000 | $10,008 | $9,705 | $12,004 | $11,206 | $12,472 | $11,638 | $15,647 | $12,073 | $13,841 | $17,059 |
| | 2014 | 2015 | 2016 | 2017 | 2018 | 2019 | 2020 | 2021 | 2022 | 2023 | 2024 |
AVERAGE ANNUAL TOTAL RETURNS:| | 1 Year | 5 Year | 10 Year |
| Class M (incl. 3.50% sales charge) | 18.57% | 6.93% | 3.91% |
| Class M (without 3.50% sales charge) | 22.87% | 7.69% | 4.28% |
| MSCI EAFE Value Index | 23.14% | 6.76% | 4.54% |
| MSCI EAFE Index | 23.25% | 6.46% | 5.49% |
Visit institutional.fidelity.com for more recent performance information. |
The Fund's past performance is not a good predictor of the Fund's future performance. The graph and table do not reflect the deduction of taxes that a shareholder would pay on fund distributions or redemption of fund shares. |
Key Fund Statistics(as of October 31, 2024)
KEY FACTS | | |
| Fund Size | $1,472,284,197 | |
| Number of Holdings | 101 | |
| Total Advisory Fee | $8,618,481 | |
| Portfolio Turnover | 29% | |
What did the Fund invest in?
(as of October 31, 2024)
MARKET SECTORS (% of Fund's net assets) | | |
| Financials | 35.1 | |
| Industrials | 18.0 | |
| Materials | 13.0 | |
| Energy | 8.4 | |
| Consumer Discretionary | 5.0 | |
| Health Care | 4.7 | |
| Information Technology | 4.3 | |
| Consumer Staples | 3.9 | |
| Communication Services | 3.0 | |
| Real Estate | 0.9 | |
| Utilities | 0.6 | |
| |
| Common Stocks | 96.5 |
| Preferred Stocks | 0.4 |
| Short-Term Investments and Net Other Assets (Liabilities) | 3.1 |
ASSET ALLOCATION (% of Fund's net assets) |
|
|
| Japan | 22.8 |
| United Kingdom | 14.8 |
| United States | 13.1 |
| Germany | 11.4 |
| France | 9.8 |
| Australia | 6.1 |
| Italy | 5.0 |
| Spain | 3.4 |
| Switzerland | 3.3 |
| Others | 10.3 |
GEOGRAPHIC DIVERSIFICATION (% of Fund's net assets) |
|
| |
|
TOP HOLDINGS(% of Fund's net assets) | | |
| Shell PLC ADR | 3.7 | |
| Hitachi Ltd | 2.8 | |
| Banco Santander SA | 2.4 | |
| AXA SA | 2.3 | |
| CRH PLC | 2.2 | |
| BAE Systems PLC | 2.1 | |
| BHP Group Ltd | 2.1 | |
| Rheinmetall AG | 2.1 | |
| TotalEnergies SE | 2.0 | |
| Mitsubishi UFJ Financial Group Inc | 2.0 | |
| | 23.7 | |
How has the Fund changed?
This is a summary of certain changes to the Fund since November 1, 2023. For more complete information, you may review the Fund's next prospectus, which we expect to be available by December 30, 2024 at fundresearch.fidelity.com/prospectus/sec or upon request at 1-877-208-0098 or by sending an e-mail to fidfunddocuments@fidelity.com.
The fees associated with this class changed during the reporting year.The variations in class fees are primarily the result of the following changes: - Management fee
- Operating expenses
- Performance adjustment fee
- Expense reductions
The fund's transfer agent and pricing & bookkeeping fees were changed to a fixed rate effective December 1, 2023, through February 29, 2024, in anticipation of the transition to a new management fee structure. Effective March 1, 2024, the fund's management contract was amended to incorporate administrative services previously covered under separate services agreements (transfer agent and pricing & bookkeeping). The amended contract incorporates a basic fee rate that may vary by class (subject to a performance adjustment). The Adviser or an affiliate pays certain expenses of managing and operating the fund out of each class's management fee. | The fund's sub-advisory agreement with FIL Investments (Japan) Limited was not renewed.
|
| Fidelity, the Fidelity Investments Logo and all other Fidelity trademarks or service marks used herein are trademarks or service marks of FMR LLC. Any third-party marks that are used herein are trademarks or service marks of their respective owners. © 2024 FMR LLC. All rights reserved. |
| | For additional information about the Fund; including its prospectus, financial information, holdings and proxy information, scan the QR code or visit fundresearch.fidelity.com/prospectus/sec 1.9913939.100 1615-TSRA-1224 |
| |
| | ANNUAL SHAREHOLDER REPORT | AS OF OCTOBER 31, 2024 | This report describes changes to the Fund that occurred during the reporting period. |
| | Fidelity® Japan Fund Fidelity Advisor® Japan Fund Class A : FPJAX |
| | | |
This annual shareholder report contains information about Fidelity® Japan Fund for the period November 1, 2023 to October 31, 2024. You can find additional information about the Fund at fundresearch.fidelity.com/prospectus/sec. You can also request this information by contacting us at 1-877-208-0098 or by sending an e-mail to fidfunddocuments@fidelity.com.
What were your Fund costs for the last year?(based on hypothetical $10,000 investment)
FUND COST (PREVIOUS YEAR)
| | Costs of a $10,000 investment | Costs paid as a percentage of a $10,000 investment | |
| Class A | $ 108 | 0.97% | |
What affected the Fund's performance this period?
•International stocks achieved a strong gain for the 12 months ending October 31, 2024. Resilient global economic growth and a slowing in the pace of inflation in certain regions, as well as a shift to global monetary easing, contributed to a favorable backdrop, despite persistent geopolitical risk.
•With that said, in March 2024, the Bank of Japan raised short-term interest rates for the first time in 17 years, ending its negative interest rate policy.
•Against this backdrop, stock selection in Japan and a non-benchmark allocation to the United States contributed to the fund's performance versus the TOPIX Total Return Index for the fiscal year.
•By sector, security selection was the primary contributor, led by industrials, where our stock picks in capital goods helped most. Stock picking in financials and consumer discretionary also boosted the fund's relative performance.
•The top individual relative contributor was an overweight in IHI (+196%). The second-largest relative contributor was an overweight in Hitachi (+109%). The stock was among the fund's largest holdings. An overweight in Dexerials (+115%) also helped. We trimmed our stakes in all three stocks.
•In contrast, from a regional standpoint, non-benchmark allocations to emerging markets and Asia Pacific ex Japan modestly detracted from the fund's relative result.
•By sector, the biggest detractor from performance versus the benchmark was stock selection in information technology, primarily within the semiconductors & semiconductor equipment industry. Security selection in energy also hampered the fund's result. Also hurting our result was an underweight in industrials, primarily within the capital goods industry.
•The largest individual relative detractor this period was avoiding Recruit Holdings, a benchmark component that gained 120%. The second-largest relative detractor was our non-benchmark stake in JTOWER (-31%). The stock was not held at period end. An overweight in TechnoPro Holdings (-4%) also hurt, and we reduced our exposure to the stock.
•By sector, meaningful changes in positioning include increased exposure to materials and industrials.
How did the Fund perform over the past 10 years?
CUMULATIVE PERFORMANCE
October 31, 2014 through October 31, 2024.
Initial investment of $10,000 and the current sales charge was paid.
Class A | $9,425 | $9,643 | $10,275 | $12,402 | $11,722 | $13,089 | $14,641 | $17,777 | $12,555 | $13,785 | $17,017 |
Tokyo Stock Price Index (TOPIX) | $10,000 | $11,061 | $11,611 | $13,898 | $13,325 | $14,450 | $14,503 | $17,203 | $13,066 | $15,363 | $18,700 |
| | 2014 | 2015 | 2016 | 2017 | 2018 | 2019 | 2020 | 2021 | 2022 | 2023 | 2024 |
AVERAGE ANNUAL TOTAL RETURNS:| | 1 Year | 5 Year | 10 Year |
| Class A (incl. 5.75% sales charge) | 16.34% | 4.15% | 5.46% |
| Class A (without 5.75% sales charge) | 23.44% | 5.39% | 6.09% |
| Tokyo Stock Price Index (TOPIX) | 21.72% | 5.29% | 6.46% |
Visit institutional.fidelity.com for more recent performance information. |
The Fund's past performance is not a good predictor of the Fund's future performance. The graph and table do not reflect the deduction of taxes that a shareholder would pay on fund distributions or redemption of fund shares. |
Key Fund Statistics(as of October 31, 2024)
KEY FACTS | | |
| Fund Size | $692,986,086 | |
| Number of Holdings | 89 | |
| Total Advisory Fee | $3,522,427 | |
| Portfolio Turnover | 21% | |
What did the Fund invest in?
(as of October 31, 2024)
MARKET SECTORS (% of Fund's net assets) | | |
| Industrials | 25.1 | |
| Information Technology | 18.9 | |
| Consumer Discretionary | 14.7 | |
| Financials | 13.4 | |
| Materials | 7.8 | |
| Health Care | 7.1 | |
| Communication Services | 4.2 | |
| Consumer Staples | 3.2 | |
| Energy | 1.9 | |
| Utilities | 1.9 | |
| Real Estate | 1.1 | |
| |
| Common Stocks | 99.3 |
| Short-Term Investments and Net Other Assets (Liabilities) | 0.7 |
ASSET ALLOCATION (% of Fund's net assets) |
|
|
| Japan | 98.4 |
| United States | 1.0 |
| China | 0.6 |
GEOGRAPHIC DIVERSIFICATION (% of Fund's net assets) |
|
| |
|
TOP HOLDINGS(% of Fund's net assets) | | |
| Sumitomo Mitsui Financial Group Inc | 6.0 | |
| Hitachi Ltd | 5.0 | |
| Sony Group Corp | 3.8 | |
| Shin-Etsu Chemical Co Ltd | 3.3 | |
| Hoya Corp | 3.3 | |
| ORIX Corp | 3.1 | |
| Renesas Electronics Corp | 2.7 | |
| Fujitsu Ltd | 2.6 | |
| FUJIFILM Holdings Corp | 2.4 | |
| Denso Corp | 2.3 | |
| | 34.5 | |
How has the Fund changed?
This is a summary of certain changes to the Fund since November 1, 2023. For more complete information, you may review the Fund's next prospectus, which we expect to be available by December 30, 2024 at fundresearch.fidelity.com/prospectus/sec or upon request at 1-877-208-0098 or by sending an e-mail to fidfunddocuments@fidelity.com.
The fees associated with this class changed during the reporting year.The variations in class fees are primarily the result of the following changes: - Management fee
- Performance adjustment fee
- Operating expenses
The fund's transfer agent and pricing & bookkeeping fees were changed to a fixed rate effective December 1, 2023, through February 29, 2024, in anticipation of the transition to a new management fee structure. Effective March 1, 2024, the fund's management contract was amended to incorporate administrative services previously covered under separate services agreements (transfer agent and pricing & bookkeeping). The amended contract incorporates a basic fee rate that may vary by class (subject to a performance adjustment). The Adviser or an affiliate pays certain expenses of managing and operating the fund out of each class's management fee. | The fund's sub-advisory agreement with FIL Investments (Japan) Limited was not renewed.
|
| Fidelity, the Fidelity Investments Logo and all other Fidelity trademarks or service marks used herein are trademarks or service marks of FMR LLC. Any third-party marks that are used herein are trademarks or service marks of their respective owners. © 2024 FMR LLC. All rights reserved. |
| | For additional information about the Fund; including its prospectus, financial information, holdings and proxy information, scan the QR code or visit fundresearch.fidelity.com/prospectus/sec 1.9913882.100 2256-TSRA-1224 |
| |
| | ANNUAL SHAREHOLDER REPORT | AS OF OCTOBER 31, 2024 | This report describes changes to the Fund that occurred during the reporting period. |
| | Fidelity® Total International Equity Fund Fidelity Advisor® Total International Equity Fund Class A : FTAEX |
| | | |
This annual shareholder report contains information about Fidelity® Total International Equity Fund for the period November 1, 2023 to October 31, 2024. You can find additional information about the Fund at fundresearch.fidelity.com/prospectus/sec. You can also request this information by contacting us at 1-877-208-0098 or by sending an e-mail to fidfunddocuments@fidelity.com.
What were your Fund costs for the last year?(based on hypothetical $10,000 investment)
FUND COST (PREVIOUS YEAR)
| | Costs of a $10,000 investment | Costs paid as a percentage of a $10,000 investment | |
| Class A | $ 139 | 1.24% | |
What affected the Fund's performance this period?
•International stocks achieved a strong gain for the 12 months ending October 31, 2024. Resilient global economic growth and a slowing in the pace of inflation in certain regions, as well as a shift to global monetary easing, contributed to a favorable backdrop, despite persistent geopolitical risk.
•Against this backdrop, an overweight in the United States and stock picks in Japan contributed to the fund's performance versus the MSCI All Country World ex US Index (Net MA) for the fiscal year.
•By sector, the biggest contributor to performance versus the benchmark was stock selection in materials. An underweight in consumer staples also boosted relative performance. Also bolstering our relative result were picks and an overweight in industrials, primarily within the capital goods industry.
•The top individual relative contributor was an overweight in Taiwan Semiconductor (+100%). The company was the fund's largest holding. The second-largest relative contributor was an overweight in CRH (+83%). The stock was among our largest holdings. An overweight in China Life Insurance (+65%) also contributed.
•In contrast, from a regional standpoint, stock picks in Canada and the United States detracted from the fund's relative result.
•By sector, the biggest detractor from performance versus the benchmark was stock selection in financials. Also hurting our result was security selection in information technology, primarily within the technology hardware & equipment industry, and consumer staples, primarily within the consumer staples distribution & retail industry. Lastly, the fund's position in cash detracted.
•The largest individual relative detractor was an overweight in Samsung Electronics (-13%). The stock was among our biggest holdings. The second-largest relative detractor was an overweight in Wal Mart De Mexico (-21%). This period we increased our stake in Wal Mart De Mexico. An overweight in Edenred (-38%) also detracted.
•Notable changes in positioning include higher allocations to Germany and the United Kingdom. By sector, meaningful changes in positioning include decreased exposure to consumer discretionary and energy.
How did the Fund perform over the past 10 years?
CUMULATIVE PERFORMANCE
October 31, 2014 through October 31, 2024.
Initial investment of $10,000 and the current sales charge was paid.
Class A | $9,425 | $9,341 | $9,270 | $11,475 | $10,437 | $11,965 | $12,480 | $16,604 | $12,380 | $13,948 | $17,471 |
MSCI ACWI (All Country World Index) ex USA Index | $10,000 | $9,545 | $9,583 | $11,868 | $10,910 | $12,161 | $11,862 | $15,403 | $11,613 | $13,038 | $16,238 |
| | 2014 | 2015 | 2016 | 2017 | 2018 | 2019 | 2020 | 2021 | 2022 | 2023 | 2024 |
AVERAGE ANNUAL TOTAL RETURNS:| | 1 Year | 5 Year | 10 Year |
| Class A (incl. 5.75% sales charge) | 18.05% | 6.59% | 5.74% |
| Class A (without 5.75% sales charge) | 25.25% | 7.86% | 6.37% |
| MSCI ACWI (All Country World Index) ex USA Index | 24.55% | 5.95% | 4.97% |
Visit institutional.fidelity.com for more recent performance information. |
The Fund's past performance is not a good predictor of the Fund's future performance. The graph and table do not reflect the deduction of taxes that a shareholder would pay on fund distributions or redemption of fund shares. |
Key Fund Statistics(as of October 31, 2024)
KEY FACTS | | |
| Fund Size | $319,759,338 | |
| Number of Holdings | 305 | |
| Total Advisory Fee | $2,246,403 | |
| Portfolio Turnover | 33% | |
What did the Fund invest in?
(as of October 31, 2024)
MARKET SECTORS (% of Fund's net assets) | | |
| Financials | 23.8 | |
| Industrials | 20.0 | |
| Information Technology | 14.0 | |
| Materials | 10.5 | |
| Consumer Discretionary | 9.5 | |
| Health Care | 5.5 | |
| Energy | 5.0 | |
| Communication Services | 4.2 | |
| Consumer Staples | 3.6 | |
| Real Estate | 0.3 | |
| Utilities | 0.2 | |
| |
| Common Stocks | 96.4 |
| Preferred Stocks | 0.2 |
| Short-Term Investments and Net Other Assets (Liabilities) | 3.4 |
ASSET ALLOCATION (% of Fund's net assets) |
|
|
| United States | 14.5 |
| Japan | 10.8 |
| China | 9.3 |
| United Kingdom | 8.6 |
| France | 6.5 |
| Canada | 6.3 |
| Germany | 5.9 |
| Taiwan | 4.8 |
| Korea (South) | 3.9 |
| Others | 29.4 |
GEOGRAPHIC DIVERSIFICATION (% of Fund's net assets) |
|
| |
|
TOP HOLDINGS(% of Fund's net assets) | | |
| Taiwan Semiconductor Manufacturing Co Ltd | 3.4 | |
| Tencent Holdings Ltd | 2.5 | |
| CRH PLC | 1.8 | |
| Samsung Electronics Co Ltd | 1.8 | |
| SAP SE | 1.6 | |
| Novo Nordisk A/S Series B | 1.6 | |
| Linde PLC | 1.6 | |
| ASML Holding NV | 1.5 | |
| Canadian Pacific Kansas City Ltd | 1.5 | |
| BAE Systems PLC | 1.3 | |
| | 18.6 | |
How has the Fund changed?
This is a summary of certain changes to the Fund since November 1, 2023. For more complete information, you may review the Fund's next prospectus, which we expect to be available by December 30, 2024 at fundresearch.fidelity.com/prospectus/sec or upon request at 1-877-208-0098 or by sending an e-mail to fidfunddocuments@fidelity.com.
The fees associated with this class changed during the reporting year.The variations in class fees are primarily the result of the following changes: - Management fee
- Operating expenses
- Performance adjustment fee
- Expense reductions
The fund's transfer agent and pricing & bookkeeping fees were changed to a fixed rate effective December 1, 2023, through February 29, 2024, in anticipation of the transition to a new management fee structure. Effective March 1, 2024, the fund's management contract was amended to incorporate administrative services previously covered under separate services agreements (transfer agent and pricing & bookkeeping). The amended contract incorporates a basic fee rate that may vary by class (subject to a performance adjustment). The Adviser or an affiliate pays certain expenses of managing and operating the fund out of each class's management fee. The class reduced its contractual expense cap during the reporting period. |
|
The fund's sub-advisory agreement with FIL Investments (Japan) Limited was not renewed. | |
| Fidelity, the Fidelity Investments Logo and all other Fidelity trademarks or service marks used herein are trademarks or service marks of FMR LLC. Any third-party marks that are used herein are trademarks or service marks of their respective owners. © 2024 FMR LLC. All rights reserved. |
| | For additional information about the Fund; including its prospectus, financial information, holdings and proxy information, scan the QR code or visit fundresearch.fidelity.com/prospectus/sec 1.9913943.100 1980-TSRA-1224 |
| |
| | ANNUAL SHAREHOLDER REPORT | AS OF OCTOBER 31, 2024 | This report describes changes to the Fund that occurred during the reporting period. |
| | Fidelity® Emerging Markets Fund Fidelity® Emerging Markets Fund : FEMKX |
| | | |
This annual shareholder report contains information about Fidelity® Emerging Markets Fund for the period November 1, 2023 to October 31, 2024. You can find additional information about the Fund at fundresearch.fidelity.com/prospectus/sec. You can also request this information by contacting us at 1-800-544-8544 or by sending an e-mail to fidfunddocuments@fidelity.com.
What were your Fund costs for the last year?(based on hypothetical $10,000 investment)
FUND COST (PREVIOUS YEAR)
| | Costs of a $10,000 investment | Costs paid as a percentage of a $10,000 investment | |
| Fidelity® Emerging Markets Fund | $ 98 | 0.87% | |
What affected the Fund's performance this period?
•International stocks achieved a strong gain for the 12 months ending October 31, 2024. Resilient global economic growth and a slowing in the pace of inflation in certain regions, as well as a shift to global monetary easing, contributed to a favorable backdrop, despite persistent geopolitical risk.
•Against this backdrop, a non-benchmark allocation to developed markets - especially the U.S. - and stock picks in Taiwan contributed to the fund's performance versus the MSCI Emerging Markets (Net MA) Index for the fiscal year.
•By sector, the biggest contributors to performance versus the benchmark were stock picking and an overweight in information technology, primarily within the semiconductors & semiconductor equipment industry. An underweight in materials also boosted the fund's relative performance. Also bolstering our relative result was stock picking in consumer discretionary.
•The fund's non-benchmark stake in Nvidia gained 223% and was the top individual relative contributor. This period we decreased our investment in Nvidia. The stock was among our largest holdings. A second notable relative contributor was our non-benchmark stake in International Games System (+242%). This period we decreased our investment in International Games System. An overweight in Taiwan Semiconductor Manufacturing (+99%) also helped. The stock was the fund's largest holding.
•In contrast, from a geographical standpoint, stock picks in India and South Korea detracted from the fund's relative result.
•By sector, the biggest detractor from performance versus the benchmark was stock picking in financials. Also hurting our result were picks and overweights in consumer staples and health care.
•The largest individual relative detractor was an underweight in Alibaba (+23%). The stock was not held at period end. The second-largest relative detractor was an overweight in Kweichow Moutai (-4%). The company was among the fund's largest holdings this period. Another notable relative detractor this period was avoiding Hon Hai Precision Industry, a benchmark component that gained approximately 128%.
•Notable changes in positioning include decreased exposure to India and Saudi Arabia, and a higher allocation to China and Taiwan. By sector, meaningful changes in positioning include decreased exposure to materials and a higher allocation to industrials.
How did the Fund perform over the past 10 years?
CUMULATIVE PERFORMANCE
October 31, 2014 through October 31, 2024.
Initial investment of $10,000.
Fidelity® Emerging Markets Fund | $10,000 | $8,924 | $9,644 | $12,558 | $10,737 | $13,411 | $16,641 | $19,941 | $12,398 | $14,327 | $18,055 |
MSCI Emerging Markets Index | $10,000 | $8,550 | $9,346 | $11,823 | $10,347 | $11,577 | $12,535 | $14,663 | $10,115 | $11,211 | $14,051 |
| | 2014 | 2015 | 2016 | 2017 | 2018 | 2019 | 2020 | 2021 | 2022 | 2023 | 2024 |
AVERAGE ANNUAL TOTAL RETURNS:| | 1 Year | 5 Year | 10 Year |
| Fidelity® Emerging Markets Fund | 26.02% | 6.13% | 6.09% |
| MSCI Emerging Markets Index | 25.33% | 3.95% | 3.46% |
Visit www.fidelity.com for more recent performance information. |
The Fund's past performance is not a good predictor of the Fund's future performance. The graph and table do not reflect the deduction of taxes that a shareholder would pay on fund distributions or redemption of fund shares. |
Key Fund Statistics(as of October 31, 2024)
KEY FACTS | | |
| Fund Size | $8,930,817,606 | |
| Number of Holdings | 86 | |
| Total Advisory Fee | $66,535,420 | |
| Portfolio Turnover | 46% | |
What did the Fund invest in?
(as of October 31, 2024)
MARKET SECTORS (% of Fund's net assets) | | |
| Information Technology | 28.4 | |
| Financials | 17.2 | |
| Consumer Discretionary | 12.9 | |
| Industrials | 9.5 | |
| Communication Services | 9.3 | |
| Energy | 6.2 | |
| Consumer Staples | 5.4 | |
| Health Care | 5.3 | |
| Materials | 2.0 | |
| Utilities | 1.7 | |
| Real Estate | 0.6 | |
| |
| Common Stocks | 98.3 |
| Bonds | 0.3 |
| Preferred Stocks | 0.2 |
| Short-Term Investments and Net Other Assets (Liabilities) | 1.2 |
ASSET ALLOCATION (% of Fund's net assets) |
|
|
| China | 24.6 |
| India | 18.4 |
| Taiwan | 16.2 |
| Brazil | 6.6 |
| Korea (South) | 6.4 |
| United States | 6.3 |
| Indonesia | 3.8 |
| Saudi Arabia | 3.0 |
| Mexico | 2.8 |
| Others | 11.9 |
GEOGRAPHIC DIVERSIFICATION (% of Fund's net assets) |
|
| |
|
TOP HOLDINGS(% of Fund's net assets) | | |
| Taiwan Semiconductor Manufacturing Co Ltd | 13.5 | |
| Tencent Holdings Ltd | 6.6 | |
| NVIDIA Corp | 4.0 | |
| Meituan B Shares | 3.1 | |
| PDD Holdings Inc Class A ADR | 3.1 | |
| Samsung Electronics Co Ltd | 3.0 | |
| Bank Central Asia Tbk PT | 2.9 | |
| HDFC Bank Ltd | 2.6 | |
| SK Hynix Inc | 2.2 | |
| JD.com Inc ADR | 2.1 | |
| | 43.1 | |
How has the Fund changed?
This is a summary of certain changes to the Fund since November 1, 2023. For more complete information, you may review the Fund's next prospectus, which we expect to be available by December 30, 2024 at fundresearch.fidelity.com/prospectus/sec or upon request at 1-800-544-8544 or by sending an e-mail to fidfunddocuments@fidelity.com.
Fidelity® Latin America Fund merged into Fidelity® Emerging Markets Fund on September 13, 2024. | The fund's transfer agent and pricing & bookkeeping fees were changed to a fixed rate effective December 1, 2023, through February 29, 2024, in anticipation of the transition to a new management fee structure. Effective March 1, 2024, the fund's management contract was amended to incorporate administrative services previously covered under separate services agreements (transfer agent and pricing & bookkeeping). The amended contract incorporates a management fee rate that may vary by class. The Adviser or an affiliate pays certain expenses of managing and operating the fund out of each class's management fee.
|
The fund's sub-advisory agreement with FIL Investments (Japan) Limited was not renewed. | |
| Fidelity, the Fidelity Investments Logo and all other Fidelity trademarks or service marks used herein are trademarks or service marks of FMR LLC. Any third-party marks that are used herein are trademarks or service marks of their respective owners. © 2024 FMR LLC. All rights reserved. |
| | For additional information about the Fund; including its prospectus, financial information, holdings and proxy information, scan the QR code or visit fundresearch.fidelity.com/prospectus/sec 1.9913859.100 322-TSRA-1224 |
| |
| | ANNUAL SHAREHOLDER REPORT | AS OF OCTOBER 31, 2024 | This report describes changes to the Fund that occurred during the reporting period. |
| | Fidelity® Canada Fund Fidelity Advisor® Canada Fund Class Z : FIQEX |
| | | |
This annual shareholder report contains information about Fidelity® Canada Fund for the period November 1, 2023 to October 31, 2024. You can find additional information about the Fund at fundresearch.fidelity.com/prospectus/sec. You can also request this information by contacting us at 1-877-208-0098 or by sending an e-mail to fidfunddocuments@fidelity.com.
What were your Fund costs for the last year?(based on hypothetical $10,000 investment)
FUND COST (PREVIOUS YEAR)
| | Costs of a $10,000 investment | Costs paid as a percentage of a $10,000 investment | |
| Class Z | $ 105 | 0.92% | |
What affected the Fund's performance this period?
•International stocks achieved a strong gain for the 12 months ending October 31, 2024. Resilient global economic growth and a slowing in the pace of inflation in certain regions, as well as a shift to global monetary easing, contributed to a favorable backdrop, despite persistent geopolitical risk.
•Against this backdrop, stock picking in Canada's materials sector, and stock selection and an underweight in financials, primarily within the banking industry, detracted most from the fund's performance versus the S&P/TSX Composite Index for the fiscal year.
•The largest individual relative detractor was an overweight in Alimentation Couche-Tard (-3%). The stock was among the fund's largest holdings. Not owning Canadian Imperial Bank of Commerce, a benchmark component that gained 87%, was the second-largest relative detractor. An overweight in Canadian Pacific Kansas City Limited (+9%) - another of the fund's largest holdings - also hurt.
•By sector, the biggest contributors to performance versus the benchmark were picks and an overweight in information technology, primarily within the software & services industry. Stock choices in consumer discretionary and communication services also boosted the fund's relative performance.
•The top individual relative contributor this period was avoiding BCE, a benchmark component that returned about -6%. Not owning Cenovus Energy, a benchmark component that returned -13%, was the second-largest relative contributor. An overweight in Brookfield Asset Management (+91%) also helped.
•By sector, meaningful changes in positioning include increased exposure to information technology.
How did the Fund perform over the life of Fund?
CUMULATIVE PERFORMANCE
October 2, 2018 through October 31, 2024.
Initial investment of $10,000.
Class Z | $10,000 | $9,262 | $10,361 | $9,610 | $14,428 | $13,467 | $13,646 |
S&P/TSX Composite Index | $10,000 | $9,178 | $10,386 | $10,002 | $14,930 | $12,904 | $12,734 |
| | 2018 | 2019 | 2020 | 2021 | 2022 | 2023 | 2024 |
AVERAGE ANNUAL TOTAL RETURNS:| | 1 Year | 5 Year | Life of Fund A |
| Class Z | 26.62% | 10.77% | 9.40% |
| S&P/TSX Composite Index | 31.52% | 10.03% | 8.84% |
A From October 2, 2018
Visit institutional.fidelity.com for more recent performance information. |
The Fund's past performance is not a good predictor of the Fund's future performance. The graph and table do not reflect the deduction of taxes that a shareholder would pay on fund distributions or redemption of fund shares. |
Key Fund Statistics(as of October 31, 2024)
KEY FACTS | | |
| Fund Size | $942,476,918 | |
| Number of Holdings | 63 | |
| Total Advisory Fee | $8,782,874 | |
| Portfolio Turnover | 8% | |
What did the Fund invest in?
(as of October 31, 2024)
MARKET SECTORS (% of Fund's net assets) | | |
| Financials | 27.5 | |
| Energy | 17.5 | |
| Industrials | 13.0 | |
| Information Technology | 11.1 | |
| Materials | 11.1 | |
| Consumer Staples | 8.6 | |
| Consumer Discretionary | 7.0 | |
| Communication Services | 2.8 | |
| Health Care | 0.7 | |
| |
| Common Stocks | 99.3 |
| Bonds | 0.2 |
| Preferred Stocks | 0.0 |
| Short-Term Investments and Net Other Assets (Liabilities) | 0.5 |
ASSET ALLOCATION (% of Fund's net assets) |
|
|
| Canada | 94.0 |
| United States | 2.7 |
| Brazil | 2.6 |
| Chile | 0.7 |
GEOGRAPHIC DIVERSIFICATION (% of Fund's net assets) |
|
| |
|
TOP HOLDINGS(% of Fund's net assets) | | |
| Royal Bank of Canada | 8.6 | |
| Canadian Pacific Kansas City Ltd | 5.7 | |
| Constellation Software Inc/Canada | 5.6 | |
| Alimentation Couche-Tard Inc | 4.9 | |
| Canadian Natural Resources Ltd | 4.8 | |
| PrairieSky Royalty Ltd | 4.0 | |
| Franco-Nevada Corp | 3.8 | |
| Suncor Energy Inc | 3.5 | |
| Dollarama Inc | 3.5 | |
| Shopify Inc Class A | 3.4 | |
| | 47.8 | |
How has the Fund changed?
This is a summary of certain changes to the Fund since November 1, 2023. For more complete information, you may review the Fund's next prospectus, which we expect to be available by December 30, 2024 at fundresearch.fidelity.com/prospectus/sec or upon request at 1-877-208-0098 or by sending an e-mail to fidfunddocuments@fidelity.com.
The fund's transfer agent and pricing & bookkeeping fees were changed to a fixed rate effective December 1, 2023, through February 29, 2024, in anticipation of the transition to a new management fee structure. Effective March 1, 2024, the fund's management contract was amended to incorporate administrative services previously covered under separate services agreements (transfer agent and pricing & bookkeeping). The amended contract incorporates a basic fee rate that may vary by class (subject to a performance adjustment). The Adviser or an affiliate pays certain expenses of managing and operating the fund out of each class's management fee. | |
| Fidelity, the Fidelity Investments Logo and all other Fidelity trademarks or service marks used herein are trademarks or service marks of FMR LLC. Any third-party marks that are used herein are trademarks or service marks of their respective owners. © 2024 FMR LLC. All rights reserved. |
| | For additional information about the Fund; including its prospectus, financial information, holdings and proxy information, scan the QR code or visit fundresearch.fidelity.com/prospectus/sec 1.9913849.100 3263-TSRA-1224 |
| |
| | ANNUAL SHAREHOLDER REPORT | AS OF OCTOBER 31, 2024 | This report describes changes to the Fund that occurred during the reporting period. |
| | Fidelity® International Growth Fund Fidelity Advisor® International Growth Fund Class M : FITGX |
| | | |
This annual shareholder report contains information about Fidelity® International Growth Fund for the period November 1, 2023 to October 31, 2024. You can find additional information about the Fund at fundresearch.fidelity.com/prospectus/sec. You can also request this information by contacting us at 1-877-208-0098 or by sending an e-mail to fidfunddocuments@fidelity.com.
What were your Fund costs for the last year?(based on hypothetical $10,000 investment)
FUND COST (PREVIOUS YEAR)
| | Costs of a $10,000 investment | Costs paid as a percentage of a $10,000 investment | |
| Class M | $ 161 | 1.43% | |
What affected the Fund's performance this period?
•International stocks achieved a strong gain for the 12 months ending October 31, 2024. Resilient global economic growth and a slowing in the pace of inflation in certain regions, as well as a shift to global monetary easing, contributed to a favorable backdrop, despite persistent geopolitical risk.
•Against this backdrop, stock picks and an overweight in the United States and security selection in the U.K. contributed to the fund's performance versus the MSCI EAFE Growth Index (Net MA) for the fiscal year.
•By sector, an underweight in consumer staples was the primary contributor. Stock selection in materials also boosted the fund's relative performance. Also helping our relative result was an overweight in industrials, primarily within the capital goods industry.
•The fund's non-benchmark stake in Taiwan Semiconductor gained 99% and was the top individual relative contributor. The stock was among our largest holdings. A second notable relative contributor was an overweight in CRH (+83%). The stock was among the fund's biggest holdings. Another notable relative contributor was our non-benchmark stake in GE Vernova (+100%). This was a position we established this period.
•In contrast, from a regional standpoint, an underweight in Asia Pacific ex Japan and a non-benchmark allocation to Canada detracted from the fund's relative result.
•By sector, the biggest detractor from performance versus the benchmark was stock picking in financials. Also hurting our result was security selection in industrials, primarily within the capital goods industry, and energy. Lastly, the fund's position in cash detracted.
•The biggest individual relative detractor was an overweight in Edenred (-38%). Not owning Schneider Electric, a benchmark component that gained approximately 71%, was the second-largest relative detractor. Not owning Commonwealth Bank of Australia, a benchmark component that gained roughly 59%, was another notable relative detractor.
•Notable changes in positioning include increased exposure to Germany and the United Kingdom. By sector, meaningful changes in positioning include decreased exposure to consumer staples and health care.
How did the Fund perform over the past 10 years?
CUMULATIVE PERFORMANCE
October 31, 2014 through October 31, 2024.
Initial investment of $10,000 and the current sales charge was paid.
Class M | $9,650 | $9,925 | $9,570 | $11,820 | $11,063 | $13,377 | $14,349 | $18,750 | $13,465 | $14,810 | $18,467 |
MSCI EAFE Growth Index | $10,000 | $10,428 | $10,108 | $12,517 | $11,783 | $13,766 | $14,502 | $18,876 | $13,312 | $14,769 | $18,234 |
MSCI EAFE Index | $10,000 | $10,008 | $9,705 | $12,004 | $11,206 | $12,472 | $11,638 | $15,647 | $12,073 | $13,841 | $17,059 |
| | 2014 | 2015 | 2016 | 2017 | 2018 | 2019 | 2020 | 2021 | 2022 | 2023 | 2024 |
AVERAGE ANNUAL TOTAL RETURNS:| | 1 Year | 5 Year | 10 Year |
| Class M (incl. 3.50% sales charge) | 20.32% | 5.90% | 6.33% |
| Class M (without 3.50% sales charge) | 24.69% | 6.66% | 6.71% |
| MSCI EAFE Growth Index | 23.46% | 5.78% | 6.19% |
| MSCI EAFE Index | 23.25% | 6.46% | 5.49% |
Visit institutional.fidelity.com for more recent performance information. |
The Fund's past performance is not a good predictor of the Fund's future performance. The graph and table do not reflect the deduction of taxes that a shareholder would pay on fund distributions or redemption of fund shares. |
Key Fund Statistics(as of October 31, 2024)
KEY FACTS | | |
| Fund Size | $6,046,615,302 | |
| Number of Holdings | 73 | |
| Total Advisory Fee | $43,926,728 | |
| Portfolio Turnover | 31% | |
What did the Fund invest in?
(as of October 31, 2024)
MARKET SECTORS (% of Fund's net assets) | | |
| Industrials | 31.9 | |
| Information Technology | 19.7 | |
| Financials | 16.0 | |
| Materials | 10.7 | |
| Consumer Discretionary | 10.3 | |
| Health Care | 6.1 | |
| Consumer Staples | 1.1 | |
| Energy | 0.7 | |
| Communication Services | 0.5 | |
| |
| Common Stocks | 96.7 |
| Preferred Stocks | 0.3 |
| Short-Term Investments and Net Other Assets (Liabilities) | 3.0 |
ASSET ALLOCATION (% of Fund's net assets) |
|
|
| United States | 29.1 |
| United Kingdom | 11.7 |
| France | 11.2 |
| Japan | 9.6 |
| Sweden | 7.5 |
| Germany | 6.6 |
| Netherlands | 6.1 |
| Denmark | 5.1 |
| Taiwan | 3.3 |
| Others | 9.8 |
GEOGRAPHIC DIVERSIFICATION (% of Fund's net assets) |
|
| |
|
TOP HOLDINGS(% of Fund's net assets) | | |
| SAP SE | 5.3 | |
| Novo Nordisk A/S Series B | 5.1 | |
| ASML Holding NV | 4.8 | |
| Safran SA | 4.0 | |
| CRH PLC | 3.9 | |
| Linde PLC | 3.8 | |
| Atlas Copco AB A Shares | 3.4 | |
| Taiwan Semiconductor Manufacturing Co Ltd | 3.3 | |
| Recruit Holdings Co Ltd | 3.0 | |
| LVMH Moet Hennessy Louis Vuitton SE | 2.7 | |
| | 39.3 | |
How has the Fund changed?
This is a summary of certain changes to the Fund since November 1, 2023. For more complete information, you may review the Fund's next prospectus, which we expect to be available by December 30, 2024 at fundresearch.fidelity.com/prospectus/sec or upon request at 1-877-208-0098 or by sending an e-mail to fidfunddocuments@fidelity.com.
The fund's transfer agent and pricing & bookkeeping fees were changed to a fixed rate effective December 1, 2023, through February 29, 2024, in anticipation of the transition to a new management fee structure. Effective March 1, 2024, the fund's management contract was amended to incorporate administrative services previously covered under separate services agreements (transfer agent and pricing & bookkeeping). The amended contract incorporates a basic fee rate that may vary by class (subject to a performance adjustment). The Adviser or an affiliate pays certain expenses of managing and operating the fund out of each class's management fee. | The fund's sub-advisory agreement with FIL Investments (Japan) Limited was not renewed.
|
| Fidelity, the Fidelity Investments Logo and all other Fidelity trademarks or service marks used herein are trademarks or service marks of FMR LLC. Any third-party marks that are used herein are trademarks or service marks of their respective owners. © 2024 FMR LLC. All rights reserved. |
| | For additional information about the Fund; including its prospectus, financial information, holdings and proxy information, scan the QR code or visit fundresearch.fidelity.com/prospectus/sec 1.9913951.100 1988-TSRA-1224 |
| |
| | ANNUAL SHAREHOLDER REPORT | AS OF OCTOBER 31, 2024 | This report describes changes to the Fund that occurred during the reporting period. |
| | Fidelity® International Small Cap Opportunities Fund Fidelity Advisor® International Small Cap Opportunities Fund Class I : FOPIX |
| | | |
This annual shareholder report contains information about Fidelity® International Small Cap Opportunities Fund for the period November 1, 2023 to October 31, 2024. You can find additional information about the Fund at fundresearch.fidelity.com/prospectus/sec. You can also request this information by contacting us at 1-877-208-0098 or by sending an e-mail to fidfunddocuments@fidelity.com.
What were your Fund costs for the last year?(based on hypothetical $10,000 investment)
FUND COST (PREVIOUS YEAR)
| | Costs of a $10,000 investment | Costs paid as a percentage of a $10,000 investment | |
| Class I | $ 111 | 0.98% | |
What affected the Fund's performance this period?
•International stocks achieved a strong gain for the 12 months ending October 31, 2024. Resilient global economic growth and a slowing in the pace of inflation in certain regions, as well as a shift to global monetary easing, contributed to a favorable backdrop, despite persistent geopolitical risk.
•Against this backdrop, stock picking in Europe ex U.K. and a non-benchmark allocation to the United States contributed to the fund's performance versus the MSCI EAFE Small Cap Index (Net MA) for the fiscal year.
•By sector, security selection was the primary contributor, especially within communication services, where our picks in media & entertainment helped most. Stock selection and an overweight in industrials, primarily within the capital goods industry, and security selection and an underweight in consumer discretionary also boosted the fund's relative performance.
•The fund's non-benchmark stake in Lagercrantz gained 116% and was the top individual relative contributor. The stock was the fund's largest holding. The second-largest relative contributor was an overweight in Addtech (+91%). The company was among the fund's largest holdings. A non-benchmark stake in Kongsberg Gruppen gained approximately 158% and notably helped. The stock was one of the fund's biggest holdings this period.
•In contrast, from a regional standpoint, stock selection in the U.K. and a non-benchmark allocation to Canada detracted from the fund's relative result.
•By sector, the biggest detractor from performance versus the benchmark was an underweight in financials. Also hurting our result was security selection in health care and consumer staples. Lastly, the fund's position in cash detracted.
•The largest individual relative detractor was an overweight in Spectris (-11%). The stock was one of our biggest holdings. The second-largest relative detractor was our non-benchmark stake in Richelieu Hardware (-11%). An overweight in SHO-BOND Holdings (-7%) also detracted.
•Notable changes in positioning include a higher allocation to Europe. By sector, meaningful changes in positioning include higher allocations to multi-sector holdings and materials.
How did the Fund perform over the past 10 years?
CUMULATIVE PERFORMANCE
October 31, 2014 through October 31, 2024.
Initial investment of $10,000.
Class I | $10,000 | $10,898 | $11,068 | $13,983 | $13,394 | $15,127 | $16,776 | $22,869 | $15,185 | $15,795 | $19,960 |
MSCI EAFE Small Cap Index | $10,000 | $10,855 | $11,194 | $14,295 | $13,198 | $14,385 | $14,210 | $19,320 | $13,494 | $14,394 | $17,734 |
MSCI EAFE Index | $10,000 | $10,008 | $9,705 | $12,004 | $11,206 | $12,472 | $11,638 | $15,647 | $12,073 | $13,841 | $17,059 |
| | 2014 | 2015 | 2016 | 2017 | 2018 | 2019 | 2020 | 2021 | 2022 | 2023 | 2024 |
AVERAGE ANNUAL TOTAL RETURNS:| | 1 Year | 5 Year | 10 Year |
| Class I | 26.37% | 5.70% | 7.16% |
| MSCI EAFE Small Cap Index | 23.20% | 4.27% | 5.90% |
| MSCI EAFE Index | 23.25% | 6.46% | 5.49% |
Visit institutional.fidelity.com for more recent performance information. |
The Fund's past performance is not a good predictor of the Fund's future performance. The graph and table do not reflect the deduction of taxes that a shareholder would pay on fund distributions or redemption of fund shares. |
Key Fund Statistics(as of October 31, 2024)
KEY FACTS | | |
| Fund Size | $1,271,531,943 | |
| Number of Holdings | 111 | |
| Total Advisory Fee | $10,572,915 | |
| Portfolio Turnover | 27% | |
What did the Fund invest in?
(as of October 31, 2024)
MARKET SECTORS (% of Fund's net assets) | | |
| Industrials | 30.2 | |
| Information Technology | 19.8 | |
| Consumer Discretionary | 10.2 | |
| Communication Services | 9.3 | |
| Financials | 6.5 | |
| Health Care | 5.1 | |
| Materials | 4.3 | |
| Consumer Staples | 3.3 | |
| Real Estate | 2.4 | |
| Energy | 1.7 | |
| |
| Common Stocks | 92.8 |
| International Equity Funds | 4.8 |
| Short-Term Investments and Net Other Assets (Liabilities) | 2.4 |
ASSET ALLOCATION (% of Fund's net assets) |
|
|
| Japan | 25.1 |
| Sweden | 14.6 |
| United Kingdom | 14.3 |
| United States | 10.5 |
| Germany | 7.8 |
| Netherlands | 4.9 |
| Canada | 3.6 |
| France | 2.5 |
| Italy | 2.4 |
| Others | 14.3 |
GEOGRAPHIC DIVERSIFICATION (% of Fund's net assets) |
|
| |
|
TOP HOLDINGS(% of Fund's net assets) | | |
| Lagercrantz Group AB B Shares | 5.1 | |
| iShares MSCI EAFE Small-Cap ETF | 4.8 | |
| CTS Eventim AG & Co KGaA | 4.1 | |
| AddTech AB B Shares | 4.1 | |
| Azbil Corp | 3.2 | |
| Morningstar Inc | 2.7 | |
| Spectris PLC | 2.6 | |
| Interpump Group SpA | 2.4 | |
| Aalberts NV | 2.2 | |
| Howden Joinery Group PLC | 2.0 | |
| | 33.2 | |
How has the Fund changed?
This is a summary of certain changes to the Fund since November 1, 2023. For more complete information, you may review the Fund's next prospectus, which we expect to be available by December 30, 2024 at fundresearch.fidelity.com/prospectus/sec or upon request at 1-877-208-0098 or by sending an e-mail to fidfunddocuments@fidelity.com.
The fees associated with this class changed during the reporting year.The variations in class fees are primarily the result of the following changes: - Management fee
- Performance adjustment fee
- Operating expenses
The fund's transfer agent and pricing & bookkeeping fees were changed to a fixed rate effective December 1, 2023, through February 29, 2024, in anticipation of the transition to a new management fee structure. Effective March 1, 2024, the fund's management contract was amended to incorporate administrative services previously covered under separate services agreements (transfer agent and pricing & bookkeeping). The amended contract incorporates a basic fee rate that may vary by class (subject to a performance adjustment). The Adviser or an affiliate pays certain expenses of managing and operating the fund out of each class's management fee. | The fund's sub-advisory agreement with FIL Investments (Japan) Limited was not renewed.
|
| Fidelity, the Fidelity Investments Logo and all other Fidelity trademarks or service marks used herein are trademarks or service marks of FMR LLC. Any third-party marks that are used herein are trademarks or service marks of their respective owners. © 2024 FMR LLC. All rights reserved. |
| | For additional information about the Fund; including its prospectus, financial information, holdings and proxy information, scan the QR code or visit fundresearch.fidelity.com/prospectus/sec 1.9913933.100 1485-TSRA-1224 |
| |
| | ANNUAL SHAREHOLDER REPORT | AS OF OCTOBER 31, 2024 | This report describes changes to the Fund that occurred during the reporting period. |
| | Fidelity® International Value Fund Fidelity Advisor® International Value Fund Class C : FIVOX |
| | | |
This annual shareholder report contains information about Fidelity® International Value Fund for the period November 1, 2023 to October 31, 2024. You can find additional information about the Fund at fundresearch.fidelity.com/prospectus/sec. You can also request this information by contacting us at 1-877-208-0098 or by sending an e-mail to fidfunddocuments@fidelity.com.
What were your Fund costs for the last year?(based on hypothetical $10,000 investment)
FUND COST (PREVIOUS YEAR)
| | Costs of a $10,000 investment | Costs paid as a percentage of a $10,000 investment | |
| Class C | $ 209 | 1.88% | |
What affected the Fund's performance this period?
•International stocks achieved a strong gain for the 12 months ending October 31, 2024. Resilient global economic growth and a slowing in the pace of inflation in certain regions, as well as a shift to global monetary easing, contributed to a favorable backdrop, despite persistent geopolitical risk.
•Against this backdrop, stock selection in Japan and security selection and an overweight in the United States contributed to the fund's performance versus the MSCI EAFE Value Index (Net MA) for the fiscal year.
•By sector, security selection was the primary contributor, especially within industrials, where our stock picks in capital goods helped most. Security selection in materials also boosted the fund's relative performance. Also contributing to our result was an overweight in financials.
•The top individual relative contributor was an overweight in Hitachi (+110%). The company was among the fund's biggest holdings. A second notable relative contributor was an overweight in Mitsubishi Heavy Industries (+162%). This was a stake we established this period. Another notable relative contributor was our non-benchmark stake in Rheinmetall (+82%). The stock was among our biggest holdings this period.
•In contrast, from a regional standpoint, stock picks in the U.K. and Asia Pacific ex Japan, primarily in Australia, detracted from the fund's relative result.
•By sector, the biggest detractor from performance versus the benchmark was stock selection in information technology. Stock picking in financials also hampered the fund's result. Also hurting our result was an overweight in energy.
•The largest individual relative detractor was an overweight in BHP (+5%). The stock was among the fund's biggest holdings. A second notable relative detractor was an overweight in GSK (-11%). This was a stake we established this period. A non-benchmark stake in Prudential returned -19% and notably hurt.
•Notable changes in positioning include decreased exposure to France and Australia. By sector, meaningful changes in positioning include lower allocations to consumer discretionary and energy.
How did the Fund perform over the past 10 years?
CUMULATIVE PERFORMANCE
October 31, 2014 through October 31, 2024.
Initial investment of $10,000.
Class C | $10,000 | $9,842 | $9,289 | $10,999 | $9,893 | $10,242 | $8,739 | $12,361 | $10,135 | $11,931 | $14,697 |
MSCI EAFE Value Index | $10,000 | $9,591 | $9,294 | $11,477 | $10,621 | $11,237 | $9,189 | $12,742 | $10,687 | $12,659 | $15,588 |
MSCI EAFE Index | $10,000 | $10,008 | $9,705 | $12,004 | $11,206 | $12,472 | $11,638 | $15,647 | $12,073 | $13,841 | $17,059 |
| | 2014 | 2015 | 2016 | 2017 | 2018 | 2019 | 2020 | 2021 | 2022 | 2023 | 2024 |
AVERAGE ANNUAL TOTAL RETURNS:| | 1 Year | 5 Year | 10 Year |
| Class C (incl. contingent deferred sales charge) | 21.44% | 7.18% | 3.93% |
| Class C | 22.44% | 7.18% | 3.93% |
| MSCI EAFE Value Index | 23.14% | 6.76% | 4.54% |
| MSCI EAFE Index | 23.25% | 6.46% | 5.49% |
Visit institutional.fidelity.com for more recent performance information. |
The Fund's past performance is not a good predictor of the Fund's future performance. The graph and table do not reflect the deduction of taxes that a shareholder would pay on fund distributions or redemption of fund shares. |
Key Fund Statistics(as of October 31, 2024)
KEY FACTS | | |
| Fund Size | $1,472,284,197 | |
| Number of Holdings | 101 | |
| Total Advisory Fee | $8,618,481 | |
| Portfolio Turnover | 29% | |
What did the Fund invest in?
(as of October 31, 2024)
MARKET SECTORS (% of Fund's net assets) | | |
| Financials | 35.1 | |
| Industrials | 18.0 | |
| Materials | 13.0 | |
| Energy | 8.4 | |
| Consumer Discretionary | 5.0 | |
| Health Care | 4.7 | |
| Information Technology | 4.3 | |
| Consumer Staples | 3.9 | |
| Communication Services | 3.0 | |
| Real Estate | 0.9 | |
| Utilities | 0.6 | |
| |
| Common Stocks | 96.5 |
| Preferred Stocks | 0.4 |
| Short-Term Investments and Net Other Assets (Liabilities) | 3.1 |
ASSET ALLOCATION (% of Fund's net assets) |
|
|
| Japan | 22.8 |
| United Kingdom | 14.8 |
| United States | 13.1 |
| Germany | 11.4 |
| France | 9.8 |
| Australia | 6.1 |
| Italy | 5.0 |
| Spain | 3.4 |
| Switzerland | 3.3 |
| Others | 10.3 |
GEOGRAPHIC DIVERSIFICATION (% of Fund's net assets) |
|
| |
|
TOP HOLDINGS(% of Fund's net assets) | | |
| Shell PLC ADR | 3.7 | |
| Hitachi Ltd | 2.8 | |
| Banco Santander SA | 2.4 | |
| AXA SA | 2.3 | |
| CRH PLC | 2.2 | |
| BAE Systems PLC | 2.1 | |
| BHP Group Ltd | 2.1 | |
| Rheinmetall AG | 2.1 | |
| TotalEnergies SE | 2.0 | |
| Mitsubishi UFJ Financial Group Inc | 2.0 | |
| | 23.7 | |
How has the Fund changed?
This is a summary of certain changes to the Fund since November 1, 2023. For more complete information, you may review the Fund's next prospectus, which we expect to be available by December 30, 2024 at fundresearch.fidelity.com/prospectus/sec or upon request at 1-877-208-0098 or by sending an e-mail to fidfunddocuments@fidelity.com.
The fees associated with this class changed during the reporting year.The variations in class fees are primarily the result of the following changes: - Management fee
- Operating expenses
- Performance adjustment fee
- Expense reductions
The fund's transfer agent and pricing & bookkeeping fees were changed to a fixed rate effective December 1, 2023, through February 29, 2024, in anticipation of the transition to a new management fee structure. Effective March 1, 2024, the fund's management contract was amended to incorporate administrative services previously covered under separate services agreements (transfer agent and pricing & bookkeeping). The amended contract incorporates a basic fee rate that may vary by class (subject to a performance adjustment). The Adviser or an affiliate pays certain expenses of managing and operating the fund out of each class's management fee. | The fund's sub-advisory agreement with FIL Investments (Japan) Limited was not renewed.
|
| Fidelity, the Fidelity Investments Logo and all other Fidelity trademarks or service marks used herein are trademarks or service marks of FMR LLC. Any third-party marks that are used herein are trademarks or service marks of their respective owners. © 2024 FMR LLC. All rights reserved. |
| | For additional information about the Fund; including its prospectus, financial information, holdings and proxy information, scan the QR code or visit fundresearch.fidelity.com/prospectus/sec 1.9913938.100 1614-TSRA-1224 |
| |
| | ANNUAL SHAREHOLDER REPORT | AS OF OCTOBER 31, 2024 | This report describes changes to the Fund that occurred during the reporting period. |
| | Fidelity® Emerging Markets Discovery Fund Fidelity Advisor® Emerging Markets Discovery Fund Class C : FEDGX |
| | | |
This annual shareholder report contains information about Fidelity® Emerging Markets Discovery Fund for the period November 1, 2023 to October 31, 2024. You can find additional information about the Fund at fundresearch.fidelity.com/prospectus/sec. You can also request this information by contacting us at 1-877-208-0098 or by sending an e-mail to fidfunddocuments@fidelity.com.
What were your Fund costs for the last year?(based on hypothetical $10,000 investment)
FUND COST (PREVIOUS YEAR)
| | Costs of a $10,000 investment | Costs paid as a percentage of a $10,000 investment | |
| Class C | $ 215 | 2.02% | |
What affected the Fund's performance this period?
•International stocks achieved a strong gain for the 12 months ending October 31, 2024. Resilient global economic growth and a slowing in the pace of inflation in certain regions, as well as a shift to global monetary easing, contributed to a favorable backdrop, despite persistent geopolitical risk.
•Against this backdrop, an underweight in Emerging Asia, primarily in India, and stock picking and an overweight in Latin America, primarily in Brazil, detracted from the fund's performance versus the MSCI Emerging Markets SMID Index (Net MA) for the fiscal year.
•By sector, security selection was the primary detractor, especially within financials. Also hurting our result were stock picks in health care, primarily within the pharmaceuticals, biotechnology & life sciences industry, and consumer staples.
•The largest individual relative detractor was our stake in Pharmaron Beijing (-48%). The second-largest relative detractor was Hanon Systems (-52%). The stock was not held at period end. Another notable relative detractor was an overweight in Nanya Technology (-34%).
•In contrast, from a regional standpoint, stock selection in Africa, primarily in South Africa, and stock picks and an underweight in the Middle East, primarily in United Arab Emirates, contributed to the fund's relative result.
•By sector, the biggest contributor to performance versus the benchmark was security selection in communication services, primarily within the media & entertainment industry. Stock picks and an underweight in materials and stock selection and an overweight in industrials, primarily within the capital goods industry, also boosted the fund's relative performance.
•The top individual relative contributor was an overweight in International Games System (+243%). This period we decreased our investment in the stock, which was nonetheless one of our largest holdings as of October 31. The second-largest relative contributor was a non-benchmark stake in Hindustan Aeronautics (+136%), where we decreased our investment this period. Another notable relative contributor was an overweight in Bharat Electronics (+111%).
•Notable changes in positioning include increased exposure to Taiwan and South Africa. By sector, meaningful changes in positioning include lower allocations to health care and utilities.
How did the Fund perform over the past 10 years?
CUMULATIVE PERFORMANCE
October 31, 2014 through October 31, 2024.
Initial investment of $10,000.
Class C | $10,000 | $8,908 | $9,975 | $12,272 | $9,944 | $11,390 | $11,613 | $15,238 | $11,853 | $13,698 | $15,628 |
MSCI Emerging Markets SMID Cap Index | $10,000 | $8,919 | $9,391 | $11,258 | $9,624 | $10,629 | $10,543 | $14,461 | $10,969 | $12,456 | $15,202 |
MSCI Emerging Markets Index | $10,000 | $8,550 | $9,346 | $11,823 | $10,347 | $11,577 | $12,535 | $14,663 | $10,115 | $11,211 | $14,051 |
| | 2014 | 2015 | 2016 | 2017 | 2018 | 2019 | 2020 | 2021 | 2022 | 2023 | 2024 |
AVERAGE ANNUAL TOTAL RETURNS:| | 1 Year | 5 Year | 10 Year |
| Class C (incl. contingent deferred sales charge) | 12.16% | 6.21% | 4.57% |
| Class C | 13.16% | 6.21% | 4.57% |
| MSCI Emerging Markets SMID Cap Index | 22.04% | 7.42% | 4.28% |
| MSCI Emerging Markets Index | 25.33% | 3.95% | 3.46% |
Visit institutional.fidelity.com for more recent performance information. |
The Fund's past performance is not a good predictor of the Fund's future performance. The graph and table do not reflect the deduction of taxes that a shareholder would pay on fund distributions or redemption of fund shares. |
Key Fund Statistics(as of October 31, 2024)
KEY FACTS | | |
| Fund Size | $1,183,237,609 | |
| Number of Holdings | 111 | |
| Total Advisory Fee | $10,611,763 | |
| Portfolio Turnover | 29% | |
What did the Fund invest in?
(as of October 31, 2024)
MARKET SECTORS (% of Fund's net assets) | | |
| Industrials | 21.0 | |
| Consumer Discretionary | 18.3 | |
| Financials | 14.5 | |
| Information Technology | 10.9 | |
| Consumer Staples | 7.8 | |
| Real Estate | 7.4 | |
| Health Care | 4.6 | |
| Materials | 4.6 | |
| Utilities | 3.9 | |
| Energy | 3.3 | |
| Communication Services | 3.2 | |
| |
| Common Stocks | 99.5 |
| Short-Term Investments and Net Other Assets (Liabilities) | 0.5 |
ASSET ALLOCATION (% of Fund's net assets) |
|
|
| China | 21.4 |
| Taiwan | 17.6 |
| India | 13.3 |
| Brazil | 11.7 |
| Korea (South) | 6.2 |
| South Africa | 5.4 |
| Mexico | 4.8 |
| Saudi Arabia | 2.3 |
| Hong Kong | 2.2 |
| Others | 15.1 |
GEOGRAPHIC DIVERSIFICATION (% of Fund's net assets) |
|
| |
|
TOP HOLDINGS(% of Fund's net assets) | | |
| Impala Platinum Holdings Ltd | 1.8 | |
| Shriram Finance Ltd | 1.4 | |
| SITC International Holdings Co Ltd | 1.4 | |
| Bizlink Holding Inc | 1.4 | |
| Yageo Corp | 1.4 | |
| Torrent Pharmaceuticals Ltd | 1.3 | |
| Mr Price Group Ltd | 1.3 | |
| International Games System Co Ltd | 1.3 | |
| Nien Made Enterprise Co Ltd | 1.3 | |
| Coway Co Ltd | 1.3 | |
| | 13.9 | |
How has the Fund changed?
This is a summary of certain changes to the Fund since November 1, 2023. For more complete information, you may review the Fund's next prospectus, which we expect to be available by December 30, 2024 at fundresearch.fidelity.com/prospectus/sec or upon request at 1-877-208-0098 or by sending an e-mail to fidfunddocuments@fidelity.com.
The fees associated with this class changed during the reporting year.The variations in class fees are primarily the result of the following changes: - Management fee
- Operating expenses
The fund's transfer agent and pricing & bookkeeping fees were changed to a fixed rate effective December 1, 2023, through February 29, 2024, in anticipation of the transition to a new management fee structure. Effective March 1, 2024, the fund's management contract was amended to incorporate administrative services previously covered under separate services agreements (transfer agent and pricing & bookkeeping). The amended contract incorporates a management fee rate that may vary by class. The Adviser or an affiliate pays certain expenses of managing and operating the fund out of each class's management fee. | The fund's sub-advisory agreement with FIL Investments (Japan) Limited was not renewed
|
| Fidelity, the Fidelity Investments Logo and all other Fidelity trademarks or service marks used herein are trademarks or service marks of FMR LLC. Any third-party marks that are used herein are trademarks or service marks of their respective owners. © 2024 FMR LLC. All rights reserved. |
| | For additional information about the Fund; including its prospectus, financial information, holdings and proxy information, scan the QR code or visit fundresearch.fidelity.com/prospectus/sec 1.9913975.100 2376-TSRA-1224 |
| |
| | ANNUAL SHAREHOLDER REPORT | AS OF OCTOBER 31, 2024 | This report describes changes to the Fund that occurred during the reporting period. |
| | Fidelity® Japan Fund Fidelity Advisor® Japan Fund Class Z : FIQLX |
| | | |
This annual shareholder report contains information about Fidelity® Japan Fund for the period November 1, 2023 to October 31, 2024. You can find additional information about the Fund at fundresearch.fidelity.com/prospectus/sec. You can also request this information by contacting us at 1-877-208-0098 or by sending an e-mail to fidfunddocuments@fidelity.com.
What were your Fund costs for the last year?(based on hypothetical $10,000 investment)
FUND COST (PREVIOUS YEAR)
| | Costs of a $10,000 investment | Costs paid as a percentage of a $10,000 investment | |
| Class Z | $ 63 | 0.56% | |
What affected the Fund's performance this period?
•International stocks achieved a strong gain for the 12 months ending October 31, 2024. Resilient global economic growth and a slowing in the pace of inflation in certain regions, as well as a shift to global monetary easing, contributed to a favorable backdrop, despite persistent geopolitical risk.
•With that said, in March 2024, the Bank of Japan raised short-term interest rates for the first time in 17 years, ending its negative interest rate policy.
•Against this backdrop, stock selection in Japan and a non-benchmark allocation to the United States contributed to the fund's performance versus the TOPIX Total Return Index for the fiscal year.
•By sector, security selection was the primary contributor, led by industrials, where our stock picks in capital goods helped most. Stock picking in financials and consumer discretionary also boosted the fund's relative performance.
•The top individual relative contributor was an overweight in IHI (+196%). The second-largest relative contributor was an overweight in Hitachi (+109%). The stock was among the fund's largest holdings. An overweight in Dexerials (+115%) also helped. We trimmed our stakes in all three stocks.
•In contrast, from a regional standpoint, non-benchmark allocations to emerging markets and Asia Pacific ex Japan modestly detracted from the fund's relative result.
•By sector, the biggest detractor from performance versus the benchmark was stock selection in information technology, primarily within the semiconductors & semiconductor equipment industry. Security selection in energy also hampered the fund's result. Also hurting our result was an underweight in industrials, primarily within the capital goods industry.
•The largest individual relative detractor this period was avoiding Recruit Holdings, a benchmark component that gained 120%. The second-largest relative detractor was our non-benchmark stake in JTOWER (-31%). The stock was not held at period end. An overweight in TechnoPro Holdings (-4%) also hurt, and we reduced our exposure to the stock.
•By sector, meaningful changes in positioning include increased exposure to materials and industrials.
How did the Fund perform over the life of Fund?
CUMULATIVE PERFORMANCE
October 2, 2018 through October 31, 2024.
Initial investment of $10,000.
Class Z | $10,000 | $8,998 | $10,091 | $11,338 | $13,825 | $9,806 | $10,815 |
Tokyo Stock Price Index (TOPIX) | $10,000 | $9,088 | $9,856 | $9,892 | $11,734 | $8,912 | $10,479 |
| | 2018 | 2019 | 2020 | 2021 | 2022 | 2023 | 2024 |
AVERAGE ANNUAL TOTAL RETURNS:| | 1 Year | 5 Year | Life of Fund A |
| Class Z | 23.87% | 5.83% | 4.92% |
| Tokyo Stock Price Index (TOPIX) | 21.72% | 5.29% | 4.08% |
A From October 2, 2018
Visit institutional.fidelity.com for more recent performance information. |
The Fund's past performance is not a good predictor of the Fund's future performance. The graph and table do not reflect the deduction of taxes that a shareholder would pay on fund distributions or redemption of fund shares. |
Key Fund Statistics(as of October 31, 2024)
KEY FACTS | | |
| Fund Size | $692,986,086 | |
| Number of Holdings | 89 | |
| Total Advisory Fee | $3,522,427 | |
| Portfolio Turnover | 21% | |
What did the Fund invest in?
(as of October 31, 2024)
MARKET SECTORS (% of Fund's net assets) | | |
| Industrials | 25.1 | |
| Information Technology | 18.9 | |
| Consumer Discretionary | 14.7 | |
| Financials | 13.4 | |
| Materials | 7.8 | |
| Health Care | 7.1 | |
| Communication Services | 4.2 | |
| Consumer Staples | 3.2 | |
| Energy | 1.9 | |
| Utilities | 1.9 | |
| Real Estate | 1.1 | |
| |
| Common Stocks | 99.3 |
| Short-Term Investments and Net Other Assets (Liabilities) | 0.7 |
ASSET ALLOCATION (% of Fund's net assets) |
|
|
| Japan | 98.4 |
| United States | 1.0 |
| China | 0.6 |
GEOGRAPHIC DIVERSIFICATION (% of Fund's net assets) |
|
| |
|
TOP HOLDINGS(% of Fund's net assets) | | |
| Sumitomo Mitsui Financial Group Inc | 6.0 | |
| Hitachi Ltd | 5.0 | |
| Sony Group Corp | 3.8 | |
| Shin-Etsu Chemical Co Ltd | 3.3 | |
| Hoya Corp | 3.3 | |
| ORIX Corp | 3.1 | |
| Renesas Electronics Corp | 2.7 | |
| Fujitsu Ltd | 2.6 | |
| FUJIFILM Holdings Corp | 2.4 | |
| Denso Corp | 2.3 | |
| | 34.5 | |
How has the Fund changed?
This is a summary of certain changes to the Fund since November 1, 2023. For more complete information, you may review the Fund's next prospectus, which we expect to be available by December 30, 2024 at fundresearch.fidelity.com/prospectus/sec or upon request at 1-877-208-0098 or by sending an e-mail to fidfunddocuments@fidelity.com.
The fees associated with this class changed during the reporting year.The variations in class fees are primarily the result of the following changes: - Management fee
- Performance adjustment fee
The fund's transfer agent and pricing & bookkeeping fees were changed to a fixed rate effective December 1, 2023, through February 29, 2024, in anticipation of the transition to a new management fee structure. Effective March 1, 2024, the fund's management contract was amended to incorporate administrative services previously covered under separate services agreements (transfer agent and pricing & bookkeeping). The amended contract incorporates a basic fee rate that may vary by class (subject to a performance adjustment). The Adviser or an affiliate pays certain expenses of managing and operating the fund out of each class's management fee. | The fund's sub-advisory agreement with FIL Investments (Japan) Limited was not renewed.
|
| Fidelity, the Fidelity Investments Logo and all other Fidelity trademarks or service marks used herein are trademarks or service marks of FMR LLC. Any third-party marks that are used herein are trademarks or service marks of their respective owners. © 2024 FMR LLC. All rights reserved. |
| | For additional information about the Fund; including its prospectus, financial information, holdings and proxy information, scan the QR code or visit fundresearch.fidelity.com/prospectus/sec 1.9913886.100 3270-TSRA-1224 |
| |
| | ANNUAL SHAREHOLDER REPORT | AS OF OCTOBER 31, 2024 | This report describes changes to the Fund that occurred during the reporting period. |
| | Fidelity® Global Equity Income Fund Fidelity Advisor® Global Equity Income Fund Class Z : FGEKX |
| | | |
This annual shareholder report contains information about Fidelity® Global Equity Income Fund for the period October 18, 2024 to October 31, 2024. You can find additional information about the Fund at fundresearch.fidelity.com/prospectus/sec. You can also request this information by contacting us at 1-877-208-0098 or by sending an e-mail to fidfunddocuments@fidelity.com.
What were your Fund costs for the last year?(based on hypothetical $10,000 investment)
FUND COST (PREVIOUS YEAR)
| | Costs of a $10,000 investment | Costs paid as a percentage of a $10,000 investment | |
Class Z A | $ 2 | 0.64% | |
AExpenses for the full reporting period would be higher.
What affected the Fund's performance this period?
•Global equities posted a strong advance for the 12 months ending October 31, 2024. Resilient economic growth and a slowing in the pace of inflation in certain regions, as well as a shift to global monetary easing, contributed to a favorable backdrop, despite persistent geopolitical risk.
•Against this backdrop, stock picking in the United States and picks and an overweight in the U.K. detracted from the fund's performance versus the MSCI All Country World Index (Net MA) for the fiscal year.
•By sector, the biggest detractor from performance versus the benchmark was stock selection in information technology. Also hurting our result was stock selection in consumer discretionary and communication services, primarily within the media & entertainment industry. Lastly, the fund's position in cash detracted.
•The biggest individual relative detractor this period was avoiding Nvidia, a benchmark component that gained about 226%. Not owning Meta Platforms, a benchmark component that gained 89%, was the second-largest relative detractor. An overweight in Dollar Tree (-41%) also hurt.
•In contrast, from a regional standpoint, an underweight in emerging markets and picks in Europe ex U.K., primarily in Germany, contributed to the fund's relative result.
•By sector, the biggest contributor to performance versus the benchmark was security selection in industrials, primarily within the capital goods industry. Stock picks in utilities and health care, primarily within the pharmaceuticals, biotechnology & life sciences industry, also boosted the fund's relative result.
•The top individual relative contributor was an overweight in Vistra (+290%). The second-largest relative contributor was an overweight in Taiwan Semiconductor (+97%), which was among the largest holdings. Another notable relative contributor was an overweight in Rheinmetall (+82%), also among the biggest holdings.
•Notable changes in positioning include a lower allocation to France. By sector, meaningful changes in positioning include increased exposure to industrials and a lower allocation to consumer staples.
Key Fund Statistics(as of October 31, 2024)
KEY FACTS | | |
| Fund Size | $257,697,453 | |
| Number of Holdings | 153 | |
| Total Advisory Fee | $1,240,182 | |
| Portfolio Turnover | 29% | |
What did the Fund invest in?
(as of October 31, 2024)
MARKET SECTORS (% of Fund's net assets) | | |
| Information Technology | 20.5 | |
| Financials | 13.5 | |
| Industrials | 12.1 | |
| Health Care | 11.8 | |
| Consumer Discretionary | 9.4 | |
| Consumer Staples | 8.8 | |
| Communication Services | 6.2 | |
| Energy | 4.8 | |
| Utilities | 4.6 | |
| Materials | 4.3 | |
| Real Estate | 1.1 | |
| |
| Common Stocks | 97.1 |
| Short-Term Investments and Net Other Assets (Liabilities) | 2.9 |
ASSET ALLOCATION (% of Fund's net assets) |
|
|
| United States | 63.6 |
| United Kingdom | 7.4 |
| Japan | 5.5 |
| Canada | 5.2 |
| Germany | 3.8 |
| Taiwan | 2.7 |
| France | 2.6 |
| China | 2.0 |
| Italy | 1.2 |
| Others | 6.0 |
GEOGRAPHIC DIVERSIFICATION (% of Fund's net assets) |
|
| |
|
TOP HOLDINGS(% of Fund's net assets) | | |
| Apple Inc | 5.4 | |
| Microsoft Corp | 4.6 | |
| Taiwan Semiconductor Manufacturing Co Ltd | 2.7 | |
| Rheinmetall AG | 2.2 | |
| NXP Semiconductors NV | 2.0 | |
| JPMorgan Chase & Co | 1.7 | |
| Linde PLC | 1.5 | |
| Eli Lilly & Co | 1.4 | |
| UnitedHealth Group Inc | 1.4 | |
| AbbVie Inc | 1.4 | |
| | 24.3 | |
How has the Fund changed?
This is a summary of certain changes to the Fund since October 18, 2024. For more complete information, you may review the Fund's next prospectus, which we expect to be available by December 30, 2024 at fundresearch.fidelity.com/prospectus/sec or upon request at 1-877-208-0098 or by sending an e-mail to fidfunddocuments@fidelity.com.
Fidelity Advisor® Global Equity Income Fund merged into Fidelity® Global Equity Income Fund on October 25, 2024. | The fund changed its investment objective from non-fundamental to fundamental effective July 26, 2024.
|
The fund's sub-advisory agreement with FIL Investments (Japan) Limited was not renewed. | |
| Fidelity, the Fidelity Investments Logo and all other Fidelity trademarks or service marks used herein are trademarks or service marks of FMR LLC. Any third-party marks that are used herein are trademarks or service marks of their respective owners. © 2024 FMR LLC. All rights reserved. |
| | For additional information about the Fund; including its prospectus, financial information, holdings and proxy information, scan the QR code or visit fundresearch.fidelity.com/prospectus/sec 1.9918446.100 7770-TSRA-1224 |
| |
| | ANNUAL SHAREHOLDER REPORT | AS OF OCTOBER 31, 2024 | This report describes changes to the Fund that occurred during the reporting period. |
| | Fidelity® International Small Cap Fund Fidelity Advisor® International Small Cap Fund Class Z : FIQIX |
| | | |
This annual shareholder report contains information about Fidelity® International Small Cap Fund for the period November 1, 2023 to October 31, 2024. You can find additional information about the Fund at fundresearch.fidelity.com/prospectus/sec. You can also request this information by contacting us at 1-877-208-0098 or by sending an e-mail to fidfunddocuments@fidelity.com.
What were your Fund costs for the last year?(based on hypothetical $10,000 investment)
FUND COST (PREVIOUS YEAR)
| | Costs of a $10,000 investment | Costs paid as a percentage of a $10,000 investment | |
| Class Z | $ 105 | 0.96% | |
What affected the Fund's performance this period?
•International stocks achieved a strong gain for the 12 months ending October 31, 2024. Resilient global economic growth and a slowing in the pace of inflation in certain regions, as well as a shift to global monetary easing, contributed to a favorable backdrop, despite persistent geopolitical risk.
•Against this backdrop, an underweight in emerging markets, primarily in India, and picks in the U.K. and Brazil detracted from the fund's performance versus the Fidelity International Small Cap Fund Linked Index for the fiscal year.
•By sector, security selection in financials was the largest detractor. However, picks in industrials, health care and consumer discretionary also meaningfully weighed on the fund's relative result.
•The largest individual relative detractor was our non-benchmark stake in Hypera Pharma (-35%). A non-benchmark stake in Mayr-Melnhof Karton returned roughly -24% and was the second-largest relative detractor. An overweight in Stabilus (-36%) also hurt.
•In contrast, from a regional standpoint, picks in emerging markets, primarily in Taiwan and China, contributed to the fund's relative result. In Europe ex U.K., investment choices in Germany proved rewarding.
•By sector, the biggest contributor to performance versus the benchmark was stock selection in communication services, primarily within the media & entertainment industry. Security selection in information technology, primarily within the technology hardware & equipment industry, also boosted the fund's relative performance.
•The top individual relative contributor was an overweight in International Games System (+238%). This period we decreased our position in International Games System. The company was among our biggest holdings. The second-largest relative contributor was our non-benchmark stake in Rheinmetall (+81%). The company was the fund's biggest holding. Another notable relative contributor was an overweight in Test Research (+131%).
•Notable changes in positioning include decreased exposure to Germany and a higher allocation to Japan and Taiwan. By sector, meaningful changes in positioning include increased exposure to communication services and a lower allocation to consumer discretionary.
How did the Fund perform over the life of Fund?
CUMULATIVE PERFORMANCE
October 2, 2018 through October 31, 2024.
Initial investment of $10,000.
Class Z | $10,000 | $9,194 | $9,970 | $9,620 | $13,466 | $10,114 | $11,467 |
MSCI ACWI (All Country World Index) ex USA Small Cap Index | $10,000 | $9,075 | $9,885 | $9,903 | $13,764 | $9,958 | $10,852 |
| | 2018 | 2019 | 2020 | 2021 | 2022 | 2023 | 2024 |
AVERAGE ANNUAL TOTAL RETURNS:| | 1 Year | 5 Year | Life of Fund A |
| Class Z | 19.01% | 6.48% | 5.24% |
| MSCI ACWI (All Country World Index) ex USA Small Cap Index | 23.90% | 6.35% | 4.99% |
A From October 2, 2018
Visit institutional.fidelity.com for more recent performance information. |
The Fund's past performance is not a good predictor of the Fund's future performance. The graph and table do not reflect the deduction of taxes that a shareholder would pay on fund distributions or redemption of fund shares. |
Key Fund Statistics(as of October 31, 2024)
KEY FACTS | | |
| Fund Size | $4,778,290,407 | |
| Number of Holdings | 197 | |
| Total Advisory Fee | $43,346,727 | |
| Portfolio Turnover | 17% | |
What did the Fund invest in?
(as of October 31, 2024)
MARKET SECTORS (% of Fund's net assets) | | |
| Industrials | 22.4 | |
| Financials | 13.2 | |
| Consumer Discretionary | 11.0 | |
| Consumer Staples | 10.4 | |
| Information Technology | 9.4 | |
| Materials | 8.2 | |
| Real Estate | 5.9 | |
| Health Care | 5.4 | |
| Communication Services | 4.8 | |
| Energy | 3.7 | |
| Utilities | 1.5 | |
| |
| Common Stocks | 95.9 |
| Short-Term Investments and Net Other Assets (Liabilities) | 4.1 |
ASSET ALLOCATION (% of Fund's net assets) |
|
|
| Japan | 21.9 |
| United Kingdom | 15.5 |
| United States | 6.8 |
| Canada | 4.2 |
| Taiwan | 4.0 |
| Australia | 3.3 |
| Spain | 3.1 |
| China | 3.1 |
| Mexico | 3.1 |
| Others | 35.0 |
GEOGRAPHIC DIVERSIFICATION (% of Fund's net assets) |
|
| |
|
TOP HOLDINGS(% of Fund's net assets) | | |
| Rheinmetall AG | 1.3 | |
| Premier Foods PLC | 1.2 | |
| Century Pacific Food Inc | 1.1 | |
| Logista Integral SA | 1.0 | |
| North West Co Inc/The | 1.0 | |
| Ashtead Technology Holdings plc | 1.0 | |
| Shriram Finance Ltd | 0.9 | |
| RHI Magnesita NV | 0.9 | |
| BayCurrent Inc | 0.9 | |
| Richter Gedeon Nyrt | 0.9 | |
| | 10.2 | |
How has the Fund changed?
This is a summary of certain changes to the Fund since November 1, 2023. For more complete information, you may review the Fund's next prospectus, which we expect to be available by December 30, 2024 at fundresearch.fidelity.com/prospectus/sec or upon request at 1-877-208-0098 or by sending an e-mail to fidfunddocuments@fidelity.com.
The fees associated with this class changed during the reporting year.The variations in class fees are primarily the result of the following changes: - Management fee
- Operating expenses
- Performance adjustment fee
The fund's transfer agent and pricing & bookkeeping fees were changed to a fixed rate effective December 1, 2023, through February 29, 2024, in anticipation of the transition to a new management fee structure. Effective March 1, 2024, the fund's management contract was amended to incorporate administrative services previously covered under separate services agreements (transfer agent and pricing & bookkeeping). The amended contract incorporates a basic fee rate that may vary by class (subject to a performance adjustment). The Adviser or an affiliate pays certain expenses of managing and operating the fund out of each class's management fee. | The fund's sub-advisory agreement with FIL Investments (Japan) Limited was not renewed.
|
| Fidelity, the Fidelity Investments Logo and all other Fidelity trademarks or service marks used herein are trademarks or service marks of FMR LLC. Any third-party marks that are used herein are trademarks or service marks of their respective owners. © 2024 FMR LLC. All rights reserved. |
| | For additional information about the Fund; including its prospectus, financial information, holdings and proxy information, scan the QR code or visit fundresearch.fidelity.com/prospectus/sec 1.9913914.100 3267-TSRA-1224 |
| |
| | ANNUAL SHAREHOLDER REPORT | AS OF OCTOBER 31, 2024 | This report describes changes to the Fund that occurred during the reporting period. |
| | Fidelity® Emerging Markets Fund Fidelity Advisor® Emerging Markets Fund Class C : FEMMX |
| | | |
This annual shareholder report contains information about Fidelity® Emerging Markets Fund for the period November 1, 2023 to October 31, 2024. You can find additional information about the Fund at fundresearch.fidelity.com/prospectus/sec. You can also request this information by contacting us at 1-877-208-0098 or by sending an e-mail to fidfunddocuments@fidelity.com.
What were your Fund costs for the last year?(based on hypothetical $10,000 investment)
FUND COST (PREVIOUS YEAR)
| | Costs of a $10,000 investment | Costs paid as a percentage of a $10,000 investment | |
| Class C | $ 212 | 1.88% | |
What affected the Fund's performance this period?
•International stocks achieved a strong gain for the 12 months ending October 31, 2024. Resilient global economic growth and a slowing in the pace of inflation in certain regions, as well as a shift to global monetary easing, contributed to a favorable backdrop, despite persistent geopolitical risk.
•Against this backdrop, a non-benchmark allocation to developed markets - especially the U.S. - and stock picks in Taiwan contributed to the fund's performance versus the MSCI Emerging Markets (Net MA) Index for the fiscal year.
•By sector, the biggest contributors to performance versus the benchmark were stock picking and an overweight in information technology, primarily within the semiconductors & semiconductor equipment industry. An underweight in materials also boosted the fund's relative performance. Also bolstering our relative result was stock picking in consumer discretionary.
•The fund's non-benchmark stake in Nvidia gained 223% and was the top individual relative contributor. This period we decreased our investment in Nvidia. The stock was among our largest holdings. A second notable relative contributor was our non-benchmark stake in International Games System (+242%). This period we decreased our investment in International Games System. An overweight in Taiwan Semiconductor Manufacturing (+99%) also helped. The stock was the fund's largest holding.
•In contrast, from a geographical standpoint, stock picks in India and South Korea detracted from the fund's relative result.
•By sector, the biggest detractor from performance versus the benchmark was stock picking in financials. Also hurting our result were picks and overweights in consumer staples and health care.
•The largest individual relative detractor was an underweight in Alibaba (+23%). The stock was not held at period end. The second-largest relative detractor was an overweight in Kweichow Moutai (-4%). The company was among the fund's largest holdings this period. Another notable relative detractor this period was avoiding Hon Hai Precision Industry, a benchmark component that gained approximately 128%.
•Notable changes in positioning include decreased exposure to India and Saudi Arabia, and a higher allocation to China and Taiwan. By sector, meaningful changes in positioning include decreased exposure to materials and a higher allocation to industrials.
How did the Fund perform over the life of Fund?
CUMULATIVE PERFORMANCE
May 11, 2021 through October 31, 2024.
Initial investment of $10,000.
Class C | $10,000 | $10,103 | $6,213 | $7,102 |
MSCI Emerging Markets Index | $10,000 | $9,639 | $6,649 | $7,370 |
| | 2021 | 2022 | 2023 | 2024 |
AVERAGE ANNUAL TOTAL RETURNS:| | 1 Year | Life of Fund A |
| Class C (incl. contingent deferred sales charge) | 23.73% | -3.43% |
| Class C | 24.73% | -3.43% |
| MSCI Emerging Markets Index | 25.33% | -2.26% |
A From May 11, 2021
Visit institutional.fidelity.com for more recent performance information. |
The Fund's past performance is not a good predictor of the Fund's future performance. The graph and table do not reflect the deduction of taxes that a shareholder would pay on fund distributions or redemption of fund shares. |
Key Fund Statistics(as of October 31, 2024)
KEY FACTS | | |
| Fund Size | $8,930,817,606 | |
| Number of Holdings | 86 | |
| Total Advisory Fee | $66,535,420 | |
| Portfolio Turnover | 46% | |
What did the Fund invest in?
(as of October 31, 2024)
MARKET SECTORS (% of Fund's net assets) | | |
| Information Technology | 28.4 | |
| Financials | 17.2 | |
| Consumer Discretionary | 12.9 | |
| Industrials | 9.5 | |
| Communication Services | 9.3 | |
| Energy | 6.2 | |
| Consumer Staples | 5.4 | |
| Health Care | 5.3 | |
| Materials | 2.0 | |
| Utilities | 1.7 | |
| Real Estate | 0.6 | |
| |
| Common Stocks | 98.3 |
| Bonds | 0.3 |
| Preferred Stocks | 0.2 |
| Short-Term Investments and Net Other Assets (Liabilities) | 1.2 |
ASSET ALLOCATION (% of Fund's net assets) |
|
|
| China | 24.6 |
| India | 18.4 |
| Taiwan | 16.2 |
| Brazil | 6.6 |
| Korea (South) | 6.4 |
| United States | 6.3 |
| Indonesia | 3.8 |
| Saudi Arabia | 3.0 |
| Mexico | 2.8 |
| Others | 11.9 |
GEOGRAPHIC DIVERSIFICATION (% of Fund's net assets) |
|
| |
|
TOP HOLDINGS(% of Fund's net assets) | | |
| Taiwan Semiconductor Manufacturing Co Ltd | 13.5 | |
| Tencent Holdings Ltd | 6.6 | |
| NVIDIA Corp | 4.0 | |
| Meituan B Shares | 3.1 | |
| PDD Holdings Inc Class A ADR | 3.1 | |
| Samsung Electronics Co Ltd | 3.0 | |
| Bank Central Asia Tbk PT | 2.9 | |
| HDFC Bank Ltd | 2.6 | |
| SK Hynix Inc | 2.2 | |
| JD.com Inc ADR | 2.1 | |
| | 43.1 | |
How has the Fund changed?
This is a summary of certain changes to the Fund since November 1, 2023. For more complete information, you may review the Fund's next prospectus, which we expect to be available by December 30, 2024 at fundresearch.fidelity.com/prospectus/sec or upon request at 1-877-208-0098 or by sending an e-mail to fidfunddocuments@fidelity.com.
Fidelity® Latin America Fund merged into Fidelity® Emerging Markets Fund on September 13, 2024. | The fees associated with this class changed during the reporting year.The variations in class fees are primarily the result of the following changes: - Management fee
- Operating expenses
The fund's transfer agent and pricing & bookkeeping fees were changed to a fixed rate effective December 1, 2023, through February 29, 2024, in anticipation of the transition to a new management fee structure. Effective March 1, 2024, the fund's management contract was amended to incorporate administrative services previously covered under separate services agreements (transfer agent and pricing & bookkeeping). The amended contract incorporates a management fee rate that may vary by class. The Adviser or an affiliate pays certain expenses of managing and operating the fund out of each class's management fee.
|
The fund's sub-advisory agreement with FIL Investments (Japan) Limited was not renewed. | |
| Fidelity, the Fidelity Investments Logo and all other Fidelity trademarks or service marks used herein are trademarks or service marks of FMR LLC. Any third-party marks that are used herein are trademarks or service marks of their respective owners. © 2024 FMR LLC. All rights reserved. |
| | For additional information about the Fund; including its prospectus, financial information, holdings and proxy information, scan the QR code or visit fundresearch.fidelity.com/prospectus/sec 1.9913861.100 6356-TSRA-1224 |
| |
| | ANNUAL SHAREHOLDER REPORT | AS OF OCTOBER 31, 2024 | This report describes changes to the Fund that occurred during the reporting period. |
| | Fidelity® Emerging Markets Fund Fidelity Advisor® Emerging Markets Fund Class I : FECMX |
| | | |
This annual shareholder report contains information about Fidelity® Emerging Markets Fund for the period November 1, 2023 to October 31, 2024. You can find additional information about the Fund at fundresearch.fidelity.com/prospectus/sec. You can also request this information by contacting us at 1-877-208-0098 or by sending an e-mail to fidfunddocuments@fidelity.com.
What were your Fund costs for the last year?(based on hypothetical $10,000 investment)
FUND COST (PREVIOUS YEAR)
| | Costs of a $10,000 investment | Costs paid as a percentage of a $10,000 investment | |
| Class I | $ 99 | 0.87% | |
What affected the Fund's performance this period?
•International stocks achieved a strong gain for the 12 months ending October 31, 2024. Resilient global economic growth and a slowing in the pace of inflation in certain regions, as well as a shift to global monetary easing, contributed to a favorable backdrop, despite persistent geopolitical risk.
•Against this backdrop, a non-benchmark allocation to developed markets - especially the U.S. - and stock picks in Taiwan contributed to the fund's performance versus the MSCI Emerging Markets (Net MA) Index for the fiscal year.
•By sector, the biggest contributors to performance versus the benchmark were stock picking and an overweight in information technology, primarily within the semiconductors & semiconductor equipment industry. An underweight in materials also boosted the fund's relative performance. Also bolstering our relative result was stock picking in consumer discretionary.
•The fund's non-benchmark stake in Nvidia gained 223% and was the top individual relative contributor. This period we decreased our investment in Nvidia. The stock was among our largest holdings. A second notable relative contributor was our non-benchmark stake in International Games System (+242%). This period we decreased our investment in International Games System. An overweight in Taiwan Semiconductor Manufacturing (+99%) also helped. The stock was the fund's largest holding.
•In contrast, from a geographical standpoint, stock picks in India and South Korea detracted from the fund's relative result.
•By sector, the biggest detractor from performance versus the benchmark was stock picking in financials. Also hurting our result were picks and overweights in consumer staples and health care.
•The largest individual relative detractor was an underweight in Alibaba (+23%). The stock was not held at period end. The second-largest relative detractor was an overweight in Kweichow Moutai (-4%). The company was among the fund's largest holdings this period. Another notable relative detractor this period was avoiding Hon Hai Precision Industry, a benchmark component that gained approximately 128%.
•Notable changes in positioning include decreased exposure to India and Saudi Arabia, and a higher allocation to China and Taiwan. By sector, meaningful changes in positioning include decreased exposure to materials and a higher allocation to industrials.
How did the Fund perform over the life of Fund?
CUMULATIVE PERFORMANCE
May 11, 2021 through October 31, 2024.
Initial investment of $10,000.
Class I | $10,000 | $10,154 | $6,315 | $7,296 |
MSCI Emerging Markets Index | $10,000 | $9,639 | $6,649 | $7,370 |
| | 2021 | 2022 | 2023 | 2024 |
AVERAGE ANNUAL TOTAL RETURNS:| | 1 Year | Life of Fund A |
| Class I | 26.01% | -2.39% |
| MSCI Emerging Markets Index | 25.33% | -2.26% |
A From May 11, 2021
Visit institutional.fidelity.com for more recent performance information. |
The Fund's past performance is not a good predictor of the Fund's future performance. The graph and table do not reflect the deduction of taxes that a shareholder would pay on fund distributions or redemption of fund shares. |
Key Fund Statistics(as of October 31, 2024)
KEY FACTS | | |
| Fund Size | $8,930,817,606 | |
| Number of Holdings | 86 | |
| Total Advisory Fee | $66,535,420 | |
| Portfolio Turnover | 46% | |
What did the Fund invest in?
(as of October 31, 2024)
MARKET SECTORS (% of Fund's net assets) | | |
| Information Technology | 28.4 | |
| Financials | 17.2 | |
| Consumer Discretionary | 12.9 | |
| Industrials | 9.5 | |
| Communication Services | 9.3 | |
| Energy | 6.2 | |
| Consumer Staples | 5.4 | |
| Health Care | 5.3 | |
| Materials | 2.0 | |
| Utilities | 1.7 | |
| Real Estate | 0.6 | |
| |
| Common Stocks | 98.3 |
| Bonds | 0.3 |
| Preferred Stocks | 0.2 |
| Short-Term Investments and Net Other Assets (Liabilities) | 1.2 |
ASSET ALLOCATION (% of Fund's net assets) |
|
|
| China | 24.6 |
| India | 18.4 |
| Taiwan | 16.2 |
| Brazil | 6.6 |
| Korea (South) | 6.4 |
| United States | 6.3 |
| Indonesia | 3.8 |
| Saudi Arabia | 3.0 |
| Mexico | 2.8 |
| Others | 11.9 |
GEOGRAPHIC DIVERSIFICATION (% of Fund's net assets) |
|
| |
|
TOP HOLDINGS(% of Fund's net assets) | | |
| Taiwan Semiconductor Manufacturing Co Ltd | 13.5 | |
| Tencent Holdings Ltd | 6.6 | |
| NVIDIA Corp | 4.0 | |
| Meituan B Shares | 3.1 | |
| PDD Holdings Inc Class A ADR | 3.1 | |
| Samsung Electronics Co Ltd | 3.0 | |
| Bank Central Asia Tbk PT | 2.9 | |
| HDFC Bank Ltd | 2.6 | |
| SK Hynix Inc | 2.2 | |
| JD.com Inc ADR | 2.1 | |
| | 43.1 | |
How has the Fund changed?
This is a summary of certain changes to the Fund since November 1, 2023. For more complete information, you may review the Fund's next prospectus, which we expect to be available by December 30, 2024 at fundresearch.fidelity.com/prospectus/sec or upon request at 1-877-208-0098 or by sending an e-mail to fidfunddocuments@fidelity.com.
Fidelity® Latin America Fund merged into Fidelity® Emerging Markets Fund on September 13, 2024. | The fund's transfer agent and pricing & bookkeeping fees were changed to a fixed rate effective December 1, 2023, through February 29, 2024, in anticipation of the transition to a new management fee structure. Effective March 1, 2024, the fund's management contract was amended to incorporate administrative services previously covered under separate services agreements (transfer agent and pricing & bookkeeping). The amended contract incorporates a management fee rate that may vary by class. The Adviser or an affiliate pays certain expenses of managing and operating the fund out of each class's management fee.
|
The fund's sub-advisory agreement with FIL Investments (Japan) Limited was not renewed. | |
| Fidelity, the Fidelity Investments Logo and all other Fidelity trademarks or service marks used herein are trademarks or service marks of FMR LLC. Any third-party marks that are used herein are trademarks or service marks of their respective owners. © 2024 FMR LLC. All rights reserved. |
| | For additional information about the Fund; including its prospectus, financial information, holdings and proxy information, scan the QR code or visit fundresearch.fidelity.com/prospectus/sec 1.9913863.100 6358-TSRA-1224 |
| |
| | ANNUAL SHAREHOLDER REPORT | AS OF OCTOBER 31, 2024 | This report describes changes to the Fund that occurred during the reporting period. |
| | Fidelity® Japan Fund Fidelity Advisor® Japan Fund Class C : FJPCX |
| | | |
This annual shareholder report contains information about Fidelity® Japan Fund for the period November 1, 2023 to October 31, 2024. You can find additional information about the Fund at fundresearch.fidelity.com/prospectus/sec. You can also request this information by contacting us at 1-877-208-0098 or by sending an e-mail to fidfunddocuments@fidelity.com.
What were your Fund costs for the last year?(based on hypothetical $10,000 investment)
FUND COST (PREVIOUS YEAR)
| | Costs of a $10,000 investment | Costs paid as a percentage of a $10,000 investment | |
| Class C | $ 190 | 1.70% | |
What affected the Fund's performance this period?
•International stocks achieved a strong gain for the 12 months ending October 31, 2024. Resilient global economic growth and a slowing in the pace of inflation in certain regions, as well as a shift to global monetary easing, contributed to a favorable backdrop, despite persistent geopolitical risk.
•With that said, in March 2024, the Bank of Japan raised short-term interest rates for the first time in 17 years, ending its negative interest rate policy.
•Against this backdrop, stock selection in Japan and a non-benchmark allocation to the United States contributed to the fund's performance versus the TOPIX Total Return Index for the fiscal year.
•By sector, security selection was the primary contributor, led by industrials, where our stock picks in capital goods helped most. Stock picking in financials and consumer discretionary also boosted the fund's relative performance.
•The top individual relative contributor was an overweight in IHI (+196%). The second-largest relative contributor was an overweight in Hitachi (+109%). The stock was among the fund's largest holdings. An overweight in Dexerials (+115%) also helped. We trimmed our stakes in all three stocks.
•In contrast, from a regional standpoint, non-benchmark allocations to emerging markets and Asia Pacific ex Japan modestly detracted from the fund's relative result.
•By sector, the biggest detractor from performance versus the benchmark was stock selection in information technology, primarily within the semiconductors & semiconductor equipment industry. Security selection in energy also hampered the fund's result. Also hurting our result was an underweight in industrials, primarily within the capital goods industry.
•The largest individual relative detractor this period was avoiding Recruit Holdings, a benchmark component that gained 120%. The second-largest relative detractor was our non-benchmark stake in JTOWER (-31%). The stock was not held at period end. An overweight in TechnoPro Holdings (-4%) also hurt, and we reduced our exposure to the stock.
•By sector, meaningful changes in positioning include increased exposure to materials and industrials.
How did the Fund perform over the past 10 years?
CUMULATIVE PERFORMANCE
October 31, 2014 through October 31, 2024.
Initial investment of $10,000.
Class C | $10,000 | $10,164 | $10,743 | $12,884 | $12,094 | $13,410 | $14,897 | $17,957 | $12,597 | $13,832 | $17,075 |
Tokyo Stock Price Index (TOPIX) | $10,000 | $11,061 | $11,611 | $13,898 | $13,325 | $14,450 | $14,503 | $17,203 | $13,066 | $15,363 | $18,700 |
| | 2014 | 2015 | 2016 | 2017 | 2018 | 2019 | 2020 | 2021 | 2022 | 2023 | 2024 |
AVERAGE ANNUAL TOTAL RETURNS:| | 1 Year | 5 Year | 10 Year |
| Class C (incl. contingent deferred sales charge) | 21.54% | 4.64% | 5.50% |
| Class C | 22.54% | 4.64% | 5.50% |
| Tokyo Stock Price Index (TOPIX) | 21.72% | 5.29% | 6.46% |
Visit institutional.fidelity.com for more recent performance information. |
The Fund's past performance is not a good predictor of the Fund's future performance. The graph and table do not reflect the deduction of taxes that a shareholder would pay on fund distributions or redemption of fund shares. |
Key Fund Statistics(as of October 31, 2024)
KEY FACTS | | |
| Fund Size | $692,986,086 | |
| Number of Holdings | 89 | |
| Total Advisory Fee | $3,522,427 | |
| Portfolio Turnover | 21% | |
What did the Fund invest in?
(as of October 31, 2024)
MARKET SECTORS (% of Fund's net assets) | | |
| Industrials | 25.1 | |
| Information Technology | 18.9 | |
| Consumer Discretionary | 14.7 | |
| Financials | 13.4 | |
| Materials | 7.8 | |
| Health Care | 7.1 | |
| Communication Services | 4.2 | |
| Consumer Staples | 3.2 | |
| Energy | 1.9 | |
| Utilities | 1.9 | |
| Real Estate | 1.1 | |
| |
| Common Stocks | 99.3 |
| Short-Term Investments and Net Other Assets (Liabilities) | 0.7 |
ASSET ALLOCATION (% of Fund's net assets) |
|
|
| Japan | 98.4 |
| United States | 1.0 |
| China | 0.6 |
GEOGRAPHIC DIVERSIFICATION (% of Fund's net assets) |
|
| |
|
TOP HOLDINGS(% of Fund's net assets) | | |
| Sumitomo Mitsui Financial Group Inc | 6.0 | |
| Hitachi Ltd | 5.0 | |
| Sony Group Corp | 3.8 | |
| Shin-Etsu Chemical Co Ltd | 3.3 | |
| Hoya Corp | 3.3 | |
| ORIX Corp | 3.1 | |
| Renesas Electronics Corp | 2.7 | |
| Fujitsu Ltd | 2.6 | |
| FUJIFILM Holdings Corp | 2.4 | |
| Denso Corp | 2.3 | |
| | 34.5 | |
How has the Fund changed?
This is a summary of certain changes to the Fund since November 1, 2023. For more complete information, you may review the Fund's next prospectus, which we expect to be available by December 30, 2024 at fundresearch.fidelity.com/prospectus/sec or upon request at 1-877-208-0098 or by sending an e-mail to fidfunddocuments@fidelity.com.
The fees associated with this class changed during the reporting year.The variations in class fees are primarily the result of the following changes: - Management fee
- Performance adjustment fee
The fund's transfer agent and pricing & bookkeeping fees were changed to a fixed rate effective December 1, 2023, through February 29, 2024, in anticipation of the transition to a new management fee structure. Effective March 1, 2024, the fund's management contract was amended to incorporate administrative services previously covered under separate services agreements (transfer agent and pricing & bookkeeping). The amended contract incorporates a basic fee rate that may vary by class (subject to a performance adjustment). The Adviser or an affiliate pays certain expenses of managing and operating the fund out of each class's management fee. | The fund's sub-advisory agreement with FIL Investments (Japan) Limited was not renewed.
|
| Fidelity, the Fidelity Investments Logo and all other Fidelity trademarks or service marks used herein are trademarks or service marks of FMR LLC. Any third-party marks that are used herein are trademarks or service marks of their respective owners. © 2024 FMR LLC. All rights reserved. |
| | For additional information about the Fund; including its prospectus, financial information, holdings and proxy information, scan the QR code or visit fundresearch.fidelity.com/prospectus/sec 1.9913883.100 2258-TSRA-1224 |
| |
| | ANNUAL SHAREHOLDER REPORT | AS OF OCTOBER 31, 2024 | This report describes changes to the Fund that occurred during the reporting period. |
| | Fidelity® China Region Fund Fidelity Advisor® China Region Fund Class M : FHKTX |
| | | |
This annual shareholder report contains information about Fidelity® China Region Fund for the period November 1, 2023 to October 31, 2024. You can find additional information about the Fund at fundresearch.fidelity.com/prospectus/sec. You can also request this information by contacting us at 1-877-208-0098 or by sending an e-mail to fidfunddocuments@fidelity.com.
What were your Fund costs for the last year?(based on hypothetical $10,000 investment)
FUND COST (PREVIOUS YEAR)
| | Costs of a $10,000 investment | Costs paid as a percentage of a $10,000 investment | |
| Class M | $ 167 | 1.44% | |
What affected the Fund's performance this period?
•International stocks achieved a strong gain for the 12 months ending October 31, 2024. Resilient global economic growth and a slowing in the pace of inflation in certain regions, as well as a shift to global monetary easing, contributed to a favorable backdrop, despite persistent geopolitical risk.
•After trailing for most of the period, stocks in the China region got a boost in September from the Chinese government's announcement of aggressive monetary stimulus measures.
•Against this backdrop, picks in Taiwan had, by far, the biggest positive impact on the fund's performance versus the MSCI Golden Dragon (Net MA) Index for the fiscal year.
•By sector, security selection in information technology was the primary contributor, where our stock picks in semiconductors & semiconductor equipment helped most. Stock picks in materials and consumer discretionary also boosted the fund's relative performance.
•The top individual relative contributor was an overweight in Taiwan Semiconductor (+101%). The stock was the fund's biggest holding. A non-benchmark stake in Sea gained roughly 118% and was a second notable relative contributor. An overweight in Trip.com (+89%) also contributed. The stock was among our largest holdings.
•In contrast, from a geographical standpoint, an underweight in Taiwan, stock selection in Hong Kong and non-benchmark exposure to South Korea detracted from the fund's relative result.
•By sector, the biggest detractor from performance versus the benchmark was security selection in financials, primarily within the insurance industry. Stock selection and an overweight in health care also hampered the fund's result, as did picks in energy. Lastly, the fund's position in cash detracted.
•The biggest individual relative detractor was an overweight in NetEase (-25%). The company was among our largest holdings this period. The second-largest relative detractor was our non-benchmark stake in Samsung Electronics (-10%). Another notable relative detractor was our stake in Asymchem Laboratories (-54%), which was not held by the fund at period end.
•Notable changes in positioning include increased exposure to Taiwan and a lower allocation to Hong Kong. By sector, meaningful changes in positioning include lower allocations to health care and consumer staples.
How did the Fund perform over the past 10 years?
CUMULATIVE PERFORMANCE
October 31, 2014 through October 31, 2024.
Initial investment of $10,000 and the current sales charge was paid.
Class M | $9,650 | $9,477 | $9,429 | $12,754 | $10,694 | $13,357 | $18,972 | $19,610 | $10,713 | $13,246 | $17,549 |
MSCI Golden Dragon Index | $10,000 | $9,667 | $10,337 | $13,689 | $11,813 | $13,628 | $17,249 | $17,905 | $10,248 | $12,405 | $16,411 |
MSCI Emerging Markets Index | $10,000 | $8,550 | $9,346 | $11,823 | $10,347 | $11,577 | $12,535 | $14,663 | $10,115 | $11,211 | $14,051 |
| | 2014 | 2015 | 2016 | 2017 | 2018 | 2019 | 2020 | 2021 | 2022 | 2023 | 2024 |
AVERAGE ANNUAL TOTAL RETURNS:| | 1 Year | 5 Year | 10 Year |
| Class M (incl. 3.50% sales charge) | 27.85% | 4.86% | 5.79% |
| Class M (without 3.50% sales charge) | 32.49% | 5.61% | 6.16% |
| MSCI Golden Dragon Index | 32.29% | 3.79% | 5.08% |
| MSCI Emerging Markets Index | 25.33% | 3.95% | 3.46% |
Visit institutional.fidelity.com for more recent performance information. |
The Fund's past performance is not a good predictor of the Fund's future performance. The graph and table do not reflect the deduction of taxes that a shareholder would pay on fund distributions or redemption of fund shares. |
Key Fund Statistics(as of October 31, 2024)
KEY FACTS | | |
| Fund Size | $1,209,670,065 | |
| Number of Holdings | 86 | |
| Total Advisory Fee | $8,069,000 | |
| Portfolio Turnover | 30% | |
What did the Fund invest in?
(as of October 31, 2024)
MARKET SECTORS (% of Fund's net assets) | | |
| Information Technology | 31.3 | |
| Consumer Discretionary | 23.9 | |
| Communication Services | 13.8 | |
| Financials | 13.1 | |
| Industrials | 4.2 | |
| Health Care | 3.3 | |
| Materials | 3.2 | |
| Consumer Staples | 2.6 | |
| Real Estate | 1.0 | |
| Energy | 0.5 | |
| |
| Common Stocks | 94.9 |
| Preferred Stocks | 2.0 |
| Short-Term Investments and Net Other Assets (Liabilities) | 3.1 |
ASSET ALLOCATION (% of Fund's net assets) |
|
|
| China | 57.8 |
| Taiwan | 30.2 |
| Hong Kong | 5.0 |
| United States | 3.6 |
| Korea (South) | 1.3 |
| Singapore | 0.9 |
| Macau | 0.5 |
| France | 0.4 |
| Japan | 0.3 |
GEOGRAPHIC DIVERSIFICATION (% of Fund's net assets) |
|
| |
|
TOP HOLDINGS(% of Fund's net assets) | | |
| Taiwan Semiconductor Manufacturing Co Ltd | 22.8 | |
| Tencent Holdings Ltd | 10.3 | |
| Alibaba Group Holding Ltd | 5.5 | |
| Meituan B Shares | 4.0 | |
| PDD Holdings Inc Class A ADR | 3.4 | |
| China Construction Bank Corp H Shares | 3.1 | |
| AIA Group Ltd | 3.0 | |
| Hon Hai Precision Industry Co Ltd | 2.4 | |
| Zijin Mining Group Co Ltd H Shares | 2.1 | |
| JD.com Inc A Shares | 1.5 | |
| | 58.1 | |
How has the Fund changed?
This is a summary of certain changes to the Fund since November 1, 2023. For more complete information, you may review the Fund's next prospectus, which we expect to be available by December 30, 2024 at fundresearch.fidelity.com/prospectus/sec or upon request at 1-877-208-0098 or by sending an e-mail to fidfunddocuments@fidelity.com.
The fees associated with this class changed during the reporting year.The variations in class fees are primarily the result of the following changes: - Management fee
- Operating expenses
- Expense reductions
The fund's transfer agent and pricing & bookkeeping fees were changed to a fixed rate effective December 1, 2023, through February 29, 2024, in anticipation of the transition to a new management fee structure. Effective March 1, 2024, the fund's management contract was amended to incorporate administrative services previously covered under separate services agreements (transfer agent and pricing & bookkeeping). The amended contract incorporates a management fee rate that may vary by class. The Adviser or an affiliate pays certain expenses of managing and operating the fund out of each class's management fee. | The fund's sub-advisory agreement with FIL Investments (Japan) Limited was not renewed.
|
| Fidelity, the Fidelity Investments Logo and all other Fidelity trademarks or service marks used herein are trademarks or service marks of FMR LLC. Any third-party marks that are used herein are trademarks or service marks of their respective owners. © 2024 FMR LLC. All rights reserved. |
| | For additional information about the Fund; including its prospectus, financial information, holdings and proxy information, scan the QR code or visit fundresearch.fidelity.com/prospectus/sec 1.9913891.100 2067-TSRA-1224 |
| |
| | ANNUAL SHAREHOLDER REPORT | AS OF OCTOBER 31, 2024 | This report describes changes to the Fund that occurred during the reporting period. |
| | Fidelity® Total International Equity Fund Fidelity Advisor® Total International Equity Fund Class C : FTCEX |
| | | |
This annual shareholder report contains information about Fidelity® Total International Equity Fund for the period November 1, 2023 to October 31, 2024. You can find additional information about the Fund at fundresearch.fidelity.com/prospectus/sec. You can also request this information by contacting us at 1-877-208-0098 or by sending an e-mail to fidfunddocuments@fidelity.com.
What were your Fund costs for the last year?(based on hypothetical $10,000 investment)
FUND COST (PREVIOUS YEAR)
| | Costs of a $10,000 investment | Costs paid as a percentage of a $10,000 investment | |
| Class C | $ 223 | 1.99% | |
What affected the Fund's performance this period?
•International stocks achieved a strong gain for the 12 months ending October 31, 2024. Resilient global economic growth and a slowing in the pace of inflation in certain regions, as well as a shift to global monetary easing, contributed to a favorable backdrop, despite persistent geopolitical risk.
•Against this backdrop, an overweight in the United States and stock picks in Japan contributed to the fund's performance versus the MSCI All Country World ex US Index (Net MA) for the fiscal year.
•By sector, the biggest contributor to performance versus the benchmark was stock selection in materials. An underweight in consumer staples also boosted relative performance. Also bolstering our relative result were picks and an overweight in industrials, primarily within the capital goods industry.
•The top individual relative contributor was an overweight in Taiwan Semiconductor (+100%). The company was the fund's largest holding. The second-largest relative contributor was an overweight in CRH (+83%). The stock was among our largest holdings. An overweight in China Life Insurance (+65%) also contributed.
•In contrast, from a regional standpoint, stock picks in Canada and the United States detracted from the fund's relative result.
•By sector, the biggest detractor from performance versus the benchmark was stock selection in financials. Also hurting our result was security selection in information technology, primarily within the technology hardware & equipment industry, and consumer staples, primarily within the consumer staples distribution & retail industry. Lastly, the fund's position in cash detracted.
•The largest individual relative detractor was an overweight in Samsung Electronics (-13%). The stock was among our biggest holdings. The second-largest relative detractor was an overweight in Wal Mart De Mexico (-21%). This period we increased our stake in Wal Mart De Mexico. An overweight in Edenred (-38%) also detracted.
•Notable changes in positioning include higher allocations to Germany and the United Kingdom. By sector, meaningful changes in positioning include decreased exposure to consumer discretionary and energy.
How did the Fund perform over the past 10 years?
CUMULATIVE PERFORMANCE
October 31, 2014 through October 31, 2024.
Initial investment of $10,000.
Class C | $10,000 | $9,827 | $9,688 | $11,887 | $10,732 | $12,216 | $12,658 | $16,709 | $12,358 | $13,923 | $17,440 |
MSCI ACWI (All Country World Index) ex USA Index | $10,000 | $9,545 | $9,583 | $11,868 | $10,910 | $12,161 | $11,862 | $15,403 | $11,613 | $13,038 | $16,238 |
| | 2014 | 2015 | 2016 | 2017 | 2018 | 2019 | 2020 | 2021 | 2022 | 2023 | 2024 |
AVERAGE ANNUAL TOTAL RETURNS:| | 1 Year | 5 Year | 10 Year |
| Class C (incl. contingent deferred sales charge) | 23.28% | 7.05% | 5.72% |
| Class C | 24.28% | 7.05% | 5.72% |
| MSCI ACWI (All Country World Index) ex USA Index | 24.55% | 5.95% | 4.97% |
Visit institutional.fidelity.com for more recent performance information. |
The Fund's past performance is not a good predictor of the Fund's future performance. The graph and table do not reflect the deduction of taxes that a shareholder would pay on fund distributions or redemption of fund shares. |
Key Fund Statistics(as of October 31, 2024)
KEY FACTS | | |
| Fund Size | $319,759,338 | |
| Number of Holdings | 305 | |
| Total Advisory Fee | $2,246,403 | |
| Portfolio Turnover | 33% | |
What did the Fund invest in?
(as of October 31, 2024)
MARKET SECTORS (% of Fund's net assets) | | |
| Financials | 23.8 | |
| Industrials | 20.0 | |
| Information Technology | 14.0 | |
| Materials | 10.5 | |
| Consumer Discretionary | 9.5 | |
| Health Care | 5.5 | |
| Energy | 5.0 | |
| Communication Services | 4.2 | |
| Consumer Staples | 3.6 | |
| Real Estate | 0.3 | |
| Utilities | 0.2 | |
| |
| Common Stocks | 96.4 |
| Preferred Stocks | 0.2 |
| Short-Term Investments and Net Other Assets (Liabilities) | 3.4 |
ASSET ALLOCATION (% of Fund's net assets) |
|
|
| United States | 14.5 |
| Japan | 10.8 |
| China | 9.3 |
| United Kingdom | 8.6 |
| France | 6.5 |
| Canada | 6.3 |
| Germany | 5.9 |
| Taiwan | 4.8 |
| Korea (South) | 3.9 |
| Others | 29.4 |
GEOGRAPHIC DIVERSIFICATION (% of Fund's net assets) |
|
| |
|
TOP HOLDINGS(% of Fund's net assets) | | |
| Taiwan Semiconductor Manufacturing Co Ltd | 3.4 | |
| Tencent Holdings Ltd | 2.5 | |
| CRH PLC | 1.8 | |
| Samsung Electronics Co Ltd | 1.8 | |
| SAP SE | 1.6 | |
| Novo Nordisk A/S Series B | 1.6 | |
| Linde PLC | 1.6 | |
| ASML Holding NV | 1.5 | |
| Canadian Pacific Kansas City Ltd | 1.5 | |
| BAE Systems PLC | 1.3 | |
| | 18.6 | |
How has the Fund changed?
This is a summary of certain changes to the Fund since November 1, 2023. For more complete information, you may review the Fund's next prospectus, which we expect to be available by December 30, 2024 at fundresearch.fidelity.com/prospectus/sec or upon request at 1-877-208-0098 or by sending an e-mail to fidfunddocuments@fidelity.com.
The fees associated with this class changed during the reporting year.The variations in class fees are primarily the result of the following changes: - Management fee
- Operating expenses
- Performance adjustment fee
- Expense reductions
The fund's transfer agent and pricing & bookkeeping fees were changed to a fixed rate effective December 1, 2023, through February 29, 2024, in anticipation of the transition to a new management fee structure. Effective March 1, 2024, the fund's management contract was amended to incorporate administrative services previously covered under separate services agreements (transfer agent and pricing & bookkeeping). The amended contract incorporates a basic fee rate that may vary by class (subject to a performance adjustment). The Adviser or an affiliate pays certain expenses of managing and operating the fund out of each class's management fee. The class reduced its contractual expense cap during the reporting period. |
|
The fund's sub-advisory agreement with FIL Investments (Japan) Limited was not renewed. | |
| Fidelity, the Fidelity Investments Logo and all other Fidelity trademarks or service marks used herein are trademarks or service marks of FMR LLC. Any third-party marks that are used herein are trademarks or service marks of their respective owners. © 2024 FMR LLC. All rights reserved. |
| | For additional information about the Fund; including its prospectus, financial information, holdings and proxy information, scan the QR code or visit fundresearch.fidelity.com/prospectus/sec 1.9913944.100 1982-TSRA-1224 |
| |
| | ANNUAL SHAREHOLDER REPORT | AS OF OCTOBER 31, 2024 | This report describes changes to the Fund that occurred during the reporting period. |
| | Fidelity® Worldwide Fund Fidelity® Worldwide Fund : FWWFX |
| | | |
This annual shareholder report contains information about Fidelity® Worldwide Fund for the period November 1, 2023 to October 31, 2024. You can find additional information about the Fund at fundresearch.fidelity.com/prospectus/sec. You can also request this information by contacting us at 1-800-544-8544 or by sending an e-mail to fidfunddocuments@fidelity.com.
What were your Fund costs for the last year?(based on hypothetical $10,000 investment)
FUND COST (PREVIOUS YEAR)
| | Costs of a $10,000 investment | Costs paid as a percentage of a $10,000 investment | |
| Fidelity® Worldwide Fund | $ 85 | 0.70% | |
What affected the Fund's performance this period?
•Global equities posted a strong advance for the 12 months ending October 31, 2024. Resilient economic growth and a slowing in the pace of inflation in certain regions, as well as a shift to global monetary easing, contributed to a favorable backdrop, despite persistent geopolitical risk.
•Against this backdrop, by region, security selection in the United States was the primary contributor to the fund's performance versus the MSCI World Index for the fiscal year.
•By sector, security selection was the primary contributor, especially within consumer discretionary. Stock picking in information technology, primarily within the semiconductors & semiconductor equipment industry, and industrials, primarily within the capital goods industry, also boosted the fund's relative performance.
•The top individual relative contributor was an overweight in Nvidia (+219%). We decreased our position in Nvidia during the period, but the company was the fund's largest holding at period end. The second-largest relative contributor was an overweight in Constellation Energy (+138%). This period we increased our investment in the stock. An overweight in Meta Platforms (+89%), which was one of the fund's largest holdings, also helped.
•In contrast, from a regional standpoint, an overweight in emerging markets, and stock selection and an overweight in the U.K., detracted from the fund's relative result.
•By sector, the biggest detractors from performance versus the benchmark were stock picking and an underweight in financials. Also modestly hurting our result were overweights in consumer discretionary, primarily within the consumer durables & apparel industry, and information technology.
•The biggest individual relative detractor was a stake in Jabil (-8%). The stock was not held at period end. The second-largest relative detractor was an overweight in Coinbase Global (-25%). This was a position we established this period. An overweight in Oracle (+8%) also hurt. We notably decreased our stake in Oracle by period end.
•Notable changes in positioning by region include a lower allocation to Japan. By sector, meaningful changes in positioning include decreased exposure to energy and a higher allocation to consumer discretionary.
How did the Fund perform over the past 10 years?
CUMULATIVE PERFORMANCE
October 31, 2014 through October 31, 2024.
Initial investment of $10,000.
Fidelity® Worldwide Fund | $10,000 | $10,301 | $10,221 | $12,928 | $13,475 | $15,188 | $18,389 | $25,398 | $18,511 | $20,538 | $29,474 |
MSCI World Index | $10,000 | $10,220 | $10,390 | $12,813 | $13,016 | $14,736 | $15,446 | $21,766 | $17,811 | $19,758 | $26,510 |
| | 2014 | 2015 | 2016 | 2017 | 2018 | 2019 | 2020 | 2021 | 2022 | 2023 | 2024 |
AVERAGE ANNUAL TOTAL RETURNS:| | 1 Year | 5 Year | 10 Year |
| Fidelity® Worldwide Fund | 43.51% | 14.18% | 11.42% |
| MSCI World Index | 34.17% | 12.46% | 10.24% |
Visit www.fidelity.com for more recent performance information. |
The Fund's past performance is not a good predictor of the Fund's future performance. The graph and table do not reflect the deduction of taxes that a shareholder would pay on fund distributions or redemption of fund shares. |
Key Fund Statistics(as of October 31, 2024)
KEY FACTS | | |
| Fund Size | $3,143,670,063 | |
| Number of Holdings | 189 | |
| Total Advisory Fee | $19,608,125 | |
| Portfolio Turnover | 108% | |
What did the Fund invest in?
(as of October 31, 2024)
MARKET SECTORS (% of Fund's net assets) | | |
| Information Technology | 21.6 | |
| Consumer Discretionary | 16.6 | |
| Industrials | 16.3 | |
| Financials | 14.4 | |
| Communication Services | 10.4 | |
| Health Care | 8.5 | |
| Energy | 3.1 | |
| Utilities | 2.4 | |
| Real Estate | 2.2 | |
| Consumer Staples | 2.0 | |
| Materials | 1.9 | |
| |
| Common Stocks | 99.2 |
| Preferred Stocks | 0.2 |
| Short-Term Investments and Net Other Assets (Liabilities) | 0.6 |
ASSET ALLOCATION (% of Fund's net assets) |
|
|
| United States | 69.1 |
| United Kingdom | 4.6 |
| Canada | 4.0 |
| Sweden | 3.3 |
| Japan | 3.3 |
| Italy | 1.8 |
| Australia | 1.6 |
| Denmark | 1.5 |
| Belgium | 1.3 |
| Others | 9.5 |
GEOGRAPHIC DIVERSIFICATION (% of Fund's net assets) |
|
| |
|
TOP HOLDINGS(% of Fund's net assets) | | |
| NVIDIA Corp | 5.6 | |
| Meta Platforms Inc Class A | 4.7 | |
| Microsoft Corp | 4.1 | |
| Apple Inc | 3.8 | |
| Modine Manufacturing Co | 3.1 | |
| Eli Lilly & Co | 3.1 | |
| Amazon.com Inc | 2.7 | |
| Fiserv Inc | 2.5 | |
| Alphabet Inc Class A | 2.4 | |
| Deckers Outdoor Corp | 2.4 | |
| | 34.4 | |
How has the Fund changed?
This is a summary of certain changes to the Fund since November 1, 2023. For more complete information, you may review the Fund's next prospectus, which we expect to be available by December 30, 2024 at fundresearch.fidelity.com/prospectus/sec or upon request at 1-800-544-8544 or by sending an e-mail to fidfunddocuments@fidelity.com.
The fees associated with this class changed during the reporting year.The variations in class fees are primarily the result of the following changes: - Management fee
- Operating expenses
- Performance adjustment fee
The fund's transfer agent and pricing & bookkeeping fees were changed to a fixed rate effective December 1, 2023, through February 29, 2024, in anticipation of the transition to a new management fee structure. Effective March 1, 2024, the fund's management contract was amended to incorporate administrative services previously covered under separate services agreements (transfer agent and pricing & bookkeeping). The amended contract incorporates a basic fee rate that may vary by class (subject to a performance adjustment). The Adviser or an affiliate pays certain expenses of managing and operating the fund out of each class's management fee. | The fund's sub-advisory agreement with FIL Investments (Japan) Limited was not renewed.
|
| Fidelity, the Fidelity Investments Logo and all other Fidelity trademarks or service marks used herein are trademarks or service marks of FMR LLC. Any third-party marks that are used herein are trademarks or service marks of their respective owners. © 2024 FMR LLC. All rights reserved. |
| | For additional information about the Fund; including its prospectus, financial information, holdings and proxy information, scan the QR code or visit fundresearch.fidelity.com/prospectus/sec 1.9913856.100 318-TSRA-1224 |
| |
| | ANNUAL SHAREHOLDER REPORT | AS OF OCTOBER 31, 2024 | This report describes changes to the Fund that occurred during the reporting period. |
| | Fidelity® China Region Fund Fidelity Advisor® China Region Fund Class C : FCHKX |
| | | |
This annual shareholder report contains information about Fidelity® China Region Fund for the period November 1, 2023 to October 31, 2024. You can find additional information about the Fund at fundresearch.fidelity.com/prospectus/sec. You can also request this information by contacting us at 1-877-208-0098 or by sending an e-mail to fidfunddocuments@fidelity.com.
What were your Fund costs for the last year?(based on hypothetical $10,000 investment)
FUND COST (PREVIOUS YEAR)
| | Costs of a $10,000 investment | Costs paid as a percentage of a $10,000 investment | |
| Class C | $ 225 | 1.94% | |
What affected the Fund's performance this period?
•International stocks achieved a strong gain for the 12 months ending October 31, 2024. Resilient global economic growth and a slowing in the pace of inflation in certain regions, as well as a shift to global monetary easing, contributed to a favorable backdrop, despite persistent geopolitical risk.
•After trailing for most of the period, stocks in the China region got a boost in September from the Chinese government's announcement of aggressive monetary stimulus measures.
•Against this backdrop, picks in Taiwan had, by far, the biggest positive impact on the fund's performance versus the MSCI Golden Dragon (Net MA) Index for the fiscal year.
•By sector, security selection in information technology was the primary contributor, where our stock picks in semiconductors & semiconductor equipment helped most. Stock picks in materials and consumer discretionary also boosted the fund's relative performance.
•The top individual relative contributor was an overweight in Taiwan Semiconductor (+101%). The stock was the fund's biggest holding. A non-benchmark stake in Sea gained roughly 118% and was a second notable relative contributor. An overweight in Trip.com (+89%) also contributed. The stock was among our largest holdings.
•In contrast, from a geographical standpoint, an underweight in Taiwan, stock selection in Hong Kong and non-benchmark exposure to South Korea detracted from the fund's relative result.
•By sector, the biggest detractor from performance versus the benchmark was security selection in financials, primarily within the insurance industry. Stock selection and an overweight in health care also hampered the fund's result, as did picks in energy. Lastly, the fund's position in cash detracted.
•The biggest individual relative detractor was an overweight in NetEase (-25%). The company was among our largest holdings this period. The second-largest relative detractor was our non-benchmark stake in Samsung Electronics (-10%). Another notable relative detractor was our stake in Asymchem Laboratories (-54%), which was not held by the fund at period end.
•Notable changes in positioning include increased exposure to Taiwan and a lower allocation to Hong Kong. By sector, meaningful changes in positioning include lower allocations to health care and consumer staples.
How did the Fund perform over the past 10 years?
CUMULATIVE PERFORMANCE
October 31, 2014 through October 31, 2024.
Initial investment of $10,000.
Class C | $10,000 | $9,779 | $9,693 | $13,057 | $10,904 | $13,565 | $19,189 | $19,743 | $10,740 | $13,316 | $17,682 |
MSCI Golden Dragon Index | $10,000 | $9,667 | $10,337 | $13,689 | $11,813 | $13,628 | $17,249 | $17,905 | $10,248 | $12,405 | $16,411 |
MSCI Emerging Markets Index | $10,000 | $8,550 | $9,346 | $11,823 | $10,347 | $11,577 | $12,535 | $14,663 | $10,115 | $11,211 | $14,051 |
| | 2014 | 2015 | 2016 | 2017 | 2018 | 2019 | 2020 | 2021 | 2022 | 2023 | 2024 |
AVERAGE ANNUAL TOTAL RETURNS:| | 1 Year | 5 Year | 10 Year |
| Class C (incl. contingent deferred sales charge) | 30.82% | 5.13% | 5.86% |
| Class C | 31.82% | 5.13% | 5.86% |
| MSCI Golden Dragon Index | 32.29% | 3.79% | 5.08% |
| MSCI Emerging Markets Index | 25.33% | 3.95% | 3.46% |
Visit institutional.fidelity.com for more recent performance information. |
The Fund's past performance is not a good predictor of the Fund's future performance. The graph and table do not reflect the deduction of taxes that a shareholder would pay on fund distributions or redemption of fund shares. |
Key Fund Statistics(as of October 31, 2024)
KEY FACTS | | |
| Fund Size | $1,209,670,065 | |
| Number of Holdings | 86 | |
| Total Advisory Fee | $8,069,000 | |
| Portfolio Turnover | 30% | |
What did the Fund invest in?
(as of October 31, 2024)
MARKET SECTORS (% of Fund's net assets) | | |
| Information Technology | 31.3 | |
| Consumer Discretionary | 23.9 | |
| Communication Services | 13.8 | |
| Financials | 13.1 | |
| Industrials | 4.2 | |
| Health Care | 3.3 | |
| Materials | 3.2 | |
| Consumer Staples | 2.6 | |
| Real Estate | 1.0 | |
| Energy | 0.5 | |
| |
| Common Stocks | 94.9 |
| Preferred Stocks | 2.0 |
| Short-Term Investments and Net Other Assets (Liabilities) | 3.1 |
ASSET ALLOCATION (% of Fund's net assets) |
|
|
| China | 57.8 |
| Taiwan | 30.2 |
| Hong Kong | 5.0 |
| United States | 3.6 |
| Korea (South) | 1.3 |
| Singapore | 0.9 |
| Macau | 0.5 |
| France | 0.4 |
| Japan | 0.3 |
GEOGRAPHIC DIVERSIFICATION (% of Fund's net assets) |
|
| |
|
TOP HOLDINGS(% of Fund's net assets) | | |
| Taiwan Semiconductor Manufacturing Co Ltd | 22.8 | |
| Tencent Holdings Ltd | 10.3 | |
| Alibaba Group Holding Ltd | 5.5 | |
| Meituan B Shares | 4.0 | |
| PDD Holdings Inc Class A ADR | 3.4 | |
| China Construction Bank Corp H Shares | 3.1 | |
| AIA Group Ltd | 3.0 | |
| Hon Hai Precision Industry Co Ltd | 2.4 | |
| Zijin Mining Group Co Ltd H Shares | 2.1 | |
| JD.com Inc A Shares | 1.5 | |
| | 58.1 | |
How has the Fund changed?
This is a summary of certain changes to the Fund since November 1, 2023. For more complete information, you may review the Fund's next prospectus, which we expect to be available by December 30, 2024 at fundresearch.fidelity.com/prospectus/sec or upon request at 1-877-208-0098 or by sending an e-mail to fidfunddocuments@fidelity.com.
The fund's transfer agent and pricing & bookkeeping fees were changed to a fixed rate effective December 1, 2023, through February 29, 2024, in anticipation of the transition to a new management fee structure. Effective March 1, 2024, the fund's management contract was amended to incorporate administrative services previously covered under separate services agreements (transfer agent and pricing & bookkeeping). The amended contract incorporates a management fee rate that may vary by class. The Adviser or an affiliate pays certain expenses of managing and operating the fund out of each class's management fee. | The fund's sub-advisory agreement with FIL Investments (Japan) Limited was not renewed.
|
| Fidelity, the Fidelity Investments Logo and all other Fidelity trademarks or service marks used herein are trademarks or service marks of FMR LLC. Any third-party marks that are used herein are trademarks or service marks of their respective owners. © 2024 FMR LLC. All rights reserved. |
| | For additional information about the Fund; including its prospectus, financial information, holdings and proxy information, scan the QR code or visit fundresearch.fidelity.com/prospectus/sec 1.9913890.100 2066-TSRA-1224 |
| |
| | ANNUAL SHAREHOLDER REPORT | AS OF OCTOBER 31, 2024 | This report describes changes to the Fund that occurred during the reporting period. |
| | Fidelity® International Discovery Fund Fidelity Advisor® International Discovery Fund Class M : FTADX |
| | | |
This annual shareholder report contains information about Fidelity® International Discovery Fund for the period November 1, 2023 to October 31, 2024. You can find additional information about the Fund at fundresearch.fidelity.com/prospectus/sec. You can also request this information by contacting us at 1-877-208-0098 or by sending an e-mail to fidfunddocuments@fidelity.com.
What were your Fund costs for the last year?(based on hypothetical $10,000 investment)
FUND COST (PREVIOUS YEAR)
| | Costs of a $10,000 investment | Costs paid as a percentage of a $10,000 investment | |
| Class M | $ 129 | 1.12% | |
What affected the Fund's performance this period?
•International stocks achieved a strong gain for the 12 months ending October 31, 2024. Resilient global economic growth and a slowing in the pace of inflation in certain regions, as well as a shift to global monetary easing, contributed to a favorable backdrop, despite persistent geopolitical risk.
•Against this backdrop, picks in Europe ex U.K. and Japan contributed to the fund's performance versus the MSCI EAFE Index (Net MA) for the fiscal year.
•By sector, the biggest contributor to performance versus the benchmark was stock picking in industrials, primarily within the capital goods industry. Stock picking and an overweight in information technology, primarily within the semiconductors & semiconductor equipment industry, also boosted the fund's relative performance, as did stock picking in consumer discretionary.
•The top individual relative contributor was our non-benchmark stake in Nvidia (+121%). This period we decreased our investment in Nvidia. A second notable relative contributor was our non-benchmark stake in Taiwan Semiconductor (+96%). The company was one of our largest holdings. Another notable relative contributor was an overweight in Hitachi (+109%), the fund's biggest holding at period end.
•In contrast, from a regional standpoint, a non-benchmark allocation to Canada and an underweight in Asia Pacific ex Japan detracted from the fund's relative result.
•By sector, the biggest detractor from performance versus the benchmark was stock selection in consumer staples. Security selection in financials also hampered the fund's result. Also hurting our result were stock picks and an underweight in communication services, primarily within the media & entertainment industry. Lastly, the fund's position in cash detracted.
•The fund's non-benchmark stake in PDD returned -47% and was the largest individual relative detractor. This was a position we established this period. A second notable relative detractor was an overweight in L'Oréal (-9%), which was among the fund's biggest holdings this period. A non-benchmark stake in One97 Communications returned about -29% and notably hurt. The stock was not held at period end.
•Notable changes in positioning include increased exposure to Germany and a lower allocation to India. By sector, meaningful changes in positioning include increased exposure to industrials and a lower allocation to consumer staples.
How did the Fund perform over the past 10 years?
CUMULATIVE PERFORMANCE
October 31, 2014 through October 31, 2024.
Initial investment of $10,000 and the current sales charge was paid.
Class M | $9,650 | $9,926 | $9,423 | $11,831 | $10,611 | $11,844 | $12,765 | $16,917 | $11,714 | $12,464 | $16,054 |
MSCI EAFE Index | $10,000 | $10,008 | $9,705 | $12,004 | $11,206 | $12,472 | $11,638 | $15,647 | $12,073 | $13,841 | $17,059 |
| | 2014 | 2015 | 2016 | 2017 | 2018 | 2019 | 2020 | 2021 | 2022 | 2023 | 2024 |
AVERAGE ANNUAL TOTAL RETURNS:| | 1 Year | 5 Year | 10 Year |
| Class M (incl. 3.50% sales charge) | 24.30% | 5.52% | 4.85% |
| Class M (without 3.50% sales charge) | 28.81% | 6.27% | 5.22% |
| MSCI EAFE Index | 23.25% | 6.46% | 5.49% |
Visit institutional.fidelity.com for more recent performance information. |
The Fund's past performance is not a good predictor of the Fund's future performance. The graph and table do not reflect the deduction of taxes that a shareholder would pay on fund distributions or redemption of fund shares. |
Key Fund Statistics(as of October 31, 2024)
KEY FACTS | | |
| Fund Size | $9,841,033,775 | |
| Number of Holdings | 142 | |
| Total Advisory Fee | $45,667,963 | |
| Portfolio Turnover | 44% | |
What did the Fund invest in?
(as of October 31, 2024)
MARKET SECTORS (% of Fund's net assets) | | |
| Financials | 22.3 | |
| Industrials | 22.0 | |
| Consumer Discretionary | 14.1 | |
| Information Technology | 11.8 | |
| Health Care | 9.8 | |
| Materials | 5.4 | |
| Consumer Staples | 4.1 | |
| Communication Services | 3.3 | |
| Energy | 3.1 | |
| Real Estate | 1.0 | |
| |
| Common Stocks | 96.2 |
| Preferred Stocks | 0.7 |
| Short-Term Investments and Net Other Assets (Liabilities) | 3.1 |
ASSET ALLOCATION (% of Fund's net assets) |
|
|
| Japan | 17.6 |
| United Kingdom | 15.3 |
| France | 9.1 |
| United States | 8.5 |
| Germany | 7.0 |
| Netherlands | 6.0 |
| Italy | 5.0 |
| Canada | 4.6 |
| Sweden | 3.6 |
| Others | 23.3 |
GEOGRAPHIC DIVERSIFICATION (% of Fund's net assets) |
|
| |
|
TOP HOLDINGS(% of Fund's net assets) | | |
| Hitachi Ltd | 3.1 | |
| UniCredit SpA | 2.7 | |
| Novo Nordisk A/S Series B | 2.7 | |
| ASML Holding NV | 2.1 | |
| Taiwan Semiconductor Manufacturing Co Ltd | 2.0 | |
| Constellation Software Inc/Canada | 2.0 | |
| Unilever PLC | 2.0 | |
| Compass Group PLC | 1.7 | |
| UCB SA | 1.7 | |
| ITOCHU Corp | 1.6 | |
| | 21.6 | |
How has the Fund changed?
This is a summary of certain changes to the Fund since November 1, 2023. For more complete information, you may review the Fund's next prospectus, which we expect to be available by December 30, 2024 at fundresearch.fidelity.com/prospectus/sec or upon request at 1-877-208-0098 or by sending an e-mail to fidfunddocuments@fidelity.com.
The fees associated with this class changed during the reporting year.The variations in class fees are primarily the result of the following changes: - Management fee
- Performance adjustment fee
- Operating expenses
The fund's transfer agent and pricing & bookkeeping fees were changed to a fixed rate effective December 1, 2023, through February 29, 2024, in anticipation of the transition to a new management fee structure. Effective March 1, 2024, the fund's management contract was amended to incorporate administrative services previously covered under separate services agreements (transfer agent and pricing & bookkeeping). The amended contract incorporates a basic fee rate that may vary by class (subject to a performance adjustment). The Adviser or an affiliate pays certain expenses of managing and operating the fund out of each class's management fee. | The fund's sub-advisory agreement with FIL Investments (Japan) Limited was not renewed.
|
| Fidelity, the Fidelity Investments Logo and all other Fidelity trademarks or service marks used herein are trademarks or service marks of FMR LLC. Any third-party marks that are used herein are trademarks or service marks of their respective owners. © 2024 FMR LLC. All rights reserved. |
| | For additional information about the Fund; including its prospectus, financial information, holdings and proxy information, scan the QR code or visit fundresearch.fidelity.com/prospectus/sec 1.9913837.100 1401-TSRA-1224 |
| |
| | ANNUAL SHAREHOLDER REPORT | AS OF OCTOBER 31, 2024 | This report describes changes to the Fund that occurred during the reporting period. |
| | Fidelity® Japan Fund Fidelity Advisor® Japan Fund Class I : FJPIX |
| | | |
This annual shareholder report contains information about Fidelity® Japan Fund for the period November 1, 2023 to October 31, 2024. You can find additional information about the Fund at fundresearch.fidelity.com/prospectus/sec. You can also request this information by contacting us at 1-877-208-0098 or by sending an e-mail to fidfunddocuments@fidelity.com.
What were your Fund costs for the last year?(based on hypothetical $10,000 investment)
FUND COST (PREVIOUS YEAR)
| | Costs of a $10,000 investment | Costs paid as a percentage of a $10,000 investment | |
| Class I | $ 80 | 0.72% | |
What affected the Fund's performance this period?
•International stocks achieved a strong gain for the 12 months ending October 31, 2024. Resilient global economic growth and a slowing in the pace of inflation in certain regions, as well as a shift to global monetary easing, contributed to a favorable backdrop, despite persistent geopolitical risk.
•With that said, in March 2024, the Bank of Japan raised short-term interest rates for the first time in 17 years, ending its negative interest rate policy.
•Against this backdrop, stock selection in Japan and a non-benchmark allocation to the United States contributed to the fund's performance versus the TOPIX Total Return Index for the fiscal year.
•By sector, security selection was the primary contributor, led by industrials, where our stock picks in capital goods helped most. Stock picking in financials and consumer discretionary also boosted the fund's relative performance.
•The top individual relative contributor was an overweight in IHI (+196%). The second-largest relative contributor was an overweight in Hitachi (+109%). The stock was among the fund's largest holdings. An overweight in Dexerials (+115%) also helped. We trimmed our stakes in all three stocks.
•In contrast, from a regional standpoint, non-benchmark allocations to emerging markets and Asia Pacific ex Japan modestly detracted from the fund's relative result.
•By sector, the biggest detractor from performance versus the benchmark was stock selection in information technology, primarily within the semiconductors & semiconductor equipment industry. Security selection in energy also hampered the fund's result. Also hurting our result was an underweight in industrials, primarily within the capital goods industry.
•The largest individual relative detractor this period was avoiding Recruit Holdings, a benchmark component that gained 120%. The second-largest relative detractor was our non-benchmark stake in JTOWER (-31%). The stock was not held at period end. An overweight in TechnoPro Holdings (-4%) also hurt, and we reduced our exposure to the stock.
•By sector, meaningful changes in positioning include increased exposure to materials and industrials.
How did the Fund perform over the past 10 years?
CUMULATIVE PERFORMANCE
October 31, 2014 through October 31, 2024.
Initial investment of $10,000.
Class I | $10,000 | $10,272 | $10,968 | $13,295 | $12,607 | $14,135 | $15,859 | $19,317 | $13,686 | $15,070 | $18,646 |
Tokyo Stock Price Index (TOPIX) | $10,000 | $11,061 | $11,611 | $13,898 | $13,325 | $14,450 | $14,503 | $17,203 | $13,066 | $15,363 | $18,700 |
| | 2014 | 2015 | 2016 | 2017 | 2018 | 2019 | 2020 | 2021 | 2022 | 2023 | 2024 |
AVERAGE ANNUAL TOTAL RETURNS:| | 1 Year | 5 Year | 10 Year |
| Class I | 23.73% | 5.70% | 6.43% |
| Tokyo Stock Price Index (TOPIX) | 21.72% | 5.29% | 6.46% |
Visit institutional.fidelity.com for more recent performance information. |
The Fund's past performance is not a good predictor of the Fund's future performance. The graph and table do not reflect the deduction of taxes that a shareholder would pay on fund distributions or redemption of fund shares. |
Key Fund Statistics(as of October 31, 2024)
KEY FACTS | | |
| Fund Size | $692,986,086 | |
| Number of Holdings | 89 | |
| Total Advisory Fee | $3,522,427 | |
| Portfolio Turnover | 21% | |
What did the Fund invest in?
(as of October 31, 2024)
MARKET SECTORS (% of Fund's net assets) | | |
| Industrials | 25.1 | |
| Information Technology | 18.9 | |
| Consumer Discretionary | 14.7 | |
| Financials | 13.4 | |
| Materials | 7.8 | |
| Health Care | 7.1 | |
| Communication Services | 4.2 | |
| Consumer Staples | 3.2 | |
| Energy | 1.9 | |
| Utilities | 1.9 | |
| Real Estate | 1.1 | |
| |
| Common Stocks | 99.3 |
| Short-Term Investments and Net Other Assets (Liabilities) | 0.7 |
ASSET ALLOCATION (% of Fund's net assets) |
|
|
| Japan | 98.4 |
| United States | 1.0 |
| China | 0.6 |
GEOGRAPHIC DIVERSIFICATION (% of Fund's net assets) |
|
| |
|
TOP HOLDINGS(% of Fund's net assets) | | |
| Sumitomo Mitsui Financial Group Inc | 6.0 | |
| Hitachi Ltd | 5.0 | |
| Sony Group Corp | 3.8 | |
| Shin-Etsu Chemical Co Ltd | 3.3 | |
| Hoya Corp | 3.3 | |
| ORIX Corp | 3.1 | |
| Renesas Electronics Corp | 2.7 | |
| Fujitsu Ltd | 2.6 | |
| FUJIFILM Holdings Corp | 2.4 | |
| Denso Corp | 2.3 | |
| | 34.5 | |
How has the Fund changed?
This is a summary of certain changes to the Fund since November 1, 2023. For more complete information, you may review the Fund's next prospectus, which we expect to be available by December 30, 2024 at fundresearch.fidelity.com/prospectus/sec or upon request at 1-877-208-0098 or by sending an e-mail to fidfunddocuments@fidelity.com.
The fees associated with this class changed during the reporting year.The variations in class fees are primarily the result of the following changes: - Management fee
- Performance adjustment fee
The fund's transfer agent and pricing & bookkeeping fees were changed to a fixed rate effective December 1, 2023, through February 29, 2024, in anticipation of the transition to a new management fee structure. Effective March 1, 2024, the fund's management contract was amended to incorporate administrative services previously covered under separate services agreements (transfer agent and pricing & bookkeeping). The amended contract incorporates a basic fee rate that may vary by class (subject to a performance adjustment). The Adviser or an affiliate pays certain expenses of managing and operating the fund out of each class's management fee. | The fund's sub-advisory agreement with FIL Investments (Japan) Limited was not renewed.
|
| Fidelity, the Fidelity Investments Logo and all other Fidelity trademarks or service marks used herein are trademarks or service marks of FMR LLC. Any third-party marks that are used herein are trademarks or service marks of their respective owners. © 2024 FMR LLC. All rights reserved. |
| | For additional information about the Fund; including its prospectus, financial information, holdings and proxy information, scan the QR code or visit fundresearch.fidelity.com/prospectus/sec 1.9913885.100 2260-TSRA-1224 |
| |
| | ANNUAL SHAREHOLDER REPORT | AS OF OCTOBER 31, 2024 | This report describes changes to the Fund that occurred during the reporting period. |
| | Fidelity® Emerging Markets Fund Fidelity Advisor® Emerging Markets Fund Class A : FEDMX |
| | | |
This annual shareholder report contains information about Fidelity® Emerging Markets Fund for the period November 1, 2023 to October 31, 2024. You can find additional information about the Fund at fundresearch.fidelity.com/prospectus/sec. You can also request this information by contacting us at 1-877-208-0098 or by sending an e-mail to fidfunddocuments@fidelity.com.
What were your Fund costs for the last year?(based on hypothetical $10,000 investment)
FUND COST (PREVIOUS YEAR)
| | Costs of a $10,000 investment | Costs paid as a percentage of a $10,000 investment | |
| Class A | $ 128 | 1.13% | |
What affected the Fund's performance this period?
•International stocks achieved a strong gain for the 12 months ending October 31, 2024. Resilient global economic growth and a slowing in the pace of inflation in certain regions, as well as a shift to global monetary easing, contributed to a favorable backdrop, despite persistent geopolitical risk.
•Against this backdrop, a non-benchmark allocation to developed markets - especially the U.S. - and stock picks in Taiwan contributed to the fund's performance versus the MSCI Emerging Markets (Net MA) Index for the fiscal year.
•By sector, the biggest contributors to performance versus the benchmark were stock picking and an overweight in information technology, primarily within the semiconductors & semiconductor equipment industry. An underweight in materials also boosted the fund's relative performance. Also bolstering our relative result was stock picking in consumer discretionary.
•The fund's non-benchmark stake in Nvidia gained 223% and was the top individual relative contributor. This period we decreased our investment in Nvidia. The stock was among our largest holdings. A second notable relative contributor was our non-benchmark stake in International Games System (+242%). This period we decreased our investment in International Games System. An overweight in Taiwan Semiconductor Manufacturing (+99%) also helped. The stock was the fund's largest holding.
•In contrast, from a geographical standpoint, stock picks in India and South Korea detracted from the fund's relative result.
•By sector, the biggest detractor from performance versus the benchmark was stock picking in financials. Also hurting our result were picks and overweights in consumer staples and health care.
•The largest individual relative detractor was an underweight in Alibaba (+23%). The stock was not held at period end. The second-largest relative detractor was an overweight in Kweichow Moutai (-4%). The company was among the fund's largest holdings this period. Another notable relative detractor this period was avoiding Hon Hai Precision Industry, a benchmark component that gained approximately 128%.
•Notable changes in positioning include decreased exposure to India and Saudi Arabia, and a higher allocation to China and Taiwan. By sector, meaningful changes in positioning include decreased exposure to materials and a higher allocation to industrials.
How did the Fund perform over the life of Fund?
CUMULATIVE PERFORMANCE
May 11, 2021 through October 31, 2024.
Initial investment of $10,000 and the current sales charge was paid.
Class A | $9,425 | $9,556 | $5,924 | $6,824 |
MSCI Emerging Markets Index | $10,000 | $9,639 | $6,649 | $7,370 |
| | 2021 | 2022 | 2023 | 2024 |
AVERAGE ANNUAL TOTAL RETURNS:| | 1 Year | Life of Fund A |
| Class A (incl. 5.75% sales charge) | 18.46% | -4.32% |
| Class A (without 5.75% sales charge) | 25.69% | -2.68% |
| MSCI Emerging Markets Index | 25.33% | -2.26% |
A From May 11, 2021
Visit institutional.fidelity.com for more recent performance information. |
The Fund's past performance is not a good predictor of the Fund's future performance. The graph and table do not reflect the deduction of taxes that a shareholder would pay on fund distributions or redemption of fund shares. |
Key Fund Statistics(as of October 31, 2024)
KEY FACTS | | |
| Fund Size | $8,930,817,606 | |
| Number of Holdings | 86 | |
| Total Advisory Fee | $66,535,420 | |
| Portfolio Turnover | 46% | |
What did the Fund invest in?
(as of October 31, 2024)
MARKET SECTORS (% of Fund's net assets) | | |
| Information Technology | 28.4 | |
| Financials | 17.2 | |
| Consumer Discretionary | 12.9 | |
| Industrials | 9.5 | |
| Communication Services | 9.3 | |
| Energy | 6.2 | |
| Consumer Staples | 5.4 | |
| Health Care | 5.3 | |
| Materials | 2.0 | |
| Utilities | 1.7 | |
| Real Estate | 0.6 | |
| |
| Common Stocks | 98.3 |
| Bonds | 0.3 |
| Preferred Stocks | 0.2 |
| Short-Term Investments and Net Other Assets (Liabilities) | 1.2 |
ASSET ALLOCATION (% of Fund's net assets) |
|
|
| China | 24.6 |
| India | 18.4 |
| Taiwan | 16.2 |
| Brazil | 6.6 |
| Korea (South) | 6.4 |
| United States | 6.3 |
| Indonesia | 3.8 |
| Saudi Arabia | 3.0 |
| Mexico | 2.8 |
| Others | 11.9 |
GEOGRAPHIC DIVERSIFICATION (% of Fund's net assets) |
|
| |
|
TOP HOLDINGS(% of Fund's net assets) | | |
| Taiwan Semiconductor Manufacturing Co Ltd | 13.5 | |
| Tencent Holdings Ltd | 6.6 | |
| NVIDIA Corp | 4.0 | |
| Meituan B Shares | 3.1 | |
| PDD Holdings Inc Class A ADR | 3.1 | |
| Samsung Electronics Co Ltd | 3.0 | |
| Bank Central Asia Tbk PT | 2.9 | |
| HDFC Bank Ltd | 2.6 | |
| SK Hynix Inc | 2.2 | |
| JD.com Inc ADR | 2.1 | |
| | 43.1 | |
How has the Fund changed?
This is a summary of certain changes to the Fund since November 1, 2023. For more complete information, you may review the Fund's next prospectus, which we expect to be available by December 30, 2024 at fundresearch.fidelity.com/prospectus/sec or upon request at 1-877-208-0098 or by sending an e-mail to fidfunddocuments@fidelity.com.
Fidelity® Latin America Fund merged into Fidelity® Emerging Markets Fund on September 13, 2024. | The fees associated with this class changed during the reporting year.The variations in class fees are primarily the result of the following changes: - Management fee
- Operating expenses
The fund's transfer agent and pricing & bookkeeping fees were changed to a fixed rate effective December 1, 2023, through February 29, 2024, in anticipation of the transition to a new management fee structure. Effective March 1, 2024, the fund's management contract was amended to incorporate administrative services previously covered under separate services agreements (transfer agent and pricing & bookkeeping). The amended contract incorporates a management fee rate that may vary by class. The Adviser or an affiliate pays certain expenses of managing and operating the fund out of each class's management fee.
|
The fund's sub-advisory agreement with FIL Investments (Japan) Limited was not renewed. | |
| Fidelity, the Fidelity Investments Logo and all other Fidelity trademarks or service marks used herein are trademarks or service marks of FMR LLC. Any third-party marks that are used herein are trademarks or service marks of their respective owners. © 2024 FMR LLC. All rights reserved. |
| | For additional information about the Fund; including its prospectus, financial information, holdings and proxy information, scan the QR code or visit fundresearch.fidelity.com/prospectus/sec 1.9913860.100 6355-TSRA-1224 |
| |
| | ANNUAL SHAREHOLDER REPORT | AS OF OCTOBER 31, 2024 | This report describes changes to the Fund that occurred during the reporting period. |
| | Fidelity® Worldwide Fund Fidelity Advisor® Worldwide Fund Class A : FWAFX |
| | | |
This annual shareholder report contains information about Fidelity® Worldwide Fund for the period November 1, 2023 to October 31, 2024. You can find additional information about the Fund at fundresearch.fidelity.com/prospectus/sec. You can also request this information by contacting us at 1-877-208-0098 or by sending an e-mail to fidfunddocuments@fidelity.com.
What were your Fund costs for the last year?(based on hypothetical $10,000 investment)
FUND COST (PREVIOUS YEAR)
| | Costs of a $10,000 investment | Costs paid as a percentage of a $10,000 investment | |
| Class A | $ 120 | 0.99% | |
What affected the Fund's performance this period?
•Global equities posted a strong advance for the 12 months ending October 31, 2024. Resilient economic growth and a slowing in the pace of inflation in certain regions, as well as a shift to global monetary easing, contributed to a favorable backdrop, despite persistent geopolitical risk.
•Against this backdrop, by region, security selection in the United States was the primary contributor to the fund's performance versus the MSCI World Index for the fiscal year.
•By sector, security selection was the primary contributor, especially within consumer discretionary. Stock picking in information technology, primarily within the semiconductors & semiconductor equipment industry, and industrials, primarily within the capital goods industry, also boosted the fund's relative performance.
•The top individual relative contributor was an overweight in Nvidia (+219%). We decreased our position in Nvidia during the period, but the company was the fund's largest holding at period end. The second-largest relative contributor was an overweight in Constellation Energy (+138%). This period we increased our investment in the stock. An overweight in Meta Platforms (+89%), which was one of the fund's largest holdings, also helped.
•In contrast, from a regional standpoint, an overweight in emerging markets, and stock selection and an overweight in the U.K., detracted from the fund's relative result.
•By sector, the biggest detractors from performance versus the benchmark were stock picking and an underweight in financials. Also modestly hurting our result were overweights in consumer discretionary, primarily within the consumer durables & apparel industry, and information technology.
•The biggest individual relative detractor was a stake in Jabil (-8%). The stock was not held at period end. The second-largest relative detractor was an overweight in Coinbase Global (-25%). This was a position we established this period. An overweight in Oracle (+8%) also hurt. We notably decreased our stake in Oracle by period end.
•Notable changes in positioning by region include a lower allocation to Japan. By sector, meaningful changes in positioning include decreased exposure to energy and a higher allocation to consumer discretionary.
How did the Fund perform over the past 10 years?
CUMULATIVE PERFORMANCE
October 31, 2014 through October 31, 2024.
Initial investment of $10,000 and the current sales charge was paid.
Class A | $9,425 | $9,682 | $9,577 | $12,072 | $12,550 | $14,100 | $17,022 | $23,442 | $17,041 | $18,851 | $26,974 |
MSCI World Index | $10,000 | $10,220 | $10,390 | $12,813 | $13,016 | $14,736 | $15,446 | $21,766 | $17,811 | $19,758 | $26,510 |
| | 2014 | 2015 | 2016 | 2017 | 2018 | 2019 | 2020 | 2021 | 2022 | 2023 | 2024 |
AVERAGE ANNUAL TOTAL RETURNS:| | 1 Year | 5 Year | 10 Year |
| Class A (incl. 5.75% sales charge) | 34.86% | 12.51% | 10.43% |
| Class A (without 5.75% sales charge) | 43.09% | 13.85% | 11.09% |
| MSCI World Index | 34.17% | 12.46% | 10.24% |
Visit institutional.fidelity.com for more recent performance information. |
The Fund's past performance is not a good predictor of the Fund's future performance. The graph and table do not reflect the deduction of taxes that a shareholder would pay on fund distributions or redemption of fund shares. |
Key Fund Statistics(as of October 31, 2024)
KEY FACTS | | |
| Fund Size | $3,143,670,063 | |
| Number of Holdings | 189 | |
| Total Advisory Fee | $19,608,125 | |
| Portfolio Turnover | 108% | |
What did the Fund invest in?
(as of October 31, 2024)
MARKET SECTORS (% of Fund's net assets) | | |
| Information Technology | 21.6 | |
| Consumer Discretionary | 16.6 | |
| Industrials | 16.3 | |
| Financials | 14.4 | |
| Communication Services | 10.4 | |
| Health Care | 8.5 | |
| Energy | 3.1 | |
| Utilities | 2.4 | |
| Real Estate | 2.2 | |
| Consumer Staples | 2.0 | |
| Materials | 1.9 | |
| |
| Common Stocks | 99.2 |
| Preferred Stocks | 0.2 |
| Short-Term Investments and Net Other Assets (Liabilities) | 0.6 |
ASSET ALLOCATION (% of Fund's net assets) |
|
|
| United States | 69.1 |
| United Kingdom | 4.6 |
| Canada | 4.0 |
| Sweden | 3.3 |
| Japan | 3.3 |
| Italy | 1.8 |
| Australia | 1.6 |
| Denmark | 1.5 |
| Belgium | 1.3 |
| Others | 9.5 |
GEOGRAPHIC DIVERSIFICATION (% of Fund's net assets) |
|
| |
|
TOP HOLDINGS(% of Fund's net assets) | | |
| NVIDIA Corp | 5.6 | |
| Meta Platforms Inc Class A | 4.7 | |
| Microsoft Corp | 4.1 | |
| Apple Inc | 3.8 | |
| Modine Manufacturing Co | 3.1 | |
| Eli Lilly & Co | 3.1 | |
| Amazon.com Inc | 2.7 | |
| Fiserv Inc | 2.5 | |
| Alphabet Inc Class A | 2.4 | |
| Deckers Outdoor Corp | 2.4 | |
| | 34.4 | |
How has the Fund changed?
This is a summary of certain changes to the Fund since November 1, 2023. For more complete information, you may review the Fund's next prospectus, which we expect to be available by December 30, 2024 at fundresearch.fidelity.com/prospectus/sec or upon request at 1-877-208-0098 or by sending an e-mail to fidfunddocuments@fidelity.com.
The fund's transfer agent and pricing & bookkeeping fees were changed to a fixed rate effective December 1, 2023, through February 29, 2024, in anticipation of the transition to a new management fee structure. Effective March 1, 2024, the fund's management contract was amended to incorporate administrative services previously covered under separate services agreements (transfer agent and pricing & bookkeeping). The amended contract incorporates a basic fee rate that may vary by class (subject to a performance adjustment). The Adviser or an affiliate pays certain expenses of managing and operating the fund out of each class's management fee. | The fund's sub-advisory agreement with FIL Investments (Japan) Limited was not renewed.
|
| Fidelity, the Fidelity Investments Logo and all other Fidelity trademarks or service marks used herein are trademarks or service marks of FMR LLC. Any third-party marks that are used herein are trademarks or service marks of their respective owners. © 2024 FMR LLC. All rights reserved. |
| | For additional information about the Fund; including its prospectus, financial information, holdings and proxy information, scan the QR code or visit fundresearch.fidelity.com/prospectus/sec 1.9913852.100 2143-TSRA-1224 |
| |
| | ANNUAL SHAREHOLDER REPORT | AS OF OCTOBER 31, 2024 | This report describes changes to the Fund that occurred during the reporting period. |
| | Fidelity® Total International Equity Fund Fidelity® Total International Equity Fund : FTIEX |
| | | |
This annual shareholder report contains information about Fidelity® Total International Equity Fund for the period November 1, 2023 to October 31, 2024. You can find additional information about the Fund at fundresearch.fidelity.com/prospectus/sec. You can also request this information by contacting us at 1-800-544-8544 or by sending an e-mail to fidfunddocuments@fidelity.com.
What were your Fund costs for the last year?(based on hypothetical $10,000 investment)
FUND COST (PREVIOUS YEAR)
| | Costs of a $10,000 investment | Costs paid as a percentage of a $10,000 investment | |
| Fidelity® Total International Equity Fund | $ 112 | 0.99% | |
What affected the Fund's performance this period?
•International stocks achieved a strong gain for the 12 months ending October 31, 2024. Resilient global economic growth and a slowing in the pace of inflation in certain regions, as well as a shift to global monetary easing, contributed to a favorable backdrop, despite persistent geopolitical risk.
•Against this backdrop, an overweight in the United States and stock picks in Japan contributed to the fund's performance versus the MSCI All Country World ex US Index (Net MA) for the fiscal year.
•By sector, the biggest contributor to performance versus the benchmark was stock selection in materials. An underweight in consumer staples also boosted relative performance. Also bolstering our relative result were picks and an overweight in industrials, primarily within the capital goods industry.
•The top individual relative contributor was an overweight in Taiwan Semiconductor (+100%). The company was the fund's largest holding. The second-largest relative contributor was an overweight in CRH (+83%). The stock was among our largest holdings. An overweight in China Life Insurance (+65%) also contributed.
•In contrast, from a regional standpoint, stock picks in Canada and the United States detracted from the fund's relative result.
•By sector, the biggest detractor from performance versus the benchmark was stock selection in financials. Also hurting our result was security selection in information technology, primarily within the technology hardware & equipment industry, and consumer staples, primarily within the consumer staples distribution & retail industry. Lastly, the fund's position in cash detracted.
•The largest individual relative detractor was an overweight in Samsung Electronics (-13%). The stock was among our biggest holdings. The second-largest relative detractor was an overweight in Wal Mart De Mexico (-21%). This period we increased our stake in Wal Mart De Mexico. An overweight in Edenred (-38%) also detracted.
•Notable changes in positioning include higher allocations to Germany and the United Kingdom. By sector, meaningful changes in positioning include decreased exposure to consumer discretionary and energy.
How did the Fund perform over the past 10 years?
CUMULATIVE PERFORMANCE
October 31, 2014 through October 31, 2024.
Initial investment of $10,000.
Fidelity® Total International Equity Fund | $10,000 | $9,949 | $9,917 | $12,283 | $11,197 | $12,873 | $13,473 | $17,968 | $13,430 | $15,150 | $19,041 |
MSCI ACWI (All Country World Index) ex USA Index | $10,000 | $9,545 | $9,583 | $11,868 | $10,910 | $12,161 | $11,862 | $15,403 | $11,613 | $13,038 | $16,238 |
| | 2014 | 2015 | 2016 | 2017 | 2018 | 2019 | 2020 | 2021 | 2022 | 2023 | 2024 |
AVERAGE ANNUAL TOTAL RETURNS:| | 1 Year | 5 Year | 10 Year |
| Fidelity® Total International Equity Fund | 25.68% | 8.14% | 6.65% |
| MSCI ACWI (All Country World Index) ex USA Index | 24.55% | 5.95% | 4.97% |
Visit www.fidelity.com for more recent performance information. |
The Fund's past performance is not a good predictor of the Fund's future performance. The graph and table do not reflect the deduction of taxes that a shareholder would pay on fund distributions or redemption of fund shares. |
Key Fund Statistics(as of October 31, 2024)
KEY FACTS | | |
| Fund Size | $319,759,338 | |
| Number of Holdings | 305 | |
| Total Advisory Fee | $2,246,403 | |
| Portfolio Turnover | 33% | |
What did the Fund invest in?
(as of October 31, 2024)
MARKET SECTORS (% of Fund's net assets) | | |
| Financials | 23.8 | |
| Industrials | 20.0 | |
| Information Technology | 14.0 | |
| Materials | 10.5 | |
| Consumer Discretionary | 9.5 | |
| Health Care | 5.5 | |
| Energy | 5.0 | |
| Communication Services | 4.2 | |
| Consumer Staples | 3.6 | |
| Real Estate | 0.3 | |
| Utilities | 0.2 | |
| |
| Common Stocks | 96.4 |
| Preferred Stocks | 0.2 |
| Short-Term Investments and Net Other Assets (Liabilities) | 3.4 |
ASSET ALLOCATION (% of Fund's net assets) |
|
|
| United States | 14.5 |
| Japan | 10.8 |
| China | 9.3 |
| United Kingdom | 8.6 |
| France | 6.5 |
| Canada | 6.3 |
| Germany | 5.9 |
| Taiwan | 4.8 |
| Korea (South) | 3.9 |
| Others | 29.4 |
GEOGRAPHIC DIVERSIFICATION (% of Fund's net assets) |
|
| |
|
TOP HOLDINGS(% of Fund's net assets) | | |
| Taiwan Semiconductor Manufacturing Co Ltd | 3.4 | |
| Tencent Holdings Ltd | 2.5 | |
| CRH PLC | 1.8 | |
| Samsung Electronics Co Ltd | 1.8 | |
| SAP SE | 1.6 | |
| Novo Nordisk A/S Series B | 1.6 | |
| Linde PLC | 1.6 | |
| ASML Holding NV | 1.5 | |
| Canadian Pacific Kansas City Ltd | 1.5 | |
| BAE Systems PLC | 1.3 | |
| | 18.6 | |
How has the Fund changed?
This is a summary of certain changes to the Fund since November 1, 2023. For more complete information, you may review the Fund's next prospectus, which we expect to be available by December 30, 2024 at fundresearch.fidelity.com/prospectus/sec or upon request at 1-800-544-8544 or by sending an e-mail to fidfunddocuments@fidelity.com.
The fees associated with this class changed during the reporting year.The variations in class fees are primarily the result of the following changes: - Management fee
- Operating expenses
- Performance adjustment fee
- Expense reductions
The fund's transfer agent and pricing & bookkeeping fees were changed to a fixed rate effective December 1, 2023, through February 29, 2024, in anticipation of the transition to a new management fee structure. Effective March 1, 2024, the fund's management contract was amended to incorporate administrative services previously covered under separate services agreements (transfer agent and pricing & bookkeeping). The amended contract incorporates a basic fee rate that may vary by class (subject to a performance adjustment). The Adviser or an affiliate pays certain expenses of managing and operating the fund out of each class's management fee. The class reduced its contractual expense cap during the reporting period. |
|
The fund's sub-advisory agreement with FIL Investments (Japan) Limited was not renewed. | |
| Fidelity, the Fidelity Investments Logo and all other Fidelity trademarks or service marks used herein are trademarks or service marks of FMR LLC. Any third-party marks that are used herein are trademarks or service marks of their respective owners. © 2024 FMR LLC. All rights reserved. |
| | For additional information about the Fund; including its prospectus, financial information, holdings and proxy information, scan the QR code or visit fundresearch.fidelity.com/prospectus/sec 1.9913942.100 1978-TSRA-1224 |
| |
| | ANNUAL SHAREHOLDER REPORT | AS OF OCTOBER 31, 2024 | This report describes changes to the Fund that occurred during the reporting period. |
| | Fidelity® Global Equity Income Fund Fidelity Advisor® Global Equity Income Fund Class C : FGEHX |
| | | |
This annual shareholder report contains information about Fidelity® Global Equity Income Fund for the period October 18, 2024 to October 31, 2024. You can find additional information about the Fund at fundresearch.fidelity.com/prospectus/sec. You can also request this information by contacting us at 1-877-208-0098 or by sending an e-mail to fidfunddocuments@fidelity.com.
What were your Fund costs for the last year?(based on hypothetical $10,000 investment)
FUND COST (PREVIOUS YEAR)
| | Costs of a $10,000 investment | Costs paid as a percentage of a $10,000 investment | |
Class C A | $ 7 | 1.80% | |
AExpenses for the full reporting period would be higher.
What affected the Fund's performance this period?
•Global equities posted a strong advance for the 12 months ending October 31, 2024. Resilient economic growth and a slowing in the pace of inflation in certain regions, as well as a shift to global monetary easing, contributed to a favorable backdrop, despite persistent geopolitical risk.
•Against this backdrop, stock picking in the United States and picks and an overweight in the U.K. detracted from the fund's performance versus the MSCI All Country World Index (Net MA) for the fiscal year.
•By sector, the biggest detractor from performance versus the benchmark was stock selection in information technology. Also hurting our result was stock selection in consumer discretionary and communication services, primarily within the media & entertainment industry. Lastly, the fund's position in cash detracted.
•The biggest individual relative detractor this period was avoiding Nvidia, a benchmark component that gained about 226%. Not owning Meta Platforms, a benchmark component that gained 89%, was the second-largest relative detractor. An overweight in Dollar Tree (-41%) also hurt.
•In contrast, from a regional standpoint, an underweight in emerging markets and picks in Europe ex U.K., primarily in Germany, contributed to the fund's relative result.
•By sector, the biggest contributor to performance versus the benchmark was security selection in industrials, primarily within the capital goods industry. Stock picks in utilities and health care, primarily within the pharmaceuticals, biotechnology & life sciences industry, also boosted the fund's relative result.
•The top individual relative contributor was an overweight in Vistra (+290%). The second-largest relative contributor was an overweight in Taiwan Semiconductor (+97%), which was among the largest holdings. Another notable relative contributor was an overweight in Rheinmetall (+82%), also among the biggest holdings.
•Notable changes in positioning include a lower allocation to France. By sector, meaningful changes in positioning include increased exposure to industrials and a lower allocation to consumer staples.
Key Fund Statistics(as of October 31, 2024)
KEY FACTS | | |
| Fund Size | $257,697,453 | |
| Number of Holdings | 153 | |
| Total Advisory Fee | $1,240,182 | |
| Portfolio Turnover | 29% | |
What did the Fund invest in?
(as of October 31, 2024)
MARKET SECTORS (% of Fund's net assets) | | |
| Information Technology | 20.5 | |
| Financials | 13.5 | |
| Industrials | 12.1 | |
| Health Care | 11.8 | |
| Consumer Discretionary | 9.4 | |
| Consumer Staples | 8.8 | |
| Communication Services | 6.2 | |
| Energy | 4.8 | |
| Utilities | 4.6 | |
| Materials | 4.3 | |
| Real Estate | 1.1 | |
| |
| Common Stocks | 97.1 |
| Short-Term Investments and Net Other Assets (Liabilities) | 2.9 |
ASSET ALLOCATION (% of Fund's net assets) |
|
|
| United States | 63.6 |
| United Kingdom | 7.4 |
| Japan | 5.5 |
| Canada | 5.2 |
| Germany | 3.8 |
| Taiwan | 2.7 |
| France | 2.6 |
| China | 2.0 |
| Italy | 1.2 |
| Others | 6.0 |
GEOGRAPHIC DIVERSIFICATION (% of Fund's net assets) |
|
| |
|
TOP HOLDINGS(% of Fund's net assets) | | |
| Apple Inc | 5.4 | |
| Microsoft Corp | 4.6 | |
| Taiwan Semiconductor Manufacturing Co Ltd | 2.7 | |
| Rheinmetall AG | 2.2 | |
| NXP Semiconductors NV | 2.0 | |
| JPMorgan Chase & Co | 1.7 | |
| Linde PLC | 1.5 | |
| Eli Lilly & Co | 1.4 | |
| UnitedHealth Group Inc | 1.4 | |
| AbbVie Inc | 1.4 | |
| | 24.3 | |
How has the Fund changed?
This is a summary of certain changes to the Fund since October 18, 2024. For more complete information, you may review the Fund's next prospectus, which we expect to be available by December 30, 2024 at fundresearch.fidelity.com/prospectus/sec or upon request at 1-877-208-0098 or by sending an e-mail to fidfunddocuments@fidelity.com.
Fidelity Advisor® Global Equity Income Fund merged into Fidelity® Global Equity Income Fund on October 25, 2024. | The fund changed its investment objective from non-fundamental to fundamental effective July 26, 2024.
|
The fund's sub-advisory agreement with FIL Investments (Japan) Limited was not renewed. | |
| Fidelity, the Fidelity Investments Logo and all other Fidelity trademarks or service marks used herein are trademarks or service marks of FMR LLC. Any third-party marks that are used herein are trademarks or service marks of their respective owners. © 2024 FMR LLC. All rights reserved. |
| | For additional information about the Fund; including its prospectus, financial information, holdings and proxy information, scan the QR code or visit fundresearch.fidelity.com/prospectus/sec 1.9918440.100 7768-TSRA-1224 |
| |
| | ANNUAL SHAREHOLDER REPORT | AS OF OCTOBER 31, 2024 | This report describes changes to the Fund that occurred during the reporting period. |
| | Fidelity® Canada Fund Fidelity Advisor® Canada Fund Class I : FICCX |
| | | |
This annual shareholder report contains information about Fidelity® Canada Fund for the period November 1, 2023 to October 31, 2024. You can find additional information about the Fund at fundresearch.fidelity.com/prospectus/sec. You can also request this information by contacting us at 1-877-208-0098 or by sending an e-mail to fidfunddocuments@fidelity.com.
What were your Fund costs for the last year?(based on hypothetical $10,000 investment)
FUND COST (PREVIOUS YEAR)
| | Costs of a $10,000 investment | Costs paid as a percentage of a $10,000 investment | |
| Class I | $ 118 | 1.04% | |
What affected the Fund's performance this period?
•International stocks achieved a strong gain for the 12 months ending October 31, 2024. Resilient global economic growth and a slowing in the pace of inflation in certain regions, as well as a shift to global monetary easing, contributed to a favorable backdrop, despite persistent geopolitical risk.
•Against this backdrop, stock picking in Canada's materials sector, and stock selection and an underweight in financials, primarily within the banking industry, detracted most from the fund's performance versus the S&P/TSX Composite Index for the fiscal year.
•The largest individual relative detractor was an overweight in Alimentation Couche-Tard (-3%). The stock was among the fund's largest holdings. Not owning Canadian Imperial Bank of Commerce, a benchmark component that gained 87%, was the second-largest relative detractor. An overweight in Canadian Pacific Kansas City Limited (+9%) - another of the fund's largest holdings - also hurt.
•By sector, the biggest contributors to performance versus the benchmark were picks and an overweight in information technology, primarily within the software & services industry. Stock choices in consumer discretionary and communication services also boosted the fund's relative performance.
•The top individual relative contributor this period was avoiding BCE, a benchmark component that returned about -6%. Not owning Cenovus Energy, a benchmark component that returned -13%, was the second-largest relative contributor. An overweight in Brookfield Asset Management (+91%) also helped.
•By sector, meaningful changes in positioning include increased exposure to information technology.
How did the Fund perform over the past 10 years?
CUMULATIVE PERFORMANCE
October 31, 2014 through October 31, 2024.
Initial investment of $10,000.
Class I | $10,000 | $8,595 | $9,268 | $10,600 | $9,979 | $11,151 | $10,331 | $15,499 | $14,454 | $14,627 | $18,501 |
S&P/TSX Composite Index | $10,000 | $8,219 | $9,044 | $10,482 | $9,938 | $11,246 | $10,831 | $16,167 | $13,973 | $13,788 | $18,134 |
| | 2014 | 2015 | 2016 | 2017 | 2018 | 2019 | 2020 | 2021 | 2022 | 2023 | 2024 |
AVERAGE ANNUAL TOTAL RETURNS:| | 1 Year | 5 Year | 10 Year |
| Class I | 26.49% | 10.66% | 6.35% |
| S&P/TSX Composite Index | 31.52% | 10.03% | 6.13% |
Visit institutional.fidelity.com for more recent performance information. |
The Fund's past performance is not a good predictor of the Fund's future performance. The graph and table do not reflect the deduction of taxes that a shareholder would pay on fund distributions or redemption of fund shares. |
Key Fund Statistics(as of October 31, 2024)
KEY FACTS | | |
| Fund Size | $942,476,918 | |
| Number of Holdings | 63 | |
| Total Advisory Fee | $8,782,874 | |
| Portfolio Turnover | 8% | |
What did the Fund invest in?
(as of October 31, 2024)
MARKET SECTORS (% of Fund's net assets) | | |
| Financials | 27.5 | |
| Energy | 17.5 | |
| Industrials | 13.0 | |
| Information Technology | 11.1 | |
| Materials | 11.1 | |
| Consumer Staples | 8.6 | |
| Consumer Discretionary | 7.0 | |
| Communication Services | 2.8 | |
| Health Care | 0.7 | |
| |
| Common Stocks | 99.3 |
| Bonds | 0.2 |
| Preferred Stocks | 0.0 |
| Short-Term Investments and Net Other Assets (Liabilities) | 0.5 |
ASSET ALLOCATION (% of Fund's net assets) |
|
|
| Canada | 94.0 |
| United States | 2.7 |
| Brazil | 2.6 |
| Chile | 0.7 |
GEOGRAPHIC DIVERSIFICATION (% of Fund's net assets) |
|
| |
|
TOP HOLDINGS(% of Fund's net assets) | | |
| Royal Bank of Canada | 8.6 | |
| Canadian Pacific Kansas City Ltd | 5.7 | |
| Constellation Software Inc/Canada | 5.6 | |
| Alimentation Couche-Tard Inc | 4.9 | |
| Canadian Natural Resources Ltd | 4.8 | |
| PrairieSky Royalty Ltd | 4.0 | |
| Franco-Nevada Corp | 3.8 | |
| Suncor Energy Inc | 3.5 | |
| Dollarama Inc | 3.5 | |
| Shopify Inc Class A | 3.4 | |
| | 47.8 | |
How has the Fund changed?
This is a summary of certain changes to the Fund since November 1, 2023. For more complete information, you may review the Fund's next prospectus, which we expect to be available by December 30, 2024 at fundresearch.fidelity.com/prospectus/sec or upon request at 1-877-208-0098 or by sending an e-mail to fidfunddocuments@fidelity.com.
The fund's transfer agent and pricing & bookkeeping fees were changed to a fixed rate effective December 1, 2023, through February 29, 2024, in anticipation of the transition to a new management fee structure. Effective March 1, 2024, the fund's management contract was amended to incorporate administrative services previously covered under separate services agreements (transfer agent and pricing & bookkeeping). The amended contract incorporates a basic fee rate that may vary by class (subject to a performance adjustment). The Adviser or an affiliate pays certain expenses of managing and operating the fund out of each class's management fee. | |
| Fidelity, the Fidelity Investments Logo and all other Fidelity trademarks or service marks used herein are trademarks or service marks of FMR LLC. Any third-party marks that are used herein are trademarks or service marks of their respective owners. © 2024 FMR LLC. All rights reserved. |
| | For additional information about the Fund; including its prospectus, financial information, holdings and proxy information, scan the QR code or visit fundresearch.fidelity.com/prospectus/sec 1.9913847.100 1861-TSRA-1224 |
| |
| | ANNUAL SHAREHOLDER REPORT | AS OF OCTOBER 31, 2024 | This report describes changes to the Fund that occurred during the reporting period. |
| | Fidelity® Emerging Markets Fund Fidelity Advisor® Emerging Markets Fund Class M : FEQMX |
| | | |
This annual shareholder report contains information about Fidelity® Emerging Markets Fund for the period November 1, 2023 to October 31, 2024. You can find additional information about the Fund at fundresearch.fidelity.com/prospectus/sec. You can also request this information by contacting us at 1-877-208-0098 or by sending an e-mail to fidfunddocuments@fidelity.com.
What were your Fund costs for the last year?(based on hypothetical $10,000 investment)
FUND COST (PREVIOUS YEAR)
| | Costs of a $10,000 investment | Costs paid as a percentage of a $10,000 investment | |
| Class M | $ 156 | 1.39% | |
What affected the Fund's performance this period?
•International stocks achieved a strong gain for the 12 months ending October 31, 2024. Resilient global economic growth and a slowing in the pace of inflation in certain regions, as well as a shift to global monetary easing, contributed to a favorable backdrop, despite persistent geopolitical risk.
•Against this backdrop, a non-benchmark allocation to developed markets - especially the U.S. - and stock picks in Taiwan contributed to the fund's performance versus the MSCI Emerging Markets (Net MA) Index for the fiscal year.
•By sector, the biggest contributors to performance versus the benchmark were stock picking and an overweight in information technology, primarily within the semiconductors & semiconductor equipment industry. An underweight in materials also boosted the fund's relative performance. Also bolstering our relative result was stock picking in consumer discretionary.
•The fund's non-benchmark stake in Nvidia gained 223% and was the top individual relative contributor. This period we decreased our investment in Nvidia. The stock was among our largest holdings. A second notable relative contributor was our non-benchmark stake in International Games System (+242%). This period we decreased our investment in International Games System. An overweight in Taiwan Semiconductor Manufacturing (+99%) also helped. The stock was the fund's largest holding.
•In contrast, from a geographical standpoint, stock picks in India and South Korea detracted from the fund's relative result.
•By sector, the biggest detractor from performance versus the benchmark was stock picking in financials. Also hurting our result were picks and overweights in consumer staples and health care.
•The largest individual relative detractor was an underweight in Alibaba (+23%). The stock was not held at period end. The second-largest relative detractor was an overweight in Kweichow Moutai (-4%). The company was among the fund's largest holdings this period. Another notable relative detractor this period was avoiding Hon Hai Precision Industry, a benchmark component that gained approximately 128%.
•Notable changes in positioning include decreased exposure to India and Saudi Arabia, and a higher allocation to China and Taiwan. By sector, meaningful changes in positioning include decreased exposure to materials and a higher allocation to industrials.
How did the Fund perform over the life of Fund?
CUMULATIVE PERFORMANCE
May 11, 2021 through October 31, 2024.
Initial investment of $10,000 and the current sales charge was paid.
Class M | $9,650 | $9,772 | $6,039 | $6,938 |
MSCI Emerging Markets Index | $10,000 | $9,639 | $6,649 | $7,370 |
| | 2021 | 2022 | 2023 | 2024 |
AVERAGE ANNUAL TOTAL RETURNS:| | 1 Year | Life of Fund A |
| Class M (incl. 3.50% sales charge) | 20.99% | -3.93% |
| Class M (without 3.50% sales charge) | 25.37% | -2.94% |
| MSCI Emerging Markets Index | 25.33% | -2.26% |
A From May 11, 2021
Visit institutional.fidelity.com for more recent performance information. |
The Fund's past performance is not a good predictor of the Fund's future performance. The graph and table do not reflect the deduction of taxes that a shareholder would pay on fund distributions or redemption of fund shares. |
Key Fund Statistics(as of October 31, 2024)
KEY FACTS | | |
| Fund Size | $8,930,817,606 | |
| Number of Holdings | 86 | |
| Total Advisory Fee | $66,535,420 | |
| Portfolio Turnover | 46% | |
What did the Fund invest in?
(as of October 31, 2024)
MARKET SECTORS (% of Fund's net assets) | | |
| Information Technology | 28.4 | |
| Financials | 17.2 | |
| Consumer Discretionary | 12.9 | |
| Industrials | 9.5 | |
| Communication Services | 9.3 | |
| Energy | 6.2 | |
| Consumer Staples | 5.4 | |
| Health Care | 5.3 | |
| Materials | 2.0 | |
| Utilities | 1.7 | |
| Real Estate | 0.6 | |
| |
| Common Stocks | 98.3 |
| Bonds | 0.3 |
| Preferred Stocks | 0.2 |
| Short-Term Investments and Net Other Assets (Liabilities) | 1.2 |
ASSET ALLOCATION (% of Fund's net assets) |
|
|
| China | 24.6 |
| India | 18.4 |
| Taiwan | 16.2 |
| Brazil | 6.6 |
| Korea (South) | 6.4 |
| United States | 6.3 |
| Indonesia | 3.8 |
| Saudi Arabia | 3.0 |
| Mexico | 2.8 |
| Others | 11.9 |
GEOGRAPHIC DIVERSIFICATION (% of Fund's net assets) |
|
| |
|
TOP HOLDINGS(% of Fund's net assets) | | |
| Taiwan Semiconductor Manufacturing Co Ltd | 13.5 | |
| Tencent Holdings Ltd | 6.6 | |
| NVIDIA Corp | 4.0 | |
| Meituan B Shares | 3.1 | |
| PDD Holdings Inc Class A ADR | 3.1 | |
| Samsung Electronics Co Ltd | 3.0 | |
| Bank Central Asia Tbk PT | 2.9 | |
| HDFC Bank Ltd | 2.6 | |
| SK Hynix Inc | 2.2 | |
| JD.com Inc ADR | 2.1 | |
| | 43.1 | |
How has the Fund changed?
This is a summary of certain changes to the Fund since November 1, 2023. For more complete information, you may review the Fund's next prospectus, which we expect to be available by December 30, 2024 at fundresearch.fidelity.com/prospectus/sec or upon request at 1-877-208-0098 or by sending an e-mail to fidfunddocuments@fidelity.com.
Fidelity® Latin America Fund merged into Fidelity® Emerging Markets Fund on September 13, 2024. | The fees associated with this class changed during the reporting year.The variations in class fees are primarily the result of the following changes: - Management fee
- Operating expenses
- Expense reductions
The fund's transfer agent and pricing & bookkeeping fees were changed to a fixed rate effective December 1, 2023, through February 29, 2024, in anticipation of the transition to a new management fee structure. Effective March 1, 2024, the fund's management contract was amended to incorporate administrative services previously covered under separate services agreements (transfer agent and pricing & bookkeeping). The amended contract incorporates a management fee rate that may vary by class. The Adviser or an affiliate pays certain expenses of managing and operating the fund out of each class's management fee.
|
The fund's sub-advisory agreement with FIL Investments (Japan) Limited was not renewed. | |
| Fidelity, the Fidelity Investments Logo and all other Fidelity trademarks or service marks used herein are trademarks or service marks of FMR LLC. Any third-party marks that are used herein are trademarks or service marks of their respective owners. © 2024 FMR LLC. All rights reserved. |
| | For additional information about the Fund; including its prospectus, financial information, holdings and proxy information, scan the QR code or visit fundresearch.fidelity.com/prospectus/sec 1.9913862.100 6357-TSRA-1224 |
| |
| | ANNUAL SHAREHOLDER REPORT | AS OF OCTOBER 31, 2024 | This report describes changes to the Fund that occurred during the reporting period. |
| | Fidelity® International Small Cap Fund Fidelity Advisor® International Small Cap Fund Class A : FIASX |
| | | |
This annual shareholder report contains information about Fidelity® International Small Cap Fund for the period November 1, 2023 to October 31, 2024. You can find additional information about the Fund at fundresearch.fidelity.com/prospectus/sec. You can also request this information by contacting us at 1-877-208-0098 or by sending an e-mail to fidfunddocuments@fidelity.com.
What were your Fund costs for the last year?(based on hypothetical $10,000 investment)
FUND COST (PREVIOUS YEAR)
| | Costs of a $10,000 investment | Costs paid as a percentage of a $10,000 investment | |
| Class A | $ 144 | 1.32% | |
What affected the Fund's performance this period?
•International stocks achieved a strong gain for the 12 months ending October 31, 2024. Resilient global economic growth and a slowing in the pace of inflation in certain regions, as well as a shift to global monetary easing, contributed to a favorable backdrop, despite persistent geopolitical risk.
•Against this backdrop, an underweight in emerging markets, primarily in India, and picks in the U.K. and Brazil detracted from the fund's performance versus the Fidelity International Small Cap Fund Linked Index for the fiscal year.
•By sector, security selection in financials was the largest detractor. However, picks in industrials, health care and consumer discretionary also meaningfully weighed on the fund's relative result.
•The largest individual relative detractor was our non-benchmark stake in Hypera Pharma (-35%). A non-benchmark stake in Mayr-Melnhof Karton returned roughly -24% and was the second-largest relative detractor. An overweight in Stabilus (-36%) also hurt.
•In contrast, from a regional standpoint, picks in emerging markets, primarily in Taiwan and China, contributed to the fund's relative result. In Europe ex U.K., investment choices in Germany proved rewarding.
•By sector, the biggest contributor to performance versus the benchmark was stock selection in communication services, primarily within the media & entertainment industry. Security selection in information technology, primarily within the technology hardware & equipment industry, also boosted the fund's relative performance.
•The top individual relative contributor was an overweight in International Games System (+238%). This period we decreased our position in International Games System. The company was among our biggest holdings. The second-largest relative contributor was our non-benchmark stake in Rheinmetall (+81%). The company was the fund's biggest holding. Another notable relative contributor was an overweight in Test Research (+131%).
•Notable changes in positioning include decreased exposure to Germany and a higher allocation to Japan and Taiwan. By sector, meaningful changes in positioning include increased exposure to communication services and a lower allocation to consumer discretionary.
How did the Fund perform over the past 10 years?
CUMULATIVE PERFORMANCE
October 31, 2014 through October 31, 2024.
Initial investment of $10,000 and the current sales charge was paid.
Class A | $9,425 | $10,010 | $10,922 | $13,743 | $12,530 | $13,532 | $13,003 | $18,130 | $13,562 | $15,308 | $18,153 |
MSCI ACWI (All Country World Index) ex USA Small Cap Index | $10,000 | $10,162 | $10,602 | $13,236 | $11,963 | $13,030 | $13,055 | $18,144 | $13,127 | $14,305 | $17,725 |
| | 2014 | 2015 | 2016 | 2017 | 2018 | 2019 | 2020 | 2021 | 2022 | 2023 | 2024 |
AVERAGE ANNUAL TOTAL RETURNS:| | 1 Year | 5 Year | 10 Year |
| Class A (incl. 5.75% sales charge) | 11.77% | 4.80% | 6.14% |
| Class A (without 5.75% sales charge) | 18.59% | 6.05% | 6.77% |
| MSCI ACWI (All Country World Index) ex USA Small Cap Index | 23.90% | 6.35% | 5.89% |
Visit institutional.fidelity.com for more recent performance information. |
The Fund's past performance is not a good predictor of the Fund's future performance. The graph and table do not reflect the deduction of taxes that a shareholder would pay on fund distributions or redemption of fund shares. |
Key Fund Statistics(as of October 31, 2024)
KEY FACTS | | |
| Fund Size | $4,778,290,407 | |
| Number of Holdings | 197 | |
| Total Advisory Fee | $43,346,727 | |
| Portfolio Turnover | 17% | |
What did the Fund invest in?
(as of October 31, 2024)
MARKET SECTORS (% of Fund's net assets) | | |
| Industrials | 22.4 | |
| Financials | 13.2 | |
| Consumer Discretionary | 11.0 | |
| Consumer Staples | 10.4 | |
| Information Technology | 9.4 | |
| Materials | 8.2 | |
| Real Estate | 5.9 | |
| Health Care | 5.4 | |
| Communication Services | 4.8 | |
| Energy | 3.7 | |
| Utilities | 1.5 | |
| |
| Common Stocks | 95.9 |
| Short-Term Investments and Net Other Assets (Liabilities) | 4.1 |
ASSET ALLOCATION (% of Fund's net assets) |
|
|
| Japan | 21.9 |
| United Kingdom | 15.5 |
| United States | 6.8 |
| Canada | 4.2 |
| Taiwan | 4.0 |
| Australia | 3.3 |
| Spain | 3.1 |
| China | 3.1 |
| Mexico | 3.1 |
| Others | 35.0 |
GEOGRAPHIC DIVERSIFICATION (% of Fund's net assets) |
|
| |
|
TOP HOLDINGS(% of Fund's net assets) | | |
| Rheinmetall AG | 1.3 | |
| Premier Foods PLC | 1.2 | |
| Century Pacific Food Inc | 1.1 | |
| Logista Integral SA | 1.0 | |
| North West Co Inc/The | 1.0 | |
| Ashtead Technology Holdings plc | 1.0 | |
| Shriram Finance Ltd | 0.9 | |
| RHI Magnesita NV | 0.9 | |
| BayCurrent Inc | 0.9 | |
| Richter Gedeon Nyrt | 0.9 | |
| | 10.2 | |
How has the Fund changed?
This is a summary of certain changes to the Fund since November 1, 2023. For more complete information, you may review the Fund's next prospectus, which we expect to be available by December 30, 2024 at fundresearch.fidelity.com/prospectus/sec or upon request at 1-877-208-0098 or by sending an e-mail to fidfunddocuments@fidelity.com.
The fees associated with this class changed during the reporting year.The variations in class fees are primarily the result of the following changes: - Management fee
- Operating expenses
- Performance adjustment fee
The fund's transfer agent and pricing & bookkeeping fees were changed to a fixed rate effective December 1, 2023, through February 29, 2024, in anticipation of the transition to a new management fee structure. Effective March 1, 2024, the fund's management contract was amended to incorporate administrative services previously covered under separate services agreements (transfer agent and pricing & bookkeeping). The amended contract incorporates a basic fee rate that may vary by class (subject to a performance adjustment). The Adviser or an affiliate pays certain expenses of managing and operating the fund out of each class's management fee. | The fund's sub-advisory agreement with FIL Investments (Japan) Limited was not renewed.
|
| Fidelity, the Fidelity Investments Logo and all other Fidelity trademarks or service marks used herein are trademarks or service marks of FMR LLC. Any third-party marks that are used herein are trademarks or service marks of their respective owners. © 2024 FMR LLC. All rights reserved. |
| | For additional information about the Fund; including its prospectus, financial information, holdings and proxy information, scan the QR code or visit fundresearch.fidelity.com/prospectus/sec 1.9913910.100 1258-TSRA-1224 |
| |
| | ANNUAL SHAREHOLDER REPORT | AS OF OCTOBER 31, 2024 | This report describes changes to the Fund that occurred during the reporting period. |
| | Fidelity® Worldwide Fund Fidelity Advisor® Worldwide Fund Class I : FWIFX |
| | | |
This annual shareholder report contains information about Fidelity® Worldwide Fund for the period November 1, 2023 to October 31, 2024. You can find additional information about the Fund at fundresearch.fidelity.com/prospectus/sec. You can also request this information by contacting us at 1-877-208-0098 or by sending an e-mail to fidfunddocuments@fidelity.com.
What were your Fund costs for the last year?(based on hypothetical $10,000 investment)
FUND COST (PREVIOUS YEAR)
| | Costs of a $10,000 investment | Costs paid as a percentage of a $10,000 investment | |
| Class I | $ 88 | 0.72% | |
What affected the Fund's performance this period?
•Global equities posted a strong advance for the 12 months ending October 31, 2024. Resilient economic growth and a slowing in the pace of inflation in certain regions, as well as a shift to global monetary easing, contributed to a favorable backdrop, despite persistent geopolitical risk.
•Against this backdrop, by region, security selection in the United States was the primary contributor to the fund's performance versus the MSCI World Index for the fiscal year.
•By sector, security selection was the primary contributor, especially within consumer discretionary. Stock picking in information technology, primarily within the semiconductors & semiconductor equipment industry, and industrials, primarily within the capital goods industry, also boosted the fund's relative performance.
•The top individual relative contributor was an overweight in Nvidia (+219%). We decreased our position in Nvidia during the period, but the company was the fund's largest holding at period end. The second-largest relative contributor was an overweight in Constellation Energy (+138%). This period we increased our investment in the stock. An overweight in Meta Platforms (+89%), which was one of the fund's largest holdings, also helped.
•In contrast, from a regional standpoint, an overweight in emerging markets, and stock selection and an overweight in the U.K., detracted from the fund's relative result.
•By sector, the biggest detractors from performance versus the benchmark were stock picking and an underweight in financials. Also modestly hurting our result were overweights in consumer discretionary, primarily within the consumer durables & apparel industry, and information technology.
•The biggest individual relative detractor was a stake in Jabil (-8%). The stock was not held at period end. The second-largest relative detractor was an overweight in Coinbase Global (-25%). This was a position we established this period. An overweight in Oracle (+8%) also hurt. We notably decreased our stake in Oracle by period end.
•Notable changes in positioning by region include a lower allocation to Japan. By sector, meaningful changes in positioning include decreased exposure to energy and a higher allocation to consumer discretionary.
How did the Fund perform over the past 10 years?
CUMULATIVE PERFORMANCE
October 31, 2014 through October 31, 2024.
Initial investment of $10,000.
Class I | $10,000 | $10,300 | $10,212 | $12,913 | $13,458 | $15,166 | $18,363 | $25,352 | $18,474 | $20,501 | $29,409 |
MSCI World Index | $10,000 | $10,220 | $10,390 | $12,813 | $13,016 | $14,736 | $15,446 | $21,766 | $17,811 | $19,758 | $26,510 |
| | 2014 | 2015 | 2016 | 2017 | 2018 | 2019 | 2020 | 2021 | 2022 | 2023 | 2024 |
AVERAGE ANNUAL TOTAL RETURNS:| | 1 Year | 5 Year | 10 Year |
| Class I | 43.45% | 14.16% | 11.39% |
| MSCI World Index | 34.17% | 12.46% | 10.24% |
Visit institutional.fidelity.com for more recent performance information. |
The Fund's past performance is not a good predictor of the Fund's future performance. The graph and table do not reflect the deduction of taxes that a shareholder would pay on fund distributions or redemption of fund shares. |
Key Fund Statistics(as of October 31, 2024)
KEY FACTS | | |
| Fund Size | $3,143,670,063 | |
| Number of Holdings | 189 | |
| Total Advisory Fee | $19,608,125 | |
| Portfolio Turnover | 108% | |
What did the Fund invest in?
(as of October 31, 2024)
MARKET SECTORS (% of Fund's net assets) | | |
| Information Technology | 21.6 | |
| Consumer Discretionary | 16.6 | |
| Industrials | 16.3 | |
| Financials | 14.4 | |
| Communication Services | 10.4 | |
| Health Care | 8.5 | |
| Energy | 3.1 | |
| Utilities | 2.4 | |
| Real Estate | 2.2 | |
| Consumer Staples | 2.0 | |
| Materials | 1.9 | |
| |
| Common Stocks | 99.2 |
| Preferred Stocks | 0.2 |
| Short-Term Investments and Net Other Assets (Liabilities) | 0.6 |
ASSET ALLOCATION (% of Fund's net assets) |
|
|
| United States | 69.1 |
| United Kingdom | 4.6 |
| Canada | 4.0 |
| Sweden | 3.3 |
| Japan | 3.3 |
| Italy | 1.8 |
| Australia | 1.6 |
| Denmark | 1.5 |
| Belgium | 1.3 |
| Others | 9.5 |
GEOGRAPHIC DIVERSIFICATION (% of Fund's net assets) |
|
| |
|
TOP HOLDINGS(% of Fund's net assets) | | |
| NVIDIA Corp | 5.6 | |
| Meta Platforms Inc Class A | 4.7 | |
| Microsoft Corp | 4.1 | |
| Apple Inc | 3.8 | |
| Modine Manufacturing Co | 3.1 | |
| Eli Lilly & Co | 3.1 | |
| Amazon.com Inc | 2.7 | |
| Fiserv Inc | 2.5 | |
| Alphabet Inc Class A | 2.4 | |
| Deckers Outdoor Corp | 2.4 | |
| | 34.4 | |
How has the Fund changed?
This is a summary of certain changes to the Fund since November 1, 2023. For more complete information, you may review the Fund's next prospectus, which we expect to be available by December 30, 2024 at fundresearch.fidelity.com/prospectus/sec or upon request at 1-877-208-0098 or by sending an e-mail to fidfunddocuments@fidelity.com.
The fees associated with this class changed during the reporting year.The variations in class fees are primarily the result of the following changes: - Management fee
- Operating expenses
- Performance adjustment fee
The fund's transfer agent and pricing & bookkeeping fees were changed to a fixed rate effective December 1, 2023, through February 29, 2024, in anticipation of the transition to a new management fee structure. Effective March 1, 2024, the fund's management contract was amended to incorporate administrative services previously covered under separate services agreements (transfer agent and pricing & bookkeeping). The amended contract incorporates a basic fee rate that may vary by class (subject to a performance adjustment). The Adviser or an affiliate pays certain expenses of managing and operating the fund out of each class's management fee. | The fund's sub-advisory agreement with FIL Investments (Japan) Limited was not renewed.
|
| Fidelity, the Fidelity Investments Logo and all other Fidelity trademarks or service marks used herein are trademarks or service marks of FMR LLC. Any third-party marks that are used herein are trademarks or service marks of their respective owners. © 2024 FMR LLC. All rights reserved. |
| | For additional information about the Fund; including its prospectus, financial information, holdings and proxy information, scan the QR code or visit fundresearch.fidelity.com/prospectus/sec 1.9913855.100 2147-TSRA-1224 |
| |
| | ANNUAL SHAREHOLDER REPORT | AS OF OCTOBER 31, 2024 | This report describes changes to the Fund that occurred during the reporting period. |
| | Fidelity® International Discovery Fund Fidelity® International Discovery Fund : FIGRX |
| | | |
This annual shareholder report contains information about Fidelity® International Discovery Fund for the period November 1, 2023 to October 31, 2024. You can find additional information about the Fund at fundresearch.fidelity.com/prospectus/sec. You can also request this information by contacting us at 1-800-544-8544 or by sending an e-mail to fidfunddocuments@fidelity.com.
What were your Fund costs for the last year?(based on hypothetical $10,000 investment)
FUND COST (PREVIOUS YEAR)
| | Costs of a $10,000 investment | Costs paid as a percentage of a $10,000 investment | |
| Fidelity® International Discovery Fund | $ 66 | 0.58% | |
What affected the Fund's performance this period?
•International stocks achieved a strong gain for the 12 months ending October 31, 2024. Resilient global economic growth and a slowing in the pace of inflation in certain regions, as well as a shift to global monetary easing, contributed to a favorable backdrop, despite persistent geopolitical risk.
•Against this backdrop, picks in Europe ex U.K. and Japan contributed to the fund's performance versus the MSCI EAFE Index (Net MA) for the fiscal year.
•By sector, the biggest contributor to performance versus the benchmark was stock picking in industrials, primarily within the capital goods industry. Stock picking and an overweight in information technology, primarily within the semiconductors & semiconductor equipment industry, also boosted the fund's relative performance, as did stock picking in consumer discretionary.
•The top individual relative contributor was our non-benchmark stake in Nvidia (+121%). This period we decreased our investment in Nvidia. A second notable relative contributor was our non-benchmark stake in Taiwan Semiconductor (+96%). The company was one of our largest holdings. Another notable relative contributor was an overweight in Hitachi (+109%), the fund's biggest holding at period end.
•In contrast, from a regional standpoint, a non-benchmark allocation to Canada and an underweight in Asia Pacific ex Japan detracted from the fund's relative result.
•By sector, the biggest detractor from performance versus the benchmark was stock selection in consumer staples. Security selection in financials also hampered the fund's result. Also hurting our result were stock picks and an underweight in communication services, primarily within the media & entertainment industry. Lastly, the fund's position in cash detracted.
•The fund's non-benchmark stake in PDD returned -47% and was the largest individual relative detractor. This was a position we established this period. A second notable relative detractor was an overweight in L'Oréal (-9%), which was among the fund's biggest holdings this period. A non-benchmark stake in One97 Communications returned about -29% and notably hurt. The stock was not held at period end.
•Notable changes in positioning include increased exposure to Germany and a lower allocation to India. By sector, meaningful changes in positioning include increased exposure to industrials and a lower allocation to consumer staples.
How did the Fund perform over the past 10 years?
CUMULATIVE PERFORMANCE
October 31, 2014 through October 31, 2024.
Initial investment of $10,000.
Fidelity® International Discovery Fund | $10,000 | $10,347 | $9,878 | $12,480 | $11,256 | $12,641 | $13,702 | $18,264 | $12,719 | $13,615 | $17,633 |
MSCI EAFE Index | $10,000 | $10,008 | $9,705 | $12,004 | $11,206 | $12,472 | $11,638 | $15,647 | $12,073 | $13,841 | $17,059 |
| | 2014 | 2015 | 2016 | 2017 | 2018 | 2019 | 2020 | 2021 | 2022 | 2023 | 2024 |
AVERAGE ANNUAL TOTAL RETURNS:| | 1 Year | 5 Year | 10 Year |
| Fidelity® International Discovery Fund | 29.52% | 6.88% | 5.84% |
| MSCI EAFE Index | 23.25% | 6.46% | 5.49% |
Visit www.fidelity.com for more recent performance information. |
The Fund's past performance is not a good predictor of the Fund's future performance. The graph and table do not reflect the deduction of taxes that a shareholder would pay on fund distributions or redemption of fund shares. |
Key Fund Statistics(as of October 31, 2024)
KEY FACTS | | |
| Fund Size | $9,841,033,775 | |
| Number of Holdings | 142 | |
| Total Advisory Fee | $45,667,963 | |
| Portfolio Turnover | 44% | |
What did the Fund invest in?
(as of October 31, 2024)
MARKET SECTORS (% of Fund's net assets) | | |
| Financials | 22.3 | |
| Industrials | 22.0 | |
| Consumer Discretionary | 14.1 | |
| Information Technology | 11.8 | |
| Health Care | 9.8 | |
| Materials | 5.4 | |
| Consumer Staples | 4.1 | |
| Communication Services | 3.3 | |
| Energy | 3.1 | |
| Real Estate | 1.0 | |
| |
| Common Stocks | 96.2 |
| Preferred Stocks | 0.7 |
| Short-Term Investments and Net Other Assets (Liabilities) | 3.1 |
ASSET ALLOCATION (% of Fund's net assets) |
|
|
| Japan | 17.6 |
| United Kingdom | 15.3 |
| France | 9.1 |
| United States | 8.5 |
| Germany | 7.0 |
| Netherlands | 6.0 |
| Italy | 5.0 |
| Canada | 4.6 |
| Sweden | 3.6 |
| Others | 23.3 |
GEOGRAPHIC DIVERSIFICATION (% of Fund's net assets) |
|
| |
|
TOP HOLDINGS(% of Fund's net assets) | | |
| Hitachi Ltd | 3.1 | |
| UniCredit SpA | 2.7 | |
| Novo Nordisk A/S Series B | 2.7 | |
| ASML Holding NV | 2.1 | |
| Taiwan Semiconductor Manufacturing Co Ltd | 2.0 | |
| Constellation Software Inc/Canada | 2.0 | |
| Unilever PLC | 2.0 | |
| Compass Group PLC | 1.7 | |
| UCB SA | 1.7 | |
| ITOCHU Corp | 1.6 | |
| | 21.6 | |
How has the Fund changed?
This is a summary of certain changes to the Fund since November 1, 2023. For more complete information, you may review the Fund's next prospectus, which we expect to be available by December 30, 2024 at fundresearch.fidelity.com/prospectus/sec or upon request at 1-800-544-8544 or by sending an e-mail to fidfunddocuments@fidelity.com.
The fees associated with this class changed during the reporting year.The variations in class fees are primarily the result of the following changes: - Management fee
- Performance adjustment fee
The fund's transfer agent and pricing & bookkeeping fees were changed to a fixed rate effective December 1, 2023, through February 29, 2024, in anticipation of the transition to a new management fee structure. Effective March 1, 2024, the fund's management contract was amended to incorporate administrative services previously covered under separate services agreements (transfer agent and pricing & bookkeeping). The amended contract incorporates a basic fee rate that may vary by class (subject to a performance adjustment). The Adviser or an affiliate pays certain expenses of managing and operating the fund out of each class's management fee. | The fund's sub-advisory agreement with FIL Investments (Japan) Limited was not renewed.
|
| Fidelity, the Fidelity Investments Logo and all other Fidelity trademarks or service marks used herein are trademarks or service marks of FMR LLC. Any third-party marks that are used herein are trademarks or service marks of their respective owners. © 2024 FMR LLC. All rights reserved. |
| | For additional information about the Fund; including its prospectus, financial information, holdings and proxy information, scan the QR code or visit fundresearch.fidelity.com/prospectus/sec 1.9913841.100 305-TSRA-1224 |
| |
| | ANNUAL SHAREHOLDER REPORT | AS OF OCTOBER 31, 2024 | This report describes changes to the Fund that occurred during the reporting period. |
| | Fidelity® Global Equity Income Fund Fidelity Advisor® Global Equity Income Fund Class I : FGEJX |
| | | |
This annual shareholder report contains information about Fidelity® Global Equity Income Fund for the period October 18, 2024 to October 31, 2024. You can find additional information about the Fund at fundresearch.fidelity.com/prospectus/sec. You can also request this information by contacting us at 1-877-208-0098 or by sending an e-mail to fidfunddocuments@fidelity.com.
What were your Fund costs for the last year?(based on hypothetical $10,000 investment)
FUND COST (PREVIOUS YEAR)
| | Costs of a $10,000 investment | Costs paid as a percentage of a $10,000 investment | |
Class I A | $ 3 | 0.80% | |
AExpenses for the full reporting period would be higher.
What affected the Fund's performance this period?
•Global equities posted a strong advance for the 12 months ending October 31, 2024. Resilient economic growth and a slowing in the pace of inflation in certain regions, as well as a shift to global monetary easing, contributed to a favorable backdrop, despite persistent geopolitical risk.
•Against this backdrop, stock picking in the United States and picks and an overweight in the U.K. detracted from the fund's performance versus the MSCI All Country World Index (Net MA) for the fiscal year.
•By sector, the biggest detractor from performance versus the benchmark was stock selection in information technology. Also hurting our result was stock selection in consumer discretionary and communication services, primarily within the media & entertainment industry. Lastly, the fund's position in cash detracted.
•The biggest individual relative detractor this period was avoiding Nvidia, a benchmark component that gained about 226%. Not owning Meta Platforms, a benchmark component that gained 89%, was the second-largest relative detractor. An overweight in Dollar Tree (-41%) also hurt.
•In contrast, from a regional standpoint, an underweight in emerging markets and picks in Europe ex U.K., primarily in Germany, contributed to the fund's relative result.
•By sector, the biggest contributor to performance versus the benchmark was security selection in industrials, primarily within the capital goods industry. Stock picks in utilities and health care, primarily within the pharmaceuticals, biotechnology & life sciences industry, also boosted the fund's relative result.
•The top individual relative contributor was an overweight in Vistra (+290%). The second-largest relative contributor was an overweight in Taiwan Semiconductor (+97%), which was among the largest holdings. Another notable relative contributor was an overweight in Rheinmetall (+82%), also among the biggest holdings.
•Notable changes in positioning include a lower allocation to France. By sector, meaningful changes in positioning include increased exposure to industrials and a lower allocation to consumer staples.
Key Fund Statistics(as of October 31, 2024)
KEY FACTS | | |
| Fund Size | $257,697,453 | |
| Number of Holdings | 153 | |
| Total Advisory Fee | $1,240,182 | |
| Portfolio Turnover | 29% | |
What did the Fund invest in?
(as of October 31, 2024)
MARKET SECTORS (% of Fund's net assets) | | |
| Information Technology | 20.5 | |
| Financials | 13.5 | |
| Industrials | 12.1 | |
| Health Care | 11.8 | |
| Consumer Discretionary | 9.4 | |
| Consumer Staples | 8.8 | |
| Communication Services | 6.2 | |
| Energy | 4.8 | |
| Utilities | 4.6 | |
| Materials | 4.3 | |
| Real Estate | 1.1 | |
| |
| Common Stocks | 97.1 |
| Short-Term Investments and Net Other Assets (Liabilities) | 2.9 |
ASSET ALLOCATION (% of Fund's net assets) |
|
|
| United States | 63.6 |
| United Kingdom | 7.4 |
| Japan | 5.5 |
| Canada | 5.2 |
| Germany | 3.8 |
| Taiwan | 2.7 |
| France | 2.6 |
| China | 2.0 |
| Italy | 1.2 |
| Others | 6.0 |
GEOGRAPHIC DIVERSIFICATION (% of Fund's net assets) |
|
| |
|
TOP HOLDINGS(% of Fund's net assets) | | |
| Apple Inc | 5.4 | |
| Microsoft Corp | 4.6 | |
| Taiwan Semiconductor Manufacturing Co Ltd | 2.7 | |
| Rheinmetall AG | 2.2 | |
| NXP Semiconductors NV | 2.0 | |
| JPMorgan Chase & Co | 1.7 | |
| Linde PLC | 1.5 | |
| Eli Lilly & Co | 1.4 | |
| UnitedHealth Group Inc | 1.4 | |
| AbbVie Inc | 1.4 | |
| | 24.3 | |
How has the Fund changed?
This is a summary of certain changes to the Fund since October 18, 2024. For more complete information, you may review the Fund's next prospectus, which we expect to be available by December 30, 2024 at fundresearch.fidelity.com/prospectus/sec or upon request at 1-877-208-0098 or by sending an e-mail to fidfunddocuments@fidelity.com.
Fidelity Advisor® Global Equity Income Fund merged into Fidelity® Global Equity Income Fund on October 25, 2024. | The fund changed its investment objective from non-fundamental to fundamental effective July 26, 2024.
|
The fund's sub-advisory agreement with FIL Investments (Japan) Limited was not renewed. | |
| Fidelity, the Fidelity Investments Logo and all other Fidelity trademarks or service marks used herein are trademarks or service marks of FMR LLC. Any third-party marks that are used herein are trademarks or service marks of their respective owners. © 2024 FMR LLC. All rights reserved. |
| | For additional information about the Fund; including its prospectus, financial information, holdings and proxy information, scan the QR code or visit fundresearch.fidelity.com/prospectus/sec 1.9918444.100 7769-TSRA-1224 |
| |
| | ANNUAL SHAREHOLDER REPORT | AS OF OCTOBER 31, 2024 | This report describes changes to the Fund that occurred during the reporting period. |
| | Fidelity® International Growth Fund Fidelity Advisor® International Growth Fund Class A : FIAGX |
| | | |
This annual shareholder report contains information about Fidelity® International Growth Fund for the period November 1, 2023 to October 31, 2024. You can find additional information about the Fund at fundresearch.fidelity.com/prospectus/sec. You can also request this information by contacting us at 1-877-208-0098 or by sending an e-mail to fidfunddocuments@fidelity.com.
What were your Fund costs for the last year?(based on hypothetical $10,000 investment)
FUND COST (PREVIOUS YEAR)
| | Costs of a $10,000 investment | Costs paid as a percentage of a $10,000 investment | |
| Class A | $ 133 | 1.18% | |
What affected the Fund's performance this period?
•International stocks achieved a strong gain for the 12 months ending October 31, 2024. Resilient global economic growth and a slowing in the pace of inflation in certain regions, as well as a shift to global monetary easing, contributed to a favorable backdrop, despite persistent geopolitical risk.
•Against this backdrop, stock picks and an overweight in the United States and security selection in the U.K. contributed to the fund's performance versus the MSCI EAFE Growth Index (Net MA) for the fiscal year.
•By sector, an underweight in consumer staples was the primary contributor. Stock selection in materials also boosted the fund's relative performance. Also helping our relative result was an overweight in industrials, primarily within the capital goods industry.
•The fund's non-benchmark stake in Taiwan Semiconductor gained 99% and was the top individual relative contributor. The stock was among our largest holdings. A second notable relative contributor was an overweight in CRH (+83%). The stock was among the fund's biggest holdings. Another notable relative contributor was our non-benchmark stake in GE Vernova (+100%). This was a position we established this period.
•In contrast, from a regional standpoint, an underweight in Asia Pacific ex Japan and a non-benchmark allocation to Canada detracted from the fund's relative result.
•By sector, the biggest detractor from performance versus the benchmark was stock picking in financials. Also hurting our result was security selection in industrials, primarily within the capital goods industry, and energy. Lastly, the fund's position in cash detracted.
•The biggest individual relative detractor was an overweight in Edenred (-38%). Not owning Schneider Electric, a benchmark component that gained approximately 71%, was the second-largest relative detractor. Not owning Commonwealth Bank of Australia, a benchmark component that gained roughly 59%, was another notable relative detractor.
•Notable changes in positioning include increased exposure to Germany and the United Kingdom. By sector, meaningful changes in positioning include decreased exposure to consumer staples and health care.
How did the Fund perform over the past 10 years?
CUMULATIVE PERFORMANCE
October 31, 2014 through October 31, 2024.
Initial investment of $10,000 and the current sales charge was paid.
Class A | $9,425 | $9,727 | $9,413 | $11,654 | $10,940 | $13,265 | $14,280 | $18,708 | $13,470 | $14,853 | $18,577 |
MSCI EAFE Growth Index | $10,000 | $10,428 | $10,108 | $12,517 | $11,783 | $13,766 | $14,502 | $18,876 | $13,312 | $14,769 | $18,234 |
MSCI EAFE Index | $10,000 | $10,008 | $9,705 | $12,004 | $11,206 | $12,472 | $11,638 | $15,647 | $12,073 | $13,841 | $17,059 |
| | 2014 | 2015 | 2016 | 2017 | 2018 | 2019 | 2020 | 2021 | 2022 | 2023 | 2024 |
AVERAGE ANNUAL TOTAL RETURNS:| | 1 Year | 5 Year | 10 Year |
| Class A (incl. 5.75% sales charge) | 17.89% | 5.71% | 6.39% |
| Class A (without 5.75% sales charge) | 25.08% | 6.97% | 7.02% |
| MSCI EAFE Growth Index | 23.46% | 5.78% | 6.19% |
| MSCI EAFE Index | 23.25% | 6.46% | 5.49% |
Visit institutional.fidelity.com for more recent performance information. |
The Fund's past performance is not a good predictor of the Fund's future performance. The graph and table do not reflect the deduction of taxes that a shareholder would pay on fund distributions or redemption of fund shares. |
Key Fund Statistics(as of October 31, 2024)
KEY FACTS | | |
| Fund Size | $6,046,615,302 | |
| Number of Holdings | 73 | |
| Total Advisory Fee | $43,926,728 | |
| Portfolio Turnover | 31% | |
What did the Fund invest in?
(as of October 31, 2024)
MARKET SECTORS (% of Fund's net assets) | | |
| Industrials | 31.9 | |
| Information Technology | 19.7 | |
| Financials | 16.0 | |
| Materials | 10.7 | |
| Consumer Discretionary | 10.3 | |
| Health Care | 6.1 | |
| Consumer Staples | 1.1 | |
| Energy | 0.7 | |
| Communication Services | 0.5 | |
| |
| Common Stocks | 96.7 |
| Preferred Stocks | 0.3 |
| Short-Term Investments and Net Other Assets (Liabilities) | 3.0 |
ASSET ALLOCATION (% of Fund's net assets) |
|
|
| United States | 29.1 |
| United Kingdom | 11.7 |
| France | 11.2 |
| Japan | 9.6 |
| Sweden | 7.5 |
| Germany | 6.6 |
| Netherlands | 6.1 |
| Denmark | 5.1 |
| Taiwan | 3.3 |
| Others | 9.8 |
GEOGRAPHIC DIVERSIFICATION (% of Fund's net assets) |
|
| |
|
TOP HOLDINGS(% of Fund's net assets) | | |
| SAP SE | 5.3 | |
| Novo Nordisk A/S Series B | 5.1 | |
| ASML Holding NV | 4.8 | |
| Safran SA | 4.0 | |
| CRH PLC | 3.9 | |
| Linde PLC | 3.8 | |
| Atlas Copco AB A Shares | 3.4 | |
| Taiwan Semiconductor Manufacturing Co Ltd | 3.3 | |
| Recruit Holdings Co Ltd | 3.0 | |
| LVMH Moet Hennessy Louis Vuitton SE | 2.7 | |
| | 39.3 | |
How has the Fund changed?
This is a summary of certain changes to the Fund since November 1, 2023. For more complete information, you may review the Fund's next prospectus, which we expect to be available by December 30, 2024 at fundresearch.fidelity.com/prospectus/sec or upon request at 1-877-208-0098 or by sending an e-mail to fidfunddocuments@fidelity.com.
The fund's transfer agent and pricing & bookkeeping fees were changed to a fixed rate effective December 1, 2023, through February 29, 2024, in anticipation of the transition to a new management fee structure. Effective March 1, 2024, the fund's management contract was amended to incorporate administrative services previously covered under separate services agreements (transfer agent and pricing & bookkeeping). The amended contract incorporates a basic fee rate that may vary by class (subject to a performance adjustment). The Adviser or an affiliate pays certain expenses of managing and operating the fund out of each class's management fee. | The fund's sub-advisory agreement with FIL Investments (Japan) Limited was not renewed.
|
| Fidelity, the Fidelity Investments Logo and all other Fidelity trademarks or service marks used herein are trademarks or service marks of FMR LLC. Any third-party marks that are used herein are trademarks or service marks of their respective owners. © 2024 FMR LLC. All rights reserved. |
| | For additional information about the Fund; including its prospectus, financial information, holdings and proxy information, scan the QR code or visit fundresearch.fidelity.com/prospectus/sec 1.9913949.100 1985-TSRA-1224 |
| |
| | ANNUAL SHAREHOLDER REPORT | AS OF OCTOBER 31, 2024 | This report describes changes to the Fund that occurred during the reporting period. |
| | Fidelity® International Value Fund Fidelity Advisor® International Value Fund Class Z : FIQKX |
| | | |
This annual shareholder report contains information about Fidelity® International Value Fund for the period November 1, 2023 to October 31, 2024. You can find additional information about the Fund at fundresearch.fidelity.com/prospectus/sec. You can also request this information by contacting us at 1-877-208-0098 or by sending an e-mail to fidfunddocuments@fidelity.com.
What were your Fund costs for the last year?(based on hypothetical $10,000 investment)
FUND COST (PREVIOUS YEAR)
| | Costs of a $10,000 investment | Costs paid as a percentage of a $10,000 investment | |
| Class Z | $ 88 | 0.79% | |
What affected the Fund's performance this period?
•International stocks achieved a strong gain for the 12 months ending October 31, 2024. Resilient global economic growth and a slowing in the pace of inflation in certain regions, as well as a shift to global monetary easing, contributed to a favorable backdrop, despite persistent geopolitical risk.
•Against this backdrop, stock selection in Japan and security selection and an overweight in the United States contributed to the fund's performance versus the MSCI EAFE Value Index (Net MA) for the fiscal year.
•By sector, security selection was the primary contributor, especially within industrials, where our stock picks in capital goods helped most. Security selection in materials also boosted the fund's relative performance. Also contributing to our result was an overweight in financials.
•The top individual relative contributor was an overweight in Hitachi (+110%). The company was among the fund's biggest holdings. A second notable relative contributor was an overweight in Mitsubishi Heavy Industries (+162%). This was a stake we established this period. Another notable relative contributor was our non-benchmark stake in Rheinmetall (+82%). The stock was among our biggest holdings this period.
•In contrast, from a regional standpoint, stock picks in the U.K. and Asia Pacific ex Japan, primarily in Australia, detracted from the fund's relative result.
•By sector, the biggest detractor from performance versus the benchmark was stock selection in information technology. Stock picking in financials also hampered the fund's result. Also hurting our result was an overweight in energy.
•The largest individual relative detractor was an overweight in BHP (+5%). The stock was among the fund's biggest holdings. A second notable relative detractor was an overweight in GSK (-11%). This was a stake we established this period. A non-benchmark stake in Prudential returned -19% and notably hurt.
•Notable changes in positioning include decreased exposure to France and Australia. By sector, meaningful changes in positioning include lower allocations to consumer discretionary and energy.
How did the Fund perform over the life of Fund?
CUMULATIVE PERFORMANCE
October 2, 2018 through October 31, 2024.
Initial investment of $10,000.
Class Z | $10,000 | $9,240 | $9,687 | $8,372 | $12,001 | $9,945 | $11,755 |
MSCI EAFE Value Index | $10,000 | $9,397 | $9,942 | $8,130 | $11,273 | $9,455 | $11,200 |
MSCI EAFE Index | $10,000 | $9,263 | $10,310 | $9,621 | $12,935 | $9,980 | $11,442 |
| | 2018 | 2019 | 2020 | 2021 | 2022 | 2023 | 2024 |
AVERAGE ANNUAL TOTAL RETURNS:| | 1 Year | 5 Year | Life of Fund A |
| Class Z | 23.71% | 8.47% | 6.35% |
| MSCI EAFE Value Index | 23.14% | 6.76% | 5.42% |
| MSCI EAFE Index | 23.25% | 6.46% | 5.81% |
A From October 2, 2018
Visit institutional.fidelity.com for more recent performance information. |
The Fund's past performance is not a good predictor of the Fund's future performance. The graph and table do not reflect the deduction of taxes that a shareholder would pay on fund distributions or redemption of fund shares. |
Key Fund Statistics(as of October 31, 2024)
KEY FACTS | | |
| Fund Size | $1,472,284,197 | |
| Number of Holdings | 101 | |
| Total Advisory Fee | $8,618,481 | |
| Portfolio Turnover | 29% | |
What did the Fund invest in?
(as of October 31, 2024)
MARKET SECTORS (% of Fund's net assets) | | |
| Financials | 35.1 | |
| Industrials | 18.0 | |
| Materials | 13.0 | |
| Energy | 8.4 | |
| Consumer Discretionary | 5.0 | |
| Health Care | 4.7 | |
| Information Technology | 4.3 | |
| Consumer Staples | 3.9 | |
| Communication Services | 3.0 | |
| Real Estate | 0.9 | |
| Utilities | 0.6 | |
| |
| Common Stocks | 96.5 |
| Preferred Stocks | 0.4 |
| Short-Term Investments and Net Other Assets (Liabilities) | 3.1 |
ASSET ALLOCATION (% of Fund's net assets) |
|
|
| Japan | 22.8 |
| United Kingdom | 14.8 |
| United States | 13.1 |
| Germany | 11.4 |
| France | 9.8 |
| Australia | 6.1 |
| Italy | 5.0 |
| Spain | 3.4 |
| Switzerland | 3.3 |
| Others | 10.3 |
GEOGRAPHIC DIVERSIFICATION (% of Fund's net assets) |
|
| |
|
TOP HOLDINGS(% of Fund's net assets) | | |
| Shell PLC ADR | 3.7 | |
| Hitachi Ltd | 2.8 | |
| Banco Santander SA | 2.4 | |
| AXA SA | 2.3 | |
| CRH PLC | 2.2 | |
| BAE Systems PLC | 2.1 | |
| BHP Group Ltd | 2.1 | |
| Rheinmetall AG | 2.1 | |
| TotalEnergies SE | 2.0 | |
| Mitsubishi UFJ Financial Group Inc | 2.0 | |
| | 23.7 | |
How has the Fund changed?
This is a summary of certain changes to the Fund since November 1, 2023. For more complete information, you may review the Fund's next prospectus, which we expect to be available by December 30, 2024 at fundresearch.fidelity.com/prospectus/sec or upon request at 1-877-208-0098 or by sending an e-mail to fidfunddocuments@fidelity.com.
The fees associated with this class changed during the reporting year.The variations in class fees are primarily the result of the following changes: - Management fee
- Operating expenses
- Performance adjustment fee
The fund's transfer agent and pricing & bookkeeping fees were changed to a fixed rate effective December 1, 2023, through February 29, 2024, in anticipation of the transition to a new management fee structure. Effective March 1, 2024, the fund's management contract was amended to incorporate administrative services previously covered under separate services agreements (transfer agent and pricing & bookkeeping). The amended contract incorporates a basic fee rate that may vary by class (subject to a performance adjustment). The Adviser or an affiliate pays certain expenses of managing and operating the fund out of each class's management fee. | The fund's sub-advisory agreement with FIL Investments (Japan) Limited was not renewed.
|
| Fidelity, the Fidelity Investments Logo and all other Fidelity trademarks or service marks used herein are trademarks or service marks of FMR LLC. Any third-party marks that are used herein are trademarks or service marks of their respective owners. © 2024 FMR LLC. All rights reserved. |
| | For additional information about the Fund; including its prospectus, financial information, holdings and proxy information, scan the QR code or visit fundresearch.fidelity.com/prospectus/sec 1.9913941.100 3269-TSRA-1224 |
| |
| | ANNUAL SHAREHOLDER REPORT | AS OF OCTOBER 31, 2024 | This report describes changes to the Fund that occurred during the reporting period. |
| | Fidelity® International Discovery Fund Fidelity Advisor® International Discovery Fund Class I : FIADX |
| | | |
This annual shareholder report contains information about Fidelity® International Discovery Fund for the period November 1, 2023 to October 31, 2024. You can find additional information about the Fund at fundresearch.fidelity.com/prospectus/sec. You can also request this information by contacting us at 1-877-208-0098 or by sending an e-mail to fidfunddocuments@fidelity.com.
What were your Fund costs for the last year?(based on hypothetical $10,000 investment)
FUND COST (PREVIOUS YEAR)
| | Costs of a $10,000 investment | Costs paid as a percentage of a $10,000 investment | |
| Class I | $ 71 | 0.62% | |
What affected the Fund's performance this period?
•International stocks achieved a strong gain for the 12 months ending October 31, 2024. Resilient global economic growth and a slowing in the pace of inflation in certain regions, as well as a shift to global monetary easing, contributed to a favorable backdrop, despite persistent geopolitical risk.
•Against this backdrop, picks in Europe ex U.K. and Japan contributed to the fund's performance versus the MSCI EAFE Index (Net MA) for the fiscal year.
•By sector, the biggest contributor to performance versus the benchmark was stock picking in industrials, primarily within the capital goods industry. Stock picking and an overweight in information technology, primarily within the semiconductors & semiconductor equipment industry, also boosted the fund's relative performance, as did stock picking in consumer discretionary.
•The top individual relative contributor was our non-benchmark stake in Nvidia (+121%). This period we decreased our investment in Nvidia. A second notable relative contributor was our non-benchmark stake in Taiwan Semiconductor (+96%). The company was one of our largest holdings. Another notable relative contributor was an overweight in Hitachi (+109%), the fund's biggest holding at period end.
•In contrast, from a regional standpoint, a non-benchmark allocation to Canada and an underweight in Asia Pacific ex Japan detracted from the fund's relative result.
•By sector, the biggest detractor from performance versus the benchmark was stock selection in consumer staples. Security selection in financials also hampered the fund's result. Also hurting our result were stock picks and an underweight in communication services, primarily within the media & entertainment industry. Lastly, the fund's position in cash detracted.
•The fund's non-benchmark stake in PDD returned -47% and was the largest individual relative detractor. This was a position we established this period. A second notable relative detractor was an overweight in L'Oréal (-9%), which was among the fund's biggest holdings this period. A non-benchmark stake in One97 Communications returned about -29% and notably hurt. The stock was not held at period end.
•Notable changes in positioning include increased exposure to Germany and a lower allocation to India. By sector, meaningful changes in positioning include increased exposure to industrials and a lower allocation to consumer staples.
How did the Fund perform over the past 10 years?
CUMULATIVE PERFORMANCE
October 31, 2014 through October 31, 2024.
Initial investment of $10,000.
Class I | $10,000 | $10,344 | $9,877 | $12,474 | $11,250 | $12,630 | $13,687 | $18,240 | $12,701 | $13,591 | $17,598 |
MSCI EAFE Index | $10,000 | $10,008 | $9,705 | $12,004 | $11,206 | $12,472 | $11,638 | $15,647 | $12,073 | $13,841 | $17,059 |
| | 2014 | 2015 | 2016 | 2017 | 2018 | 2019 | 2020 | 2021 | 2022 | 2023 | 2024 |
AVERAGE ANNUAL TOTAL RETURNS:| | 1 Year | 5 Year | 10 Year |
| Class I | 29.49% | 6.86% | 5.82% |
| MSCI EAFE Index | 23.25% | 6.46% | 5.49% |
Visit institutional.fidelity.com for more recent performance information. |
The Fund's past performance is not a good predictor of the Fund's future performance. The graph and table do not reflect the deduction of taxes that a shareholder would pay on fund distributions or redemption of fund shares. |
Key Fund Statistics(as of October 31, 2024)
KEY FACTS | | |
| Fund Size | $9,841,033,775 | |
| Number of Holdings | 142 | |
| Total Advisory Fee | $45,667,963 | |
| Portfolio Turnover | 44% | |
What did the Fund invest in?
(as of October 31, 2024)
MARKET SECTORS (% of Fund's net assets) | | |
| Financials | 22.3 | |
| Industrials | 22.0 | |
| Consumer Discretionary | 14.1 | |
| Information Technology | 11.8 | |
| Health Care | 9.8 | |
| Materials | 5.4 | |
| Consumer Staples | 4.1 | |
| Communication Services | 3.3 | |
| Energy | 3.1 | |
| Real Estate | 1.0 | |
| |
| Common Stocks | 96.2 |
| Preferred Stocks | 0.7 |
| Short-Term Investments and Net Other Assets (Liabilities) | 3.1 |
ASSET ALLOCATION (% of Fund's net assets) |
|
|
| Japan | 17.6 |
| United Kingdom | 15.3 |
| France | 9.1 |
| United States | 8.5 |
| Germany | 7.0 |
| Netherlands | 6.0 |
| Italy | 5.0 |
| Canada | 4.6 |
| Sweden | 3.6 |
| Others | 23.3 |
GEOGRAPHIC DIVERSIFICATION (% of Fund's net assets) |
|
| |
|
TOP HOLDINGS(% of Fund's net assets) | | |
| Hitachi Ltd | 3.1 | |
| UniCredit SpA | 2.7 | |
| Novo Nordisk A/S Series B | 2.7 | |
| ASML Holding NV | 2.1 | |
| Taiwan Semiconductor Manufacturing Co Ltd | 2.0 | |
| Constellation Software Inc/Canada | 2.0 | |
| Unilever PLC | 2.0 | |
| Compass Group PLC | 1.7 | |
| UCB SA | 1.7 | |
| ITOCHU Corp | 1.6 | |
| | 21.6 | |
How has the Fund changed?
This is a summary of certain changes to the Fund since November 1, 2023. For more complete information, you may review the Fund's next prospectus, which we expect to be available by December 30, 2024 at fundresearch.fidelity.com/prospectus/sec or upon request at 1-877-208-0098 or by sending an e-mail to fidfunddocuments@fidelity.com.
The fees associated with this class changed during the reporting year.The variations in class fees are primarily the result of the following changes: - Management fee
- Performance adjustment fee
The fund's transfer agent and pricing & bookkeeping fees were changed to a fixed rate effective December 1, 2023, through February 29, 2024, in anticipation of the transition to a new management fee structure. Effective March 1, 2024, the fund's management contract was amended to incorporate administrative services previously covered under separate services agreements (transfer agent and pricing & bookkeeping). The amended contract incorporates a basic fee rate that may vary by class (subject to a performance adjustment). The Adviser or an affiliate pays certain expenses of managing and operating the fund out of each class's management fee. | The fund's sub-advisory agreement with FIL Investments (Japan) Limited was not renewed.
|
| Fidelity, the Fidelity Investments Logo and all other Fidelity trademarks or service marks used herein are trademarks or service marks of FMR LLC. Any third-party marks that are used herein are trademarks or service marks of their respective owners. © 2024 FMR LLC. All rights reserved. |
| | For additional information about the Fund; including its prospectus, financial information, holdings and proxy information, scan the QR code or visit fundresearch.fidelity.com/prospectus/sec 1.9913838.100 1402-TSRA-1224 |
| |
| | ANNUAL SHAREHOLDER REPORT | AS OF OCTOBER 31, 2024 | This report describes changes to the Fund that occurred during the reporting period. |
| | Fidelity® Worldwide Fund Fidelity Advisor® Worldwide Fund Class C : FWCFX |
| | | |
This annual shareholder report contains information about Fidelity® Worldwide Fund for the period November 1, 2023 to October 31, 2024. You can find additional information about the Fund at fundresearch.fidelity.com/prospectus/sec. You can also request this information by contacting us at 1-877-208-0098 or by sending an e-mail to fidfunddocuments@fidelity.com.
What were your Fund costs for the last year?(based on hypothetical $10,000 investment)
FUND COST (PREVIOUS YEAR)
| | Costs of a $10,000 investment | Costs paid as a percentage of a $10,000 investment | |
| Class C | $ 211 | 1.74% | |
What affected the Fund's performance this period?
•Global equities posted a strong advance for the 12 months ending October 31, 2024. Resilient economic growth and a slowing in the pace of inflation in certain regions, as well as a shift to global monetary easing, contributed to a favorable backdrop, despite persistent geopolitical risk.
•Against this backdrop, by region, security selection in the United States was the primary contributor to the fund's performance versus the MSCI World Index for the fiscal year.
•By sector, security selection was the primary contributor, especially within consumer discretionary. Stock picking in information technology, primarily within the semiconductors & semiconductor equipment industry, and industrials, primarily within the capital goods industry, also boosted the fund's relative performance.
•The top individual relative contributor was an overweight in Nvidia (+219%). We decreased our position in Nvidia during the period, but the company was the fund's largest holding at period end. The second-largest relative contributor was an overweight in Constellation Energy (+138%). This period we increased our investment in the stock. An overweight in Meta Platforms (+89%), which was one of the fund's largest holdings, also helped.
•In contrast, from a regional standpoint, an overweight in emerging markets, and stock selection and an overweight in the U.K., detracted from the fund's relative result.
•By sector, the biggest detractors from performance versus the benchmark were stock picking and an underweight in financials. Also modestly hurting our result were overweights in consumer discretionary, primarily within the consumer durables & apparel industry, and information technology.
•The biggest individual relative detractor was a stake in Jabil (-8%). The stock was not held at period end. The second-largest relative detractor was an overweight in Coinbase Global (-25%). This was a position we established this period. An overweight in Oracle (+8%) also hurt. We notably decreased our stake in Oracle by period end.
•Notable changes in positioning by region include a lower allocation to Japan. By sector, meaningful changes in positioning include decreased exposure to energy and a higher allocation to consumer discretionary.
How did the Fund perform over the past 10 years?
CUMULATIVE PERFORMANCE
October 31, 2014 through October 31, 2024.
Initial investment of $10,000.
Class C | $10,000 | $10,190 | $9,998 | $12,508 | $12,898 | $14,380 | $17,221 | $23,531 | $16,969 | $18,772 | $26,860 |
MSCI World Index | $10,000 | $10,220 | $10,390 | $12,813 | $13,016 | $14,736 | $15,446 | $21,766 | $17,811 | $19,758 | $26,510 |
| | 2014 | 2015 | 2016 | 2017 | 2018 | 2019 | 2020 | 2021 | 2022 | 2023 | 2024 |
AVERAGE ANNUAL TOTAL RETURNS:| | 1 Year | 5 Year | 10 Year |
| Class C (incl. contingent deferred sales charge) | 40.98% | 12.96% | 10.39% |
| Class C | 41.98% | 12.96% | 10.39% |
| MSCI World Index | 34.17% | 12.46% | 10.24% |
Visit institutional.fidelity.com for more recent performance information. |
The Fund's past performance is not a good predictor of the Fund's future performance. The graph and table do not reflect the deduction of taxes that a shareholder would pay on fund distributions or redemption of fund shares. |
Key Fund Statistics(as of October 31, 2024)
KEY FACTS | | |
| Fund Size | $3,143,670,063 | |
| Number of Holdings | 189 | |
| Total Advisory Fee | $19,608,125 | |
| Portfolio Turnover | 108% | |
What did the Fund invest in?
(as of October 31, 2024)
MARKET SECTORS (% of Fund's net assets) | | |
| Information Technology | 21.6 | |
| Consumer Discretionary | 16.6 | |
| Industrials | 16.3 | |
| Financials | 14.4 | |
| Communication Services | 10.4 | |
| Health Care | 8.5 | |
| Energy | 3.1 | |
| Utilities | 2.4 | |
| Real Estate | 2.2 | |
| Consumer Staples | 2.0 | |
| Materials | 1.9 | |
| |
| Common Stocks | 99.2 |
| Preferred Stocks | 0.2 |
| Short-Term Investments and Net Other Assets (Liabilities) | 0.6 |
ASSET ALLOCATION (% of Fund's net assets) |
|
|
| United States | 69.1 |
| United Kingdom | 4.6 |
| Canada | 4.0 |
| Sweden | 3.3 |
| Japan | 3.3 |
| Italy | 1.8 |
| Australia | 1.6 |
| Denmark | 1.5 |
| Belgium | 1.3 |
| Others | 9.5 |
GEOGRAPHIC DIVERSIFICATION (% of Fund's net assets) |
|
| |
|
TOP HOLDINGS(% of Fund's net assets) | | |
| NVIDIA Corp | 5.6 | |
| Meta Platforms Inc Class A | 4.7 | |
| Microsoft Corp | 4.1 | |
| Apple Inc | 3.8 | |
| Modine Manufacturing Co | 3.1 | |
| Eli Lilly & Co | 3.1 | |
| Amazon.com Inc | 2.7 | |
| Fiserv Inc | 2.5 | |
| Alphabet Inc Class A | 2.4 | |
| Deckers Outdoor Corp | 2.4 | |
| | 34.4 | |
How has the Fund changed?
This is a summary of certain changes to the Fund since November 1, 2023. For more complete information, you may review the Fund's next prospectus, which we expect to be available by December 30, 2024 at fundresearch.fidelity.com/prospectus/sec or upon request at 1-877-208-0098 or by sending an e-mail to fidfunddocuments@fidelity.com.
The fund's transfer agent and pricing & bookkeeping fees were changed to a fixed rate effective December 1, 2023, through February 29, 2024, in anticipation of the transition to a new management fee structure. Effective March 1, 2024, the fund's management contract was amended to incorporate administrative services previously covered under separate services agreements (transfer agent and pricing & bookkeeping). The amended contract incorporates a basic fee rate that may vary by class (subject to a performance adjustment). The Adviser or an affiliate pays certain expenses of managing and operating the fund out of each class's management fee. | The fund's sub-advisory agreement with FIL Investments (Japan) Limited was not renewed.
|
| Fidelity, the Fidelity Investments Logo and all other Fidelity trademarks or service marks used herein are trademarks or service marks of FMR LLC. Any third-party marks that are used herein are trademarks or service marks of their respective owners. © 2024 FMR LLC. All rights reserved. |
| | For additional information about the Fund; including its prospectus, financial information, holdings and proxy information, scan the QR code or visit fundresearch.fidelity.com/prospectus/sec 1.9913853.100 2145-TSRA-1224 |
| |
| | ANNUAL SHAREHOLDER REPORT | AS OF OCTOBER 31, 2024 | This report describes changes to the Fund that occurred during the reporting period. |
| | Fidelity® International Small Cap Fund Fidelity Advisor® International Small Cap Fund Class M : FTISX |
| | | |
This annual shareholder report contains information about Fidelity® International Small Cap Fund for the period November 1, 2023 to October 31, 2024. You can find additional information about the Fund at fundresearch.fidelity.com/prospectus/sec. You can also request this information by contacting us at 1-877-208-0098 or by sending an e-mail to fidfunddocuments@fidelity.com.
What were your Fund costs for the last year?(based on hypothetical $10,000 investment)
FUND COST (PREVIOUS YEAR)
| | Costs of a $10,000 investment | Costs paid as a percentage of a $10,000 investment | |
| Class M | $ 172 | 1.57% | |
What affected the Fund's performance this period?
•International stocks achieved a strong gain for the 12 months ending October 31, 2024. Resilient global economic growth and a slowing in the pace of inflation in certain regions, as well as a shift to global monetary easing, contributed to a favorable backdrop, despite persistent geopolitical risk.
•Against this backdrop, an underweight in emerging markets, primarily in India, and picks in the U.K. and Brazil detracted from the fund's performance versus the Fidelity International Small Cap Fund Linked Index for the fiscal year.
•By sector, security selection in financials was the largest detractor. However, picks in industrials, health care and consumer discretionary also meaningfully weighed on the fund's relative result.
•The largest individual relative detractor was our non-benchmark stake in Hypera Pharma (-35%). A non-benchmark stake in Mayr-Melnhof Karton returned roughly -24% and was the second-largest relative detractor. An overweight in Stabilus (-36%) also hurt.
•In contrast, from a regional standpoint, picks in emerging markets, primarily in Taiwan and China, contributed to the fund's relative result. In Europe ex U.K., investment choices in Germany proved rewarding.
•By sector, the biggest contributor to performance versus the benchmark was stock selection in communication services, primarily within the media & entertainment industry. Security selection in information technology, primarily within the technology hardware & equipment industry, also boosted the fund's relative performance.
•The top individual relative contributor was an overweight in International Games System (+238%). This period we decreased our position in International Games System. The company was among our biggest holdings. The second-largest relative contributor was our non-benchmark stake in Rheinmetall (+81%). The company was the fund's biggest holding. Another notable relative contributor was an overweight in Test Research (+131%).
•Notable changes in positioning include decreased exposure to Germany and a higher allocation to Japan and Taiwan. By sector, meaningful changes in positioning include increased exposure to communication services and a lower allocation to consumer discretionary.
How did the Fund perform over the past 10 years?
CUMULATIVE PERFORMANCE
October 31, 2014 through October 31, 2024.
Initial investment of $10,000 and the current sales charge was paid.
Class M | $9,650 | $10,219 | $11,118 | $13,949 | $12,680 | $13,650 | $13,077 | $18,186 | $13,562 | $15,274 | $18,065 |
MSCI ACWI (All Country World Index) ex USA Small Cap Index | $10,000 | $10,162 | $10,602 | $13,236 | $11,963 | $13,030 | $13,055 | $18,144 | $13,127 | $14,305 | $17,725 |
| | 2014 | 2015 | 2016 | 2017 | 2018 | 2019 | 2020 | 2021 | 2022 | 2023 | 2024 |
AVERAGE ANNUAL TOTAL RETURNS:| | 1 Year | 5 Year | 10 Year |
| Class M (incl. 3.50% sales charge) | 14.13% | 5.01% | 6.09% |
| Class M (without 3.50% sales charge) | 18.27% | 5.76% | 6.47% |
| MSCI ACWI (All Country World Index) ex USA Small Cap Index | 23.90% | 6.35% | 5.89% |
Visit institutional.fidelity.com for more recent performance information. |
The Fund's past performance is not a good predictor of the Fund's future performance. The graph and table do not reflect the deduction of taxes that a shareholder would pay on fund distributions or redemption of fund shares. |
Key Fund Statistics(as of October 31, 2024)
KEY FACTS | | |
| Fund Size | $4,778,290,407 | |
| Number of Holdings | 197 | |
| Total Advisory Fee | $43,346,727 | |
| Portfolio Turnover | 17% | |
What did the Fund invest in?
(as of October 31, 2024)
MARKET SECTORS (% of Fund's net assets) | | |
| Industrials | 22.4 | |
| Financials | 13.2 | |
| Consumer Discretionary | 11.0 | |
| Consumer Staples | 10.4 | |
| Information Technology | 9.4 | |
| Materials | 8.2 | |
| Real Estate | 5.9 | |
| Health Care | 5.4 | |
| Communication Services | 4.8 | |
| Energy | 3.7 | |
| Utilities | 1.5 | |
| |
| Common Stocks | 95.9 |
| Short-Term Investments and Net Other Assets (Liabilities) | 4.1 |
ASSET ALLOCATION (% of Fund's net assets) |
|
|
| Japan | 21.9 |
| United Kingdom | 15.5 |
| United States | 6.8 |
| Canada | 4.2 |
| Taiwan | 4.0 |
| Australia | 3.3 |
| Spain | 3.1 |
| China | 3.1 |
| Mexico | 3.1 |
| Others | 35.0 |
GEOGRAPHIC DIVERSIFICATION (% of Fund's net assets) |
|
| |
|
TOP HOLDINGS(% of Fund's net assets) | | |
| Rheinmetall AG | 1.3 | |
| Premier Foods PLC | 1.2 | |
| Century Pacific Food Inc | 1.1 | |
| Logista Integral SA | 1.0 | |
| North West Co Inc/The | 1.0 | |
| Ashtead Technology Holdings plc | 1.0 | |
| Shriram Finance Ltd | 0.9 | |
| RHI Magnesita NV | 0.9 | |
| BayCurrent Inc | 0.9 | |
| Richter Gedeon Nyrt | 0.9 | |
| | 10.2 | |
How has the Fund changed?
This is a summary of certain changes to the Fund since November 1, 2023. For more complete information, you may review the Fund's next prospectus, which we expect to be available by December 30, 2024 at fundresearch.fidelity.com/prospectus/sec or upon request at 1-877-208-0098 or by sending an e-mail to fidfunddocuments@fidelity.com.
The fees associated with this class changed during the reporting year.The variations in class fees are primarily the result of the following changes: - Management fee
- Operating expenses
- Performance adjustment fee
The fund's transfer agent and pricing & bookkeeping fees were changed to a fixed rate effective December 1, 2023, through February 29, 2024, in anticipation of the transition to a new management fee structure. Effective March 1, 2024, the fund's management contract was amended to incorporate administrative services previously covered under separate services agreements (transfer agent and pricing & bookkeeping). The amended contract incorporates a basic fee rate that may vary by class (subject to a performance adjustment). The Adviser or an affiliate pays certain expenses of managing and operating the fund out of each class's management fee. | The fund's sub-advisory agreement with FIL Investments (Japan) Limited was not renewed.
|
| Fidelity, the Fidelity Investments Logo and all other Fidelity trademarks or service marks used herein are trademarks or service marks of FMR LLC. Any third-party marks that are used herein are trademarks or service marks of their respective owners. © 2024 FMR LLC. All rights reserved. |
| | For additional information about the Fund; including its prospectus, financial information, holdings and proxy information, scan the QR code or visit fundresearch.fidelity.com/prospectus/sec 1.9913912.100 1261-TSRA-1224 |
| |
| | ANNUAL SHAREHOLDER REPORT | AS OF OCTOBER 31, 2024 | This report describes changes to the Fund that occurred during the reporting period. |
| | Fidelity® Europe Fund Fidelity® Europe Fund : FIEUX |
| | | |
This annual shareholder report contains information about Fidelity® Europe Fund for the period November 1, 2023 to October 31, 2024. You can find additional information about the Fund at fundresearch.fidelity.com/prospectus/sec. You can also request this information by contacting us at 1-800-544-8544 or by sending an e-mail to fidfunddocuments@fidelity.com.
What were your Fund costs for the last year?(based on hypothetical $10,000 investment)
FUND COST (PREVIOUS YEAR)
| | Costs of a $10,000 investment | Costs paid as a percentage of a $10,000 investment | |
| Fidelity® Europe Fund | $ 71 | 0.64% | |
What affected the Fund's performance this period?
•International stocks achieved a strong gain for the 12 months ending October 31, 2024. Resilient global economic growth and a slowing in the pace of inflation in certain regions, as well as a shift to global monetary easing, contributed to a favorable backdrop, despite persistent geopolitical risk.
•Against this backdrop, stock picks in Europe ex U.K., primarily in France, and the U.K. detracted from the fund's performance versus the MSCI Europe Index (Net MA) for the fiscal year.
•By sector, security selection was the primary detractor, especially within consumer staples. Picks and an underweight in financials, primarily within the banks industry, also hampered the fund's result. Also hurting our result was stock selection in materials.
•The biggest individual relative detractor was an overweight in Davide Campari Milano (-39%). The second-largest relative detractor was an overweight in Diageo (-16%). Not owning Schneider Electric, a benchmark component that gained roughly 71%, was another notable relative detractor.
•In contrast, from a regional standpoint, an underweight in Europe ex U.K., along with stock selection in Belgium and in Sweden, contributed to the fund's relative result.
•By sector, the biggest contributor to performance versus the benchmark was stock selection in health care, primarily within the pharmaceuticals, biotechnology & life sciences industry. Stock picks in communication services, primarily within the media & entertainment industry, also boosted the fund's relative performance.
•The top individual relative contributor was an overweight in UCB (+165%). Although we reduced the fund's exposure to the stock, it was among the fund's biggest holdings at period end. A second notable relative contributor was an overweight in SAP (+76%). The stock was among our largest holdings, even though we trimmed the position. A non-benchmark stake in Hemnet gained 81% and notably helped.
•Notable changes in positioning include decreased exposure to France and a higher allocation to Italy. By sector, meaningful changes in positioning include increased exposure to communication services and a lower allocation to consumer staples.
How did the Fund perform over the past 10 years?
CUMULATIVE PERFORMANCE
October 31, 2014 through October 31, 2024.
Initial investment of $10,000.
Fidelity® Europe Fund | $10,000 | $10,497 | $9,823 | $12,382 | $11,262 | $12,113 | $12,713 | $16,780 | $11,735 | $13,016 | $15,889 |
MSCI Europe Index | $10,000 | $10,004 | $9,281 | $11,817 | $10,862 | $12,081 | $10,984 | $15,520 | $11,998 | $13,925 | $17,097 |
| | 2014 | 2015 | 2016 | 2017 | 2018 | 2019 | 2020 | 2021 | 2022 | 2023 | 2024 |
AVERAGE ANNUAL TOTAL RETURNS:| | 1 Year | 5 Year | 10 Year |
| Fidelity® Europe Fund | 22.07% | 5.58% | 4.74% |
| MSCI Europe Index | 22.78% | 7.19% | 5.51% |
Visit www.fidelity.com for more recent performance information. |
The Fund's past performance is not a good predictor of the Fund's future performance. The graph and table do not reflect the deduction of taxes that a shareholder would pay on fund distributions or redemption of fund shares. |
Key Fund Statistics(as of October 31, 2024)
KEY FACTS | | |
| Fund Size | $580,672,025 | |
| Number of Holdings | 101 | |
| Total Advisory Fee | $3,255,111 | |
| Portfolio Turnover | 31% | |
What did the Fund invest in?
(as of October 31, 2024)
MARKET SECTORS (% of Fund's net assets) | | |
| Financials | 18.9 | |
| Health Care | 16.4 | |
| Industrials | 14.6 | |
| Consumer Discretionary | 12.3 | |
| Information Technology | 11.2 | |
| Consumer Staples | 8.4 | |
| Communication Services | 4.7 | |
| Energy | 4.4 | |
| Materials | 4.1 | |
| Real Estate | 1.0 | |
| Utilities | 0.8 | |
| |
| Common Stocks | 96.7 |
| Preferred Stocks | 0.1 |
| Short-Term Investments and Net Other Assets (Liabilities) | 3.2 |
ASSET ALLOCATION (% of Fund's net assets) |
|
|
| United Kingdom | 23.1 |
| France | 15.3 |
| Germany | 12.4 |
| United States | 8.2 |
| Italy | 7.8 |
| Denmark | 7.1 |
| Sweden | 6.7 |
| Netherlands | 5.1 |
| Switzerland | 2.8 |
| Others | 11.5 |
GEOGRAPHIC DIVERSIFICATION (% of Fund's net assets) |
|
| |
|
TOP HOLDINGS(% of Fund's net assets) | | |
| Novo Nordisk A/S Series B | 5.6 | |
| SAP SE | 3.9 | |
| ASML Holding NV | 3.8 | |
| Astrazeneca PLC | 3.7 | |
| Shell PLC | 2.7 | |
| RELX PLC | 2.5 | |
| Air Liquide SA | 2.3 | |
| UCB SA | 2.2 | |
| LVMH Moet Hennessy Louis Vuitton SE | 2.1 | |
| UniCredit SpA | 1.7 | |
| | 30.5 | |
How has the Fund changed?
This is a summary of certain changes to the Fund since November 1, 2023. For more complete information, you may review the Fund's next prospectus, which we expect to be available by December 30, 2024 at fundresearch.fidelity.com/prospectus/sec or upon request at 1-800-544-8544 or by sending an e-mail to fidfunddocuments@fidelity.com.
The fees associated with this class changed during the reporting year.The variations in class fees are primarily the result of the following changes: - Management fee
- Operating expenses
The fund's transfer agent and pricing & bookkeeping fees were changed to a fixed rate effective December 1, 2023, through February 29, 2024, in anticipation of the transition to a new management fee structure. Effective March 1, 2024, the fund's management contract was amended to incorporate administrative services previously covered under separate services agreements (transfer agent and pricing & bookkeeping). The amended contract incorporates a basic fee rate that may vary by class (subject to a performance adjustment). The Adviser or an affiliate pays certain expenses of managing and operating the fund out of each class's management fee. | |
| Fidelity, the Fidelity Investments Logo and all other Fidelity trademarks or service marks used herein are trademarks or service marks of FMR LLC. Any third-party marks that are used herein are trademarks or service marks of their respective owners. © 2024 FMR LLC. All rights reserved. |
| | For additional information about the Fund; including its prospectus, financial information, holdings and proxy information, scan the QR code or visit fundresearch.fidelity.com/prospectus/sec 1.9913832.100 301-TSRA-1224 |
| |
| | ANNUAL SHAREHOLDER REPORT | AS OF OCTOBER 31, 2024 | This report describes changes to the Fund that occurred during the reporting period. |
| | Fidelity® International Small Cap Opportunities Fund Fidelity Advisor® International Small Cap Opportunities Fund Class Z : FIQJX |
| | | |
This annual shareholder report contains information about Fidelity® International Small Cap Opportunities Fund for the period November 1, 2023 to October 31, 2024. You can find additional information about the Fund at fundresearch.fidelity.com/prospectus/sec. You can also request this information by contacting us at 1-877-208-0098 or by sending an e-mail to fidfunddocuments@fidelity.com.
What were your Fund costs for the last year?(based on hypothetical $10,000 investment)
FUND COST (PREVIOUS YEAR)
| | Costs of a $10,000 investment | Costs paid as a percentage of a $10,000 investment | |
| Class Z | $ 98 | 0.87% | |
What affected the Fund's performance this period?
•International stocks achieved a strong gain for the 12 months ending October 31, 2024. Resilient global economic growth and a slowing in the pace of inflation in certain regions, as well as a shift to global monetary easing, contributed to a favorable backdrop, despite persistent geopolitical risk.
•Against this backdrop, stock picking in Europe ex U.K. and a non-benchmark allocation to the United States contributed to the fund's performance versus the MSCI EAFE Small Cap Index (Net MA) for the fiscal year.
•By sector, security selection was the primary contributor, especially within communication services, where our picks in media & entertainment helped most. Stock selection and an overweight in industrials, primarily within the capital goods industry, and security selection and an underweight in consumer discretionary also boosted the fund's relative performance.
•The fund's non-benchmark stake in Lagercrantz gained 116% and was the top individual relative contributor. The stock was the fund's largest holding. The second-largest relative contributor was an overweight in Addtech (+91%). The company was among the fund's largest holdings. A non-benchmark stake in Kongsberg Gruppen gained approximately 158% and notably helped. The stock was one of the fund's biggest holdings this period.
•In contrast, from a regional standpoint, stock selection in the U.K. and a non-benchmark allocation to Canada detracted from the fund's relative result.
•By sector, the biggest detractor from performance versus the benchmark was an underweight in financials. Also hurting our result was security selection in health care and consumer staples. Lastly, the fund's position in cash detracted.
•The largest individual relative detractor was an overweight in Spectris (-11%). The stock was one of our biggest holdings. The second-largest relative detractor was our non-benchmark stake in Richelieu Hardware (-11%). An overweight in SHO-BOND Holdings (-7%) also detracted.
•Notable changes in positioning include a higher allocation to Europe. By sector, meaningful changes in positioning include higher allocations to multi-sector holdings and materials.
How did the Fund perform over the life of Fund?
CUMULATIVE PERFORMANCE
October 2, 2018 through October 31, 2024.
Initial investment of $10,000.
Class Z | $10,000 | $9,163 | $10,363 | $11,506 | $15,704 | $10,440 | $10,877 |
MSCI EAFE Small Cap Index | $10,000 | $9,081 | $9,899 | $9,778 | $13,294 | $9,285 | $9,905 |
MSCI EAFE Index | $10,000 | $9,263 | $10,310 | $9,621 | $12,935 | $9,980 | $11,442 |
| | 2018 | 2019 | 2020 | 2021 | 2022 | 2023 | 2024 |
AVERAGE ANNUAL TOTAL RETURNS:| | 1 Year | 5 Year | Life of Fund A |
| Class Z | 26.53% | 5.84% | 5.39% |
| MSCI EAFE Small Cap Index | 23.20% | 4.27% | 3.33% |
| MSCI EAFE Index | 23.25% | 6.46% | 5.81% |
A From October 2, 2018
Visit institutional.fidelity.com for more recent performance information. |
The Fund's past performance is not a good predictor of the Fund's future performance. The graph and table do not reflect the deduction of taxes that a shareholder would pay on fund distributions or redemption of fund shares. |
Key Fund Statistics(as of October 31, 2024)
KEY FACTS | | |
| Fund Size | $1,271,531,943 | |
| Number of Holdings | 111 | |
| Total Advisory Fee | $10,572,915 | |
| Portfolio Turnover | 27% | |
What did the Fund invest in?
(as of October 31, 2024)
MARKET SECTORS (% of Fund's net assets) | | |
| Industrials | 30.2 | |
| Information Technology | 19.8 | |
| Consumer Discretionary | 10.2 | |
| Communication Services | 9.3 | |
| Financials | 6.5 | |
| Health Care | 5.1 | |
| Materials | 4.3 | |
| Consumer Staples | 3.3 | |
| Real Estate | 2.4 | |
| Energy | 1.7 | |
| |
| Common Stocks | 92.8 |
| International Equity Funds | 4.8 |
| Short-Term Investments and Net Other Assets (Liabilities) | 2.4 |
ASSET ALLOCATION (% of Fund's net assets) |
|
|
| Japan | 25.1 |
| Sweden | 14.6 |
| United Kingdom | 14.3 |
| United States | 10.5 |
| Germany | 7.8 |
| Netherlands | 4.9 |
| Canada | 3.6 |
| France | 2.5 |
| Italy | 2.4 |
| Others | 14.3 |
GEOGRAPHIC DIVERSIFICATION (% of Fund's net assets) |
|
| |
|
TOP HOLDINGS(% of Fund's net assets) | | |
| Lagercrantz Group AB B Shares | 5.1 | |
| iShares MSCI EAFE Small-Cap ETF | 4.8 | |
| CTS Eventim AG & Co KGaA | 4.1 | |
| AddTech AB B Shares | 4.1 | |
| Azbil Corp | 3.2 | |
| Morningstar Inc | 2.7 | |
| Spectris PLC | 2.6 | |
| Interpump Group SpA | 2.4 | |
| Aalberts NV | 2.2 | |
| Howden Joinery Group PLC | 2.0 | |
| | 33.2 | |
How has the Fund changed?
This is a summary of certain changes to the Fund since November 1, 2023. For more complete information, you may review the Fund's next prospectus, which we expect to be available by December 30, 2024 at fundresearch.fidelity.com/prospectus/sec or upon request at 1-877-208-0098 or by sending an e-mail to fidfunddocuments@fidelity.com.
The fund's transfer agent and pricing & bookkeeping fees were changed to a fixed rate effective December 1, 2023, through February 29, 2024, in anticipation of the transition to a new management fee structure. Effective March 1, 2024, the fund's management contract was amended to incorporate administrative services previously covered under separate services agreements (transfer agent and pricing & bookkeeping). The amended contract incorporates a basic fee rate that may vary by class (subject to a performance adjustment). The Adviser or an affiliate pays certain expenses of managing and operating the fund out of each class's management fee. | The fund's sub-advisory agreement with FIL Investments (Japan) Limited was not renewed.
|
| Fidelity, the Fidelity Investments Logo and all other Fidelity trademarks or service marks used herein are trademarks or service marks of FMR LLC. Any third-party marks that are used herein are trademarks or service marks of their respective owners. © 2024 FMR LLC. All rights reserved. |
| | For additional information about the Fund; including its prospectus, financial information, holdings and proxy information, scan the QR code or visit fundresearch.fidelity.com/prospectus/sec 1.9913935.100 3268-TSRA-1224 |
| |
| | ANNUAL SHAREHOLDER REPORT | AS OF OCTOBER 31, 2024 | This report describes changes to the Fund that occurred during the reporting period. |
| | Fidelity® Canada Fund Fidelity Advisor® Canada Fund Class A : FACNX |
| | | |
This annual shareholder report contains information about Fidelity® Canada Fund for the period November 1, 2023 to October 31, 2024. You can find additional information about the Fund at fundresearch.fidelity.com/prospectus/sec. You can also request this information by contacting us at 1-877-208-0098 or by sending an e-mail to fidfunddocuments@fidelity.com.
What were your Fund costs for the last year?(based on hypothetical $10,000 investment)
FUND COST (PREVIOUS YEAR)
| | Costs of a $10,000 investment | Costs paid as a percentage of a $10,000 investment | |
| Class A | $ 151 | 1.33% | |
What affected the Fund's performance this period?
•International stocks achieved a strong gain for the 12 months ending October 31, 2024. Resilient global economic growth and a slowing in the pace of inflation in certain regions, as well as a shift to global monetary easing, contributed to a favorable backdrop, despite persistent geopolitical risk.
•Against this backdrop, stock picking in Canada's materials sector, and stock selection and an underweight in financials, primarily within the banking industry, detracted most from the fund's performance versus the S&P/TSX Composite Index for the fiscal year.
•The largest individual relative detractor was an overweight in Alimentation Couche-Tard (-3%). The stock was among the fund's largest holdings. Not owning Canadian Imperial Bank of Commerce, a benchmark component that gained 87%, was the second-largest relative detractor. An overweight in Canadian Pacific Kansas City Limited (+9%) - another of the fund's largest holdings - also hurt.
•By sector, the biggest contributors to performance versus the benchmark were picks and an overweight in information technology, primarily within the software & services industry. Stock choices in consumer discretionary and communication services also boosted the fund's relative performance.
•The top individual relative contributor this period was avoiding BCE, a benchmark component that returned about -6%. Not owning Cenovus Energy, a benchmark component that returned -13%, was the second-largest relative contributor. An overweight in Brookfield Asset Management (+91%) also helped.
•By sector, meaningful changes in positioning include increased exposure to information technology.
How did the Fund perform over the past 10 years?
CUMULATIVE PERFORMANCE
October 31, 2014 through October 31, 2024.
Initial investment of $10,000 and the current sales charge was paid.
Class A | $9,425 | $8,075 | $8,677 | $9,889 | $9,277 | $10,329 | $9,534 | $14,249 | $13,243 | $13,359 | $16,848 |
S&P/TSX Composite Index | $10,000 | $8,219 | $9,044 | $10,482 | $9,938 | $11,246 | $10,831 | $16,167 | $13,973 | $13,788 | $18,134 |
| | 2014 | 2015 | 2016 | 2017 | 2018 | 2019 | 2020 | 2021 | 2022 | 2023 | 2024 |
AVERAGE ANNUAL TOTAL RETURNS:| | 1 Year | 5 Year | 10 Year |
| Class A (incl. 5.75% sales charge) | 18.86% | 8.98% | 5.35% |
| Class A (without 5.75% sales charge) | 26.11% | 10.28% | 5.98% |
| S&P/TSX Composite Index | 31.52% | 10.03% | 6.13% |
Visit institutional.fidelity.com for more recent performance information. |
The Fund's past performance is not a good predictor of the Fund's future performance. The graph and table do not reflect the deduction of taxes that a shareholder would pay on fund distributions or redemption of fund shares. |
Key Fund Statistics(as of October 31, 2024)
KEY FACTS | | |
| Fund Size | $942,476,918 | |
| Number of Holdings | 63 | |
| Total Advisory Fee | $8,782,874 | |
| Portfolio Turnover | 8% | |
What did the Fund invest in?
(as of October 31, 2024)
MARKET SECTORS (% of Fund's net assets) | | |
| Financials | 27.5 | |
| Energy | 17.5 | |
| Industrials | 13.0 | |
| Information Technology | 11.1 | |
| Materials | 11.1 | |
| Consumer Staples | 8.6 | |
| Consumer Discretionary | 7.0 | |
| Communication Services | 2.8 | |
| Health Care | 0.7 | |
| |
| Common Stocks | 99.3 |
| Bonds | 0.2 |
| Preferred Stocks | 0.0 |
| Short-Term Investments and Net Other Assets (Liabilities) | 0.5 |
ASSET ALLOCATION (% of Fund's net assets) |
|
|
| Canada | 94.0 |
| United States | 2.7 |
| Brazil | 2.6 |
| Chile | 0.7 |
GEOGRAPHIC DIVERSIFICATION (% of Fund's net assets) |
|
| |
|
TOP HOLDINGS(% of Fund's net assets) | | |
| Royal Bank of Canada | 8.6 | |
| Canadian Pacific Kansas City Ltd | 5.7 | |
| Constellation Software Inc/Canada | 5.6 | |
| Alimentation Couche-Tard Inc | 4.9 | |
| Canadian Natural Resources Ltd | 4.8 | |
| PrairieSky Royalty Ltd | 4.0 | |
| Franco-Nevada Corp | 3.8 | |
| Suncor Energy Inc | 3.5 | |
| Dollarama Inc | 3.5 | |
| Shopify Inc Class A | 3.4 | |
| | 47.8 | |
How has the Fund changed?
This is a summary of certain changes to the Fund since November 1, 2023. For more complete information, you may review the Fund's next prospectus, which we expect to be available by December 30, 2024 at fundresearch.fidelity.com/prospectus/sec or upon request at 1-877-208-0098 or by sending an e-mail to fidfunddocuments@fidelity.com.
The fund's transfer agent and pricing & bookkeeping fees were changed to a fixed rate effective December 1, 2023, through February 29, 2024, in anticipation of the transition to a new management fee structure. Effective March 1, 2024, the fund's management contract was amended to incorporate administrative services previously covered under separate services agreements (transfer agent and pricing & bookkeeping). The amended contract incorporates a basic fee rate that may vary by class (subject to a performance adjustment). The Adviser or an affiliate pays certain expenses of managing and operating the fund out of each class's management fee. | |
| Fidelity, the Fidelity Investments Logo and all other Fidelity trademarks or service marks used herein are trademarks or service marks of FMR LLC. Any third-party marks that are used herein are trademarks or service marks of their respective owners. © 2024 FMR LLC. All rights reserved. |
| | For additional information about the Fund; including its prospectus, financial information, holdings and proxy information, scan the QR code or visit fundresearch.fidelity.com/prospectus/sec 1.9913844.100 1856-TSRA-1224 |
| |
| | ANNUAL SHAREHOLDER REPORT | AS OF OCTOBER 31, 2024 | This report describes changes to the Fund that occurred during the reporting period. |
| | Fidelity® International Value Fund Fidelity Advisor® International Value Fund Class I : FIVQX |
| | | |
This annual shareholder report contains information about Fidelity® International Value Fund for the period November 1, 2023 to October 31, 2024. You can find additional information about the Fund at fundresearch.fidelity.com/prospectus/sec. You can also request this information by contacting us at 1-877-208-0098 or by sending an e-mail to fidfunddocuments@fidelity.com.
What were your Fund costs for the last year?(based on hypothetical $10,000 investment)
FUND COST (PREVIOUS YEAR)
| | Costs of a $10,000 investment | Costs paid as a percentage of a $10,000 investment | |
| Class I | $ 103 | 0.92% | |
What affected the Fund's performance this period?
•International stocks achieved a strong gain for the 12 months ending October 31, 2024. Resilient global economic growth and a slowing in the pace of inflation in certain regions, as well as a shift to global monetary easing, contributed to a favorable backdrop, despite persistent geopolitical risk.
•Against this backdrop, stock selection in Japan and security selection and an overweight in the United States contributed to the fund's performance versus the MSCI EAFE Value Index (Net MA) for the fiscal year.
•By sector, security selection was the primary contributor, especially within industrials, where our stock picks in capital goods helped most. Security selection in materials also boosted the fund's relative performance. Also contributing to our result was an overweight in financials.
•The top individual relative contributor was an overweight in Hitachi (+110%). The company was among the fund's biggest holdings. A second notable relative contributor was an overweight in Mitsubishi Heavy Industries (+162%). This was a stake we established this period. Another notable relative contributor was our non-benchmark stake in Rheinmetall (+82%). The stock was among our biggest holdings this period.
•In contrast, from a regional standpoint, stock picks in the U.K. and Asia Pacific ex Japan, primarily in Australia, detracted from the fund's relative result.
•By sector, the biggest detractor from performance versus the benchmark was stock selection in information technology. Stock picking in financials also hampered the fund's result. Also hurting our result was an overweight in energy.
•The largest individual relative detractor was an overweight in BHP (+5%). The stock was among the fund's biggest holdings. A second notable relative detractor was an overweight in GSK (-11%). This was a stake we established this period. A non-benchmark stake in Prudential returned -19% and notably hurt.
•Notable changes in positioning include decreased exposure to France and Australia. By sector, meaningful changes in positioning include lower allocations to consumer discretionary and energy.
How did the Fund perform over the past 10 years?
CUMULATIVE PERFORMANCE
October 31, 2014 through October 31, 2024.
Initial investment of $10,000.
Class I | $10,000 | $9,947 | $9,469 | $11,333 | $10,309 | $10,780 | $9,298 | $13,301 | $11,009 | $12,987 | $16,045 |
MSCI EAFE Value Index | $10,000 | $9,591 | $9,294 | $11,477 | $10,621 | $11,237 | $9,189 | $12,742 | $10,687 | $12,659 | $15,588 |
MSCI EAFE Index | $10,000 | $10,008 | $9,705 | $12,004 | $11,206 | $12,472 | $11,638 | $15,647 | $12,073 | $13,841 | $17,059 |
| | 2014 | 2015 | 2016 | 2017 | 2018 | 2019 | 2020 | 2021 | 2022 | 2023 | 2024 |
AVERAGE ANNUAL TOTAL RETURNS:| | 1 Year | 5 Year | 10 Year |
| Class I | 23.55% | 8.28% | 4.84% |
| MSCI EAFE Value Index | 23.14% | 6.76% | 4.54% |
| MSCI EAFE Index | 23.25% | 6.46% | 5.49% |
Visit institutional.fidelity.com for more recent performance information. |
The Fund's past performance is not a good predictor of the Fund's future performance. The graph and table do not reflect the deduction of taxes that a shareholder would pay on fund distributions or redemption of fund shares. |
Key Fund Statistics(as of October 31, 2024)
KEY FACTS | | |
| Fund Size | $1,472,284,197 | |
| Number of Holdings | 101 | |
| Total Advisory Fee | $8,618,481 | |
| Portfolio Turnover | 29% | |
What did the Fund invest in?
(as of October 31, 2024)
MARKET SECTORS (% of Fund's net assets) | | |
| Financials | 35.1 | |
| Industrials | 18.0 | |
| Materials | 13.0 | |
| Energy | 8.4 | |
| Consumer Discretionary | 5.0 | |
| Health Care | 4.7 | |
| Information Technology | 4.3 | |
| Consumer Staples | 3.9 | |
| Communication Services | 3.0 | |
| Real Estate | 0.9 | |
| Utilities | 0.6 | |
| |
| Common Stocks | 96.5 |
| Preferred Stocks | 0.4 |
| Short-Term Investments and Net Other Assets (Liabilities) | 3.1 |
ASSET ALLOCATION (% of Fund's net assets) |
|
|
| Japan | 22.8 |
| United Kingdom | 14.8 |
| United States | 13.1 |
| Germany | 11.4 |
| France | 9.8 |
| Australia | 6.1 |
| Italy | 5.0 |
| Spain | 3.4 |
| Switzerland | 3.3 |
| Others | 10.3 |
GEOGRAPHIC DIVERSIFICATION (% of Fund's net assets) |
|
| |
|
TOP HOLDINGS(% of Fund's net assets) | | |
| Shell PLC ADR | 3.7 | |
| Hitachi Ltd | 2.8 | |
| Banco Santander SA | 2.4 | |
| AXA SA | 2.3 | |
| CRH PLC | 2.2 | |
| BAE Systems PLC | 2.1 | |
| BHP Group Ltd | 2.1 | |
| Rheinmetall AG | 2.1 | |
| TotalEnergies SE | 2.0 | |
| Mitsubishi UFJ Financial Group Inc | 2.0 | |
| | 23.7 | |
How has the Fund changed?
This is a summary of certain changes to the Fund since November 1, 2023. For more complete information, you may review the Fund's next prospectus, which we expect to be available by December 30, 2024 at fundresearch.fidelity.com/prospectus/sec or upon request at 1-877-208-0098 or by sending an e-mail to fidfunddocuments@fidelity.com.
The fees associated with this class changed during the reporting year.The variations in class fees are primarily the result of the following changes: - Management fee
- Operating expenses
- Performance adjustment fee
The fund's transfer agent and pricing & bookkeeping fees were changed to a fixed rate effective December 1, 2023, through February 29, 2024, in anticipation of the transition to a new management fee structure. Effective March 1, 2024, the fund's management contract was amended to incorporate administrative services previously covered under separate services agreements (transfer agent and pricing & bookkeeping). The amended contract incorporates a basic fee rate that may vary by class (subject to a performance adjustment). The Adviser or an affiliate pays certain expenses of managing and operating the fund out of each class's management fee. | The fund's sub-advisory agreement with FIL Investments (Japan) Limited was not renewed.
|
| Fidelity, the Fidelity Investments Logo and all other Fidelity trademarks or service marks used herein are trademarks or service marks of FMR LLC. Any third-party marks that are used herein are trademarks or service marks of their respective owners. © 2024 FMR LLC. All rights reserved. |
| | For additional information about the Fund; including its prospectus, financial information, holdings and proxy information, scan the QR code or visit fundresearch.fidelity.com/prospectus/sec 1.9913940.100 1616-TSRA-1224 |
| |
| | ANNUAL SHAREHOLDER REPORT | AS OF OCTOBER 31, 2024 | This report describes changes to the Fund that occurred during the reporting period. |
| | Fidelity® Pacific Basin Fund Fidelity® Pacific Basin Fund : FPBFX |
| | | |
This annual shareholder report contains information about Fidelity® Pacific Basin Fund for the period November 1, 2023 to October 31, 2024. You can find additional information about the Fund at fundresearch.fidelity.com/prospectus/sec. You can also request this information by contacting us at 1-800-544-8544 or by sending an e-mail to fidfunddocuments@fidelity.com.
What were your Fund costs for the last year?(based on hypothetical $10,000 investment)
FUND COST (PREVIOUS YEAR)
| | Costs of a $10,000 investment | Costs paid as a percentage of a $10,000 investment | |
| Fidelity® Pacific Basin Fund | $ 100 | 0.88% | |
What affected the Fund's performance this period?
•International stocks achieved a strong gain for the 12 months ending October 31, 2024. Resilient global economic growth and a slowing in the pace of inflation in certain regions, as well as a shift to global monetary easing, contributed to a favorable backdrop, despite persistent geopolitical risk.
•Against this backdrop, security selection in Japan and emerging markets contributed to the fund's performance versus the MS All Country Pacific Index for the fiscal year.
•By sector, security selection was the primary contributor, especially within communication services, where our stock picks in media & entertainment helped most. Stock picking in industrials, primarily within the capital goods industry, and in the consumer discretionary sector also boosted the fund's relative performance.
•The top individual relative contributor was an overweight in Taiwan Semiconductor Manufacturing (+102%). We reduced the position, but it was the fund's biggest holding. The second-largest relative contributor was an overweight in Sea (+164%). Another notable relative contributor was our non-benchmark stake in DouYu International Holdings (+146%). This was a position we established this period.
•In contrast, from a geographical standpoint, security selection in India and Hong Kong detracted from the fund's relative result. A non-benchmark allocation to both the United States and the U.K. hurt as well.
•By sector, the biggest detractor from performance versus the benchmark was security selection in health care, primarily within the pharmaceuticals, biotechnology & life sciences industry. Within the financials sector, an underweight in banks and stock picking in insurance also hampered the fund's result.
•The largest individual relative detractor was our stake in Alibaba Group Holding (-9%). We sold off the stock this period. A second notable relative detractor was an underweight in Meituan (+66%). The stock was not held at period end. An overweight in AIA Group (-6%) also hurt. The company was one of our biggest holdings.
•Notable changes in positioning include decreased exposure to India and a higher allocation to South Korea. By sector, meaningful changes in positioning include increased exposure to communication services and information technology.
How did the Fund perform over the past 10 years?
CUMULATIVE PERFORMANCE
October 31, 2014 through October 31, 2024.
Initial investment of $10,000.
Fidelity® Pacific Basin Fund | $10,000 | $9,971 | $11,173 | $14,102 | $12,235 | $14,972 | $18,558 | $22,285 | $14,461 | $16,784 | $21,601 |
MSCI AC (All Country) Pacific Index | $10,000 | $9,728 | $10,326 | $12,788 | $11,684 | $13,066 | $14,152 | $16,280 | $11,224 | $12,853 | $16,153 |
| | 2014 | 2015 | 2016 | 2017 | 2018 | 2019 | 2020 | 2021 | 2022 | 2023 | 2024 |
AVERAGE ANNUAL TOTAL RETURNS:| | 1 Year | 5 Year | 10 Year |
| Fidelity® Pacific Basin Fund | 28.70% | 7.61% | 8.01% |
| MSCI AC (All Country) Pacific Index | 25.68% | 4.33% | 4.91% |
Visit www.fidelity.com for more recent performance information. |
The Fund's past performance is not a good predictor of the Fund's future performance. The graph and table do not reflect the deduction of taxes that a shareholder would pay on fund distributions or redemption of fund shares. |
Key Fund Statistics(as of October 31, 2024)
KEY FACTS | | |
| Fund Size | $715,685,719 | |
| Number of Holdings | 99 | |
| Total Advisory Fee | $5,231,315 | |
| Portfolio Turnover | 61% | |
What did the Fund invest in?
(as of October 31, 2024)
MARKET SECTORS (% of Fund's net assets) | | |
| Consumer Discretionary | 22.3 | |
| Information Technology | 22.2 | |
| Financials | 15.5 | |
| Communication Services | 12.8 | |
| Industrials | 10.7 | |
| Health Care | 7.0 | |
| Materials | 3.7 | |
| Utilities | 1.6 | |
| Real Estate | 1.4 | |
| Energy | 1.2 | |
| Consumer Staples | 1.1 | |
| |
| Common Stocks | 95.8 |
| Preferred Stocks | 3.7 |
| Short-Term Investments and Net Other Assets (Liabilities) | 0.5 |
ASSET ALLOCATION (% of Fund's net assets) |
|
|
| Japan | 37.6 |
| China | 25.0 |
| Taiwan | 12.1 |
| Korea (South) | 8.7 |
| Australia | 7.5 |
| Hong Kong | 3.1 |
| United States | 1.6 |
| Philippines | 1.4 |
| Singapore | 1.3 |
| Others | 1.7 |
GEOGRAPHIC DIVERSIFICATION (% of Fund's net assets) |
|
| |
|
TOP HOLDINGS(% of Fund's net assets) | | |
| Taiwan Semiconductor Manufacturing Co Ltd | 9.7 | |
| Tencent Holdings Ltd | 4.3 | |
| TAL Education Group Class A ADR | 3.7 | |
| PDD Holdings Inc Class A ADR | 3.1 | |
| Hitachi Ltd | 2.7 | |
| ORIX Corp | 2.5 | |
| AIA Group Ltd | 2.4 | |
| Sony Group Corp | 2.4 | |
| Samsung Electronics Co Ltd | 2.3 | |
| Shin-Etsu Chemical Co Ltd | 2.1 | |
| | 35.2 | |
How has the Fund changed?
This is a summary of certain changes to the Fund since November 1, 2023. For more complete information, you may review the Fund's next prospectus, which we expect to be available by December 30, 2024 at fundresearch.fidelity.com/prospectus/sec or upon request at 1-800-544-8544 or by sending an e-mail to fidfunddocuments@fidelity.com.
The fees associated with this class changed during the reporting year.The variations in class fees are primarily the result of the following changes: - Management fee
- Operating expenses
- Performance adjustment fee
The fund's transfer agent and pricing & bookkeeping fees were changed to a fixed rate effective December 1, 2023, through February 29, 2024, in anticipation of the transition to a new management fee structure. Effective March 1, 2024, the fund's management contract was amended to incorporate administrative services previously covered under separate services agreements (transfer agent and pricing & bookkeeping). The amended contract incorporates a basic fee rate that may vary by class (subject to a performance adjustment). The Adviser or an affiliate pays certain expenses of managing and operating the fund out of each class's management fee. | The fund's sub-advisory agreement with FIL Investments (Japan) Limited was not renewed.
|
| Fidelity, the Fidelity Investments Logo and all other Fidelity trademarks or service marks used herein are trademarks or service marks of FMR LLC. Any third-party marks that are used herein are trademarks or service marks of their respective owners. © 2024 FMR LLC. All rights reserved. |
| | For additional information about the Fund; including its prospectus, financial information, holdings and proxy information, scan the QR code or visit fundresearch.fidelity.com/prospectus/sec 1.9913834.100 302-TSRA-1224 |
| |
| | ANNUAL SHAREHOLDER REPORT | AS OF OCTOBER 31, 2024 | This report describes changes to the Fund that occurred during the reporting period. |
| | Fidelity® Emerging Markets Discovery Fund Fidelity Advisor® Emerging Markets Discovery Fund Class A : FEDAX |
| | | |
This annual shareholder report contains information about Fidelity® Emerging Markets Discovery Fund for the period November 1, 2023 to October 31, 2024. You can find additional information about the Fund at fundresearch.fidelity.com/prospectus/sec. You can also request this information by contacting us at 1-877-208-0098 or by sending an e-mail to fidfunddocuments@fidelity.com.
What were your Fund costs for the last year?(based on hypothetical $10,000 investment)
FUND COST (PREVIOUS YEAR)
| | Costs of a $10,000 investment | Costs paid as a percentage of a $10,000 investment | |
| Class A | $ 138 | 1.29% | |
What affected the Fund's performance this period?
•International stocks achieved a strong gain for the 12 months ending October 31, 2024. Resilient global economic growth and a slowing in the pace of inflation in certain regions, as well as a shift to global monetary easing, contributed to a favorable backdrop, despite persistent geopolitical risk.
•Against this backdrop, an underweight in Emerging Asia, primarily in India, and stock picking and an overweight in Latin America, primarily in Brazil, detracted from the fund's performance versus the MSCI Emerging Markets SMID Index (Net MA) for the fiscal year.
•By sector, security selection was the primary detractor, especially within financials. Also hurting our result were stock picks in health care, primarily within the pharmaceuticals, biotechnology & life sciences industry, and consumer staples.
•The largest individual relative detractor was our stake in Pharmaron Beijing (-48%). The second-largest relative detractor was Hanon Systems (-52%). The stock was not held at period end. Another notable relative detractor was an overweight in Nanya Technology (-34%).
•In contrast, from a regional standpoint, stock selection in Africa, primarily in South Africa, and stock picks and an underweight in the Middle East, primarily in United Arab Emirates, contributed to the fund's relative result.
•By sector, the biggest contributor to performance versus the benchmark was security selection in communication services, primarily within the media & entertainment industry. Stock picks and an underweight in materials and stock selection and an overweight in industrials, primarily within the capital goods industry, also boosted the fund's relative performance.
•The top individual relative contributor was an overweight in International Games System (+243%). This period we decreased our investment in the stock, which was nonetheless one of our largest holdings as of October 31. The second-largest relative contributor was a non-benchmark stake in Hindustan Aeronautics (+136%), where we decreased our investment this period. Another notable relative contributor was an overweight in Bharat Electronics (+111%).
•Notable changes in positioning include increased exposure to Taiwan and South Africa. By sector, meaningful changes in positioning include lower allocations to health care and utilities.
How did the Fund perform over the past 10 years?
CUMULATIVE PERFORMANCE
October 31, 2014 through October 31, 2024.
Initial investment of $10,000 and the current sales charge was paid.
Class A | $9,425 | $8,457 | $9,550 | $11,832 | $9,656 | $11,152 | $11,459 | $15,153 | $11,882 | $13,731 | $15,666 |
MSCI Emerging Markets SMID Cap Index | $10,000 | $8,919 | $9,391 | $11,258 | $9,624 | $10,629 | $10,543 | $14,461 | $10,969 | $12,456 | $15,202 |
MSCI Emerging Markets Index | $10,000 | $8,550 | $9,346 | $11,823 | $10,347 | $11,577 | $12,535 | $14,663 | $10,115 | $11,211 | $14,051 |
| | 2014 | 2015 | 2016 | 2017 | 2018 | 2019 | 2020 | 2021 | 2022 | 2023 | 2024 |
AVERAGE ANNUAL TOTAL RETURNS:| | 1 Year | 5 Year | 10 Year |
| Class A (incl. 5.75% sales charge) | 7.53% | 5.77% | 4.59% |
| Class A (without 5.75% sales charge) | 14.09% | 7.03% | 5.21% |
| MSCI Emerging Markets SMID Cap Index | 22.04% | 7.42% | 4.28% |
| MSCI Emerging Markets Index | 25.33% | 3.95% | 3.46% |
Visit institutional.fidelity.com for more recent performance information. |
The Fund's past performance is not a good predictor of the Fund's future performance. The graph and table do not reflect the deduction of taxes that a shareholder would pay on fund distributions or redemption of fund shares. |
Key Fund Statistics(as of October 31, 2024)
KEY FACTS | | |
| Fund Size | $1,183,237,609 | |
| Number of Holdings | 111 | |
| Total Advisory Fee | $10,611,763 | |
| Portfolio Turnover | 29% | |
What did the Fund invest in?
(as of October 31, 2024)
MARKET SECTORS (% of Fund's net assets) | | |
| Industrials | 21.0 | |
| Consumer Discretionary | 18.3 | |
| Financials | 14.5 | |
| Information Technology | 10.9 | |
| Consumer Staples | 7.8 | |
| Real Estate | 7.4 | |
| Health Care | 4.6 | |
| Materials | 4.6 | |
| Utilities | 3.9 | |
| Energy | 3.3 | |
| Communication Services | 3.2 | |
| |
| Common Stocks | 99.5 |
| Short-Term Investments and Net Other Assets (Liabilities) | 0.5 |
ASSET ALLOCATION (% of Fund's net assets) |
|
|
| China | 21.4 |
| Taiwan | 17.6 |
| India | 13.3 |
| Brazil | 11.7 |
| Korea (South) | 6.2 |
| South Africa | 5.4 |
| Mexico | 4.8 |
| Saudi Arabia | 2.3 |
| Hong Kong | 2.2 |
| Others | 15.1 |
GEOGRAPHIC DIVERSIFICATION (% of Fund's net assets) |
|
| |
|
TOP HOLDINGS(% of Fund's net assets) | | |
| Impala Platinum Holdings Ltd | 1.8 | |
| Shriram Finance Ltd | 1.4 | |
| SITC International Holdings Co Ltd | 1.4 | |
| Bizlink Holding Inc | 1.4 | |
| Yageo Corp | 1.4 | |
| Torrent Pharmaceuticals Ltd | 1.3 | |
| Mr Price Group Ltd | 1.3 | |
| International Games System Co Ltd | 1.3 | |
| Nien Made Enterprise Co Ltd | 1.3 | |
| Coway Co Ltd | 1.3 | |
| | 13.9 | |
How has the Fund changed?
This is a summary of certain changes to the Fund since November 1, 2023. For more complete information, you may review the Fund's next prospectus, which we expect to be available by December 30, 2024 at fundresearch.fidelity.com/prospectus/sec or upon request at 1-877-208-0098 or by sending an e-mail to fidfunddocuments@fidelity.com.
The fees associated with this class changed during the reporting year.The variations in class fees are primarily the result of the following changes: - Management fee
- Operating expenses
The fund's transfer agent and pricing & bookkeeping fees were changed to a fixed rate effective December 1, 2023, through February 29, 2024, in anticipation of the transition to a new management fee structure. Effective March 1, 2024, the fund's management contract was amended to incorporate administrative services previously covered under separate services agreements (transfer agent and pricing & bookkeeping). The amended contract incorporates a management fee rate that may vary by class. The Adviser or an affiliate pays certain expenses of managing and operating the fund out of each class's management fee. | The fund's sub-advisory agreement with FIL Investments (Japan) Limited was not renewed
|
| Fidelity, the Fidelity Investments Logo and all other Fidelity trademarks or service marks used herein are trademarks or service marks of FMR LLC. Any third-party marks that are used herein are trademarks or service marks of their respective owners. © 2024 FMR LLC. All rights reserved. |
| | For additional information about the Fund; including its prospectus, financial information, holdings and proxy information, scan the QR code or visit fundresearch.fidelity.com/prospectus/sec 1.9913974.100 2375-TSRA-1224 |
Item 2.
Code of Ethics
As of the end of the period, October 31, 2024, Fidelity Investment Trust (the trust) has adopted a code of ethics, as defined in Item 2 of Form N-CSR, that applies to its President and Treasurer and its Chief Financial Officer. A copy of the code of ethics is filed as an exhibit to this Form N-CSR.
Item 3.
Audit Committee Financial Expert
The Board of Trustees of the trust has determined that Donald F. Donahue is an audit committee financial expert, as defined in Item 3 of Form N-CSR. Mr. Donahue is independent for purposes of Item 3 of Form N-CSR.
Item 4.
Principal Accountant Fees and Services
Fees and Services
The following table presents fees billed by Deloitte & Touche LLP, the member firms of Deloitte Touche Tohmatsu, and their respective affiliates (collectively, “Deloitte Entities”) in each of the last two fiscal years for services rendered to Fidelity Diversified International Fund, Fidelity Diversified International K6 Fund, Fidelity Global Equity Income Fund, Fidelity International Capital Appreciation Fund, Fidelity International Capital Appreciation K6 Fund, Fidelity International Discovery K6 Fund, Fidelity International Small Cap Fund, Fidelity International Small Cap Opportunities Fund, Fidelity International Value Fund, Fidelity Total International Equity Fund, and Fidelity Worldwide Fund (the “Fund(s)”):
Services Billed by Deloitte Entities
October 31, 2024 FeesA
| | | | |
| Audit Fees | Audit-Related Fees | Tax Fees | All Other Fees |
Fidelity Diversified International Fund | $64,000 | $- | $12,300 | $1,200 |
Fidelity Diversified International K6 Fund | $65,500 | $- | $12,500 | $1,200 |
Fidelity Global Equity Income Fund | $46,900 | $- | $10,000 | $1,100 |
Fidelity International Capital Appreciation Fund | $49,300 | $- | $12,000 | $1,200 |
Fidelity International Capital Appreciation K6 Fund | $49,200 | $- | $11,900 | $1,200 |
Fidelity International Discovery K6 Fund | $61,600 | $- | $12,300 | $1,100 |
Fidelity International Small Cap Fund | $55,800 | $- | $12,000 | $1,300 |
Fidelity International Small Cap Opportunities Fund | $49,700 | $- | $9,700 | $1,200 |
Fidelity International Value Fund | $48,800 | $- | $9,700 | $1,100 |
Fidelity Total International Equity Fund | $52,100 | $- | $11,800 | $1,200 |
Fidelity Worldwide Fund | $49,500 | $- | $9,700 | $1,200 |
| | | | |
| Audit Fees | Audit-Related Fees | Tax Fees | All Other Fees |
Fidelity Diversified International Fund | $53,600 | $0 | $12,300 | $1,400 |
Fidelity Diversified International K6 Fund | $50,700 | $0 | $12,500 | $1,300 |
Fidelity Global Equity Income Fund | $44,500 | $0 | $10,000 | $1,200 |
Fidelity International Capital Appreciation Fund | $49,800 | $0 | $12,000 | $1,300 |
Fidelity International Capital Appreciation K6 Fund | $49,300 | $0 | $11,900 | $1,300 |
Fidelity International Discovery K6 Fund | $46,200 | $0 | $12,300 | $1,200 |
Fidelity International Small Cap Fund | $56,000 | $0 | $12,000 | $1,500 |
Fidelity International Small Cap Opportunities Fund | $49,900 | $0 | $9,700 | $1,300 |
Fidelity International Value Fund | $48,600 | $0 | $9,400 | $1,200 |
Fidelity Total International Equity Fund | $52,300 | $0 | $11,800 | $1,400 |
Fidelity Worldwide Fund | $49,700 | $0 | $9,700 | $1,300 |
A Amounts may reflect rounding.
The following table presents fees billed by PricewaterhouseCoopers LLP (“PwC”) in each of the last two fiscal years for services rendered to Fidelity Canada Fund, Fidelity China Region Fund, Fidelity Emerging Asia Fund, Emerging Markets Discovery Fund, Fidelity Emerging Markets Fund, Fidelity Europe Fund, Fidelity International Discovery
Fund, Fidelity International Growth Fund, Fidelity Japan Fund, Fidelity Japan Smaller Companies Fund, Fidelity Nordic Fund, Fidelity Overseas Fund, and Fidelity Pacific Basin Fund (the “Fund(s)”):
Services Billed by PwC
October 31, 2024 FeesA
| | | | |
| Audit Fees | Audit-Related Fees | Tax Fees | All Other Fees |
Fidelity Canada Fund | $51,200 | $4,700 | $11,500 | $1,600 |
Fidelity China Region Fund | $63,100 | $5,600 | $12,300 | $1,900 |
Fidelity Emerging Asia Fund | $55,200 | $5,000 | $11,500 | $1,700 |
Fidelity Emerging Markets Discovery Fund | $51,600 | $4,700 | $11,500 | $1,600 |
Fidelity Emerging Markets Fund | $59,300 | $4,900 | $11,800 | $1,700 |
Fidelity Europe Fund | $58,700 | $5,300 | $11,500 | $1,800 |
Fidelity International Discovery Fund | $85,500 | $5,800 | $30,900 | $2,000 |
Fidelity International Growth Fund | $50,200 | $4,600 | $11,500 | $1,600 |
Fidelity Japan Fund | $54,000 | $4,900 | $11,500 | $1,700 |
Fidelity Japan Smaller Companies Fund | $45,200 | $4,200 | $11,500 | $1,400 |
Fidelity Nordic Fund | $44,600 | $4,200 | $13,000 | $1,400 |
Fidelity Overseas Fund | $57,500 | $5,200 | $13,400 | $1,800 |
Fidelity Pacific Basin Fund | $54,900 | $5,000 | $13,400 | $1,700 |
| | | | |
| Audit Fees | Audit-Related Fees | Tax Fees | All Other Fees |
Fidelity Canada Fund | $51,400 | $4,700 | $11,500 | $1,600 |
Fidelity China Region Fund | $63,300 | $5,600 | $11,500 | $1,900 |
Fidelity Emerging Asia Fund | $55,400 | $5,000 | $11,500 | $1,700 |
Fidelity Emerging Markets Discovery Fund | $51,700 | $4,700 | $11,500 | $1,600 |
Fidelity Emerging Markets Fund | $54,700 | $5,200 | $12,700 | $1,700 |
Fidelity Europe Fund | $58,900 | $5,300 | $19,900 | $1,800 |
Fidelity International Discovery Fund | $87,400 | $5,900 | $51,500 | $2,000 |
Fidelity International Growth Fund | $50,300 | $4,600 | $16,200 | $1,600 |
Fidelity Japan Fund | $54,200 | $5,000 | $11,500 | $1,700 |
Fidelity Japan Smaller Companies Fund | $45,400 | $4,300 | $11,500 | $1,400 |
Fidelity Nordic Fund | $44,800 | $4,200 | $28,500 | $1,400 |
Fidelity Overseas Fund | $57,600 | $5,300 | $23,700 | $1,800 |
Fidelity Pacific Basin Fund | $55,100 | $5,200 | $14,300 | $1,700 |
A Amounts may reflect rounding.
The following table(s) present(s) fees billed by Deloitte Entities and PwC that were required to be approved by the Audit Committee for services that relate directly to the operations and financial reporting of the Fund(s) and that are rendered on behalf of Fidelity Management & Research Company LLC ("FMR") and entities controlling, controlled by, or under common control with FMR (not including any sub-adviser whose role is primarily portfolio management and is subcontracted with or overseen by another investment adviser) that provide ongoing services to the Fund(s) (“Fund Service Providers”):
Services Billed by Deloitte Entities
| | |
| October 31, 2024A | October 31, 2023A |
Audit-Related Fees | $125,000 | $75,000 |
Tax Fees | $- | $- |
All Other Fees | $2,929,500 | $- |
A Amounts may reflect rounding.
.
Services Billed by PwC
| | |
| October 31, 2024A | October 31, 2023A |
Audit-Related Fees | $9,701,800 | $8,881,200 |
Tax Fees | $61,000 | $1,000 |
All Other Fees | $35,000 | $- |
A Amounts may reflect rounding
B May include amounts billed prior to the Fidelity Sustainable Emerging Markets Equity Fund’s commencement of operations.
“Audit-Related Fees” represent fees billed for assurance and related services that are reasonably related to the performance of the fund audit or the review of the fund's financial statements and that are not reported under Audit Fees.
“Tax Fees” represent fees billed for tax compliance, tax advice or tax planning that relate directly to the operations and financial reporting of the fund.
“All Other Fees” represent fees billed for services provided to the fund or Fund Service Provider, a significant portion of which are assurance related, that relate directly to the operations and financial reporting of the fund, excluding those services that are reported under Audit Fees, Audit-Related Fees or Tax Fees.
Assurance services must be performed by an independent public accountant.
* * *
The aggregate non-audit fees billed by Deloitte Entities and PwC for services rendered to the Fund(s), FMR (not including any sub-adviser whose role is primarily portfolio management and is subcontracted with or overseen by another investment adviser), and any Fund Service Provider for each of the last two fiscal years of the Fund(s) are as follows:
| | |
Billed By | October 31, 2024A | October 31, 2023A |
Deloitte Entities | $3,627,600 | $6,085,300 |
PwC | $15,740,000 | $14,885,800 |
A Amounts may reflect rounding.
The trust's Audit Committee has considered non-audit services that were not pre-approved that were provided by Deloitte Entities and PwC to Fund Service Providers to be compatible with maintaining the independence of Deloitte Entities and PwC in its(their) audit of the Fund(s), taking into account representations from Deloitte Entities and PwC, in accordance with Public Company Accounting Oversight Board rules, regarding its independence from the Fund(s) and its(their) related entities and FMR’s review of the appropriateness and permissibility under applicable law of such non-audit services prior to their provision to the Fund(s) Service Providers.
Audit Committee Pre-Approval Policies and Procedures
The trust’s Audit Committee must pre-approve all audit and non-audit services provided by a fund’s independent registered public accounting firm relating to the operations or
financial reporting of the fund. Prior to the commencement of any audit or non-audit services to a fund, the Audit Committee reviews the services to determine whether they are appropriate and permissible under applicable law.
The Audit Committee has adopted policies and procedures to, among other purposes, provide a framework for the Committee’s consideration of non-audit services by the audit firms that audit the Fidelity funds. The policies and procedures require that any non-audit service provided by a fund audit firm to a Fidelity fund and any non-audit service provided by a fund auditor to a Fund Service Provider that relates directly to the operations and financial reporting of a Fidelity fund (“Covered Service”) are subject to approval by the Audit Committee before such service is provided.
All Covered Services must be approved in advance of provision of the service either: (i) by formal resolution of the Audit Committee, or (ii) by oral or written approval of the service by the Chair of the Audit Committee (or if the Chair is unavailable, such other member of the Audit Committee as may be designated by the Chair to act in the Chair’s absence). The approval contemplated by (ii) above is permitted where the Treasurer determines that action on such an engagement is necessary before the next meeting of the Audit Committee.
Non-audit services provided by a fund audit firm to a Fund Service Provider that do not relate directly to the operations and financial reporting of a Fidelity fund are reported to the Audit Committee periodically.
Non-Audit Services Approved Pursuant to Rule 2-01(c)(7)(i)(C) and (ii) of Regulation S-X (“De Minimis Exception”)
There were no non-audit services approved or required to be approved by the Audit Committee pursuant to the De Minimis Exception during the Fund’s(s’) last two fiscal years relating to services provided to (i) the Fund(s) or (ii) any Fund Service Provider that relate directly to the operations and financial reporting of the Fund(s).
The Registrant has not retained, for the preparation of the audit report on the financial statements included in the Form N-CSR, a registered public accounting firm that has a branch or office that is located in a foreign jurisdiction and that the Public Company Accounting Oversight Board (the “PCAOB”) has determined that the PCAOB is unable to inspect or investigate completely because of a position taken by an authority in the foreign jurisdiction.
The Registrant is not a “foreign issuer,” as defined in 17 CFR 240.3b-4.
Item 5.
Audit Committee of Listed Registrants
Not applicable.
Item 6.
Investments
(a)
Not applicable.
(b)
Not applicable.
Item 7.
Financial Statements and Financial Highlights for Open-End Management Investment Companies
Fidelity's Targeted International Equity Funds®
Fidelity® Canada Fund
Fidelity® China Region Fund
Fidelity® Emerging Asia Fund
Fidelity® Emerging Markets Fund
Fidelity® Europe Fund
Fidelity® Japan Fund
Fidelity® Japan Smaller Companies Fund
Fidelity® Nordic Fund
Fidelity® Pacific Basin Fund
Annual Report
October 31, 2024
Includes Fidelity and Fidelity Advisor share classes
Contents
To view a fund's proxy voting guidelines and proxy voting record for the 12-month period ended June 30, visit http://www.fidelity.com/proxyvotingresults or visit the Securities and Exchange Commission's (SEC) web site at http://www.sec.gov.
You may also call 1-800-544-8544 if you're an individual investing directly with Fidelity, call 1-800-835-5092 if you're a plan sponsor or participant with Fidelity as your recordkeeper or call 1-877-208-0098 on institutional accounts or if you're an advisor or invest through one to request a free copy of the proxy voting guidelines.
Standard & Poor's, S&P and S&P 500 are registered service marks of The McGraw-Hill Companies, Inc. and have been licensed for use by Fidelity Distributors Corporation.
Other third-party marks appearing herein are the property of their respective owners.
All other marks appearing herein are registered or unregistered trademarks or service marks of FMR LLC or an affiliated company. © 2024 FMR LLC. All rights reserved.
This report and the financial statements contained herein are submitted for the general information of the shareholders of the Funds. This report is not authorized for distribution to prospective investors in the Funds unless preceded or accompanied by an effective prospectus.
A fund files its complete schedule of portfolio holdings with the SEC for the first and third quarters of each fiscal year on Form N-PORT. Forms N-PORT are available on the SEC's web site at http://www.sec.gov. A fund's Forms N-PORT may be reviewed and copied at the SEC's Public Reference Room in Washington, DC. Information regarding the operation of the SEC's Public Reference Room may be obtained by calling 1-800-SEC-0330.
For a complete list of a fund's portfolio holdings, view the most recent holdings listing, semiannual report, or annual report on Fidelity's web site at http://www.fidelity.com, http://www.institutional.fidelity.com, or http://www.401k.com, as applicable.
NOT FDIC INSURED •MAY LOSE VALUE •NO BANK GUARANTEE
Neither the Funds nor Fidelity Distributors Corporation is a bank.
Item 7: Financial Statements and Financial Highlights for Open-End Management Investment Companies (Annual Report)
Schedule of Investments October 31, 2024
Showing Percentage of Net Assets
| Common Stocks - 99.3% |
| | | Shares | Value ($) |
| COMMUNICATION SERVICES - 2.8% | | | |
| Diversified Telecommunication Services - 1.8% | | | |
| Quebecor, Inc.: | | | |
| Class A | | 341,900 | 8,348,907 |
| Class B (sub. vtg.) | | 136,600 | 3,401,388 |
| TELUS Corp. | | 333,500 | 5,271,904 |
| | | | 17,022,199 |
| Wireless Telecommunication Services - 1.0% | | | |
| Rogers Communications, Inc. Class B (non-vtg.) | | 261,700 | 9,504,915 |
TOTAL COMMUNICATION SERVICES | | | 26,527,114 |
| CONSUMER DISCRETIONARY - 7.0% | | | |
| Broadline Retail - 3.4% | | | |
| Dollarama, Inc. | | 307,100 | 31,957,280 |
| Hotels, Restaurants & Leisure - 2.0% | | | |
| Restaurant Brands International, Inc. | | 263,300 | 18,312,904 |
| Specialty Retail - 1.5% | | | |
| Aritzia, Inc. (a) | | 185,600 | 5,975,831 |
| Diversified Royalty Corp. (b) | | 1,909,400 | 4,059,198 |
| Pet Valu Holdings Ltd. | | 223,700 | 4,092,103 |
| | | | 14,127,132 |
| Textiles, Apparel & Luxury Goods - 0.1% | | | |
| Canada Goose Holdings, Inc. (a)(b) | | 133,576 | 1,314,318 |
TOTAL CONSUMER DISCRETIONARY | | | 65,711,634 |
| CONSUMER STAPLES - 8.6% | | | |
| Beverages - 0.0% | | | |
| GURU Organic Energy Corp. (a) | | 322,600 | 373,028 |
| Consumer Staples Distribution & Retail - 8.1% | | | |
| Alimentation Couche-Tard, Inc. (multi-vtg.) | | 889,900 | 46,407,612 |
| Metro, Inc. | | 353,495 | 20,993,645 |
| North West Co., Inc. | | 242,400 | 9,124,275 |
| | | | 76,525,532 |
| Personal Care Products - 0.5% | | | |
| Jamieson Wellness, Inc. (c) | | 186,100 | 4,433,466 |
TOTAL CONSUMER STAPLES | | | 81,332,026 |
| ENERGY - 17.5% | | | |
| Energy Equipment & Services - 0.6% | | | |
| Pason Systems, Inc. | | 588,400 | 5,692,353 |
| Oil, Gas & Consumable Fuels - 16.9% | | | |
| Cameco Corp. | | 243,300 | 12,714,122 |
| Canadian Natural Resources Ltd. | | 1,309,396 | 44,528,962 |
| Enbridge, Inc. | | 162,400 | 6,559,684 |
| MEG Energy Corp. | | 142,200 | 2,599,196 |
| Parkland Corp. | | 383,183 | 8,916,673 |
| PrairieSky Royalty Ltd. (b) | | 1,855,318 | 37,123,683 |
| South Bow Corp. | | 547,000 | 13,659,777 |
| Suncor Energy, Inc. | | 874,800 | 33,022,938 |
| | | | 159,125,035 |
TOTAL ENERGY | | | 164,817,388 |
| FINANCIALS - 27.5% | | | |
| Banks - 14.0% | | | |
| Bank of Montreal | | 242,400 | 22,089,067 |
| Royal Bank of Canada | | 668,300 | 80,823,814 |
| The Toronto-Dominion Bank | | 525,900 | 29,072,089 |
| | | | 131,984,970 |
| Capital Markets - 6.1% | | | |
| Brookfield Asset Management Ltd. Class A | | 379,201 | 20,118,202 |
| Brookfield Corp. (Canada) Class A | | 395,306 | 20,961,283 |
| TMX Group Ltd. | | 517,200 | 16,154,723 |
| | | | 57,234,208 |
| Insurance - 7.4% | | | |
| Definity Financial Corp. | | 437,913 | 16,898,815 |
| Intact Financial Corp. | | 133,425 | 25,480,452 |
| Sun Life Financial, Inc. | | 490,500 | 27,196,179 |
| | | | 69,575,446 |
TOTAL FINANCIALS | | | 258,794,624 |
| HEALTH CARE - 0.7% | | | |
| Health Care Providers & Services - 0.7% | | | |
| Andlauer Healthcare Group, Inc. (b) | | 211,159 | 6,228,535 |
| INDUSTRIALS - 13.0% | | | |
| Commercial Services & Supplies - 2.2% | | | |
| GFL Environmental, Inc. | | 503,400 | 21,060,114 |
| Ground Transportation - 7.8% | | | |
| Canadian National Railway Co. | | 179,350 | 19,366,734 |
| Canadian Pacific Kansas City Ltd. | | 698,862 | 53,912,283 |
| | | | 73,279,017 |
| Professional Services - 3.0% | | | |
| Thomson Reuters Corp. | | 173,700 | 28,432,482 |
TOTAL INDUSTRIALS | | | 122,771,613 |
| INFORMATION TECHNOLOGY - 11.1% | | | |
| Electronic Equipment, Instruments & Components - 0.4% | | | |
| Celestica, Inc. (sub. vtg.) (a) | | 55,500 | 3,797,924 |
| IT Services - 3.4% | | | |
| Shopify, Inc. Class A (a) | | 408,400 | 31,948,094 |
| Software - 7.3% | | | |
| ApplyBoard, Inc. (a)(d)(e) | | 1,677 | 52,809 |
| ApplyBoard, Inc. (non-vtg.) (a)(d)(e) | | 414 | 13,037 |
| Computer Modelling Group Ltd. | | 415,600 | 3,414,705 |
| Constellation Software, Inc. | | 17,500 | 52,776,385 |
| Constellation Software, Inc. warrants 3/31/40 (a)(e) | | 19,300 | 1 |
| Dye & Durham Ltd. (b) | | 742,200 | 10,149,379 |
| Lumine Group, Inc. (a) | | 125,207 | 2,915,367 |
| | | | 69,321,683 |
TOTAL INFORMATION TECHNOLOGY | | | 105,067,701 |
| MATERIALS - 11.1% | | | |
| Chemicals - 1.8% | | | |
| Nutrien Ltd. | | 351,481 | 16,759,309 |
| Containers & Packaging - 1.3% | | | |
| CCL Industries, Inc.: | | | |
| Class A | | 25,900 | 1,497,246 |
| Class B | | 185,000 | 10,791,611 |
| | | | 12,288,857 |
| Metals & Mining - 7.4% | | | |
| Franco-Nevada Corp. | | 264,600 | 35,122,902 |
| Lundin Mining Corp. | | 693,800 | 6,746,904 |
| Triple Flag Precious Metals Corp. | | 182,800 | 3,132,551 |
| Wheaton Precious Metals Corp. | | 370,100 | 24,441,193 |
| | | | 69,443,550 |
| Paper & Forest Products - 0.6% | | | |
| Stella-Jones, Inc. | | 103,123 | 6,234,707 |
TOTAL MATERIALS | | | 104,726,423 |
| TOTAL COMMON STOCKS (Cost $469,797,061) | | | 935,977,058 |
| | | | |
| Nonconvertible Preferred Stocks - 0.0% |
| | | Shares | Value ($) |
| INFORMATION TECHNOLOGY - 0.0% | | | |
| Software - 0.0% | | | |
| ApplyBoard, Inc.: | | | |
| Series A1 (a)(d)(e) | | 2,063 | 65,108 |
| Series A2 (a)(d)(e) | | 1,615 | 51,002 |
| Series A3 (a)(d)(e) | | 92 | 2,907 |
| Series D (a)(d)(e) | | 4,504 | 209,886 |
| Series Seed (a)(d)(e) | | 617 | 19,442 |
| (Cost $770,130) | | | 348,345 |
| | | | |
| Convertible Bonds - 0.2% |
| | | Principal Amount (f) | Value ($) |
| COMMUNICATION SERVICES - 0.2% | | | |
| Entertainment - 0.2% | | | |
Cineplex, Inc. 7.75% 3/1/30 (c) (Cost $1,478,413) | CAD | 2,190,000 | 1,903,185 |
| | | | |
| Money Market Funds - 0.9% |
| | | Shares | Value ($) |
| Fidelity Cash Central Fund 4.87% (g) | | 718,261 | 718,404 |
| Fidelity Securities Lending Cash Central Fund 4.87% (g)(h) | | 7,294,376 | 7,295,105 |
| TOTAL MONEY MARKET FUNDS (Cost $8,013,509) | | | 8,013,509 |
| | | | |
| TOTAL INVESTMENT IN SECURITIES - 100.4% (Cost $480,059,113) | 946,242,097 |
NET OTHER ASSETS (LIABILITIES) - (0.4)% | (3,765,179) |
| NET ASSETS - 100.0% | 942,476,918 |
| | |
Currency Abbreviations
Legend
| (b) | Security or a portion of the security is on loan at period end. |
| (c) | Security exempt from registration under Rule 144A of the Securities Act of 1933. These securities may be resold in transactions exempt from registration, normally to qualified institutional buyers. At the end of the period, the value of these securities amounted to $6,336,651 or 0.7% of net assets. |
| (d) | Restricted securities (including private placements) - Investment in securities not registered under the Securities Act of 1933 (excluding 144A issues). At the end of the period, the value of restricted securities (excluding 144A issues) amounted to $414,191 or 0.0% of net assets. |
| (f) | Amount is stated in United States dollars unless otherwise noted. |
| (g) | Affiliated fund that is generally available only to investment companies and other accounts managed by Fidelity Investments. The rate quoted is the annualized seven-day yield of the fund at period end. A complete unaudited listing of the fund's holdings as of its most recent quarter end is available upon request. In addition, each Fidelity Central Fund's financial statements, which are not covered by the Fund's Report of Independent Registered Public Accounting Firm, are available on the SEC's website or upon request. |
| (h) | Investment made with cash collateral received from securities on loan. |
| Additional information on each restricted holding is as follows: |
| Security | Acquisition Date | Acquisition Cost ($) |
| ApplyBoard, Inc. | 6/04/21 - 6/30/21 | 85,688 |
| | | |
| ApplyBoard, Inc. (non-vtg.) | 6/30/21 | 44,290 |
| | | |
| ApplyBoard, Inc. Series A1 | 6/04/21 | 133,582 |
| | | |
| ApplyBoard, Inc. Series A2 | 6/04/21 | 104,573 |
| | | |
| ApplyBoard, Inc. Series A3 | 6/04/21 | 5,957 |
| | | |
| ApplyBoard, Inc. Series D | 6/04/21 | 486,066 |
| | | |
| ApplyBoard, Inc. Series Seed | 6/04/21 | 39,952 |
| | | |
Affiliated Central Funds
Fiscal year to date information regarding the Fund's investments in Fidelity Central Funds, including the ownership percentage, is presented below.
| Affiliate | Value, beginning of period ($) | Purchases ($) | Sales Proceeds ($) | Dividend Income ($) | Realized Gain (loss) ($) | Change in Unrealized appreciation (depreciation) ($) | Value, end of period ($) | % ownership, end of period |
| Fidelity Cash Central Fund 4.87% | 373,341 | 55,951,251 | 55,606,127 | 28,055 | (61) | - | 718,404 | 0.0% |
| Fidelity Securities Lending Cash Central Fund 4.87% | 22,380,495 | 871,920,860 | 887,006,250 | 229,543 | - | - | 7,295,105 | 0.0% |
| Total | 22,753,836 | 927,872,111 | 942,612,377 | 257,598 | (61) | - | 8,013,509 | |
| | | | | | | | | |
Amounts in the dividend income column in the above table include any capital gain distributions from underlying funds, which are presented in the corresponding line item in the Statement of Operations, if applicable.
Amounts in the dividend income column for Fidelity Securities Lending Cash Central Fund represents the income earned on investing cash collateral, less rebates paid to borrowers and any lending agent fees associated with the loan, plus any premium payments received for lending certain types of securities.
Amounts included in the purchases and sales proceeds columns may include in-kind transactions, if applicable.
Investment Valuation
The following is a summary of the inputs used, as of October 31, 2024, involving the Fund's assets and liabilities carried at fair value. The inputs or methodology used for valuing securities may not be an indication of the risk associated with investing in those securities. For more information on valuation inputs, and their aggregation into the levels used below, please refer to the Investment Valuation section in the accompanying Notes to Financial Statements.
| Valuation Inputs at Reporting Date: |
| Description | Total ($) | Level 1 ($) | Level 2 ($) | Level 3 ($) |
Investments in Securities: | | | | |
|
| Equities: | | | | |
Communication Services | 26,527,114 | 26,527,114 | - | - |
Consumer Discretionary | 65,711,634 | 65,711,634 | - | - |
Consumer Staples | 81,332,026 | 81,332,026 | - | - |
Energy | 164,817,388 | 164,817,388 | - | - |
Financials | 258,794,624 | 258,794,624 | - | - |
Health Care | 6,228,535 | 6,228,535 | - | - |
Industrials | 122,771,613 | 122,771,613 | - | - |
Information Technology | 105,416,046 | 105,001,854 | - | 414,192 |
Materials | 104,726,423 | 104,726,423 | - | - |
|
| Corporate Bonds | 1,903,185 | - | 1,903,185 | - |
|
| Money Market Funds | 8,013,509 | 8,013,509 | - | - |
| Total Investments in Securities: | 946,242,097 | 943,924,720 | 1,903,185 | 414,192 |
Fidelity® Canada Fund
Financial Statements
| Statement of Assets and Liabilities |
As of October 31, 2024 |
| Assets | | | | |
| Investment in securities, at value (including securities loaned of $6,792,133) - See accompanying schedule: | | | | |
Unaffiliated issuers (cost $472,045,604) | $ | 938,228,588 | | |
Fidelity Central Funds (cost $8,013,509) | | 8,013,509 | | |
| | | | | |
| | | | | |
| Total Investment in Securities (cost $480,059,113) | | | $ | 946,242,097 |
| Foreign currency held at value (cost $1,343,912) | | | | 1,332,486 |
| Receivable for fund shares sold | | | | 2,468,133 |
| Dividends receivable | | | | 1,054,221 |
| Interest receivable | | | | 10,687 |
| Distributions receivable from Fidelity Central Funds | | | | 12,382 |
| Prepaid expenses | | | | 1,089 |
| Other receivables | | | | 97,518 |
Total assets | | | | 951,218,613 |
| Liabilities | | | | |
| Payable for fund shares redeemed | $ | 599,337 | | |
| Accrued management fee | | 773,773 | | |
| Distribution and service plan fees payable | | 10,347 | | |
| Other payables and accrued expenses | | 66,707 | | |
| Collateral on securities loaned | | 7,291,531 | | |
| Total liabilities | | | | 8,741,695 |
| Net Assets | | | $ | 942,476,918 |
| Net Assets consist of: | | | | |
| Paid in capital | | | $ | 419,437,039 |
| Total accumulated earnings (loss) | | | | 523,039,879 |
| Net Assets | | | $ | 942,476,918 |
| | | | | |
| Net Asset Value and Maximum Offering Price | | | | |
| Class A : | | | | |
Net Asset Value and redemption price per share ($31,400,743 ÷ 444,615 shares)(a) | | | $ | 70.62 |
| Maximum offering price per share (100/94.25 of $70.62) | | | $ | 74.93 |
| Class M : | | | | |
Net Asset Value and redemption price per share ($6,946,202 ÷ 98,908 shares)(a) | | | $ | 70.23 |
| Maximum offering price per share (100/96.50 of $70.23) | | | $ | 72.78 |
| Class C : | | | | |
Net Asset Value and offering price per share ($758,965 ÷ 10,910 shares)(a) | | | $ | 69.57 |
| Canada : | | | | |
Net Asset Value, offering price and redemption price per share ($877,615,241 ÷ 12,355,286 shares) | | | $ | 71.03 |
| Class I : | | | | |
Net Asset Value, offering price and redemption price per share ($19,072,348 ÷ 268,270 shares) | | | $ | 71.09 |
| Class Z : | | | | |
Net Asset Value, offering price and redemption price per share ($6,683,419 ÷ 94,342 shares) | | | $ | 70.84 |
(a)Redemption price per share is equal to net asset value less any applicable contingent deferred sales charge. |
| Statement of Operations |
| Year ended October 31, 2024 |
| Investment Income | | | | |
| Dividends | | | $ | 21,829,144 |
| Interest | | | | 60,622 |
| Income from Fidelity Central Funds (including $229,543 from security lending) | | | | 257,598 |
| Income before foreign taxes withheld | | | $ | 22,147,364 |
| Less foreign taxes withheld | | | | (3,375,393) |
| Total income | | | | 18,771,971 |
| Expenses | | | | |
| Management fee | | | | |
| Basic fee | $ | 7,159,516 | | |
| Performance adjustment | | 1,664,010 | | |
| Transfer agent fees | | 509,686 | | |
| Distribution and service plan fees | | 121,853 | | |
| Accounting fees | | 135,482 | | |
| Custodian fees and expenses | | 20,902 | | |
| Independent trustees' fees and expenses | | 4,150 | | |
| Registration fees | | 81,530 | | |
| Audit fees | | 64,504 | | |
| Legal | | 3,358 | | |
| Miscellaneous | | 18,642 | | |
| Total expenses before reductions | | 9,783,633 | | |
| Expense reductions | | (40,765) | | |
| Total expenses after reductions | | | | 9,742,868 |
| Net Investment income (loss) | | | | 9,029,103 |
| Realized and Unrealized Gain (Loss) | | | | |
| Net realized gain (loss) on: | | | | |
| Investment Securities: | | | | |
| Unaffiliated issuers | | 56,961,371 | | |
| Fidelity Central Funds | | (61) | | |
| Foreign currency transactions | | (63,684) | | |
| Total net realized gain (loss) | | | | 56,897,626 |
| Change in net unrealized appreciation (depreciation) on: | | | | |
| Investment Securities: | | | | |
| Unaffiliated issuers | | 144,547,793 | | |
| Assets and liabilities in foreign currencies | | (13,188) | | |
| Total change in net unrealized appreciation (depreciation) | | | | 144,534,605 |
| Net gain (loss) | | | | 201,432,231 |
| Net increase (decrease) in net assets resulting from operations | | | $ | 210,461,334 |
| Statement of Changes in Net Assets |
| |
| | Year ended October 31, 2024 | | Year ended October 31, 2023 |
| Increase (Decrease) in Net Assets | | | | |
| Operations | | | | |
| Net investment income (loss) | $ | 9,029,103 | $ | 11,119,448 |
| Net realized gain (loss) | | 56,897,626 | | 20,915,338 |
| Change in net unrealized appreciation (depreciation) | | 144,534,605 | | (17,873,688) |
| Net increase (decrease) in net assets resulting from operations | | 210,461,334 | | 14,161,098 |
| Distributions to shareholders | | (30,159,569) | | (34,966,270) |
| | | | | |
| Share transactions - net increase (decrease) | | (60,797,616) | | (43,174,882) |
| | | | | |
| Total increase (decrease) in net assets | | 119,504,149 | | (63,980,054) |
| | | | | |
| Net Assets | | | | |
| Beginning of period | | 822,972,769 | | 886,952,823 |
| End of period | $ | 942,476,918 | $ | 822,972,769 |
| | | | | |
| | | | | |
Financial Highlights
Fidelity Advisor® Canada Fund Class A |
| |
| Years ended October 31, | | 2024 | | 2023 | | 2022 | | 2021 | | 2020 |
Selected Per-Share Data | | | | | | | | | | |
| Net asset value, beginning of period | $ | 57.80 | $ | 59.44 | $ | 67.23 | $ | 46.01 | $ | 51.95 |
| Income from Investment Operations | | | | | | | | | | |
Net investment income (loss) A,B | | .47 | | .57 | | .63 | | .55 | | .61 |
| Net realized and unrealized gain (loss) | | 14.32 | | (.01) C | | (5.30) | | 21.89 | | (4.38) |
| Total from investment operations | | 14.79 | | .56 | | (4.67) | | 22.44 | | (3.77) |
| Distributions from net investment income | | (.65) | | (.68) | | (.61) | | (.63) | | (.77) |
| Distributions from net realized gain | | (1.31) | | (1.52) | | (2.51) | | (.59) | | (1.40) |
| Total distributions | | (1.97) D | | (2.20) | | (3.12) | | (1.22) | | (2.17) |
| Net asset value, end of period | $ | 70.62 | $ | 57.80 | $ | 59.44 | $ | 67.23 | $ | 46.01 |
Total Return E,F | | | | .88% | | (7.06)% | | 49.45% | | (7.70)% |
Ratios to Average Net Assets B,G,H | | | | | | | | | | |
| Expenses before reductions | | 1.34% | | 1.36% | | 1.20% | | 1.12% | | 1.20% |
| Expenses net of fee waivers, if any | | | | 1.36% | | 1.20% | | 1.12% | | 1.20% |
| Expenses net of all reductions | | 1.33% | | 1.35% | | 1.20% | | 1.12% | | 1.19% |
| Net investment income (loss) | | .70% | | .94% | | 1.00% | | .92% | | 1.27% |
| Supplemental Data | | | | | | | | | | |
| Net assets, end of period (000 omitted) | $ | 31,401 | $ | 28,548 | $ | 31,707 | $ | 33,087 | $ | 23,395 |
Portfolio turnover rate I | | | | 9% | | 13% | | 7% | | 11% |
ACalculated based on average shares outstanding during the period.
BNet investment income (loss) is affected by the timing of the declaration of dividends by any underlying mutual funds or exchange-traded funds (ETFs). Net investment income (loss) of any mutual funds or ETFs is not included in the Fund's net investment income (loss) ratio.
CThe amount shown for a share outstanding does not correspond with the aggregate net gain (loss) on investments for the period due to the timing of sales and repurchases of shares in relation to fluctuating market values of the investments of the Fund.
DTotal distributions per share do not sum due to rounding.
ETotal returns would have been lower if certain expenses had not been reduced during the applicable periods shown.
FTotal returns do not include the effect of the sales charges.
GFees and expenses of any underlying mutual funds or exchange-traded funds (ETFs) are not included in the Fund's expense ratio. The Fund indirectly bears its proportionate share of these expenses. For additional expense information related to investments in Fidelity Central Funds, please refer to the "Investments in Fidelity Central Funds" note found in the Notes to Financial Statements section of the most recent Annual or Semi-Annual report.
HExpense ratios reflect operating expenses of the class. Expenses before reductions do not reflect amounts reimbursed, waived, or reduced through arrangements with the investment adviser, brokerage services, or other offset arrangements, if applicable, and do not represent the amount paid by the class during periods when reimbursements, waivers or reductions occur.
IAmount does not include the portfolio activity of any underlying mutual funds or exchange-traded funds (ETFs).
Fidelity Advisor® Canada Fund Class M |
| |
| Years ended October 31, | | 2024 | | 2023 | | 2022 | | 2021 | | 2020 |
Selected Per-Share Data | | | | | | | | | | |
| Net asset value, beginning of period | $ | 57.49 | $ | 59.09 | $ | 66.84 | $ | 45.74 | $ | 51.67 |
| Income from Investment Operations | | | | | | | | | | |
Net investment income (loss) A,B | | .30 | | .41 | | .45 | | .38 | | .47 |
| Net realized and unrealized gain (loss) | | 14.25 | | - C | | (5.26) | | 21.78 | | (4.36) |
| Total from investment operations | | 14.55 | | .41 | | (4.81) | | 22.16 | | (3.89) |
| Distributions from net investment income | | (.50) | | (.49) | | (.42) | | (.47) | | (.64) |
| Distributions from net realized gain | | (1.31) | | (1.52) | | (2.51) | | (.59) | | (1.40) |
| Total distributions | | (1.81) | | (2.01) | | (2.94) D | | (1.06) | | (2.04) |
| Net asset value, end of period | $ | 70.23 | $ | 57.49 | $ | 59.09 | $ | 66.84 | $ | 45.74 |
Total Return E,F | | | | .62% | | (7.32)% | | 49.04% | | (7.95)% |
Ratios to Average Net Assets B,G,H | | | | | | | | | | |
| Expenses before reductions | | 1.59% | | 1.63% | | 1.48% | | 1.40% | | 1.47% |
| Expenses net of fee waivers, if any | | | | 1.63% | | 1.48% | | 1.39% | | 1.47% |
| Expenses net of all reductions | | 1.58% | | 1.62% | | 1.48% | | 1.39% | | 1.47% |
| Net investment income (loss) | | .45% | | .68% | | .72% | | .64% | | .99% |
| Supplemental Data | | | | | | | | | | |
| Net assets, end of period (000 omitted) | $ | 6,946 | $ | 6,255 | $ | 6,641 | $ | 7,829 | $ | 5,911 |
Portfolio turnover rate I | | | | 9% | | 13% | | 7% | | 11% |
ACalculated based on average shares outstanding during the period.
BNet investment income (loss) is affected by the timing of the declaration of dividends by any underlying mutual funds or exchange-traded funds (ETFs). Net investment income (loss) of any mutual funds or ETFs is not included in the Fund's net investment income (loss) ratio.
CAmount represents less than $.005 per share.
DTotal distributions per share do not sum due to rounding.
ETotal returns would have been lower if certain expenses had not been reduced during the applicable periods shown.
FTotal returns do not include the effect of the sales charges.
GFees and expenses of any underlying mutual funds or exchange-traded funds (ETFs) are not included in the Fund's expense ratio. The Fund indirectly bears its proportionate share of these expenses. For additional expense information related to investments in Fidelity Central Funds, please refer to the "Investments in Fidelity Central Funds" note found in the Notes to Financial Statements section of the most recent Annual or Semi-Annual report.
HExpense ratios reflect operating expenses of the class. Expenses before reductions do not reflect amounts reimbursed, waived, or reduced through arrangements with the investment adviser, brokerage services, or other offset arrangements, if applicable, and do not represent the amount paid by the class during periods when reimbursements, waivers or reductions occur.
IAmount does not include the portfolio activity of any underlying mutual funds or exchange-traded funds (ETFs).
Fidelity Advisor® Canada Fund Class C |
| |
| Years ended October 31, | | 2024 | | 2023 | | 2022 | | 2021 | | 2020 |
Selected Per-Share Data | | | | | | | | | | |
| Net asset value, beginning of period | $ | 56.91 | $ | 58.39 | $ | 65.76 | $ | 44.96 | $ | 50.61 |
| Income from Investment Operations | | | | | | | | | | |
Net investment income (loss) A,B | | (.03) | | .10 | | .14 | | .08 | | .24 |
| Net realized and unrealized gain (loss) | | 14.15 | | - C | | (5.19) | | 21.46 | | (4.31) |
| Total from investment operations | | 14.12 | | .10 | | (5.05) | | 21.54 | | (4.07) |
| Distributions from net investment income | | (.15) | | (.05) | | - | | (.15) | | (.18) |
| Distributions from net realized gain | | (1.31) | | (1.52) | | (2.32) | | (.59) | | (1.40) |
| Total distributions | | (1.46) | | (1.58) D | | (2.32) | | (.74) | | (1.58) |
| Net asset value, end of period | $ | 69.57 | $ | 56.91 | $ | 58.39 | $ | 65.76 | $ | 44.96 |
Total Return E,F | | | | .10% | | (7.79)% | | 48.31% | | (8.39)% |
Ratios to Average Net Assets A,G,H | | | | | | | | | | |
| Expenses before reductions | | 2.09% | | 2.14% | | 1.99% | | 1.90% | | 1.95% |
| Expenses net of fee waivers, if any | | | | 2.13% | | 1.98% | | 1.90% | | 1.95% |
| Expenses net of all reductions | | 2.09% | | 2.13% | | 1.98% | | 1.90% | | 1.95% |
| Net investment income (loss) | | (.05)% | | .16% | | .22% | | .14% | | .51% |
| Supplemental Data | | | | | | | | | | |
| Net assets, end of period (000 omitted) | $ | 759 | $ | 844 | $ | 1,109 | $ | 1,683 | $ | 3,151 |
Portfolio turnover rate I | | | | 9% | | 13% | | 7% | | 11% |
ANet investment income (loss) is affected by the timing of the declaration of dividends by any underlying mutual funds or exchange-traded funds (ETFs). Net investment income (loss) of any mutual funds or ETFs is not included in the Fund's net investment income (loss) ratio.
BCalculated based on average shares outstanding during the period.
CAmount represents less than $.005 per share.
DTotal distributions per share do not sum due to rounding.
ETotal returns would have been lower if certain expenses had not been reduced during the applicable periods shown.
FTotal returns do not include the effect of the contingent deferred sales charge.
GFees and expenses of any underlying mutual funds or exchange-traded funds (ETFs) are not included in the Fund's expense ratio. The Fund indirectly bears its proportionate share of these expenses. For additional expense information related to investments in Fidelity Central Funds, please refer to the "Investments in Fidelity Central Funds" note found in the Notes to Financial Statements section of the most recent Annual or Semi-Annual report.
HExpense ratios reflect operating expenses of the class. Expenses before reductions do not reflect amounts reimbursed, waived, or reduced through arrangements with the investment adviser, brokerage services, or other offset arrangements, if applicable, and do not represent the amount paid by the class during periods when reimbursements, waivers or reductions occur.
IAmount does not include the portfolio activity of any underlying mutual funds or exchange-traded funds (ETFs).
| Years ended October 31, | | 2024 | | 2023 | | 2022 | | 2021 | | 2020 |
Selected Per-Share Data | | | | | | | | | | |
| Net asset value, beginning of period | $ | 58.14 | $ | 59.79 | $ | 67.62 | $ | 46.26 | $ | 52.21 |
| Income from Investment Operations | | | | | | | | | | |
Net investment income (loss) A,B | | .66 | | .77 | | .83 | | .74 | | .76 |
| Net realized and unrealized gain (loss) | | 14.40 | | (.03) C | | (5.33) | | 21.99 | | (4.38) |
| Total from investment operations | | 15.06 | | .74 | | (4.50) | | 22.73 | | (3.62) |
| Distributions from net investment income | | (.86) | | (.87) | | (.82) | | (.78) | | (.92) |
| Distributions from net realized gain | | (1.31) | | (1.52) | | (2.51) | | (.59) | | (1.40) |
| Total distributions | | (2.17) | | (2.39) | | (3.33) | | (1.37) | | (2.33) D |
| Net asset value, end of period | $ | 71.03 | $ | 58.14 | $ | 59.79 | $ | 67.62 | $ | 46.26 |
Total Return E | | | | 1.18% | | (6.77)% | | 49.91% | | (7.40)% |
Ratios to Average Net Assets B,F,G | | | | | | | | | | |
| Expenses before reductions | | 1.05% | | 1.05% | | .89% | | .80% | | .88% |
| Expenses net of fee waivers, if any | | | | 1.04% | | .88% | | .80% | | .88% |
| Expenses net of all reductions | | 1.04% | | 1.04% | | .88% | | .80% | | .88% |
| Net investment income (loss) | | .99% | | 1.25% | | 1.32% | | 1.24% | | 1.58% |
| Supplemental Data | | | | | | | | | | |
| Net assets, end of period (000 omitted) | $ | 877,615 | $ | 774,062 | $ | 825,488 | $ | 821,617 | $ | 612,716 |
Portfolio turnover rate H | | | | 9% | | 13% | | 7% | | 11% |
ACalculated based on average shares outstanding during the period.
BNet investment income (loss) is affected by the timing of the declaration of dividends by any underlying mutual funds or exchange-traded funds (ETFs). Net investment income (loss) of any mutual funds or ETFs is not included in the Fund's net investment income (loss) ratio.
CThe amount shown for a share outstanding does not correspond with the aggregate net gain (loss) on investments for the period due to the timing of sales and repurchases of shares in relation to fluctuating market values of the investments of the Fund.
DTotal distributions per share do not sum due to rounding.
ETotal returns would have been lower if certain expenses had not been reduced during the applicable periods shown.
FFees and expenses of any underlying mutual funds or exchange-traded funds (ETFs) are not included in the Fund's expense ratio. The Fund indirectly bears its proportionate share of these expenses. For additional expense information related to investments in Fidelity Central Funds, please refer to the "Investments in Fidelity Central Funds" note found in the Notes to Financial Statements section of the most recent Annual or Semi-Annual report.
GExpense ratios reflect operating expenses of the class. Expenses before reductions do not reflect amounts reimbursed, waived, or reduced through arrangements with the investment adviser, brokerage services, or other offset arrangements, if applicable, and do not represent the amount paid by the class during periods when reimbursements, waivers or reductions occur.
HAmount does not include the portfolio activity of any underlying mutual funds or exchange-traded funds (ETFs).
Fidelity Advisor® Canada Fund Class I |
| |
| Years ended October 31, | | 2024 | | 2023 | | 2022 | | 2021 | | 2020 |
Selected Per-Share Data | | | | | | | | | | |
| Net asset value, beginning of period | $ | 58.19 | $ | 59.84 | $ | 67.70 | $ | 46.24 | $ | 52.11 |
| Income from Investment Operations | | | | | | | | | | |
Net investment income (loss) A,B | | .67 | | .78 | | .85 | | .78 | | .79 |
| Net realized and unrealized gain (loss) | | 14.40 | | (.03) C | | (5.34) | | 22.00 | | (4.39) |
| Total from investment operations | | 15.07 | | .75 | | (4.49) | | 22.78 | | (3.60) |
| Distributions from net investment income | | (.86) | | (.88) | | (.86) | | (.73) | | (.87) |
| Distributions from net realized gain | | (1.31) | | (1.52) | | (2.51) | | (.59) | | (1.40) |
| Total distributions | | (2.17) | | (2.40) | | (3.37) | | (1.32) | | (2.27) |
| Net asset value, end of period | $ | 71.09 | $ | 58.19 | $ | 59.84 | $ | 67.70 | $ | 46.24 |
Total Return D | | | | 1.20% | | (6.74)% | | 50.02% | | (7.35)% |
Ratios to Average Net Assets B,E,F | | | | | | | | | | |
| Expenses before reductions | | 1.04% | | 1.03% | | .86% | | .74% | | .81% |
| Expenses net of fee waivers, if any | | | | 1.03% | | .86% | | .74% | | .81% |
| Expenses net of all reductions | | 1.04% | | 1.03% | | .86% | | .74% | | .81% |
| Net investment income (loss) | | 1.00% | | 1.27% | | 1.34% | | 1.29% | | 1.65% |
| Supplemental Data | | | | | | | | | | |
| Net assets, end of period (000 omitted) | $ | 19,072 | $ | 10,571 | $ | 16,165 | $ | 13,724 | $ | 8,392 |
Portfolio turnover rate G | | | | 9% | | 13% | | 7% | | 11% |
ACalculated based on average shares outstanding during the period.
BNet investment income (loss) is affected by the timing of the declaration of dividends by any underlying mutual funds or exchange-traded funds (ETFs). Net investment income (loss) of any mutual funds or ETFs is not included in the Fund's net investment income (loss) ratio.
CThe amount shown for a share outstanding does not correspond with the aggregate net gain (loss) on investments for the period due to the timing of sales and repurchases of shares in relation to fluctuating market values of the investments of the Fund.
DTotal returns would have been lower if certain expenses had not been reduced during the applicable periods shown.
EFees and expenses of any underlying mutual funds or exchange-traded funds (ETFs) are not included in the Fund's expense ratio. The Fund indirectly bears its proportionate share of these expenses. For additional expense information related to investments in Fidelity Central Funds, please refer to the "Investments in Fidelity Central Funds" note found in the Notes to Financial Statements section of the most recent Annual or Semi-Annual report.
FExpense ratios reflect operating expenses of the class. Expenses before reductions do not reflect amounts reimbursed, waived, or reduced through arrangements with the investment adviser, brokerage services, or other offset arrangements, if applicable, and do not represent the amount paid by the class during periods when reimbursements, waivers or reductions occur.
GAmount does not include the portfolio activity of any underlying mutual funds or exchange-traded funds (ETFs).
Fidelity Advisor® Canada Fund Class Z |
| |
| Years ended October 31, | | 2024 | | 2023 | | 2022 | | 2021 | | 2020 |
Selected Per-Share Data | | | | | | | | | | |
| Net asset value, beginning of period | $ | 58.01 | $ | 59.55 | $ | 67.38 | $ | 46.11 | $ | 52.07 |
| Income from Investment Operations | | | | | | | | | | |
Net investment income (loss) A,B | | .75 | | .85 | | .92 | | .82 | | .84 |
| Net realized and unrealized gain (loss) | | 14.33 | | (.03) C | | (5.33) | | 21.91 | | (4.37) |
| Total from investment operations | | 15.08 | | .82 | | (4.41) | | 22.73 | | (3.53) |
| Distributions from net investment income | | (.94) | | (.84) | | (.91) | | (.87) | | (1.03) |
| Distributions from net realized gain | | (1.31) | | (1.52) | | (2.51) | | (.59) | | (1.40) |
| Total distributions | | (2.25) | | (2.36) | | (3.42) | | (1.46) | | (2.43) |
| Net asset value, end of period | $ | 70.84 | $ | 58.01 | $ | 59.55 | $ | 67.38 | $ | 46.11 |
Total Return D | | | | 1.33% | | (6.66)% | | 50.13% | | (7.24)% |
Ratios to Average Net Assets A,E,F | | | | | | | | | | |
| Expenses before reductions | | .93% | | .92% | | .75% | | .66% | | .72% |
| Expenses net of fee waivers, if any | | | | .91% | | .75% | | .66% | | .72% |
| Expenses net of all reductions | | .92% | | .91% | | .75% | | .66% | | .72% |
| Net investment income (loss) | | 1.11% | | 1.38% | | 1.45% | | 1.38% | | 1.74% |
| Supplemental Data | | | | | | | | | | |
| Net assets, end of period (000 omitted) | $ | 6,683 | $ | 2,692 | $ | 5,843 | $ | 22,010 | $ | 15,221 |
Portfolio turnover rate G | | | | 9% | | 13% | | 7% | | 11% |
ANet investment income (loss) is affected by the timing of the declaration of dividends by any underlying mutual funds or exchange-traded funds (ETFs). Net investment income (loss) of any mutual funds or ETFs is not included in the Fund's net investment income (loss) ratio.
BCalculated based on average shares outstanding during the period.
CThe amount shown for a share outstanding does not correspond with the aggregate net gain (loss) on investments for the period due to the timing of sales and repurchases of shares in relation to fluctuating market values of the investments of the Fund.
DTotal returns would have been lower if certain expenses had not been reduced during the applicable periods shown.
EFees and expenses of any underlying mutual funds or exchange-traded funds (ETFs) are not included in the Fund's expense ratio. The Fund indirectly bears its proportionate share of these expenses. For additional expense information related to investments in Fidelity Central Funds, please refer to the "Investments in Fidelity Central Funds" note found in the Notes to Financial Statements section of the most recent Annual or Semi-Annual report.
FExpense ratios reflect operating expenses of the class. Expenses before reductions do not reflect amounts reimbursed, waived, or reduced through arrangements with the investment adviser, brokerage services, or other offset arrangements, if applicable, and do not represent the amount paid by the class during periods when reimbursements, waivers or reductions occur.
GAmount does not include the portfolio activity of any underlying mutual funds or exchange-traded funds (ETFs).
Notes to Financial Statements
For the period ended October 31, 2024
1. Organization.
Fidelity Canada Fund (the Fund) is a fund of Fidelity Investment Trust (the Trust) and is authorized to issue an unlimited number of shares. The Trust is registered under the Investment Company Act of 1940, as amended (the 1940 Act), as an open-end management investment company organized as a Massachusetts business trust. The Fund offers Class A, Class M, Class C, Canada, Class I and Class Z shares, each of which has equal rights as to assets and voting privileges. Class A, Class M, Class C, Class I and Class Z are Fidelity Advisor classes. Each class has exclusive voting rights with respect to matters that affect that class. Class C shares will automatically convert to Class A shares after a holding period of eight years from the initial date of purchase, with certain exceptions.
2. Investments in Fidelity Central Funds.
Funds may invest in Fidelity Central Funds, which are open-end investment companies generally available only to other investment companies and accounts managed by the investment adviser and its affiliates. The Schedule of Investments lists any Fidelity Central Funds held as an investment as of period end, but does not include the underlying holdings of each Fidelity Central Fund. An investing fund indirectly bears its proportionate share of the expenses of the underlying Fidelity Central Funds.
Based on its investment objective, each Fidelity Central Fund may invest or participate in various investment vehicles or strategies that are similar to those of the investing fund. These strategies are consistent with the investment objectives of the investing fund and may involve certain economic risks which may cause a decline in value of each of the Fidelity Central Funds and thus a decline in the value of the investing fund.
| Fidelity Central Fund | Investment Manager | Investment Objective | Investment Practices | Expense RatioA |
| Fidelity Money Market Central Funds | Fidelity Management & Research Company LLC (FMR) | Each fund seeks to obtain a high level of current income consistent with the preservation of capital and liquidity. | Short-term Investments | Less than .005% |
A Expenses expressed as a percentage of average net assets and are as of each underlying Central Fund's most recent annual or semi-annual shareholder report.
A complete unaudited list of holdings for each Fidelity Central Fund is available upon request or at the Securities and Exchange Commission website at www.sec.gov. In addition, the financial statements of the Fidelity Central Funds which contain the significant accounting policies (including investment valuation policies) of those funds, and are not covered by the Report of Independent Registered Public Accounting Firm, are available on the Securities and Exchange Commission website or upon request.
3. Significant Accounting Policies.
The Fund is an investment company and applies the accounting and reporting guidance of the Financial Accounting Standards Board (FASB) Accounting Standards Codification Topic 946 Financial Services - Investment Companies. The financial statements have been prepared in conformity with accounting principles generally accepted in the United States of America (GAAP), which require management to make certain estimates and assumptions at the date of the financial statements. Actual results could differ from those estimates. Subsequent events, if any, through the date that the financial statements were issued have been evaluated in the preparation of the financial statements. The Fund's Schedule of Investments lists any underlying mutual funds or exchange-traded funds (ETFs) but does not include the underlying holdings of these funds. The following summarizes the significant accounting policies of the Fund:
Investment Valuation. Investments are valued as of 4:00 p.m. Eastern time on the last calendar day of the period. The Board of Trustees (the Board) has designated the Fund's investment adviser as the valuation designee responsible for the fair valuation function and performing fair value determinations as needed. The investment adviser has established a Fair Value Committee (the Committee) to carry out the day-to-day fair valuation responsibilities and has adopted policies and procedures to govern the fair valuation process and the activities of the Committee. In accordance with these fair valuation policies and procedures, which have been approved by the Board, the Fund attempts to obtain prices from one or more third party pricing services or brokers to value its investments. When current market prices, quotations or currency exchange rates are not readily available or reliable, investments will be fair valued in good faith by the Committee, in accordance with the policies and procedures. Factors used in determining fair value vary by investment type and may include market or investment specific events, transaction data, estimated cash flows, and market observations of comparable investments. The frequency that the fair valuation procedures are used cannot be predicted and they may be utilized to a significant extent. The Committee manages the Fund's fair valuation practices and maintains the fair valuation policies and procedures. The Fund's investment adviser reports to the Board information regarding the fair valuation process and related material matters.
The Fund categorizes the inputs to valuation techniques used to value its investments into a disclosure hierarchy consisting of three levels as shown below:
Level 1 - unadjusted quoted prices in active markets for identical investments
Level 2 - other significant observable inputs (including quoted prices for similar investments, interest rates, prepayment speeds, etc.)
Level 3 - unobservable inputs (including the Fund's own assumptions based on the best information available)
Valuation techniques used to value the Fund's investments by major category are as follows:
Equity securities, including restricted securities, for which market quotations are readily available, are valued at the last reported sale price or official closing price as reported by a third party pricing service on the primary market or exchange on which they are traded and are categorized as Level 1 in the hierarchy. In the event there were no sales during the day or closing prices are not available, securities are valued at the last quoted bid price or may be valued using the last available price and are generally categorized as Level 2 in the hierarchy. For foreign equity securities, when market or security specific events arise, comparisons to the valuation of American Depositary Receipts (ADRs), futures contracts, Exchange-Traded Funds (ETFs) and certain indexes as well as quoted prices for similar securities may be used and would be categorized as Level 2 in the hierarchy. For equity securities, including restricted securities, where observable inputs are limited, assumptions about market activity and risk are used and these securities may be categorized as Level 3 in the hierarchy.
Debt securities, including restricted securities, are valued based on evaluated prices received from third party pricing services or from brokers who make markets in such securities. Corporate bonds are valued by pricing services who utilize matrix pricing which considers yield or price of bonds of comparable quality, coupon, maturity and type or by broker-supplied prices. When independent prices are unavailable or unreliable, debt securities may be valued utilizing pricing methodologies which consider similar factors that would be used by third party pricing services. Debt securities are generally categorized as Level 2 in the hierarchy but may be Level 3 depending on the circumstances.
Investments in open-end mutual funds, including the Fidelity Central Funds, are valued at their closing net asset value (NAV) each business day and are categorized as Level 1 in the hierarchy.
Changes in valuation techniques may result in transfers in or out of an assigned level within the disclosure hierarchy. The aggregate value of investments by input level as of October 31, 2024 is included at the end of the Fund's Schedule of Investments.
Foreign Currency. Certain Funds may use foreign currency contracts to facilitate transactions in foreign-denominated securities. Gains and losses from these transactions may arise from changes in the value of the foreign currency or if the counterparties do not perform under the contracts' terms.
Foreign-denominated assets, including investment securities, and liabilities are translated into U.S. dollars at the exchange rates at period end. Purchases and sales of investment securities, income and dividends received, and expenses denominated in foreign currencies are translated into U.S. dollars at the exchange rate in effect on the transaction date.
The effects of exchange rate fluctuations on investments are included with the net realized and unrealized gain (loss) on investment securities. Other foreign currency transactions resulting in realized and unrealized gain (loss) are disclosed separately.
Investment Transactions and Income. For financial reporting purposes, the Fund's investment holdings and NAV include trades executed through the end of the last business day of the period. The NAV per share for processing shareholder transactions is calculated as of the close of business of the New York Stock Exchange (NYSE), normally 4:00 p.m. Eastern time and includes trades executed through the end of the prior business day. Gains and losses on securities sold are determined on the basis of identified cost and include proceeds received from litigation. Commissions paid to certain brokers with whom the investment adviser, or its affiliates, places trades on behalf of a fund include an amount in addition to trade execution, which may be rebated back to a fund. Any such rebates are included in net realized gain (loss) on investments in the Statement of Operations. Dividend income is recorded on the ex-dividend date, except for certain dividends from foreign securities where the ex-dividend date may have passed, which are recorded as soon as the Fund is informed of the ex-dividend date. Non-cash dividends included in dividend income, if any, are recorded at the fair market value of the securities received. Income and capital gain distributions from Fidelity Central Funds, if any, are recorded on the ex-dividend date. Certain distributions received by the Fund represent a return of capital or capital gain. The Fund determines the components of these distributions subsequent to the ex-dividend date, based upon receipt of tax filings or other correspondence relating to the underlying investment. These distributions are recorded as a reduction of cost of investments and/or as a realized gain. Interest income is accrued as earned and includes coupon interest and amortization of premium and accretion of discount on debt securities as applicable. Investment income is recorded net of foreign taxes withheld where recovery of such taxes is uncertain.
Class Allocations and Expenses. Investment income, realized and unrealized capital gains and losses, common expenses of a fund, and certain fund-level expense reductions, if any, are allocated daily on a pro-rata basis to each class based on the relative net assets of each class to the total net assets of a fund. Each class differs with respect to transfer agent and distribution and service plan fees incurred, as applicable. Certain expense reductions may also differ by class, if applicable. For the reporting period, the allocated portion of income and expenses to each class as a percent of its average net assets may vary due to the timing of recording these transactions in relation to fluctuating net assets of the classes. Expenses directly attributable to a fund are charged to that fund. Expenses attributable to more than one fund are allocated among the respective funds on the basis of relative net assets or other appropriate methods. Expenses included in the accompanying financial statements reflect the expenses of that fund and do not include any expenses associated with any underlying mutual funds or exchange-traded funds (ETFs). Although not included in a fund's expenses, a fund indirectly bears its proportionate share of these expenses through the net asset value of each underlying mutual fund or exchange-traded fund (ETF). Expense estimates are accrued in the period to which they relate and adjustments are made when actual amounts are known.
Income Tax Information and Distributions to Shareholders. Each year, the Fund intends to qualify as a regulated investment company under Subchapter M of the Internal Revenue Code, including distributing substantially all of its taxable income and realized gains. As a result, no provision for U.S. Federal income taxes is required. As of October 31, 2024, the Fund did not have any unrecognized tax benefits in the financial statements; nor is the Fund aware of any tax positions for which it is reasonably possible that the total amounts of unrecognized tax benefits will significantly change in the next twelve months. The Fund files a U.S. federal tax return, in addition to state and local tax returns as required. The Fund's federal income tax returns are subject to examination by the Internal Revenue Service (IRS) for a period of three fiscal years after they are filed. State and local tax returns may be subject to examination for an additional fiscal year depending on the jurisdiction. Foreign taxes are provided for based on the Fund's understanding of the tax rules and rates that exist in the foreign markets in which it invests.
Distributions are declared and recorded on the ex-dividend date. Income and capital gain distributions are declared separately for each class. Income and capital gain distributions are determined in accordance with income tax regulations, which may differ from GAAP. In addition, the Fund claimed a portion of the payment made to redeeming shareholders as a distribution for income tax purposes.
Capital accounts within the financial statements are adjusted for permanent book-tax differences. These adjustments have no impact on net assets or the results of operations. Capital accounts are not adjusted for temporary book-tax differences which will reverse in a subsequent period.
Book-tax differences are primarily due to foreign currency transactions, passive foreign investment companies (PFIC) and losses deferred due to wash sales.
As of period end, the cost and unrealized appreciation (depreciation) in securities, and derivatives if applicable, for federal income tax purposes were as follows:
| Gross unrealized appreciation | $470,992,700 |
| Gross unrealized depreciation | (10,744,792) |
| Net unrealized appreciation (depreciation) | $460,247,908 |
| Tax Cost | $485,994,189 |
The tax-based components of distributable earnings as of period end were as follows:
| Undistributed ordinary income | $10,009,203 |
| Undistributed long-term capital gain | $52,799,812 |
| Net unrealized appreciation (depreciation) on securities and other investments | $460,230,867 |
The tax character of distributions paid was as follows:
| | October 31, 2024 | October 31, 2023 |
| Ordinary Income | $11,813,217 | $12,611,012 |
| Long-term Capital Gains | 18,346,352 | 22,355,258 |
| Total | $30,159,569 | $34,966,270 |
Restricted Securities (including Private Placements). Funds may invest in securities that are subject to legal or contractual restrictions on resale. These securities generally may be resold in transactions exempt from registration or to the public if the securities are registered. Disposal of these securities may involve time-consuming negotiations and expense, and prompt sale at an acceptable price may be difficult. Information regarding restricted securities held at period end is included at the end of the Schedule of Investments, if applicable.
New Accounting Pronouncement. In November 2023, the FASB issued Accounting Standards Update (ASU) 2023-07 Segment Reporting (Topic 280): Improvements to Reportable Segment Disclosures. Effective for fiscal years beginning after December 15, 2023 and interim periods within fiscal years beginning after December 15, 2024, the amendments enhance required disclosures of segment information for public entities on an annual and interim basis. The ASU allows for early adoption with updates applied retrospectively. Management is currently evaluating the impact of the ASU but does not expect this guidance to materially impact the financial statements.
4. Purchases and Sales of Investments.
Purchases and sales of securities, other than short-term securities and in-kind transactions, as applicable, are noted in the table below.
| | Purchases ($) | Sales ($) |
| Fidelity Canada Fund | 75,529,639 | 161,150,154 |
5. Fees and Other Transactions with Affiliates.
Management Fee. Fidelity Management & Research Company LLC (the investment adviser) and its affiliates provide the Fund with investment management related services for which the Fund pays a monthly management fee.
Effective March 1, 2024, the Fund's management contract was amended to incorporate administrative services previously covered under separate services agreements (Transfer Agent and Accounting agreements). The amended contract incorporates a basic fee rate that may vary by class (subject to a performance adjustment). The investment adviser or an affiliate pays certain expenses of managing and operating the Fund out of each class's management fee. Each class of the Fund pays a management fee to the investment adviser. The management fee is calculated and paid to the investment adviser every month. The management fee is determined by calculating a basic fee and then applying a performance adjustment. When determining a class's basic fee, a mandate rate is calculated based on the monthly average net assets of a group of funds advised by FMR within a designated asset class. A discount rate is subtracted from the mandate rate once the Fund's monthly average net assets reach a certain level. The mandate rate and discount rate may vary by class. The annual basic fee rate for a class of shares of the Fund is the lesser of (1) the class's mandate rate reduced by the class's discount rate (if applicable) or (2) the amount set forth in the following table.
| | Maximum Management Fee Rate % |
| Class A | .89 |
| Class M | .89 |
| Class C | .89 |
| Canada | .86 |
| Class I | .84 |
| Class Z | .73 |
One-twelfth of the basic fee rate for a class is applied to the average net assets of the class for the month, giving a dollar amount which is the basic fee for the class for that month. A different management fee rate may be applicable to each class of the Fund. The difference between classes is the result of separate arrangements for class-level services and/or waivers of certain expenses. It is not the result of any difference in advisory or custodial fees or other expenses related to the management of the Fund's assets, which do not vary by class. For the portion of the reporting period on or after March 1, 2024, the total annualized management fee rates were as follows:
| | Total Management Fee Rate % |
| Class A | .87 |
| Class M | .87 |
| Class C | .87 |
| Canada | .83 |
| Class I | .84 |
| Class Z | .73 |
Prior to March 1, 2024, the management fee was the sum of an individual fund fee rate that was based on an annual rate of .45% of the Fund's average net assets and an annualized group fee rate that averaged .22% during the period. The group fee rate was based upon the monthly average net assets of a group of registered investment companies with which the investment adviser has management contracts. The group fee rate decreased as assets under management increased and increased as assets under management decreased. For the portion of the reporting period prior to March 1, 2024, the total annualized management fee rate was .67%.
The performance adjustment rate is calculated monthly by comparing over the performance period the Fund's performance to that of the performance adjustment index listed below.
| | Performance Adjustment Index |
| Fidelity Canada Fund | S&P/TSX Composite Index |
For the purposes of calculating the performance adjustment for the Fund, the Fund's investment performance is based on the performance of Canada. To the extent that other classes of the Fund have higher expenses, this could result in those classes bearing a larger positive performance adjustment and smaller negative performance adjustment than would be the case if each class's own performance were considered. The performance period is the most recent 36 month period. The maximum annualized performance adjustment rate is ±.20% of the Fund's average net assets over the performance period. The performance adjustment rate is divided by twelve and multiplied by the Fund's average net assets over the performance period, and the resulting dollar amount is proportionately added to or subtracted from a class's basic fee. For the entire reporting period, the total annual performance adjustment was .18%.
Effective March 1, 2024, the Fund's sub-advisory agreements with FMR Investment Management (UK) Limited, Fidelity Management & Research (Hong Kong) Limited, and Fidelity Management & Research (Japan) Limited were amended to provide that the investment adviser pays each sub-adviser monthly fees equal to 110% of the sub-adviser's costs for providing sub-advisory services.
Effective March 1, 2024, the Fund's sub-advisory agreement with FIL Investment Advisors (FIA) was amended to provide that the investment adviser pays FIA monthly fees at an annual rate of 0.44% with respect to the average daily net assets of the Fund managed by FIA. FIA in turn pays FIA(UK).
Distribution and Service Plan Fees. In accordance with Rule 12b-1 of the 1940 Act, the Fund has adopted separate Distribution and Service Plans for each class of shares. Certain classes pay Fidelity Distributors Company LLC (FDC), an affiliate of the investment adviser, separate Distribution and Service Fees, each of which is based on an annual percentage of each class' average net assets. In addition, FDC may pay financial intermediaries for selling shares of the Fund and providing shareholder support services. For the period, the Distribution and Service Fee rates, total fees and amounts retained by FDC were as follows:
| | Distribution Fee | Service Fee | Total Fees ($) | Retained by FDC ($) |
| Class A | - % | .25% | 78,282 | 270 |
| Class M | .25% | .25% | 34,776 | 76 |
| Class C | .75% | .25% | 8,795 | 882 |
| | | | 121,853 | 1,228 |
Sales Load. FDC may receive a front-end sales charge of up to 5.75% for selling Class A shares and 3.50% for selling Class M shares, some of which is paid to financial intermediaries for selling shares of the Fund. Depending on the holding period, FDC may receive contingent deferred sales charges levied on Class A, Class M and Class C redemptions. The deferred sales charges are 1.00% for Class C shares, 1.00% for certain purchases of Class A shares and .25% for certain purchases of Class M shares.
For the period, sales charge amounts retained by FDC were as follows:
| | Retained by FDC ($) |
| Class A | 2,083 |
| Class M | 330 |
Class CA | 92 |
| | 2,505 |
A When Class C shares are initially sold, FDC pays commissions from its own resources to financial intermediaries through which the sales are made.
Transfer Agent Fees. Fidelity Investments Institutional Operations Company LLC (FIIOC), an affiliate of the investment adviser, is the transfer, dividend disbursing and shareholder servicing agent for each class of the Fund. Effective March 1, 2024, the Fund's management contract was amended to incorporate transfer agent services and associated fees previously covered under a separate services agreement. FIIOC pays for typesetting, printing and mailing of shareholder reports, except proxy statements.
During the period December 1, 2023 through February 29, 2024, the transfer agent fees for each class were a fixed annual rate of class-level average net assets as follows:
| | % of Class-Level Average Net Assets |
| Class A | .2000 |
| Class M | .2000 |
| Class C | .2000 |
| Canada | .1694 |
| Class I | .1500 |
| Class Z | .0420 |
Prior to December 1, 2023, FIIOC received account fees and asset-based fees that varied according to the account size and type of account of the shareholders of the respective classes of the Fund, except for Class Z. FIIOC received an asset-based fee of Class Z's average net assets. For the portion of the reporting period prior to March 1, 2024, the fees were equivalent to the following annualized rates:
| | Amount ($) | % of Class-Level Average Net Assets |
| Class A | 21,349 | .21 |
| Class M | 4,797 | .21 |
| Class C | 645 | .21 |
| Canada | 476,108 | .17 |
| Class I | 6,351 | .15 |
| Class Z | 436 | .04 |
| 509,686 | |
Accounting Fees. Fidelity Service Company, Inc. (FSC), an affiliate of the investment adviser, maintains the Fund's accounting records. Effective March 1, 2024, the Fund's management contract was amended to incorporate accounting services and associated fees previously covered under a separate services agreement.
During the period December 1, 2023 through February 29, 2024, the accounting fees were a fixed annual rate of average net assets as follows:
| | % of Average Net Assets |
| Fidelity Canada Fund | .0450 |
Prior to December 1, 2023, the accounting fee was based on the level of average net assets for each month. For the portion of the reporting period prior to March 1, 2024, the fees were equivalent to the following annualized rates:
| | % of Average Net Assets |
| Fidelity Canada Fund | .05 |
Interfund Trades. Funds may purchase from or sell securities to other Fidelity Funds under procedures adopted by the Board. The procedures have been designed to ensure these interfund trades are executed in accordance with Rule 17a-7 of the 1940 Act. Any interfund trades are included within the respective purchases and sales amounts shown in the Purchases and Sales of Investments note. Interfund trades during the period are noted in the table below.
| | Purchases ($) | Sales ($) | Realized Gain (Loss)($) |
| Fidelity Canada Fund | 4,506,977 | 16,667,063 | 5,672,033 |
6. Committed Line of Credit.
Certain Funds participate with other funds managed by the investment adviser or an affiliate in a $4.25 billion credit facility (the "line of credit") to be utilized for temporary or emergency purposes to fund shareholder redemptions or for other short-term liquidity purposes. The participating funds have agreed to pay commitment fees on their pro-rata portion of the line of credit, which are reflected in Miscellaneous expenses on the Statement of Operations, and are listed below. During the period, there were no borrowings on this line of credit.
| | Amount ($) |
| Fidelity Canada Fund | 1,467 |
7. Security Lending.
Funds lend portfolio securities from time to time in order to earn additional income. Lending agents are used, including National Financial Services (NFS), an affiliate of the investment adviser. Pursuant to a securities lending agreement, NFS will receive a fee, which is capped at 9.9% of a fund's daily lending revenue, for its services as lending agent. A fund may lend securities to certain qualified borrowers, including NFS. On the settlement date of the loan, a fund receives collateral (in the form of U.S. Treasury obligations, letters of credit and/or cash) against the loaned securities and maintains collateral in an amount not less than 100% of the market value of the loaned securities during the period of the loan. The market value of the loaned securities is determined at the close of business of a fund and any additional required collateral is delivered to a fund on the next business day. A fund or borrower may terminate the loan at any time, and if the borrower defaults on its obligation to return the securities loaned because of insolvency or other reasons, a fund may apply collateral received from the borrower against the obligation. A fund may experience delays and costs in recovering the securities loaned. Any cash collateral received is invested in the Fidelity Securities Lending Cash Central Fund. Any loaned securities are identified as such in the Schedule of Investments, and the value of loaned securities and cash collateral at period end, as applicable, are presented in the Statement of Assets and Liabilities. Security lending income represents the income earned on investing cash collateral, less rebates paid to borrowers and any lending agent fees associated with the loan, plus any premium payments received for lending certain types of securities. Security lending income is presented in the Statement of Operations as a component of income from Fidelity Central Funds. Affiliated security lending activity, if any, was as follows:
| | Total Security Lending Fees Paid to NFS ($) | Security Lending Income From Securities Loaned to NFS ($) | Value of Securities Loaned to NFS at Period End ($) |
| Fidelity Canada Fund | 24,877 | - | - |
8. Expense Reductions.
Through arrangements with each class' transfer agent, credits realized as a result of certain uninvested cash balances were used to reduce the Fund's expenses. During the period, transfer agent credits reduced each class' expenses as noted in the table below.
| | Expense reduction ($) |
| Class A | 20 |
| Class M | 93 |
| | 113 |
In addition, during the period the investment adviser or an affiliate reimbursed and/or waived a portion of fund-level operating expenses in the amount of $40,652.
9. Distributions to Shareholders.
Distributions to shareholders of each class were as follows:
| | Year ended October 31, 2024 | Year ended October 31, 2023 |
| Fidelity Canada Fund | | |
| Distributions to shareholders | | |
| Class A | $956,471 | $1,149,850 |
| Class M | 195,471 | 223,562 |
| Class C | 21,926 | 28,556 |
| Canada | 28,479,448 | 32,768,937 |
| Class I | 395,367 | 643,345 |
| Class Z | 110,886 | 152,020 |
Total | $30,159,569 | $34,966,270 |
10. Share Transactions.
Share transactions for each class were as follows and may contain in-kind transactions, automatic conversions between classes or exchanges between affiliated funds:
| | Shares | Shares | Dollars | Dollars |
| | Year ended October 31, 2024 | Year ended October 31, 2023 | Year ended October 31, 2024 | Year ended October 31, 2023 |
| Fidelity Canada Fund | | | | |
| Class A | | | | |
| Shares sold | 13,073 | 21,447 | $863,814 | $1,305,304 |
| Reinvestment of distributions | 15,002 | 18,742 | 916,003 | 1,102,198 |
| Shares redeemed | (77,356) | (79,708) | (5,101,231) | (4,871,865) |
| Net increase (decrease) | (49,281) | (39,519) | $(3,321,414) | $(2,464,363) |
| Class M | | | | |
| Shares sold | 1,815 | 3,145 | $118,342 | $189,947 |
| Reinvestment of distributions | 3,195 | 3,795 | 194,459 | 222,444 |
| Shares redeemed | (14,909) | (10,510) | (987,428) | (631,738) |
| Net increase (decrease) | (9,899) | (3,570) | $(674,627) | $(219,347) |
| Class C | | | | |
| Shares sold | 1,074 | 1,809 | $67,883 | $108,691 |
| Reinvestment of distributions | 362 | 490 | 21,926 | 28,556 |
| Shares redeemed | (5,361) | (6,450) | (354,782) | (390,489) |
| Net increase (decrease) | (3,925) | (4,151) | $(264,973) | $(253,242) |
| Canada | | | | |
| Shares sold | 412,712 | 602,311 | $27,859,664 | $36,851,268 |
| Reinvestment of distributions | 435,957 | 524,933 | 26,706,738 | 30,971,047 |
| Shares redeemed | (1,806,263) | (1,620,750) | (120,315,587) | (99,399,772) |
| Net increase (decrease) | (957,594) | (493,506) | $(65,749,185) | $(31,577,457) |
| Class I | | | | |
| Shares sold | 241,609 | 65,023 | $16,397,061 | $3,953,919 |
| Reinvestment of distributions | 6,203 | 10,141 | 380,299 | 598,723 |
| Shares redeemed | (161,195) | (163,668) | (10,741,551) | (10,006,385) |
| Net increase (decrease) | 86,617 | (88,504) | $6,035,809 | $(5,453,743) |
| Class Z | | | | |
| Shares sold | 88,695 | 28,551 | $5,943,877 | $1,711,374 |
| Reinvestment of distributions | 1,551 | 2,264 | 94,654 | 133,088 |
| Shares redeemed | (42,317) | (82,521) | (2,861,757) | (5,051,192) |
| Net increase (decrease) | 47,929 | (51,706) | $3,176,774 | $(3,206,730) |
11. Other.
A fund's organizational documents provide former and current trustees and officers with a limited indemnification against liabilities arising in connection with the performance of their duties to the fund. In the normal course of business, a fund may also enter into contracts that provide general indemnifications. A fund's maximum exposure under these arrangements is unknown as this would be dependent on future claims that may be made against a fund. The risk of material loss from such claims is considered remote.
12. Risk and Uncertainties.
Many factors affect a fund's performance. Developments that disrupt global economies and financial markets, such as pandemics, epidemics, outbreaks of infectious diseases, war, terrorism, and environmental disasters, may significantly affect a fund's investment performance. The effects of these developments to a fund will be impacted by the types of securities in which a fund invests, the financial condition, industry, economic sector, and geographic location of an issuer, and a fund's level of investment in the securities of that issuer. Significant concentrations in security types, issuers, industries, sectors, and geographic locations may magnify the factors that affect a fund's performance.
Fidelity® China Region Fund
Schedule of Investments October 31, 2024
Showing Percentage of Net Assets
| Common Stocks - 94.9% |
| | | Shares | Value ($) |
| COMMUNICATION SERVICES - 13.1% | | | |
| Diversified Telecommunication Services - 0.4% | | | |
| HKT Trust/HKT Ltd. unit | | 4,072,000 | 5,060,301 |
| Entertainment - 2.4% | | | |
| Cloud Music, Inc. (a)(b) | | 208,050 | 3,329,515 |
| NetEase, Inc. | | 873,800 | 14,058,394 |
| Sea Ltd. ADR Class A (a) | | 117,700 | 11,069,685 |
| | | | 28,457,594 |
| Interactive Media & Services - 10.3% | | | |
| Tencent Holdings Ltd. | | 2,387,700 | 124,499,766 |
TOTAL COMMUNICATION SERVICES | | | 158,017,661 |
| CONSUMER DISCRETIONARY - 23.8% | | | |
| Automobile Components - 0.9% | | | |
| Fuyao Glass Industries Group Co. Ltd. (H Shares) (b) | | 1,085,200 | 7,676,269 |
| Zhejiang Shuanghuan Driveline Co. Ltd. | | 669,870 | 2,644,114 |
| | | | 10,320,383 |
| Automobiles - 0.6% | | | |
| BYD Co. Ltd. (H Shares) | | 146,500 | 5,291,378 |
| Li Auto, Inc. Class A (a) | | 191,600 | 2,409,389 |
| Zeekr Intelligent Technology Holding Ltd. ADR | | 7,300 | 183,303 |
| | | | 7,884,070 |
| Broadline Retail - 10.4% | | | |
| Alibaba Group Holding Ltd. | | 5,410,200 | 66,179,272 |
| JD.com, Inc. Class A | | 928,000 | 18,819,123 |
| PDD Holdings, Inc. ADR (a) | | 337,205 | 40,663,551 |
| | | | 125,661,946 |
| Diversified Consumer Services - 1.8% | | | |
| New Oriental Education & Technology Group, Inc. | | 442,000 | 2,766,061 |
| New Oriental Education & Technology Group, Inc. sponsored ADR | | 189,846 | 11,884,360 |
| TAL Education Group ADR (a) | | 691,300 | 7,687,256 |
| | | | 22,337,677 |
| Hotels, Restaurants & Leisure - 7.0% | | | |
| Galaxy Entertainment Group Ltd. | | 1,341,000 | 5,968,226 |
| Meituan Class B (a)(b) | | 2,023,058 | 47,805,615 |
| TravelSky Technology Ltd. (H Shares) | | 4,184,000 | 5,864,236 |
| Trip.com Group Ltd. (a) | | 108,000 | 6,950,287 |
| Trip.com Group Ltd. ADR (a) | | 280,600 | 18,070,640 |
| | | | 84,659,004 |
| Household Durables - 1.2% | | | |
| Chervon Holdings Ltd. | | 793,400 | 2,089,354 |
| Haier Smart Home Co. Ltd. | | 866,800 | 3,145,814 |
| Haier Smart Home Co. Ltd. (A Shares) | | 2,112,927 | 8,680,374 |
| Midea Group Co. Ltd. (H Shares) (c) | | 130,700 | 1,218,309 |
| | | | 15,133,851 |
| Textiles, Apparel & Luxury Goods - 1.9% | | | |
| Li Ning Co. Ltd. | | 2,197,500 | 4,483,798 |
| LVMH Moet Hennessy Louis Vuitton SE | | 7,000 | 4,660,044 |
| Shenzhou International Group Holdings Ltd. | | 1,730,500 | 13,362,940 |
| | | | 22,506,782 |
TOTAL CONSUMER DISCRETIONARY | | | 288,503,713 |
| CONSUMER STAPLES - 2.6% | | | |
| Beverages - 1.3% | | | |
| Kweichow Moutai Co. Ltd. (A Shares) | | 75,945 | 16,305,737 |
| Consumer Staples Distribution & Retail - 0.2% | | | |
| Yifeng Pharmacy Chain Co. Ltd. | | 653,440 | 2,178,984 |
| Food Products - 0.8% | | | |
| Uni-President Enterprises Corp. | | 3,628,000 | 10,192,934 |
| Personal Care Products - 0.3% | | | |
| Proya Cosmetics Co. Ltd. (A Shares) | | 228,064 | 3,074,076 |
TOTAL CONSUMER STAPLES | | | 31,751,731 |
| ENERGY - 0.6% | | | |
| Oil, Gas & Consumable Fuels - 0.6% | | | |
| PetroChina Co. Ltd. (H Shares) | | 9,750,000 | 7,321,418 |
| FINANCIALS - 13.1% | | | |
| Banks - 6.0% | | | |
| China Construction Bank Corp. (H Shares) | | 47,630,610 | 36,972,621 |
| E.SUN Financial Holdings Co. Ltd. | | 14,648,885 | 12,496,974 |
| Hang Seng Bank Ltd. | | 454,500 | 5,559,531 |
| Industrial & Commercial Bank of China Ltd. (H Shares) | | 28,203,000 | 16,917,755 |
| | | | 71,946,881 |
| Capital Markets - 0.8% | | | |
| Hong Kong Exchanges and Clearing Ltd. | | 237,200 | 9,497,575 |
| Financial Services - 1.4% | | | |
| Chailease Holding Co. Ltd. | | 1,713,000 | 8,047,731 |
| Far East Horizon Ltd. | | 13,368,500 | 9,331,072 |
| | | | 17,378,803 |
| Insurance - 4.9% | | | |
| AIA Group Ltd. | | 4,614,000 | 36,415,158 |
| China Pacific Insurance (Group) Co. Ltd. (H Shares) | | 2,943,600 | 10,222,691 |
| PICC Property & Casualty Co. Ltd. (H Shares) | | 3,986,000 | 6,046,645 |
| Ping An Insurance Group Co. of China Ltd. (H Shares) | | 1,078,500 | 6,682,154 |
| | | | 59,366,648 |
TOTAL FINANCIALS | | | 158,189,907 |
| HEALTH CARE - 3.2% | | | |
| Biotechnology - 2.3% | | | |
| Abbisko Cayman Ltd. (a) | | 6,601,000 | 3,508,439 |
| Innovent Biologics, Inc. (a)(b) | | 1,040,000 | 4,521,063 |
| Legend Biotech Corp. ADR (a) | | 97,100 | 4,371,442 |
| Zai Lab Ltd. (a) | | 3,071,000 | 9,363,856 |
| Zai Lab Ltd. ADR (a) | | 187,700 | 5,672,294 |
| | | | 27,437,094 |
| Health Care Equipment & Supplies - 0.8% | | | |
| Eyebright Medical Technology Beijing Co. Ltd. (A Shares) | | 436,800 | 5,821,959 |
| Shenzhen Mindray Bio-Medical Electronics Co. Ltd. (A Shares) | | 94,610 | 3,543,400 |
| | | | 9,365,359 |
| Pharmaceuticals - 0.1% | | | |
| Consun Pharmaceutical Group Ltd. | | 1,222,000 | 1,302,299 |
TOTAL HEALTH CARE | | | 38,104,752 |
| INDUSTRIALS - 4.2% | | | |
| Aerospace & Defense - 0.1% | | | |
| Space Exploration Technologies Corp. (a)(d)(e) | | 10,000 | 1,169,200 |
| Air Freight & Logistics - 1.2% | | | |
| ZTO Express, Inc. | | 118,000 | 2,721,448 |
| ZTO Express, Inc. sponsored ADR Class A | | 498,600 | 11,522,646 |
| | | | 14,244,094 |
| Electrical Equipment - 1.0% | | | |
| Contemporary Amperex Technology Co. Ltd. | | 352,700 | 12,236,841 |
| Machinery - 1.7% | | | |
| Hangcha Group Co. Ltd. (A Shares) | | 922,880 | 2,286,490 |
| Shenzhen Inovance Technology Co. Ltd. (A Shares) | | 248,913 | 1,942,798 |
| Sinotruk Hong Kong Ltd. | | 1,072,500 | 2,894,763 |
| Techtronic Industries Co. Ltd. | | 262,500 | 3,797,180 |
| Weichai Power Co. Ltd. (H Shares) | | 3,359,000 | 5,075,658 |
| Zhejiang Sanhua Intelligent Controls Co. Ltd. (A Shares) | | 1,280,984 | 3,922,648 |
| | | | 19,919,537 |
| Marine Transportation - 0.2% | | | |
| SITC International Holdings Co. Ltd. | | 1,055,000 | 2,981,759 |
| Trading Companies & Distributors - 0.0% | | | |
| ZKH Group Ltd. (A Shares) (a) | | 1 | 0 |
TOTAL INDUSTRIALS | | | 50,551,431 |
| INFORMATION TECHNOLOGY - 30.1% | | | |
| Communications Equipment - 0.3% | | | |
| Zhongji Innolight Co. Ltd. (A Shares) | | 168,340 | 3,325,122 |
| Electronic Equipment, Instruments & Components - 3.2% | | | |
| Hon Hai Precision Industry Co. Ltd. (Foxconn) | | 4,561,000 | 29,329,955 |
| Samsung Electro-Mechanics Co. Ltd. | | 22,510 | 1,920,182 |
| Taiyo Yuden Co. Ltd. | | 206,900 | 3,618,631 |
| Unimicron Technology Corp. | | 889,000 | 4,355,827 |
| | | | 39,224,595 |
| Semiconductors & Semiconductor Equipment - 26.4% | | | |
| Advanced Micro-Fabrication Equipment, Inc., China (A Shares) | | 583,891 | 15,765,803 |
| eMemory Technology, Inc. | | 185,481 | 18,093,954 |
| King Yuan Electronics Co. Ltd. | | 668,000 | 2,525,823 |
| MediaTek, Inc. | | 74,000 | 2,890,068 |
| NAURA Technology Group Co. Ltd. | | 83,100 | 4,572,857 |
| Taiwan Semiconductor Manufacturing Co. Ltd. | | 8,735,000 | 274,817,164 |
| | | | 318,665,669 |
| Technology Hardware, Storage & Peripherals - 0.2% | | | |
| Quanta Computer, Inc. | | 307,000 | 2,797,050 |
TOTAL INFORMATION TECHNOLOGY | | | 364,012,436 |
| MATERIALS - 3.2% | | | |
| Chemicals - 0.4% | | | |
| Shandong Sinocera Functional Material Co. Ltd. (A Shares) | | 2,024,700 | 5,431,314 |
| Containers & Packaging - 0.7% | | | |
| Shenzhen YUTO Packaging Technology Co. Ltd. (A Shares) | | 2,206,071 | 7,901,385 |
| Metals & Mining - 2.1% | | | |
| Zijin Mining Group Co. Ltd. (H Shares) | | 11,772,000 | 25,075,205 |
TOTAL MATERIALS | | | 38,407,904 |
| REAL ESTATE - 1.0% | | | |
| Real Estate Management & Development - 1.0% | | | |
| China Resources Mixc Lifestyle Services Ltd. (b) | | 1,671,600 | 6,896,048 |
| KE Holdings, Inc. ADR | | 262,970 | 5,766,932 |
| | | | 12,662,980 |
| TOTAL COMMON STOCKS (Cost $747,896,096) | | | 1,147,523,933 |
| | | | |
| Preferred Stocks - 2.0% |
| | | Shares | Value ($) |
| Convertible Preferred Stocks - 0.9% | | | |
| COMMUNICATION SERVICES - 0.8% | | | |
| Interactive Media & Services - 0.8% | | | |
| ByteDance Ltd. Series E1 (a)(d)(e) | | 38,752 | 9,655,836 |
| HEALTH CARE - 0.1% | | | |
| Health Care Providers & Services - 0.1% | | | |
| dMed Biopharmaceutical Co. Ltd. Series C (a)(d)(e) | | 275,211 | 1,491,644 |
| TOTAL CONVERTIBLE PREFERRED STOCKS | | | 11,147,480 |
| Nonconvertible Preferred Stocks - 1.1% | | | |
| INFORMATION TECHNOLOGY - 1.1% | | | |
| Technology Hardware, Storage & Peripherals - 1.1% | | | |
| Samsung Electronics Co. Ltd. | | 386,430 | 13,336,840 |
| TOTAL PREFERRED STOCKS (Cost $25,197,717) | | | 24,484,320 |
| | | | |
| Money Market Funds - 3.0% |
| | | Shares | Value ($) |
| Fidelity Cash Central Fund 4.87% (f) | | 35,889,897 | 35,897,075 |
| Fidelity Securities Lending Cash Central Fund 4.87% (f)(g) | | 749,925 | 750,000 |
| TOTAL MONEY MARKET FUNDS (Cost $36,647,075) | | | 36,647,075 |
| | | | |
| TOTAL INVESTMENT IN SECURITIES - 99.9% (Cost $809,740,888) | 1,208,655,328 |
NET OTHER ASSETS (LIABILITIES) - 0.1% | 1,014,737 |
| NET ASSETS - 100.0% | 1,209,670,065 |
| | |
Legend
| (b) | Security exempt from registration under Rule 144A of the Securities Act of 1933. These securities may be resold in transactions exempt from registration, normally to qualified institutional buyers. At the end of the period, the value of these securities amounted to $70,228,510 or 5.8% of net assets. |
| (c) | Security or a portion of the security is on loan at period end. |
| (d) | Restricted securities (including private placements) - Investment in securities not registered under the Securities Act of 1933 (excluding 144A issues). At the end of the period, the value of restricted securities (excluding 144A issues) amounted to $12,316,680 or 1.0% of net assets. |
| (f) | Affiliated fund that is generally available only to investment companies and other accounts managed by Fidelity Investments. The rate quoted is the annualized seven-day yield of the fund at period end. A complete unaudited listing of the fund's holdings as of its most recent quarter end is available upon request. In addition, each Fidelity Central Fund's financial statements, which are not covered by the Fund's Report of Independent Registered Public Accounting Firm, are available on the SEC's website or upon request. |
| (g) | Investment made with cash collateral received from securities on loan. |
| Additional information on each restricted holding is as follows: |
| Security | Acquisition Date | Acquisition Cost ($) |
| ByteDance Ltd. Series E1 | 11/18/20 | 4,246,219 |
| | | |
| dMed Biopharmaceutical Co. Ltd. Series C | 12/01/20 | 3,908,863 |
| | | |
| Space Exploration Technologies Corp. | 2/16/21 | 419,990 |
| | | |
Affiliated Central Funds
Fiscal year to date information regarding the Fund's investments in Fidelity Central Funds, including the ownership percentage, is presented below.
| Affiliate | Value, beginning of period ($) | Purchases ($) | Sales Proceeds ($) | Dividend Income ($) | Realized Gain (loss) ($) | Change in Unrealized appreciation (depreciation) ($) | Value, end of period ($) | % ownership, end of period |
| Fidelity Cash Central Fund 4.87% | 13,693,950 | 270,323,895 | 248,120,768 | 1,635,841 | (2) | - | 35,897,075 | 0.1% |
| Fidelity Securities Lending Cash Central Fund 4.87% | 6,127,633 | 78,815,624 | 84,193,257 | 45,491 | - | - | 750,000 | 0.0% |
| Total | 19,821,583 | 349,139,519 | 332,314,025 | 1,681,332 | (2) | - | 36,647,075 | |
| | | | | | | | | |
Amounts in the dividend income column in the above table include any capital gain distributions from underlying funds, which are presented in the corresponding line item in the Statement of Operations, if applicable.
Amounts in the dividend income column for Fidelity Securities Lending Cash Central Fund represents the income earned on investing cash collateral, less rebates paid to borrowers and any lending agent fees associated with the loan, plus any premium payments received for lending certain types of securities.
Amounts included in the purchases and sales proceeds columns may include in-kind transactions, if applicable.
Investment Valuation
The following is a summary of the inputs used, as of October 31, 2024, involving the Fund's assets and liabilities carried at fair value. The inputs or methodology used for valuing securities may not be an indication of the risk associated with investing in those securities. For more information on valuation inputs, and their aggregation into the levels used below, please refer to the Investment Valuation section in the accompanying Notes to Financial Statements.
| Valuation Inputs at Reporting Date: |
| Description | Total ($) | Level 1 ($) | Level 2 ($) | Level 3 ($) |
Investments in Securities: | | | | |
|
| Equities: | | | | |
Communication Services | 167,673,497 | 11,069,685 | 146,947,976 | 9,655,836 |
Consumer Discretionary | 288,503,713 | 78,489,110 | 210,014,603 | - |
Consumer Staples | 31,751,731 | - | 31,751,731 | - |
Energy | 7,321,418 | - | 7,321,418 | - |
Financials | 158,189,907 | - | 158,189,907 | - |
Health Care | 39,596,396 | 10,043,736 | 28,061,016 | 1,491,644 |
Industrials | 50,551,431 | 11,522,646 | 37,859,585 | 1,169,200 |
Information Technology | 377,349,276 | - | 377,349,276 | - |
Materials | 38,407,904 | - | 38,407,904 | - |
Real Estate | 12,662,980 | 5,766,932 | 6,896,048 | - |
|
| Money Market Funds | 36,647,075 | 36,647,075 | - | - |
| Total Investments in Securities: | 1,208,655,328 | 153,539,184 | 1,042,799,464 | 12,316,680 |
The following is a reconciliation of Investments in Securities for which Level 3 inputs were used in determining value:
| |
| Investments in Securities: | |
| Beginning Balance | $ | 12,643,995 | |
| Net Realized Gain (Loss) on Investment Securities | | - | |
| Net Unrealized Gain (Loss) on Investment Securities | | 1,444,663 | |
| Cost of Purchases | | - | |
| Proceeds of Sales | | (1,771,978) | |
| Amortization/Accretion | | - | |
| Transfers into Level 3 | | - | |
| Transfers out of Level 3 | | - | |
| Ending Balance | $ | 12,316,680 | |
| The change in unrealized gain (loss) for the period attributable to Level 3 securities held at October 31, 2024 | $ | 831,282 | |
| The information used in the above reconciliation represents fiscal year to date activity for any Investments in Securities identified as using Level 3 inputs at either the beginning or the end of the current fiscal period. Cost of purchases and proceeds of sales may include securities received and/or delivered through in-kind transactions, corporate actions or exchanges. Transfers into Level 3 were attributable to a lack of observable market data resulting from decreases in market activity, decreases in liquidity, security restructurings or corporate actions. Transfers out of Level 3 were attributable to observable market data becoming available for those securities. Transfers in or out of Level 3 represent the beginning value of any Security or Instrument where a change in the pricing level occurred from the beginning to the end of the period. Realized and unrealized gains (losses) disclosed in the reconciliation are included in Net Gain (Loss) on the Fund's Statement of Operations. | |
Fidelity® China Region Fund
Financial Statements
| Statement of Assets and Liabilities |
As of October 31, 2024 |
| Assets | | | | |
| Investment in securities, at value (including securities loaned of $704,789) - See accompanying schedule: | | | | |
Unaffiliated issuers (cost $773,093,813) | $ | 1,172,008,253 | | |
Fidelity Central Funds (cost $36,647,075) | | 36,647,075 | | |
| | | | | |
| | | | | |
| Total Investment in Securities (cost $809,740,888) | | | $ | 1,208,655,328 |
| Cash | | | | 13,724 |
| Receivable for investments sold | | | | 2,760,353 |
| Receivable for fund shares sold | | | | 423,935 |
| Dividends receivable | | | | 574,035 |
| Distributions receivable from Fidelity Central Funds | | | | 199,417 |
| Prepaid expenses | | | | 1,285 |
| Other receivables | | | | 30,482 |
Total assets | | | | 1,212,658,559 |
| Liabilities | | | | |
| Payable for fund shares redeemed | $ | 1,139,202 | | |
| Accrued management fee | | 892,611 | | |
| Distribution and service plan fees payable | | 13,285 | | |
| Other payables and accrued expenses | | 193,396 | | |
| Collateral on securities loaned | | 750,000 | | |
| Total liabilities | | | | 2,988,494 |
| Net Assets | | | $ | 1,209,670,065 |
| Net Assets consist of: | | | | |
| Paid in capital | | | $ | 1,049,254,660 |
| Total accumulated earnings (loss) | | | | 160,415,405 |
| Net Assets | | | $ | 1,209,670,065 |
| | | | | |
| Net Asset Value and Maximum Offering Price | | | | |
| Class A : | | | | |
Net Asset Value and redemption price per share ($25,855,516 ÷ 645,718 shares)(a) | | | $ | 40.04 |
| Maximum offering price per share (100/94.25 of $40.04) | | | $ | 42.48 |
| Class M : | | | | |
Net Asset Value and redemption price per share ($9,322,155 ÷ 234,866 shares)(a) | | | $ | 39.69 |
| Maximum offering price per share (100/96.50 of $39.69) | | | $ | 41.13 |
| Class C : | | | | |
Net Asset Value and offering price per share ($4,627,625 ÷ 121,674 shares)(a) | | | $ | 38.03 |
| China Region : | | | | |
Net Asset Value, offering price and redemption price per share ($972,317,536 ÷ 23,922,674 shares) | | | $ | 40.64 |
| Class I : | | | | |
Net Asset Value, offering price and redemption price per share ($32,635,301 ÷ 808,955 shares) | | | $ | 40.34 |
| Class Z : | | | | |
Net Asset Value, offering price and redemption price per share ($164,911,932 ÷ 4,087,727 shares) | | | $ | 40.34 |
(a)Redemption price per share is equal to net asset value less any applicable contingent deferred sales charge. |
| Statement of Operations |
| Year ended October 31, 2024 |
| Investment Income | | | | |
| Dividends | | | $ | 24,719,480 |
| Income from Fidelity Central Funds (including $45,491 from security lending) | | | | 1,681,332 |
| Income before foreign taxes withheld | | | $ | 26,400,812 |
| Less foreign taxes withheld | | | | (2,309,034) |
| Total income | | | | 24,091,778 |
| Expenses | | | | |
| Management fee | $ | 8,109,600 | | |
| Transfer agent fees | | 536,196 | | |
| Distribution and service plan fees | | 135,344 | | |
| Accounting fees | | 134,897 | | |
| Custodian fees and expenses | | 232,156 | | |
| Independent trustees' fees and expenses | | 4,473 | | |
| Registration fees | | 105,137 | | |
| Audit fees | | 86,130 | | |
| Legal | | 1,380 | | |
| Miscellaneous | | 23,824 | | |
| Total expenses before reductions | | 9,369,137 | | |
| Expense reductions | | (41,938) | | |
| Total expenses after reductions | | | | 9,327,199 |
| Net Investment income (loss) | | | | 14,764,579 |
| Realized and Unrealized Gain (Loss) | | | | |
| Net realized gain (loss) on: | | | | |
| Investment Securities: | | | | |
| Unaffiliated issuers | | (47,567,489) | | |
| Fidelity Central Funds | | (2) | | |
| Foreign currency transactions | | 132,093 | | |
| Total net realized gain (loss) | | | | (47,435,398) |
| Change in net unrealized appreciation (depreciation) on: | | | | |
| Investment Securities: | | | | |
| Unaffiliated issuers | | 321,699,800 | | |
| Assets and liabilities in foreign currencies | | (4,073) | | |
| Total change in net unrealized appreciation (depreciation) | | | | 321,695,727 |
| Net gain (loss) | | | | 274,260,329 |
| Net increase (decrease) in net assets resulting from operations | | | $ | 289,024,908 |
| Statement of Changes in Net Assets |
| |
| | Year ended October 31, 2024 | | Year ended October 31, 2023 |
| Increase (Decrease) in Net Assets | | | | |
| Operations | | | | |
| Net investment income (loss) | $ | 14,764,579 | $ | 9,856,644 |
| Net realized gain (loss) | | (47,435,398) | | (42,325,277) |
| Change in net unrealized appreciation (depreciation) | | 321,695,727 | | 222,995,954 |
| Net increase (decrease) in net assets resulting from operations | | 289,024,908 | | 190,527,321 |
| Distributions to shareholders | | (17,558,581) | | (10,463,693) |
| | | | | |
| Share transactions - net increase (decrease) | | 43,245,195 | | (76,688,681) |
| | | | | |
| Total increase (decrease) in net assets | | 314,711,522 | | 103,374,947 |
| | | | | |
| Net Assets | | | | |
| Beginning of period | | 894,958,543 | | 791,583,596 |
| End of period | $ | 1,209,670,065 | $ | 894,958,543 |
| | | | | |
| | | | | |
Financial Highlights
Fidelity Advisor® China Region Fund Class A |
| |
| Years ended October 31, | | 2024 | | 2023 | | 2022 | | 2021 | | 2020 |
Selected Per-Share Data | | | | | | | | | | |
| Net asset value, beginning of period | $ | 30.63 | $ | 24.85 | $ | 50.32 | $ | 50.90 | $ | 35.86 |
| Income from Investment Operations | | | | | | | | | | |
Net investment income (loss) A,B | | .41 | | .22 | | .14 | | .06 | | .08 |
| Net realized and unrealized gain (loss) | | 9.50 | | 5.75 C | | (20.99) | | 1.95 | | 15.11 |
| Total from investment operations | | 9.91 | | 5.97 | | (20.85) | | 2.01 | | 15.19 |
| Distributions from net investment income | | (.50) | | (.19) | | - | | (.44) | | (.15) |
| Distributions from net realized gain | | - | | - | | (4.62) | | (2.16) | | - |
| Total distributions | | (.50) | | (.19) | | (4.62) | | (2.59) D | | (.15) |
| Net asset value, end of period | $ | 40.04 | $ | 30.63 | $ | 24.85 | $ | 50.32 | $ | 50.90 |
Total Return E,F | | | | 23.98% C | | (45.20)% | | 3.65% | | 42.52% |
Ratios to Average Net Assets B,G,H | | | | | | | | | | |
| Expenses before reductions | | 1.19% | | 1.25% | | 1.23% | | 1.21% | | 1.24% |
| Expenses net of fee waivers, if any | | | | 1.25% | | 1.22% | | 1.21% | | 1.24% |
| Expenses net of all reductions | | 1.19% | | 1.25% | | 1.22% | | 1.21% | | 1.22% |
| Net investment income (loss) | | 1.18% | | .66% | | .38% | | .11% | | .18% |
| Supplemental Data | | | | | | | | | | |
| Net assets, end of period (000 omitted) | $ | 25,856 | $ | 21,354 | $ | 19,362 | $ | 45,301 | $ | 39,303 |
Portfolio turnover rate I | | | | 24% | | 20% | | 60% | | 60% |
ACalculated based on average shares outstanding during the period.
BNet investment income (loss) is affected by the timing of the declaration of dividends by any underlying mutual funds or exchange-traded funds (ETFs). Net investment income (loss) of any mutual funds or ETFs is not included in the Fund's net investment income (loss) ratio.
CAmount includes a reimbursement from the investment adviser for an operational error which amounted to less than $.01 per share. Excluding this reimbursement, the total return would have been 23.96%.
DTotal distributions per share do not sum due to rounding.
ETotal returns would have been lower if certain expenses had not been reduced during the applicable periods shown.
FTotal returns do not include the effect of the sales charges.
GFees and expenses of any underlying mutual funds or exchange-traded funds (ETFs) are not included in the Fund's expense ratio. The Fund indirectly bears its proportionate share of these expenses. For additional expense information related to investments in Fidelity Central Funds, please refer to the "Investments in Fidelity Central Funds" note found in the Notes to Financial Statements section of the most recent Annual or Semi-Annual report.
HExpense ratios reflect operating expenses of the class. Expenses before reductions do not reflect amounts reimbursed, waived, or reduced through arrangements with the investment adviser, brokerage services, or other offset arrangements, if applicable, and do not represent the amount paid by the class during periods when reimbursements, waivers or reductions occur.
IAmount does not include the portfolio activity of any underlying mutual funds or exchange-traded funds (ETFs).
Fidelity Advisor® China Region Fund Class M |
| |
| Years ended October 31, | | 2024 | | 2023 | | 2022 | | 2021 | | 2020 |
Selected Per-Share Data | | | | | | | | | | |
| Net asset value, beginning of period | $ | 30.34 | $ | 24.61 | $ | 50.02 | $ | 50.64 | $ | 35.66 |
| Income from Investment Operations | | | | | | | | | | |
Net investment income (loss) A,B | | .32 | | .13 | | .03 | | (.10) | | (.05) |
| Net realized and unrealized gain (loss) | | 9.43 | | 5.69 C | | (20.82) | | 1.96 | | 15.04 |
| Total from investment operations | | 9.75 | | 5.82 | | (20.79) | | 1.86 | | 14.99 |
| Distributions from net investment income | | (.40) | | (.09) | | - | | (.32) | | (.01) |
| Distributions from net realized gain | | - | | - | | (4.62) | | (2.16) | | - |
| Total distributions | | (.40) | | (.09) | | (4.62) | | (2.48) | | (.01) |
| Net asset value, end of period | $ | 39.69 | $ | 30.34 | $ | 24.61 | $ | 50.02 | $ | 50.64 |
Total Return D,E | | | | 23.64% C | | (45.37)% | | 3.36% | | 42.04% |
Ratios to Average Net Assets B,F,G | | | | | | | | | | |
| Expenses before reductions | | 1.44% | | 1.52% | | 1.53% | | 1.50% | | 1.56% |
| Expenses net of fee waivers, if any | | | | 1.52% | | 1.53% | | 1.50% | | 1.56% |
| Expenses net of all reductions | | 1.44% | | 1.51% | | 1.53% | | 1.50% | | 1.53% |
| Net investment income (loss) | | .93% | | .40% | | .08% | | (.18)% | | (.13)% |
| Supplemental Data | | | | | | | | | | |
| Net assets, end of period (000 omitted) | $ | 9,322 | $ | 6,610 | $ | 5,803 | $ | 12,623 | $ | 12,028 |
Portfolio turnover rate H | | | | 24% | | 20% | | 60% | | 60% |
ACalculated based on average shares outstanding during the period.
BNet investment income (loss) is affected by the timing of the declaration of dividends by any underlying mutual funds or exchange-traded funds (ETFs). Net investment income (loss) of any mutual funds or ETFs is not included in the Fund's net investment income (loss) ratio.
CAmount includes a reimbursement from the investment adviser for an operational error which amounted to less than $.01 per share. Excluding this reimbursement, the total return would have been 23.62%.
DTotal returns would have been lower if certain expenses had not been reduced during the applicable periods shown.
ETotal returns do not include the effect of the sales charges.
FFees and expenses of any underlying mutual funds or exchange-traded funds (ETFs) are not included in the Fund's expense ratio. The Fund indirectly bears its proportionate share of these expenses. For additional expense information related to investments in Fidelity Central Funds, please refer to the "Investments in Fidelity Central Funds" note found in the Notes to Financial Statements section of the most recent Annual or Semi-Annual report.
GExpense ratios reflect operating expenses of the class. Expenses before reductions do not reflect amounts reimbursed, waived, or reduced through arrangements with the investment adviser, brokerage services, or other offset arrangements, if applicable, and do not represent the amount paid by the class during periods when reimbursements, waivers or reductions occur.
HAmount does not include the portfolio activity of any underlying mutual funds or exchange-traded funds (ETFs).
Fidelity Advisor® China Region Fund Class C |
| |
| Years ended October 31, | | 2024 | | 2023 | | 2022 | | 2021 | | 2020 |
Selected Per-Share Data | | | | | | | | | | |
| Net asset value, beginning of period | $ | 29.03 | $ | 23.59 | $ | 48.34 | $ | 49.10 | $ | 34.71 |
| Income from Investment Operations | | | | | | | | | | |
Net investment income (loss) A,B | | .14 | | (.02) | | (.13) | | (.35) | | (.22) |
| Net realized and unrealized gain (loss) | | 9.05 | | 5.46 C | | (20.00) | | 1.92 | | 14.61 |
| Total from investment operations | | 9.19 | | 5.44 | | (20.13) | | 1.57 | | 14.39 |
| Distributions from net investment income | | (.19) | | - | | - | | (.17) | | - |
| Distributions from net realized gain | | - | | - | | (4.62) | | (2.16) | | - |
| Total distributions | | (.19) | | - | | (4.62) | | (2.33) | | - |
| Net asset value, end of period | $ | 38.03 | $ | 29.03 | $ | 23.59 | $ | 48.34 | $ | 49.10 |
Total Return D,E | | | | 23.06% C | | (45.60)% | | 2.89% | | 41.46% |
Ratios to Average Net Assets B,F,G | | | | | | | | | | |
| Expenses before reductions | | 1.94% | | 1.97% | | 1.96% | | 1.96% | | 1.98% |
| Expenses net of fee waivers, if any | | | | 1.96% | | 1.96% | | 1.96% | | 1.98% |
| Expenses net of all reductions | | 1.94% | | 1.96% | | 1.96% | | 1.96% | | 1.96% |
| Net investment income (loss) | | .43% | | (.05)% | | (.36)% | | (.65)% | | (.55)% |
| Supplemental Data | | | | | | | | | | |
| Net assets, end of period (000 omitted) | $ | 4,628 | $ | 4,834 | $ | 5,784 | $ | 13,168 | $ | 11,308 |
Portfolio turnover rate H | | | | 24% | | 20% | | 60% | | 60% |
ACalculated based on average shares outstanding during the period.
BNet investment income (loss) is affected by the timing of the declaration of dividends by any underlying mutual funds or exchange-traded funds (ETFs). Net investment income (loss) of any mutual funds or ETFs is not included in the Fund's net investment income (loss) ratio.
CAmount includes a reimbursement from the investment adviser for an operational error which amounted to less than $.01 per share. Excluding this reimbursement, the total return would have been 23.04%.
DTotal returns would have been lower if certain expenses had not been reduced during the applicable periods shown.
ETotal returns do not include the effect of the contingent deferred sales charge.
FFees and expenses of any underlying mutual funds or exchange-traded funds (ETFs) are not included in the Fund's expense ratio. The Fund indirectly bears its proportionate share of these expenses. For additional expense information related to investments in Fidelity Central Funds, please refer to the "Investments in Fidelity Central Funds" note found in the Notes to Financial Statements section of the most recent Annual or Semi-Annual report.
GExpense ratios reflect operating expenses of the class. Expenses before reductions do not reflect amounts reimbursed, waived, or reduced through arrangements with the investment adviser, brokerage services, or other offset arrangements, if applicable, and do not represent the amount paid by the class during periods when reimbursements, waivers or reductions occur.
HAmount does not include the portfolio activity of any underlying mutual funds or exchange-traded funds (ETFs).
Fidelity® China Region Fund |
| |
| Years ended October 31, | | 2024 | | 2023 | | 2022 | | 2021 | | 2020 |
Selected Per-Share Data | | | | | | | | | | |
| Net asset value, beginning of period | $ | 31.11 | $ | 25.28 | $ | 51.03 | $ | 51.53 | $ | 36.30 |
| Income from Investment Operations | | | | | | | | | | |
Net investment income (loss) A,B | | .51 | | .32 | | .25 | | .23 | | .21 |
| Net realized and unrealized gain (loss) | | 9.64 | | 5.85 C | | (21.32) | | 1.97 | | 15.28 |
| Total from investment operations | | 10.15 | | 6.17 | | (21.07) | | 2.20 | | 15.49 |
| Distributions from net investment income | | (.62) | | (.34) | | (.06) | | (.54) | | (.26) |
| Distributions from net realized gain | | - | | - | | (4.62) | | (2.16) | | - |
| Total distributions | | (.62) | | (.34) | | (4.68) | | (2.70) | | (.26) |
| Net asset value, end of period | $ | 40.64 | $ | 31.11 | $ | 25.28 | $ | 51.03 | $ | 51.53 |
Total Return D | | | | 24.34% C | | (45.04)% | | 3.97% | | 42.95% |
Ratios to Average Net Assets B,E,F | | | | | | | | | | |
| Expenses before reductions | | .92% | | .95% | | .94% | | .91% | | .93% |
| Expenses net of fee waivers, if any | | | | .95% | | .93% | | .91% | | .93% |
| Expenses net of all reductions | | .92% | | .95% | | .93% | | .91% | | .91% |
| Net investment income (loss) | | 1.45% | | .96% | | .67% | | .41% | | .49% |
| Supplemental Data | | | | | | | | | | |
| Net assets, end of period (000 omitted) | $ | 972,318 | $ | 809,283 | $ | 736,185 | $ | 1,609,326 | $ | 1,518,404 |
Portfolio turnover rate G | | | | 24% | | 20% | | 60% | | 60% |
ACalculated based on average shares outstanding during the period.
BNet investment income (loss) is affected by the timing of the declaration of dividends by any underlying mutual funds or exchange-traded funds (ETFs). Net investment income (loss) of any mutual funds or ETFs is not included in the Fund's net investment income (loss) ratio.
CAmount includes a reimbursement from the investment adviser for an operational error which amounted to less than $.01 per share. Excluding this reimbursement, the total return would have been 24.32%.
DTotal returns would have been lower if certain expenses had not been reduced during the applicable periods shown.
EFees and expenses of any underlying mutual funds or exchange-traded funds (ETFs) are not included in the Fund's expense ratio. The Fund indirectly bears its proportionate share of these expenses. For additional expense information related to investments in Fidelity Central Funds, please refer to the "Investments in Fidelity Central Funds" note found in the Notes to Financial Statements section of the most recent Annual or Semi-Annual report.
FExpense ratios reflect operating expenses of the class. Expenses before reductions do not reflect amounts reimbursed, waived, or reduced through arrangements with the investment adviser, brokerage services, or other offset arrangements, if applicable, and do not represent the amount paid by the class during periods when reimbursements, waivers or reductions occur.
GAmount does not include the portfolio activity of any underlying mutual funds or exchange-traded funds (ETFs).
Fidelity Advisor® China Region Fund Class I |
| |
| Years ended October 31, | | 2024 | | 2023 | | 2022 | | 2021 | | 2020 |
Selected Per-Share Data | | | | | | | | | | |
| Net asset value, beginning of period | $ | 30.87 | $ | 25.07 | $ | 50.63 | $ | 51.16 | $ | 36.05 |
| Income from Investment Operations | | | | | | | | | | |
Net investment income (loss) A,B | | .51 | | .32 | | .25 | | .22 | | .20 |
| Net realized and unrealized gain (loss) | | 9.56 | | 5.82 C | | (21.15) | | 1.96 | | 15.17 |
| Total from investment operations | | 10.07 | | 6.14 | | (20.90) | | 2.18 | | 15.37 |
| Distributions from net investment income | | (.60) | | (.34) | | (.04) | | (.55) | | (.26) |
| Distributions from net realized gain | | - | | - | | (4.62) | | (2.16) | | - |
| Total distributions | | (.60) | | (.34) | | (4.66) | | (2.71) | | (.26) |
| Net asset value, end of period | $ | 40.34 | $ | 30.87 | $ | 25.07 | $ | 50.63 | $ | 51.16 |
Total Return D | | | | 24.40% C | | (45.05)% | | 3.96% | | 42.91% |
Ratios to Average Net Assets B,E,F | | | | | | | | | | |
| Expenses before reductions | | .91% | | .94% | | .93% | | .93% | | .95% |
| Expenses net of fee waivers, if any | | | | .93% | | .93% | | .93% | | .95% |
| Expenses net of all reductions | | .91% | | .93% | | .93% | | .93% | | .93% |
| Net investment income (loss) | | 1.46% | | .98% | | .68% | | .39% | | .48% |
| Supplemental Data | | | | | | | | | | |
| Net assets, end of period (000 omitted) | $ | 32,635 | $ | 26,683 | $ | 20,509 | $ | 68,464 | $ | 47,688 |
Portfolio turnover rate G | | | | 24% | | 20% | | 60% | | 60% |
ACalculated based on average shares outstanding during the period.
BNet investment income (loss) is affected by the timing of the declaration of dividends by any underlying mutual funds or exchange-traded funds (ETFs). Net investment income (loss) of any mutual funds or ETFs is not included in the Fund's net investment income (loss) ratio.
CAmount includes a reimbursement from the investment adviser for an operational error which amounted to less than $.01 per share. Excluding this reimbursement, the total return would have been 24.38%.
DTotal returns would have been lower if certain expenses had not been reduced during the applicable periods shown.
EFees and expenses of any underlying mutual funds or exchange-traded funds (ETFs) are not included in the Fund's expense ratio. The Fund indirectly bears its proportionate share of these expenses. For additional expense information related to investments in Fidelity Central Funds, please refer to the "Investments in Fidelity Central Funds" note found in the Notes to Financial Statements section of the most recent Annual or Semi-Annual report.
FExpense ratios reflect operating expenses of the class. Expenses before reductions do not reflect amounts reimbursed, waived, or reduced through arrangements with the investment adviser, brokerage services, or other offset arrangements, if applicable, and do not represent the amount paid by the class during periods when reimbursements, waivers or reductions occur.
GAmount does not include the portfolio activity of any underlying mutual funds or exchange-traded funds (ETFs).
Fidelity Advisor® China Region Fund Class Z |
| |
| Years ended October 31, | | 2024 | | 2023 | | 2022 | | 2021 | | 2020 |
Selected Per-Share Data | | | | | | | | | | |
| Net asset value, beginning of period | $ | 30.90 | $ | 25.02 | $ | 50.57 | $ | 51.07 | $ | 36.00 |
| Income from Investment Operations | | | | | | | | | | |
Net investment income (loss) A,B | | .57 | | .36 | | .30 | | .29 | | .26 |
| Net realized and unrealized gain (loss) | | 9.55 | | 5.80 C | | (21.10) | | 1.95 | | 15.14 |
| Total from investment operations | | 10.12 | | 6.16 | | (20.80) | | 2.24 | | 15.40 |
| Distributions from net investment income | | (.68) | | (.28) | | (.12) | | (.59) | | (.33) |
| Distributions from net realized gain | | - | | - | | (4.62) | | (2.16) | | - |
| Total distributions | | (.68) | | (.28) | | (4.75) D | | (2.74) D | | (.33) |
| Net asset value, end of period | $ | 40.34 | $ | 30.90 | $ | 25.02 | $ | 50.57 | $ | 51.07 |
Total Return E | | | | 24.55% C | | (44.97)% | | 4.09% | | 43.13% |
Ratios to Average Net Assets B,F,G | | | | | | | | | | |
| Expenses before reductions | | .77% | | .81% | | .80% | | .80% | | .81% |
| Expenses net of fee waivers, if any | | | | .80% | | .80% | | .80% | | .81% |
| Expenses net of all reductions | | .77% | | .80% | | .80% | | .80% | | .79% |
| Net investment income (loss) | | 1.60% | | 1.11% | | .81% | | .52% | | .61% |
| Supplemental Data | | | | | | | | | | |
| Net assets, end of period (000 omitted) | $ | 164,912 | $ | 26,195 | $ | 3,940 | $ | 71,573 | $ | 71,121 |
Portfolio turnover rate H | | | | 24% | | 20% | | 60% | | 60% |
ACalculated based on average shares outstanding during the period.
BNet investment income (loss) is affected by the timing of the declaration of dividends by any underlying mutual funds or exchange-traded funds (ETFs). Net investment income (loss) of any mutual funds or ETFs is not included in the Fund's net investment income (loss) ratio.
CAmount includes a reimbursement from the investment adviser for an operational error which amounted to less than $.01 per share. Excluding this reimbursement, the total return would have been 24.53%.
DTotal distributions per share do not sum due to rounding.
ETotal returns would have been lower if certain expenses had not been reduced during the applicable periods shown.
FFees and expenses of any underlying mutual funds or exchange-traded funds (ETFs) are not included in the Fund's expense ratio. The Fund indirectly bears its proportionate share of these expenses. For additional expense information related to investments in Fidelity Central Funds, please refer to the "Investments in Fidelity Central Funds" note found in the Notes to Financial Statements section of the most recent Annual or Semi-Annual report.
GExpense ratios reflect operating expenses of the class. Expenses before reductions do not reflect amounts reimbursed, waived, or reduced through arrangements with the investment adviser, brokerage services, or other offset arrangements, if applicable, and do not represent the amount paid by the class during periods when reimbursements, waivers or reductions occur.
HAmount does not include the portfolio activity of any underlying mutual funds or exchange-traded funds (ETFs).
Notes to Financial Statements
For the period ended October 31, 2024
1. Organization.
Fidelity China Region Fund (the Fund) is a fund of Fidelity Investment Trust (the Trust) and is authorized to issue an unlimited number of shares. The Trust is registered under the Investment Company Act of 1940, as amended (the 1940 Act), as an open-end management investment company organized as a Massachusetts business trust. The Fund offers Class A, Class M, Class C, China Region, Class I and Class Z shares, each of which has equal rights as to assets and voting privileges. Class A, Class M, Class C, Class I and Class Z are Fidelity Advisor classes. Each class has exclusive voting rights with respect to matters that affect that class. Class C shares will automatically convert to Class A shares after a holding period of eight years from the initial date of purchase, with certain exceptions. The Fund's investments in emerging markets can be subject to social, economic, regulatory, and political uncertainties and can be extremely volatile.
2. Investments in Fidelity Central Funds.
Funds may invest in Fidelity Central Funds, which are open-end investment companies generally available only to other investment companies and accounts managed by the investment adviser and its affiliates. The Schedule of Investments lists any Fidelity Central Funds held as an investment as of period end, but does not include the underlying holdings of each Fidelity Central Fund. An investing fund indirectly bears its proportionate share of the expenses of the underlying Fidelity Central Funds.
Based on its investment objective, each Fidelity Central Fund may invest or participate in various investment vehicles or strategies that are similar to those of the investing fund. These strategies are consistent with the investment objectives of the investing fund and may involve certain economic risks which may cause a decline in value of each of the Fidelity Central Funds and thus a decline in the value of the investing fund.
| Fidelity Central Fund | Investment Manager | Investment Objective | Investment Practices | Expense RatioA |
| Fidelity Money Market Central Funds | Fidelity Management & Research Company LLC (FMR) | Each fund seeks to obtain a high level of current income consistent with the preservation of capital and liquidity. | Short-term Investments | Less than .005% |
A Expenses expressed as a percentage of average net assets and are as of each underlying Central Fund's most recent annual or semi-annual shareholder report.
A complete unaudited list of holdings for each Fidelity Central Fund is available upon request or at the Securities and Exchange Commission website at www.sec.gov. In addition, the financial statements of the Fidelity Central Funds which contain the significant accounting policies (including investment valuation policies) of those funds, and are not covered by the Report of Independent Registered Public Accounting Firm, are available on the Securities and Exchange Commission website or upon request.
3. Significant Accounting Policies.
The Fund is an investment company and applies the accounting and reporting guidance of the Financial Accounting Standards Board (FASB) Accounting Standards Codification Topic 946 Financial Services - Investment Companies. The financial statements have been prepared in conformity with accounting principles generally accepted in the United States of America (GAAP), which require management to make certain estimates and assumptions at the date of the financial statements. Actual results could differ from those estimates. Subsequent events, if any, through the date that the financial statements were issued have been evaluated in the preparation of the financial statements. The Fund's Schedule of Investments lists any underlying mutual funds or exchange-traded funds (ETFs) but does not include the underlying holdings of these funds. The following summarizes the significant accounting policies of the Fund:
Investment Valuation. Investments are valued as of 4:00 p.m. Eastern time on the last calendar day of the period. The Board of Trustees (the Board) has designated the Fund's investment adviser as the valuation designee responsible for the fair valuation function and performing fair value determinations as needed. The investment adviser has established a Fair Value Committee (the Committee) to carry out the day-to-day fair valuation responsibilities and has adopted policies and procedures to govern the fair valuation process and the activities of the Committee. In accordance with these fair valuation policies and procedures, which have been approved by the Board, the Fund attempts to obtain prices from one or more third party pricing services or brokers to value its investments. When current market prices, quotations or currency exchange rates are not readily available or reliable, investments will be fair valued in good faith by the Committee, in accordance with the policies and procedures. Factors used in determining fair value vary by investment type and may include market or investment specific events, transaction data, estimated cash flows, and market observations of comparable investments. The frequency that the fair valuation procedures are used cannot be predicted and they may be utilized to a significant extent. The Committee manages the Fund's fair valuation practices and maintains the fair valuation policies and procedures. The Fund's investment adviser reports to the Board information regarding the fair valuation process and related material matters.
The Fund categorizes the inputs to valuation techniques used to value its investments into a disclosure hierarchy consisting of three levels as shown below:
Level 1 - unadjusted quoted prices in active markets for identical investments
Level 2 - other significant observable inputs (including quoted prices for similar investments, interest rates, prepayment speeds, etc.)
Level 3 - unobservable inputs (including the Fund's own assumptions based on the best information available)
Valuation techniques used to value the Fund's investments by major category are as follows:
Equity securities, including restricted securities, for which market quotations are readily available, are valued at the last reported sale price or official closing price as reported by a third party pricing service on the primary market or exchange on which they are traded and are categorized as Level 1 in the hierarchy. In the event there were no sales during the day or closing prices are not available, securities are valued at the last quoted bid price or may be valued using the last available price and are generally categorized as Level 2 in the hierarchy. For foreign equity securities, when market or security specific events arise, comparisons to the valuation of American Depositary Receipts (ADRs), futures contracts, Exchange-Traded Funds (ETFs) and certain indexes as well as quoted prices for similar securities may be used and would be categorized as Level 2 in the hierarchy. For equity securities, including restricted securities, where observable inputs are limited, assumptions about market activity and risk are used and these securities may be categorized as Level 3 in the hierarchy. Securities, including private placements or other restricted securities, for which observable inputs are not available are valued using alternate valuation approaches, including the market approach, the income approach and cost approach, and are categorized as Level 3 in the hierarchy. The market approach considers factors including the price of recent investments in the same or a similar security or financial metrics of comparable securities. The income approach considers factors including expected future cash flows, security specific risks and corresponding discount rates. The cost approach considers factors including the value of the security's underlying assets and liabilities.
Investments in open-end mutual funds, including the Fidelity Central Funds, are valued at their closing net asset value (NAV) each business day and are categorized as Level 1 in the hierarchy.
The following provides information on Level 3 securities held by the Fund that were valued at period end based on unobservable inputs. These amounts exclude valuations provided by a broker.
| Asset Type | Fair Value | Valuation Technique(s) | Unobservable Input | Amount or Range/Weighted Average | Impact to Valuation from an Increase in InputA |
| Equities | $12,316,680 | Market comparable | Enterprise value/Revenue multiple (EV/R) | 2.5 - 2.8 / 2.5 | Increase |
| | | | Enterprise value/EBITDA multiple (EV/EBITDA) | 22.3 | Increase |
| | | Black scholes | Discount rate | 4.0% | Increase |
| | | | Term | 3.0 | Increase |
| | | | Volatility | 60.0% | Increase |
A Represents the directional change in the fair value of the Level 3 investments that could have resulted from an increase in the corresponding input as of period end. A decrease to the unobservable input would have had the opposite effect. Significant changes in these inputs may have resulted in a significantly higher or lower fair value measurement at period end.
Changes in valuation techniques may result in transfers in or out of an assigned level within the disclosure hierarchy. The aggregate value of investments by input level as of October 31, 2024, as well as a roll forward of Level 3 investments, is included at the end of the Fund's Schedule of Investments.
Foreign Currency. Certain Funds may use foreign currency contracts to facilitate transactions in foreign-denominated securities. Gains and losses from these transactions may arise from changes in the value of the foreign currency or if the counterparties do not perform under the contracts' terms.
Foreign-denominated assets, including investment securities, and liabilities are translated into U.S. dollars at the exchange rates at period end. Purchases and sales of investment securities, income and dividends received, and expenses denominated in foreign currencies are translated into U.S. dollars at the exchange rate in effect on the transaction date.
The effects of exchange rate fluctuations on investments are included with the net realized and unrealized gain (loss) on investment securities. Other foreign currency transactions resulting in realized and unrealized gain (loss) are disclosed separately.
Investment Transactions and Income. For financial reporting purposes, the Fund's investment holdings and NAV include trades executed through the end of the last business day of the period. The NAV per share for processing shareholder transactions is calculated as of the close of business of the New York Stock Exchange (NYSE), normally 4:00 p.m. Eastern time and includes trades executed through the end of the prior business day. Gains and losses on securities sold are determined on the basis of identified cost and include proceeds received from litigation. Commissions paid to certain brokers with whom the investment adviser, or its affiliates, places trades on behalf of a fund include an amount in addition to trade execution, which may be rebated back to a fund. Any such rebates are included in net realized gain (loss) on investments in the Statement of Operations. Dividend income is recorded on the ex-dividend date, except for certain dividends from foreign securities where the ex-dividend date may have passed, which are recorded as soon as the Fund is informed of the ex-dividend date. Non-cash dividends included in dividend income, if any, are recorded at the fair market value of the securities received. Income and capital gain distributions from Fidelity Central Funds, if any, are recorded on the ex-dividend date. Investment income is recorded net of foreign taxes withheld where recovery of such taxes is uncertain. Funds may file withholding tax reclaims in certain jurisdictions to recover a portion of amounts previously withheld. Any withholding tax reclaims income is included in the Statement of Operations in foreign taxes withheld. Any receivables for withholding tax reclaims are included in the Statement of Assets and Liabilities in dividends receivable. The Fund has filed tax reclaims for previously withheld taxes on dividends earned in certain European Union (EU) countries. These additional filings are subject to various administrative proceedings by the local jurisdictions' tax authorities within the EU, as well as a number of related judicial proceedings. Income recognized for EU reclaims is included with other reclaims in the Statement of Operations in foreign taxes withheld. These reclaims are recorded when the amount is known and there are no significant uncertainties on collectability.
Class Allocations and Expenses. Investment income, realized and unrealized capital gains and losses, common expenses of a fund, and certain fund-level expense reductions, if any, are allocated daily on a pro-rata basis to each class based on the relative net assets of each class to the total net assets of a fund. Each class differs with respect to transfer agent and distribution and service plan fees incurred, as applicable. Certain expense reductions may also differ by class, if applicable. For the reporting period, the allocated portion of income and expenses to each class as a percent of its average net assets may vary due to the timing of recording these transactions in relation to fluctuating net assets of the classes. Expenses directly attributable to a fund are charged to that fund. Expenses attributable to more than one fund are allocated among the respective funds on the basis of relative net assets or other appropriate methods. Expenses included in the accompanying financial statements reflect the expenses of that fund and do not include any expenses associated with any underlying mutual funds or exchange-traded funds (ETFs). Although not included in a fund's expenses, a fund indirectly bears its proportionate share of these expenses through the net asset value of each underlying mutual fund or exchange-traded fund (ETF). Expense estimates are accrued in the period to which they relate and adjustments are made when actual amounts are known.
Income Tax Information and Distributions to Shareholders. Each year, the Fund intends to qualify as a regulated investment company under Subchapter M of the Internal Revenue Code, including distributing substantially all of its taxable income and realized gains. As a result, no provision for U.S. Federal income taxes is required. As of October 31, 2024, the Fund did not have any unrecognized tax benefits in the financial statements; nor is the Fund aware of any tax positions for which it is reasonably possible that the total amounts of unrecognized tax benefits will significantly change in the next twelve months. The Fund files a U.S. federal tax return, in addition to state and local tax returns as required. The Fund's federal income tax returns are subject to examination by the Internal Revenue Service (IRS) for a period of three fiscal years after they are filed. State and local tax returns may be subject to examination for an additional fiscal year depending on the jurisdiction. Foreign taxes are provided for based on the Fund's understanding of the tax rules and rates that exist in the foreign markets in which it invests.
Distributions are declared and recorded on the ex-dividend date. Income and capital gain distributions are declared separately for each class. Income and capital gain distributions are determined in accordance with income tax regulations, which may differ from GAAP. In addition, the Fund claimed a portion of the payment made to redeeming shareholders as a distribution for income tax purposes.
Capital accounts within the financial statements are adjusted for permanent book-tax differences. These adjustments have no impact on net assets or the results of operations. Capital accounts are not adjusted for temporary book-tax differences which will reverse in a subsequent period.
Book-tax differences are primarily due to foreign currency transactions, passive foreign investment companies (PFIC), capital loss carryforwards, certain corporate actions and losses deferred due to wash sales.
As of period end, the cost and unrealized appreciation (depreciation) in securities, and derivatives if applicable, for federal income tax purposes were as follows:
| Gross unrealized appreciation | $446,934,644 |
| Gross unrealized depreciation | (67,482,650) |
| Net unrealized appreciation (depreciation) | $379,451,994 |
| Tax Cost | $829,203,334 |
The tax-based components of distributable earnings as of period end were as follows:
| Undistributed ordinary income | $15,484,506 |
| Capital loss carryforward | $(234,511,880) |
| Net unrealized appreciation (depreciation) on securities and other investments | $379,442,779 |
Capital loss carryforwards are only available to offset future capital gains of the Fund to the extent provided by regulations and may be limited. The capital loss carryforward information presented below, including any applicable limitation, is estimated as of fiscal period end and is subject to adjustment.
Short-term | $(123,365,904) |
Long-term | (111,145,976) |
| Total capital loss carryforward | $(234,511,880) |
The tax character of distributions paid was as follows:
| | October 31, 2024 | October 31, 2023 |
| Ordinary Income | $17,558,581 | $10,463,693 |
| Total | $17,558,581 | $10,463,693 |
Restricted Securities (including Private Placements). Funds may invest in securities that are subject to legal or contractual restrictions on resale. These securities generally may be resold in transactions exempt from registration or to the public if the securities are registered. Disposal of these securities may involve time-consuming negotiations and expense, and prompt sale at an acceptable price may be difficult. Information regarding restricted securities held at period end is included at the end of the Schedule of Investments, if applicable.
New Accounting Pronouncement. In November 2023, the FASB issued Accounting Standards Update (ASU) 2023-07 Segment Reporting (Topic 280): Improvements to Reportable Segment Disclosures. Effective for fiscal years beginning after December 15, 2023 and interim periods within fiscal years beginning after December 15, 2024, the amendments enhance required disclosures of segment information for public entities on an annual and interim basis. The ASU allows for early adoption with updates applied retrospectively. Management is currently evaluating the impact of the ASU but does not expect this guidance to materially impact the financial statements.
4. Purchases and Sales of Investments.
Purchases and sales of securities, other than short-term securities and in-kind transactions, as applicable, are noted in the table below.
| | Purchases ($) | Sales ($) |
| Fidelity China Region Fund | 309,876,496 | 293,124,447 |
5. Fees and Other Transactions with Affiliates.
Management Fee. Fidelity Management & Research Company LLC (the investment adviser) and its affiliates provide the Fund with investment management related services for which the Fund pays a monthly management fee.
Effective March 1, 2024, the Fund's management contract was amended to incorporate administrative services previously covered under separate services agreements (Transfer Agent and Accounting agreements). The amended contract incorporates a management fee rate that may vary by class. The investment adviser or an affiliate pays certain expenses of managing and operating the Fund out of each class's management fee. Each class of the Fund pays a management fee to the investment adviser. The management fee is calculated and paid to the investment adviser every month. When determining a class's management fee, a mandate rate is calculated based on the monthly average net assets of a group of funds advised by FMR within a designated asset class. A discount rate is subtracted from the mandate rate once the Fund's monthly average net assets reach a certain level. The mandate rate and discount rate may vary by class. The annual management fee rate for a class of shares of the Fund is the lesser of (1) the class's mandate rate reduced by the class's discount rate (if applicable) or (2) the amount set forth in the following table.
| | Maximum Management Fee Rate % |
| Class A | .89 |
| Class M | .89 |
| Class C | .89 |
| China Region | .87 |
| Class I | .86 |
| Class Z | .73 |
One-twelfth of the management fee rate for a class is applied to the average net assets of the class for the month, giving a dollar amount which is the management fee for the class for that month. A different management fee rate may be applicable to each class of the Fund. The difference between classes is the result of separate arrangements for class-level services and/or waivers of certain expenses. It is not the result of any difference in advisory or custodial fees or other expenses related to the management of the Fund's assets, which do not vary by class. For the portion of the reporting period on or after March 1, 2024, the total annualized management fee rates were as follows:
| | Total Management Fee Rate % |
| Class A | .89 |
| Class M | .89 |
| Class C | .89 |
| China Region | .87 |
| Class I | .86 |
| Class Z | .73 |
Prior to March 1, 2024, the management fee was the sum of an individual fund fee rate that was based on an annual rate of .45% of the Fund's average net assets and an annualized group fee rate that averaged .22% during the period. The group fee rate was based upon the monthly average net assets of a group of registered investment companies with which the investment adviser has management contracts. The group fee rate decreased as assets under management increased and increased as assets under management decreased. For the portion of the reporting period prior to March 1, 2024, the total annualized management fee rate was .67%.
Effective March 1, 2024, the Fund's sub-advisory agreements with FMR Investment Management (UK) Limited, Fidelity Management & Research (Hong Kong) Limited, and Fidelity Management & Research (Japan) Limited were amended to provide that the investment adviser pays each sub-adviser monthly fees equal to 110% of the sub-adviser's costs for providing sub-advisory services.
Effective March 1, 2024, the Fund's sub-advisory agreement with FIL Investment Advisors (FIA) was amended to provide that the investment adviser pays FIA monthly fees at an annual rate of 0.50% with respect to the average daily net assets of the Fund managed by FIA. FIA in turn pays FIA(UK).
Distribution and Service Plan Fees. In accordance with Rule 12b-1 of the 1940 Act, the Fund has adopted separate Distribution and Service Plans for each class of shares. Certain classes pay Fidelity Distributors Company LLC (FDC), an affiliate of the investment adviser, separate Distribution and Service Fees, each of which is based on an annual percentage of each class' average net assets. In addition, FDC may pay financial intermediaries for selling shares of the Fund and providing shareholder support services. For the period, the Distribution and Service Fee rates, total fees and amounts retained by FDC were as follows:
| | Distribution Fee | Service Fee | Total Fees ($) | Retained by FDC ($) |
| Class A | - % | .25% | 55,309 | 2,191 |
| Class M | .25% | .25% | 35,428 | - |
| Class C | .75% | .25% | 44,607 | 6,788 |
| | | | 135,344 | 8,979 |
Sales Load. FDC may receive a front-end sales charge of up to 5.75% for selling Class A shares and 3.50% for selling Class M shares, some of which is paid to financial intermediaries for selling shares of the Fund. Depending on the holding period, FDC may receive contingent deferred sales charges levied on Class A, Class M and Class C redemptions. The deferred sales charges are 1.00% for Class C shares, 1.00% for certain purchases of Class A shares and .25% for certain purchases of Class M shares.
For the period, sales charge amounts retained by FDC were as follows:
| | Retained by FDC ($) |
| Class A | 5,822 |
| Class M | 706 |
Class CA | 32 |
| | 6,560 |
A When Class C shares are initially sold, FDC pays commissions from its own resources to financial intermediaries through which the sales are made.
Transfer Agent Fees. Fidelity Investments Institutional Operations Company LLC (FIIOC), an affiliate of the investment adviser, is the transfer, dividend disbursing and shareholder servicing agent for each class of the Fund. Effective March 1, 2024, the Fund's management contract was amended to incorporate transfer agent services and associated fees previously covered under a separate services agreement. FIIOC pays for typesetting, printing and mailing of shareholder reports, except proxy statements.
During the period December 1, 2023 through February 29, 2024, the transfer agent fees for each class were a fixed annual rate of class-level average net assets as follows:
| | % of Class-Level Average Net Assets |
| Class A | .2000 |
| Class M | .2000 |
| Class C | .2000 |
| China Region | .1844 |
| Class I | .1762 |
| Class Z | .0420 |
Prior to December 1, 2023, FIIOC received account fees and asset-based fees that varied according to the account size and type of account of the shareholders of the respective classes of the Fund, except for Class Z. FIIOC received an asset-based fee of Class Z's average net assets. For the portion of the reporting period prior to March 1, 2024, the fees were equivalent to the following annualized rates:
| | Amount ($) | % of Class-Level Average Net Assets |
| Class A | 14,731 | .21 |
| Class M | 4,603 | .21 |
| Class C | 3,147 | .20 |
| China Region | 493,408 | .18 |
| Class I | 13,524 | .17 |
| Class Z | 6,783 | .04 |
| 536,196 | |
Accounting Fees. Fidelity Service Company, Inc. (FSC), an affiliate of the investment adviser, maintains the Fund's accounting records. Effective March 1, 2024, the Fund's management contract was amended to incorporate accounting services and associated fees previously covered under a separate services agreement.
During the period December 1, 2023 through February 29, 2024, the accounting fees were a fixed annual rate of average net assets as follows:
| | % of Average Net Assets |
| Fidelity China Region Fund | .0445 |
Prior to December 1, 2023, the accounting fee was based on the level of average net assets for each month. For the portion of the reporting period prior to March 1, 2024, the fees were equivalent to the following annualized rates:
| | % of Average Net Assets |
| Fidelity China Region Fund | .04 |
Brokerage Commissions. A portion of portfolio transactions were placed with brokerage firms which are affiliates of the investment adviser. Brokerage commissions are included in net realized gain (loss) and change in net unrealized appreciation (depreciation) in the Statement of Operations. The commissions paid to these affiliated firms were as follows:
| | Amount ($) |
| Fidelity China Region Fund | 724 |
Interfund Trades. Funds may purchase from or sell securities to other Fidelity Funds under procedures adopted by the Board. The procedures have been designed to ensure these interfund trades are executed in accordance with Rule 17a-7 of the 1940 Act. Any interfund trades are included within the respective purchases and sales amounts shown in the Purchases and Sales of Investments note. Interfund trades during the period are noted in the table below.
| | Purchases ($) | Sales ($) | Realized Gain (Loss)($) |
| Fidelity China Region Fund | 2,774,811 | 5,145,063 | (9,224,545) |
6. Committed Line of Credit.
Certain Funds participate with other funds managed by the investment adviser or an affiliate in a $4.25 billion credit facility (the "line of credit") to be utilized for temporary or emergency purposes to fund shareholder redemptions or for other short-term liquidity purposes. The participating funds have agreed to pay commitment fees on their pro-rata portion of the line of credit, which are reflected in Miscellaneous expenses on the Statement of Operations, and are listed below. During the period, there were no borrowings on this line of credit.
| | Amount ($) |
| Fidelity China Region Fund | 1,577 |
7. Security Lending.
Funds lend portfolio securities from time to time in order to earn additional income. Lending agents are used, including National Financial Services (NFS), an affiliate of the investment adviser. Pursuant to a securities lending agreement, NFS will receive a fee, which is capped at 9.9% of a fund's daily lending revenue, for its services as lending agent. A fund may lend securities to certain qualified borrowers, including NFS. On the settlement date of the loan, a fund receives collateral (in the form of U.S. Treasury obligations, letters of credit and/or cash) against the loaned securities and maintains collateral in an amount not less than 100% of the market value of the loaned securities during the period of the loan. The market value of the loaned securities is determined at the close of business of a fund and any additional required collateral is delivered to a fund on the next business day. A fund or borrower may terminate the loan at any time, and if the borrower defaults on its obligation to return the securities loaned because of insolvency or other reasons, a fund may apply collateral received from the borrower against the obligation. A fund may experience delays and costs in recovering the securities loaned. Any cash collateral received is invested in the Fidelity Securities Lending Cash Central Fund. Any loaned securities are identified as such in the Schedule of Investments, and the value of loaned securities and cash collateral at period end, as applicable, are presented in the Statement of Assets and Liabilities. Security lending income represents the income earned on investing cash collateral, less rebates paid to borrowers and any lending agent fees associated with the loan, plus any premium payments received for lending certain types of securities. Security lending income is presented in the Statement of Operations as a component of income from Fidelity Central Funds. Affiliated security lending activity, if any, was as follows:
| | Total Security Lending Fees Paid to NFS ($) | Security Lending Income From Securities Loaned to NFS ($) | Value of Securities Loaned to NFS at Period End ($) |
| Fidelity China Region Fund | 4,806 | - | - |
8. Expense Reductions.
Through arrangements with the Fund's custodian and each class' transfer agent, credits realized as a result of certain uninvested cash balances were used to reduce the Fund's expenses. During the period, custodian credits reduced the Fund's expenses by $1,238. During the period, transfer agent credits reduced each class' expenses as noted in the table below.
| | Expense reduction ($) |
| Class A | 29 |
| Class M | 69 |
| Class C | 2 |
| | 100 |
In addition, during the period the investment adviser or an affiliate reimbursed and/or waived a portion of fund-level operating expenses in the amount of $40,600.
9. Distributions to Shareholders.
Distributions to shareholders of each class were as follows:
| | Year ended October 31, 2024 | Year ended October 31, 2023 |
| Fidelity China Region Fund | | |
| Distributions to shareholders | | |
| Class A | $338,330 | $147,676 |
| Class M | 85,978 | 22,086 |
| Class C | 30,918 | - |
| China Region | 15,840,360 | 9,963,708 |
| Class I | 463,654 | 287,558 |
| Class Z | 799,341 | 42,665 |
Total | $17,558,581 | $10,463,693 |
10. Share Transactions.
Share transactions for each class were as follows and may contain in-kind transactions, automatic conversions between classes or exchanges between affiliated funds:
| | Shares | Shares | Dollars | Dollars |
| | Year ended October 31, 2024 | Year ended October 31, 2023 | Year ended October 31, 2024 | Year ended October 31, 2023 |
| Fidelity China Region Fund | | | | |
| Class A | | | | |
| Shares sold | 178,844 | 213,022 | $6,717,569 | $7,300,449 |
| Reinvestment of distributions | 10,187 | 4,346 | 321,753 | 141,383 |
| Shares redeemed | (240,554) | (299,344) | (8,335,430) | (9,796,907) |
| Net increase (decrease) | (51,523) | (81,976) | $(1,296,108) | $(2,355,075) |
| Class M | | | | |
| Shares sold | 47,502 | 55,083 | $1,843,637 | $1,982,190 |
| Reinvestment of distributions | 2,728 | 682 | 85,562 | 22,023 |
| Shares redeemed | (33,205) | (73,707) | (1,091,731) | (2,410,361) |
| Net increase (decrease) | 17,025 | (17,942) | $837,468 | $(406,148) |
| Class C | | | | |
| Shares sold | 21,261 | 85,870 | $735,512 | $2,816,391 |
| Reinvestment of distributions | 934 | - | 28,179 | - |
| Shares redeemed | (67,001) | (164,625) | (2,134,280) | (5,078,761) |
| Net increase (decrease) | (44,806) | (78,755) | $(1,370,589) | $(2,262,370) |
| China Region | | | | |
| Shares sold | 5,146,816 | 4,425,610 | $191,640,410 | $152,711,723 |
| Reinvestment of distributions | 464,822 | 285,364 | 14,864,692 | 9,405,600 |
| Shares redeemed | (7,703,610) | (7,820,514) | (267,249,284) | (259,958,996) |
| Net increase (decrease) | (2,091,972) | (3,109,540) | $(60,744,182) | $(97,841,673) |
| Class I | | | | |
| Shares sold | 577,398 | 909,474 | $22,269,323 | $31,717,017 |
| Reinvestment of distributions | 12,678 | 7,396 | 402,398 | 241,861 |
| Shares redeemed | (645,608) | (870,332) | (21,463,489) | (29,080,141) |
| Net increase (decrease) | (55,532) | 46,538 | $1,208,232 | $2,878,737 |
| Class Z | | | | |
| Shares sold | 3,540,230 | 915,990 | $115,458,729 | $30,707,964 |
| Reinvestment of distributions | 24,293 | 1,256 | 770,360 | 41,047 |
| Shares redeemed | (324,534) | (226,966) | (11,618,715) | (7,451,163) |
| Net increase (decrease) | 3,239,989 | 690,280 | $104,610,374 | $23,297,848 |
11. Other.
A fund's organizational documents provide former and current trustees and officers with a limited indemnification against liabilities arising in connection with the performance of their duties to the fund. In the normal course of business, a fund may also enter into contracts that provide general indemnifications. A fund's maximum exposure under these arrangements is unknown as this would be dependent on future claims that may be made against a fund. The risk of material loss from such claims is considered remote.
At the end of the period, the following mutual funds managed by the investment adviser or its affiliates were the owners of record of 10% or more of the total outstanding shares.
| | Strategic Advisers Fidelity Emerging Markets Fund |
| Fidelity China Region Fund | 13% |
12. Risk and Uncertainties.
Many factors affect a fund's performance. Developments that disrupt global economies and financial markets, such as pandemics, epidemics, outbreaks of infectious diseases, war, terrorism, and environmental disasters, may significantly affect a fund's investment performance. The effects of these developments to a fund will be impacted by the types of securities in which a fund invests, the financial condition, industry, economic sector, and geographic location of an issuer, and a fund's level of investment in the securities of that issuer. Significant concentrations in security types, issuers, industries, sectors, and geographic locations may magnify the factors that affect a fund's performance.
Fidelity® Emerging Asia Fund
Schedule of Investments October 31, 2024
Showing Percentage of Net Assets
| Common Stocks - 98.1% |
| | | Shares | Value ($) |
| China - 40.5% | | | |
| Advanced Micro-Fabrication Equipment, Inc., China (A Shares) | | 765,200 | 20,661,377 |
| AK Medical Holdings Ltd. (a) | | 8,437,985 | 5,187,750 |
| Alibaba Group Holding Ltd. | | 2,335,447 | 28,567,924 |
| Alibaba Group Holding Ltd. sponsored ADR | | 95,044 | 9,312,411 |
| Asymchem Laboratories Tianjin Co. Ltd.: | | | |
| (A Shares) | | 71,100 | 829,965 |
| (H Shares) (a)(b) | | 208,200 | 1,509,721 |
| Beijing Chunlizhengda Medical Instruments Co. Ltd. | | 557,900 | 1,098,870 |
| Beijing Sinohytec Co. Ltd. (A Shares) | | 539,245 | 1,884,842 |
| BYD Co. Ltd.: | | | |
| (A Shares) | | 178,400 | 7,348,321 |
| (H Shares) | | 428,020 | 15,459,491 |
| China Resources Beverage Holdings Co. Ltd. | | 50,200 | 97,366 |
| Contemporary Amperex Technology Co. Ltd. | | 307,100 | 10,654,760 |
| Empyrean Technology Co. Ltd. (A Shares) | | 142,700 | 2,003,345 |
| Estun Automation Co. Ltd.: | | | |
| (A Shares) | | 1,882,500 | 4,007,967 |
| (A Shares) | | 972,100 | 2,069,665 |
| Flat Glass Group Co. Ltd. (A Shares) | | 2,568,500 | 10,383,514 |
| Glodon Co. Ltd. (A Shares) | | 5,116,560 | 10,179,659 |
| GRG Metrology & Test Co. Ltd. (A Shares) | | 799,690 | 1,953,564 |
| Guangzhou Kingmed Diagnostics Group Co. Ltd. (A Shares) | | 340,132 | 1,631,173 |
| Hangzhou Tigermed Consulting Co. Ltd. (A Shares) | | 254,997 | 2,255,462 |
| Hygeia Healthcare Holdings Co. (a)(c) | | 304,874 | 689,427 |
| Innovent Biologics, Inc. (a)(c) | | 694,883 | 3,020,779 |
| Joinn Laboratories China Co. Ltd. (A Shares) | | 675,860 | 1,662,750 |
| Kangji Medical Holdings Ltd. | | 1,437,785 | 1,071,357 |
| Kanzhun Ltd. ADR | | 130,054 | 1,892,286 |
| KE Holdings, Inc. ADR | | 427,337 | 9,371,500 |
| Kindstar Globalgene Technology, Inc. (a) | | 5,990,217 | 901,958 |
| Kingsemi Co. Ltd. (A Shares) | | 581,305 | 7,117,948 |
| Li Auto, Inc. ADR (b)(c) | | 333,374 | 8,337,684 |
| Li Ning Co. Ltd. | | 2,055,633 | 4,194,332 |
| Maxscend Microelectronics Co. Ltd. (A Shares) | | 129,800 | 1,739,259 |
| Meituan Class B (a)(c) | | 1,366,240 | 32,284,761 |
| Microport Cardioflow Medtech Corp. (a)(b)(c) | | 9,175,964 | 850,826 |
| MicroPort NeuroTech Ltd. | | 518,268 | 626,020 |
| MicroTech Medical (Hangzhou) Co. Ltd. (H Shares) (a)(c) | | 1,232,688 | 695,345 |
| NAURA Technology Group Co. Ltd. | | 364,397 | 20,052,171 |
| NXP Semiconductors NV | | 36,400 | 8,535,800 |
| PDD Holdings, Inc. ADR (c) | | 389,572 | 46,978,487 |
| Ping An Insurance Group Co. of China Ltd. (H Shares) | | 2,885,166 | 17,875,868 |
| SG Micro Corp. (A Shares) | | 83,940 | 1,050,903 |
| Shandong Weigao Orthopaedic Device Co. Ltd. (A Shares) | | 1,813,800 | 7,588,439 |
| Shanghai Aohua Photoelectricity Endoscope Co. Ltd. (A Shares) | | 301,100 | 2,238,879 |
| Shanghai MicroPort Endovascula MedTech Group Co. Ltd. (A Shares) | | 107,996 | 1,512,452 |
| Shenzhen Mindray Bio-Medical Electronics Co. Ltd. (A Shares) | | 249,589 | 9,347,781 |
| Silergy Corp. | | 137,000 | 2,132,390 |
| SITC International Holdings Co. Ltd. | | 2,142,931 | 6,056,591 |
| Skyverse Technology Co. Ltd. | | 378,500 | 3,756,134 |
| Smoore International Holdings Ltd. (a)(b) | | 1,591,090 | 2,077,247 |
| SonoScape Medical Corp. | | 450,260 | 2,252,925 |
| TAL Education Group ADR (c) | | 591,655 | 6,579,204 |
| Tencent Holdings Ltd. | | 511,427 | 26,666,894 |
| Tofflon Science & Technology Group Co. Ltd. (A Shares) | | 2,551,900 | 4,587,558 |
| Trip.com Group Ltd. (c) | | 78,968 | 5,081,947 |
| Venus MedTech Hangzhou, Inc. (H Shares) (a)(b)(c)(d) | | 2,490,882 | 1,440,553 |
| Warom Technology, Inc. Co. (A Shares) | | 805,700 | 2,319,521 |
| Weihai Guangwei Composites Co. Ltd. (A Shares) | | 594,036 | 2,919,241 |
| WuXi AppTec Co. Ltd. (H Shares) (a)(b) | | 906,566 | 6,028,962 |
| WuXi XDC Cayman, Inc. (b) | | 4,741,259 | 14,093,066 |
| Zeekr Intelligent Technology Holding Ltd. ADR | | 21,200 | 532,332 |
| ZKH Group Ltd. (A Shares) (c) | | 18 | 2 |
| Zylox-Tonbridge Medical Technology Co. Ltd. (a)(c) | | 1,663,090 | 2,438,816 |
TOTAL CHINA | | | 415,697,542 |
| Hong Kong - 4.2% | | | |
| AIA Group Ltd. | | 2,205,349 | 17,405,317 |
| Hong Kong Exchanges and Clearing Ltd. | | 444,387 | 17,793,419 |
| Huanxi Media Group Ltd. (c) | | 19,829,015 | 1,500,573 |
| J&T Global Express Ltd. | | 8,420,927 | 6,649,470 |
TOTAL HONG KONG | | | 43,348,779 |
| India - 22.0% | | | |
| Afcons Infrastructure Ltd. | | 285,920 | 1,574,305 |
| Afcons Infrastructure Ltd. | | 285,920 | 1,574,305 |
| Afcons Infrastructure Ltd. | | 149,037 | 820,613 |
| Amber Enterprises India Ltd. (c) | | 31,138 | 2,227,843 |
| Aster DM Healthcare Ltd. (a) | | 312,366 | 1,647,208 |
| Bajaj Finance Ltd. | | 123,375 | 10,077,084 |
| Bajaj Housing Finance Ltd. (h) | | 2,015,024 | 3,184,773 |
| Bharat Electronics Ltd. | | 837,837 | 2,828,125 |
| Computer Age Management Services Private Ltd. | | 299,371 | 15,772,186 |
| Delhivery Private Ltd. (c) | | 3,062,303 | 12,935,479 |
| Devyani International Ltd. (c) | | 717,131 | 1,440,011 |
| Divi's Laboratories Ltd. | | 46,300 | 3,235,844 |
| Eicher Motors Ltd. | | 48,985 | 2,842,898 |
| GMR Airports Infrastructure Ltd. (c) | | 2,112,625 | 1,983,362 |
| HDFC Asset Management Co. Ltd. (a) | | 160,690 | 8,200,019 |
| HDFC Bank Ltd. | | 975,225 | 20,044,934 |
| HDFC Standard Life Insurance Co. Ltd. (a) | | 558,257 | 4,768,231 |
| Hindustan Aeronautics Ltd. | | 196,766 | 9,901,377 |
| Hyundai Motor India Ltd. | | 334,526 | 7,185,324 |
| INOX India Ltd. | | 111,832 | 1,507,269 |
| Juniper Hotels Ltd. | | 824,627 | 3,298,552 |
| Kotak Mahindra Bank Ltd. | | 74,945 | 1,538,596 |
| Larsen & Toubro Ltd. | | 53,877 | 2,314,317 |
| MakeMyTrip Ltd. (b)(c) | | 385,960 | 39,171,080 |
| Page Industries Ltd. | | 2,898 | 1,484,941 |
| Reliance Industries Ltd. | | 414,103 | 6,547,611 |
| Reliance Industries Ltd. (c) | | 414,103 | 6,500,787 |
| Sapphire Foods India Ltd. (c) | | 585,666 | 2,232,346 |
| SIS Ltd. (c) | | 340,416 | 1,623,358 |
| SRF Ltd. | | 50,920 | 1,353,867 |
| Syngene International Ltd. (a) | | 167,572 | 1,711,751 |
| Vijaya Diagnostic Centre Pvt Ltd. | | 119,225 | 1,414,202 |
| Zomato Ltd. (c) | | 14,791,761 | 42,436,531 |
TOTAL INDIA | | | 225,379,129 |
| Indonesia - 1.0% | | | |
| PT Bank Central Asia Tbk | | 10,323,040 | 6,681,036 |
| PT Bank Rakyat Indonesia (Persero) Tbk | | 12,739,688 | 3,883,747 |
TOTAL INDONESIA | | | 10,564,783 |
| Japan - 0.8% | | | |
| Freee KK (c) | | 158,335 | 2,954,754 |
| Money Forward, Inc. (c) | | 149,010 | 4,861,540 |
TOTAL JAPAN | | | 7,816,294 |
| Korea (South) - 6.7% | | | |
| Delivery Hero AG (a)(c) | | 426,651 | 18,112,242 |
| Gabia, Inc. | | 128,155 | 1,253,594 |
| Kakao Corp. | | 70,465 | 1,881,614 |
| NAVER Corp. | | 131,840 | 16,179,723 |
| Samsung Electronics Co. Ltd. | | 712,558 | 30,355,012 |
| Webtoon Entertainment, Inc. | | 97,900 | 1,018,160 |
TOTAL KOREA (SOUTH) | | | 68,800,345 |
| Singapore - 7.5% | | | |
| Oversea-Chinese Banking Corp. Ltd. | | 322,432 | 3,699,296 |
| Sea Ltd. ADR Class A (c) | | 755,042 | 71,011,700 |
| United Overseas Bank Ltd. | | 110,902 | 2,695,922 |
TOTAL SINGAPORE | | | 77,406,918 |
| South Africa - 0.9% | | | |
| Naspers Ltd. Class N | | 37,400 | 8,839,394 |
| Switzerland - 0.4% | | | |
| Yunnan Botanee Bio-Technology Group Co. Ltd. ELS (UBS AG London Branch Bank Warrant Programme) Class A warrants 3/10/25 (a) | | 179,025 | 1,305,526 |
| ZWSOFT Co. Ltd. Guangzhou ELS (UBS AG London Branch Bank Warrant Programme) Class A warrants 9/25/25 (a) | | 202,088 | 2,630,624 |
TOTAL SWITZERLAND | | | 3,936,150 |
| Taiwan - 12.8% | | | |
| E Ink Holdings, Inc. | | 768,000 | 7,211,281 |
| MediaTek, Inc. | | 88,000 | 3,436,837 |
| Taiwan Semiconductor Manufacturing Co. Ltd. | | 3,458,892 | 108,822,313 |
| Taiwan Semiconductor Manufacturing Co. Ltd. sponsored ADR | | 39,653 | 7,555,483 |
| Unimicron Technology Corp. | | 848,000 | 4,154,939 |
TOTAL TAIWAN | | | 131,180,853 |
| United Kingdom - 0.2% | | | |
| Endava PLC ADR (c) | | 64,447 | 1,524,172 |
| United States of America - 0.8% | | | |
| ON Semiconductor Corp. (c) | | 61,548 | 4,338,519 |
| Space Exploration Technologies Corp. (c)(d)(e) | | 11,000 | 1,286,120 |
| Teradyne, Inc. | | 25,334 | 2,690,724 |
TOTAL UNITED STATES OF AMERICA | | | 8,315,363 |
| Vietnam - 0.3% | | | |
| Vietnam Dairy Products Corp. | | 1,043,400 | 2,727,237 |
| TOTAL COMMON STOCKS (Cost $717,660,771) | | | 1,005,536,959 |
| | | | |
| Preferred Stocks - 1.1% |
| | | Shares | Value ($) |
| Convertible Preferred Stocks - 0.7% | | | |
| China - 0.6% | | | |
| ByteDance Ltd. Series E1 (c)(d)(e) | | 23,366 | 5,822,106 |
| dMed Biopharmaceutical Co. Ltd. Series C (c)(d)(e) | | 128,423 | 696,053 |
| | | | 6,518,159 |
| India - 0.1% | | | |
| Meesho: | | | |
| Series D2 (d)(e) | | 5,677 | 315,244 |
| Series E (d)(e) | | 946 | 52,531 |
| Series F (c)(d)(e) | | 878 | 49,607 |
| | | | 417,382 |
TOTAL CONVERTIBLE PREFERRED STOCKS | | | 6,935,541 |
| Nonconvertible Preferred Stocks - 0.4% | | | |
| Korea (South) - 0.4% | | | |
| Samsung Electronics Co. Ltd. | | 121,810 | 4,204,023 |
| TOTAL PREFERRED STOCKS (Cost $8,861,547) | | | 11,139,564 |
| | | | |
| Money Market Funds - 7.5% |
| | | Shares | Value ($) |
| Fidelity Cash Central Fund 4.87% (f) | | 16,199,798 | 16,203,038 |
| Fidelity Securities Lending Cash Central Fund 4.87% (f)(g) | | 60,890,693 | 60,896,782 |
| TOTAL MONEY MARKET FUNDS (Cost $77,099,820) | | | 77,099,820 |
| | | | |
| TOTAL INVESTMENT IN SECURITIES - 106.7% (Cost $803,622,138) | 1,093,776,343 |
NET OTHER ASSETS (LIABILITIES) - (6.7)% | (68,224,694) |
| NET ASSETS - 100.0% | 1,025,551,649 |
| | |
Security Type Abbreviations
| ELS | - | EQUITY-LINKED SECURITY |
Legend
| (a) | Security exempt from registration under Rule 144A of the Securities Act of 1933. These securities may be resold in transactions exempt from registration, normally to qualified institutional buyers. At the end of the period, the value of these securities amounted to $95,501,746 or 9.3% of net assets. |
| (b) | Security or a portion of the security is on loan at period end. |
| (e) | Restricted securities (including private placements) - Investment in securities not registered under the Securities Act of 1933 (excluding 144A issues). At the end of the period, the value of restricted securities (excluding 144A issues) amounted to $8,221,661 or 0.8% of net assets. |
| (f) | Affiliated fund that is generally available only to investment companies and other accounts managed by Fidelity Investments. The rate quoted is the annualized seven-day yield of the fund at period end. A complete unaudited listing of the fund's holdings as of its most recent quarter end is available upon request. In addition, each Fidelity Central Fund's financial statements, which are not covered by the Fund's Report of Independent Registered Public Accounting Firm, are available on the SEC's website or upon request. |
| (g) | Investment made with cash collateral received from securities on loan. |
| (h) | Equity security is subject to lock-up or market standoff agreement. Fair value is based on the unadjusted market price of the equivalent equity security. As of period end, the total fair value of unadjusted equity securities subject to contractual sale restrictions is $3,184,773 and all restrictions are set to expire on or before December 31, 2024. Under normal market conditions, there are no circumstances that could cause the restrictions to lapse. |
| Additional information on each restricted holding is as follows: |
| Security | Acquisition Date | Acquisition Cost ($) |
| ByteDance Ltd. Series E1 | 11/18/20 | 2,560,310 |
| | | |
| dMed Biopharmaceutical Co. Ltd. Series C | 12/01/20 | 1,824,011 |
| | | |
| Meesho Series D2 | 7/15/24 | 317,912 |
| | | |
| Meesho Series E | 7/15/24 | 52,976 |
| | | |
| Meesho Series F | 7/15/24 | 49,168 |
| | | |
| Space Exploration Technologies Corp. | 2/16/21 | 461,989 |
| | | |
Affiliated Central Funds
Fiscal year to date information regarding the Fund's investments in Fidelity Central Funds, including the ownership percentage, is presented below.
| Affiliate | Value, beginning of period ($) | Purchases ($) | Sales Proceeds ($) | Dividend Income ($) | Realized Gain (loss) ($) | Change in Unrealized appreciation (depreciation) ($) | Value, end of period ($) | % ownership, end of period |
| Fidelity Cash Central Fund 4.87% | 8,975,185 | 330,578,888 | 323,351,301 | 659,686 | 267 | (1) | 16,203,038 | 0.0% |
| Fidelity Securities Lending Cash Central Fund 4.87% | 16,834,536 | 248,019,561 | 203,957,315 | 736,603 | - | - | 60,896,782 | 0.3% |
| Total | 25,809,721 | 578,598,449 | 527,308,616 | 1,396,289 | 267 | (1) | 77,099,820 | |
| | | | | | | | | |
Amounts in the dividend income column in the above table include any capital gain distributions from underlying funds, which are presented in the corresponding line item in the Statement of Operations, if applicable.
Amounts in the dividend income column for Fidelity Securities Lending Cash Central Fund represents the income earned on investing cash collateral, less rebates paid to borrowers and any lending agent fees associated with the loan, plus any premium payments received for lending certain types of securities.
Amounts included in the purchases and sales proceeds columns may include in-kind transactions, if applicable.
Investment Valuation
The following is a summary of the inputs used, as of October 31, 2024, involving the Fund's assets and liabilities carried at fair value. The inputs or methodology used for valuing securities may not be an indication of the risk associated with investing in those securities. For more information on valuation inputs, and their aggregation into the levels used below, please refer to the Investment Valuation section in the accompanying Notes to Financial Statements.
| Valuation Inputs at Reporting Date: |
| Description | Total ($) | Level 1 ($) | Level 2 ($) | Level 3 ($) |
Investments in Securities: | | | | |
|
| Equities: | | | | |
Communication Services | 125,973,056 | 73,922,146 | 46,228,804 | 5,822,106 |
Consumer Discretionary | 294,365,438 | 110,911,198 | 183,036,858 | 417,382 |
Consumer Staples | 6,207,376 | - | 6,207,376 | - |
Energy | 13,048,398 | - | 13,048,398 | - |
Financials | 117,848,242 | - | 117,848,242 | - |
Health Care | 82,265,892 | - | 80,129,286 | 2,136,606 |
Industrials | 89,717,198 | 2 | 88,431,076 | 1,286,120 |
Information Technology | 273,606,315 | 24,644,698 | 248,961,617 | - |
Materials | 4,273,108 | - | 4,273,108 | - |
Real Estate | 9,371,500 | 9,371,500 | - | - |
|
| Money Market Funds | 77,099,820 | 77,099,820 | - | - |
| Total Investments in Securities: | 1,093,776,343 | 295,949,364 | 788,164,765 | 9,662,214 |
The following is a reconciliation of Investments in Securities for which Level 3 inputs were used in determining value:
| |
| Investments in Securities: | |
| Beginning Balance | $ | 11,961,089 | |
| Net Realized Gain (Loss) on Investment Securities | | (8,288,969) | |
| Net Unrealized Gain (Loss) on Investment Securities | | 10,865,144 | |
| Cost of Purchases | | 420,056 | |
| Proceeds of Sales | | (6,708,077) | |
| Amortization/Accretion | | - | |
| Transfers into Level 3 | | 1,412,971 | |
| Transfers out of Level 3 | | - | |
| Ending Balance | $ | 9,662,214 | |
| The change in unrealized gain (loss) for the period attributable to Level 3 securities held at October 31, 2024 | $ | 722,310 | |
| The information used in the above reconciliation represents fiscal year to date activity for any Investments in Securities identified as using Level 3 inputs at either the beginning or the end of the current fiscal period. Cost of purchases and proceeds of sales may include securities received and/or delivered through in-kind transactions, corporate actions or exchanges. Transfers into Level 3 were attributable to a lack of observable market data resulting from decreases in market activity, decreases in liquidity, security restructurings or corporate actions. Transfers out of Level 3 were attributable to observable market data becoming available for those securities. Transfers in or out of Level 3 represent the beginning value of any Security or Instrument where a change in the pricing level occurred from the beginning to the end of the period. Realized and unrealized gains (losses) disclosed in the reconciliation are included in Net Gain (Loss) on the Fund's Statement of Operations. | |
Fidelity® Emerging Asia Fund
Financial Statements
| Statement of Assets and Liabilities |
As of October 31, 2024 |
| Assets | | | | |
| Investment in securities, at value (including securities loaned of $57,745,226) - See accompanying schedule: | | | | |
Unaffiliated issuers (cost $726,522,318) | $ | 1,016,676,523 | | |
Fidelity Central Funds (cost $77,099,820) | | 77,099,820 | | |
| | | | | |
| | | | | |
| Total Investment in Securities (cost $803,622,138) | | | $ | 1,093,776,343 |
| Foreign currency held at value (cost $2,310,200) | | | | 2,310,200 |
| Receivable for fund shares sold | | | | 280,583 |
| Dividends receivable | | | | 189,379 |
| Distributions receivable from Fidelity Central Funds | | | | 168,554 |
| Prepaid expenses | | | | 1,131 |
| Other receivables | | | | 511,295 |
Total assets | | | | 1,097,237,485 |
| Liabilities | | | | |
| Payable for investments purchased | $ | 134,544 | | |
| Payable for fund shares redeemed | | 798,536 | | |
| Accrued management fee | | 627,681 | | |
| Deferred taxes | | 9,060,070 | | |
| Other payables and accrued expenses | | 166,993 | | |
| Collateral on securities loaned | | 60,898,012 | | |
| Total liabilities | | | | 71,685,836 |
| Net Assets | | | $ | 1,025,551,649 |
| Net Assets consist of: | | | | |
| Paid in capital | | | $ | 1,020,015,510 |
| Total accumulated earnings (loss) | | | | 5,536,139 |
| Net Assets | | | $ | 1,025,551,649 |
Net Asset Value, offering price and redemption price per share ($1,025,551,649 ÷ 20,642,859 shares) | | | $ | 49.68 |
| Statement of Operations |
| Year ended October 31, 2024 |
| Investment Income | | | | |
| Dividends | | | $ | 11,447,583 |
| Income from Fidelity Central Funds (including $736,603 from security lending) | | | | 1,396,289 |
| Income before foreign taxes withheld | | | $ | 12,843,872 |
| Less foreign taxes withheld | | | | (1,430,371) |
| Total income | | | | 11,413,501 |
| Expenses | | | | |
| Management fee | | | | |
| Basic fee | $ | 7,544,898 | | |
| Performance adjustment | | (2,501,981) | | |
| Transfer agent fees | | 574,617 | | |
| Accounting fees | | 135,028 | | |
| Custodian fees and expenses | | 249,919 | | |
| Independent trustees' fees and expenses | | 4,213 | | |
| Registration fees | | 25,028 | | |
| Audit fees | | 102,944 | | |
| Legal | | 1,364 | | |
| Interest | | 16,047 | | |
| Miscellaneous | | 24,075 | | |
| Total expenses before reductions | | 6,176,152 | | |
| Expense reductions | | (40,536) | | |
| Total expenses after reductions | | | | 6,135,616 |
| Net Investment income (loss) | | | | 5,277,885 |
| Realized and Unrealized Gain (Loss) | | | | |
| Net realized gain (loss) on: | | | | |
| Investment Securities: | | | | |
| Unaffiliated issuers (net of foreign taxes of $8,250,877) | | 28,730,097 | | |
| Fidelity Central Funds | | 267 | | |
| Foreign currency transactions | | (121,390) | | |
| Total net realized gain (loss) | | | | 28,608,974 |
| Change in net unrealized appreciation (depreciation) on: | | | | |
| Investment Securities: | | | | |
| Unaffiliated issuers (net of increase in deferred foreign taxes of $3,504,088) | | 266,659,309 | | |
| Fidelity Central Funds | | (1) | | |
| Assets and liabilities in foreign currencies | | 242,079 | | |
| Total change in net unrealized appreciation (depreciation) | | | | 266,901,387 |
| Net gain (loss) | | | | 295,510,361 |
| Net increase (decrease) in net assets resulting from operations | | | $ | 300,788,246 |
| Statement of Changes in Net Assets |
| |
| | Year ended October 31, 2024 | | Year ended October 31, 2023 |
| Increase (Decrease) in Net Assets | | | | |
| Operations | | | | |
| Net investment income (loss) | $ | 5,277,885 | $ | 1,271,379 |
| Net realized gain (loss) | | 28,608,974 | | (172,657,476) |
| Change in net unrealized appreciation (depreciation) | | 266,901,387 | | 329,221,567 |
| Net increase (decrease) in net assets resulting from operations | | 300,788,246 | | 157,835,470 |
| Distributions to shareholders | | (375,705) | | - |
| Distributions to shareholders from tax return of capital | | (336,817) | | - |
| | | | | |
| Total Distributions | | (712,522) | | - |
| Share transactions | | | | |
| Proceeds from sales of shares | | 61,473,832 | | 89,917,598 |
| Reinvestment of distributions | | 649,603 | | - |
| Cost of shares redeemed | | (204,300,986) | | (203,626,450) |
| | | | | |
Net increase (decrease) in net assets resulting from share transactions | | (142,177,551) | | (113,708,852) |
| Total increase (decrease) in net assets | | 157,898,173 | | 44,126,618 |
| | | | | |
| Net Assets | | | | |
| Beginning of period | | 867,653,476 | | 823,526,858 |
| End of period | $ | 1,025,551,649 | $ | 867,653,476 |
| | | | | |
| Other Information | | | | |
| Shares | | | | |
| Sold | | 1,380,129 | | 2,379,648 |
| Issued in reinvestment of distributions | | 16,661 | | - |
| Redeemed | | (4,876,776) | | (5,497,734) |
| Net increase (decrease) | | (3,479,986) | | (3,118,086) |
| | | | | |
Financial Highlights
Fidelity® Emerging Asia Fund |
| |
| Years ended October 31, | | 2024 | | 2023 | | 2022 | | 2021 | | 2020 |
Selected Per-Share Data | | | | | | | | | | |
| Net asset value, beginning of period | $ | 35.97 | $ | 30.23 | $ | 64.66 | $ | 63.60 | $ | 45.03 |
| Income from Investment Operations | | | | | | | | | | |
Net investment income (loss) A,B | | .24 | | .05 | | (.22) | | (.31) C | | (.12) |
| Net realized and unrealized gain (loss) | | 13.50 | | 5.69 | | (26.97) | | 11.00 | | 21.49 |
| Total from investment operations | | 13.74 | | 5.74 | | (27.19) | | 10.69 | | 21.37 |
| Distributions from net investment income | | (.02) | | - | | (.09) | | - | | (.29) D |
| Distributions from net realized gain | | - | | - | | (7.15) | | (9.63) | | (2.51) D |
| Distributions from tax return of capital | | (.01) | | - | | - | | - | | - |
| Total distributions | | (.03) | | - | | (7.24) | | (9.63) | | (2.80) |
| Net asset value, end of period | $ | 49.68 | $ | 35.97 | $ | 30.23 | $ | 64.66 | $ | 63.60 |
Total Return E | | | | 18.99% | | (46.77)% | | 17.02% | | 50.46% |
Ratios to Average Net Assets B,F,G | | | | | | | | | | |
| Expenses before reductions | | .66% | | .87% | | 1.18% | | 1.02% | | 1.13% |
| Expenses net of fee waivers, if any | | | | .87% | | 1.17% | | 1.02% | | 1.13% |
| Expenses net of all reductions | | .65% | | .87% | | 1.17% | | 1.02% | | 1.10% |
| Net investment income (loss) | | .56% | | .13% | | (.51)% | | (.45)% C | | (.24)% |
| Supplemental Data | | | | | | | | | | |
| Net assets, end of period (000 omitted) | $ | 1,025,552 | $ | 867,653 | $ | 823,527 | $ | 2,000,120 | $ | 1,578,782 |
Portfolio turnover rate H | | | | 50% | | 44% | | 85% | | 114% |
ACalculated based on average shares outstanding during the period.
BNet investment income (loss) is affected by the timing of the declaration of dividends by any underlying mutual funds or exchange-traded funds (ETFs). Net investment income (loss) of any mutual funds or ETFs is not included in the Fund's net investment income (loss) ratio.
CNet investment income per share reflects one or more large, non-recurring dividend(s) which amounted to $.06 per share. Excluding such non-recurring dividend(s), the ratio of net investment income (loss) to average net assets would have been (.54)%.
DThe amount shown reflects reclassifications related to book to tax differences that were made in the year shown.
ETotal returns would have been lower if certain expenses had not been reduced during the applicable periods shown.
FFees and expenses of any underlying mutual funds or exchange-traded funds (ETFs) are not included in the Fund's expense ratio. The Fund indirectly bears its proportionate share of these expenses. For additional expense information related to investments in Fidelity Central Funds, please refer to the "Investments in Fidelity Central Funds" note found in the Notes to Financial Statements section of the most recent Annual or Semi-Annual report.
GExpense ratios reflect operating expenses of the class. Expenses before reductions do not reflect amounts reimbursed, waived, or reduced through arrangements with the investment adviser, brokerage services, or other offset arrangements, if applicable, and do not represent the amount paid by the class during periods when reimbursements, waivers or reductions occur.
HAmount does not include the portfolio activity of any underlying mutual funds or exchange-traded funds (ETFs).
Notes to Financial Statements
For the period ended October 31, 2024
1. Organization.
Fidelity Emerging Asia Fund (the Fund) is a fund of Fidelity Investment Trust (the Trust) and is authorized to issue an unlimited number of shares. Share transactions on the Statement of Changes in Net Assets may contain exchanges between affiliated funds. The Trust is registered under the Investment Company Act of 1940, as amended (the 1940 Act), as an open-end management investment company organized as a Massachusetts business trust. The Fund's investments in emerging markets can be subject to social, economic, regulatory, and political uncertainties and can be extremely volatile.
2. Investments in Fidelity Central Funds.
Funds may invest in Fidelity Central Funds, which are open-end investment companies generally available only to other investment companies and accounts managed by the investment adviser and its affiliates. The Schedule of Investments lists any Fidelity Central Funds held as an investment as of period end, but does not include the underlying holdings of each Fidelity Central Fund. An investing fund indirectly bears its proportionate share of the expenses of the underlying Fidelity Central Funds.
Based on its investment objective, each Fidelity Central Fund may invest or participate in various investment vehicles or strategies that are similar to those of the investing fund. These strategies are consistent with the investment objectives of the investing fund and may involve certain economic risks which may cause a decline in value of each of the Fidelity Central Funds and thus a decline in the value of the investing fund.
| Fidelity Central Fund | Investment Manager | Investment Objective | Investment Practices | Expense RatioA |
| Fidelity Money Market Central Funds | Fidelity Management & Research Company LLC (FMR) | Each fund seeks to obtain a high level of current income consistent with the preservation of capital and liquidity. | Short-term Investments | Less than .005% |
A Expenses expressed as a percentage of average net assets and are as of each underlying Central Fund's most recent annual or semi-annual shareholder report.
A complete unaudited list of holdings for each Fidelity Central Fund is available upon request or at the Securities and Exchange Commission website at www.sec.gov. In addition, the financial statements of the Fidelity Central Funds which contain the significant accounting policies (including investment valuation policies) of those funds, and are not covered by the Report of Independent Registered Public Accounting Firm, are available on the Securities and Exchange Commission website or upon request.
3. Significant Accounting Policies.
The Fund is an investment company and applies the accounting and reporting guidance of the Financial Accounting Standards Board (FASB) Accounting Standards Codification Topic 946 Financial Services - Investment Companies. The financial statements have been prepared in conformity with accounting principles generally accepted in the United States of America (GAAP), which require management to make certain estimates and assumptions at the date of the financial statements. Actual results could differ from those estimates. Subsequent events, if any, through the date that the financial statements were issued have been evaluated in the preparation of the financial statements. The Fund's Schedule of Investments lists any underlying mutual funds or exchange-traded funds (ETFs) but does not include the underlying holdings of these funds. The following summarizes the significant accounting policies of the Fund:
Investment Valuation. Investments are valued as of 4:00 p.m. Eastern time on the last calendar day of the period. The Board of Trustees (the Board) has designated the Fund's investment adviser as the valuation designee responsible for the fair valuation function and performing fair value determinations as needed. The investment adviser has established a Fair Value Committee (the Committee) to carry out the day-to-day fair valuation responsibilities and has adopted policies and procedures to govern the fair valuation process and the activities of the Committee. In accordance with these fair valuation policies and procedures, which have been approved by the Board, the Fund attempts to obtain prices from one or more third party pricing services or brokers to value its investments. When current market prices, quotations or currency exchange rates are not readily available or reliable, investments will be fair valued in good faith by the Committee, in accordance with the policies and procedures. Factors used in determining fair value vary by investment type and may include market or investment specific events, transaction data, estimated cash flows, and market observations of comparable investments. The frequency that the fair valuation procedures are used cannot be predicted and they may be utilized to a significant extent. The Committee manages the Fund's fair valuation practices and maintains the fair valuation policies and procedures. The Fund's investment adviser reports to the Board information regarding the fair valuation process and related material matters.
The Fund categorizes the inputs to valuation techniques used to value its investments into a disclosure hierarchy consisting of three levels as shown below:
Level 1 - unadjusted quoted prices in active markets for identical investments
Level 2 - other significant observable inputs (including quoted prices for similar investments, interest rates, prepayment speeds, etc.)
Level 3 - unobservable inputs (including the Fund's own assumptions based on the best information available)
Valuation techniques used to value the Fund's investments by major category are as follows:
Equity securities, including restricted securities, for which market quotations are readily available, are valued at the last reported sale price or official closing price as reported by a third party pricing service on the primary market or exchange on which they are traded and are categorized as Level 1 in the hierarchy. In the event there were no sales during the day or closing prices are not available, securities are valued at the last quoted bid price or may be valued using the last available price and are generally categorized as Level 2 in the hierarchy. For foreign equity securities, when market or security specific events arise, comparisons to the valuation of American Depositary Receipts (ADRs), futures contracts, Exchange-Traded Funds (ETFs) and certain indexes as well as quoted prices for similar securities may be used and would be categorized as Level 2 in the hierarchy. For equity securities, including restricted securities, where observable inputs are limited, assumptions about market activity and risk are used and these securities may be categorized as Level 3 in the hierarchy.
Investments in open-end mutual funds, including the Fidelity Central Funds, are valued at their closing net asset value (NAV) each business day and are categorized as Level 1 in the hierarchy.
Changes in valuation techniques may result in transfers in or out of an assigned level within the disclosure hierarchy. The aggregate value of investments by input level as of October 31, 2024, as well as a roll forward of Level 3 investments, is included at the end of the Fund's Schedule of Investments.
Foreign Currency. Certain Funds may use foreign currency contracts to facilitate transactions in foreign-denominated securities. Gains and losses from these transactions may arise from changes in the value of the foreign currency or if the counterparties do not perform under the contracts' terms.
Foreign-denominated assets, including investment securities, and liabilities are translated into U.S. dollars at the exchange rates at period end. Purchases and sales of investment securities, income and dividends received, and expenses denominated in foreign currencies are translated into U.S. dollars at the exchange rate in effect on the transaction date.
The effects of exchange rate fluctuations on investments are included with the net realized and unrealized gain (loss) on investment securities. Other foreign currency transactions resulting in realized and unrealized gain (loss) are disclosed separately.
Investment Transactions and Income. For financial reporting purposes, the Fund's investment holdings and NAV include trades executed through the end of the last business day of the period. The NAV per share for processing shareholder transactions is calculated as of the close of business of the New York Stock Exchange (NYSE), normally 4:00 p.m. Eastern time and includes trades executed through the end of the prior business day. Gains and losses on securities sold are determined on the basis of identified cost and include proceeds received from litigation. Commissions paid to certain brokers with whom the investment adviser, or its affiliates, places trades on behalf of a fund include an amount in addition to trade execution, which may be rebated back to a fund. Any such rebates are included in net realized gain (loss) on investments in the Statement of Operations. Dividend income is recorded on the ex-dividend date, except for certain dividends from foreign securities where the ex-dividend date may have passed, which are recorded as soon as the Fund is informed of the ex-dividend date. Non-cash dividends included in dividend income, if any, are recorded at the fair market value of the securities received. Income and capital gain distributions from Fidelity Central Funds, if any, are recorded on the ex-dividend date. Investment income is recorded net of foreign taxes withheld where recovery of such taxes is uncertain. Funds may file withholding tax reclaims in certain jurisdictions to recover a portion of amounts previously withheld. Any withholding tax reclaims income is included in the Statement of Operations in foreign taxes withheld. Any receivables for withholding tax reclaims are included in the Statement of Assets and Liabilities in dividends receivable.
Expenses. Expenses directly attributable to a fund are charged to that fund. Expenses attributable to more than one fund are allocated among the respective funds on the basis of relative net assets or other appropriate methods. Expenses included in the accompanying financial statements reflect the expenses of that fund and do not include any expenses associated with any underlying mutual funds or exchange-traded funds. Although not included in a fund's expenses, a fund indirectly bears its proportionate share of these expenses through the net asset value of each underlying mutual fund or exchange-traded fund. Expense estimates are accrued in the period to which they relate and adjustments are made when actual amounts are known.
Income Tax Information and Distributions to Shareholders. Each year, the Fund intends to qualify as a regulated investment company under Subchapter M of the Internal Revenue Code, including distributing substantially all of its taxable income and realized gains. As a result, no provision for U.S. Federal income taxes is required. As of October 31, 2024, the Fund did not have any unrecognized tax benefits in the financial statements; nor is the Fund aware of any tax positions for which it is reasonably possible that the total amounts of unrecognized tax benefits will significantly change in the next twelve months. The Fund files a U.S. federal tax return, in addition to state and local tax returns as required. The Fund's federal income tax returns are subject to examination by the Internal Revenue Service (IRS) for a period of three fiscal years after they are filed. State and local tax returns may be subject to examination for an additional fiscal year depending on the jurisdiction. Foreign taxes are provided for based on the Fund's understanding of the tax rules and rates that exist in the foreign markets in which it invests. The Fund is subject to a tax imposed on capital gains by certain countries in which it invests. An estimated deferred tax liability for net unrealized appreciation on the applicable securities is included in Deferred taxes on the Statement of Assets and Liabilities.
Distributions are declared and recorded on the ex-dividend date. Income and capital gain distributions are determined in accordance with income tax regulations, which may differ from GAAP.
Capital accounts within the financial statements are adjusted for permanent book-tax differences. These adjustments have no impact on net assets or the results of operations. Capital accounts are not adjusted for temporary book-tax differences which will reverse in a subsequent period.
Book-tax differences are primarily due to foreign currency transactions, certain foreign taxes, passive foreign investment companies (PFIC), capital loss carryforwards and losses deferred due to wash sales and excise tax regulations.
For the period ended October 31, 2024, the Fund's distributions exceeded the aggregate amount of taxable income resulting in a return of capital for tax purposes. This was due to reductions in taxable income available for distribution after certain distributions had been made.
As of period end, the cost and unrealized appreciation (depreciation) in securities, and derivatives if applicable, for federal income tax purposes were as follows:
| Gross unrealized appreciation | $386,015,588 |
| Gross unrealized depreciation | (98,351,323) |
| Net unrealized appreciation (depreciation) | $287,664,265 |
| Tax Cost | $806,112,078 |
The tax-based components of distributable earnings as of period end were as follows:
| Capital loss carryforward | $(272,174,519) |
| Net unrealized appreciation (depreciation) on securities and other investments | $287,378,175 |
Capital loss carryforwards are only available to offset future capital gains of the Fund to the extent provided by regulations and may be limited. The capital loss carryforward information presented below, including any applicable limitation, is estimated as of fiscal period end and is subject to adjustment.
Short-term | $(112,425,090) |
Long-term | (159,749,429) |
| Total capital loss carryforward | $(272,174,519) |
The Fund intends to elect to defer to its next fiscal year $607,447 of Ordinary Losses recognized during the period January 1, 2024 to October 31, 2024.
The tax character of distributions paid was as follows:
| | October 31, 2024 | October 31, 2023 |
| Ordinary Income | $375,705 | $- |
| Tax Return of Capital | 336,817 | - |
| Total | $712,522 | $- |
Restricted Securities (including Private Placements). Funds may invest in securities that are subject to legal or contractual restrictions on resale. These securities generally may be resold in transactions exempt from registration or to the public if the securities are registered. Disposal of these securities may involve time-consuming negotiations and expense, and prompt sale at an acceptable price may be difficult. Information regarding restricted securities held at period end is included at the end of the Schedule of Investments, if applicable.
New Accounting Pronouncement. In November 2023, the FASB issued Accounting Standards Update (ASU) 2023-07 Segment Reporting (Topic 280): Improvements to Reportable Segment Disclosures. Effective for fiscal years beginning after December 15, 2023 and interim periods within fiscal years beginning after December 15, 2024, the amendments enhance required disclosures of segment information for public entities on an annual and interim basis. The ASU allows for early adoption with updates applied retrospectively. Management is currently evaluating the impact of the ASU but does not expect this guidance to materially impact the financial statements.
4. Purchases and Sales of Investments.
Purchases and sales of securities, other than short-term securities and in-kind transactions, as applicable, are noted in the table below.
| | Purchases ($) | Sales ($) |
| Fidelity Emerging Asia Fund | 526,694,492 | 672,666,842 |
5. Fees and Other Transactions with Affiliates.
Management Fee. Fidelity Management & Research Company LLC (the investment adviser) and its affiliates provide the Fund with investment management related services for which the Fund pays a monthly management fee.
Effective March 1, 2024, the Fund's management contract was amended to incorporate administrative services previously covered under separate services agreements (Transfer Agent and Accounting agreements). Any reference to "class" in this note shall mean "the Fund" as the Fund currently offers only one class of shares. The amended contract incorporates a basic fee rate that may vary by class (subject to a performance adjustment). The investment adviser or an affiliate pays certain expenses of managing and operating the Fund out of each class's management fee. Each class of the Fund pays a management fee to the investment adviser. The management fee is calculated and paid to the investment adviser every month. The management fee is determined by calculating a basic fee and then applying a performance adjustment. When determining a class's basic fee, a mandate rate is calculated based on the monthly average net assets of a group of funds advised by FMR within a designated asset class. A discount rate is subtracted from the mandate rate once the Fund's monthly average net assets reach a certain level. The mandate rate and discount rate may vary by class. The annual basic fee rate for a class of shares of the Fund is the lesser of (1) the class's mandate rate reduced by the class's discount rate (if applicable) or (2) the amount set forth in the following table.
| | Maximum Management Fee Rate % |
| Fidelity Emerging Asia Fund | .87 |
One-twelfth of the basic fee rate for a class is applied to the average net assets of the class for the month, giving a dollar amount which is the basic fee for the class for that month. A different management fee rate may be applicable to each class of the Fund. The difference between classes is the result of separate arrangements for class-level services and/or waivers of certain expenses. It is not the result of any difference in advisory or custodial fees or other expenses related to the management of the Fund's assets, which do not vary by class. For the portion of the reporting period on or after March 1, 2024, the total annualized management fee rates were as follows:
| | Total Management Fee Rate % |
| Fidelity Emerging Asia Fund | .87 |
Prior to March 1, 2024, the management fee was the sum of an individual fund fee rate that was based on an annual rate of .45% of the Fund's average net assets and an annualized group fee rate that averaged .22% during the period. The group fee rate was based upon the monthly average net assets of a group of registered investment companies with which the investment adviser has management contracts. The group fee rate decreased as assets under management increased and increased as assets under management decreased. For the portion of the reporting period prior to March 1, 2024, the total annualized management fee rate was .67%.
The performance adjustment rate is calculated monthly by comparing over the performance period the Fund's performance to that of the performance adjustment index listed below.
| | Performance Adjustment Index |
| Fidelity Emerging Asia Fund | MSCI All Country Asia ex Japan Index |
For the purposes of calculating the performance adjustment for the Fund, the Fund's investment performance is based on the performance of the Fund. To the extent that other classes of the Fund have higher expenses, this could result in those classes bearing a larger positive performance adjustment and smaller negative performance adjustment than would be the case if each class's own performance were considered. The performance period is the most recent 36 month period. The maximum annualized performance adjustment rate is ±.20% of the Fund's average net assets over the performance period. The performance adjustment rate is divided by twelve and multiplied by the Fund's average net assets over the performance period, and the resulting dollar amount is proportionately added to or subtracted from a class's basic fee. For the entire reporting period, the total annual performance adjustment was (.27)%.
Effective March 1, 2024, the Fund's sub-advisory agreements with FMR Investment Management (UK) Limited, Fidelity Management & Research (Hong Kong) Limited, and Fidelity Management & Research (Japan) Limited were amended to provide that the investment adviser pays each sub-adviser monthly fees equal to 110% of the sub-adviser's costs for providing sub-advisory services.
Effective March 1, 2024, the Fund's sub-advisory agreement with FIL Investment Advisors (FIA) was amended to provide that the investment adviser pays FIA monthly fees at an annual rate of 0.50% with respect to the average daily net assets of the Fund managed by FIA. FIA in turn pays FIA(UK).
Transfer Agent Fees. Fidelity Investments Institutional Operations Company LLC (FIIOC), an affiliate of the investment adviser, is the Fund's transfer, dividend disbursing and shareholder servicing agent. Effective March 1, 2024, each Fund's management contract was amended to incorporate transfer agent services and associated fees previously covered under a separate services agreement. FIIOC pays for typesetting, printing and mailing of shareholder reports, except proxy statements.
During the period December 1, 2023 through February 29, 2024, the transfer agent fees were a fixed annual rate of average net assets of .1908%.
Prior to December 1, 2023, FIIOC received account fees and asset-based fees that varied according to account size and type of account.
For the portion of the reporting period prior to March 1, 2024, the fees were equivalent to the annualized rate of .19% of average net assets.
Accounting Fees. Fidelity Service Company, Inc. (FSC), an affiliate of the investment adviser, maintains the Fund's accounting records. Effective March 1, 2024, the Fund's management contract was amended to incorporate accounting services and associated fees previously covered under a separate services agreement.
During the period December 1, 2023 through February 29, 2024, the accounting fees were a fixed annual rate of average net assets as follows:
| | % of Average Net Assets |
| Fidelity Emerging Asia Fund | .0447 |
Prior to December 1, 2023, the accounting fee was based on the level of average net assets for each month. For the portion of the reporting period prior to March 1, 2024, the fees were equivalent to the following annualized rates:
| | % of Average Net Assets |
| Fidelity Emerging Asia Fund | .04 |
Brokerage Commissions. A portion of portfolio transactions were placed with brokerage firms which are affiliates of the investment adviser. Brokerage commissions are included in net realized gain (loss) and change in net unrealized appreciation (depreciation) in the Statement of Operations. The commissions paid to these affiliated firms were as follows:
| | Amount ($) |
| Fidelity Emerging Asia Fund | 4,034 |
Interfund Lending Program. Pursuant to an Exemptive Order issued by the Securities and Exchange Commission (the SEC), the Fund, along with other registered investment companies having management contracts with Fidelity Management & Research Company LLC (FMR), or other affiliated entities of FMR, may participate in an interfund lending program. This program provides an alternative credit facility allowing the Fund to borrow from, or lend money to, other participating affiliated funds at rates that are beneficial to both the borrowing and lending fund. Borrowings under the program are generally for temporary or emergency purposes, including meeting fund shareholder redemptions. The interfund loan rate is determined, as specified in the Exemptive Order, by averaging, (1) the higher of the overnight time deposit rate and the current overnight repurchase agreement rate, and (2) a benchmark rate representing the lowest bank loan rate available to the funds. At period end, there were no interfund loans outstanding. Activity in this program during the period for which loans were outstanding was as follows:
| | Borrower or Lender | Average Loan Balance ($) | Weighted Average Interest Rate | Interest Expense ($) |
| Fidelity Emerging Asia Fund | Borrower | 7,296,643 | 5.57% | 15,797 |
Interfund Trades. Funds may purchase from or sell securities to other Fidelity Funds under procedures adopted by the Board. The procedures have been designed to ensure these interfund trades are executed in accordance with Rule 17a-7 of the 1940 Act. Any interfund trades are included within the respective purchases and sales amounts shown in the Purchases and Sales of Investments note. Interfund trades during the period are noted in the table below.
| | Purchases ($) | Sales ($) | Realized Gain (Loss)($) |
| Fidelity Emerging Asia Fund | 7,099,343 | 36,463,780 | 5,809,841 |
6. Committed Line of Credit.
Certain Funds participate with other funds managed by the investment adviser or an affiliate in a $4.25 billion credit facility (the "line of credit") to be utilized for temporary or emergency purposes to fund shareholder redemptions or for other short-term liquidity purposes. The participating funds have agreed to pay commitment fees on their pro-rata portion of the line of credit, which are reflected in Miscellaneous expenses on the Statement of Operations, and are listed below. During the period, there were no borrowings on this line of credit.
| | Amount ($) |
| Fidelity Emerging Asia Fund | 1,480 |
7. Security Lending.
Funds lend portfolio securities from time to time in order to earn additional income. Lending agents are used, including National Financial Services (NFS), an affiliate of the investment adviser. Pursuant to a securities lending agreement, NFS will receive a fee, which is capped at 9.9% of a fund's daily lending revenue, for its services as lending agent. A fund may lend securities to certain qualified borrowers, including NFS. On the settlement date of the loan, a fund receives collateral (in the form of U.S. Treasury obligations, letters of credit and/or cash) against the loaned securities and maintains collateral in an amount not less than 100% of the market value of the loaned securities during the period of the loan. The market value of the loaned securities is determined at the close of business of a fund and any additional required collateral is delivered to a fund on the next business day. A fund or borrower may terminate the loan at any time, and if the borrower defaults on its obligation to return the securities loaned because of insolvency or other reasons, a fund may apply collateral received from the borrower against the obligation. A fund may experience delays and costs in recovering the securities loaned. Any cash collateral received is invested in the Fidelity Securities Lending Cash Central Fund. Any loaned securities are identified as such in the Schedule of Investments, and the value of loaned securities and cash collateral at period end, as applicable, are presented in the Statement of Assets and Liabilities. Security lending income represents the income earned on investing cash collateral, less rebates paid to borrowers and any lending agent fees associated with the loan, plus any premium payments received for lending certain types of securities. Security lending income is presented in the Statement of Operations as a component of income from Fidelity Central Funds. Affiliated security lending activity, if any, was as follows:
| | Total Security Lending Fees Paid to NFS ($) | Security Lending Income From Securities Loaned to NFS ($) | Value of Securities Loaned to NFS at Period End ($) |
| Fidelity Emerging Asia Fund | 79,990 | - | - |
8. Bank Borrowings.
The Fund is permitted to have bank borrowings for temporary or emergency purposes to fund shareholder redemptions or for other short-term liquidity requirements. The Fund has established borrowing arrangements with certain banks. The interest rate on the borrowings is the bank's base rate, as revised from time to time. Any open loans, including accrued interest, at period end are presented under the caption "Notes payable" in the Statement of Assets and Liabilities, if applicable. Activity in this program during the period for which loans were outstanding was as follows:
| | Average Loan Balance ($) | Weighted Average Interest Rate | Interest Expense ($) |
| Fidelity Emerging Asia Fund | 386,000 | 5.83% | 250 |
9. Expense Reductions.
During the period the investment adviser or an affiliate reimbursed and/or waived a portion of operating expenses in the amount of $40,536.
10. Other.
A fund's organizational documents provide former and current trustees and officers with a limited indemnification against liabilities arising in connection with the performance of their duties to the fund. In the normal course of business, a fund may also enter into contracts that provide general indemnifications. A fund's maximum exposure under these arrangements is unknown as this would be dependent on future claims that may be made against a fund. The risk of material loss from such claims is considered remote.
11. Risk and Uncertainties.
Many factors affect a fund's performance. Developments that disrupt global economies and financial markets, such as pandemics, epidemics, outbreaks of infectious diseases, war, terrorism, and environmental disasters, may significantly affect a fund's investment performance. The effects of these developments to a fund will be impacted by the types of securities in which a fund invests, the financial condition, industry, economic sector, and geographic location of an issuer, and a fund's level of investment in the securities of that issuer. Significant concentrations in security types, issuers, industries, sectors, and geographic locations may magnify the factors that affect a fund's performance.
Fidelity® Emerging Markets Fund
Schedule of Investments October 31, 2024
Showing Percentage of Net Assets
| Common Stocks - 98.3% |
| | | Shares | Value ($) |
| Brazil - 6.3% | | | |
| Atacadao SA | | 16,379,827 | 21,222,457 |
| Banco BTG Pactual SA unit | | 9,522,700 | 53,569,203 |
| Equatorial Energia SA | | 11,754,300 | 65,309,574 |
| MercadoLibre, Inc. (a) | | 29,400 | 59,893,092 |
| Nu Holdings Ltd. Class A (a) | | 10,346,170 | 156,123,705 |
| Raia Drogasil SA | | 13,846,900 | 58,301,224 |
| Totvs SA | | 9,605,100 | 49,579,855 |
| Vamos Locacao de Caminhoes Maquinas e Equipamentos SA | | 15,390,984 | 16,746,404 |
| Weg SA | | 8,382,400 | 78,460,389 |
TOTAL BRAZIL | | | 559,205,903 |
| Canada - 1.0% | | | |
| Cameco Corp. | | 1,633,000 | 85,335,641 |
| China - 24.3% | | | |
| Airtac International Group | | 2,588,000 | 71,868,987 |
| Bank of Chengdu Co. Ltd. (A Shares) | | 17,740,244 | 38,428,068 |
| Chervon Holdings Ltd. | | 1,203,028 | 3,168,076 |
| Contemporary Amperex Technology Co. Ltd. | | 1,949,337 | 67,631,776 |
| JD.com, Inc. sponsored ADR | | 4,658,100 | 189,212,022 |
| Kweichow Moutai Co. Ltd. (A Shares) | | 840,626 | 180,486,229 |
| Meituan Class B (a)(b) | | 11,803,010 | 278,909,530 |
| NetEase, Inc. ADR | | 514,700 | 41,438,497 |
| PDD Holdings, Inc. ADR (a) | | 2,225,200 | 268,336,868 |
| Shenzhen Mindray Bio-Medical Electronics Co. Ltd. (A Shares) | | 3,380,225 | 126,598,546 |
| Sieyuan Electric Co. Ltd. (A Shares) | | 13,375,816 | 143,596,059 |
| Tencent Holdings Ltd. | | 11,248,600 | 586,525,973 |
| Tencent Music Entertainment Group ADR | | 6,477,725 | 72,097,079 |
| Yum China Holdings, Inc. | | 2,364,800 | 104,311,328 |
| ZKH Group Ltd. (A Shares) (a) | | 1 | 0 |
TOTAL CHINA | | | 2,172,609,038 |
| France - 2.3% | | | |
| Gaztransport et Technigaz SA | | 691,441 | 100,332,134 |
| Hermes International SCA | | 45,919 | 103,592,966 |
TOTAL FRANCE | | | 203,925,100 |
| Germany - 0.6% | | | |
| BioNTech SE ADR (a) | | 490,000 | 55,419,000 |
| Greece - 0.7% | | | |
| OPAP SA | | 3,692,744 | 62,983,146 |
| Hungary - 0.7% | | | |
| Richter Gedeon PLC | | 2,217,755 | 64,061,772 |
| India - 18.4% | | | |
| 360 ONE WAM Ltd. | | 8,604,061 | 111,334,057 |
| Bajaj Finance Ltd. | | 1,293,400 | 105,642,957 |
| Computer Age Management Services Private Ltd. | | 1,868,400 | 98,435,560 |
| Delhivery Private Ltd. (a) | | 12,716,500 | 53,715,786 |
| HDFC Bank Ltd. | | 11,059,567 | 227,320,145 |
| HDFC Standard Life Insurance Co. Ltd. (b) | | 8,489,700 | 72,512,937 |
| Hindustan Aeronautics Ltd. | | 1,768,300 | 88,981,865 |
| Jindal Steel & Power Ltd. | | 5,944,400 | 64,874,176 |
| Kotak Mahindra Bank Ltd. | | 3,074,448 | 63,117,410 |
| Larsen & Toubro Ltd. | | 2,633,632 | 113,129,167 |
| Lenskart Solutions Pvt Ltd. (a)(c)(d) | | 3,233,000 | 9,352,376 |
| Max Healthcare Institute Ltd. | | 9,495,148 | 114,616,415 |
| Power Grid Corp. of India Ltd. | | 24,234,733 | 92,185,978 |
| Reliance Industries Ltd. (a) | | 5,997,918 | 94,158,190 |
| Reliance Industries Ltd. | | 5,997,918 | 94,836,395 |
| SBI Life Insurance Co. Ltd. (b) | | 4,057,700 | 78,119,858 |
| Tata Consultancy Services Ltd. | | 1,960,300 | 92,204,374 |
| Ultratech Cement Ltd. | | 531,300 | 69,766,261 |
TOTAL INDIA | | | 1,644,303,907 |
| Indonesia - 3.8% | | | |
| PT Bank Central Asia Tbk | | 394,966,870 | 255,621,199 |
| PT Bank Mandiri (Persero) Tbk | | 196,128,000 | 83,260,088 |
TOTAL INDONESIA | | | 338,881,287 |
| Italy - 0.7% | | | |
| Ferrari NV (e) | | 136,200 | 64,814,856 |
| Japan - 0.7% | | | |
| Disco Corp. | | 224,200 | 63,792,702 |
| Kazakhstan - 1.2% | | | |
| Kaspi.KZ JSC ADR | | 993,600 | 109,435,104 |
| Korea (South) - 6.4% | | | |
| Samsung Biologics Co. Ltd. (a)(b) | | 102,830 | 74,614,404 |
| Samsung Electronics Co. Ltd. | | 6,140,887 | 261,602,139 |
| SK Hynix, Inc. | | 1,481,840 | 194,628,719 |
| Webtoon Entertainment, Inc. (e) | | 3,599,100 | 37,430,640 |
TOTAL KOREA (SOUTH) | | | 568,275,902 |
| Mexico - 2.9% | | | |
| Banco del Bajio SA (b) | | 19,866,623 | 44,162,392 |
| BBB Foods, Inc. (e) | | 2,101,370 | 67,117,758 |
| Becle S.A.B. de CV (e) | | 23,577,425 | 30,989,594 |
| Prologis Property Mexico SA (e) | | 14,736,600 | 49,322,077 |
| Wal-Mart de Mexico SA de CV Series V | | 22,861,100 | 62,861,027 |
TOTAL MEXICO | | | 254,452,848 |
| Netherlands - 1.3% | | | |
| ASML Holding NV (Netherlands) | | 102,300 | 69,125,164 |
| BE Semiconductor Industries NV | | 431,700 | 45,990,829 |
TOTAL NETHERLANDS | | | 115,115,993 |
| Philippines - 0.3% | | | |
| TaskUs, Inc. (a)(e) | | 2,328,272 | 29,429,358 |
| Poland - 0.7% | | | |
| Dino Polska SA (a)(b) | | 768,281 | 63,665,932 |
| Russia - 0.0% | | | |
| Sberbank of Russia (a)(d) | | 25,741,060 | 3 |
| Saudi Arabia - 3.0% | | | |
| Al Rajhi Bank | | 5,737,920 | 134,445,499 |
| Dr Sulaiman Al Habib Medical Services Group Co. | | 595,552 | 45,383,546 |
| Sabic Agriculture-Nutrients Co. | | 1,329,600 | 40,287,691 |
| Saudi Arabian Oil Co. (b) | | 6,195,110 | 44,537,096 |
TOTAL SAUDI ARABIA | | | 264,653,832 |
| Sweden - 0.2% | | | |
| VEF AB (a)(f) | | 93,159,625 | 20,110,388 |
| Taiwan - 16.2% | | | |
| ASPEED Tech, Inc. | | 358,000 | 45,544,791 |
| eMemory Technology, Inc. | | 742,000 | 72,383,228 |
| International Games Systems Co. Ltd. | | 2,205,072 | 69,801,583 |
| Taiwan Semiconductor Manufacturing Co. Ltd. | | 38,134,000 | 1,199,757,055 |
| Voltronic Power Technology Corp. | | 959,868 | 63,330,584 |
TOTAL TAIWAN | | | 1,450,817,241 |
| United Arab Emirates - 1.5% | | | |
| ADNOC Drilling Co. PJSC | | 59,805,883 | 82,551,511 |
| Adnoc Gas PLC | | 58,345,600 | 52,578,630 |
TOTAL UNITED ARAB EMIRATES | | | 135,130,141 |
| United States of America - 5.1% | | | |
| Energy Recovery, Inc. (a) | | 1,453,900 | 25,966,654 |
| Globant SA (a) | | 361,000 | 75,770,290 |
| NVIDIA Corp. | | 2,661,080 | 353,284,981 |
TOTAL UNITED STATES OF AMERICA | | | 455,021,925 |
| TOTAL COMMON STOCKS (Cost $6,317,253,248) | | | 8,781,441,019 |
| | | | |
| Convertible Preferred Stocks - 0.2% |
| | | Shares | Value ($) |
| China - 0.2% | | | |
ByteDance Ltd. Series E1 (a)(c)(d) (Cost $9,341,528) | | 85,253 | 21,242,490 |
| | | | |
| Convertible Bonds - 0.3% |
| | | Principal Amount (g) | Value ($) |
| Brazil - 0.3% | | | |
Creditas Financial Solutions Ltd. 5% 7/28/27 (c)(d) (Cost $30,523,684) | | 30,523,684 | 28,606,797 |
| | | | |
| Money Market Funds - 2.8% |
| | | Shares | Value ($) |
| Fidelity Cash Central Fund 4.87% (h) | | 198,908,968 | 198,948,750 |
| Fidelity Securities Lending Cash Central Fund 4.87% (h)(i) | | 47,262,698 | 47,267,424 |
| TOTAL MONEY MARKET FUNDS (Cost $246,216,174) | | | 246,216,174 |
| | | | |
| TOTAL INVESTMENT IN SECURITIES - 101.6% (Cost $6,603,334,634) | 9,077,506,480 |
NET OTHER ASSETS (LIABILITIES) - (1.6)% | (146,688,874) |
| NET ASSETS - 100.0% | 8,930,817,606 |
| | |
Legend
| (b) | Security exempt from registration under Rule 144A of the Securities Act of 1933. These securities may be resold in transactions exempt from registration, normally to qualified institutional buyers. At the end of the period, the value of these securities amounted to $656,522,149 or 7.4% of net assets. |
| (c) | Restricted securities (including private placements) - Investment in securities not registered under the Securities Act of 1933 (excluding 144A issues). At the end of the period, the value of restricted securities (excluding 144A issues) amounted to $59,201,663 or 0.7% of net assets. |
| (e) | Security or a portion of the security is on loan at period end. |
| (g) | Amount is stated in United States dollars unless otherwise noted. |
| (h) | Affiliated fund that is generally available only to investment companies and other accounts managed by Fidelity Investments. The rate quoted is the annualized seven-day yield of the fund at period end. A complete unaudited listing of the fund's holdings as of its most recent quarter end is available upon request. In addition, each Fidelity Central Fund's financial statements, which are not covered by the Fund's Report of Independent Registered Public Accounting Firm, are available on the SEC's website or upon request. |
| (i) | Investment made with cash collateral received from securities on loan. |
| Additional information on each restricted holding is as follows: |
| Security | Acquisition Date | Acquisition Cost ($) |
| ByteDance Ltd. Series E1 | 11/18/20 | 9,341,528 |
| | | |
| Creditas Financial Solutions Ltd. 5% 7/28/27 | 1/28/22 - 7/28/23 | 30,523,684 |
| | | |
| Lenskart Solutions Pvt Ltd. | 4/30/24 | 8,909,538 |
| | | |
Affiliated Central Funds
Fiscal year to date information regarding the Fund's investments in Fidelity Central Funds, including the ownership percentage, is presented below.
| Affiliate | Value, beginning of period ($) | Purchases ($) | Sales Proceeds ($) | Dividend Income ($) | Realized Gain (loss) ($) | Change in Unrealized appreciation (depreciation) ($) | Value, end of period ($) | % ownership, end of period |
| Fidelity Cash Central Fund 4.87% | 53,179,150 | 3,402,717,499 | 3,267,525,699 | 8,646,919 | 1,664 | - | 198,948,750 | 0.4% |
| Fidelity Securities Lending Cash Central Fund 4.87% | 27,684,244 | 1,081,327,203 | 1,061,744,023 | 570,181 | - | - | 47,267,424 | 0.2% |
| Total | 80,863,394 | 4,484,044,702 | 4,329,269,722 | 9,217,100 | 1,664 | - | 246,216,174 | |
| | | | | | | | | |
Amounts in the dividend income column in the above table include any capital gain distributions from underlying funds, which are presented in the corresponding line item in the Statement of Operations, if applicable.
Amounts in the dividend income column for Fidelity Securities Lending Cash Central Fund represents the income earned on investing cash collateral, less rebates paid to borrowers and any lending agent fees associated with the loan, plus any premium payments received for lending certain types of securities.
Amounts included in the purchases and sales proceeds columns may include in-kind transactions, if applicable.
Other Affiliated Issuers
An affiliated company is a company in which the Fund has ownership of at least 5% of the voting securities. Fiscal year to date transactions with companies which are or were affiliates are presented in the table below. Certain corporate actions, such as mergers, are excluded from the amounts in this table if applicable. A dash in the Value end of period ($) column means either the issuer is no longer held at period end, or the issuer is held at period end but is no longer an affiliate.
| Affiliate | Value, beginning of period ($) | Purchases ($) | Sales Proceeds ($) | Dividend Income ($) | Realized Gain (loss) ($) | Change in Unrealized appreciation (depreciation) ($) | Value, end of period ($) |
| Restaurant Brands Asia Ltd. | 34,411,680 | - | 33,518,531 | - | (10,714,754) | 9,821,605 | - |
| VEF AB | 15,223,914 | - | 3,583,261 | - | 224,834 | 5,618,771 | 20,110,388 |
| Total | 49,635,594 | - | 37,101,792 | - | (10,489,920) | 15,440,376 | 20,110,388 |
Amounts included in the purchases and sales proceeds columns may include in-kind transactions, if applicable.
Investment Valuation
The following is a summary of the inputs used, as of October 31, 2024, involving the Fund's assets and liabilities carried at fair value. The inputs or methodology used for valuing securities may not be an indication of the risk associated with investing in those securities. For more information on valuation inputs, and their aggregation into the levels used below, please refer to the Investment Valuation section in the accompanying Notes to Financial Statements.
| Valuation Inputs at Reporting Date: |
| Description | Total ($) | Level 1 ($) | Level 2 ($) | Level 3 ($) |
Investments in Securities: | | | | |
|
| Equities: | | | | |
Communication Services | 828,536,262 | 150,966,216 | 656,327,556 | 21,242,490 |
Consumer Discretionary | 1,144,574,260 | 853,144,278 | 282,077,606 | 9,352,376 |
Consumer Staples | 484,644,221 | 304,157,992 | 180,486,229 | - |
Energy | 554,329,597 | 365,335,012 | 188,994,585 | - |
Financials | 1,553,203,013 | 517,846,291 | 1,035,356,719 | 3 |
Health Care | 480,693,683 | 164,864,318 | 315,829,365 | - |
Industrials | 851,292,589 | 150,602,805 | 700,689,784 | - |
Information Technology | 2,523,664,127 | 593,751,119 | 1,929,913,008 | - |
Materials | 174,928,128 | 40,287,691 | 134,640,437 | - |
Real Estate | 49,322,077 | 49,322,077 | - | - |
Utilities | 157,495,552 | 65,309,574 | 92,185,978 | - |
|
| Corporate Bonds | 28,606,797 | - | - | 28,606,797 |
|
| Money Market Funds | 246,216,174 | 246,216,174 | - | - |
| Total Investments in Securities: | 9,077,506,480 | 3,501,803,547 | 5,516,501,267 | 59,201,666 |
Fidelity® Emerging Markets Fund
Financial Statements
| Statement of Assets and Liabilities |
As of October 31, 2024 |
| Assets | | | | |
| Investment in securities, at value (including securities loaned of $44,702,396) - See accompanying schedule: | | | | |
Unaffiliated issuers (cost $6,319,743,443) | $ | 8,811,179,918 | | |
Fidelity Central Funds (cost $246,216,174) | | 246,216,174 | | |
Other affiliated issuers (cost $37,375,017) | | 20,110,388 | | |
| | | | | |
| | | | | |
| Total Investment in Securities (cost $6,603,334,634) | | | $ | 9,077,506,480 |
| Foreign currency held at value (cost $594,901) | | | | 596,725 |
| Receivable for investments sold | | | | 230,889 |
| Receivable for fund shares sold | | | | 6,703,979 |
| Dividends receivable | | | | 7,587,759 |
| Interest receivable | | | | 1,927,539 |
| Distributions receivable from Fidelity Central Funds | | | | 429,575 |
| Prepaid expenses | | | | 11,530 |
| Receivable from investment adviser for expense reductions | | | | 81,259 |
| Other receivables | | | | 3,452,137 |
Total assets | | | | 9,098,527,872 |
| Liabilities | | | | |
| Payable for investments purchased | $ | 14,326,058 | | |
| Payable for fund shares redeemed | | 26,599,321 | | |
| Accrued management fee | | 6,580,779 | | |
| Distribution and service plan fees payable | | 14,022 | | |
| Deferred taxes | | 70,437,805 | | |
| Other payables and accrued expenses | | 2,484,857 | | |
| Collateral on securities loaned | | 47,267,424 | | |
| Total liabilities | | | | 167,710,266 |
| Net Assets | | | $ | 8,930,817,606 |
| Net Assets consist of: | | | | |
| Paid in capital | | | $ | 7,368,964,367 |
| Total accumulated earnings (loss) | | | | 1,561,853,239 |
| Net Assets | | | $ | 8,930,817,606 |
| | | | | |
| Net Asset Value and Maximum Offering Price | | | | |
| Class A : | | | | |
Net Asset Value and redemption price per share ($38,430,481 ÷ 969,981 shares)(a) | | | $ | 39.62 |
| Maximum offering price per share (100/94.25 of $39.62) | | | $ | 42.04 |
| Class M : | | | | |
Net Asset Value and redemption price per share ($6,498,212 ÷ 164,153 shares)(a) | | | $ | 39.59 |
| Maximum offering price per share (100/96.50 of $39.59) | | | $ | 41.03 |
| Class C : | | | | |
Net Asset Value and offering price per share ($3,573,446 ÷ 90,942 shares)(a) | | | $ | 39.29 |
| Emerging Markets : | | | | |
Net Asset Value, offering price and redemption price per share ($4,759,857,845 ÷ 119,497,813 shares) | | | $ | 39.83 |
| Class K : | | | | |
Net Asset Value, offering price and redemption price per share ($1,897,729,674 ÷ 47,597,261 shares) | | | $ | 39.87 |
| Class I : | | | | |
Net Asset Value, offering price and redemption price per share ($303,026,677 ÷ 7,629,188 shares) | | | $ | 39.72 |
| Class Z : | | | | |
Net Asset Value, offering price and redemption price per share ($1,921,701,271 ÷ 48,255,370 shares) | | | $ | 39.82 |
(a)Redemption price per share is equal to net asset value less any applicable contingent deferred sales charge. |
| Statement of Operations |
| Year ended October 31, 2024 |
| Investment Income | | | | |
| Dividends | | | $ | 157,329,764 |
| Interest | | | | 1,549,748 |
| Income from Fidelity Central Funds (including $570,181 from security lending) | | | | 9,217,100 |
| Income before foreign taxes withheld | | | $ | 168,096,612 |
| Less foreign taxes withheld | | | | (17,351,514) |
| Total income | | | | 150,745,098 |
| Expenses | | | | |
| Management fee | $ | 66,905,588 | | |
| Transfer agent fees | | 3,037,683 | | |
| Distribution and service plan fees | | 102,310 | | |
| Accounting fees | | 552,258 | | |
| Custodian fees and expenses | | 1,871,217 | | |
| Independent trustees' fees and expenses | | 38,750 | | |
| Registration fees | | 195,095 | | |
| Audit fees | | 128,196 | | |
| Legal | | 7,260 | | |
| Interest | | 28,577 | | |
| Miscellaneous | | 124,512 | | |
| Total expenses before reductions | | 72,991,446 | | |
| Expense reductions | | (380,668) | | |
| Total expenses after reductions | | | | 72,610,778 |
| Net Investment income (loss) | | | | 78,134,320 |
| Realized and Unrealized Gain (Loss) | | | | |
| Net realized gain (loss) on: | | | | |
| Investment Securities: | | | | |
| Unaffiliated issuers (net of foreign taxes of $18,767,175) | | (24,895,432) | | |
| Redemptions in-kind | | 346,805,773 | | |
| Fidelity Central Funds | | 1,664 | | |
| Other affiliated issuers | | (10,489,920) | | |
| Foreign currency transactions | | (2,625,158) | | |
| Futures contracts | | 6,090,798 | | |
| Total net realized gain (loss) | | | | 314,887,725 |
| Change in net unrealized appreciation (depreciation) on: | | | | |
| Investment Securities: | | | | |
| Unaffiliated issuers (net of increase in deferred foreign taxes of $38,666,205) | | 1,541,900,271 | | |
| Affiliated issuers | | 15,440,376 | | |
| Assets and liabilities in foreign currencies | | 665,541 | | |
| Total change in net unrealized appreciation (depreciation) | | | | 1,558,006,188 |
| Net gain (loss) | | | | 1,872,893,913 |
| Net increase (decrease) in net assets resulting from operations | | | $ | 1,951,028,233 |
| Statement of Changes in Net Assets |
| |
| | Year ended October 31, 2024 | | Year ended October 31, 2023 |
| Increase (Decrease) in Net Assets | | | | |
| Operations | | | | |
| Net investment income (loss) | $ | 78,134,320 | $ | 77,916,451 |
| Net realized gain (loss) | | 314,887,725 | | (418,114,595) |
| Change in net unrealized appreciation (depreciation) | | 1,558,006,188 | | 1,169,042,149 |
| Net increase (decrease) in net assets resulting from operations | | 1,951,028,233 | | 828,844,005 |
| Distributions to shareholders | | (91,875,932) | | (50,450,464) |
| | | | | |
| Share transactions - net increase (decrease) | | 244,321,857 | | 524,409,567 |
| | | | | |
| Total increase (decrease) in net assets | | 2,103,474,158 | | 1,302,803,108 |
| | | | | |
| Net Assets | | | | |
| Beginning of period | | 6,827,343,448 | | 5,524,540,340 |
| End of period | $ | 8,930,817,606 | $ | 6,827,343,448 |
| | | | | |
| | | | | |
Financial Highlights
Fidelity Advisor® Emerging Markets Fund Class A |
| |
| Years ended October 31, | | 2024 | | 2023 | | 2022 | | 2021 A |
Selected Per-Share Data | | | | | | | | |
| Net asset value, beginning of period | $ | 31.80 | $ | 27.73 | $ | 47.48 | $ | 46.83 |
| Income from Investment Operations | | | | | | | | |
Net investment income (loss) B,C | | .21 | | .26 D | | .16 E | | (.04) |
| Net realized and unrealized gain (loss) | | 7.91 | | 3.95 | | (17.27) | | .69 |
| Total from investment operations | | 8.12 | | 4.21 | | (17.11) | | .65 |
| Distributions from net investment income | | (.30) | | (.14) | | (.48) | | - |
| Distributions from net realized gain | | - | | - | | (2.16) | | - |
| Total distributions | | (.30) | | (.14) | | (2.64) | | - |
| Net asset value, end of period | $ | 39.62 | $ | 31.80 | $ | 27.73 | $ | 47.48 |
Total Return F,G,H | | | | 15.18% | | (38.00)% | | 1.39% |
Ratios to Average Net Assets C,I,J | | | | | | | | |
| Expenses before reductions | | 1.14% | | 1.20% | | 1.21% | | 1.25% K |
| Expenses net of fee waivers, if any | | | | 1.20% | | 1.21% | | 1.25% K |
| Expenses net of all reductions | | 1.13% | | 1.20% | | 1.21% | | 1.25% K |
| Net investment income (loss) | | .54% | | .77% D | | .45% E | | (.17)% K |
| Supplemental Data | | | | | | | | |
| Net assets, end of period (000 omitted) | $ | 38,430 | $ | 15,288 | $ | 10,046 | $ | 6,248 |
Portfolio turnover rate L | | | | 23% | | 34% | | 38% K,N |
AFor the period May 11, 2021 (commencement of sale of shares) through October 31, 2021.
BCalculated based on average shares outstanding during the period.
CNet investment income (loss) is affected by the timing of the declaration of dividends by any underlying mutual funds or exchange-traded funds (ETFs). Net investment income (loss) of any mutual funds or ETFs is not included in the Fund's net investment income (loss) ratio.
DNet investment income per share reflects one or more large, non-recurring dividend(s) which amounted to $.11 per share. Excluding such non-recurring dividend(s), the ratio of net investment income (loss) to average net assets would have been .44%.
ENet investment income per share reflects one or more large, non-recurring dividend(s) which amounted to $.08 per share. Excluding such non-recurring dividend(s), the ratio of net investment income (loss) to average net assets would have been .22%.
FTotal returns for periods of less than one year are not annualized.
GTotal returns would have been lower if certain expenses had not been reduced during the applicable periods shown.
HTotal returns do not include the effect of the sales charges.
IFees and expenses of any underlying mutual funds or exchange-traded funds (ETFs) are not included in the Fund's expense ratio. The Fund indirectly bears its proportionate share of these expenses. For additional expense information related to investments in Fidelity Central Funds, please refer to the "Investments in Fidelity Central Funds" note found in the Notes to Financial Statements section of the most recent Annual or Semi-Annual report.
JExpense ratios reflect operating expenses of the class. Expenses before reductions do not reflect amounts reimbursed, waived, or reduced through arrangements with the investment adviser, brokerage services, or other offset arrangements, if applicable, and do not represent the amount paid by the class during periods when reimbursements, waivers or reductions occur.
KAnnualized.
LAmount does not include the portfolio activity of any underlying mutual funds or exchange-traded funds (ETFs).
MPortfolio turnover rate excludes securities received or delivered in-kind.
NThe portfolio turnover rate does not include the assets acquired in the reorganization.
Fidelity Advisor® Emerging Markets Fund Class M |
| |
| Years ended October 31, | | 2024 | | 2023 | | 2022 | | 2021 A |
Selected Per-Share Data | | | | | | | | |
| Net asset value, beginning of period | $ | 31.80 | $ | 27.71 | $ | 47.42 | $ | 46.83 |
| Income from Investment Operations | | | | | | | | |
Net investment income (loss) B,C | | .11 | | .17 D | | .05 E | | (.09) |
| Net realized and unrealized gain (loss) | | 7.92 | | 3.96 | | (17.29) | | .68 |
| Total from investment operations | | 8.03 | | 4.13 | | (17.24) | | .59 |
| Distributions from net investment income | | (.24) | | (.04) | | (.32) | | - |
| Distributions from net realized gain | | - | | - | | (2.16) | | - |
| Total distributions | | (.24) | | (.04) | | (2.47) F | | - |
| Net asset value, end of period | $ | 39.59 | $ | 31.80 | $ | 27.71 | $ | 47.42 |
Total Return G,H,I | | | | 14.90% | | (38.20)% | | 1.26% |
Ratios to Average Net Assets C,J,K | | | | | | | | |
| Expenses before reductions | | 1.39% | | 1.48% | | 1.51% | | 1.52% L |
| Expenses net of fee waivers, if any | | | | 1.47% | | 1.50% | | 1.51% L |
| Expenses net of all reductions | | 1.39% | | 1.47% | | 1.50% | | 1.51% L |
| Net investment income (loss) | | .29% | | .50% D | | .15% E | | (.39)% L |
| Supplemental Data | | | | | | | | |
| Net assets, end of period (000 omitted) | $ | 6,498 | $ | 3,070 | $ | 1,392 | $ | 2,234 |
Portfolio turnover rate M | | | | 23% | | 34% | | 38% L,N |
AFor the period May 11, 2021 (commencement of sale of shares) through October 31, 2021.
BCalculated based on average shares outstanding during the period.
CNet investment income (loss) is affected by the timing of the declaration of dividends by any underlying mutual funds or exchange-traded funds (ETFs). Net investment income (loss) of any mutual funds or ETFs is not included in the Fund's net investment income (loss) ratio.
DNet investment income per share reflects one or more large, non-recurring dividend(s) which amounted to $.11 per share. Excluding such non-recurring dividend(s), the ratio of net investment income (loss) to average net assets would have been .17%.
ENet investment income per share reflects one or more large, non-recurring dividend(s) which amounted to $.08 per share. Excluding such non-recurring dividend(s), the ratio of net investment income (loss) to average net assets would have been (.08)%.
FTotal distributions per share do not sum due to rounding.
GTotal returns for periods of less than one year are not annualized.
HTotal returns would have been lower if certain expenses had not been reduced during the applicable periods shown.
ITotal returns do not include the effect of the sales charges.
JFees and expenses of any underlying mutual funds or exchange-traded funds (ETFs) are not included in the Fund's expense ratio. The Fund indirectly bears its proportionate share of these expenses. For additional expense information related to investments in Fidelity Central Funds, please refer to the "Investments in Fidelity Central Funds" note found in the Notes to Financial Statements section of the most recent Annual or Semi-Annual report.
KExpense ratios reflect operating expenses of the class. Expenses before reductions do not reflect amounts reimbursed, waived, or reduced through arrangements with the investment adviser, brokerage services, or other offset arrangements, if applicable, and do not represent the amount paid by the class during periods when reimbursements, waivers or reductions occur.
LAnnualized.
MAmount does not include the portfolio activity of any underlying mutual funds or exchange-traded funds (ETFs).
NThe portfolio turnover rate does not include the assets acquired in the reorganization.
OPortfolio turnover rate excludes securities received or delivered in-kind.
Fidelity Advisor® Emerging Markets Fund Class C |
| |
| Years ended October 31, | | 2024 | | 2023 | | 2022 | | 2021 A |
Selected Per-Share Data | | | | | | | | |
| Net asset value, beginning of period | $ | 31.54 | $ | 27.59 | $ | 47.31 | $ | 46.83 |
| Income from Investment Operations | | | | | | | | |
Net investment income (loss) B,C | | (.08) | | - D,E | | (.12) F | | (.19) |
| Net realized and unrealized gain (loss) | | 7.88 | | 3.95 | | (17.26) | | .67 |
| Total from investment operations | | 7.80 | | 3.95 | | (17.38) | | .48 |
| Distributions from net investment income | | (.05) | | - | | (.18) | | - |
| Distributions from net realized gain | | - | | - | | (2.16) | | - |
| Total distributions | | (.05) | | - | | (2.34) | | - |
| Net asset value, end of period | $ | 39.29 | $ | 31.54 | $ | 27.59 | $ | 47.31 |
Total Return G,H,I | | | | 14.32% | | (38.50)% | | 1.02% |
Ratios to Average Net Assets C,J,K | | | | | | | | |
| Expenses before reductions | | 1.89% | | 1.98% | | 2.00% | | 2.01% L |
| Expenses net of fee waivers, if any | | | | 1.98% | | 2.00% | | 2.01% L |
| Expenses net of all reductions | | 1.88% | | 1.97% | | 2.00% | | 2.01% L |
| Net investment income (loss) | | (.21)% | | (.01)% D | | (.34)% F | | (.86)% L |
| Supplemental Data | | | | | | | | |
| Net assets, end of period (000 omitted) | $ | 3,573 | $ | 1,768 | $ | 1,377 | $ | 1,587 |
Portfolio turnover rate M | | | | 23% | | 34% | | 38% L,O |
AFor the period May 11, 2021 (commencement of sale of shares) through October 31, 2021.
BCalculated based on average shares outstanding during the period.
CNet investment income (loss) is affected by the timing of the declaration of dividends by any underlying mutual funds or exchange-traded funds (ETFs). Net investment income (loss) of any mutual funds or ETFs is not included in the Fund's net investment income (loss) ratio.
DNet investment income per share reflects one or more large, non-recurring dividend(s) which amounted to $.11 per share. Excluding such non-recurring dividend(s), the ratio of net investment income (loss) to average net assets would have been (.34)%.
EAmount represents less than $.005 per share.
FNet investment income per share reflects one or more large, non-recurring dividend(s) which amounted to $.08 per share. Excluding such non-recurring dividend(s), the ratio of net investment income (loss) to average net assets would have been (.57)%.
GTotal returns for periods of less than one year are not annualized.
HTotal returns would have been lower if certain expenses had not been reduced during the applicable periods shown.
ITotal returns do not include the effect of the contingent deferred sales charge.
JFees and expenses of any underlying mutual funds or exchange-traded funds (ETFs) are not included in the Fund's expense ratio. The Fund indirectly bears its proportionate share of these expenses. For additional expense information related to investments in Fidelity Central Funds, please refer to the "Investments in Fidelity Central Funds" note found in the Notes to Financial Statements section of the most recent Annual or Semi-Annual report.
KExpense ratios reflect operating expenses of the class. Expenses before reductions do not reflect amounts reimbursed, waived, or reduced through arrangements with the investment adviser, brokerage services, or other offset arrangements, if applicable, and do not represent the amount paid by the class during periods when reimbursements, waivers or reductions occur.
LAnnualized.
MAmount does not include the portfolio activity of any underlying mutual funds or exchange-traded funds (ETFs).
NPortfolio turnover rate excludes securities received or delivered in-kind.
OThe portfolio turnover rate does not include the assets acquired in the reorganization.
Fidelity® Emerging Markets Fund |
| |
| Years ended October 31, | | 2024 | | 2023 | | 2022 | | 2021 | | 2020 |
Selected Per-Share Data | | | | | | | | | | |
| Net asset value, beginning of period | $ | 31.97 | $ | 27.87 | $ | 47.56 | $ | 40.26 | $ | 33.03 |
| Income from Investment Operations | | | | | | | | | | |
Net investment income (loss) A,B | | .30 | | .36 C | | .28 D | | .12 | | .15 |
| Net realized and unrealized gain (loss) | | 7.96 | | 3.98 | | (17.35) | | 7.81 | | 7.68 |
| Total from investment operations | | 8.26 | | 4.34 | | (17.07) | | 7.93 | | 7.83 |
| Distributions from net investment income | | (.40) | | (.24) | | (.46) | | (.09) | | (.60) |
| Distributions from net realized gain | | - | | - | | (2.16) | | (.54) | | - |
| Total distributions | | (.40) | | (.24) | | (2.62) | | (.63) | | (.60) |
| Net asset value, end of period | $ | 39.83 | $ | 31.97 | $ | 27.87 | $ | 47.56 | $ | 40.26 |
Total Return E | | | | 15.56% | | (37.83)% | | 19.83% | | 24.09% |
Ratios to Average Net Assets A,F,G | | | | | | | | | | |
| Expenses before reductions | | .87% | | .90% | | .90% | | .88% | | .92% |
| Expenses net of fee waivers, if any | | | | .90% | | .90% | | .88% | | .92% |
| Expenses net of all reductions | | .87% | | .90% | | .90% | | .88% | | .91% |
| Net investment income (loss) | | .81% | | 1.07% C | | .76% D | | .26% | | .43% |
| Supplemental Data | | | | | | | | | | |
| Net assets, end of period (000 omitted) | $ | 4,759,858 | $ | 3,985,433 | $ | 3,330,900 | $ | 5,016,159 | $ | 4,526,531 |
Portfolio turnover rate H | | | | 23% | | 34% | | 38% J | | 34% |
ANet investment income (loss) is affected by the timing of the declaration of dividends by any underlying mutual funds or exchange-traded funds (ETFs). Net investment income (loss) of any mutual funds or ETFs is not included in the Fund's net investment income (loss) ratio.
BCalculated based on average shares outstanding during the period.
CNet investment income per share reflects one or more large, non-recurring dividend(s) which amounted to $.11 per share. Excluding such non-recurring dividend(s), the ratio of net investment income (loss) to average net assets would have been .74%.
DNet investment income per share reflects one or more large, non-recurring dividend(s) which amounted to $.08 per share. Excluding such non-recurring dividend(s), the ratio of net investment income (loss) to average net assets would have been .53%.
ETotal returns would have been lower if certain expenses had not been reduced during the applicable periods shown.
FFees and expenses of any underlying mutual funds or exchange-traded funds (ETFs) are not included in the Fund's expense ratio. The Fund indirectly bears its proportionate share of these expenses. For additional expense information related to investments in Fidelity Central Funds, please refer to the "Investments in Fidelity Central Funds" note found in the Notes to Financial Statements section of the most recent Annual or Semi-Annual report.
GExpense ratios reflect operating expenses of the class. Expenses before reductions do not reflect amounts reimbursed, waived, or reduced through arrangements with the investment adviser, brokerage services, or other offset arrangements, if applicable, and do not represent the amount paid by the class during periods when reimbursements, waivers or reductions occur.
HAmount does not include the portfolio activity of any underlying mutual funds or exchange-traded funds (ETFs).
IPortfolio turnover rate excludes securities received or delivered in-kind.
JThe portfolio turnover rate does not include the assets acquired in the reorganization.
Fidelity® Emerging Markets Fund Class K |
| |
| Years ended October 31, | | 2024 | | 2023 | | 2022 | | 2021 | | 2020 |
Selected Per-Share Data | | | | | | | | | | |
| Net asset value, beginning of period | $ | 32.00 | $ | 27.90 | $ | 47.62 | $ | 40.30 | $ | 33.07 |
| Income from Investment Operations | | | | | | | | | | |
Net investment income (loss) A,B | | .36 | | .40 C | | .33 D | | .16 | | .19 |
| Net realized and unrealized gain (loss) | | 7.95 | | 3.98 | | (17.35) | | 7.83 | | 7.69 |
| Total from investment operations | | 8.31 | | 4.38 | | (17.02) | | 7.99 | | 7.88 |
| Distributions from net investment income | | (.44) | | (.28) | | (.54) | | (.12) | | (.65) |
| Distributions from net realized gain | | - | | - | | (2.16) | | (.54) | | - |
| Total distributions | | (.44) | | (.28) | | (2.70) | | (.67) E | | (.65) |
| Net asset value, end of period | $ | 39.87 | $ | 32.00 | $ | 27.90 | $ | 47.62 | $ | 40.30 |
Total Return F | | | | 15.69% | | (37.73)% | | 19.94% | | 24.24% |
Ratios to Average Net Assets B,G,H | | | | | | | | | | |
| Expenses before reductions | | .74% | | .77% | | .77% | | .77% | | .80% |
| Expenses net of fee waivers, if any | | | | .76% | | .77% | | .77% | | .80% |
| Expenses net of all reductions | | .74% | | .76% | | .77% | | .77% | | .79% |
| Net investment income (loss) | | .94% | | 1.20% C | | .88% D | | .34% | | .55% |
| Supplemental Data | | | | | | | | | | |
| Net assets, end of period (000 omitted) | $ | 1,897,730 | $ | 1,095,217 | $ | 826,468 | $ | 1,689,454 | $ | 1,227,097 |
Portfolio turnover rate I | | | | 23% | | 34% | | 38% K | | 34% |
ACalculated based on average shares outstanding during the period.
BNet investment income (loss) is affected by the timing of the declaration of dividends by any underlying mutual funds or exchange-traded funds (ETFs). Net investment income (loss) of any mutual funds or ETFs is not included in the Fund's net investment income (loss) ratio.
CNet investment income per share reflects one or more large, non-recurring dividend(s) which amounted to $.11 per share. Excluding such non-recurring dividend(s), the ratio of net investment income (loss) to average net assets would have been .87%.
DNet investment income per share reflects one or more large, non-recurring dividend(s) which amounted to $.08 per share. Excluding such non-recurring dividend(s), the ratio of net investment income (loss) to average net assets would have been .66%.
ETotal distributions per share do not sum due to rounding.
FTotal returns would have been lower if certain expenses had not been reduced during the applicable periods shown.
GFees and expenses of any underlying mutual funds or exchange-traded funds (ETFs) are not included in the Fund's expense ratio. The Fund indirectly bears its proportionate share of these expenses. For additional expense information related to investments in Fidelity Central Funds, please refer to the "Investments in Fidelity Central Funds" note found in the Notes to Financial Statements section of the most recent Annual or Semi-Annual report.
HExpense ratios reflect operating expenses of the class. Expenses before reductions do not reflect amounts reimbursed, waived, or reduced through arrangements with the investment adviser, brokerage services, or other offset arrangements, if applicable, and do not represent the amount paid by the class during periods when reimbursements, waivers or reductions occur.
IAmount does not include the portfolio activity of any underlying mutual funds or exchange-traded funds (ETFs).
JPortfolio turnover rate excludes securities received or delivered in-kind.
KThe portfolio turnover rate does not include the assets acquired in the reorganization.
Fidelity Advisor® Emerging Markets Fund Class I |
| |
| Years ended October 31, | | 2024 | | 2023 | | 2022 | | 2021 A |
Selected Per-Share Data | | | | | | | | |
| Net asset value, beginning of period | $ | 31.89 | $ | 27.83 | $ | 47.55 | $ | 46.83 |
| Income from Investment Operations | | | | | | | | |
Net investment income (loss) B,C | | .31 | | .36 D | | .26 E | | .04 |
| Net realized and unrealized gain (loss) | | 7.92 | | 3.97 | | (17.29) | | .68 |
| Total from investment operations | | 8.23 | | 4.33 | | (17.03) | | .72 |
| Distributions from net investment income | | (.40) | | (.27) | | (.53) | | - |
| Distributions from net realized gain | | - | | - | | (2.16) | | - |
| Total distributions | | (.40) | | (.27) | | (2.69) | | - |
| Net asset value, end of period | $ | 39.72 | $ | 31.89 | $ | 27.83 | $ | 47.55 |
Total Return F,G | | | | 15.54% | | (37.81)% | | 1.54% |
Ratios to Average Net Assets C,H,I | | | | | | | | |
| Expenses before reductions | | .88% | | .91% | | .89% | | .94% J |
| Expenses net of fee waivers, if any | | | | .90% | | .89% | | .93% J |
| Expenses net of all reductions | | .87% | | .90% | | .89% | | .93% J |
| Net investment income (loss) | | .81% | | 1.06% D | | .76% E | | .17% J |
| Supplemental Data | | | | | | | | |
| Net assets, end of period (000 omitted) | $ | 303,027 | $ | 114,992 | $ | 47,819 | $ | 25,824 |
Portfolio turnover rate K | | | | 23% | | 34% | | 38% J,M |
AFor the period May 11, 2021 (commencement of sale of shares) through October 31, 2021.
BCalculated based on average shares outstanding during the period.
CNet investment income (loss) is affected by the timing of the declaration of dividends by any underlying mutual funds or exchange-traded funds (ETFs). Net investment income (loss) of any mutual funds or ETFs is not included in the Fund's net investment income (loss) ratio.
DNet investment income per share reflects one or more large, non-recurring dividend(s) which amounted to $.11 per share. Excluding such non-recurring dividend(s), the ratio of net investment income (loss) to average net assets would have been .73%.
ENet investment income per share reflects one or more large, non-recurring dividend(s) which amounted to $.08 per share. Excluding such non-recurring dividend(s), the ratio of net investment income (loss) to average net assets would have been .53%.
FTotal returns for periods of less than one year are not annualized.
GTotal returns would have been lower if certain expenses had not been reduced during the applicable periods shown.
HFees and expenses of any underlying mutual funds or exchange-traded funds (ETFs) are not included in the Fund's expense ratio. The Fund indirectly bears its proportionate share of these expenses. For additional expense information related to investments in Fidelity Central Funds, please refer to the "Investments in Fidelity Central Funds" note found in the Notes to Financial Statements section of the most recent Annual or Semi-Annual report.
IExpense ratios reflect operating expenses of the class. Expenses before reductions do not reflect amounts reimbursed, waived, or reduced through arrangements with the investment adviser, brokerage services, or other offset arrangements, if applicable, and do not represent the amount paid by the class during periods when reimbursements, waivers or reductions occur.
JAnnualized.
KAmount does not include the portfolio activity of any underlying mutual funds or exchange-traded funds (ETFs).
LPortfolio turnover rate excludes securities received or delivered in-kind.
MThe portfolio turnover rate does not include the assets acquired in the reorganization.
Fidelity Advisor® Emerging Markets Fund Class Z |
| |
| Years ended October 31, | | 2024 | | 2023 | | 2022 | | 2021 A |
Selected Per-Share Data | | | | | | | | |
| Net asset value, beginning of period | $ | 31.96 | $ | 27.87 | $ | 47.59 | $ | 46.83 |
| Income from Investment Operations | | | | | | | | |
Net investment income (loss) B,C | | .36 | | .40 D | | .32 E | | (.03) |
| Net realized and unrealized gain (loss) | | 7.94 | | 3.97 | | (17.33) | | .79 |
| Total from investment operations | | 8.30 | | 4.37 | | (17.01) | | .76 |
| Distributions from net investment income | | (.44) | | (.28) | | (.55) | | - |
| Distributions from net realized gain | | - | | - | | (2.16) | | - |
| Total distributions | | (.44) | | (.28) | | (2.71) | | - |
| Net asset value, end of period | $ | 39.82 | $ | 31.96 | $ | 27.87 | $ | 47.59 |
Total Return F,G | | | | 15.67% | | (37.74)% | | 1.62% |
Ratios to Average Net Assets C,H,I | | | | | | | | |
| Expenses before reductions | | .74% | | .77% | | .77% | | .78% J |
| Expenses net of fee waivers, if any | | | | .76% | | .77% | | .78% J |
| Expenses net of all reductions | | .74% | | .76% | | .77% | | .78% J |
| Net investment income (loss) | | .94% | | 1.20% D | | .88% E | | (.13)% J |
| Supplemental Data | | | | | | | | |
| Net assets, end of period (000 omitted) | $ | 1,921,701 | $ | 1,611,575 | $ | 1,306,539 | $ | 1,797,766 |
Portfolio turnover rate K | | | | 23% | | 34% | | 38% J,L |
AFor the period May 11, 2021 (commencement of sale of shares) through October 31, 2021.
BCalculated based on average shares outstanding during the period.
CNet investment income (loss) is affected by the timing of the declaration of dividends by any underlying mutual funds or exchange-traded funds (ETFs). Net investment income (loss) of any mutual funds or ETFs is not included in the Fund's net investment income (loss) ratio.
DNet investment income per share reflects one or more large, non-recurring dividend(s) which amounted to $.11 per share. Excluding such non-recurring dividend(s), the ratio of net investment income (loss) to average net assets would have been .87%.
ENet investment income per share reflects one or more large, non-recurring dividend(s) which amounted to $.08 per share. Excluding such non-recurring dividend(s), the ratio of net investment income (loss) to average net assets would have been .66%.
FTotal returns for periods of less than one year are not annualized.
GTotal returns would have been lower if certain expenses had not been reduced during the applicable periods shown.
HFees and expenses of any underlying mutual funds or exchange-traded funds (ETFs) are not included in the Fund's expense ratio. The Fund indirectly bears its proportionate share of these expenses. For additional expense information related to investments in Fidelity Central Funds, please refer to the "Investments in Fidelity Central Funds" note found in the Notes to Financial Statements section of the most recent Annual or Semi-Annual report.
IExpense ratios reflect operating expenses of the class. Expenses before reductions do not reflect amounts reimbursed, waived, or reduced through arrangements with the investment adviser, brokerage services, or other offset arrangements, if applicable, and do not represent the amount paid by the class during periods when reimbursements, waivers or reductions occur.
JAnnualized.
KAmount does not include the portfolio activity of any underlying mutual funds or exchange-traded funds (ETFs).
LThe portfolio turnover rate does not include the assets acquired in the reorganization.
MPortfolio turnover rate excludes securities received or delivered in-kind.
Notes to Financial Statements
For the period ended October 31, 2024
1. Organization.
Fidelity Emerging Markets Fund (the Fund) is a fund of Fidelity Investment Trust (the Trust) and is authorized to issue an unlimited number of shares. The Trust is registered under the Investment Company Act of 1940, as amended (the 1940 Act), as an open-end management investment company organized as a Massachusetts business trust. The Fund offers Class A, Class M, Class C, Emerging Markets, Class I and Class Z shares, each of which has equal rights as to assets and voting privileges. Class A, Class M, Class C, Class I and Class Z are Fidelity Advisor classes. Each class has exclusive voting rights with respect to matters that affect that class. Class C shares will automatically convert to Class A shares after a holding period of eight years from the initial date of purchase, with certain exceptions. The Fund's investments in emerging markets can be subject to social, economic, regulatory, and political uncertainties and can be extremely volatile.
2. Investments in Fidelity Central Funds.
Funds may invest in Fidelity Central Funds, which are open-end investment companies generally available only to other investment companies and accounts managed by the investment adviser and its affiliates. The Schedule of Investments lists any Fidelity Central Funds held as an investment as of period end, but does not include the underlying holdings of each Fidelity Central Fund. An investing fund indirectly bears its proportionate share of the expenses of the underlying Fidelity Central Funds.
Based on its investment objective, each Fidelity Central Fund may invest or participate in various investment vehicles or strategies that are similar to those of the investing fund. These strategies are consistent with the investment objectives of the investing fund and may involve certain economic risks which may cause a decline in value of each of the Fidelity Central Funds and thus a decline in the value of the investing fund.
| Fidelity Central Fund | Investment Manager | Investment Objective | Investment Practices | Expense RatioA |
| Fidelity Money Market Central Funds | Fidelity Management & Research Company LLC (FMR) | Each fund seeks to obtain a high level of current income consistent with the preservation of capital and liquidity. | Short-term Investments | Less than .005% |
A Expenses expressed as a percentage of average net assets and are as of each underlying Central Fund's most recent annual or semi-annual shareholder report.
A complete unaudited list of holdings for each Fidelity Central Fund is available upon request or at the Securities and Exchange Commission website at www.sec.gov. In addition, the financial statements of the Fidelity Central Funds which contain the significant accounting policies (including investment valuation policies) of those funds, and are not covered by the Report of Independent Registered Public Accounting Firm, are available on the Securities and Exchange Commission website or upon request.
3. Significant Accounting Policies.
The Fund is an investment company and applies the accounting and reporting guidance of the Financial Accounting Standards Board (FASB) Accounting Standards Codification Topic 946 Financial Services - Investment Companies. The financial statements have been prepared in conformity with accounting principles generally accepted in the United States of America (GAAP), which require management to make certain estimates and assumptions at the date of the financial statements. Actual results could differ from those estimates. Subsequent events, if any, through the date that the financial statements were issued have been evaluated in the preparation of the financial statements. The Fund's Schedule of Investments lists any underlying mutual funds or exchange-traded funds (ETFs) but does not include the underlying holdings of these funds. The following summarizes the significant accounting policies of the Fund:
Investment Valuation. Investments are valued as of 4:00 p.m. Eastern time on the last calendar day of the period. The Board of Trustees (the Board) has designated the Fund's investment adviser as the valuation designee responsible for the fair valuation function and performing fair value determinations as needed. The investment adviser has established a Fair Value Committee (the Committee) to carry out the day-to-day fair valuation responsibilities and has adopted policies and procedures to govern the fair valuation process and the activities of the Committee. In accordance with these fair valuation policies and procedures, which have been approved by the Board, the Fund attempts to obtain prices from one or more third party pricing services or brokers to value its investments. When current market prices, quotations or currency exchange rates are not readily available or reliable, investments will be fair valued in good faith by the Committee, in accordance with the policies and procedures. Factors used in determining fair value vary by investment type and may include market or investment specific events, transaction data, estimated cash flows, and market observations of comparable investments. The frequency that the fair valuation procedures are used cannot be predicted and they may be utilized to a significant extent. The Committee manages the Fund's fair valuation practices and maintains the fair valuation policies and procedures. The Fund's investment adviser reports to the Board information regarding the fair valuation process and related material matters.
The Fund categorizes the inputs to valuation techniques used to value its investments into a disclosure hierarchy consisting of three levels as shown below:
Level 1 - unadjusted quoted prices in active markets for identical investments
Level 2 - other significant observable inputs (including quoted prices for similar investments, interest rates, prepayment speeds, etc.)
Level 3 - unobservable inputs (including the Fund's own assumptions based on the best information available)
Valuation techniques used to value the Fund's investments by major category are as follows:
Equity securities, including restricted securities, for which market quotations are readily available, are valued at the last reported sale price or official closing price as reported by a third party pricing service on the primary market or exchange on which they are traded and are categorized as Level 1 in the hierarchy. In the event there were no sales during the day or closing prices are not available, securities are valued at the last quoted bid price or may be valued using the last available price and are generally categorized as Level 2 in the hierarchy. For foreign equity securities, when market or security specific events arise, comparisons to the valuation of American Depositary Receipts (ADRs), futures contracts, Exchange-Traded Funds (ETFs) and certain indexes as well as quoted prices for similar securities may be used and would be categorized as Level 2 in the hierarchy. For equity securities, including restricted securities, where observable inputs are limited, assumptions about market activity and risk are used and these securities may be categorized as Level 3 in the hierarchy.
Debt securities, including restricted securities, are valued based on evaluated prices received from third party pricing services or from brokers who make markets in such securities. Corporate bonds are valued by pricing services who utilize matrix pricing which considers yield or price of bonds of comparable quality, coupon, maturity and type or by broker-supplied prices. When independent prices are unavailable or unreliable, debt securities may be valued utilizing pricing methodologies which consider similar factors that would be used by third party pricing services. Debt securities are generally categorized as Level 2 in the hierarchy but may be Level 3 depending on the circumstances.
Investments in open-end mutual funds, including the Fidelity Central Funds, are valued at their closing net asset value (NAV) each business day and are categorized as Level 1 in the hierarchy.
Changes in valuation techniques may result in transfers in or out of an assigned level within the disclosure hierarchy. The aggregate value of investments by input level as of October 31, 2024 is included at the end of the Fund's Schedule of Investments.
Foreign Currency. Certain Funds may use foreign currency contracts to facilitate transactions in foreign-denominated securities. Gains and losses from these transactions may arise from changes in the value of the foreign currency or if the counterparties do not perform under the contracts' terms.
Foreign-denominated assets, including investment securities, and liabilities are translated into U.S. dollars at the exchange rates at period end. Purchases and sales of investment securities, income and dividends received, and expenses denominated in foreign currencies are translated into U.S. dollars at the exchange rate in effect on the transaction date.
The effects of exchange rate fluctuations on investments are included with the net realized and unrealized gain (loss) on investment securities. Other foreign currency transactions resulting in realized and unrealized gain (loss) are disclosed separately.
Investment Transactions and Income. For financial reporting purposes, the Fund's investment holdings and NAV include trades executed through the end of the last business day of the period. The NAV per share for processing shareholder transactions is calculated as of the close of business of the New York Stock Exchange (NYSE), normally 4:00 p.m. Eastern time and includes trades executed through the end of the prior business day. Gains and losses on securities sold are determined on the basis of identified cost and include proceeds received from litigation. Commissions paid to certain brokers with whom the investment adviser, or its affiliates, places trades on behalf of a fund include an amount in addition to trade execution, which may be rebated back to a fund. Any such rebates are included in net realized gain (loss) on investments in the Statement of Operations. Dividend income is recorded on the ex-dividend date, except for certain dividends from foreign securities where the ex-dividend date may have passed, which are recorded as soon as the Fund is informed of the ex-dividend date. Non-cash dividends included in dividend income, if any, are recorded at the fair market value of the securities received. Income and capital gain distributions from Fidelity Central Funds, if any, are recorded on the ex-dividend date. Interest income is accrued as earned and includes coupon interest and amortization of premium and accretion of discount on debt securities as applicable. Investment income is recorded net of foreign taxes withheld where recovery of such taxes is uncertain. Funds may file withholding tax reclaims in certain jurisdictions to recover a portion of amounts previously withheld. Any withholding tax reclaims income is included in the Statement of Operations in foreign taxes withheld. Any receivables for withholding tax reclaims are included in the Statement of Assets and Liabilities in dividends receivable. The Fund has filed tax reclaims for previously withheld taxes on dividends earned in certain European Union (EU) countries. These additional filings are subject to various administrative proceedings by the local jurisdictions' tax authorities within the EU, as well as a number of related judicial proceedings. Income recognized for EU reclaims is included with other reclaims in the Statement of Operations in foreign taxes withheld. These reclaims are recorded when the amount is known and there are no significant uncertainties on collectability.
Class Allocations and Expenses. Investment income, realized and unrealized capital gains and losses, common expenses of a fund, and certain fund-level expense reductions, if any, are allocated daily on a pro-rata basis to each class based on the relative net assets of each class to the total net assets of a fund. Each class differs with respect to transfer agent and distribution and service plan fees incurred, as applicable. Certain expense reductions may also differ by class, if applicable. For the reporting period, the allocated portion of income and expenses to each class as a percent of its average net assets may vary due to the timing of recording these transactions in relation to fluctuating net assets of the classes. Expenses directly attributable to a fund are charged to that fund. Expenses attributable to more than one fund are allocated among the respective funds on the basis of relative net assets or other appropriate methods. Expenses included in the accompanying financial statements reflect the expenses of that fund and do not include any expenses associated with any underlying mutual funds or exchange-traded funds (ETFs). Although not included in a fund's expenses, a fund indirectly bears its proportionate share of these expenses through the net asset value of each underlying mutual fund or exchange-traded fund (ETF). Expense estimates are accrued in the period to which they relate and adjustments are made when actual amounts are known.
Income Tax Information and Distributions to Shareholders. Each year, the Fund intends to qualify as a regulated investment company under Subchapter M of the Internal Revenue Code, including distributing substantially all of its taxable income and realized gains. As a result, no provision for U.S. Federal income taxes is required. As of October 31, 2024, the Fund did not have any unrecognized tax benefits in the financial statements; nor is the Fund aware of any tax positions for which it is reasonably possible that the total amounts of unrecognized tax benefits will significantly change in the next twelve months. The Fund files a U.S. federal tax return, in addition to state and local tax returns as required. The Fund's federal income tax returns are subject to examination by the Internal Revenue Service (IRS) for a period of three fiscal years after they are filed. State and local tax returns may be subject to examination for an additional fiscal year depending on the jurisdiction. Foreign taxes are provided for based on the Fund's understanding of the tax rules and rates that exist in the foreign markets in which it invests. The Fund is subject to a tax imposed on capital gains by certain countries in which it invests. An estimated deferred tax liability for net unrealized appreciation on the applicable securities is included in Deferred taxes on the Statement of Assets and Liabilities.
Distributions are declared and recorded on the ex-dividend date. Income and capital gain distributions are declared separately for each class. Income and capital gain distributions are determined in accordance with income tax regulations, which may differ from GAAP. In addition, the Fund claimed a portion of the payment made to redeeming shareholders as a distribution for income tax purposes.
Capital accounts within the financial statements are adjusted for permanent book-tax differences. These adjustments have no impact on net assets or the results of operations. Capital accounts are not adjusted for temporary book-tax differences which will reverse in a subsequent period.
Book-tax differences are primarily due to foreign currency transactions, certain foreign taxes, partnerships, redemptions in-kind, passive foreign investment companies (PFIC), capital loss carryforwards and losses deferred due to wash sales.
As of period end, the cost and unrealized appreciation (depreciation) in securities, and derivatives if applicable, for federal income tax purposes were as follows:
| Gross unrealized appreciation | $2,937,828,428 |
| Gross unrealized depreciation | (527,442,637) |
| Net unrealized appreciation (depreciation) | $2,410,385,791 |
| Tax Cost | $6,667,120,689 |
The tax-based components of distributable earnings as of period end were as follows:
| Undistributed ordinary income | $31,826,231 |
| Capital loss carryforward | $(808,781,354) |
| Net unrealized appreciation (depreciation) on securities and other investments | $2,409,246,167 |
Capital loss carryforwards are only available to offset future capital gains of the Fund to the extent provided by regulations and may be limited. The capital loss carryforward information presented below, including any applicable limitation, is estimated as of fiscal period end and is subject to adjustment.
Short-term | $(689,281,496) |
Long-term | (119,499,858) |
| Total capital loss carryforward | $(808,781,354) |
Due to a merger in the current period, a portion of the Fund's realized capital losses are subject to limitation and will only be available to offset capital gains to the extent of an annual limit. These realized capital losses were acquired from Fidelity Latin America Fund when it merged into the Fund on September 13, 2024.
The tax character of distributions paid was as follows:
| | October 31, 2024 | October 31, 2023 |
| Ordinary Income | $91,875,932 | $50,450,464 |
| Total | $91,875,932 | $50,450,464 |
Restricted Securities (including Private Placements). Funds may invest in securities that are subject to legal or contractual restrictions on resale. These securities generally may be resold in transactions exempt from registration or to the public if the securities are registered. Disposal of these securities may involve time-consuming negotiations and expense, and prompt sale at an acceptable price may be difficult. Information regarding restricted securities held at period end is included at the end of the Schedule of Investments, if applicable.
New Accounting Pronouncement. In November 2023, the FASB issued Accounting Standards Update (ASU) 2023-07 Segment Reporting (Topic 280): Improvements to Reportable Segment Disclosures. Effective for fiscal years beginning after December 15, 2023 and interim periods within fiscal years beginning after December 15, 2024, the amendments enhance required disclosures of segment information for public entities on an annual and interim basis. The ASU allows for early adoption with updates applied retrospectively. Management is currently evaluating the impact of the ASU but does not expect this guidance to materially impact the financial statements.
4. Derivative Instruments.
Risk Exposures and the Use of Derivative Instruments. The Fund's investment objectives allow for various types of derivative instruments, including futures contracts. Derivatives are investments whose value is primarily derived from underlying assets, indices or reference rates and may be transacted on an exchange or over-the-counter (OTC). Derivatives may involve a future commitment to buy or sell a specified asset based on specified terms, to exchange future cash flows at periodic intervals based on a notional principal amount, or for one party to make one or more payments upon the occurrence of specified events in exchange for periodic payments from the other party.
Derivatives were used to increase returns and to manage exposure to certain risks as defined below. The success of any strategy involving derivatives depends on analysis of numerous economic factors, and if the strategies for investment do not work as intended, the objectives may not be achieved.
Derivatives were used to increase or decrease exposure to the following risk(s):
| Equity Risk | Equity risk relates to the fluctuations in the value of financial instruments as a result of changes in market prices (other than those arising from interest rate risk or foreign exchange risk), whether caused by factors specific to an individual investment, its issuer, or all factors affecting all instruments traded in a market or market segment. |
Funds are also exposed to additional risks from investing in derivatives, such as liquidity risk and counterparty credit risk. Liquidity risk is the risk that a fund will be unable to close out the derivative in the open market in a timely manner. Counterparty credit risk is the risk that the counterparty will not be able to fulfill its obligation to a fund. Counterparty credit risk related to exchange-traded contracts may be mitigated by the protection provided by the exchange on which they trade.
Investing in derivatives may involve greater risks than investing in the underlying assets directly and, to varying degrees, may involve risk of loss in excess of any initial investment and collateral received and amounts recognized in the Statement of Assets and Liabilities. In addition, there may be the risk that the change in value of the derivative contract does not correspond to the change in value of the underlying instrument.
Futures Contracts. A futures contract is an agreement between two parties to buy or sell a specified underlying instrument for a fixed price at a specified future date. Futures contracts were used to manage exposure to the stock market.
Upon entering into a futures contract, a fund is required to deposit either cash or securities (initial margin) with a clearing broker in an amount equal to a certain percentage of the face value of the contract. Futures contracts are marked-to-market daily and subsequent daily payments are made or received by a fund depending on the daily fluctuations in the value of the futures contracts and are recorded as unrealized appreciation or (depreciation). This receivable and/or payable, if any, is included in daily variation margin on futures contracts in the Statement of Assets and Liabilities. Realized gain or (loss) is recorded upon the expiration or closing of a futures contract. The net realized gain (loss) and change in net unrealized appreciation (depreciation) on futures contracts during the period is presented in the Statement of Operations.
Any open futures contracts at period end are presented in the Schedule of Investments under the caption "Futures Contracts". The notional amount at value reflects each contract's exposure to the underlying instrument or index at period end, and is representative of volume of activity during the period unless an average notional amount is presented. Any securities deposited to meet initial margin requirements are identified in the Schedule of Investments. Any cash deposited to meet initial margin requirements is presented as segregated cash with brokers for derivative instruments in the Statement of Assets and Liabilities.
5. Purchases and Sales of Investments.
Purchases and sales of securities, other than short-term securities, securities acquired in the reorganization and in-kind transactions, as applicable, are noted in the table below.
| | Purchases ($) | Sales ($) |
| Fidelity Emerging Markets Fund | 4,556,236,643 | 4,000,496,333 |
6. Fees and Other Transactions with Affiliates.
Management Fee. Fidelity Management & Research Company LLC (the investment adviser) and its affiliates provide the Fund with investment management related services for which the Fund pays a monthly management fee.
Effective March 1, 2024, the Fund's management contract was amended to incorporate administrative services previously covered under separate services agreements (Transfer Agent and Accounting agreements). The amended contract incorporates a management fee rate that may vary by class. The investment adviser or an affiliate pays certain expenses of managing and operating the Fund out of each class's management fee. Each class of the Fund pays a management fee to the investment adviser. The management fee is calculated and paid to the investment adviser every month. When determining a class's management fee, a mandate rate is calculated based on the monthly average net assets of a group of funds advised by FMR within a designated asset class. A discount rate is subtracted from the mandate rate once the Fund's monthly average net assets reach a certain level. The mandate rate and discount rate may vary by class. The annual management fee rate for a class of shares of the Fund is the lesser of (1) the class's mandate rate reduced by the class's discount rate (if applicable) or (2) the amount set forth in the following table.
| | Maximum Management Fee Rate % |
| Class A | .86 |
| Class M | .86 |
| Class C | .86 |
| Emerging Markets | .84 |
| Class K | .71 |
| Class I | .85 |
| Class Z | .71 |
One-twelfth of the management fee rate for a class is applied to the average net assets of the class for the month, giving a dollar amount which is the management fee for the class for that month. A different management fee rate may be applicable to each class of the Fund. The difference between classes is the result of separate arrangements for class-level services and/or waivers of certain expenses. It is not the result of any difference in advisory or custodial fees or other expenses related to the management of the Fund's assets, which do not vary by class. For the portion of the reporting period on or after March 1, 2024, the total annualized management fee rates were as follows:
| | Total Management Fee Rate % |
| Class A | .86 |
| Class M | .86 |
| Class C | .86 |
| Emerging Markets | .84 |
| Class K | .71 |
| Class I | .85 |
| Class Z | .71 |
Prior to March 1, 2024, the management fee was the sum of an individual fund fee rate that was based on an annual rate of .45% of the Fund's average net assets and an annualized group fee rate that averaged .22% during the period. The group fee rate was based upon the monthly average net assets of a group of registered investment companies with which the investment adviser has management contracts. The group fee rate decreased as assets under management increased and increased as assets under management decreased. For the portion of the reporting period prior to March 1, 2024, the total annualized management fee rate was .67%.
Effective March 1, 2024, the Fund's sub-advisory agreements with FMR Investment Management (UK) Limited, Fidelity Management & Research (Hong Kong) Limited, and Fidelity Management & Research (Japan) Limited were amended to provide that the investment adviser pays each sub-adviser monthly fees equal to 110% of the sub-adviser's costs for providing sub-advisory services.
Effective March 1, 2024, the Fund's sub-advisory agreement with FIL Investment Advisors (FIA) was amended to provide that the investment adviser pays FIA monthly fees at an annual rate of 0.50% with respect to the average daily net assets of the Fund managed by FIA. FIA in turn pays FIA(UK).
Distribution and Service Plan Fees. In accordance with Rule 12b-1 of the 1940 Act, the Fund has adopted separate Distribution and Service Plans for each class of shares. Certain classes pay Fidelity Distributors Company LLC (FDC), an affiliate of the investment adviser, separate Distribution and Service Fees, each of which is based on an annual percentage of each class' average net assets. In addition, FDC may pay financial intermediaries for selling shares of the Fund and providing shareholder support services. For the period, the Distribution and Service Fee rates, total fees and amounts retained by FDC were as follows:
| | Distribution Fee | Service Fee | Total Fees ($) | Retained by FDC ($) |
| Class A | - % | .25% | 58,380 | 5,525 |
| Class M | .25% | .25% | 20,846 | - |
| Class C | .75% | .25% | 23,084 | 5,934 |
| | | | 102,310 | 11,459 |
Sales Load. FDC may receive a front-end sales charge of up to 5.75% for selling Class A shares and 3.50% for selling Class M shares, some of which is paid to financial intermediaries for selling shares of the Fund. Depending on the holding period, FDC may receive contingent deferred sales charges levied on Class A, Class M and Class C redemptions. The deferred sales charges are 1.00% for Class C shares, 1.00% for certain purchases of Class A shares and .25% for certain purchases of Class M shares.
For the period, sales charge amounts retained by FDC were as follows:
| | Retained by FDC ($) |
| Class A | 9,278 |
| Class M | 732 |
Class CA | 158 |
| | 10,168 |
A When Class C shares are initially sold, FDC pays commissions from its own resources to financial intermediaries through which the sales are made.
Transfer Agent Fees. Fidelity Investments Institutional Operations Company LLC (FIIOC), an affiliate of the investment adviser, is the transfer, dividend disbursing and shareholder servicing agent for each class of the Fund. Effective March 1, 2024, the Fund's management contract was amended to incorporate transfer agent services and associated fees previously covered under a separate services agreement. FIIOC pays for typesetting, printing and mailing of shareholder reports, except proxy statements.
During the period December 1, 2023 through February 29, 2024, the transfer agent fees for each class were a fixed annual rate of class-level average net assets as follows:
| | % of Class-Level Average Net Assets |
| Class A | .2000 |
| Class M | .2000 |
| Class C | .2000 |
| Emerging Markets | .1718 |
| Class K | .0420 |
| Class I | .1894 |
| Class Z | .0420 |
Prior to December 1, 2023, FIIOC received account fees and asset-based fees that varied according to the account size and type of account of the shareholders of the respective classes of the Fund, except for Class K and Class Z. FIIOC received an asset-based fee of Class K's and Class Z's average net assets. For the portion of the reporting period prior to March 1, 2024, the fees were equivalent to the following annualized rates:
| | Amount ($) | % of Class-Level Average Net Assets |
| Class A | 12,360 | .20 |
| Class M | 2,319 | .21 |
| Class C | 1,355 | .21 |
| Emerging Markets | 2,466,395 | .17 |
| Class K | 201,867 | .04 |
| Class I | 88,058 | .19 |
| Class Z | 265,329 | .04 |
| 3,037,683 | |
Accounting Fees. Fidelity Service Company, Inc. (FSC), an affiliate of the investment adviser, maintains the Fund's accounting records. Effective March 1, 2024, the Fund's management contract was amended to incorporate accounting services and associated fees previously covered under a separate services agreement.
During the period December 1, 2023 through February 29, 2024, the accounting fees were a fixed annual rate of average net assets as follows:
| | % of Average Net Assets |
| Fidelity Emerging Markets Fund | .0211 |
Prior to December 1, 2023, the accounting fee was based on the level of average net assets for each month. For the portion of the reporting period prior to March 1, 2024, the fees were equivalent to the following annualized rates:
| | % of Average Net Assets |
| Fidelity Emerging Markets Fund | .02 |
Brokerage Commissions. A portion of portfolio transactions were placed with brokerage firms which are affiliates of the investment adviser. Brokerage commissions are included in net realized gain (loss) and change in net unrealized appreciation (depreciation) in the Statement of Operations. The commissions paid to these affiliated firms were as follows:
| | Amount ($) |
| Fidelity Emerging Markets Fund | 17,283 |
Interfund Lending Program. Pursuant to an Exemptive Order issued by the Securities and Exchange Commission (the SEC), the Fund, along with other registered investment companies having management contracts with Fidelity Management & Research Company LLC (FMR), or other affiliated entities of FMR, may participate in an interfund lending program. This program provides an alternative credit facility allowing the Fund to borrow from, or lend money to, other participating affiliated funds at rates that are beneficial to both the borrowing and lending fund. Borrowings under the program are generally for temporary or emergency purposes, including meeting fund shareholder redemptions. The interfund loan rate is determined, as specified in the Exemptive Order, by averaging, (1) the higher of the overnight time deposit rate and the current overnight repurchase agreement rate, and (2) a benchmark rate representing the lowest bank loan rate available to the funds. At period end, there were no interfund loans outstanding. Activity in this program during the period for which loans were outstanding was as follows:
| | Borrower or Lender | Average Loan Balance ($) | Weighted Average Interest Rate | Interest Expense ($) |
| Fidelity Emerging Markets Fund | Borrower | 21,681,889 | 5.27% | 28,577 |
Interfund Trades. Funds may purchase from or sell securities to other Fidelity Funds under procedures adopted by the Board. The procedures have been designed to ensure these interfund trades are executed in accordance with Rule 17a-7 of the 1940 Act. Any interfund trades are included within the respective purchases and sales amounts shown in the Purchases and Sales of Investments note. Interfund trades during the period are noted in the table below.
| | Purchases ($) | Sales ($) | Realized Gain (Loss)($) |
| Fidelity Emerging Markets Fund | 52,726,942 | 59,239,313 | 6,209,997 |
Affiliated Redemptions In-Kind. Shares that were redeemed in-kind for investments, including accrued interest and cash, if any, are shown in the table below. The net realized gain or loss on investments delivered through in-kind redemptions is included in the "Net realized gain (loss) on: Redemptions in-kind" line in the accompanying Statement of Operations. The amount of the in-kind redemptions is included in share transactions in the accompanying Statement of Changes in Net Assets. There was no gain or loss for federal income tax purposes.
| | Shares | Total net realized gain or loss ($) | Total Proceeds ($) |
| Fidelity Emerging Markets Fund | 36,475,274 | 346,805,773 | 1,498,769,012 |
Other. During the period, the investment adviser reimbursed the Fund for certain losses as follows:
| | Amount ($) |
| Fidelity Emerging Markets Fund | 3,941 |
7. Committed Line of Credit.
Certain Funds participate with other funds managed by the investment adviser or an affiliate in a $4.25 billion credit facility (the "line of credit") to be utilized for temporary or emergency purposes to fund shareholder redemptions or for other short-term liquidity purposes. The participating funds have agreed to pay commitment fees on their pro-rata portion of the line of credit, which are reflected in Miscellaneous expenses on the Statement of Operations, and are listed below. During the period, there were no borrowings on this line of credit.
| | Amount ($) |
| Fidelity Emerging Markets Fund | 13,847 |
8. Security Lending.
Funds lend portfolio securities from time to time in order to earn additional income. Lending agents are used, including National Financial Services (NFS), an affiliate of the investment adviser. Pursuant to a securities lending agreement, NFS will receive a fee, which is capped at 9.9% of a fund's daily lending revenue, for its services as lending agent. A fund may lend securities to certain qualified borrowers, including NFS. On the settlement date of the loan, a fund receives collateral (in the form of U.S. Treasury obligations, letters of credit and/or cash) against the loaned securities and maintains collateral in an amount not less than 100% of the market value of the loaned securities during the period of the loan. The market value of the loaned securities is determined at the close of business of a fund and any additional required collateral is delivered to a fund on the next business day. A fund or borrower may terminate the loan at any time, and if the borrower defaults on its obligation to return the securities loaned because of insolvency or other reasons, a fund may apply collateral received from the borrower against the obligation. A fund may experience delays and costs in recovering the securities loaned. Any cash collateral received is invested in the Fidelity Securities Lending Cash Central Fund. Any loaned securities are identified as such in the Schedule of Investments, and the value of loaned securities and cash collateral at period end, as applicable, are presented in the Statement of Assets and Liabilities. Security lending income represents the income earned on investing cash collateral, less rebates paid to borrowers and any lending agent fees associated with the loan, plus any premium payments received for lending certain types of securities. Security lending income is presented in the Statement of Operations as a component of income from Fidelity Central Funds. Affiliated security lending activity, if any, was as follows:
| | Total Security Lending Fees Paid to NFS ($) | Security Lending Income From Securities Loaned to NFS ($) | Value of Securities Loaned to NFS at Period End ($) |
| Fidelity Emerging Markets Fund | 62,311 | 37,977 | - |
9. Expense Reductions.
Through arrangements with the Fund's custodian and each class' transfer agent, credits realized as a result of certain uninvested cash balances were used to reduce the Fund's expenses. During the period, custodian credits reduced the Fund's expenses by $10,493. During the period, transfer agent credits reduced each class' expenses as noted in the table below.
| | Expense reduction ($) |
| Class M | 7 |
In addition, during the period the investment adviser or an affiliate reimbursed and/or waived a portion of fund-level operating expenses in the amount of $370,168.
10. Distributions to Shareholders.
Distributions to shareholders of each class were as follows:
| | Year ended October 31, 2024 | Year ended October 31, 2023 |
| Fidelity Emerging Markets Fund | | |
| Distributions to shareholders | | |
| Class A | $149,850 | $53,539 |
| Class M | 22,696 | 1,926 |
| Class C | 2,509 | - |
| Emerging Markets | 49,044,521 | 28,390,916 |
| Class K | 18,162,751 | 8,364,511 |
| Class I | 1,576,885 | 674,976 |
| Class Z | 22,916,720 | 12,964,596 |
Total | $91,875,932 | $50,450,464 |
11. Share Transactions.
Share transactions for each class were as follows and may contain in-kind transactions, automatic conversions between classes or exchanges between affiliated funds:
| | Shares | Shares | Dollars | Dollars |
| | Year ended October 31, 2024 | Year ended October 31, 2023 | Year ended October 31, 2024 | Year ended October 31, 2023 |
| Fidelity Emerging Markets Fund | | | | |
| Class A | | | | |
| Shares sold | 354,848 | 311,663 | $13,436,279 | $10,362,526 |
| Issued in exchange for the shares of the Acquired Fund(s) | 259,916 | - | 9,991,163 | - |
| Reinvestment of distributions | 4,334 | 1,632 | 148,618 | 52,760 |
| Shares redeemed | (129,879) | (194,860) | (4,844,792) | (6,441,724) |
| Net increase (decrease) | 489,219 | 118,435 | $18,731,268 | $3,973,562 |
| Class M | | | | |
| Shares sold | 36,439 | 53,614 | $1,362,892 | $1,831,527 |
| Issued in exchange for the shares of the Acquired Fund(s) | 58,126 | - | 2,233,184 | - |
| Reinvestment of distributions | 656 | 60 | 22,545 | 1,926 |
| Shares redeemed | (27,603) | (7,386) | (1,025,710) | (241,523) |
| Net increase (decrease) | 67,618 | 46,288 | $2,592,911 | $1,591,930 |
| Class C | | | | |
| Shares sold | 20,145 | 28,408 | $2,445,647 | $941,354 |
| Issued in exchange for the shares of the Acquired Fund(s) | 31,209 | - | 1,190,948 | - |
| Reinvestment of distributions | 72 | - | 2,487 | - |
| Shares redeemed | (16,527) | (22,275) | (2,300,041) | (725,503) |
| Net increase (decrease) | 34,899 | 6,133 | $1,339,041 | $215,851 |
| Emerging Markets | | | | |
| Shares sold | 23,336,798 | 32,842,894 | $885,074,796 | $1,091,041,239 |
| Issued in exchange for the shares of the Acquired Fund(s) | 4,412,960 | - | 170,472,261 | - |
| Reinvestment of distributions | 1,104,208 | 705,770 | 37,951,098 | 22,902,138 |
| Shares redeemed | (34,021,450) | (28,385,896) | (1,265,925,610) | (937,069,628) |
| Net increase (decrease) | (5,167,484) | 5,162,768 | $(172,427,455) | $176,873,749 |
| Class K | | | | |
| Shares sold | 30,067,036 | 13,987,503 | $1,119,926,599 | $471,747,111 |
| Reinvestment of distributions | 528,375 | 257,656 | 18,156,694 | 8,363,213 |
| Shares redeemed | (17,220,929) | (9,646,138) | (677,157,529) | (321,986,003) |
| Net increase (decrease) | 13,374,482 | 4,599,021 | $460,925,764 | $158,124,321 |
| Class I | | | | |
| Shares sold | 8,642,102 | 3,147,089 | $324,804,856 | $103,953,662 |
| Issued in exchange for the shares of the Acquired Fund(s) | 48,755 | - | 1,878,043 | - |
| Reinvestment of distributions | 42,705 | 19,449 | 1,463,912 | 629,629 |
| Shares redeemed | (4,710,389) | (1,278,880) | (181,718,005) | (41,874,106) |
| Net increase (decrease) | 4,023,173 | 1,887,658 | $146,428,806 | $62,709,185 |
| Class Z | | | | |
| Shares sold | 36,108,432 | 6,017,620 | $1,355,101,151 | $203,435,458 |
| Issued in exchange for the shares of the Acquired Fund(s) | 15,788 | - | 609,745 | - |
| Reinvestment of distributions | 649,621 | 395,803 | 22,297,061 | 12,830,167 |
| Shares redeemed | (38,937,032) | (2,879,543) | (1,591,276,435) | (95,344,656) |
| Net increase (decrease) | (2,163,191) | 3,533,880 | $(213,268,478) | $120,920,969 |
12. Other.
A fund's organizational documents provide former and current trustees and officers with a limited indemnification against liabilities arising in connection with the performance of their duties to the fund. In the normal course of business, a fund may also enter into contracts that provide general indemnifications. A fund's maximum exposure under these arrangements is unknown as this would be dependent on future claims that may be made against a fund. The risk of material loss from such claims is considered remote.
At the end of the period, the following mutual funds managed by the investment adviser or its affiliates were the owners of record of 10% or more of the total outstanding shares.
| | Strategic Advisers Fidelity Emerging Markets Fund |
| Fidelity Emerging Markets Fund | 11% |
Mutual funds managed by the investment adviser or its affiliates, in aggregate, were the owners of record of more than 20% of the total outstanding shares.
| Fund | % of shares held |
| Fidelity Emerging Markets Fund | 27% |
13. Risk and Uncertainties.
Many factors affect a fund's performance. Developments that disrupt global economies and financial markets, such as pandemics, epidemics, outbreaks of infectious diseases, war, terrorism, and environmental disasters, may significantly affect a fund's investment performance. The effects of these developments to a fund will be impacted by the types of securities in which a fund invests, the financial condition, industry, economic sector, and geographic location of an issuer, and a fund's level of investment in the securities of that issuer. Significant concentrations in security types, issuers, industries, sectors, and geographic locations may magnify the factors that affect a fund's performance.
14. Reorganization Information.
On September 13, 2024, the Fund acquired all of the assets and assumed all of the liabilities of Fidelity Latin America Fund ("Acquired Fund") pursuant to an Agreement and Plan of Reorganization (Agreements) approved by the Board of Trustees ("The Board"). The securities held by the Acquired Fund were the primary assets acquired by the Fund. The acquisition was accomplished by an exchange of each class of the Fund for corresponding shares then outstanding of the Acquired Fund at its respective net asset value on the acquisition date. The reorganization provides shareholders of the Acquired Fund access to a larger portfolio with a similar investment objective and lower projected expenses. For financial reporting purposes, the assets and liabilities of the Acquired Fund and shares issued by the Fund were recorded at fair value; however, the cost basis of the investments received from the Acquired Fund were carried forward and will be utilized for purposes of the Fund's ongoing reporting of realized and unrealized gains and losses to more closely align subsequent reporting of realized gains with amounts distributable to shareholders for tax purposes. The reorganization qualified as a tax-free reorganization for federal income tax purposes with no gain or loss recognized to the funds or their shareholders.
| Acquired Fund and Share Class | Investments $ | Unrealized appreciation (depreciation) $ | Net Assets $ | Shares Exchanged | Shares Exchanged Ratio |
| Fidelity Latin America Fund | 179,728,071 | 11,207,705 | | | |
| Class A | | | 9,991,163 | 259,916 | .4343522373 |
| Class M | | | 2,233,184 | 58,126 | .4360879750 |
| Class C | | | 1,190,948 | 31,209 | .4437971698 |
| Latin America | | | 170,472,261 | 4,412,960 | .4306756407 |
| Class I | | | 1,878,043 | 48,755 | .4324844237 |
| Class Z | | | 609,745 | 15,788 | .4312195750 |
| Acquiring Fund | Net Assets $ | Total net assets after the acquisition $ |
| Fidelity Emerging Markets Fund | 9,771,715,039 | 9,958,090,383 |
Pro forma results of operations of the combined entity for the entire period ended October 31, 2024, as though the acquisition had occurred as of the beginning of the year (rather than on the actual acquisition date), are as follows:
| Net investment income (loss) | $89,796,022 |
| Total net realized gain (loss) | 281,914,088 |
| Total change in net unrealized appreciation (depreciation) | 1,587,783,041 |
| Net increase (decrease) in net assets resulting from operations | $1,959,493,151 |
Because the combined investment portfolios have been managed as a single portfolio since the acquisition was completed, it is not practicable to separate the amounts of revenue and earnings of the acquired fund that have been included in the Fund's accompanying Statement of Operations since September 13, 2024.
Schedule of Investments October 31, 2024
Showing Percentage of Net Assets
| Common Stocks - 96.6% |
| | | Shares | Value ($) |
| Belgium - 2.8% | | | |
| KBC Group NV | | 47,800 | 3,466,990 |
| UCB SA | | 66,300 | 12,750,431 |
TOTAL BELGIUM | | | 16,217,421 |
| Canada - 0.3% | | | |
| Lumine Group, Inc. (a) | | 77,500 | 1,804,539 |
| China - 0.5% | | | |
| Prosus NV | | 67,500 | 2,844,779 |
| Prosus NV rights (a)(b) | | 67,500 | 7,342 |
TOTAL CHINA | | | 2,852,121 |
| Denmark - 7.1% | | | |
| DSV A/S | | 11,500 | 2,499,471 |
| Novo Nordisk A/S Series B | | 284,800 | 31,944,596 |
| Tryg A/S | | 282,700 | 6,657,584 |
TOTAL DENMARK | | | 41,101,651 |
| Finland - 1.0% | | | |
| Nordea Bank Abp | | 507,400 | 5,938,569 |
| France - 15.2% | | | |
| Air Liquide SA | | 75,518 | 13,540,483 |
| Airbus Group NV | | 42,800 | 6,528,765 |
| AXA SA | | 191,100 | 7,175,639 |
| BNP Paribas SA | | 91,300 | 6,235,245 |
| Capgemini SA | | 28,700 | 4,978,900 |
| Compagnie de St.-Gobain | | 65,500 | 5,939,864 |
| Danone SA | | 124,000 | 8,858,380 |
| Dassault Aviation SA | | 23,300 | 4,696,350 |
| EssilorLuxottica SA | | 26,964 | 6,317,702 |
| Gaztransport et Technigaz SA | | 17,300 | 2,510,331 |
| L'Oreal SA | | 11,600 | 4,351,977 |
| LVMH Moet Hennessy Louis Vuitton SE | | 18,200 | 12,116,114 |
| TotalEnergies SE | | 77,907 | 4,889,109 |
TOTAL FRANCE | | | 88,138,859 |
| Germany - 12.4% | | | |
| adidas AG | | 23,100 | 5,532,249 |
| Deutsche Borse AG | | 30,800 | 7,154,172 |
| Deutsche Telekom AG | | 250,700 | 7,579,544 |
| Merck KGaA | | 27,000 | 4,464,126 |
| MTU Aero Engines AG | | 19,700 | 6,443,603 |
| Rheinmetall AG | | 12,000 | 6,176,680 |
| SAP SE | | 97,200 | 22,694,752 |
| SCHOTT Pharma AG & Co. KGaA (c) | | 63,500 | 2,052,824 |
| Scout24 AG (d) | | 74,200 | 6,388,280 |
| Siemens Healthineers AG (d) | | 72,100 | 3,762,132 |
TOTAL GERMANY | | | 72,248,362 |
| Ireland - 1.8% | | | |
| AIB Group PLC | | 1,118,600 | 5,954,809 |
| Kerry Group PLC Class A | | 44,300 | 4,409,140 |
TOTAL IRELAND | | | 10,363,949 |
| Italy - 7.8% | | | |
| Coca-Cola HBC AG | | 112,300 | 3,924,222 |
| Davide Campari Milano NV | | 412,300 | 2,768,085 |
| Ferrari NV (Italy) | | 14,500 | 6,936,691 |
| FinecoBank SpA | | 291,635 | 4,658,463 |
| Prada SpA | | 614,000 | 4,713,992 |
| Prysmian SpA | | 62,500 | 4,406,747 |
| Recordati SpA | | 146,700 | 8,313,749 |
| UniCredit SpA | | 220,300 | 9,745,899 |
TOTAL ITALY | | | 45,467,848 |
| Luxembourg - 0.6% | | | |
| CVC Capital Partners PLC (a)(d) | | 177,100 | 3,716,036 |
| Netherlands - 5.1% | | | |
| ASML Holding NV (Netherlands) | | 32,500 | 21,960,585 |
| Heineken NV (Bearer) | | 34,400 | 2,821,375 |
| Topicus.Com, Inc. | | 37,300 | 3,193,010 |
| Universal Music Group NV | | 65,050 | 1,637,061 |
TOTAL NETHERLANDS | | | 29,612,031 |
| Norway - 1.0% | | | |
| Equinor ASA | | 94,200 | 2,238,400 |
| Kongsberg Gruppen ASA | | 35,200 | 3,663,933 |
TOTAL NORWAY | | | 5,902,333 |
| South Africa - 0.8% | | | |
| Anglo American PLC (United Kingdom) | | 156,799 | 4,860,835 |
| Spain - 2.1% | | | |
| CaixaBank SA | | 1,084,600 | 6,609,296 |
| Neinor Homes SLU (d) | | 145,100 | 2,380,114 |
| Puig Brands SA Class B | | 127,400 | 2,937,882 |
TOTAL SPAIN | | | 11,927,292 |
| Sweden - 6.7% | | | |
| EQT AB | | 114,700 | 3,326,494 |
| Haypp Group AB (a) | | 399,824 | 2,679,365 |
| Hemnet Group AB | | 307,800 | 9,660,504 |
| HEXPOL AB (B Shares) | | 191,700 | 1,815,424 |
| Indutrade AB | | 227,400 | 6,159,588 |
| Investor AB (B Shares) | | 221,400 | 6,264,087 |
| Kry International AB (a)(e)(f) | | 18,879 | 395,722 |
| Nordnet AB | | 148,000 | 3,075,418 |
| Saab AB (B Shares) | | 147,500 | 3,033,188 |
| Sandvik AB | | 124,000 | 2,432,388 |
TOTAL SWEDEN | | | 38,842,178 |
| Switzerland - 2.8% | | | |
| Compagnie Financiere Richemont SA Series A | | 41,490 | 6,040,965 |
| Galderma Group AG (a) | | 35,550 | 3,326,727 |
| Sika AG | | 13,600 | 3,787,621 |
| UBS Group AG | | 106,370 | 3,269,133 |
TOTAL SWITZERLAND | | | 16,424,446 |
| Taiwan - 0.5% | | | |
| Taiwan Semiconductor Manufacturing Co. Ltd. sponsored ADR | | 15,100 | 2,877,154 |
| United Kingdom - 23.0% | | | |
| 3i Group PLC | | 130,765 | 5,362,374 |
| AstraZeneca PLC (United Kingdom) | | 149,300 | 21,244,435 |
| B&M European Value Retail SA | | 455,800 | 2,278,047 |
| Beazley PLC | | 328,300 | 3,198,231 |
| Bunzl PLC | | 114,563 | 5,040,318 |
| Compass Group PLC | | 275,961 | 8,962,227 |
| Deliveroo PLC Class A (a)(d) | | 1,850,700 | 3,288,439 |
| Diageo PLC | | 243,985 | 7,534,691 |
| Flutter Entertainment PLC (a) | | 29,600 | 6,923,624 |
| Games Workshop Group PLC | | 17,856 | 2,753,721 |
| Grainger Trust PLC | | 732,933 | 2,145,333 |
| Halma PLC | | 105,142 | 3,355,490 |
| Hiscox Ltd. | | 265,067 | 3,698,175 |
| JD Sports Fashion PLC | | 1,810,000 | 2,894,042 |
| Judges Scientific PLC (c) | | 15,196 | 1,873,232 |
| Lloyds Banking Group PLC | | 7,744,273 | 5,315,672 |
| London Stock Exchange Group PLC | | 70,800 | 9,595,941 |
| Londonmetric Properity PLC | | 819,811 | 2,050,784 |
| National Grid PLC | | 377,100 | 4,734,924 |
| Oxford Instruments PLC | | 22,047 | 611,213 |
| RELX PLC (London Stock Exchange) | | 309,922 | 14,212,931 |
| Rolls-Royce Holdings PLC (a) | | 986,600 | 6,807,933 |
| Safestore Holdings PLC | | 182,073 | 1,899,322 |
| Sage Group PLC | | 243,100 | 3,038,733 |
| Unilever PLC | | 24,982 | 1,523,953 |
| Vistry Group PLC (a) | | 83,500 | 979,250 |
| Zegona Communications PLC (a) | | 469,500 | 2,009,917 |
TOTAL UNITED KINGDOM | | | 133,332,952 |
| United States of America - 5.1% | | | |
| Experian PLC | | 102,294 | 4,981,976 |
| Nestle SA (Reg. S) | | 92,940 | 8,782,146 |
| Shell PLC (London) | | 464,773 | 15,517,525 |
TOTAL UNITED STATES OF AMERICA | | | 29,281,647 |
| TOTAL COMMON STOCKS (Cost $440,950,442) | | | 560,910,223 |
| | | | |
| Convertible Preferred Stocks - 0.1% |
| | | Shares | Value ($) |
| Estonia - 0.1% | | | |
Bolt Technology OU Series E (a)(e)(f) (Cost $1,000,736) | | 3,852 | 707,023 |
| | | | |
| Money Market Funds - 2.1% |
| | | Shares | Value ($) |
| Fidelity Cash Central Fund 4.87% (g) | | 10,858,557 | 10,860,728 |
| Fidelity Securities Lending Cash Central Fund 4.87% (g)(h) | | 1,011,419 | 1,011,520 |
| TOTAL MONEY MARKET FUNDS (Cost $11,872,248) | | | 11,872,248 |
| | | | |
| TOTAL INVESTMENT IN SECURITIES - 98.8% (Cost $453,823,426) | 573,489,494 |
NET OTHER ASSETS (LIABILITIES) - 1.2% | 7,182,531 |
| NET ASSETS - 100.0% | 580,672,025 |
| | |
Legend
| (b) | Security or a portion of the security purchased on a delayed delivery or when-issued basis. |
| (c) | Security or a portion of the security is on loan at period end. |
| (d) | Security exempt from registration under Rule 144A of the Securities Act of 1933. These securities may be resold in transactions exempt from registration, normally to qualified institutional buyers. At the end of the period, the value of these securities amounted to $19,535,001 or 3.4% of net assets. |
| (e) | Restricted securities (including private placements) - Investment in securities not registered under the Securities Act of 1933 (excluding 144A issues). At the end of the period, the value of restricted securities (excluding 144A issues) amounted to $1,102,745 or 0.2% of net assets. |
| (g) | Affiliated fund that is generally available only to investment companies and other accounts managed by Fidelity Investments. The rate quoted is the annualized seven-day yield of the fund at period end. A complete unaudited listing of the fund's holdings as of its most recent quarter end is available upon request. In addition, each Fidelity Central Fund's financial statements, which are not covered by the Fund's Report of Independent Registered Public Accounting Firm, are available on the SEC's website or upon request. |
| (h) | Investment made with cash collateral received from securities on loan. |
| Additional information on each restricted holding is as follows: |
| Security | Acquisition Date | Acquisition Cost ($) |
| Bolt Technology OU Series E | 1/03/22 | 1,000,736 |
| | | |
| Kry International AB | 5/14/21 - 10/30/24 | 1,248,475 |
| | | |
Affiliated Central Funds
Fiscal year to date information regarding the Fund's investments in Fidelity Central Funds, including the ownership percentage, is presented below.
| Affiliate | Value, beginning of period ($) | Purchases ($) | Sales Proceeds ($) | Dividend Income ($) | Realized Gain (loss) ($) | Change in Unrealized appreciation (depreciation) ($) | Value, end of period ($) | % ownership, end of period |
| Fidelity Cash Central Fund 4.87% | 4,563,237 | 134,352,512 | 128,055,259 | 239,723 | 238 | - | 10,860,728 | 0.0% |
| Fidelity Securities Lending Cash Central Fund 4.87% | 2,636,857 | 40,977,419 | 42,602,756 | 21,511 | - | - | 1,011,520 | 0.0% |
| Total | 7,200,094 | 175,329,931 | 170,658,015 | 261,234 | 238 | - | 11,872,248 | |
| | | | | | | | | |
Amounts in the dividend income column in the above table include any capital gain distributions from underlying funds, which are presented in the corresponding line item in the Statement of Operations, if applicable.
Amounts in the dividend income column for Fidelity Securities Lending Cash Central Fund represents the income earned on investing cash collateral, less rebates paid to borrowers and any lending agent fees associated with the loan, plus any premium payments received for lending certain types of securities.
Amounts included in the purchases and sales proceeds columns may include in-kind transactions, if applicable.
Investment Valuation
The following is a summary of the inputs used, as of October 31, 2024, involving the Fund's assets and liabilities carried at fair value. The inputs or methodology used for valuing securities may not be an indication of the risk associated with investing in those securities. For more information on valuation inputs, and their aggregation into the levels used below, please refer to the Investment Valuation section in the accompanying Notes to Financial Statements.
| Valuation Inputs at Reporting Date: |
| Description | Total ($) | Level 1 ($) | Level 2 ($) | Level 3 ($) |
Investments in Securities: | | | | |
|
| Equities: | | | | |
Communication Services | 27,275,306 | 18,058,701 | 9,216,605 | - |
Consumer Discretionary | 71,330,961 | 33,965,414 | 37,365,547 | - |
Consumer Staples | 47,911,851 | 11,271,244 | 36,640,607 | - |
Energy | 25,155,365 | 2,510,331 | 22,645,034 | - |
Financials | 110,418,227 | 60,399,628 | 50,018,599 | - |
Health Care | 94,176,722 | 40,987,691 | 53,189,031 | - |
Industrials | 84,896,967 | 51,407,474 | 33,489,493 | - |
Information Technology | 65,617,121 | 36,840,724 | 27,673,652 | 1,102,745 |
Materials | 24,004,363 | 5,603,045 | 18,401,318 | - |
Real Estate | 6,095,439 | 6,095,439 | - | - |
Utilities | 4,734,924 | - | 4,734,924 | - |
|
| Money Market Funds | 11,872,248 | 11,872,248 | - | - |
| Total Investments in Securities: | 573,489,494 | 279,011,939 | 293,374,810 | 1,102,745 |
Fidelity® Europe Fund
Financial Statements
| Statement of Assets and Liabilities |
As of October 31, 2024 |
| Assets | | | | |
| Investment in securities, at value (including securities loaned of $945,586) - See accompanying schedule: | | | | |
Unaffiliated issuers (cost $441,951,178) | $ | 561,617,246 | | |
Fidelity Central Funds (cost $11,872,248) | | 11,872,248 | | |
| | | | | |
| | | | | |
| Total Investment in Securities (cost $453,823,426) | | | $ | 573,489,494 |
| Receivable for investments sold | | | | 5,164,369 |
| Receivable for fund shares sold | | | | 37,779 |
| Dividends receivable | | | | 96,836 |
| Reclaims receivable | | | | 3,761,771 |
| Distributions receivable from Fidelity Central Funds | | | | 47,441 |
| Prepaid expenses | | | | 736 |
| Other receivables | | | | 195,598 |
Total assets | | | | 582,794,024 |
| Liabilities | | | | |
| Payable for investments purchased on a delayed delivery basis | $ | 7,342 | | |
| Payable for fund shares redeemed | | 598,266 | | |
| Accrued management fee | | 305,513 | | |
| Distribution and service plan fees payable | | 6,893 | | |
| Other payables and accrued expenses | | 192,465 | | |
| Collateral on securities loaned | | 1,011,520 | | |
| Total liabilities | | | | 2,121,999 |
| Net Assets | | | $ | 580,672,025 |
| Net Assets consist of: | | | | |
| Paid in capital | | | $ | 535,939,332 |
| Total accumulated earnings (loss) | | | | 44,732,693 |
| Net Assets | | | $ | 580,672,025 |
| | | | | |
| Net Asset Value and Maximum Offering Price | | | | |
| Class A : | | | | |
Net Asset Value and redemption price per share ($15,851,800 ÷ 432,536 shares)(a) | | | $ | 36.65 |
| Maximum offering price per share (100/94.25 of $36.65) | | | $ | 38.89 |
| Class M : | | | | |
Net Asset Value and redemption price per share ($4,665,112 ÷ 127,237 shares)(a) | | | $ | 36.66 |
| Maximum offering price per share (100/96.50 of $36.66) | | | $ | 37.99 |
| Class C : | | | | |
Net Asset Value and offering price per share ($1,601,164 ÷ 44,246 shares)(a) | | | $ | 36.19 |
| Europe : | | | | |
Net Asset Value, offering price and redemption price per share ($552,466,963 ÷ 15,048,836 shares) | | | $ | 36.71 |
| Class I : | | | | |
Net Asset Value, offering price and redemption price per share ($3,010,924 ÷ 82,017 shares) | | | $ | 36.71 |
| Class Z : | | | | |
Net Asset Value, offering price and redemption price per share ($3,076,062 ÷ 83,972 shares) | | | $ | 36.63 |
(a)Redemption price per share is equal to net asset value less any applicable contingent deferred sales charge. |
| Statement of Operations |
| Year ended October 31, 2024 |
| Investment Income | | | | |
| Dividends | | | $ | 15,719,491 |
| Foreign Tax Reclaims | | | | 1,940,045 |
| Income from Fidelity Central Funds (including $21,511 from security lending) | | | | 261,234 |
| Income before foreign taxes withheld | | | $ | 17,920,770 |
| Less foreign taxes withheld | | | | (3,339,442) |
| Total income | | | | 14,581,328 |
| Expenses | | | | |
| Management fee | | | | |
| Basic fee | $ | 4,721,015 | | |
| Performance adjustment | | (1,439,109) | | |
| Transfer agent fees | | 325,541 | | |
| Distribution and service plan fees | | 85,471 | | |
| Accounting fees | | 94,136 | | |
| Custodian fees and expenses | | 50,049 | | |
| Independent trustees' fees and expenses | | 2,750 | | |
| Registration fees | | 83,250 | | |
| Audit fees | | 85,478 | | |
| Legal | | 1,444 | | |
| Miscellaneous | | 15,623 | | |
| Total expenses before reductions | | 4,025,648 | | |
| Expense reductions | | (26,821) | | |
| Total expenses after reductions | | | | 3,998,827 |
| Net Investment income (loss) | | | | 10,582,501 |
| Realized and Unrealized Gain (Loss) | | | | |
| Net realized gain (loss) on: | | | | |
| Investment Securities: | | | | |
| Unaffiliated issuers | | 15,955,661 | | |
| Fidelity Central Funds | | 238 | | |
| Foreign currency transactions | | 6,493 | | |
| Total net realized gain (loss) | | | | 15,962,392 |
| Change in net unrealized appreciation (depreciation) on: | | | | |
| Investment Securities: | | | | |
| Unaffiliated issuers | | 91,353,038 | | |
| Assets and liabilities in foreign currencies | | 144,380 | | |
| Total change in net unrealized appreciation (depreciation) | | | | 91,497,418 |
| Net gain (loss) | | | | 107,459,810 |
| Net increase (decrease) in net assets resulting from operations | | | $ | 118,042,311 |
| Statement of Changes in Net Assets |
| |
| | Year ended October 31, 2024 | | Year ended October 31, 2023 |
| Increase (Decrease) in Net Assets | | | | |
| Operations | | | | |
| Net investment income (loss) | $ | 10,582,501 | $ | 10,631,570 |
| Net realized gain (loss) | | 15,962,392 | | (1,666,121) |
| Change in net unrealized appreciation (depreciation) | | 91,497,418 | | 54,400,651 |
| Net increase (decrease) in net assets resulting from operations | | 118,042,311 | | 63,366,100 |
| Distributions to shareholders | | (9,697,062) | | - |
| | | | | |
| Share transactions - net increase (decrease) | | (75,309,165) | | (68,214,872) |
| | | | | |
| Total increase (decrease) in net assets | | 33,036,084 | | (4,848,772) |
| | | | | |
| Net Assets | | | | |
| Beginning of period | | 547,635,941 | | 552,484,713 |
| End of period | $ | 580,672,025 | $ | 547,635,941 |
| | | | | |
| | | | | |
Financial Highlights
Fidelity Advisor® Europe Fund Class A |
| |
| Years ended October 31, | | 2024 | | 2023 | | 2022 | | 2021 | | 2020 |
Selected Per-Share Data | | | | | | | | | | |
| Net asset value, beginning of period | $ | 30.50 | $ | 27.58 | $ | 46.12 | $ | 35.37 | $ | 36.30 |
| Income from Investment Operations | | | | | | | | | | |
Net investment income (loss) A,B | | .53 | | .46 | | .47 | | .41 | | .19 |
| Net realized and unrealized gain (loss) | | 6.05 | | 2.46 | | (12.91) | | 10.72 | | 1.46 |
| Total from investment operations | | 6.58 | | 2.92 | | (12.44) | | 11.13 | | 1.65 |
| Distributions from net investment income | | (.43) | | - | | (.99) | | (.38) | | (1.50) |
| Distributions from net realized gain | | - | | - | | (5.12) | | - | | (1.08) |
| Total distributions | | (.43) | | - | | (6.10) C | | (.38) | | (2.58) |
| Net asset value, end of period | $ | 36.65 | $ | 30.50 | $ | 27.58 | $ | 46.12 | $ | 35.37 |
Total Return D,E | | | | 10.59% | | (30.29)% | | 31.60% | | 4.62% |
Ratios to Average Net Assets B,F,G | | | | | | | | | | |
| Expenses before reductions | | .93% | | 1.02% | | 1.18% | | 1.36% | | 1.34% |
| Expenses net of fee waivers, if any | | | | 1.01% | | 1.18% | | 1.36% | | 1.34% |
| Expenses net of all reductions | | .93% | | 1.01% | | 1.18% | | 1.36% | | 1.33% |
| Net investment income (loss) | | 1.47% | | 1.43% | | 1.42% | | .92% | | .56% |
| Supplemental Data | | | | | | | | | | |
| Net assets, end of period (000 omitted) | $ | 15,852 | $ | 15,325 | $ | 16,495 | $ | 32,148 | $ | 23,189 |
Portfolio turnover rate H | | | | 37% | | 55% | | 52% | | 39% |
ACalculated based on average shares outstanding during the period.
BNet investment income (loss) is affected by the timing of the declaration of dividends by any underlying mutual funds or exchange-traded funds (ETFs). Net investment income (loss) of any mutual funds or ETFs is not included in the Fund's net investment income (loss) ratio.
CTotal distributions per share do not sum due to rounding.
DTotal returns would have been lower if certain expenses had not been reduced during the applicable periods shown.
ETotal returns do not include the effect of the sales charges.
FFees and expenses of any underlying mutual funds or exchange-traded funds (ETFs) are not included in the Fund's expense ratio. The Fund indirectly bears its proportionate share of these expenses. For additional expense information related to investments in Fidelity Central Funds, please refer to the "Investments in Fidelity Central Funds" note found in the Notes to Financial Statements section of the most recent Annual or Semi-Annual report.
GExpense ratios reflect operating expenses of the class. Expenses before reductions do not reflect amounts reimbursed, waived, or reduced through arrangements with the investment adviser, brokerage services, or other offset arrangements, if applicable, and do not represent the amount paid by the class during periods when reimbursements, waivers or reductions occur.
HAmount does not include the portfolio activity of any underlying mutual funds or exchange-traded funds (ETFs).
Fidelity Advisor® Europe Fund Class M |
| |
| Years ended October 31, | | 2024 | | 2023 | | 2022 | | 2021 | | 2020 |
Selected Per-Share Data | | | | | | | | | | |
| Net asset value, beginning of period | $ | 30.50 | $ | 27.65 | $ | 46.18 | $ | 35.42 | $ | 36.32 |
| Income from Investment Operations | | | | | | | | | | |
Net investment income (loss) A,B | | .44 | | .38 | | .37 | | .27 | | .09 |
| Net realized and unrealized gain (loss) | | 6.05 | | 2.47 | | (12.95) | | 10.75 | | 1.45 |
| Total from investment operations | | 6.49 | | 2.85 | | (12.58) | | 11.02 | | 1.54 |
| Distributions from net investment income | | (.33) | | - | | (.83) | | (.26) | | (1.36) |
| Distributions from net realized gain | | - | | - | | (5.12) | | - | | (1.08) |
| Total distributions | | (.33) | | - | | (5.95) | | (.26) | | (2.44) |
| Net asset value, end of period | $ | 36.66 | $ | 30.50 | $ | 27.65 | $ | 46.18 | $ | 35.42 |
Total Return C,D | | | | 10.31% | | (30.51)% | | 31.20% | | 4.30% |
Ratios to Average Net Assets B,E,F | | | | | | | | | | |
| Expenses before reductions | | 1.19% | | 1.29% | | 1.49% | | 1.68% | | 1.65% |
| Expenses net of fee waivers, if any | | | | 1.28% | | 1.48% | | 1.68% | | 1.65% |
| Expenses net of all reductions | | 1.19% | | 1.28% | | 1.48% | | 1.68% | | 1.64% |
| Net investment income (loss) | | 1.21% | | 1.16% | | 1.12% | | .59% | | .25% |
| Supplemental Data | | | | | | | | | | |
| Net assets, end of period (000 omitted) | $ | 4,665 | $ | 4,248 | $ | 4,066 | $ | 6,937 | $ | 5,204 |
Portfolio turnover rate G | | | | 37% | | 55% | | 52% | | 39% |
ACalculated based on average shares outstanding during the period.
BNet investment income (loss) is affected by the timing of the declaration of dividends by any underlying mutual funds or exchange-traded funds (ETFs). Net investment income (loss) of any mutual funds or ETFs is not included in the Fund's net investment income (loss) ratio.
CTotal returns would have been lower if certain expenses had not been reduced during the applicable periods shown.
DTotal returns do not include the effect of the sales charges.
EFees and expenses of any underlying mutual funds or exchange-traded funds (ETFs) are not included in the Fund's expense ratio. The Fund indirectly bears its proportionate share of these expenses. For additional expense information related to investments in Fidelity Central Funds, please refer to the "Investments in Fidelity Central Funds" note found in the Notes to Financial Statements section of the most recent Annual or Semi-Annual report.
FExpense ratios reflect operating expenses of the class. Expenses before reductions do not reflect amounts reimbursed, waived, or reduced through arrangements with the investment adviser, brokerage services, or other offset arrangements, if applicable, and do not represent the amount paid by the class during periods when reimbursements, waivers or reductions occur.
GAmount does not include the portfolio activity of any underlying mutual funds or exchange-traded funds (ETFs).
Fidelity Advisor® Europe Fund Class C |
| |
| Years ended October 31, | | 2024 | | 2023 | | 2022 | | 2021 | | 2020 |
Selected Per-Share Data | | | | | | | | | | |
| Net asset value, beginning of period | $ | 30.03 | $ | 27.36 | $ | 45.63 | $ | 35.01 | $ | 35.87 |
| Income from Investment Operations | | | | | | | | | | |
Net investment income (loss) A,B | | .26 | | .21 | | .21 | | .04 | | (.09) |
| Net realized and unrealized gain (loss) | | 5.98 | | 2.46 | | (12.84) | | 10.64 | | 1.45 |
| Total from investment operations | | 6.24 | | 2.67 | | (12.63) | | 10.68 | | 1.36 |
| Distributions from net investment income | | (.08) | | - | | (.52) | | (.06) | | (1.14) |
| Distributions from net realized gain | | - | | - | | (5.12) | | - | | (1.08) |
| Total distributions | | (.08) | | - | | (5.64) | | (.06) | | (2.22) |
| Net asset value, end of period | $ | 36.19 | $ | 30.03 | $ | 27.36 | $ | 45.63 | $ | 35.01 |
Total Return C,D | | | | 9.76% | | (30.85)% | | 30.53% | | 3.81% |
Ratios to Average Net Assets B,E,F | | | | | | | | | | |
| Expenses before reductions | | 1.67% | | 1.79% | | 1.99% | | 2.19% | | 2.15% |
| Expenses net of fee waivers, if any | | | | 1.78% | | 1.98% | | 2.18% | | 2.15% |
| Expenses net of all reductions | | 1.67% | | 1.78% | | 1.98% | | 2.18% | | 2.14% |
| Net investment income (loss) | | .73% | | .65% | | .62% | | .09% | | (.25)% |
| Supplemental Data | | | | | | | | | | |
| Net assets, end of period (000 omitted) | $ | 1,601 | $ | 2,025 | $ | 2,496 | $ | 5,255 | $ | 5,242 |
Portfolio turnover rate G | | | | 37% | | 55% | | 52% | | 39% |
ACalculated based on average shares outstanding during the period.
BNet investment income (loss) is affected by the timing of the declaration of dividends by any underlying mutual funds or exchange-traded funds (ETFs). Net investment income (loss) of any mutual funds or ETFs is not included in the Fund's net investment income (loss) ratio.
CTotal returns would have been lower if certain expenses had not been reduced during the applicable periods shown.
DTotal returns do not include the effect of the contingent deferred sales charge.
EFees and expenses of any underlying mutual funds or exchange-traded funds (ETFs) are not included in the Fund's expense ratio. The Fund indirectly bears its proportionate share of these expenses. For additional expense information related to investments in Fidelity Central Funds, please refer to the "Investments in Fidelity Central Funds" note found in the Notes to Financial Statements section of the most recent Annual or Semi-Annual report.
FExpense ratios reflect operating expenses of the class. Expenses before reductions do not reflect amounts reimbursed, waived, or reduced through arrangements with the investment adviser, brokerage services, or other offset arrangements, if applicable, and do not represent the amount paid by the class during periods when reimbursements, waivers or reductions occur.
GAmount does not include the portfolio activity of any underlying mutual funds or exchange-traded funds (ETFs).
| Years ended October 31, | | 2024 | | 2023 | | 2022 | | 2021 | | 2020 |
Selected Per-Share Data | | | | | | | | | | |
| Net asset value, beginning of period | $ | 30.58 | $ | 27.57 | $ | 46.11 | $ | 35.35 | $ | 36.28 |
| Income from Investment Operations | | | | | | | | | | |
Net investment income (loss) A,B | | .64 | | .57 | | .57 | | .54 | | .30 |
| Net realized and unrealized gain (loss) | | 6.05 | | 2.44 | | (12.88) | | 10.71 | | 1.46 |
| Total from investment operations | | 6.69 | | 3.01 | | (12.31) | | 11.25 | | 1.76 |
| Distributions from net investment income | | (.56) | | - | | (1.11) | | (.49) | | (1.61) |
| Distributions from net realized gain | | - | | - | | (5.12) | | - | | (1.08) |
| Total distributions | | (.56) | | - | | (6.23) | | (.49) | | (2.69) |
| Net asset value, end of period | $ | 36.71 | $ | 30.58 | $ | 27.57 | $ | 46.11 | $ | 35.35 |
Total Return C | | | | 10.92% | | (30.07)% | | 31.99% | | 4.95% |
Ratios to Average Net Assets B,D,E | | | | | | | | | | |
| Expenses before reductions | | .65% | | .70% | | .88% | | 1.06% | | 1.03% |
| Expenses net of fee waivers, if any | | | | .69% | | .88% | | 1.06% | | 1.03% |
| Expenses net of all reductions | | .64% | | .69% | | .88% | | 1.06% | | 1.02% |
| Net investment income (loss) | | 1.76% | | 1.75% | | 1.73% | | 1.21% | | .86% |
| Supplemental Data | | | | | | | | | | |
| Net assets, end of period (000 omitted) | $ | 552,467 | $ | 519,010 | $ | 523,685 | $ | 913,296 | $ | 755,125 |
Portfolio turnover rate F | | | | 37% | | 55% | | 52% | | 39% |
ACalculated based on average shares outstanding during the period.
BNet investment income (loss) is affected by the timing of the declaration of dividends by any underlying mutual funds or exchange-traded funds (ETFs). Net investment income (loss) of any mutual funds or ETFs is not included in the Fund's net investment income (loss) ratio.
CTotal returns would have been lower if certain expenses had not been reduced during the applicable periods shown.
DFees and expenses of any underlying mutual funds or exchange-traded funds (ETFs) are not included in the Fund's expense ratio. The Fund indirectly bears its proportionate share of these expenses. For additional expense information related to investments in Fidelity Central Funds, please refer to the "Investments in Fidelity Central Funds" note found in the Notes to Financial Statements section of the most recent Annual or Semi-Annual report.
EExpense ratios reflect operating expenses of the class. Expenses before reductions do not reflect amounts reimbursed, waived, or reduced through arrangements with the investment adviser, brokerage services, or other offset arrangements, if applicable, and do not represent the amount paid by the class during periods when reimbursements, waivers or reductions occur.
FAmount does not include the portfolio activity of any underlying mutual funds or exchange-traded funds (ETFs).
Fidelity Advisor® Europe Fund Class I |
| |
| Years ended October 31, | | 2024 | | 2023 | | 2022 | | 2021 | | 2020 |
Selected Per-Share Data | | | | | | | | | | |
| Net asset value, beginning of period | $ | 30.58 | $ | 27.56 | $ | 46.07 | $ | 35.34 | $ | 36.27 |
| Income from Investment Operations | | | | | | | | | | |
Net investment income (loss) A,B | | .64 | | .57 | | .60 | | .54 | | .31 |
| Net realized and unrealized gain (loss) | | 6.05 | | 2.45 | | (12.91) | | 10.70 | | 1.46 |
| Total from investment operations | | 6.69 | | 3.02 | | (12.31) | | 11.24 | | 1.77 |
| Distributions from net investment income | | (.56) | | - | | (1.08) | | (.51) | | (1.62) |
| Distributions from net realized gain | | - | | - | | (5.12) | | - | | (1.08) |
| Total distributions | | (.56) | | - | | (6.20) | | (.51) | | (2.70) |
| Net asset value, end of period | $ | 36.71 | $ | 30.58 | $ | 27.56 | $ | 46.07 | $ | 35.34 |
Total Return C | | | | 10.96% | | (30.08)% | | 31.99% | | 4.99% |
Ratios to Average Net Assets B,D,E | | | | | | | | | | |
| Expenses before reductions | | .62% | | .68% | | .86% | | 1.06% | | 1.00% |
| Expenses net of fee waivers, if any | | | | .67% | | .86% | | 1.06% | | 1.00% |
| Expenses net of all reductions | | .61% | | .67% | | .86% | | 1.06% | | .99% |
| Net investment income (loss) | | 1.79% | | 1.77% | | 1.74% | | 1.22% | | .90% |
| Supplemental Data | | | | | | | | | | |
| Net assets, end of period (000 omitted) | $ | 3,011 | $ | 4,806 | $ | 4,283 | $ | 14,401 | $ | 14,733 |
Portfolio turnover rate F | | | | 37% | | 55% | | 52% | | 39% |
ACalculated based on average shares outstanding during the period.
BNet investment income (loss) is affected by the timing of the declaration of dividends by any underlying mutual funds or exchange-traded funds (ETFs). Net investment income (loss) of any mutual funds or ETFs is not included in the Fund's net investment income (loss) ratio.
CTotal returns would have been lower if certain expenses had not been reduced during the applicable periods shown.
DFees and expenses of any underlying mutual funds or exchange-traded funds (ETFs) are not included in the Fund's expense ratio. The Fund indirectly bears its proportionate share of these expenses. For additional expense information related to investments in Fidelity Central Funds, please refer to the "Investments in Fidelity Central Funds" note found in the Notes to Financial Statements section of the most recent Annual or Semi-Annual report.
EExpense ratios reflect operating expenses of the class. Expenses before reductions do not reflect amounts reimbursed, waived, or reduced through arrangements with the investment adviser, brokerage services, or other offset arrangements, if applicable, and do not represent the amount paid by the class during periods when reimbursements, waivers or reductions occur.
FAmount does not include the portfolio activity of any underlying mutual funds or exchange-traded funds (ETFs).
Fidelity Advisor® Europe Fund Class Z |
| |
| Years ended October 31, | | 2024 | | 2023 | | 2022 | | 2021 | | 2020 |
Selected Per-Share Data | | | | | | | | | | |
| Net asset value, beginning of period | $ | 30.53 | $ | 27.48 | $ | 46.00 | $ | 35.27 | $ | 36.21 |
| Income from Investment Operations | | | | | | | | | | |
Net investment income (loss) A,B | | .67 | | .61 | | .62 | | .59 | | .34 |
| Net realized and unrealized gain (loss) | | 6.04 | | 2.44 | | (12.86) | | 10.67 | | 1.47 |
| Total from investment operations | | 6.71 | | 3.05 | | (12.24) | | 11.26 | | 1.81 |
| Distributions from net investment income | | (.61) | | - | | (1.17) | | (.53) | | (1.67) |
| Distributions from net realized gain | | - | | - | | (5.12) | | - | | (1.08) |
| Total distributions | | (.61) | | - | | (6.28) C | | (.53) | | (2.75) |
| Net asset value, end of period | $ | 36.63 | $ | 30.53 | $ | 27.48 | $ | 46.00 | $ | 35.27 |
Total Return D | | | | 11.10% | | (30.00)% | | 32.13% | | 5.11% |
Ratios to Average Net Assets B,E,F | | | | | | | | | | |
| Expenses before reductions | | .55% | | .57% | | .76% | | .95% | | .91% |
| Expenses net of fee waivers, if any | | | | .56% | | .75% | | .95% | | .90% |
| Expenses net of all reductions | | .54% | | .56% | | .75% | | .95% | | .90% |
| Net investment income (loss) | | 1.86% | | 1.87% | | 1.85% | | 1.33% | | .99% |
| Supplemental Data | | | | | | | | | | |
| Net assets, end of period (000 omitted) | $ | 3,076 | $ | 2,222 | $ | 1,461 | $ | 28,249 | $ | 19,479 |
Portfolio turnover rate G | | | | 37% | | 55% | | 52% | | 39% |
ACalculated based on average shares outstanding during the period.
BNet investment income (loss) is affected by the timing of the declaration of dividends by any underlying mutual funds or exchange-traded funds (ETFs). Net investment income (loss) of any mutual funds or ETFs is not included in the Fund's net investment income (loss) ratio.
CTotal distributions per share do not sum due to rounding.
DTotal returns would have been lower if certain expenses had not been reduced during the applicable periods shown.
EFees and expenses of any underlying mutual funds or exchange-traded funds (ETFs) are not included in the Fund's expense ratio. The Fund indirectly bears its proportionate share of these expenses. For additional expense information related to investments in Fidelity Central Funds, please refer to the "Investments in Fidelity Central Funds" note found in the Notes to Financial Statements section of the most recent Annual or Semi-Annual report.
FExpense ratios reflect operating expenses of the class. Expenses before reductions do not reflect amounts reimbursed, waived, or reduced through arrangements with the investment adviser, brokerage services, or other offset arrangements, if applicable, and do not represent the amount paid by the class during periods when reimbursements, waivers or reductions occur.
GAmount does not include the portfolio activity of any underlying mutual funds or exchange-traded funds (ETFs).
Notes to Financial Statements
For the period ended October 31, 2024
1. Organization.
Fidelity Europe Fund (the Fund) is a fund of Fidelity Investment Trust (the Trust) and is authorized to issue an unlimited number of shares. The Trust is registered under the Investment Company Act of 1940, as amended (the 1940 Act), as an open-end management investment company organized as a Massachusetts business trust. The Fund offers Class A, Class M, Class C, Europe, Class I and Class Z shares, each of which has equal rights as to assets and voting privileges. Class A, Class M, Class C, Class I and Class Z are Fidelity Advisor classes. Each class has exclusive voting rights with respect to matters that affect that class. Class C shares will automatically convert to Class A shares after a holding period of eight years from the initial date of purchase, with certain exceptions.
2. Investments in Fidelity Central Funds.
Funds may invest in Fidelity Central Funds, which are open-end investment companies generally available only to other investment companies and accounts managed by the investment adviser and its affiliates. The Schedule of Investments lists any Fidelity Central Funds held as an investment as of period end, but does not include the underlying holdings of each Fidelity Central Fund. An investing fund indirectly bears its proportionate share of the expenses of the underlying Fidelity Central Funds.
Based on its investment objective, each Fidelity Central Fund may invest or participate in various investment vehicles or strategies that are similar to those of the investing fund. These strategies are consistent with the investment objectives of the investing fund and may involve certain economic risks which may cause a decline in value of each of the Fidelity Central Funds and thus a decline in the value of the investing fund.
| Fidelity Central Fund | Investment Manager | Investment Objective | Investment Practices | Expense RatioA |
| Fidelity Money Market Central Funds | Fidelity Management & Research Company LLC (FMR) | Each fund seeks to obtain a high level of current income consistent with the preservation of capital and liquidity. | Short-term Investments | Less than .005% |
A Expenses expressed as a percentage of average net assets and are as of each underlying Central Fund's most recent annual or semi-annual shareholder report.
A complete unaudited list of holdings for each Fidelity Central Fund is available upon request or at the Securities and Exchange Commission website at www.sec.gov. In addition, the financial statements of the Fidelity Central Funds which contain the significant accounting policies (including investment valuation policies) of those funds, and are not covered by the Report of Independent Registered Public Accounting Firm, are available on the Securities and Exchange Commission website or upon request.
3. Significant Accounting Policies.
The Fund is an investment company and applies the accounting and reporting guidance of the Financial Accounting Standards Board (FASB) Accounting Standards Codification Topic 946 Financial Services - Investment Companies. The financial statements have been prepared in conformity with accounting principles generally accepted in the United States of America (GAAP), which require management to make certain estimates and assumptions at the date of the financial statements. Actual results could differ from those estimates. Subsequent events, if any, through the date that the financial statements were issued have been evaluated in the preparation of the financial statements. The Fund's Schedule of Investments lists any underlying mutual funds or exchange-traded funds (ETFs) but does not include the underlying holdings of these funds. The following summarizes the significant accounting policies of the Fund:
Investment Valuation. Investments are valued as of 4:00 p.m. Eastern time on the last calendar day of the period. The Board of Trustees (the Board) has designated the Fund's investment adviser as the valuation designee responsible for the fair valuation function and performing fair value determinations as needed. The investment adviser has established a Fair Value Committee (the Committee) to carry out the day-to-day fair valuation responsibilities and has adopted policies and procedures to govern the fair valuation process and the activities of the Committee. In accordance with these fair valuation policies and procedures, which have been approved by the Board, the Fund attempts to obtain prices from one or more third party pricing services or brokers to value its investments. When current market prices, quotations or currency exchange rates are not readily available or reliable, investments will be fair valued in good faith by the Committee, in accordance with the policies and procedures. Factors used in determining fair value vary by investment type and may include market or investment specific events, transaction data, estimated cash flows, and market observations of comparable investments. The frequency that the fair valuation procedures are used cannot be predicted and they may be utilized to a significant extent. The Committee manages the Fund's fair valuation practices and maintains the fair valuation policies and procedures. The Fund's investment adviser reports to the Board information regarding the fair valuation process and related material matters.
The Fund categorizes the inputs to valuation techniques used to value its investments into a disclosure hierarchy consisting of three levels as shown below:
Level 1 - unadjusted quoted prices in active markets for identical investments
Level 2 - other significant observable inputs (including quoted prices for similar investments, interest rates, prepayment speeds, etc.)
Level 3 - unobservable inputs (including the Fund's own assumptions based on the best information available)
Valuation techniques used to value the Fund's investments by major category are as follows:
Equity securities, including restricted securities, for which market quotations are readily available, are valued at the last reported sale price or official closing price as reported by a third party pricing service on the primary market or exchange on which they are traded and are categorized as Level 1 in the hierarchy. In the event there were no sales during the day or closing prices are not available, securities are valued at the last quoted bid price or may be valued using the last available price and are generally categorized as Level 2 in the hierarchy. For foreign equity securities, when market or security specific events arise, comparisons to the valuation of American Depositary Receipts (ADRs), futures contracts, Exchange-Traded Funds (ETFs) and certain indexes as well as quoted prices for similar securities may be used and would be categorized as Level 2 in the hierarchy. For equity securities, including restricted securities, where observable inputs are limited, assumptions about market activity and risk are used and these securities may be categorized as Level 3 in the hierarchy.
Investments in open-end mutual funds, including the Fidelity Central Funds, are valued at their closing net asset value (NAV) each business day and are categorized as Level 1 in the hierarchy.
Changes in valuation techniques may result in transfers in or out of an assigned level within the disclosure hierarchy. The aggregate value of investments by input level as of October 31, 2024 is included at the end of the Fund's Schedule of Investments.
Foreign Currency. Certain Funds may use foreign currency contracts to facilitate transactions in foreign-denominated securities. Gains and losses from these transactions may arise from changes in the value of the foreign currency or if the counterparties do not perform under the contracts' terms.
Foreign-denominated assets, including investment securities, and liabilities are translated into U.S. dollars at the exchange rates at period end. Purchases and sales of investment securities, income and dividends received, and expenses denominated in foreign currencies are translated into U.S. dollars at the exchange rate in effect on the transaction date.
The effects of exchange rate fluctuations on investments are included with the net realized and unrealized gain (loss) on investment securities. Other foreign currency transactions resulting in realized and unrealized gain (loss) are disclosed separately.
Investment Transactions and Income. For financial reporting purposes, the Fund's investment holdings and NAV include trades executed through the end of the last business day of the period. The NAV per share for processing shareholder transactions is calculated as of the close of business of the New York Stock Exchange (NYSE), normally 4:00 p.m. Eastern time and includes trades executed through the end of the prior business day. Gains and losses on securities sold are determined on the basis of identified cost and include proceeds received from litigation. Commissions paid to certain brokers with whom the investment adviser, or its affiliates, places trades on behalf of a fund include an amount in addition to trade execution, which may be rebated back to a fund. Any such rebates are included in net realized gain (loss) on investments in the Statement of Operations. Dividend income is recorded on the ex-dividend date, except for certain dividends from foreign securities where the ex-dividend date may have passed, which are recorded as soon as the Fund is informed of the ex-dividend date. Non-cash dividends included in dividend income, if any, are recorded at the fair market value of the securities received. Income and capital gain distributions from Fidelity Central Funds, if any, are recorded on the ex-dividend date. Investment income is recorded net of foreign taxes withheld where recovery of such taxes is uncertain. Funds may file withholding tax reclaims in certain jurisdictions to recover a portion of amounts previously withheld. Any withholding tax reclaims income is included in the Statement of Operations in foreign tax reclaims. Any receivables for withholding tax reclaims are included in the Statement of Assets and Liabilities in reclaims receivable. The Fund has filed tax reclaims for previously withheld taxes on dividends earned in certain European Union (EU) countries. These additional filings are subject to various administrative proceedings by the local jurisdictions' tax authorities within the EU, as well as a number of related judicial proceedings. Income recognized for EU reclaims is included with other reclaims in the Statement of Operations in foreign taxes withheld. These reclaims are recorded when the amount is known and there are no significant uncertainties on collectability. For U.S. income tax purposes, EU reclaims received by a fund reduce the amounts of foreign taxes shareholders can use as tax credits in their individual income tax returns. In the event that EU reclaims received by a fund during the fiscal year exceed foreign withholding taxes paid in that year, and a fund previously passed foreign tax credit on to its shareholders, a fund will enter into a closing agreement with the Internal Revenue Service (IRS) in order to pay the associated tax liability on behalf of shareholders. During the fiscal year ended October 31, 2024, the Fund received EU reclaims in excess of foreign withholding taxes paid. The Fund is seeking a closing agreement with the IRS and has accrued the estimated fees as presented in the Statement of Assets and Liabilities in other payables and accrued expenses, and in the Statement of Operations in foreign taxes withheld. The actual fees may differ from the estimate.
Class Allocations and Expenses. Investment income, realized and unrealized capital gains and losses, common expenses of a fund, and certain fund-level expense reductions, if any, are allocated daily on a pro-rata basis to each class based on the relative net assets of each class to the total net assets of a fund. Each class differs with respect to transfer agent and distribution and service plan fees incurred, as applicable. Certain expense reductions may also differ by class, if applicable. For the reporting period, the allocated portion of income and expenses to each class as a percent of its average net assets may vary due to the timing of recording these transactions in relation to fluctuating net assets of the classes. Expenses directly attributable to a fund are charged to that fund. Expenses attributable to more than one fund are allocated among the respective funds on the basis of relative net assets or other appropriate methods. Expenses included in the accompanying financial statements reflect the expenses of that fund and do not include any expenses associated with any underlying mutual funds or exchange-traded funds (ETFs). Although not included in a fund's expenses, a fund indirectly bears its proportionate share of these expenses through the net asset value of each underlying mutual fund or exchange-traded fund (ETF). Expense estimates are accrued in the period to which they relate and adjustments are made when actual amounts are known.
Income Tax Information and Distributions to Shareholders. Each year, the Fund intends to qualify as a regulated investment company under Subchapter M of the Internal Revenue Code, including distributing substantially all of its taxable income and realized gains. As a result, no provision for U.S. Federal income taxes is required. As of October 31, 2024, the Fund did not have any unrecognized tax benefits in the financial statements; nor is the Fund aware of any tax positions for which it is reasonably possible that the total amounts of unrecognized tax benefits will significantly change in the next twelve months. The Fund files a U.S. federal tax return, in addition to state and local tax returns as required. The Fund's federal income tax returns are subject to examination by the Internal Revenue Service (IRS) for a period of three fiscal years after they are filed. State and local tax returns may be subject to examination for an additional fiscal year depending on the jurisdiction. Foreign taxes are provided for based on the Fund's understanding of the tax rules and rates that exist in the foreign markets in which it invests.
Distributions are declared and recorded on the ex-dividend date. Income and capital gain distributions are declared separately for each class. Income and capital gain distributions are determined in accordance with income tax regulations, which may differ from GAAP.
Capital accounts within the financial statements are adjusted for permanent book-tax differences. These adjustments have no impact on net assets or the results of operations. Capital accounts are not adjusted for temporary book-tax differences which will reverse in a subsequent period.
Book-tax differences are primarily due to foreign currency transactions, passive foreign investment companies (PFIC), capital loss carryforwards and losses deferred due to wash sales.
As of period end, the cost and unrealized appreciation (depreciation) in securities, and derivatives if applicable, for federal income tax purposes were as follows:
| Gross unrealized appreciation | $132,797,400 |
| Gross unrealized depreciation | (18,391,778) |
| Net unrealized appreciation (depreciation) | $114,405,622 |
| Tax Cost | $459,083,872 |
The tax-based components of distributable earnings as of period end were as follows:
| Undistributed ordinary income | $16,824,390 |
| Capital loss carryforward | $(86,490,762) |
| Net unrealized appreciation (depreciation) on securities and other investments | $114,399,063 |
Capital loss carryforwards are only available to offset future capital gains of the Fund to the extent provided by regulations and may be limited. The capital loss carryforward information presented below, including any applicable limitation, is estimated as of fiscal period end and is subject to adjustment.
Short-term | $(58,515,557) |
Long-term | (27,975,205) |
| Total capital loss carryforward | $(86,490,762) |
The tax character of distributions paid was as follows:
| | October 31, 2024 | October 31, 2023 |
| Ordinary Income | $9,697,062 | $- |
| Total | $9,697,062 | $- |
Delayed Delivery Transactions and When-Issued Securities. During the period, certain Funds transacted in securities on a delayed delivery or when-issued basis. Payment and delivery may take place after the customary settlement period for that security. The price of the underlying securities and the date when the securities will be delivered and paid for are fixed at the time the transaction is negotiated. Securities purchased on a delayed delivery or when-issued basis are identified as such in the Schedule of Investments. Compensation for interest forgone in the purchase of a delayed delivery or when-issued debt security may be received. With respect to purchase commitments, each applicable Fund identifies securities as segregated in its records with a value at least equal to the amount of the commitment. Payables and receivables associated with the purchases and sales of delayed delivery securities having the same coupon, settlement date and broker are offset. Delayed delivery or when-issued securities that have been purchased from and sold to different brokers are reflected as both payables and receivables in the Statement of Assets and Liabilities under the caption "Delayed delivery", as applicable. Losses may arise due to changes in the value of the underlying securities or if the counterparty does not perform under the contract's terms, or if the issuer does not issue the securities due to political, economic, or other factors.
Restricted Securities (including Private Placements). Funds may invest in securities that are subject to legal or contractual restrictions on resale. These securities generally may be resold in transactions exempt from registration or to the public if the securities are registered. Disposal of these securities may involve time-consuming negotiations and expense, and prompt sale at an acceptable price may be difficult. Information regarding restricted securities held at period end is included at the end of the Schedule of Investments, if applicable.
New Accounting Pronouncement. In November 2023, the FASB issued Accounting Standards Update (ASU) 2023-07 Segment Reporting (Topic 280): Improvements to Reportable Segment Disclosures. Effective for fiscal years beginning after December 15, 2023 and interim periods within fiscal years beginning after December 15, 2024, the amendments enhance required disclosures of segment information for public entities on an annual and interim basis. The ASU allows for early adoption with updates applied retrospectively. Management is currently evaluating the impact of the ASU but does not expect this guidance to materially impact the financial statements.
4. Purchases and Sales of Investments.
Purchases and sales of securities, other than short-term securities and in-kind transactions, as applicable, are noted in the table below.
| | Purchases ($) | Sales ($) |
| Fidelity Europe Fund | 186,611,030 | 271,500,357 |
5. Fees and Other Transactions with Affiliates.
Management Fee. Fidelity Management & Research Company LLC (the investment adviser) and its affiliates provide the Fund with investment management related services for which the Fund pays a monthly management fee.
Effective March 1, 2024, the Fund's management contract was amended to incorporate administrative services previously covered under separate services agreements (Transfer Agent and Accounting agreements). The amended contract incorporates a basic fee rate that may vary by class (subject to a performance adjustment). The investment adviser or an affiliate pays certain expenses of managing and operating the Fund out of each class's management fee. Each class of the Fund pays a management fee to the investment adviser. The management fee is calculated and paid to the investment adviser every month. The management fee is determined by calculating a basic fee and then applying a performance adjustment. When determining a class's basic fee, a mandate rate is calculated based on the monthly average net assets of a group of funds advised by FMR within a designated asset class. A discount rate is subtracted from the mandate rate once the Fund's monthly average net assets reach a certain level. The mandate rate and discount rate may vary by class. The annual basic fee rate for a class of shares of the Fund is the lesser of (1) the class's mandate rate reduced by the class's discount rate (if applicable) or (2) the amount set forth in the following table.
| | Maximum Management Fee Rate % |
| Class A | .88 |
| Class M | .88 |
| Class C | .88 |
| Europe | .84 |
| Class I | .83 |
| Class Z | .72 |
One-twelfth of the basic fee rate for a class is applied to the average net assets of the class for the month, giving a dollar amount which is the basic fee for the class for that month. A different management fee rate may be applicable to each class of the Fund. The difference between classes is the result of separate arrangements for class-level services and/or waivers of certain expenses. It is not the result of any difference in advisory or custodial fees or other expenses related to the management of the Fund's assets, which do not vary by class. For the portion of the reporting period on or after March 1, 2024, the total annualized management fee rates were as follows:
| | Total Management Fee Rate % |
| Class A | .87 |
| Class M | .87 |
| Class C | .87 |
| Europe | .83 |
| Class I | .83 |
| Class Z | .72 |
Prior to March 1, 2024, the management fee was the sum of an individual fund fee rate that was based on an annual rate of .45% of the Fund's average net assets and an annualized group fee rate that averaged .22% during the period. The group fee rate was based upon the monthly average net assets of a group of registered investment companies with which the investment adviser has management contracts. The group fee rate decreased as assets under management increased and increased as assets under management decreased. For the portion of the reporting period prior to March 1, 2024, the total annualized management fee rate was .67%.
The performance adjustment rate is calculated monthly by comparing over the performance period the Fund's performance to that of the performance adjustment index listed below.
| | Performance Adjustment Index |
| Fidelity Europe Fund | MSCI Europe Index |
For the purposes of calculating the performance adjustment for the Fund, the Fund's investment performance is based on the performance of Europe. To the extent that other classes of the Fund have higher expenses, this could result in those classes bearing a larger positive performance adjustment and smaller negative performance adjustment than would be the case if each class's own performance were considered. The performance period is the most recent 36 month period. The maximum annualized performance adjustment rate is ±.20% of the Fund's average net assets over the performance period. The performance adjustment rate is divided by twelve and multiplied by the Fund's average net assets over the performance period, and the resulting dollar amount is proportionately added to or subtracted from a class's basic fee. For the entire reporting period, the total annual performance adjustment was (.24)%.
Effective March 1, 2024, the Fund's sub-advisory agreements with FMR Investment Management (UK) Limited, Fidelity Management & Research (Hong Kong) Limited, and Fidelity Management & Research (Japan) Limited were amended to provide that the investment adviser pays each sub-adviser monthly fees equal to 110% of the sub-adviser's costs for providing sub-advisory services.
Effective March 1, 2024, the Fund's sub-advisory agreement with FIL Investment Advisors (FIA) was amended to provide that the investment adviser pays FIA monthly fees at an annual rate of 0.44% with respect to the average daily net assets of the Fund managed by FIA. FIA in turn pays FIA(UK).
Distribution and Service Plan Fees. In accordance with Rule 12b-1 of the 1940 Act, the Fund has adopted separate Distribution and Service Plans for each class of shares. Certain classes pay Fidelity Distributors Company LLC (FDC), an affiliate of the investment adviser, separate Distribution and Service Fees, each of which is based on an annual percentage of each class' average net assets. In addition, FDC may pay financial intermediaries for selling shares of the Fund and providing shareholder support services. For the period, the Distribution and Service Fee rates, total fees and amounts retained by FDC were as follows:
| | Distribution Fee | Service Fee | Total Fees ($) | Retained by FDC ($) |
| Class A | - % | .25% | 41,757 | 155 |
| Class M | .25% | .25% | 24,167 | 138 |
| Class C | .75% | .25% | 19,547 | 829 |
| | | | 85,471 | 1,122 |
Sales Load. FDC may receive a front-end sales charge of up to 5.75% for selling Class A shares and 3.50% for selling Class M shares, some of which is paid to financial intermediaries for selling shares of the Fund. Depending on the holding period, FDC may receive contingent deferred sales charges levied on Class A, Class M and Class C redemptions. The deferred sales charges are 1.00% for Class C shares, 1.00% for certain purchases of Class A shares and .25% for certain purchases of Class M shares.
For the period, sales charge amounts retained by FDC were as follows:
| | Retained by FDC ($) |
| Class A | 1,000 |
| Class M | 115 |
Class CA | 91 |
| | 1,206 |
A When Class C shares are initially sold, FDC pays commissions from its own resources to financial intermediaries through which the sales are made.
Transfer Agent Fees. Fidelity Investments Institutional Operations Company LLC (FIIOC), an affiliate of the investment adviser, is the transfer, dividend disbursing and shareholder servicing agent for each class of the Fund. Effective March 1, 2024, the Fund's management contract was amended to incorporate transfer agent services and associated fees previously covered under a separate services agreement. FIIOC pays for typesetting, printing and mailing of shareholder reports, except proxy statements.
During the period December 1, 2023 through February 29, 2024, the transfer agent fees for each class were a fixed annual rate of class-level average net assets as follows:
| | % of Class-Level Average Net Assets |
| Class A | .2000 |
| Class M | .2000 |
| Class C | .2000 |
| Europe | .1641 |
| Class I | .1486 |
| Class Z | .0420 |
Prior to December 1, 2023, FIIOC received account fees and asset-based fees that varied according to the account size and type of account of the shareholders of the respective classes of the Fund, except for Class Z. FIIOC received an asset-based fee of Class Z's average net assets. For the portion of the reporting period prior to March 1, 2024, the fees were equivalent to the following annualized rates:
| | Amount ($) | % of Class-Level Average Net Assets |
| Class A | 11,676 | .21 |
| Class M | 3,224 | .21 |
| Class C | 1,460 | .21 |
| Europe | 306,527 | .16 |
| Class I | 2,318 | .15 |
| Class Z | 336 | .04 |
| 325,541 | |
Accounting Fees. Fidelity Service Company, Inc. (FSC), an affiliate of the investment adviser, maintains the Fund's accounting records. Effective March 1, 2024, the Fund's management contract was amended to incorporate accounting services and associated fees previously covered under a separate services agreement.
During the period December 1, 2023 through February 29, 2024, the accounting fees were a fixed annual rate of average net assets as follows:
| | % of Average Net Assets |
| Fidelity Europe Fund | .0476 |
Prior to December 1, 2023, the accounting fee was based on the level of average net assets for each month. For the portion of the reporting period prior to March 1, 2024, the fees were equivalent to the following annualized rates:
| | % of Average Net Assets |
| Fidelity Europe Fund | .05 |
Brokerage Commissions. A portion of portfolio transactions were placed with brokerage firms which are affiliates of the investment adviser. Brokerage commissions are included in net realized gain (loss) and change in net unrealized appreciation (depreciation) in the Statement of Operations. The commissions paid to these affiliated firms were as follows:
| | Amount ($) |
| Fidelity Europe Fund | 78 |
Interfund Trades. Funds may purchase from or sell securities to other Fidelity Funds under procedures adopted by the Board. The procedures have been designed to ensure these interfund trades are executed in accordance with Rule 17a-7 of the 1940 Act. Any interfund trades are included within the respective purchases and sales amounts shown in the Purchases and Sales of Investments note. Interfund trades during the period are noted in the table below.
| | Purchases ($) | Sales ($) | Realized Gain (Loss)($) |
| Fidelity Europe Fund | 8,585,996 | 7,149,081 | 291,187 |
6. Committed Line of Credit.
Certain Funds participate with other funds managed by the investment adviser or an affiliate in a $4.25 billion credit facility (the "line of credit") to be utilized for temporary or emergency purposes to fund shareholder redemptions or for other short-term liquidity purposes. The participating funds have agreed to pay commitment fees on their pro-rata portion of the line of credit, which are reflected in Miscellaneous expenses on the Statement of Operations, and are listed below. During the period, there were no borrowings on this line of credit.
| | Amount ($) |
| Fidelity Europe Fund | 971 |
7. Security Lending.
Funds lend portfolio securities from time to time in order to earn additional income. Lending agents are used, including National Financial Services (NFS), an affiliate of the investment adviser. Pursuant to a securities lending agreement, NFS will receive a fee, which is capped at 9.9% of a fund's daily lending revenue, for its services as lending agent. A fund may lend securities to certain qualified borrowers, including NFS. On the settlement date of the loan, a fund receives collateral (in the form of U.S. Treasury obligations, letters of credit and/or cash) against the loaned securities and maintains collateral in an amount not less than 100% of the market value of the loaned securities during the period of the loan. The market value of the loaned securities is determined at the close of business of a fund and any additional required collateral is delivered to a fund on the next business day. A fund or borrower may terminate the loan at any time, and if the borrower defaults on its obligation to return the securities loaned because of insolvency or other reasons, a fund may apply collateral received from the borrower against the obligation. A fund may experience delays and costs in recovering the securities loaned. Any cash collateral received is invested in the Fidelity Securities Lending Cash Central Fund. Any loaned securities are identified as such in the Schedule of Investments, and the value of loaned securities and cash collateral at period end, as applicable, are presented in the Statement of Assets and Liabilities. Security lending income represents the income earned on investing cash collateral, less rebates paid to borrowers and any lending agent fees associated with the loan, plus any premium payments received for lending certain types of securities. Security lending income is presented in the Statement of Operations as a component of income from Fidelity Central Funds. Affiliated security lending activity, if any, was as follows:
| | Total Security Lending Fees Paid to NFS ($) | Security Lending Income From Securities Loaned to NFS ($) | Value of Securities Loaned to NFS at Period End ($) |
| Fidelity Europe Fund | 2,331 | - | - |
8. Expense Reductions.
Through arrangements with each class' transfer agent, credits realized as a result of certain uninvested cash balances were used to reduce the Fund's expenses. During the period, transfer agent credits reduced each class' expenses as noted in the table below.
| | Expense reduction ($) |
| Class A | 1 |
| Class M | 25 |
| | 26 |
In addition, during the period the investment adviser or an affiliate reimbursed and/or waived a portion of fund-level operating expenses in the amount of $26,795.
9. Distributions to Shareholders.
Distributions to shareholders of each class were as follows:
| | Year ended October 31, 2024 | Year ended October 31, 2023 |
| Fidelity Europe Fund | | |
| Distributions to shareholders | | |
| Class A | $214,383 | $ - |
| Class M | 44,641 | - |
| Class C | 5,044 | - |
| Europe | 9,309,343 | - |
| Class I | 81,789 | - |
| Class Z | 41,862 | - |
Total | $9,697,062 | $ - |
10. Share Transactions.
Share transactions for each class were as follows and may contain in-kind transactions, automatic conversions between classes or exchanges between affiliated funds:
| | Shares | Shares | Dollars | Dollars |
| | Year ended October 31, 2024 | Year ended October 31, 2023 | Year ended October 31, 2024 | Year ended October 31, 2023 |
| Fidelity Europe Fund | | | | |
| Class A | | | | |
| Shares sold | 21,452 | 44,425 | $775,929 | $1,464,114 |
| Reinvestment of distributions | 6,443 | - | 213,141 | - |
| Shares redeemed | (97,780) | (139,999) | (3,489,488) | (4,536,728) |
| Net increase (decrease) | (69,885) | (95,574) | $(2,500,418) | $(3,072,614) |
| Class M | | | | |
| Shares sold | 3,801 | 4,489 | $136,486 | $147,618 |
| Reinvestment of distributions | 1,296 | - | 42,989 | - |
| Shares redeemed | (17,130) | (12,258) | (618,152) | (398,082) |
| Net increase (decrease) | (12,033) | (7,769) | $(438,677) | $(250,464) |
| Class C | | | | |
| Shares sold | 2,160 | 8,574 | $77,699 | $278,728 |
| Reinvestment of distributions | 153 | - | 5,024 | - |
| Shares redeemed | (25,492) | (32,347) | (901,511) | (1,039,195) |
| Net increase (decrease) | (23,179) | (23,773) | $(818,788) | $(760,467) |
| Europe | | | | |
| Shares sold | 633,047 | 957,209 | $22,875,346 | $31,285,588 |
| Reinvestment of distributions | 259,528 | - | 8,577,392 | - |
| Shares redeemed | (2,815,218) | (2,983,175) | (100,700,066) | (96,260,656) |
| Net increase (decrease) | (1,922,643) | (2,025,966) | $(69,247,328) | $(64,975,068) |
| Class I | | | | |
| Shares sold | 13,511 | 81,291 | $485,051 | $2,703,708 |
| Reinvestment of distributions | 1,869 | - | 61,781 | - |
| Shares redeemed | (90,511) | (79,518) | (3,281,012) | (2,541,717) |
| Net increase (decrease) | (75,131) | 1,773 | $(2,734,180) | $161,991 |
| Class Z | | | | |
| Shares sold | 28,495 | 49,574 | $1,050,990 | $1,674,500 |
| Reinvestment of distributions | 865 | - | 28,496 | - |
| Shares redeemed | (18,170) | (29,932) | (649,260) | (992,750) |
| Net increase (decrease) | 11,190 | 19,642 | $430,226 | $681,750 |
11. Other.
A fund's organizational documents provide former and current trustees and officers with a limited indemnification against liabilities arising in connection with the performance of their duties to the fund. In the normal course of business, a fund may also enter into contracts that provide general indemnifications. A fund's maximum exposure under these arrangements is unknown as this would be dependent on future claims that may be made against a fund. The risk of material loss from such claims is considered remote.
12. Risk and Uncertainties.
Many factors affect a fund's performance. Developments that disrupt global economies and financial markets, such as pandemics, epidemics, outbreaks of infectious diseases, war, terrorism, and environmental disasters, may significantly affect a fund's investment performance. The effects of these developments to a fund will be impacted by the types of securities in which a fund invests, the financial condition, industry, economic sector, and geographic location of an issuer, and a fund's level of investment in the securities of that issuer. Significant concentrations in security types, issuers, industries, sectors, and geographic locations may magnify the factors that affect a fund's performance.
Schedule of Investments October 31, 2024
Showing Percentage of Net Assets
| Common Stocks - 99.3% |
| | | Shares | Value ($) |
| COMMUNICATION SERVICES - 4.2% | | | |
| Entertainment - 0.6% | | | |
| Daiichikosho Co. Ltd. | | 344,300 | 4,302,259 |
| Interactive Media & Services - 1.6% | | | |
| Kakaku.com, Inc. | | 389,000 | 5,973,093 |
| LY Corp. | | 1,807,400 | 4,930,202 |
| | | | 10,903,295 |
| Wireless Telecommunication Services - 2.0% | | | |
| SoftBank Group Corp. | | 228,100 | 13,598,978 |
TOTAL COMMUNICATION SERVICES | | | 28,804,532 |
| CONSUMER DISCRETIONARY - 14.8% | | | |
| Automobile Components - 2.3% | | | |
| DENSO Corp. | | 1,099,700 | 15,619,583 |
| Automobiles - 1.7% | | | |
| Isuzu Motors Ltd. | | 366,800 | 4,743,380 |
| Suzuki Motor Corp. | | 722,100 | 7,165,641 |
| | | | 11,909,021 |
| Broadline Retail - 1.1% | | | |
| Pan Pacific International Holdings Ltd. | | 290,200 | 7,199,369 |
| Hotels, Restaurants & Leisure - 1.6% | | | |
| Curves Holdings Co. Ltd. | | 856,100 | 4,531,262 |
| Kyoritsu Maintenance Co. Ltd. | | 419,600 | 6,736,602 |
| | | | 11,267,864 |
| Household Durables - 5.2% | | | |
| Chervon Holdings Ltd. | | 1,163,900 | 3,065,036 |
| Open House Group Co. Ltd. | | 179,700 | 6,623,984 |
| Sony Group Corp. | | 1,473,000 | 25,921,142 |
| | | | 35,610,162 |
| Leisure Products - 0.5% | | | |
| Roland Corp. | | 145,600 | 3,724,541 |
| Specialty Retail - 2.4% | | | |
| Fast Retailing Co. Ltd. | | 38,400 | 12,277,306 |
| ZOZO, Inc. | | 142,000 | 4,604,416 |
| | | | 16,881,722 |
TOTAL CONSUMER DISCRETIONARY | | | 102,212,262 |
| CONSUMER STAPLES - 3.2% | | | |
| Consumer Staples Distribution & Retail - 1.5% | | | |
| Seven & i Holdings Co. Ltd. | | 327,400 | 4,714,541 |
| Sugi Holdings Co. Ltd. | | 152,100 | 2,596,835 |
| Tsuruha Holdings, Inc. | | 29,100 | 1,627,731 |
| Welcia Holdings Co. Ltd. | | 142,300 | 1,776,456 |
| | | | 10,715,563 |
| Food Products - 0.7% | | | |
| Ajinomoto Co., Inc. | | 127,100 | 4,882,642 |
| Personal Care Products - 1.0% | | | |
| Rohto Pharmaceutical Co. Ltd. | | 300,400 | 6,755,204 |
TOTAL CONSUMER STAPLES | | | 22,353,409 |
| ENERGY - 1.9% | | | |
| Oil, Gas & Consumable Fuels - 1.9% | | | |
| ENEOS Holdings, Inc. | | 840,400 | 4,239,439 |
| INPEX Corp. | | 702,800 | 9,264,349 |
| | | | 13,503,788 |
| FINANCIALS - 13.4% | | | |
| Banks - 7.0% | | | |
| Mizuho Financial Group, Inc. | | 318,200 | 6,609,334 |
| Sumitomo Mitsui Financial Group, Inc. | | 1,960,800 | 41,597,475 |
| | | | 48,206,809 |
| Capital Markets - 0.5% | | | |
| SBI Holdings, Inc. Japan | | 155,200 | 3,408,055 |
| Financial Services - 3.0% | | | |
| ORIX Corp. | | 1,004,900 | 21,173,124 |
| Insurance - 2.9% | | | |
| Lifenet Insurance Co. (a)(b) | | 406,600 | 5,304,241 |
| Tokio Marine Holdings, Inc. | | 419,200 | 15,097,976 |
| | | | 20,402,217 |
TOTAL FINANCIALS | | | 93,190,205 |
| HEALTH CARE - 7.0% | | | |
| Health Care Equipment & Supplies - 3.2% | | | |
| Hoya Corp. | | 168,600 | 22,557,676 |
| Health Care Providers & Services - 0.6% | | | |
| CUC, Inc. (a) | | 302,100 | 3,909,390 |
| Health Care Technology - 0.2% | | | |
| Medlive Technology Co. Ltd. (c) | | 1,008,500 | 1,097,814 |
| Pharmaceuticals - 3.0% | | | |
| Astellas Pharma, Inc. | | 775,900 | 9,084,492 |
| Daiichi Sankyo Co. Ltd. | | 370,500 | 12,059,124 |
| | | | 21,143,616 |
TOTAL HEALTH CARE | | | 48,708,496 |
| INDUSTRIALS - 25.1% | | | |
| Aerospace & Defense - 0.3% | | | |
| Space Exploration Technologies Corp. (a)(d)(e) | | 18,055 | 2,110,991 |
| Electrical Equipment - 3.5% | | | |
| Fuji Electric Co. Ltd. | | 81,900 | 4,170,996 |
| Mitsubishi Electric Corp. | | 642,600 | 11,304,961 |
| Nidec Corp. | | 444,900 | 8,862,774 |
| | | | 24,338,731 |
| Industrial Conglomerates - 5.0% | | | |
| Hitachi Ltd. | | 1,368,100 | 34,373,321 |
| Machinery - 8.5% | | | |
| Ebara Corp. | | 266,900 | 4,011,081 |
| Hoshizaki Corp. | | 128,000 | 4,207,134 |
| IHI Corp. | | 216,500 | 11,526,226 |
| Japan Steel Works Ltd. | | 88,000 | 2,984,860 |
| Kawasaki Heavy Industries Ltd. | | 105,200 | 4,027,933 |
| Misumi Group, Inc. | | 366,160 | 5,959,458 |
| Mitsubishi Heavy Industries Ltd. | | 851,100 | 12,014,938 |
| Nabtesco Corp. | | 155,900 | 2,527,094 |
| SMC Corp. | | 27,400 | 11,632,576 |
| | | | 58,891,300 |
| Professional Services - 6.0% | | | |
| BayCurrent Consulting, Inc. | | 251,800 | 8,183,265 |
| Funai Soken Holdings, Inc. | | 250,200 | 3,982,373 |
| Gakujo Co. Ltd. (b) | | 202,100 | 2,199,403 |
| Persol Holdings Co. Ltd. | | 6,714,800 | 11,277,739 |
| SMS Co., Ltd. | | 238,300 | 2,671,455 |
| TechnoPro Holdings, Inc. | | 466,900 | 8,333,410 |
| Visional, Inc. (a) | | 97,100 | 5,195,733 |
| | | | 41,843,378 |
| Trading Companies & Distributors - 1.8% | | | |
| Itochu Corp. | | 253,000 | 12,515,361 |
TOTAL INDUSTRIALS | | | 174,073,082 |
| INFORMATION TECHNOLOGY - 18.9% | | | |
| Electronic Equipment, Instruments & Components - 6.1% | | | |
| Daiwabo Holdings Co. Ltd. | | 201,100 | 3,620,075 |
| Dexerials Corp. | | 587,400 | 8,968,174 |
| Hamamatsu Photonics K.K. | | 371,600 | 4,913,537 |
| Ibiden Co. Ltd. | | 209,900 | 6,667,412 |
| Murata Manufacturing Co. Ltd. | | 372,800 | 6,513,231 |
| Shibaura Electronics Co. Ltd. | | 136,000 | 3,142,800 |
| Taiyo Yuden Co. Ltd. (b) | | 233,000 | 4,075,113 |
| TDK Corp. | | 370,000 | 4,349,460 |
| | | | 42,249,802 |
| IT Services - 5.5% | | | |
| DTS Corp. | | 185,100 | 4,794,387 |
| ExaWizards, Inc. (a)(b) | | 627,500 | 1,359,965 |
| Fujitsu Ltd. | | 925,000 | 17,783,903 |
| NSD Co. Ltd. | | 373,400 | 8,064,692 |
| Techmatrix Corp. | | 407,600 | 5,916,245 |
| | | | 37,919,192 |
| Semiconductors & Semiconductor Equipment - 4.0% | | | |
| Furuya Metal Co. Ltd. | | 15,600 | 405,038 |
| Renesas Electronics Corp. | | 1,415,800 | 18,969,343 |
| ROHM Co. Ltd. | | 336,400 | 3,708,754 |
| Sumco Corp. | | 476,900 | 4,559,843 |
| | | | 27,642,978 |
| Software - 0.9% | | | |
| Appier Group, Inc. (a) | | 76,600 | 821,448 |
| Money Forward, Inc. (a) | | 165,200 | 5,389,748 |
| | | | 6,211,196 |
| Technology Hardware, Storage & Peripherals - 2.4% | | | |
| FUJIFILM Holdings Corp. | | 701,200 | 16,680,371 |
TOTAL INFORMATION TECHNOLOGY | | | 130,703,539 |
| MATERIALS - 7.8% | | | |
| Chemicals - 7.8% | | | |
| Mitsui Chemicals, Inc. | | 210,000 | 4,797,622 |
| Nippon Sanso Holdings Corp. | | 213,600 | 7,414,486 |
| NOF Corp. | | 335,700 | 5,453,950 |
| Resonac Holdings Corp. | | 240,200 | 5,713,250 |
| Shin-Etsu Chemical Co. Ltd. | | 630,900 | 23,118,677 |
| Tokyo Ohka Kogyo Co. Ltd. | | 213,300 | 4,909,045 |
| Toyo Gosei Co. Ltd. (b) | | 57,900 | 2,699,264 |
| | | | 54,106,294 |
| REAL ESTATE - 1.1% | | | |
| Real Estate Management & Development - 1.1% | | | |
| Relo Group, Inc. | | 612,000 | 7,444,597 |
| UTILITIES - 1.9% | | | |
| Electric Utilities - 1.9% | | | |
| Hokkaido Electric Power Co., Inc. (b) | | 361,600 | 2,326,168 |
| Kansai Electric Power Co., Inc. | | 657,600 | 10,545,984 |
| | | | 12,872,152 |
| TOTAL COMMON STOCKS (Cost $526,051,083) | | | 687,972,356 |
| | | | |
| Money Market Funds - 1.9% |
| | | Shares | Value ($) |
| Fidelity Cash Central Fund 4.87% (f) | | 566,466 | 566,579 |
| Fidelity Securities Lending Cash Central Fund 4.87% (f)(g) | | 13,012,547 | 13,013,849 |
| TOTAL MONEY MARKET FUNDS (Cost $13,580,428) | | | 13,580,428 |
| | | | |
| TOTAL INVESTMENT IN SECURITIES - 101.2% (Cost $539,631,511) | 701,552,784 |
NET OTHER ASSETS (LIABILITIES) - (1.2)% | (8,566,698) |
| NET ASSETS - 100.0% | 692,986,086 |
| | |
Legend
| (b) | Security or a portion of the security is on loan at period end. |
| (c) | Security exempt from registration under Rule 144A of the Securities Act of 1933. These securities may be resold in transactions exempt from registration, normally to qualified institutional buyers. At the end of the period, the value of these securities amounted to $1,097,814 or 0.2% of net assets. |
| (d) | Restricted securities (including private placements) - Investment in securities not registered under the Securities Act of 1933 (excluding 144A issues). At the end of the period, the value of restricted securities (excluding 144A issues) amounted to $2,110,991 or 0.3% of net assets. |
| (f) | Affiliated fund that is generally available only to investment companies and other accounts managed by Fidelity Investments. The rate quoted is the annualized seven-day yield of the fund at period end. A complete unaudited listing of the fund's holdings as of its most recent quarter end is available upon request. In addition, each Fidelity Central Fund's financial statements, which are not covered by the Fund's Report of Independent Registered Public Accounting Firm, are available on the SEC's website or upon request. |
| (g) | Investment made with cash collateral received from securities on loan. |
| Additional information on each restricted holding is as follows: |
| Security | Acquisition Date | Acquisition Cost ($) |
| Space Exploration Technologies Corp. | 2/16/21 - 5/24/22 | 1,151,846 |
| | | |
Affiliated Central Funds
Fiscal year to date information regarding the Fund's investments in Fidelity Central Funds, including the ownership percentage, is presented below.
| Affiliate | Value, beginning of period ($) | Purchases ($) | Sales Proceeds ($) | Dividend Income ($) | Realized Gain (loss) ($) | Change in Unrealized appreciation (depreciation) ($) | Value, end of period ($) | % ownership, end of period |
| Fidelity Cash Central Fund 4.87% | 558,316 | 29,976,357 | 29,968,126 | 38,482 | 32 | - | 566,579 | 0.0% |
| Fidelity Securities Lending Cash Central Fund 4.87% | 13,586,272 | 251,230,968 | 251,803,391 | 238,219 | - | - | 13,013,849 | 0.1% |
| Total | 14,144,588 | 281,207,325 | 281,771,517 | 276,701 | 32 | - | 13,580,428 | |
| | | | | | | | | |
Amounts in the dividend income column in the above table include any capital gain distributions from underlying funds, which are presented in the corresponding line item in the Statement of Operations, if applicable.
Amounts in the dividend income column for Fidelity Securities Lending Cash Central Fund represents the income earned on investing cash collateral, less rebates paid to borrowers and any lending agent fees associated with the loan, plus any premium payments received for lending certain types of securities.
Amounts included in the purchases and sales proceeds columns may include in-kind transactions, if applicable.
Investment Valuation
The following is a summary of the inputs used, as of October 31, 2024, involving the Fund's assets and liabilities carried at fair value. The inputs or methodology used for valuing securities may not be an indication of the risk associated with investing in those securities. For more information on valuation inputs, and their aggregation into the levels used below, please refer to the Investment Valuation section in the accompanying Notes to Financial Statements.
| Valuation Inputs at Reporting Date: |
| Description | Total ($) | Level 1 ($) | Level 2 ($) | Level 3 ($) |
Investments in Securities: | | | | |
|
| Equities: | | | | |
Communication Services | 28,804,532 | - | 28,804,532 | - |
Consumer Discretionary | 102,212,262 | - | 102,212,262 | - |
Consumer Staples | 22,353,409 | - | 22,353,409 | - |
Energy | 13,503,788 | - | 13,503,788 | - |
Financials | 93,190,205 | - | 93,190,205 | - |
Health Care | 48,708,496 | - | 48,708,496 | - |
Industrials | 174,073,082 | - | 171,962,091 | 2,110,991 |
Information Technology | 130,703,539 | - | 130,703,539 | - |
Materials | 54,106,294 | - | 54,106,294 | - |
Real Estate | 7,444,597 | - | 7,444,597 | - |
Utilities | 12,872,152 | - | 12,872,152 | - |
|
| Money Market Funds | 13,580,428 | 13,580,428 | - | - |
| Total Investments in Securities: | 701,552,784 | 13,580,428 | 685,861,365 | 2,110,991 |
Fidelity® Japan Fund
Financial Statements
| Statement of Assets and Liabilities |
As of October 31, 2024 |
| Assets | | | | |
| Investment in securities, at value (including securities loaned of $12,350,857) - See accompanying schedule: | | | | |
Unaffiliated issuers (cost $526,051,083) | $ | 687,972,356 | | |
Fidelity Central Funds (cost $13,580,428) | | 13,580,428 | | |
| | | | | |
| | | | | |
| Total Investment in Securities (cost $539,631,511) | | | $ | 701,552,784 |
| Foreign currency held at value (cost $507) | | | | 512 |
| Receivable for fund shares sold | | | | 32,149 |
| Dividends receivable | | | | 4,837,438 |
| Distributions receivable from Fidelity Central Funds | | | | 15,256 |
| Prepaid expenses | | | | 814 |
| Other receivables | | | | 48,614 |
Total assets | | | | 706,487,567 |
| Liabilities | | | | |
| Payable for fund shares redeemed | $ | 70,464 | | |
| Accrued management fee | | 339,841 | | |
| Distribution and service plan fees payable | | 6,582 | | |
| Other payables and accrued expenses | | 70,745 | | |
| Collateral on securities loaned | | 13,013,849 | | |
| Total liabilities | | | | 13,501,481 |
| Net Assets | | | $ | 692,986,086 |
| Net Assets consist of: | | | | |
| Paid in capital | | | $ | 513,841,405 |
| Total accumulated earnings (loss) | | | | 179,144,681 |
| Net Assets | | | $ | 692,986,086 |
| | | | | |
| Net Asset Value and Maximum Offering Price | | | | |
| Class A : | | | | |
Net Asset Value and redemption price per share ($16,922,109 ÷ 975,981 shares)(a) | | | $ | 17.34 |
| Maximum offering price per share (100/94.25 of $17.34) | | | $ | 18.40 |
| Class M : | | | | |
Net Asset Value and redemption price per share ($2,846,947 ÷ 165,436 shares)(a) | | | $ | 17.21 |
| Maximum offering price per share (100/96.50 of $17.21) | | | $ | 17.83 |
| Class C : | | | | |
Net Asset Value and offering price per share ($1,967,305 ÷ 116,842 shares)(a) | | | $ | 16.84 |
| Japan : | | | | |
Net Asset Value, offering price and redemption price per share ($176,868,571 ÷ 10,104,998 shares) | | | $ | 17.50 |
| Class I : | | | | |
Net Asset Value, offering price and redemption price per share ($18,555,301 ÷ 1,051,703 shares) | | | $ | 17.64 |
| Class Z : | | | | |
Net Asset Value, offering price and redemption price per share ($475,825,853 ÷ 27,232,364 shares) | | | $ | 17.47 |
(a)Redemption price per share is equal to net asset value less any applicable contingent deferred sales charge. |
| Statement of Operations |
| Year ended October 31, 2024 |
| Investment Income | | | | |
| Dividends | | | $ | 13,600,303 |
| Income from Fidelity Central Funds (including $238,219 from security lending) | | | | 276,701 |
| Income before foreign taxes withheld | | | $ | 13,877,004 |
| Less foreign taxes withheld | | | | (1,351,185) |
| Total income | | | | 12,525,819 |
| Expenses | | | | |
| Management fee | | | | |
| Basic fee | $ | 4,904,142 | | |
| Performance adjustment | | (1,353,215) | | |
| Transfer agent fees | | 201,076 | | |
| Distribution and service plan fees | | 78,731 | | |
| Accounting fees | | 99,064 | | |
| Custodian fees and expenses | | 37,569 | | |
| Independent trustees' fees and expenses | | 3,032 | | |
| Registration fees | | 94,974 | | |
| Audit fees | | 67,850 | | |
| Legal | | 461 | | |
| Interest | | 38,788 | | |
| Miscellaneous | | 8,693 | | |
| Total expenses before reductions | | 4,181,165 | | |
| Expense reductions | | (28,574) | | |
| Total expenses after reductions | | | | 4,152,591 |
| Net Investment income (loss) | | | | 8,373,228 |
| Realized and Unrealized Gain (Loss) | | | | |
| Net realized gain (loss) on: | | | | |
| Investment Securities: | | | | |
| Unaffiliated issuers | | 16,526,237 | | |
| Fidelity Central Funds | | 32 | | |
| Foreign currency transactions | | (444,348) | | |
| Total net realized gain (loss) | | | | 16,081,921 |
| Change in net unrealized appreciation (depreciation) on: | | | | |
| Investment Securities: | | | | |
| Unaffiliated issuers | | 113,752,284 | | |
| Assets and liabilities in foreign currencies | | (227,213) | | |
| Total change in net unrealized appreciation (depreciation) | | | | 113,525,071 |
| Net gain (loss) | | | | 129,606,992 |
| Net increase (decrease) in net assets resulting from operations | | | $ | 137,980,220 |
| Statement of Changes in Net Assets |
| |
| | Year ended October 31, 2024 | | Year ended October 31, 2023 |
| Increase (Decrease) in Net Assets | | | | |
| Operations | | | | |
| Net investment income (loss) | $ | 8,373,228 | $ | 6,921,452 |
| Net realized gain (loss) | | 16,081,921 | | 32,280,933 |
| Change in net unrealized appreciation (depreciation) | | 113,525,071 | | 14,095,560 |
| Net increase (decrease) in net assets resulting from operations | | 137,980,220 | | 53,297,945 |
| Distributions to shareholders | | (23,847,306) | | - |
| | | | | |
| Share transactions - net increase (decrease) | | (53,403,809) | | 6,725,873 |
| | | | | |
| Total increase (decrease) in net assets | | 60,729,105 | | 60,023,818 |
| | | | | |
| Net Assets | | | | |
| Beginning of period | | 632,256,981 | | 572,233,163 |
| End of period | $ | 692,986,086 | $ | 632,256,981 |
| | | | | |
| | | | | |
Financial Highlights
Fidelity Advisor® Japan Fund Class A |
| |
| Years ended October 31, | | 2024 | | 2023 | | 2022 | | 2021 | | 2020 |
Selected Per-Share Data | | | | | | | | | | |
| Net asset value, beginning of period | $ | 14.56 | $ | 13.26 | $ | 20.90 | $ | 17.50 | $ | 15.80 |
| Income from Investment Operations | | | | | | | | | | |
Net investment income (loss) A,B | | .15 | | .11 | | .04 | | .02 | | .05 |
| Net realized and unrealized gain (loss) | | 3.18 | | 1.19 | | (5.58) | | 3.71 | | 1.81 |
| Total from investment operations | | 3.33 | | 1.30 | | (5.54) | | 3.73 | | 1.86 |
| Distributions from net investment income | | (.09) | | - | | (.55) | | (.07) | | (.07) |
| Distributions from net realized gain | | (.46) | | - | | (1.55) | | (.25) | | (.09) |
| Total distributions | | (.55) | | - | | (2.10) | | (.33) C | | (.16) |
| Net asset value, end of period | $ | 17.34 | $ | 14.56 | $ | 13.26 | $ | 20.90 | $ | 17.50 |
Total Return D,E | | | | 9.80% | | (29.38)% | | 21.42% | | 11.85% |
Ratios to Average Net Assets B,F,G | | | | | | | | | | |
| Expenses before reductions | | .97% | | 1.22% | | 1.39% | | 1.38% | | 1.37% |
| Expenses net of fee waivers, if any | | | | 1.22% | | 1.39% | | 1.38% | | 1.37% |
| Expenses net of all reductions | | .97% | | 1.21% | | 1.39% | | 1.38% | | 1.37% |
| Net investment income (loss) | | .90% | | .69% | | .26% | | .08% | | .35% |
| Supplemental Data | | | | | | | | | | |
| Net assets, end of period (000 omitted) | $ | 16,922 | $ | 15,764 | $ | 13,004 | $ | 20,357 | $ | 16,181 |
Portfolio turnover rate H | | | | 25% | | 26% | | 31% | | 22% |
ACalculated based on average shares outstanding during the period.
BNet investment income (loss) is affected by the timing of the declaration of dividends by any underlying mutual funds or exchange-traded funds (ETFs). Net investment income (loss) of any mutual funds or ETFs is not included in the Fund's net investment income (loss) ratio.
CTotal distributions per share do not sum due to rounding.
DTotal returns would have been lower if certain expenses had not been reduced during the applicable periods shown.
ETotal returns do not include the effect of the sales charges.
FFees and expenses of any underlying mutual funds or exchange-traded funds (ETFs) are not included in the Fund's expense ratio. The Fund indirectly bears its proportionate share of these expenses. For additional expense information related to investments in Fidelity Central Funds, please refer to the "Investments in Fidelity Central Funds" note found in the Notes to Financial Statements section of the most recent Annual or Semi-Annual report.
GExpense ratios reflect operating expenses of the class. Expenses before reductions do not reflect amounts reimbursed, waived, or reduced through arrangements with the investment adviser, brokerage services, or other offset arrangements, if applicable, and do not represent the amount paid by the class during periods when reimbursements, waivers or reductions occur.
HAmount does not include the portfolio activity of any underlying mutual funds or exchange-traded funds (ETFs).
Fidelity Advisor® Japan Fund Class M |
| |
| Years ended October 31, | | 2024 | | 2023 | | 2022 | | 2021 | | 2020 |
Selected Per-Share Data | | | | | | | | | | |
| Net asset value, beginning of period | $ | 14.44 | $ | 13.19 | $ | 20.76 | $ | 17.40 | $ | 15.71 |
| Income from Investment Operations | | | | | | | | | | |
Net investment income (loss) A,B | | .11 | | .06 | | (.01) | | (.05) | | .01 |
| Net realized and unrealized gain (loss) | | 3.16 | | 1.19 | | (5.55) | | 3.69 | | 1.80 |
| Total from investment operations | | 3.27 | | 1.25 | | (5.56) | | 3.64 | | 1.81 |
| Distributions from net investment income | | (.04) | | - | | (.46) | | (.02) | | (.03) |
| Distributions from net realized gain | | (.46) | | - | | (1.55) | | (.25) | | (.09) |
| Total distributions | | (.50) | | - | | (2.01) | | (.28) C | | (.12) |
| Net asset value, end of period | $ | 17.21 | $ | 14.44 | $ | 13.19 | $ | 20.76 | $ | 17.40 |
Total Return D,E | | | | 9.48% | | (29.55)% | | 21.00% | | 11.55% |
Ratios to Average Net Assets B,F,G | | | | | | | | | | |
| Expenses before reductions | | 1.22% | | 1.51% | | 1.69% | | 1.70% | | 1.67% |
| Expenses net of fee waivers, if any | | | | 1.50% | | 1.69% | | 1.70% | | 1.67% |
| Expenses net of all reductions | | 1.21% | | 1.49% | | 1.69% | | 1.70% | | 1.67% |
| Net investment income (loss) | | .65% | | .42% | | (.04)% | | (.23)% | | .04% |
| Supplemental Data | | | | | | | | | | |
| Net assets, end of period (000 omitted) | $ | 2,847 | $ | 2,354 | $ | 2,282 | $ | 3,919 | $ | 3,728 |
Portfolio turnover rate H | | | | 25% | | 26% | | 31% | | 22% |
ACalculated based on average shares outstanding during the period.
BNet investment income (loss) is affected by the timing of the declaration of dividends by any underlying mutual funds or exchange-traded funds (ETFs). Net investment income (loss) of any mutual funds or ETFs is not included in the Fund's net investment income (loss) ratio.
CTotal distributions per share do not sum due to rounding.
DTotal returns would have been lower if certain expenses had not been reduced during the applicable periods shown.
ETotal returns do not include the effect of the sales charges.
FFees and expenses of any underlying mutual funds or exchange-traded funds (ETFs) are not included in the Fund's expense ratio. The Fund indirectly bears its proportionate share of these expenses. For additional expense information related to investments in Fidelity Central Funds, please refer to the "Investments in Fidelity Central Funds" note found in the Notes to Financial Statements section of the most recent Annual or Semi-Annual report.
GExpense ratios reflect operating expenses of the class. Expenses before reductions do not reflect amounts reimbursed, waived, or reduced through arrangements with the investment adviser, brokerage services, or other offset arrangements, if applicable, and do not represent the amount paid by the class during periods when reimbursements, waivers or reductions occur.
HAmount does not include the portfolio activity of any underlying mutual funds or exchange-traded funds (ETFs).
Fidelity Advisor® Japan Fund Class C |
| |
| Years ended October 31, | | 2024 | | 2023 | | 2022 | | 2021 | | 2020 |
Selected Per-Share Data | | | | | | | | | | |
| Net asset value, beginning of period | $ | 14.17 | $ | 13.00 | $ | 20.43 | $ | 17.17 | $ | 15.49 |
| Income from Investment Operations | | | | | | | | | | |
Net investment income (loss) A,B | | .03 | | - C | | (.07) | | (.12) | | (.05) |
| Net realized and unrealized gain (loss) | | 3.10 | | 1.17 | | (5.49) | | 3.63 | | 1.77 |
| Total from investment operations | | 3.13 | | 1.17 | | (5.56) | | 3.51 | | 1.72 |
| Distributions from net investment income | | - | | - | | (.33) | | (.01) | | - |
| Distributions from net realized gain | | (.46) | | - | | (1.55) | | (.25) | | (.04) |
| Total distributions | | (.46) | | - | | (1.87) D | | (.25) D | | (.04) |
| Net asset value, end of period | $ | 16.84 | $ | 14.17 | $ | 13.00 | $ | 20.43 | $ | 17.17 |
Total Return E,F | | | | 9.00% | | (29.85)% | | 20.54% | | 11.09% |
Ratios to Average Net Assets B,G,H | | | | | | | | | | |
| Expenses before reductions | | 1.71% | | 1.94% | | 2.11% | | 2.09% | | 2.06% |
| Expenses net of fee waivers, if any | | | | 1.93% | | 2.10% | | 2.09% | | 2.05% |
| Expenses net of all reductions | | 1.70% | | 1.93% | | 2.10% | | 2.09% | | 2.05% |
| Net investment income (loss) | | .16% | | (.02)% | | (.46)% | | (.63)% | | (.34)% |
| Supplemental Data | | | | | | | | | | |
| Net assets, end of period (000 omitted) | $ | 1,967 | $ | 1,779 | $ | 2,179 | $ | 4,778 | $ | 6,167 |
Portfolio turnover rate I | | | | 25% | | 26% | | 31% | | 22% |
ACalculated based on average shares outstanding during the period.
BNet investment income (loss) is affected by the timing of the declaration of dividends by any underlying mutual funds or exchange-traded funds (ETFs). Net investment income (loss) of any mutual funds or ETFs is not included in the Fund's net investment income (loss) ratio.
CAmount represents less than $.005 per share.
DTotal distributions per share do not sum due to rounding.
ETotal returns would have been lower if certain expenses had not been reduced during the applicable periods shown.
FTotal returns do not include the effect of the contingent deferred sales charge.
GFees and expenses of any underlying mutual funds or exchange-traded funds (ETFs) are not included in the Fund's expense ratio. The Fund indirectly bears its proportionate share of these expenses. For additional expense information related to investments in Fidelity Central Funds, please refer to the "Investments in Fidelity Central Funds" note found in the Notes to Financial Statements section of the most recent Annual or Semi-Annual report.
HExpense ratios reflect operating expenses of the class. Expenses before reductions do not reflect amounts reimbursed, waived, or reduced through arrangements with the investment adviser, brokerage services, or other offset arrangements, if applicable, and do not represent the amount paid by the class during periods when reimbursements, waivers or reductions occur.
IAmount does not include the portfolio activity of any underlying mutual funds or exchange-traded funds (ETFs).
| Years ended October 31, | | 2024 | | 2023 | | 2022 | | 2021 | | 2020 |
Selected Per-Share Data | | | | | | | | | | |
| Net asset value, beginning of period | $ | 14.69 | $ | 13.35 | $ | 21.01 | $ | 17.58 | $ | 15.86 |
| Income from Investment Operations | | | | | | | | | | |
Net investment income (loss) A,B | | .20 | | .15 | | .08 | | .08 | | .10 |
| Net realized and unrealized gain (loss) | | 3.21 | | 1.19 | | (5.60) | | 3.72 | | 1.81 |
| Total from investment operations | | 3.41 | | 1.34 | | (5.52) | | 3.80 | | 1.91 |
| Distributions from net investment income | | (.14) | | - | | (.59) | | (.11) | | (.11) |
| Distributions from net realized gain | | (.46) | | - | | (1.55) | | (.25) | | (.09) |
| Total distributions | | (.60) | | - | | (2.14) | | (.37) C | | (.19) C |
| Net asset value, end of period | $ | 17.50 | $ | 14.69 | $ | 13.35 | $ | 21.01 | $ | 17.58 |
Total Return D | | | | 10.04% | | (29.16)% | | 21.75% | | 12.16% |
Ratios to Average Net Assets B,E,F | | | | | | | | | | |
| Expenses before reductions | | .69% | | .96% | | 1.13% | | 1.09% | | 1.06% |
| Expenses net of fee waivers, if any | | | | .95% | | 1.12% | | 1.09% | | 1.06% |
| Expenses net of all reductions | | .68% | | .95% | | 1.12% | | 1.09% | | 1.06% |
| Net investment income (loss) | | 1.18% | | .96% | | .52% | | .37% | | .65% |
| Supplemental Data | | | | | | | | | | |
| Net assets, end of period (000 omitted) | $ | 176,869 | $ | 149,990 | $ | 113,015 | $ | 167,954 | $ | 274,433 |
Portfolio turnover rate G | | | | 25% | | 26% | | 31% | | 22% |
ACalculated based on average shares outstanding during the period.
BNet investment income (loss) is affected by the timing of the declaration of dividends by any underlying mutual funds or exchange-traded funds (ETFs). Net investment income (loss) of any mutual funds or ETFs is not included in the Fund's net investment income (loss) ratio.
CTotal distributions per share do not sum due to rounding.
DTotal returns would have been lower if certain expenses had not been reduced during the applicable periods shown.
EFees and expenses of any underlying mutual funds or exchange-traded funds (ETFs) are not included in the Fund's expense ratio. The Fund indirectly bears its proportionate share of these expenses. For additional expense information related to investments in Fidelity Central Funds, please refer to the "Investments in Fidelity Central Funds" note found in the Notes to Financial Statements section of the most recent Annual or Semi-Annual report.
FExpense ratios reflect operating expenses of the class. Expenses before reductions do not reflect amounts reimbursed, waived, or reduced through arrangements with the investment adviser, brokerage services, or other offset arrangements, if applicable, and do not represent the amount paid by the class during periods when reimbursements, waivers or reductions occur.
GAmount does not include the portfolio activity of any underlying mutual funds or exchange-traded funds (ETFs).
Fidelity Advisor® Japan Fund Class I |
| |
| Years ended October 31, | | 2024 | | 2023 | | 2022 | | 2021 | | 2020 |
Selected Per-Share Data | | | | | | | | | | |
| Net asset value, beginning of period | $ | 14.81 | $ | 13.45 | $ | 20.97 | $ | 17.56 | $ | 15.85 |
| Income from Investment Operations | | | | | | | | | | |
Net investment income (loss) A,B | | .19 | | .15 | | .09 | | .09 | | .11 |
| Net realized and unrealized gain (loss) | | 3.24 | | 1.21 | | (5.65) | | 3.71 | | 1.81 |
| Total from investment operations | | 3.43 | | 1.36 | | (5.56) | | 3.80 | | 1.92 |
| Distributions from net investment income | | (.14) | | - | | (.41) | | (.14) | | (.12) |
| Distributions from net realized gain | | (.46) | | - | | (1.55) | | (.25) | | (.09) |
| Total distributions | | (.60) | | - | | (1.96) | | (.39) | | (.21) |
| Net asset value, end of period | $ | 17.64 | $ | 14.81 | $ | 13.45 | $ | 20.97 | $ | 17.56 |
Total Return C | | | | 10.11% | | (29.15)% | | 21.80% | | 12.20% |
Ratios to Average Net Assets B,D,E | | | | | | | | | | |
| Expenses before reductions | | .72% | | .94% | | 1.09% | | 1.04% | | 1.01% |
| Expenses net of fee waivers, if any | | | | .94% | | 1.09% | | 1.04% | | 1.01% |
| Expenses net of all reductions | | .72% | | .94% | | 1.09% | | 1.04% | | 1.00% |
| Net investment income (loss) | | 1.15% | | .97% | | .56% | | .43% | | .71% |
| Supplemental Data | | | | | | | | | | |
| Net assets, end of period (000 omitted) | $ | 18,555 | $ | 32,712 | $ | 33,320 | $ | 48,887 | $ | 473,859 |
Portfolio turnover rate F | | | | 25% | | 26% | | 31% | | 22% |
ACalculated based on average shares outstanding during the period.
BNet investment income (loss) is affected by the timing of the declaration of dividends by any underlying mutual funds or exchange-traded funds (ETFs). Net investment income (loss) of any mutual funds or ETFs is not included in the Fund's net investment income (loss) ratio.
CTotal returns would have been lower if certain expenses had not been reduced during the applicable periods shown.
DFees and expenses of any underlying mutual funds or exchange-traded funds (ETFs) are not included in the Fund's expense ratio. The Fund indirectly bears its proportionate share of these expenses. For additional expense information related to investments in Fidelity Central Funds, please refer to the "Investments in Fidelity Central Funds" note found in the Notes to Financial Statements section of the most recent Annual or Semi-Annual report.
EExpense ratios reflect operating expenses of the class. Expenses before reductions do not reflect amounts reimbursed, waived, or reduced through arrangements with the investment adviser, brokerage services, or other offset arrangements, if applicable, and do not represent the amount paid by the class during periods when reimbursements, waivers or reductions occur.
FAmount does not include the portfolio activity of any underlying mutual funds or exchange-traded funds (ETFs).
Fidelity Advisor® Japan Fund Class Z |
| |
| Years ended October 31, | | 2024 | | 2023 | | 2022 | | 2021 | | 2020 |
Selected Per-Share Data | | | | | | | | | | |
| Net asset value, beginning of period | $ | 14.68 | $ | 13.31 | $ | 20.98 | $ | 17.56 | $ | 15.84 |
| Income from Investment Operations | | | | | | | | | | |
Net investment income (loss) A,B | | .22 | | .17 | | .11 | | .10 | | .13 |
| Net realized and unrealized gain (loss) | | 3.19 | | 1.20 | | (5.59) | | 3.72 | | 1.81 |
| Total from investment operations | | 3.41 | | 1.37 | | (5.48) | | 3.82 | | 1.94 |
| Distributions from net investment income | | (.16) | | - | | (.64) | | (.15) | | (.13) |
| Distributions from net realized gain | | (.46) | | - | | (1.55) | | (.25) | | (.09) |
| Total distributions | | (.62) | | - | | (2.19) | | (.40) | | (.22) |
| Net asset value, end of period | $ | 17.47 | $ | 14.68 | $ | 13.31 | $ | 20.98 | $ | 17.56 |
Total Return C | | | | 10.29% | | (29.07)% | | 21.93% | | 12.36% |
Ratios to Average Net Assets B,D,E | | | | | | | | | | |
| Expenses before reductions | | .57% | | .80% | | .96% | | .96% | | .92% |
| Expenses net of fee waivers, if any | | | | .79% | | .96% | | .96% | | .92% |
| Expenses net of all reductions | | .56% | | .79% | | .96% | | .96% | | .92% |
| Net investment income (loss) | | 1.30% | | 1.12% | | .69% | | .51% | | .79% |
| Supplemental Data | | | | | | | | | | |
| Net assets, end of period (000 omitted) | $ | 475,826 | $ | 429,659 | $ | 408,434 | $ | 585,487 | $ | 8,368 |
Portfolio turnover rate F | | | | 25% | | 26% | | 31% | | 22% |
ACalculated based on average shares outstanding during the period.
BNet investment income (loss) is affected by the timing of the declaration of dividends by any underlying mutual funds or exchange-traded funds (ETFs). Net investment income (loss) of any mutual funds or ETFs is not included in the Fund's net investment income (loss) ratio.
CTotal returns would have been lower if certain expenses had not been reduced during the applicable periods shown.
DFees and expenses of any underlying mutual funds or exchange-traded funds (ETFs) are not included in the Fund's expense ratio. The Fund indirectly bears its proportionate share of these expenses. For additional expense information related to investments in Fidelity Central Funds, please refer to the "Investments in Fidelity Central Funds" note found in the Notes to Financial Statements section of the most recent Annual or Semi-Annual report.
EExpense ratios reflect operating expenses of the class. Expenses before reductions do not reflect amounts reimbursed, waived, or reduced through arrangements with the investment adviser, brokerage services, or other offset arrangements, if applicable, and do not represent the amount paid by the class during periods when reimbursements, waivers or reductions occur.
FAmount does not include the portfolio activity of any underlying mutual funds or exchange-traded funds (ETFs).
Notes to Financial Statements
For the period ended October 31, 2024
1. Organization.
Fidelity Japan Fund (the Fund) is a fund of Fidelity Investment Trust (the Trust) and is authorized to issue an unlimited number of shares. The Trust is registered under the Investment Company Act of 1940, as amended (the 1940 Act), as an open-end management investment company organized as a Massachusetts business trust. The Fund offers Class A, Class M, Class C, Japan, Class I and Class Z shares, each of which has equal rights as to assets and voting privileges. Class A, Class M, Class C, Class I and Class Z are Fidelity Advisor classes. Each class has exclusive voting rights with respect to matters that affect that class. Class C shares will automatically convert to Class A shares after a holding period of eight years from the initial date of purchase, with certain exceptions.
2. Investments in Fidelity Central Funds.
Funds may invest in Fidelity Central Funds, which are open-end investment companies generally available only to other investment companies and accounts managed by the investment adviser and its affiliates. The Schedule of Investments lists any Fidelity Central Funds held as an investment as of period end, but does not include the underlying holdings of each Fidelity Central Fund. An investing fund indirectly bears its proportionate share of the expenses of the underlying Fidelity Central Funds.
Based on its investment objective, each Fidelity Central Fund may invest or participate in various investment vehicles or strategies that are similar to those of the investing fund. These strategies are consistent with the investment objectives of the investing fund and may involve certain economic risks which may cause a decline in value of each of the Fidelity Central Funds and thus a decline in the value of the investing fund.
| Fidelity Central Fund | Investment Manager | Investment Objective | Investment Practices | Expense RatioA |
| Fidelity Money Market Central Funds | Fidelity Management & Research Company LLC (FMR) | Each fund seeks to obtain a high level of current income consistent with the preservation of capital and liquidity. | Short-term Investments | Less than .005% |
A Expenses expressed as a percentage of average net assets and are as of each underlying Central Fund's most recent annual or semi-annual shareholder report.
A complete unaudited list of holdings for each Fidelity Central Fund is available upon request or at the Securities and Exchange Commission website at www.sec.gov. In addition, the financial statements of the Fidelity Central Funds which contain the significant accounting policies (including investment valuation policies) of those funds, and are not covered by the Report of Independent Registered Public Accounting Firm, are available on the Securities and Exchange Commission website or upon request.
3. Significant Accounting Policies.
The Fund is an investment company and applies the accounting and reporting guidance of the Financial Accounting Standards Board (FASB) Accounting Standards Codification Topic 946 Financial Services - Investment Companies. The financial statements have been prepared in conformity with accounting principles generally accepted in the United States of America (GAAP), which require management to make certain estimates and assumptions at the date of the financial statements. Actual results could differ from those estimates. Subsequent events, if any, through the date that the financial statements were issued have been evaluated in the preparation of the financial statements. The Fund's Schedule of Investments lists any underlying mutual funds or exchange-traded funds (ETFs) but does not include the underlying holdings of these funds. The following summarizes the significant accounting policies of the Fund:
Investment Valuation. Investments are valued as of 4:00 p.m. Eastern time on the last calendar day of the period. The Board of Trustees (the Board) has designated the Fund's investment adviser as the valuation designee responsible for the fair valuation function and performing fair value determinations as needed. The investment adviser has established a Fair Value Committee (the Committee) to carry out the day-to-day fair valuation responsibilities and has adopted policies and procedures to govern the fair valuation process and the activities of the Committee. In accordance with these fair valuation policies and procedures, which have been approved by the Board, the Fund attempts to obtain prices from one or more third party pricing services or brokers to value its investments. When current market prices, quotations or currency exchange rates are not readily available or reliable, investments will be fair valued in good faith by the Committee, in accordance with the policies and procedures. Factors used in determining fair value vary by investment type and may include market or investment specific events, transaction data, estimated cash flows, and market observations of comparable investments. The frequency that the fair valuation procedures are used cannot be predicted and they may be utilized to a significant extent. The Committee manages the Fund's fair valuation practices and maintains the fair valuation policies and procedures. The Fund's investment adviser reports to the Board information regarding the fair valuation process and related material matters.
The Fund categorizes the inputs to valuation techniques used to value its investments into a disclosure hierarchy consisting of three levels as shown below:
Level 1 - unadjusted quoted prices in active markets for identical investments
Level 2 - other significant observable inputs (including quoted prices for similar investments, interest rates, prepayment speeds, etc.)
Level 3 - unobservable inputs (including the Fund's own assumptions based on the best information available)
Valuation techniques used to value the Fund's investments by major category are as follows:
Equity securities, including restricted securities, for which market quotations are readily available, are valued at the last reported sale price or official closing price as reported by a third party pricing service on the primary market or exchange on which they are traded and are categorized as Level 1 in the hierarchy. In the event there were no sales during the day or closing prices are not available, securities are valued at the last quoted bid price or may be valued using the last available price and are generally categorized as Level 2 in the hierarchy. For foreign equity securities, when market or security specific events arise, comparisons to the valuation of American Depositary Receipts (ADRs), futures contracts, Exchange-Traded Funds (ETFs) and certain indexes as well as quoted prices for similar securities may be used and would be categorized as Level 2 in the hierarchy. For equity securities, including restricted securities, where observable inputs are limited, assumptions about market activity and risk are used and these securities may be categorized as Level 3 in the hierarchy.
Investments in open-end mutual funds, including the Fidelity Central Funds, are valued at their closing net asset value (NAV) each business day and are categorized as Level 1 in the hierarchy.
Changes in valuation techniques may result in transfers in or out of an assigned level within the disclosure hierarchy. The aggregate value of investments by input level as of October 31, 2024 is included at the end of the Fund's Schedule of Investments.
Foreign Currency. Certain Funds may use foreign currency contracts to facilitate transactions in foreign-denominated securities. Gains and losses from these transactions may arise from changes in the value of the foreign currency or if the counterparties do not perform under the contracts' terms.
Foreign-denominated assets, including investment securities, and liabilities are translated into U.S. dollars at the exchange rates at period end. Purchases and sales of investment securities, income and dividends received, and expenses denominated in foreign currencies are translated into U.S. dollars at the exchange rate in effect on the transaction date.
The effects of exchange rate fluctuations on investments are included with the net realized and unrealized gain (loss) on investment securities. Other foreign currency transactions resulting in realized and unrealized gain (loss) are disclosed separately.
Investment Transactions and Income. For financial reporting purposes, the Fund's investment holdings and NAV include trades executed through the end of the last business day of the period. The NAV per share for processing shareholder transactions is calculated as of the close of business of the New York Stock Exchange (NYSE), normally 4:00 p.m. Eastern time and includes trades executed through the end of the prior business day. Gains and losses on securities sold are determined on the basis of identified cost and include proceeds received from litigation. Commissions paid to certain brokers with whom the investment adviser, or its affiliates, places trades on behalf of a fund include an amount in addition to trade execution, which may be rebated back to a fund. Any such rebates are included in net realized gain (loss) on investments in the Statement of Operations. Dividend income is recorded on the ex-dividend date, except for certain dividends from foreign securities where the ex-dividend date may have passed, which are recorded as soon as the Fund is informed of the ex-dividend date. Non-cash dividends included in dividend income, if any, are recorded at the fair market value of the securities received. Income and capital gain distributions from Fidelity Central Funds, if any, are recorded on the ex-dividend date. Investment income is recorded net of foreign taxes withheld where recovery of such taxes is uncertain.
Class Allocations and Expenses. Investment income, realized and unrealized capital gains and losses, common expenses of a fund, and certain fund-level expense reductions, if any, are allocated daily on a pro-rata basis to each class based on the relative net assets of each class to the total net assets of a fund. Each class differs with respect to transfer agent and distribution and service plan fees incurred, as applicable. Certain expense reductions may also differ by class, if applicable. For the reporting period, the allocated portion of income and expenses to each class as a percent of its average net assets may vary due to the timing of recording these transactions in relation to fluctuating net assets of the classes. Expenses directly attributable to a fund are charged to that fund. Expenses attributable to more than one fund are allocated among the respective funds on the basis of relative net assets or other appropriate methods. Expenses included in the accompanying financial statements reflect the expenses of that fund and do not include any expenses associated with any underlying mutual funds or exchange-traded funds (ETFs). Although not included in a fund's expenses, a fund indirectly bears its proportionate share of these expenses through the net asset value of each underlying mutual fund or exchange-traded fund (ETF). Expense estimates are accrued in the period to which they relate and adjustments are made when actual amounts are known.
Income Tax Information and Distributions to Shareholders. Each year, the Fund intends to qualify as a regulated investment company under Subchapter M of the Internal Revenue Code, including distributing substantially all of its taxable income and realized gains. As a result, no provision for U.S. Federal income taxes is required. As of October 31, 2024, the Fund did not have any unrecognized tax benefits in the financial statements; nor is the Fund aware of any tax positions for which it is reasonably possible that the total amounts of unrecognized tax benefits will significantly change in the next twelve months. The Fund files a U.S. federal tax return, in addition to state and local tax returns as required. The Fund's federal income tax returns are subject to examination by the Internal Revenue Service (IRS) for a period of three fiscal years after they are filed. State and local tax returns may be subject to examination for an additional fiscal year depending on the jurisdiction. Foreign taxes are provided for based on the Fund's understanding of the tax rules and rates that exist in the foreign markets in which it invests.
Distributions are declared and recorded on the ex-dividend date. Income and capital gain distributions are declared separately for each class. Income and capital gain distributions are determined in accordance with income tax regulations, which may differ from GAAP.
Capital accounts within the financial statements are adjusted for permanent book-tax differences. These adjustments have no impact on net assets or the results of operations. Capital accounts are not adjusted for temporary book-tax differences which will reverse in a subsequent period.
Book-tax differences are primarily due to foreign currency transactions, passive foreign investment companies (PFIC) and losses deferred due to wash sales.
As of period end, the cost and unrealized appreciation (depreciation) in securities, and derivatives if applicable, for federal income tax purposes were as follows:
| Gross unrealized appreciation | $206,040,174 |
| Gross unrealized depreciation | (58,182,976) |
| Net unrealized appreciation (depreciation) | $147,857,198 |
| Tax Cost | $553,695,586 |
The tax-based components of distributable earnings as of period end were as follows:
| Undistributed ordinary income | $20,482,871 |
| Undistributed long-term capital gain | $11,121,461 |
| Net unrealized appreciation (depreciation) on securities and other investments | $147,540,351 |
The tax character of distributions paid was as follows:
| | October 31, 2024 | October 31, 2023 |
| Ordinary Income | $5,853,517 | $- |
| Long-term Capital Gains | 17,993,789 | - |
| Total | $23,847,306 | $- |
Restricted Securities (including Private Placements). Funds may invest in securities that are subject to legal or contractual restrictions on resale. These securities generally may be resold in transactions exempt from registration or to the public if the securities are registered. Disposal of these securities may involve time-consuming negotiations and expense, and prompt sale at an acceptable price may be difficult. Information regarding restricted securities held at period end is included at the end of the Schedule of Investments, if applicable.
New Accounting Pronouncement. In November 2023, the FASB issued Accounting Standards Update (ASU) 2023-07 Segment Reporting (Topic 280): Improvements to Reportable Segment Disclosures. Effective for fiscal years beginning after December 15, 2023 and interim periods within fiscal years beginning after December 15, 2024, the amendments enhance required disclosures of segment information for public entities on an annual and interim basis. The ASU allows for early adoption with updates applied retrospectively. Management is currently evaluating the impact of the ASU but does not expect this guidance to materially impact the financial statements.
4. Purchases and Sales of Investments.
Purchases and sales of securities, other than short-term securities and in-kind transactions, as applicable, are noted in the table below.
| | Purchases ($) | Sales ($) |
| Fidelity Japan Fund | 137,113,352 | 205,755,077 |
5. Fees and Other Transactions with Affiliates.
Management Fee. Fidelity Management & Research Company LLC (the investment adviser) and its affiliates provide the Fund with investment management related services for which the Fund pays a monthly management fee.
Effective March 1, 2024, the Fund's management contract was amended to incorporate administrative services previously covered under separate services agreements (Transfer Agent and Accounting agreements). The amended contract incorporates a basic fee rate that may vary by class (subject to a performance adjustment). The investment adviser or an affiliate pays certain expenses of managing and operating the Fund out of each class's management fee. Each class of the Fund pays a management fee to the investment adviser. The management fee is calculated and paid to the investment adviser every month. The management fee is determined by calculating a basic fee and then applying a performance adjustment. When determining a class's basic fee, a mandate rate is calculated based on the monthly average net assets of a group of funds advised by FMR within a designated asset class. A discount rate is subtracted from the mandate rate once the Fund's monthly average net assets reach a certain level. The mandate rate and discount rate may vary by class. The annual basic fee rate for a class of shares of the Fund is the lesser of (1) the class's mandate rate reduced by the class's discount rate (if applicable) or (2) the amount set forth in the following table.
| | Maximum Management Fee Rate % |
| Class A | .88 |
| Class M | .88 |
| Class C | .86 |
| Japan | .87 |
| Class I | .87 |
| Class Z | .72 |
One-twelfth of the basic fee rate for a class is applied to the average net assets of the class for the month, giving a dollar amount which is the basic fee for the class for that month. A different management fee rate may be applicable to each class of the Fund. The difference between classes is the result of separate arrangements for class-level services and/or waivers of certain expenses. It is not the result of any difference in advisory or custodial fees or other expenses related to the management of the Fund's assets, which do not vary by class. For the portion of the reporting period on or after March 1, 2024, the total annualized management fee rates were as follows:
| | Total Management Fee Rate % |
| Class A | .87 |
| Class M | .87 |
| Class C | .86 |
| Japan | .83 |
| Class I | .87 |
| Class Z | .72 |
Prior to March 1, 2024, the management fee was the sum of an individual fund fee rate that was based on an annual rate of .45% of the Fund's average net assets and an annualized group fee rate that averaged .22% during the period. The group fee rate was based upon the monthly average net assets of a group of registered investment companies with which the investment adviser has management contracts. The group fee rate decreased as assets under management increased and increased as assets under management decreased. For the portion of the reporting period prior to March 1, 2024, the total annualized management fee rate was .67%.
The performance adjustment rate is calculated monthly by comparing over the performance period the Fund's performance to that of the performance adjustment index listed below.
| | Performance Adjustment Index |
| Fidelity Japan Fund | TOPIX |
For the purposes of calculating the performance adjustment for the Fund, the Fund's investment performance is based on the performance of Japan. To the extent that other classes of the Fund have higher expenses, this could result in those classes bearing a larger positive performance adjustment and smaller negative performance adjustment than would be the case if each class's own performance were considered. The performance period is the most recent 36 month period. The maximum annualized performance adjustment rate is ±.20% of the Fund's average net assets over the performance period. The performance adjustment rate is divided by twelve and multiplied by the Fund's average net assets over the performance period, and the resulting dollar amount is proportionately added to or subtracted from a class's basic fee. For the entire reporting period, the total annual performance adjustment was (.20)%.
Effective March 1, 2024, the Fund's sub-advisory agreements with FMR Investment Management (UK) Limited, Fidelity Management & Research (Hong Kong) Limited, and Fidelity Management & Research (Japan) Limited were amended to provide that the investment adviser pays each sub-adviser monthly fees equal to 110% of the sub-adviser's costs for providing sub-advisory services.
Effective March 1, 2024, the Fund's sub-advisory agreement with FIL Investment Advisors (FIA) was amended to provide that the investment adviser pays FIA monthly fees at an annual rate of 0.44% with respect to the average daily net assets of the Fund managed by FIA. FIA in turn pays FIA(UK).
Distribution and Service Plan Fees. In accordance with Rule 12b-1 of the 1940 Act, the Fund has adopted separate Distribution and Service Plans for each class of shares. Certain classes pay Fidelity Distributors Company LLC (FDC), an affiliate of the investment adviser, separate Distribution and Service Fees, each of which is based on an annual percentage of each class' average net assets. In addition, FDC may pay financial intermediaries for selling shares of the Fund and providing shareholder support services. For the period, the Distribution and Service Fee rates, total fees and amounts retained by FDC were as follows:
| | Distribution Fee | Service Fee | Total Fees ($) | Retained by FDC ($) |
| Class A | - % | .25% | 44,571 | 3,663 |
| Class M | .25% | .25% | 13,836 | - |
| Class C | .75% | .25% | 20,324 | 6,415 |
| | | | 78,731 | 10,078 |
Sales Load. FDC may receive a front-end sales charge of up to 5.75% for selling Class A shares and 3.50% for selling Class M shares, some of which is paid to financial intermediaries for selling shares of the Fund. Depending on the holding period, FDC may receive contingent deferred sales charges levied on Class A, Class M and Class C redemptions. The deferred sales charges are 1.00% for Class C shares, 1.00% for certain purchases of Class A shares and .25% for certain purchases of Class M shares.
For the period, sales charge amounts retained by FDC were as follows:
| | Retained by FDC ($) |
| Class A | 7,589 |
| Class M | 386 |
Class CA | 35 |
| | 8,010 |
A When Class C shares are initially sold, FDC pays commissions from its own resources to financial intermediaries through which the sales are made.
Transfer Agent Fees. Fidelity Investments Institutional Operations Company LLC (FIIOC), an affiliate of the investment adviser, is the transfer, dividend disbursing and shareholder servicing agent for each class of the Fund. Effective March 1, 2024, the Fund's management contract was amended to incorporate transfer agent services and associated fees previously covered under a separate services agreement. FIIOC pays for typesetting, printing and mailing of shareholder reports, except proxy statements.
During the period December 1, 2023 through February 29, 2024, the transfer agent fees for each class were a fixed annual rate of class-level average net assets as follows:
| | % of Class-Level Average Net Assets |
| Class A | .2000 |
| Class M | .2000 |
| Class C | .1827 |
| Japan | .1937 |
| Class I | .1893 |
| Class Z | .0420 |
Prior to December 1, 2023, FIIOC received account fees and asset-based fees that varied according to the account size and type of account of the shareholders of the respective classes of the Fund, except for Class Z. FIIOC received an asset-based fee of Class Z's average net assets. For the portion of the reporting period prior to March 1, 2024, the fees were equivalent to the following annualized rates:
| | Amount ($) | % of Class-Level Average Net Assets |
| Class A | 11,693 | .20 |
| Class M | 1,776 | .21 |
| Class C | 1,208 | .18 |
| Japan | 104,766 | .19 |
| Class I | 24,297 | .19 |
| Class Z | 57,336 | .04 |
| 201,076 | |
Accounting Fees. Fidelity Service Company, Inc. (FSC), an affiliate of the investment adviser, maintains the Fund's accounting records. Effective March 1, 2024, the Fund's management contract was amended to incorporate accounting services and associated fees previously covered under a separate services agreement.
During the period December 1, 2023 through February 29, 2024, the accounting fees were a fixed annual rate of average net assets as follows:
| | % of Average Net Assets |
| Fidelity Japan Fund | .0466 |
Prior to December 1, 2023, the accounting fee was based on the level of average net assets for each month. For the portion of the reporting period prior to March 1, 2024, the fees were equivalent to the following annualized rates:
| | % of Average Net Assets |
| Fidelity Japan Fund | .05 |
Interfund Lending Program. Pursuant to an Exemptive Order issued by the Securities and Exchange Commission (the SEC), the Fund, along with other registered investment companies having management contracts with Fidelity Management & Research Company LLC (FMR), or other affiliated entities of FMR, may participate in an interfund lending program. This program provides an alternative credit facility allowing the Fund to borrow from, or lend money to, other participating affiliated funds at rates that are beneficial to both the borrowing and lending fund. Borrowings under the program are generally for temporary or emergency purposes, including meeting fund shareholder redemptions. The interfund loan rate is determined, as specified in the Exemptive Order, by averaging, (1) the higher of the overnight time deposit rate and the current overnight repurchase agreement rate, and (2) a benchmark rate representing the lowest bank loan rate available to the funds. At period end, there were no interfund loans outstanding. Activity in this program during the period for which loans were outstanding was as follows:
| | Borrower or Lender | Average Loan Balance ($) | Weighted Average Interest Rate | Interest Expense ($) |
| Fidelity Japan Fund | Borrower | 17,489,214 | 5.57% | 37,852 |
Interfund Trades. Funds may purchase from or sell securities to other Fidelity Funds under procedures adopted by the Board. The procedures have been designed to ensure these interfund trades are executed in accordance with Rule 17a-7 of the 1940 Act. Any interfund trades are included within the respective purchases and sales amounts shown in the Purchases and Sales of Investments note. Interfund trades during the period are noted in the table below.
| | Purchases ($) | Sales ($) | Realized Gain (Loss)($) |
| Fidelity Japan Fund | 1,174,975 | 1,964,033 | 1,278,802 |
6. Committed Line of Credit.
Certain Funds participate with other funds managed by the investment adviser or an affiliate in a $4.25 billion credit facility (the "line of credit") to be utilized for temporary or emergency purposes to fund shareholder redemptions or for other short-term liquidity purposes. The participating funds have agreed to pay commitment fees on their pro-rata portion of the line of credit, which are reflected in Miscellaneous expenses on the Statement of Operations, and are listed below. During the period, there were no borrowings on this line of credit.
| | Amount ($) |
| Fidelity Japan Fund | 1,065 |
7. Security Lending.
Funds lend portfolio securities from time to time in order to earn additional income. Lending agents are used, including National Financial Services (NFS), an affiliate of the investment adviser. Pursuant to a securities lending agreement, NFS will receive a fee, which is capped at 9.9% of a fund's daily lending revenue, for its services as lending agent. A fund may lend securities to certain qualified borrowers, including NFS. On the settlement date of the loan, a fund receives collateral (in the form of U.S. Treasury obligations, letters of credit and/or cash) against the loaned securities and maintains collateral in an amount not less than 100% of the market value of the loaned securities during the period of the loan. The market value of the loaned securities is determined at the close of business of a fund and any additional required collateral is delivered to a fund on the next business day. A fund or borrower may terminate the loan at any time, and if the borrower defaults on its obligation to return the securities loaned because of insolvency or other reasons, a fund may apply collateral received from the borrower against the obligation. A fund may experience delays and costs in recovering the securities loaned. Any cash collateral received is invested in the Fidelity Securities Lending Cash Central Fund. Any loaned securities are identified as such in the Schedule of Investments, and the value of loaned securities and cash collateral at period end, as applicable, are presented in the Statement of Assets and Liabilities. Security lending income represents the income earned on investing cash collateral, less rebates paid to borrowers and any lending agent fees associated with the loan, plus any premium payments received for lending certain types of securities. Security lending income is presented in the Statement of Operations as a component of income from Fidelity Central Funds. Affiliated security lending activity, if any, was as follows:
| | Total Security Lending Fees Paid to NFS ($) | Security Lending Income From Securities Loaned to NFS ($) | Value of Securities Loaned to NFS at Period End ($) |
| Fidelity Japan Fund | 25,239 | - | - |
8. Bank Borrowings.
The Fund is permitted to have bank borrowings for temporary or emergency purposes to fund shareholder redemptions or for other short-term liquidity requirements. The Fund has established borrowing arrangements with certain banks. The interest rate on the borrowings is the bank's base rate, as revised from time to time. Any open loans, including accrued interest, at period end are presented under the caption "Notes payable" in the Statement of Assets and Liabilities, if applicable. Activity in this program during the period for which loans were outstanding was as follows:
| | Average Loan Balance ($) | Weighted Average Interest Rate | Interest Expense ($) |
| Fidelity Japan Fund | 1,155,600 | 5.83% | 936 |
9. Expense Reductions.
Through arrangements with each class' transfer agent, credits realized as a result of certain uninvested cash balances were used to reduce the Fund's expenses. During the period, transfer agent credits reduced each class' expenses as noted in the table below.
| | Expense reduction ($) |
| Class A | 24 |
| Class M | 47 |
| Class C | 3 |
| | 74 |
In addition, during the period the investment adviser or an affiliate reimbursed and/or waived a portion of fund-level operating expenses in the amount of $28,500.
10. Distributions to Shareholders.
Distributions to shareholders of each class were as follows:
| | Year ended October 31, 2024 | Year ended October 31, 2023 |
| Fidelity Japan Fund | | |
| Distributions to shareholders | | |
| Class A | $601,432 | $- |
| Class M | 80,704 | - |
| Class C | 58,025 | - |
| Japan | 5,977,883 | - |
| Class I | 1,377,391 | - |
| Class Z | 15,751,871 | - |
Total | $23,847,306 | - |
11. Share Transactions.
Share transactions for each class were as follows and may contain in-kind transactions, automatic conversions between classes or exchanges between affiliated funds:
| | Shares | Shares | Dollars | Dollars |
| | Year ended October 31, 2024 | Year ended October 31, 2023 | Year ended October 31, 2024 | Year ended October 31, 2023 |
| Fidelity Japan Fund | | | | |
| Class A | | | | |
| Shares sold | 178,076 | 253,562 | $2,989,956 | $4,046,153 |
| Reinvestment of distributions | 37,678 | - | 571,577 | - |
| Shares redeemed | (322,353) | (151,426) | (5,347,066) | (2,307,493) |
| Net increase (decrease) | (106,599) | 102,136 | $(1,785,533) | $1,738,660 |
| Class M | | | | |
| Shares sold | 10,714 | 12,539 | $174,853 | $196,973 |
| Reinvestment of distributions | 5,341 | - | 80,602 | - |
| Shares redeemed | (13,657) | (22,565) | (229,966) | (338,510) |
| Net increase (decrease) | 2,398 | (10,026) | $25,489 | $(141,537) |
| Class C | | | | |
| Shares sold | 35,715 | 39,644 | $576,393 | $604,997 |
| Reinvestment of distributions | 3,913 | - | 58,025 | - |
| Shares redeemed | (48,344) | (81,701) | (787,654) | (1,220,282) |
| Net increase (decrease) | (8,716) | (42,057) | $(153,236) | $(615,285) |
| Japan | | | | |
| Shares sold | 2,663,798 | 4,480,372 | $44,014,546 | $70,308,105 |
| Reinvestment of distributions | 360,541 | - | 5,509,063 | - |
| Shares redeemed | (3,127,359) | (2,739,105) | (51,775,389) | (42,188,958) |
| Net increase (decrease) | (103,020) | 1,741,267 | $(2,251,780) | $28,119,147 |
| Class I | | | | |
| Shares sold | 873,438 | 2,062,944 | $14,285,779 | $32,061,275 |
| Reinvestment of distributions | 86,366 | - | 1,330,039 | - |
| Shares redeemed | (2,116,540) | (2,330,965) | (36,696,595) | (34,977,085) |
| Net increase (decrease) | (1,156,736) | (268,021) | $(21,080,777) | $(2,915,810) |
| Class Z | | | | |
| Shares sold | 8,068,059 | 5,627,405 | $125,982,060 | $89,494,212 |
| Reinvestment of distributions | 630,507 | - | 9,602,617 | - |
| Shares redeemed | (10,742,814) | (7,035,462) | (163,742,649) | (108,953,514) |
| Net increase (decrease) | (2,044,248) | (1,408,057) | $(28,157,972) | $(19,459,302) |
12. Other.
A fund's organizational documents provide former and current trustees and officers with a limited indemnification against liabilities arising in connection with the performance of their duties to the fund. In the normal course of business, a fund may also enter into contracts that provide general indemnifications. A fund's maximum exposure under these arrangements is unknown as this would be dependent on future claims that may be made against a fund. The risk of material loss from such claims is considered remote.
At the end of the period, the following mutual funds managed by the investment adviser or its affiliates were the owners of record of 10% or more of the total outstanding shares.
| | Strategic Advisers Fidelity International Fund | Strategic Advisers International Fund |
| Fidelity Japan Fund | 25% | 39% |
Mutual funds managed by the investment adviser or its affiliates, in aggregate, were the owners of record of more than 20% of the total outstanding shares.
| Fund | % of shares held |
| Fidelity Japan Fund | 64% |
13. Risk and Uncertainties.
Many factors affect a fund's performance. Developments that disrupt global economies and financial markets, such as pandemics, epidemics, outbreaks of infectious diseases, war, terrorism, and environmental disasters, may significantly affect a fund's investment performance. The effects of these developments to a fund will be impacted by the types of securities in which a fund invests, the financial condition, industry, economic sector, and geographic location of an issuer, and a fund's level of investment in the securities of that issuer. Significant concentrations in security types, issuers, industries, sectors, and geographic locations may magnify the factors that affect a fund's performance.
Fidelity® Japan Smaller Companies Fund
Schedule of Investments October 31, 2024
Showing Percentage of Net Assets
| Common Stocks - 98.3% |
| | | Shares | Value ($) |
| COMMUNICATION SERVICES - 1.6% | | | |
| Entertainment - 1.6% | | | |
| Capcom Co. Ltd. | | 322,100 | 6,373,864 |
| CONSUMER DISCRETIONARY - 11.9% | | | |
| Automobiles - 2.6% | | | |
| Subaru Corp. | | 278,200 | 4,968,439 |
| Suzuki Motor Corp. | | 586,000 | 5,815,075 |
| | | | 10,783,514 |
| Broadline Retail - 1.4% | | | |
| Pan Pacific International Holdings Ltd. | | 222,400 | 5,517,366 |
| Distributors - 0.9% | | | |
| Central Automotive Products Ltd. | | 127,000 | 3,825,078 |
| Hotels, Restaurants & Leisure - 1.8% | | | |
| Koshidaka Holdings Co. Ltd. | | 927,800 | 7,277,794 |
| Leisure Products - 1.0% | | | |
| Roland Corp. | | 88,900 | 2,274,119 |
| YONEX Co. Ltd. | | 152,400 | 1,906,999 |
| | | | 4,181,118 |
| Specialty Retail - 3.4% | | | |
| Fast Retailing Co. Ltd. | | 22,100 | 7,065,845 |
| Fuji Corp. (a) | | 508,300 | 6,052,042 |
| Intermestic, Inc. | | 48,100 | 643,209 |
| | | | 13,761,096 |
| Textiles, Apparel & Luxury Goods - 0.8% | | | |
| Fujibo Holdings, Inc. | | 109,000 | 3,340,617 |
TOTAL CONSUMER DISCRETIONARY | | | 48,686,583 |
| CONSUMER STAPLES - 8.4% | | | |
| Beverages - 1.7% | | | |
| Asahi Group Holdings | | 580,800 | 6,972,663 |
| Consumer Staples Distribution & Retail - 0.7% | | | |
| Kato Sangyo | | 110,500 | 2,991,544 |
| Food Products - 4.2% | | | |
| Ajinomoto Co., Inc. | | 156,600 | 6,015,907 |
| Kotobuki Spirits Co. Ltd. | | 468,000 | 6,319,269 |
| Toyo Suisan Kaisha Ltd. | | 79,200 | 4,652,508 |
| | | | 16,987,684 |
| Household Products - 0.7% | | | |
| Transaction Co. Ltd. (a) | | 186,500 | 3,018,795 |
| Personal Care Products - 1.1% | | | |
| Rohto Pharmaceutical Co. Ltd. | | 193,900 | 4,360,300 |
TOTAL CONSUMER STAPLES | | | 34,330,986 |
| ENERGY - 4.0% | | | |
| Oil, Gas & Consumable Fuels - 4.0% | | | |
| ENEOS Holdings, Inc. | | 1,175,900 | 5,931,886 |
| INPEX Corp. (a) | | 787,200 | 10,376,915 |
| | | | 16,308,801 |
| FINANCIALS - 11.1% | | | |
| Banks - 3.7% | | | |
| Chiba Bank Ltd. | | 792,700 | 5,784,899 |
| Hokuhoku Financial Group, Inc. | | 326,800 | 3,415,545 |
| Kyoto Financial Group, Inc. | | 395,800 | 5,808,910 |
| | | | 15,009,354 |
| Consumer Finance - 1.5% | | | |
| Credit Saison Co. Ltd. | | 268,900 | 6,048,171 |
| Financial Services - 0.6% | | | |
| Zenkoku Hosho Co. Ltd. | | 73,400 | 2,652,214 |
| Insurance - 5.3% | | | |
| Lifenet Insurance Co. (a)(b) | | 244,100 | 3,184,371 |
| Sompo Holdings, Inc. | | 351,300 | 7,531,550 |
| T&D Holdings, Inc. | | 401,100 | 6,402,457 |
| Tokio Marine Holdings, Inc. | | 124,900 | 4,498,419 |
| | | | 21,616,797 |
TOTAL FINANCIALS | | | 45,326,536 |
| HEALTH CARE - 2.1% | | | |
| Health Care Providers & Services - 0.8% | | | |
| As One Corp. | | 184,200 | 3,444,700 |
| Pharmaceuticals - 1.3% | | | |
| Santen Pharmaceutical Co. Ltd. | | 437,000 | 5,226,021 |
TOTAL HEALTH CARE | | | 8,670,721 |
| INDUSTRIALS - 23.1% | | | |
| Electrical Equipment - 4.3% | | | |
| Fuji Electric Co. Ltd. | | 134,100 | 6,829,432 |
| SWCC Showa Holdings Co. Ltd. | | 311,900 | 10,938,086 |
| | | | 17,767,518 |
| Ground Transportation - 1.7% | | | |
| Kyushu Railway Co. | | 257,100 | 6,764,436 |
| Machinery - 4.7% | | | |
| CKD Corp. | | 198,400 | 3,339,631 |
| IHI Corp. | | 111,000 | 5,909,520 |
| Mitsubishi Heavy Industries Ltd. | | 716,500 | 10,114,796 |
| | | | 19,363,947 |
| Marine Transportation - 1.0% | | | |
| Nippon Concept Corp. | | 363,300 | 4,288,814 |
| Professional Services - 4.9% | | | |
| Funai Soken Holdings, Inc. | | 262,780 | 4,182,606 |
| Open Up Group, Inc. | | 339,300 | 4,471,714 |
| TKC Corp. | | 169,800 | 4,403,284 |
| Visional, Inc. (b) | | 132,600 | 7,095,306 |
| | | | 20,152,910 |
| Trading Companies & Distributors - 5.2% | | | |
| Hanwa Co. Ltd. | | 83,650 | 2,771,611 |
| Inaba Denki Sangyo Co. Ltd. | | 165,200 | 4,143,526 |
| Itochu Corp. | | 87,800 | 4,343,276 |
| Mitani Shoji Co. Ltd. | | 404,700 | 4,977,183 |
| Senshu Electric Co. Ltd. (a) | | 148,500 | 4,937,994 |
| | | | 21,173,590 |
| Transportation Infrastructure - 1.3% | | | |
| Kamigumi Co. Ltd. | | 254,500 | 5,311,822 |
TOTAL INDUSTRIALS | | | 94,823,037 |
| INFORMATION TECHNOLOGY - 20.0% | | | |
| Electronic Equipment, Instruments & Components - 8.9% | | | |
| Amano Corp. | | 250,200 | 7,216,352 |
| Azbil Corp. | | 605,600 | 4,709,123 |
| Dexerials Corp. | | 363,000 | 5,542,130 |
| Ibiden Co. Ltd. | | 104,000 | 3,303,530 |
| Maruwa Ceramic Co. Ltd. | | 28,000 | 7,724,294 |
| Riken Keiki Co. Ltd. | | 127,400 | 3,609,479 |
| Shibaura Electronics Co. Ltd. | | 103,700 | 2,396,385 |
| Taiyo Yuden Co. Ltd. | | 117,900 | 2,062,042 |
| | | | 36,563,335 |
| IT Services - 5.0% | | | |
| Ad-Sol Nissin Corp. | | 43,600 | 515,022 |
| Argo Graphics, Inc. | | 260,100 | 8,943,761 |
| Net One Systems Co. Ltd. | | 200,200 | 4,860,624 |
| NSD Co. Ltd. | | 283,600 | 6,125,192 |
| | | | 20,444,599 |
| Semiconductors & Semiconductor Equipment - 2.6% | | | |
| Renesas Electronics Corp. | | 516,600 | 6,921,573 |
| Sumco Corp. | | 395,157 | 3,778,263 |
| | | | 10,699,836 |
| Software - 2.7% | | | |
| m-up Holdings, Inc. | | 88,200 | 761,153 |
| Money Forward, Inc. (b) | | 279,050 | 9,104,172 |
| WingArc1st, Inc. | | 58,400 | 1,244,078 |
| | | | 11,109,403 |
| Technology Hardware, Storage & Peripherals - 0.8% | | | |
| FUJIFILM Holdings Corp. | | 136,100 | 3,237,590 |
TOTAL INFORMATION TECHNOLOGY | | | 82,054,763 |
| MATERIALS - 10.9% | | | |
| Chemicals - 6.7% | | | |
| C. Uyemura & Co. Ltd. | | 88,800 | 6,171,816 |
| Kuraray Co. Ltd. | | 306,700 | 4,156,236 |
| NOF Corp. | | 342,000 | 5,556,303 |
| Osaka Soda Co. Ltd. | | 475,500 | 4,994,298 |
| Resonac Holdings Corp. | | 135,700 | 3,227,677 |
| Tokyo Ohka Kogyo Co. Ltd. | | 157,700 | 3,629,425 |
| | | | 27,735,755 |
| Construction Materials - 1.1% | | | |
| Maeda Kosen Co. Ltd. | | 380,000 | 4,398,418 |
| Metals & Mining - 3.1% | | | |
| Dowa Holdings Co. Ltd. | | 108,300 | 3,679,511 |
| Yamato Kogyo Co. Ltd. | | 186,600 | 8,912,878 |
| | | | 12,592,389 |
TOTAL MATERIALS | | | 44,726,562 |
| REAL ESTATE - 1.4% | | | |
| Real Estate Management & Development - 1.4% | | | |
| Relo Group, Inc. | | 254,215 | 3,092,366 |
| Starts Corp., Inc. | | 119,000 | 2,741,240 |
| | | | 5,833,606 |
| UTILITIES - 3.8% | | | |
| Electric Utilities - 2.8% | | | |
| Kansai Electric Power Co., Inc. | | 548,100 | 8,789,923 |
| Tohoku Electric Power Co., Inc. | | 289,200 | 2,836,732 |
| | | | 11,626,655 |
| Gas Utilities - 1.0% | | | |
| Nippon Gas Co. Ltd. | | 301,300 | 4,117,969 |
TOTAL UTILITIES | | | 15,744,624 |
| TOTAL COMMON STOCKS (Cost $299,585,676) | | | 402,880,083 |
| | | | |
| Money Market Funds - 2.4% |
| | | Shares | Value ($) |
| Fidelity Cash Central Fund 4.87% (c) | | 472,254 | 472,348 |
| Fidelity Securities Lending Cash Central Fund 4.87% (c)(d) | | 9,337,369 | 9,338,303 |
| TOTAL MONEY MARKET FUNDS (Cost $9,810,651) | | | 9,810,651 |
| | | | |
| TOTAL INVESTMENT IN SECURITIES - 100.7% (Cost $309,396,327) | 412,690,734 |
NET OTHER ASSETS (LIABILITIES) - (0.7)% | (2,789,411) |
| NET ASSETS - 100.0% | 409,901,323 |
| | |
Legend
| (a) | Security or a portion of the security is on loan at period end. |
| (c) | Affiliated fund that is generally available only to investment companies and other accounts managed by Fidelity Investments. The rate quoted is the annualized seven-day yield of the fund at period end. A complete unaudited listing of the fund's holdings as of its most recent quarter end is available upon request. In addition, each Fidelity Central Fund's financial statements, which are not covered by the Fund's Report of Independent Registered Public Accounting Firm, are available on the SEC's website or upon request. |
| (d) | Investment made with cash collateral received from securities on loan. |
Affiliated Central Funds
Fiscal year to date information regarding the Fund's investments in Fidelity Central Funds, including the ownership percentage, is presented below.
| Affiliate | Value, beginning of period ($) | Purchases ($) | Sales Proceeds ($) | Dividend Income ($) | Realized Gain (loss) ($) | Change in Unrealized appreciation (depreciation) ($) | Value, end of period ($) | % ownership, end of period |
| Fidelity Cash Central Fund 4.87% | 163,542 | 27,945,464 | 27,636,652 | 19,630 | (6) | - | 472,348 | 0.0% |
| Fidelity Securities Lending Cash Central Fund 4.87% | 13,158,092 | 227,783,341 | 231,603,130 | 75,259 | - | - | 9,338,303 | 0.0% |
| Total | 13,321,634 | 255,728,805 | 259,239,782 | 94,889 | (6) | - | 9,810,651 | |
| | | | | | | | | |
Amounts in the dividend income column in the above table include any capital gain distributions from underlying funds, which are presented in the corresponding line item in the Statement of Operations, if applicable.
Amounts in the dividend income column for Fidelity Securities Lending Cash Central Fund represents the income earned on investing cash collateral, less rebates paid to borrowers and any lending agent fees associated with the loan, plus any premium payments received for lending certain types of securities.
Amounts included in the purchases and sales proceeds columns may include in-kind transactions, if applicable.
Investment Valuation
The following is a summary of the inputs used, as of October 31, 2024, involving the Fund's assets and liabilities carried at fair value. The inputs or methodology used for valuing securities may not be an indication of the risk associated with investing in those securities. For more information on valuation inputs, and their aggregation into the levels used below, please refer to the Investment Valuation section in the accompanying Notes to Financial Statements.
| Valuation Inputs at Reporting Date: |
| Description | Total ($) | Level 1 ($) | Level 2 ($) | Level 3 ($) |
Investments in Securities: | | | | |
|
| Equities: | | | | |
Communication Services | 6,373,864 | - | 6,373,864 | - |
Consumer Discretionary | 48,686,583 | - | 48,686,583 | - |
Consumer Staples | 34,330,986 | - | 34,330,986 | - |
Energy | 16,308,801 | - | 16,308,801 | - |
Financials | 45,326,536 | - | 45,326,536 | - |
Health Care | 8,670,721 | - | 8,670,721 | - |
Industrials | 94,823,037 | - | 94,823,037 | - |
Information Technology | 82,054,763 | - | 82,054,763 | - |
Materials | 44,726,562 | - | 44,726,562 | - |
Real Estate | 5,833,606 | - | 5,833,606 | - |
Utilities | 15,744,624 | - | 15,744,624 | - |
|
| Money Market Funds | 9,810,651 | 9,810,651 | - | - |
| Total Investments in Securities: | 412,690,734 | 9,810,651 | 402,880,083 | - |
Fidelity® Japan Smaller Companies Fund
Financial Statements
| Statement of Assets and Liabilities |
As of October 31, 2024 |
| Assets | | | | |
| Investment in securities, at value (including securities loaned of $8,874,165) - See accompanying schedule: | | | | |
Unaffiliated issuers (cost $299,585,676) | $ | 402,880,083 | | |
Fidelity Central Funds (cost $9,810,651) | | 9,810,651 | | |
| | | | | |
| | | | | |
| Total Investment in Securities (cost $309,396,327) | | | $ | 412,690,734 |
| Foreign currency held at value (cost $7,210,743) | | | | 6,954,425 |
| Receivable for investments sold | | | | 1,729,822 |
| Receivable for fund shares sold | | | | 2,315 |
| Dividends receivable | | | | 2,876,982 |
| Distributions receivable from Fidelity Central Funds | | | | 7,121 |
| Prepaid expenses | | | | 493 |
| Other receivables | | | | 24,602 |
Total assets | | | | 424,286,494 |
| Liabilities | | | | |
| Payable for investments purchased | $ | 3,636,968 | | |
| Payable for fund shares redeemed | | 1,051,312 | | |
| Accrued management fee | | 293,173 | | |
| Other payables and accrued expenses | | 65,415 | | |
| Collateral on securities loaned | | 9,338,303 | | |
| Total liabilities | | | | 14,385,171 |
| Net Assets | | | $ | 409,901,323 |
| Net Assets consist of: | | | | |
| Paid in capital | | | $ | 302,078,090 |
| Total accumulated earnings (loss) | | | | 107,823,233 |
| Net Assets | | | $ | 409,901,323 |
Net Asset Value, offering price and redemption price per share ($409,901,323 ÷ 25,325,953 shares) | | | $ | 16.19 |
| Statement of Operations |
| Year ended October 31, 2024 |
| Investment Income | | | | |
| Dividends | | | $ | 10,158,852 |
| Income from Fidelity Central Funds (including $75,259 from security lending) | | | | 94,889 |
| Income before foreign taxes withheld | | | $ | 10,253,741 |
| Less foreign taxes withheld | | | | (1,019,125) |
| Total income | | | | 9,234,616 |
| Expenses | | | | |
| Management fee | $ | 3,419,515 | | |
| Transfer agent fees | | 234,926 | | |
| Accounting fees | | 76,922 | | |
| Custodian fees and expenses | | 39,196 | | |
| Independent trustees' fees and expenses | | 2,049 | | |
| Registration fees | | 25,423 | | |
| Audit fees | | 57,928 | | |
| Legal | | 326 | | |
| Interest | | 19,308 | | |
| Miscellaneous | | 5,711 | | |
| Total expenses before reductions | | 3,881,304 | | |
| Expense reductions | | (20,801) | | |
| Total expenses after reductions | | | | 3,860,503 |
| Net Investment income (loss) | | | | 5,374,113 |
| Realized and Unrealized Gain (Loss) | | | | |
| Net realized gain (loss) on: | | | | |
| Investment Securities: | | | | |
| Unaffiliated issuers | | 14,319,245 | | |
| Fidelity Central Funds | | (6) | | |
| Foreign currency transactions | | (337,166) | | |
| Total net realized gain (loss) | | | | 13,982,073 |
| Change in net unrealized appreciation (depreciation) on: | | | | |
| Investment Securities: | | | | |
| Unaffiliated issuers | | 69,059,536 | | |
| Assets and liabilities in foreign currencies | | (39,247) | | |
| Total change in net unrealized appreciation (depreciation) | | | | 69,020,289 |
| Net gain (loss) | | | | 83,002,362 |
| Net increase (decrease) in net assets resulting from operations | | | $ | 88,376,475 |
| Statement of Changes in Net Assets |
| |
| | Year ended October 31, 2024 | | Year ended October 31, 2023 |
| Increase (Decrease) in Net Assets | | | | |
| Operations | | | | |
| Net investment income (loss) | $ | 5,374,113 | $ | 5,244,318 |
| Net realized gain (loss) | | 13,982,073 | | 17,301,493 |
| Change in net unrealized appreciation (depreciation) | | 69,020,289 | | 7,606,221 |
| Net increase (decrease) in net assets resulting from operations | | 88,376,475 | | 30,152,032 |
| Distributions to shareholders | | (13,096,272) | | (198,124) |
| | | | | |
| Share transactions | | | | |
| Proceeds from sales of shares | | 28,846,628 | | 104,318,260 |
| Reinvestment of distributions | | 12,571,486 | | 192,250 |
| Cost of shares redeemed | | (142,666,579) | | (63,019,461) |
| | | | | |
Net increase (decrease) in net assets resulting from share transactions | | (101,248,465) | | 41,491,049 |
| Total increase (decrease) in net assets | | (25,968,262) | | 71,444,957 |
| | | | | |
| Net Assets | | | | |
| Beginning of period | | 435,869,585 | | 364,424,628 |
| End of period | $ | 409,901,323 | $ | 435,869,585 |
| | | | | |
| Other Information | | | | |
| Shares | | | | |
| Sold | | 1,867,703 | | 7,080,855 |
| Issued in reinvestment of distributions | | 873,020 | | 14,575 |
| Redeemed | | (9,273,731) | | (4,466,160) |
| Net increase (decrease) | | (6,533,008) | | 2,629,270 |
| | | | | |
Financial Highlights
Fidelity® Japan Smaller Companies Fund |
| |
| Years ended October 31, | | 2024 | | 2023 | | 2022 | | 2021 | | 2020 |
Selected Per-Share Data | | | | | | | | | | |
| Net asset value, beginning of period | $ | 13.68 | $ | 12.47 | $ | 17.92 | $ | 16.64 | $ | 17.60 |
| Income from Investment Operations | | | | | | | | | | |
Net investment income (loss) A,B | | .19 | | .18 | | .19 | | .20 | | .16 |
| Net realized and unrealized gain (loss) | | 2.75 | | 1.04 | | (3.75) | | 1.36 | | .11 |
| Total from investment operations | | 2.94 | | 1.22 | | (3.56) | | 1.56 | | .27 |
| Distributions from net investment income | | (.33) | | (.01) | | (.51) | | (.19) | | (.23) |
| Distributions from net realized gain | | (.10) | | - | | (1.38) | | (.10) | | (1.00) |
| Total distributions | | (.43) | | (.01) | | (1.89) | | (.28) C | | (1.23) |
| Net asset value, end of period | $ | 16.19 | $ | 13.68 | $ | 12.47 | $ | 17.92 | $ | 16.64 |
Total Return D | | | | 9.76% | | (21.95)% | | 9.44% | | 1.31% |
Ratios to Average Net Assets B,E,F | | | | | | | | | | |
| Expenses before reductions | | .88% | | .92% | | .91% | | .91% | | .92% |
| Expenses net of fee waivers, if any | | | | .91% | | .91% | | .91% | | .92% |
| Expenses net of all reductions | | .87% | | .91% | | .91% | | .91% | | .92% |
| Net investment income (loss) | | 1.21% | | 1.26% | | 1.33% | | 1.13% | | 1.02% |
| Supplemental Data | | | | | | | | | | |
| Net assets, end of period (000 omitted) | $ | 409,901 | $ | 435,870 | $ | 364,425 | $ | 501,214 | $ | 523,774 |
Portfolio turnover rate G | | | | 36% | | 38% | | 23% | | 20% |
ACalculated based on average shares outstanding during the period.
BNet investment income (loss) is affected by the timing of the declaration of dividends by any underlying mutual funds or exchange-traded funds (ETFs). Net investment income (loss) of any mutual funds or ETFs is not included in the Fund's net investment income (loss) ratio.
CTotal distributions per share do not sum due to rounding.
DTotal returns would have been lower if certain expenses had not been reduced during the applicable periods shown.
EFees and expenses of any underlying mutual funds or exchange-traded funds (ETFs) are not included in the Fund's expense ratio. The Fund indirectly bears its proportionate share of these expenses. For additional expense information related to investments in Fidelity Central Funds, please refer to the "Investments in Fidelity Central Funds" note found in the Notes to Financial Statements section of the most recent Annual or Semi-Annual report.
FExpense ratios reflect operating expenses of the class. Expenses before reductions do not reflect amounts reimbursed, waived, or reduced through arrangements with the investment adviser, brokerage services, or other offset arrangements, if applicable, and do not represent the amount paid by the class during periods when reimbursements, waivers or reductions occur.
GAmount does not include the portfolio activity of any underlying mutual funds or exchange-traded funds (ETFs).
Notes to Financial Statements
For the period ended October 31, 2024
1. Organization.
Fidelity Japan Smaller Companies Fund (the Fund) is a fund of Fidelity Investment Trust (the Trust) and is authorized to issue an unlimited number of shares. Share transactions on the Statement of Changes in Net Assets may contain exchanges between affiliated funds. The Trust is registered under the Investment Company Act of 1940, as amended (the 1940 Act), as an open-end management investment company organized as a Massachusetts business trust.
2. Investments in Fidelity Central Funds.
Funds may invest in Fidelity Central Funds, which are open-end investment companies generally available only to other investment companies and accounts managed by the investment adviser and its affiliates. The Schedule of Investments lists any Fidelity Central Funds held as an investment as of period end, but does not include the underlying holdings of each Fidelity Central Fund. An investing fund indirectly bears its proportionate share of the expenses of the underlying Fidelity Central Funds.
Based on its investment objective, each Fidelity Central Fund may invest or participate in various investment vehicles or strategies that are similar to those of the investing fund. These strategies are consistent with the investment objectives of the investing fund and may involve certain economic risks which may cause a decline in value of each of the Fidelity Central Funds and thus a decline in the value of the investing fund.
| Fidelity Central Fund | Investment Manager | Investment Objective | Investment Practices | Expense RatioA |
| Fidelity Money Market Central Funds | Fidelity Management & Research Company LLC (FMR) | Each fund seeks to obtain a high level of current income consistent with the preservation of capital and liquidity. | Short-term Investments | Less than .005% |
A Expenses expressed as a percentage of average net assets and are as of each underlying Central Fund's most recent annual or semi-annual shareholder report.
A complete unaudited list of holdings for each Fidelity Central Fund is available upon request or at the Securities and Exchange Commission website at www.sec.gov. In addition, the financial statements of the Fidelity Central Funds which contain the significant accounting policies (including investment valuation policies) of those funds, and are not covered by the Report of Independent Registered Public Accounting Firm, are available on the Securities and Exchange Commission website or upon request.
3. Significant Accounting Policies.
The Fund is an investment company and applies the accounting and reporting guidance of the Financial Accounting Standards Board (FASB) Accounting Standards Codification Topic 946 Financial Services - Investment Companies. The financial statements have been prepared in conformity with accounting principles generally accepted in the United States of America (GAAP), which require management to make certain estimates and assumptions at the date of the financial statements. Actual results could differ from those estimates. Subsequent events, if any, through the date that the financial statements were issued have been evaluated in the preparation of the financial statements. The Fund's Schedule of Investments lists any underlying mutual funds or exchange-traded funds (ETFs) but does not include the underlying holdings of these funds. The following summarizes the significant accounting policies of the Fund:
Investment Valuation. Investments are valued as of 4:00 p.m. Eastern time on the last calendar day of the period. The Board of Trustees (the Board) has designated the Fund's investment adviser as the valuation designee responsible for the fair valuation function and performing fair value determinations as needed. The investment adviser has established a Fair Value Committee (the Committee) to carry out the day-to-day fair valuation responsibilities and has adopted policies and procedures to govern the fair valuation process and the activities of the Committee. In accordance with these fair valuation policies and procedures, which have been approved by the Board, the Fund attempts to obtain prices from one or more third party pricing services or brokers to value its investments. When current market prices, quotations or currency exchange rates are not readily available or reliable, investments will be fair valued in good faith by the Committee, in accordance with the policies and procedures. Factors used in determining fair value vary by investment type and may include market or investment specific events, transaction data, estimated cash flows, and market observations of comparable investments. The frequency that the fair valuation procedures are used cannot be predicted and they may be utilized to a significant extent. The Committee manages the Fund's fair valuation practices and maintains the fair valuation policies and procedures. The Fund's investment adviser reports to the Board information regarding the fair valuation process and related material matters.
The Fund categorizes the inputs to valuation techniques used to value its investments into a disclosure hierarchy consisting of three levels as shown below:
Level 1 - unadjusted quoted prices in active markets for identical investments
Level 2 - other significant observable inputs (including quoted prices for similar investments, interest rates, prepayment speeds, etc.)
Level 3 - unobservable inputs (including the Fund's own assumptions based on the best information available)
Valuation techniques used to value the Fund's investments by major category are as follows:
Equity securities, including restricted securities, for which market quotations are readily available, are valued at the last reported sale price or official closing price as reported by a third party pricing service on the primary market or exchange on which they are traded and are categorized as Level 1 in the hierarchy. In the event there were no sales during the day or closing prices are not available, securities are valued at the last quoted bid price or may be valued using the last available price and are generally categorized as Level 2 in the hierarchy. For foreign equity securities, when market or security specific events arise, comparisons to the valuation of American Depositary Receipts (ADRs), futures contracts, Exchange-Traded Funds (ETFs) and certain indexes as well as quoted prices for similar securities may be used and would be categorized as Level 2 in the hierarchy. For equity securities, including restricted securities, where observable inputs are limited, assumptions about market activity and risk are used and these securities may be categorized as Level 3 in the hierarchy.
Investments in open-end mutual funds, including the Fidelity Central Funds, are valued at their closing net asset value (NAV) each business day and are categorized as Level 1 in the hierarchy.
Changes in valuation techniques may result in transfers in or out of an assigned level within the disclosure hierarchy. The aggregate value of investments by input level as of October 31, 2024 is included at the end of the Fund's Schedule of Investments.
Foreign Currency. Certain Funds may use foreign currency contracts to facilitate transactions in foreign-denominated securities. Gains and losses from these transactions may arise from changes in the value of the foreign currency or if the counterparties do not perform under the contracts' terms.
Foreign-denominated assets, including investment securities, and liabilities are translated into U.S. dollars at the exchange rates at period end. Purchases and sales of investment securities, income and dividends received, and expenses denominated in foreign currencies are translated into U.S. dollars at the exchange rate in effect on the transaction date.
The effects of exchange rate fluctuations on investments are included with the net realized and unrealized gain (loss) on investment securities. Other foreign currency transactions resulting in realized and unrealized gain (loss) are disclosed separately.
Investment Transactions and Income. For financial reporting purposes, the Fund's investment holdings and NAV include trades executed through the end of the last business day of the period. The NAV per share for processing shareholder transactions is calculated as of the close of business of the New York Stock Exchange (NYSE), normally 4:00 p.m. Eastern time and includes trades executed through the end of the prior business day. Gains and losses on securities sold are determined on the basis of identified cost and include proceeds received from litigation. Commissions paid to certain brokers with whom the investment adviser, or its affiliates, places trades on behalf of a fund include an amount in addition to trade execution, which may be rebated back to a fund. Any such rebates are included in net realized gain (loss) on investments in the Statement of Operations. Dividend income is recorded on the ex-dividend date, except for certain dividends from foreign securities where the ex-dividend date may have passed, which are recorded as soon as the Fund is informed of the ex-dividend date. Non-cash dividends included in dividend income, if any, are recorded at the fair market value of the securities received. Income and capital gain distributions from Fidelity Central Funds, if any, are recorded on the ex-dividend date. Investment income is recorded net of foreign taxes withheld where recovery of such taxes is uncertain. Funds may file withholding tax reclaims in certain jurisdictions to recover a portion of amounts previously withheld. Any withholding tax reclaims income is included in the Statement of Operations in foreign taxes withheld. Any receivables for withholding tax reclaims are included in the Statement of Assets and Liabilities in dividends receivable.
Expenses. Expenses directly attributable to a fund are charged to that fund. Expenses attributable to more than one fund are allocated among the respective funds on the basis of relative net assets or other appropriate methods. Expenses included in the accompanying financial statements reflect the expenses of that fund and do not include any expenses associated with any underlying mutual funds or exchange-traded funds. Although not included in a fund's expenses, a fund indirectly bears its proportionate share of these expenses through the net asset value of each underlying mutual fund or exchange-traded fund. Expense estimates are accrued in the period to which they relate and adjustments are made when actual amounts are known.
Income Tax Information and Distributions to Shareholders. Each year, the Fund intends to qualify as a regulated investment company under Subchapter M of the Internal Revenue Code, including distributing substantially all of its taxable income and realized gains. As a result, no provision for U.S. Federal income taxes is required. As of October 31, 2024, the Fund did not have any unrecognized tax benefits in the financial statements; nor is the Fund aware of any tax positions for which it is reasonably possible that the total amounts of unrecognized tax benefits will significantly change in the next twelve months. The Fund files a U.S. federal tax return, in addition to state and local tax returns as required. The Fund's federal income tax returns are subject to examination by the Internal Revenue Service (IRS) for a period of three fiscal years after they are filed. State and local tax returns may be subject to examination for an additional fiscal year depending on the jurisdiction. Foreign taxes are provided for based on the Fund's understanding of the tax rules and rates that exist in the foreign markets in which it invests.
Distributions are declared and recorded on the ex-dividend date. Income and capital gain distributions are determined in accordance with income tax regulations, which may differ from GAAP. In addition, the Fund claimed a portion of the payment made to redeeming shareholders as a distribution for income tax purposes.
Capital accounts within the financial statements are adjusted for permanent book-tax differences. These adjustments have no impact on net assets or the results of operations. Capital accounts are not adjusted for temporary book-tax differences which will reverse in a subsequent period.
Book-tax differences are primarily due to foreign currency transactions, passive foreign investment companies (PFIC) and losses deferred due to wash sales.
As of period end, the cost and unrealized appreciation (depreciation) in securities, and derivatives if applicable, for federal income tax purposes were as follows:
| Gross unrealized appreciation | $101,831,034 |
| Gross unrealized depreciation | (11,096,580) |
| Net unrealized appreciation (depreciation) | $90,734,454 |
| Tax Cost | $321,956,280 |
The tax-based components of distributable earnings as of period end were as follows:
| Undistributed ordinary income | $8,879,702 |
| Undistributed long-term capital gain | $8,668,009 |
| Net unrealized appreciation (depreciation) on securities and other investments | $90,275,522 |
The tax character of distributions paid was as follows:
| | October 31, 2024 | October 31, 2023 |
| Ordinary Income | $10,045,611 | $198,124 |
| Long-term Capital Gains | 3,050,661 | - |
| Total | $13,096,272 | $198,124 |
New Accounting Pronouncement. In November 2023, the FASB issued Accounting Standards Update (ASU) 2023-07 Segment Reporting (Topic 280): Improvements to Reportable Segment Disclosures. Effective for fiscal years beginning after December 15, 2023 and interim periods within fiscal years beginning after December 15, 2024, the amendments enhance required disclosures of segment information for public entities on an annual and interim basis. The ASU allows for early adoption with updates applied retrospectively. Management is currently evaluating the impact of the ASU but does not expect this guidance to materially impact the financial statements.
4. Purchases and Sales of Investments.
Purchases and sales of securities, other than short-term securities and in-kind transactions, as applicable, are noted in the table below.
| | Purchases ($) | Sales ($) |
| Fidelity Japan Smaller Companies Fund | 91,149,175 | 192,889,305 |
5. Fees and Other Transactions with Affiliates.
Management Fee. Fidelity Management & Research Company LLC (the investment adviser) and its affiliates provide the Fund with investment management related services for which the Fund pays a monthly management fee.
Effective March 1, 2024, the Fund's management contract was amended to incorporate administrative services previously covered under separate services agreements (Transfer Agent and Accounting agreements). Any reference to "class" in this note shall mean "the Fund" as the Fund currently offers only one class of shares. The amended contract incorporates a management fee rate that may vary by class. The investment adviser or an affiliate pays certain expenses of managing and operating the Fund out of each class's management fee. Each class of the Fund pays a management fee to the investment adviser. The management fee is calculated and paid to the investment adviser every month. When determining a class's management fee, a mandate rate is calculated based on the monthly average net assets of a group of funds advised by FMR within a designated asset class. A discount rate is subtracted from the mandate rate once the Fund's monthly average net assets reach a certain level. The mandate rate and discount rate may vary by class. The annual management fee rate for a class of shares of the Fund is the lesser of (1) the class's mandate rate reduced by the class's discount rate (if applicable) or (2) the amount set forth in the following table.
| | Maximum Management Fee Rate % |
| Fidelity Japan Smaller Companies Fund | .84 |
One-twelfth of the management fee rate for a class is applied to the average net assets of the class for the month, giving a dollar amount which is the management fee for the class for that month. A different management fee rate may be applicable to each class of the Fund. The difference between classes is the result of separate arrangements for class-level services and/or waivers of certain expenses. It is not the result of any difference in advisory or custodial fees or other expenses related to the management of the Fund's assets, which do not vary by class. For the portion of the reporting period on or after March 1, 2024, the total annualized management fee rates were as follows:
| | Total Management Fee Rate % |
| Fidelity Japan Smaller Companies Fund | .83 |
Prior to March 1, 2024, the management fee was the sum of an individual fund fee rate that was based on an annual rate of .45% of the Fund's average net assets and an annualized group fee rate that averaged .22% during the period. The group fee rate was based upon the monthly average net assets of a group of registered investment companies with which the investment adviser has management contracts. The group fee rate decreased as assets under management increased and increased as assets under management decreased. For the portion of the reporting period prior to March 1, 2024, the total annualized management fee rate was .67%.
Effective March 1, 2024, the Fund's sub-advisory agreements with FMR Investment Management (UK) Limited, Fidelity Management & Research (Hong Kong) Limited, and Fidelity Management & Research (Japan) Limited were amended to provide that the investment adviser pays each sub-adviser monthly fees equal to 110% of the sub-adviser's costs for providing sub-advisory services.
Effective March 1, 2024, the Fund's sub-advisory agreement with FIL Investment Advisors (FIA) was amended to provide that the investment adviser pays FIA monthly fees at an annual rate of 0.44% with respect to the average daily net assets of the Fund managed by FIA. FIA in turn pays FIA(UK).
Transfer Agent Fees. Fidelity Investments Institutional Operations Company LLC (FIIOC), an affiliate of the investment adviser, is the Fund's transfer, dividend disbursing and shareholder servicing agent. Effective March 1, 2024, each Fund's management contract was amended to incorporate transfer agent services and associated fees previously covered under a separate services agreement. FIIOC pays for typesetting, printing and mailing of shareholder reports, except proxy statements.
During the period December 1, 2023 through February 29, 2024, the transfer agent fees were a fixed annual rate of average net assets of .1535.
Prior to December 1, 2023, FIIOC received account fees and asset-based fees that varied according to account size and type of account.
For the portion of the reporting period prior to March 1, 2024, the fees were equivalent to the annualized rate of .15% of average net assets.
Accounting Fees. Fidelity Service Company, Inc. (FSC), an affiliate of the investment adviser, maintains the Fund's accounting records. Effective March 1, 2024, the Fund's management contract was amended to incorporate accounting services and associated fees previously covered under a separate services agreement.
During the period December 1, 2023 through February 29, 2024, the accounting fees were a fixed annual rate of average net assets as follows:
| | % of Average Net Assets |
| Fidelity Japan Smaller Companies Fund | .0497 |
Prior to December 1, 2023, the accounting fee was based on the level of average net assets for each month. For the portion of the reporting period prior to March 1, 2024, the fees were equivalent to the following annualized rates:
| | % of Average Net Assets |
| Fidelity Japan Smaller Companies Fund | .05 |
Interfund Lending Program. Pursuant to an Exemptive Order issued by the Securities and Exchange Commission (the SEC), the Fund, along with other registered investment companies having management contracts with Fidelity Management & Research Company LLC (FMR), or other affiliated entities of FMR, may participate in an interfund lending program. This program provides an alternative credit facility allowing the Fund to borrow from, or lend money to, other participating affiliated funds at rates that are beneficial to both the borrowing and lending fund. Borrowings under the program are generally for temporary or emergency purposes, including meeting fund shareholder redemptions. The interfund loan rate is determined, as specified in the Exemptive Order, by averaging, (1) the higher of the overnight time deposit rate and the current overnight repurchase agreement rate, and (2) a benchmark rate representing the lowest bank loan rate available to the funds. At period end, there were no interfund loans outstanding. Activity in this program during the period for which loans were outstanding was as follows:
| | Borrower or Lender | Average Loan Balance ($) | Weighted Average Interest Rate | Interest Expense ($) |
| Fidelity Japan Smaller Companies Fund | Borrower | 8,244,200 | 5.57% | 19,140 |
Interfund Trades. Funds may purchase from or sell securities to other Fidelity Funds under procedures adopted by the Board. The procedures have been designed to ensure these interfund trades are executed in accordance with Rule 17a-7 of the 1940 Act. Any interfund trades are included within the respective purchases and sales amounts shown in the Purchases and Sales of Investments note. Interfund trades during the period are noted in the table below.
| | Purchases ($) | Sales ($) | Realized Gain (Loss)($) |
| Fidelity Japan Smaller Companies Fund | 1,542,663 | 11,637,867 | 6,073,319 |
6. Committed Line of Credit.
Certain Funds participate with other funds managed by the investment adviser or an affiliate in a $4.25 billion credit facility (the "line of credit") to be utilized for temporary or emergency purposes to fund shareholder redemptions or for other short-term liquidity purposes. The participating funds have agreed to pay commitment fees on their pro-rata portion of the line of credit, which are reflected in Miscellaneous expenses on the Statement of Operations, and are listed below. During the period, there were no borrowings on this line of credit.
| | Amount ($) |
| Fidelity Japan Smaller Companies Fund | 718 |
7. Security Lending.
Funds lend portfolio securities from time to time in order to earn additional income. Lending agents are used, including National Financial Services (NFS), an affiliate of the investment adviser. Pursuant to a securities lending agreement, NFS will receive a fee, which is capped at 9.9% of a fund's daily lending revenue, for its services as lending agent. A fund may lend securities to certain qualified borrowers, including NFS. On the settlement date of the loan, a fund receives collateral (in the form of U.S. Treasury obligations, letters of credit and/or cash) against the loaned securities and maintains collateral in an amount not less than 100% of the market value of the loaned securities during the period of the loan. The market value of the loaned securities is determined at the close of business of a fund and any additional required collateral is delivered to a fund on the next business day. A fund or borrower may terminate the loan at any time, and if the borrower defaults on its obligation to return the securities loaned because of insolvency or other reasons, a fund may apply collateral received from the borrower against the obligation. A fund may experience delays and costs in recovering the securities loaned. Any cash collateral received is invested in the Fidelity Securities Lending Cash Central Fund. Any loaned securities are identified as such in the Schedule of Investments, and the value of loaned securities and cash collateral at period end, as applicable, are presented in the Statement of Assets and Liabilities. Security lending income represents the income earned on investing cash collateral, less rebates paid to borrowers and any lending agent fees associated with the loan, plus any premium payments received for lending certain types of securities. Security lending income is presented in the Statement of Operations as a component of income from Fidelity Central Funds. Affiliated security lending activity, if any, was as follows:
| | Total Security Lending Fees Paid to NFS ($) | Security Lending Income From Securities Loaned to NFS ($) | Value of Securities Loaned to NFS at Period End ($) |
| Fidelity Japan Smaller Companies Fund | 8,150 | - | - |
8. Bank Borrowings.
The Fund is permitted to have bank borrowings for temporary or emergency purposes to fund shareholder redemptions or for other short-term liquidity requirements. The Fund has established borrowing arrangements with certain banks. The interest rate on the borrowings is the bank's base rate, as revised from time to time. Any open loans, including accrued interest, at period end are presented under the caption "Notes payable" in the Statement of Assets and Liabilities, if applicable. Activity in this program during the period for which loans were outstanding was as follows:
| | Average Loan Balance ($) | Weighted Average Interest Rate | Interest Expense ($) |
| Fidelity Japan Smaller Companies Fund | 1,038,000 | 5.83% | 168 |
9. Expense Reductions.
During the period the investment adviser or an affiliate reimbursed and/or waived a portion of operating expenses in the amount of $20,801.
10. Other.
A fund's organizational documents provide former and current trustees and officers with a limited indemnification against liabilities arising in connection with the performance of their duties to the fund. In the normal course of business, a fund may also enter into contracts that provide general indemnifications. A fund's maximum exposure under these arrangements is unknown as this would be dependent on future claims that may be made against a fund. The risk of material loss from such claims is considered remote.
At the end of the period, the following mutual funds managed by the investment adviser or its affiliates were the owners of record of 10% or more of the total outstanding shares.
| | Strategic Advisers Fidelity International Fund | Strategic Advisers International Fund | VIP Funds Manager 60% Portfolio |
| Fidelity Japan Smaller Companies Fund | 12% | 23% | 13% |
Mutual funds managed by the investment adviser or its affiliates, in aggregate, were the owners of record of more than 20% of the total outstanding shares.
| Fund | % of shares held |
| Fidelity Japan Smaller Companies Fund | 61% |
11. Risk and Uncertainties.
Many factors affect a fund's performance. Developments that disrupt global economies and financial markets, such as pandemics, epidemics, outbreaks of infectious diseases, war, terrorism, and environmental disasters, may significantly affect a fund's investment performance. The effects of these developments to a fund will be impacted by the types of securities in which a fund invests, the financial condition, industry, economic sector, and geographic location of an issuer, and a fund's level of investment in the securities of that issuer. Significant concentrations in security types, issuers, industries, sectors, and geographic locations may magnify the factors that affect a fund's performance.
Schedule of Investments October 31, 2024
Showing Percentage of Net Assets
| Common Stocks - 96.7% |
| | | Shares | Value ($) |
| Denmark - 31.5% | | | |
| Better Collective A/S (a) | | 40,100 | 526,158 |
| Carlsberg A/S Series B | | 46,500 | 5,138,888 |
| Demant A/S (a) | | 61,100 | 2,241,662 |
| DSV A/S | | 62,200 | 13,518,880 |
| Genmab A/S (a) | | 15,000 | 3,359,360 |
| Novo Nordisk A/S Series B | | 582,900 | 65,380,987 |
| Tryg A/S | | 345,983 | 8,147,899 |
| Vestas Wind Systems A/S (a) | | 342,000 | 6,517,610 |
TOTAL DENMARK | | | 104,831,444 |
| Finland - 10.8% | | | |
| Elisa Corp. (A Shares) | | 138,500 | 6,592,592 |
| Fortum Corp. | | 223,600 | 3,290,779 |
| Nordea Bank Abp | | 1,509,444 | 17,666,412 |
| Sampo Oyj (A Shares) | | 123,900 | 5,485,230 |
| UPM-Kymmene Corp. | | 96,400 | 2,823,856 |
TOTAL FINLAND | | | 35,858,869 |
| Norway - 10.5% | | | |
| DNB Bank ASA | | 350,700 | 7,243,417 |
| Equinor ASA | | 305,000 | 7,247,473 |
| Kongsberg Gruppen ASA | | 67,100 | 6,984,373 |
| Mowi ASA | | 223,100 | 3,834,208 |
| Nordic VLSI ASA (a) | | 183,000 | 1,808,340 |
| Norsk Hydro ASA | | 983,300 | 6,103,687 |
| Selvaag Bolig ASA | | 321,200 | 962,123 |
| TGS ASA | | 79,300 | 720,175 |
TOTAL NORWAY | | | 34,903,796 |
| Sweden - 43.9% | | | |
| Alfa Laval AB | | 199,100 | 8,780,952 |
| ASSA ABLOY AB (B Shares) | | 349,400 | 10,944,166 |
| Atlas Copco AB (B Shares) | | 1,112,400 | 16,135,963 |
| Autoliv, Inc. | | 18,000 | 1,671,840 |
| Axfood AB | | 23,000 | 513,555 |
| Beijer Alma AB (B Shares) | | 116,500 | 1,871,951 |
| BONESUPPORT Holding AB (a)(b) | | 53,100 | 1,669,568 |
| Eltel AB (a)(b) | | 1,544,681 | 1,069,942 |
| EQT AB | | 278,300 | 8,071,171 |
| Evolution AB (b) | | 62,600 | 5,918,632 |
| Fortnox AB | | 645,900 | 3,940,429 |
| Haypp Group AB (a) | | 385,600 | 2,584,045 |
| Hemnet Group AB | | 303,400 | 9,522,407 |
| HEXPOL AB (B Shares) | | 304,170 | 2,880,530 |
| Indutrade AB | | 298,900 | 8,096,310 |
| Investor AB (B Shares) | | 609,500 | 17,244,630 |
| Lagercrantz Group AB (B Shares) | | 394,353 | 7,691,226 |
| Nolato AB (B Shares) | | 318,900 | 1,668,646 |
| Nordnet AB | | 260,500 | 5,413,152 |
| Rusta AB | | 160,300 | 1,074,981 |
| Saab AB (B Shares) | | 395,800 | 8,139,225 |
| Sandvik AB | | 489,000 | 9,592,240 |
| Surgical Science Sweden AB (a)(c) | | 124,000 | 1,461,760 |
| Svenska Cellulosa AB SCA (B Shares) | | 293,600 | 3,881,305 |
| Swedish Logistic Property AB (a) | | 142,304 | 502,192 |
| Trelleborg AB (B Shares) | | 170,200 | 5,648,546 |
TOTAL SWEDEN | | | 145,989,364 |
| TOTAL COMMON STOCKS (Cost $235,869,005) | | | 321,583,473 |
| | | | |
| Money Market Funds - 3.1% |
| | | Shares | Value ($) |
| Fidelity Cash Central Fund 4.87% (d) | | 9,499,675 | 9,501,575 |
| Fidelity Securities Lending Cash Central Fund 4.87% (d)(e) | | 976,101 | 976,198 |
| TOTAL MONEY MARKET FUNDS (Cost $10,477,773) | | | 10,477,773 |
| | | | |
| TOTAL INVESTMENT IN SECURITIES - 99.8% (Cost $246,346,778) | 332,061,246 |
NET OTHER ASSETS (LIABILITIES) - 0.2% | 532,918 |
| NET ASSETS - 100.0% | 332,594,164 |
| | |
Legend
| (b) | Security exempt from registration under Rule 144A of the Securities Act of 1933. These securities may be resold in transactions exempt from registration, normally to qualified institutional buyers. At the end of the period, the value of these securities amounted to $8,658,142 or 2.6% of net assets. |
| (c) | Security or a portion of the security is on loan at period end. |
| (d) | Affiliated fund that is generally available only to investment companies and other accounts managed by Fidelity Investments. The rate quoted is the annualized seven-day yield of the fund at period end. A complete unaudited listing of the fund's holdings as of its most recent quarter end is available upon request. In addition, each Fidelity Central Fund's financial statements, which are not covered by the Fund's Report of Independent Registered Public Accounting Firm, are available on the SEC's website or upon request. |
| (e) | Investment made with cash collateral received from securities on loan. |
Affiliated Central Funds
Fiscal year to date information regarding the Fund's investments in Fidelity Central Funds, including the ownership percentage, is presented below.
| Affiliate | Value, beginning of period ($) | Purchases ($) | Sales Proceeds ($) | Dividend Income ($) | Realized Gain (loss) ($) | Change in Unrealized appreciation (depreciation) ($) | Value, end of period ($) | % ownership, end of period |
| Fidelity Cash Central Fund 4.87% | 9,211,851 | 74,855,464 | 74,565,612 | 495,908 | (128) | - | 9,501,575 | 0.0% |
| Fidelity Securities Lending Cash Central Fund 4.87% | 3,656,000 | 69,286,475 | 71,966,277 | 38,076 | - | - | 976,198 | 0.0% |
| Total | 12,867,851 | 144,141,939 | 146,531,889 | 533,984 | (128) | - | 10,477,773 | |
| | | | | | | | | |
Amounts in the dividend income column in the above table include any capital gain distributions from underlying funds, which are presented in the corresponding line item in the Statement of Operations, if applicable.
Amounts in the dividend income column for Fidelity Securities Lending Cash Central Fund represents the income earned on investing cash collateral, less rebates paid to borrowers and any lending agent fees associated with the loan, plus any premium payments received for lending certain types of securities.
Amounts included in the purchases and sales proceeds columns may include in-kind transactions, if applicable.
Investment Valuation
The following is a summary of the inputs used, as of October 31, 2024, involving the Fund's assets and liabilities carried at fair value. The inputs or methodology used for valuing securities may not be an indication of the risk associated with investing in those securities. For more information on valuation inputs, and their aggregation into the levels used below, please refer to the Investment Valuation section in the accompanying Notes to Financial Statements.
| Valuation Inputs at Reporting Date: |
| Description | Total ($) | Level 1 ($) | Level 2 ($) | Level 3 ($) |
Investments in Securities: | | | | |
|
| Equities: | | | | |
Communication Services | 16,641,157 | 16,641,157 | - | - |
Consumer Discretionary | 11,249,498 | 5,330,866 | 5,918,632 | - |
Consumer Staples | 9,486,651 | 4,347,763 | 5,138,888 | - |
Energy | 7,967,648 | 720,175 | 7,247,473 | - |
Financials | 69,271,911 | 69,271,911 | - | - |
Health Care | 74,113,337 | 5,372,990 | 68,740,347 | - |
Industrials | 98,968,804 | 81,507,028 | 17,461,776 | - |
Information Technology | 13,439,995 | 13,439,995 | - | - |
Materials | 15,689,378 | 9,585,691 | 6,103,687 | - |
Real Estate | 1,464,315 | 1,464,315 | - | - |
Utilities | 3,290,779 | 3,290,779 | - | - |
|
| Money Market Funds | 10,477,773 | 10,477,773 | - | - |
| Total Investments in Securities: | 332,061,246 | 221,450,443 | 110,610,803 | - |
Fidelity® Nordic Fund
Financial Statements
| Statement of Assets and Liabilities |
As of October 31, 2024 |
| Assets | | | | |
| Investment in securities, at value (including securities loaned of $902,273) - See accompanying schedule: | | | | |
Unaffiliated issuers (cost $235,869,005) | $ | 321,583,473 | | |
Fidelity Central Funds (cost $10,477,773) | | 10,477,773 | | |
| | | | | |
| | | | | |
| Total Investment in Securities (cost $246,346,778) | | | $ | 332,061,246 |
| Cash | | | | 35,196 |
| Foreign currency held at value (cost $165) | | | | 165 |
| Receivable for fund shares sold | | | | 1,080,574 |
| Dividends receivable | | | | 75,121 |
| Reclaims receivable | | | | 2,178,166 |
| Distributions receivable from Fidelity Central Funds | | | | 44,019 |
| Prepaid expenses | | | | 427 |
| Other receivables | | | | 35,196 |
Total assets | | | | 335,510,110 |
| Liabilities | | | | |
| Payable for investments purchased | $ | 850,096 | | |
| Payable for fund shares redeemed | | 653,627 | | |
| Accrued management fee | | 237,296 | | |
| Other payables and accrued expenses | | 198,729 | | |
| Collateral on securities loaned | | 976,198 | | |
| Total liabilities | | | | 2,915,946 |
| Net Assets | | | $ | 332,594,164 |
| Net Assets consist of: | | | | |
| Paid in capital | | | $ | 240,974,570 |
| Total accumulated earnings (loss) | | | | 91,619,594 |
| Net Assets | | | $ | 332,594,164 |
Net Asset Value, offering price and redemption price per share ($332,594,164 ÷ 5,073,658 shares) | | | $ | 65.55 |
| Statement of Operations |
| Year ended October 31, 2024 |
| Investment Income | | | | |
| Dividends | | | $ | 8,515,226 |
| Foreign Tax Reclaims | | | | 586,132 |
| Income from Fidelity Central Funds (including $38,076 from security lending) | | | | 533,984 |
| Income before foreign taxes withheld | | | $ | 9,635,342 |
| Less foreign taxes withheld | | | | (1,846,604) |
| Total income | | | | 7,788,738 |
| Expenses | | | | |
| Management fee | $ | 2,666,907 | | |
| Transfer agent fees | | 175,119 | | |
| Accounting fees | | 53,499 | | |
| Custodian fees and expenses | | 25,764 | | |
| Independent trustees' fees and expenses | | 1,525 | | |
| Registration fees | | 24,469 | | |
| Audit fees | | 65,653 | | |
| Legal | | 234 | | |
| Miscellaneous | | 16,782 | | |
| Total expenses before reductions | | 3,029,952 | | |
| Expense reductions | | (15,039) | | |
| Total expenses after reductions | | | | 3,014,913 |
| Net Investment income (loss) | | | | 4,773,825 |
| Realized and Unrealized Gain (Loss) | | | | |
| Net realized gain (loss) on: | | | | |
| Investment Securities: | | | | |
| Unaffiliated issuers | | 14,188,673 | | |
| Fidelity Central Funds | | (128) | | |
| Foreign currency transactions | | (50,185) | | |
| Total net realized gain (loss) | | | | 14,138,360 |
| Change in net unrealized appreciation (depreciation) on: | | | | |
| Investment Securities: | | | | |
| Unaffiliated issuers | | 44,829,684 | | |
| Assets and liabilities in foreign currencies | | 131,338 | | |
| Total change in net unrealized appreciation (depreciation) | | | | 44,961,022 |
| Net gain (loss) | | | | 59,099,382 |
| Net increase (decrease) in net assets resulting from operations | | | $ | 63,873,207 |
| Statement of Changes in Net Assets |
| |
| | Year ended October 31, 2024 | | Year ended October 31, 2023 |
| Increase (Decrease) in Net Assets | | | | |
| Operations | | | | |
| Net investment income (loss) | $ | 4,773,825 | $ | 5,184,181 |
| Net realized gain (loss) | | 14,138,360 | | 1,880,670 |
| Change in net unrealized appreciation (depreciation) | | 44,961,022 | | 34,480,640 |
| Net increase (decrease) in net assets resulting from operations | | 63,873,207 | | 41,545,491 |
| Distributions to shareholders | | (158,641) | | - |
| | | | | |
| Share transactions | | | | |
| Proceeds from sales of shares | | 38,753,187 | | 44,092,104 |
| Reinvestment of distributions | | 143,738 | | - |
| Cost of shares redeemed | | (56,670,115) | | (56,149,155) |
| | | | | |
Net increase (decrease) in net assets resulting from share transactions | | (17,773,190) | | (12,057,051) |
| Total increase (decrease) in net assets | | 45,941,376 | | 29,488,440 |
| | | | | |
| Net Assets | | | | |
| Beginning of period | | 286,652,788 | | 257,164,348 |
| End of period | $ | 332,594,164 | $ | 286,652,788 |
| | | | | |
| Other Information | | | | |
| Shares | | | | |
| Sold | | 576,139 | | 789,514 |
| Issued in reinvestment of distributions | | 2,295 | | - |
| Redeemed | | (858,020) | | (1,011,489) |
| Net increase (decrease) | | (279,586) | | (221,975) |
| | | | | |
Financial Highlights
| Years ended October 31, | | 2024 | | 2023 | | 2022 | | 2021 | | 2020 |
Selected Per-Share Data | | | | | | | | | | |
| Net asset value, beginning of period | $ | 53.55 | $ | 46.13 | $ | 75.57 | $ | 56.51 | $ | 46.69 |
| Income from Investment Operations | | | | | | | | | | |
Net investment income (loss) A,B | | .92 | | .93 | | .78 | | 1.06 | | .15 |
| Net realized and unrealized gain (loss) | | 11.11 | | 6.49 | | (20.65) C | | 20.17 | | 11.86 |
| Total from investment operations | | 12.03 | | 7.42 | | (19.87) | | 21.23 | | 12.01 |
| Distributions from net investment income | | (.03) | | - | | (3.02) | | (.96) | | (1.60) |
| Distributions from net realized gain | | - | | - | | (6.56) | | (1.21) | | (.59) |
| Total distributions | | (.03) | | - | | (9.57) D | | (2.17) | | (2.19) |
| Net asset value, end of period | $ | 65.55 | $ | 53.55 | $ | 46.13 | $ | 75.57 | $ | 56.51 |
Total Return E | | | | 16.08% | | (29.33)% C | | 38.39% | | 26.73% |
Ratios to Average Net Assets B,F,G | | | | | | | | | | |
| Expenses before reductions | | .88% | | .94% | | .93% | | .92% | | .96% |
| Expenses net of fee waivers, if any | | | | .93% | | .92% | | .92% | | .96% |
| Expenses net of all reductions | | .88% | | .93% | | .92% | | .92% | | .96% |
| Net investment income (loss) | | 1.39% | | 1.69% | | 1.45% | | 1.51% | | .31% |
| Supplemental Data | | | | | | | | | | |
| Net assets, end of period (000 omitted) | $ | 332,594 | $ | 286,653 | $ | 257,164 | $ | 422,673 | $ | 301,424 |
Portfolio turnover rate H | | | | 23% | | 42% | | 34% | | 29% |
ACalculated based on average shares outstanding during the period.
BNet investment income (loss) is affected by the timing of the declaration of dividends by any underlying mutual funds or exchange-traded funds (ETFs). Net investment income (loss) of any mutual funds or ETFs is not included in the Fund's net investment income (loss) ratio.
CAmount includes a reimbursement from the investment adviser for an operational error which amounted to less than $.01 per share. Excluding this reimbursement, the total return would have been (29.35)%.
DTotal distributions per share do not sum due to rounding.
ETotal returns would have been lower if certain expenses had not been reduced during the applicable periods shown.
FFees and expenses of any underlying mutual funds or exchange-traded funds (ETFs) are not included in the Fund's expense ratio. The Fund indirectly bears its proportionate share of these expenses. For additional expense information related to investments in Fidelity Central Funds, please refer to the "Investments in Fidelity Central Funds" note found in the Notes to Financial Statements section of the most recent Annual or Semi-Annual report.
GExpense ratios reflect operating expenses of the class. Expenses before reductions do not reflect amounts reimbursed, waived, or reduced through arrangements with the investment adviser, brokerage services, or other offset arrangements, if applicable, and do not represent the amount paid by the class during periods when reimbursements, waivers or reductions occur.
HAmount does not include the portfolio activity of any underlying mutual funds or exchange-traded funds (ETFs).
Notes to Financial Statements
For the period ended October 31, 2024
1. Organization.
Fidelity Nordic Fund (the Fund) is a fund of Fidelity Investment Trust (the Trust) and is authorized to issue an unlimited number of shares. Share transactions on the Statement of Changes in Net Assets may contain exchanges between affiliated funds. The Trust is registered under the Investment Company Act of 1940, as amended (the 1940 Act), as an open-end management investment company organized as a Massachusetts business trust.
2. Investments in Fidelity Central Funds.
Funds may invest in Fidelity Central Funds, which are open-end investment companies generally available only to other investment companies and accounts managed by the investment adviser and its affiliates. The Schedule of Investments lists any Fidelity Central Funds held as an investment as of period end, but does not include the underlying holdings of each Fidelity Central Fund. An investing fund indirectly bears its proportionate share of the expenses of the underlying Fidelity Central Funds.
Based on its investment objective, each Fidelity Central Fund may invest or participate in various investment vehicles or strategies that are similar to those of the investing fund. These strategies are consistent with the investment objectives of the investing fund and may involve certain economic risks which may cause a decline in value of each of the Fidelity Central Funds and thus a decline in the value of the investing fund.
| Fidelity Central Fund | Investment Manager | Investment Objective | Investment Practices | Expense RatioA |
| Fidelity Money Market Central Funds | Fidelity Management & Research Company LLC (FMR) | Each fund seeks to obtain a high level of current income consistent with the preservation of capital and liquidity. | Short-term Investments | Less than .005% |
A Expenses expressed as a percentage of average net assets and are as of each underlying Central Fund's most recent annual or semi-annual shareholder report.
A complete unaudited list of holdings for each Fidelity Central Fund is available upon request or at the Securities and Exchange Commission website at www.sec.gov. In addition, the financial statements of the Fidelity Central Funds which contain the significant accounting policies (including investment valuation policies) of those funds, and are not covered by the Report of Independent Registered Public Accounting Firm, are available on the Securities and Exchange Commission website or upon request.
3. Significant Accounting Policies.
The Fund is an investment company and applies the accounting and reporting guidance of the Financial Accounting Standards Board (FASB) Accounting Standards Codification Topic 946 Financial Services - Investment Companies. The financial statements have been prepared in conformity with accounting principles generally accepted in the United States of America (GAAP), which require management to make certain estimates and assumptions at the date of the financial statements. Actual results could differ from those estimates. Subsequent events, if any, through the date that the financial statements were issued have been evaluated in the preparation of the financial statements. The Fund's Schedule of Investments lists any underlying mutual funds or exchange-traded funds (ETFs) but does not include the underlying holdings of these funds. The following summarizes the significant accounting policies of the Fund:
Investment Valuation. Investments are valued as of 4:00 p.m. Eastern time on the last calendar day of the period. The Board of Trustees (the Board) has designated the Fund's investment adviser as the valuation designee responsible for the fair valuation function and performing fair value determinations as needed. The investment adviser has established a Fair Value Committee (the Committee) to carry out the day-to-day fair valuation responsibilities and has adopted policies and procedures to govern the fair valuation process and the activities of the Committee. In accordance with these fair valuation policies and procedures, which have been approved by the Board, the Fund attempts to obtain prices from one or more third party pricing services or brokers to value its investments. When current market prices, quotations or currency exchange rates are not readily available or reliable, investments will be fair valued in good faith by the Committee, in accordance with the policies and procedures. Factors used in determining fair value vary by investment type and may include market or investment specific events, transaction data, estimated cash flows, and market observations of comparable investments. The frequency that the fair valuation procedures are used cannot be predicted and they may be utilized to a significant extent. The Committee manages the Fund's fair valuation practices and maintains the fair valuation policies and procedures. The Fund's investment adviser reports to the Board information regarding the fair valuation process and related material matters.
The Fund categorizes the inputs to valuation techniques used to value its investments into a disclosure hierarchy consisting of three levels as shown below:
Level 1 - unadjusted quoted prices in active markets for identical investments
Level 2 - other significant observable inputs (including quoted prices for similar investments, interest rates, prepayment speeds, etc.)
Level 3 - unobservable inputs (including the Fund's own assumptions based on the best information available)
Valuation techniques used to value the Fund's investments by major category are as follows:
Equity securities, including restricted securities, for which market quotations are readily available, are valued at the last reported sale price or official closing price as reported by a third party pricing service on the primary market or exchange on which they are traded and are categorized as Level 1 in the hierarchy. In the event there were no sales during the day or closing prices are not available, securities are valued at the last quoted bid price or may be valued using the last available price and are generally categorized as Level 2 in the hierarchy. For foreign equity securities, when market or security specific events arise, comparisons to the valuation of American Depositary Receipts (ADRs), futures contracts, Exchange-Traded Funds (ETFs) and certain indexes as well as quoted prices for similar securities may be used and would be categorized as Level 2 in the hierarchy. For equity securities, including restricted securities, where observable inputs are limited, assumptions about market activity and risk are used and these securities may be categorized as Level 3 in the hierarchy.
Investments in open-end mutual funds, including the Fidelity Central Funds, are valued at their closing net asset value (NAV) each business day and are categorized as Level 1 in the hierarchy.
Changes in valuation techniques may result in transfers in or out of an assigned level within the disclosure hierarchy. The aggregate value of investments by input level as of October 31, 2024 is included at the end of the Fund's Schedule of Investments.
Foreign Currency. Certain Funds may use foreign currency contracts to facilitate transactions in foreign-denominated securities. Gains and losses from these transactions may arise from changes in the value of the foreign currency or if the counterparties do not perform under the contracts' terms.
Foreign-denominated assets, including investment securities, and liabilities are translated into U.S. dollars at the exchange rates at period end. Purchases and sales of investment securities, income and dividends received, and expenses denominated in foreign currencies are translated into U.S. dollars at the exchange rate in effect on the transaction date.
The effects of exchange rate fluctuations on investments are included with the net realized and unrealized gain (loss) on investment securities. Other foreign currency transactions resulting in realized and unrealized gain (loss) are disclosed separately.
Investment Transactions and Income. For financial reporting purposes, the Fund's investment holdings and NAV include trades executed through the end of the last business day of the period. The NAV per share for processing shareholder transactions is calculated as of the close of business of the New York Stock Exchange (NYSE), normally 4:00 p.m. Eastern time and includes trades executed through the end of the prior business day. Gains and losses on securities sold are determined on the basis of identified cost and include proceeds received from litigation. Commissions paid to certain brokers with whom the investment adviser, or its affiliates, places trades on behalf of a fund include an amount in addition to trade execution, which may be rebated back to a fund. Any such rebates are included in net realized gain (loss) on investments in the Statement of Operations. Dividend income is recorded on the ex-dividend date,, except for certain dividends from foreign securities where the ex-dividend date may have passed, which are recorded as soon as the Fund is informed of the ex-dividend date. Non-cash dividends included in dividend income, if any, are recorded at the fair market value of the securities received. Income and capital gain distributions from Fidelity Central Funds, if any, are recorded on the ex-dividend date. Investment income is recorded net of foreign taxes withheld where recovery of such taxes is uncertain. Funds may file withholding tax reclaims in certain jurisdictions to recover a portion of amounts previously withheld. Any withholding tax reclaims income is included in the Statement of Operations in foreign tax reclaims. Any receivables for withholding tax reclaims are included in the Statement of Assets and Liabilities in reclaims receivable. For U.S. income tax purposes, EU reclaims received by a fund reduce the amounts of foreign taxes shareholders can use as tax credits in their individual income tax returns. In the event that EU reclaims received by a fund during the fiscal year exceed foreign withholding taxes paid in that year, and a fund previously passed foreign tax credit on to its shareholders, a fund will enter into a closing agreement with the Internal Revenue Service (IRS) in order to pay the associated tax liability on behalf of shareholders. During the fiscal year ended October 31, 2023, the Fund received EU reclaims in excess of foreign withholding taxes paid. The Fund is seeking a closing agreement with the IRS and has accrued the estimated fees as presented in the Statement of Assets and Liabilities in other payables and accrued expenses. The actual fees may differ from the estimate.
Expenses. Expenses directly attributable to a fund are charged to that fund. Expenses attributable to more than one fund are allocated among the respective funds on the basis of relative net assets or other appropriate methods. Expenses included in the accompanying financial statements reflect the expenses of that fund and do not include any expenses associated with any underlying mutual funds or exchange-traded funds. Although not included in a fund's expenses, a fund indirectly bears its proportionate share of these expenses through the net asset value of each underlying mutual fund or exchange-traded fund. Expense estimates are accrued in the period to which they relate and adjustments are made when actual amounts are known.
Income Tax Information and Distributions to Shareholders. Each year, the Fund intends to qualify as a regulated investment company under Subchapter M of the Internal Revenue Code, including distributing substantially all of its taxable income and realized gains. As a result, no provision for U.S. Federal income taxes is required. As of October 31, 2024, the Fund did not have any unrecognized tax benefits in the financial statements; nor is the Fund aware of any tax positions for which it is reasonably possible that the total amounts of unrecognized tax benefits will significantly change in the next twelve months. The Fund files a U.S. federal tax return, in addition to state and local tax returns as required. The Fund's federal income tax returns are subject to examination by the Internal Revenue Service (IRS) for a period of three fiscal years after they are filed. State and local tax returns may be subject to examination for an additional fiscal year depending on the jurisdiction. Foreign taxes are provided for based on the Fund's understanding of the tax rules and rates that exist in the foreign markets in which it invests.
Distributions are declared and recorded on the ex-dividend date. Income and capital gain distributions are determined in accordance with income tax regulations, which may differ from GAAP. In addition, the Fund claimed a portion of the payment made to redeeming shareholders as a distribution for income tax purposes.
Capital accounts within the financial statements are adjusted for permanent book-tax differences. These adjustments have no impact on net assets or the results of operations. Capital accounts are not adjusted for temporary book-tax differences which will reverse in a subsequent period.
Book-tax differences are primarily due to foreign currency transactions, passive foreign investment companies (PFIC), capital loss carryforwards and losses deferred due to wash sales.
As of period end, the cost and unrealized appreciation (depreciation) in securities, and derivatives if applicable, for federal income tax purposes were as follows:
| Gross unrealized appreciation | $94,754,285 |
| Gross unrealized depreciation | (20,163,027) |
| Net unrealized appreciation (depreciation) | $74,591,258 |
| Tax Cost | $257,469,988 |
The tax-based components of distributable earnings as of period end were as follows:
| Undistributed ordinary income | $11,547,318 |
| Undistributed long-term capital gain | $5,525,901 |
| Net unrealized appreciation (depreciation) on securities and other investments | $74,546,376 |
The tax character of distributions paid was as follows:
| | October 31, 2024 | October 31, 2023 |
| Ordinary Income | $158,641 | $- |
| Total | $158,641 | $- |
Restricted Securities (including Private Placements). Funds may invest in securities that are subject to legal or contractual restrictions on resale. These securities generally may be resold in transactions exempt from registration or to the public if the securities are registered. Disposal of these securities may involve time-consuming negotiations and expense, and prompt sale at an acceptable price may be difficult. Information regarding restricted securities held at period end is included at the end of the Schedule of Investments, if applicable.
New Accounting Pronouncement. In November 2023, the FASB issued Accounting Standards Update (ASU) 2023-07 Segment Reporting (Topic 280): Improvements to Reportable Segment Disclosures. Effective for fiscal years beginning after December 15, 2023 and interim periods within fiscal years beginning after December 15, 2024, the amendments enhance required disclosures of segment information for public entities on an annual and interim basis. The ASU allows for early adoption with updates applied retrospectively. Management is currently evaluating the impact of the ASU but does not expect this guidance to materially impact the financial statements.
4. Purchases and Sales of Investments.
Purchases and sales of securities, other than short-term securities and in-kind transactions, as applicable, are noted in the table below.
| | Purchases ($) | Sales ($) |
| Fidelity Nordic Fund | 69,648,829 | 82,208,930 |
5. Fees and Other Transactions with Affiliates.
Management Fee. Fidelity Management & Research Company LLC (the investment adviser) and its affiliates provide the Fund with investment management related services for which the Fund pays a monthly management fee.
Effective March 1, 2024, the Fund's management contract was amended to incorporate administrative services previously covered under separate services agreements (Transfer Agent and Accounting agreements). Any reference to "class" in this note shall mean "the Fund" as the Fund currently offers only one class of shares. The amended contract incorporates a management fee rate that may vary by class. The investment adviser or an affiliate pays certain expenses of managing and operating the Fund out of each class's management fee. Each class of the Fund pays a management fee to the investment adviser. The management fee is calculated and paid to the investment adviser every month. When determining a class's management fee, a mandate rate is calculated based on the monthly average net assets of a group of funds advised by FMR within a designated asset class. A discount rate is subtracted from the mandate rate once the Fund's monthly average net assets reach a certain level. The mandate rate and discount rate may vary by class. The annual management fee rate for a class of shares of the Fund is the lesser of (1) the class's mandate rate reduced by the class's discount rate (if applicable) or (2) the amount set forth in the following table.
| | Maximum Management Fee Rate % |
| Fidelity Nordic Fund | .85 |
One-twelfth of the management fee rate for a class is applied to the average net assets of the class for the month, giving a dollar amount which is the management fee for the class for that month. A different management fee rate may be applicable to each class of the Fund. The difference between classes is the result of separate arrangements for class-level services and/or waivers of certain expenses. It is not the result of any difference in advisory or custodial fees or other expenses related to the management of the Fund's assets, which do not vary by class. For the portion of the reporting period on or after March 1, 2024, the total annualized management fee rates were as follows:
| | Total Management Fee Rate % |
| Fidelity Nordic Fund | .83 |
Prior to March 1, 2024, the management fee was the sum of an individual fund fee rate that was based on an annual rate of .45% of the Fund's average net assets and an annualized group fee rate that averaged .22% during the period. The group fee rate was based upon the monthly average net assets of a group of registered investment companies with which the investment adviser has management contracts. The group fee rate decreased as assets under management increased and increased as assets under management decreased. For the portion of the reporting period prior to March 1, 2024, the total annualized management fee rate was .67%.
Effective March 1, 2024, the Fund's sub-advisory agreements with FMR Investment Management (UK) Limited, Fidelity Management & Research (Hong Kong) Limited, and Fidelity Management & Research (Japan) Limited were amended to provide that the investment adviser pays each sub-adviser monthly fees equal to 110% of the sub-adviser's costs for providing sub-advisory services.
Effective March 1, 2024, the Fund's sub-advisory agreement with FIL Investment Advisors (FIA) was amended to provide that the investment adviser pays FIA monthly fees at an annual rate of 0.44% with respect to the average daily net assets of the Fund managed by FIA. FIA in turn pays FIA(UK).
Transfer Agent Fees. Fidelity Investments Institutional Operations Company LLC (FIIOC), an affiliate of the investment adviser, is the Fund's transfer, dividend disbursing and shareholder servicing agent. Effective March 1, 2024, each Fund's management contract was amended to incorporate transfer agent services and associated fees previously covered under a separate services agreement. FIIOC pays for typesetting, printing and mailing of shareholder reports, except proxy statements.
During the period December 1, 2023 through February 29, 2024, the transfer agent fees were a fixed annual rate of average net assets of .1637%.
Prior to December 1, 2023, FIIOC received account fees and asset-based fees that varied according to account size and type of account.
For the portion of the reporting period prior to March 1, 2024, the fees were equivalent to the annualized rate of .16% of average net assets.
Accounting Fees. Fidelity Service Company, Inc. (FSC), an affiliate of the investment adviser, maintains the Fund's accounting records. Effective March 1, 2024, the Fund's management contract was amended to incorporate accounting services and associated fees previously covered under a separate services agreement.
During the period December 1, 2023 through February 29, 2024, the accounting fees were a fixed annual rate of average net assets as follows:
| | % of Average Net Assets |
| Fidelity Nordic Fund | .0498 |
Prior to December 1, 2023, the accounting fee was based on the level of average net assets for each month. For the portion of the reporting period prior to March 1, 2024, the fees were equivalent to the following annualized rates:
| | % of Average Net Assets |
| Fidelity Nordic Fund | .05 |
Brokerage Commissions. A portion of portfolio transactions were placed with brokerage firms which are affiliates of the investment adviser. Brokerage commissions are included in net realized gain (loss) and change in net unrealized appreciation (depreciation) in the Statement of Operations. The commissions paid to these affiliated firms were as follows:
| | Amount ($) |
| Fidelity Nordic Fund | 4 |
Interfund Trades. Funds may purchase from or sell securities to other Fidelity Funds under procedures adopted by the Board. The procedures have been designed to ensure these interfund trades are executed in accordance with Rule 17a-7 of the 1940 Act. Any interfund trades are included within the respective purchases and sales amounts shown in the Purchases and Sales of Investments note. Interfund trades during the period are noted in the table below.
| | Purchases ($) | Sales ($) | Realized Gain (Loss)($) |
| Fidelity Nordic Fund | 9,192,621 | 15,755,251 | 7,193,127 |
6. Committed Line of Credit.
Certain Funds participate with other funds managed by the investment adviser or an affiliate in a $4.25 billion credit facility (the "line of credit") to be utilized for temporary or emergency purposes to fund shareholder redemptions or for other short-term liquidity purposes. The participating funds have agreed to pay commitment fees on their pro-rata portion of the line of credit, which are reflected in Miscellaneous expenses on the Statement of Operations, and are listed below. During the period, there were no borrowings on this line of credit.
| | Amount ($) |
| Fidelity Nordic Fund | 543 |
7. Security Lending.
Funds lend portfolio securities from time to time in order to earn additional income. Lending agents are used, including National Financial Services (NFS), an affiliate of the investment adviser. Pursuant to a securities lending agreement, NFS will receive a fee, which is capped at 9.9% of a fund's daily lending revenue, for its services as lending agent. A fund may lend securities to certain qualified borrowers, including NFS. On the settlement date of the loan, a fund receives collateral (in the form of U.S. Treasury obligations, letters of credit and/or cash) against the loaned securities and maintains collateral in an amount not less than 100% of the market value of the loaned securities during the period of the loan. The market value of the loaned securities is determined at the close of business of a fund and any additional required collateral is delivered to a fund on the next business day. A fund or borrower may terminate the loan at any time, and if the borrower defaults on its obligation to return the securities loaned because of insolvency or other reasons, a fund may apply collateral received from the borrower against the obligation. A fund may experience delays and costs in recovering the securities loaned. Any cash collateral received is invested in the Fidelity Securities Lending Cash Central Fund. Any loaned securities are identified as such in the Schedule of Investments, and the value of loaned securities and cash collateral at period end, as applicable, are presented in the Statement of Assets and Liabilities. Security lending income represents the income earned on investing cash collateral, less rebates paid to borrowers and any lending agent fees associated with the loan, plus any premium payments received for lending certain types of securities. Security lending income is presented in the Statement of Operations as a component of income from Fidelity Central Funds. Affiliated security lending activity, if any, was as follows:
| | Total Security Lending Fees Paid to NFS ($) | Security Lending Income From Securities Loaned to NFS ($) | Value of Securities Loaned to NFS at Period End ($) |
| Fidelity Nordic Fund | 4,022 | - | - |
8. Expense Reductions.
Through arrangements with the Fund's custodian, credits realized as a result of certain uninvested cash balances were used to reduce the Fund's expenses by $363.
In addition, during the period the investment adviser or an affiliate reimbursed and/or waived a portion of operating expenses in the amount of $14,676.
9. Other.
A fund's organizational documents provide former and current trustees and officers with a limited indemnification against liabilities arising in connection with the performance of their duties to the fund. In the normal course of business, a fund may also enter into contracts that provide general indemnifications. A fund's maximum exposure under these arrangements is unknown as this would be dependent on future claims that may be made against a fund. The risk of material loss from such claims is considered remote.
10. Risk and Uncertainties.
Many factors affect a fund's performance. Developments that disrupt global economies and financial markets, such as pandemics, epidemics, outbreaks of infectious diseases, war, terrorism, and environmental disasters, may significantly affect a fund's investment performance. The effects of these developments to a fund will be impacted by the types of securities in which a fund invests, the financial condition, industry, economic sector, and geographic location of an issuer, and a fund's level of investment in the securities of that issuer. Significant concentrations in security types, issuers, industries, sectors, and geographic locations may magnify the factors that affect a fund's performance.
Fidelity® Pacific Basin Fund
Schedule of Investments October 31, 2024
Showing Percentage of Net Assets
| Common Stocks - 95.7% |
| | | Shares | Value ($) |
| Australia - 7.5% | | | |
| Anteris Technologies Ltd. (a) | | 357,618 | 2,524,699 |
| Aristocrat Leisure Ltd. | | 135,057 | 5,434,647 |
| Canva, Inc. Class A (b)(c) | | 1,962 | 2,187,022 |
| CAR Group Ltd. | | 243,614 | 6,000,465 |
| Challenger Ltd. | | 1,792,536 | 7,099,424 |
| Dominos Pizza Enterprises Ltd. | | 162,846 | 3,563,975 |
| HUB24 Ltd. | | 198,086 | 8,915,327 |
| Macquarie Group Ltd. | | 92,404 | 13,985,011 |
| Treasury Wine Estates Ltd. | | 543,530 | 4,035,356 |
TOTAL AUSTRALIA | | | 53,745,926 |
| China - 24.9% | | | |
| Advanced Micro-Fabrication Equipment, Inc., China (A Shares) | | 180,200 | 4,865,630 |
| Atour Lifestyle Holdings Ltd. ADR | | 483,116 | 12,657,639 |
| Chervon Holdings Ltd. | | 1,864,000 | 4,908,692 |
| Cloud Music, Inc. (a)(d) | | 130,000 | 2,080,446 |
| DouYu International Holdings Ltd. ADR (e) | | 887,510 | 9,602,858 |
| Flat Glass Group Co. Ltd. (e) | | 3,456,000 | 7,042,879 |
| HUYA, Inc. ADR | | 2,391,957 | 8,276,171 |
| Medlive Technology Co. Ltd. (d) | | 3,838,000 | 4,177,899 |
| New Oriental Education & Technology Group, Inc. | | 583,200 | 3,649,699 |
| New Oriental Education & Technology Group, Inc. sponsored ADR | | 56,900 | 3,561,940 |
| Noah Holdings Ltd. sponsored ADR | | 721,400 | 8,887,648 |
| PDD Holdings, Inc. ADR (a) | | 181,400 | 21,875,026 |
| TAL Education Group ADR (a) | | 2,390,300 | 26,580,136 |
| Tencent Holdings Ltd. | | 583,400 | 30,419,719 |
| TravelSky Technology Ltd. (H Shares) | | 8,710,000 | 12,207,814 |
| Zai Lab Ltd. (a) | | 1,791,200 | 5,461,589 |
| Zai Lab Ltd. ADR (a) | | 162,700 | 4,916,794 |
| Zylox-Tonbridge Medical Technology Co. Ltd. (a)(d) | | 4,632,000 | 6,792,535 |
TOTAL CHINA | | | 177,965,114 |
| Hong Kong - 3.1% | | | |
| AIA Group Ltd. | | 2,210,400 | 17,445,181 |
| China Metal Recycling (Holdings) Ltd. (a)(c) | | 2,572,200 | 3 |
| Prudential PLC | | 577,619 | 4,808,592 |
TOTAL HONG KONG | | | 22,253,776 |
| Japan - 37.5% | | | |
| BayCurrent Consulting, Inc. | | 240,000 | 7,799,776 |
| CUC, Inc. (a)(e) | | 326,100 | 4,219,968 |
| Daiichikosho Co. Ltd. | | 232,600 | 2,906,493 |
| DENSO Corp. | | 587,400 | 8,343,133 |
| ENEOS Holdings, Inc. | | 595,800 | 3,005,543 |
| Fast Retailing Co. Ltd. | | 16,000 | 5,115,544 |
| Fuji Electric Co. Ltd. | | 65,300 | 3,325,592 |
| FUJIFILM Holdings Corp. | | 349,800 | 8,321,155 |
| Fujitsu Ltd. | | 392,000 | 7,536,530 |
| Funai Soken Holdings, Inc. | | 257,200 | 4,093,791 |
| Hitachi Ltd. | | 765,200 | 19,225,543 |
| Hokkaido Electric Power Co., Inc. (e) | | 223,200 | 1,435,843 |
| Hoya Corp. | | 108,600 | 14,530,034 |
| Ibiden Co. Ltd. | | 140,600 | 4,466,118 |
| IHI Corp. | | 89,100 | 4,743,588 |
| INPEX Corp. | | 442,600 | 5,834,378 |
| Integral Corp. | | 118,100 | 2,995,178 |
| Kansai Electric Power Co., Inc. | | 606,900 | 9,732,904 |
| Kansai Paint Co. Ltd. | | 228,300 | 3,718,242 |
| Kyoritsu Maintenance Co. Ltd. (e) | | 352,700 | 5,662,535 |
| Lifenet Insurance Co. (a)(e) | | 370,100 | 4,828,086 |
| Mitsubishi Electric Corp. | | 264,900 | 4,660,262 |
| Mitsubishi Heavy Industries Ltd. | | 510,700 | 7,209,527 |
| Money Forward, Inc. (a) | | 122,200 | 3,986,848 |
| Murata Manufacturing Co. Ltd. | | 227,200 | 3,969,437 |
| Nidec Corp. | | 414,500 | 8,257,181 |
| NSD Co. Ltd. | | 228,200 | 4,928,663 |
| Open House Group Co. Ltd. | | 177,300 | 6,535,517 |
| ORIX Corp. | | 822,200 | 17,323,657 |
| Pan Pacific International Holdings Ltd. | | 299,500 | 7,430,086 |
| Pasona Group, Inc. | | 177,000 | 2,333,441 |
| Renesas Electronics Corp. | | 882,600 | 11,825,358 |
| Rohto Pharmaceutical Co. Ltd. | | 169,900 | 3,820,603 |
| Shin-Etsu Chemical Co. Ltd. | | 406,900 | 14,910,429 |
| SMS Co., Ltd. | | 272,600 | 3,055,975 |
| Sony Group Corp. | | 983,000 | 17,298,359 |
| TechnoPro Holdings, Inc. | | 141,200 | 2,520,192 |
| Tokio Marine Holdings, Inc. | | 128,300 | 4,620,874 |
| Toyo Gosei Co. Ltd. (e) | | 61,700 | 2,876,418 |
| Visional, Inc. (a) | | 81,900 | 4,382,395 |
| ZOZO, Inc. | | 146,500 | 4,750,331 |
TOTAL JAPAN | | | 268,535,527 |
| Korea (South) - 5.1% | | | |
| KB Financial Group, Inc. | | 111,279 | 7,264,507 |
| KT Corp. | | 326,740 | 10,452,268 |
| KT Corp. sponsored ADR | | 713,300 | 11,220,209 |
| Lotte Confectionery Co. Ltd. | | 82,328 | 1,428,610 |
| SK Hynix, Inc. | | 35,090 | 4,608,812 |
| Webtoon Entertainment, Inc. | | 169,943 | 1,767,407 |
TOTAL KOREA (SOUTH) | | | 36,741,813 |
| Malaysia - 0.8% | | | |
| MR DIY Group M Sdn Bhd (d) | | 10,785,800 | 5,375,115 |
| New Zealand - 0.9% | | | |
| Ryman Healthcare Ltd. (a) | | 2,286,200 | 6,768,097 |
| Philippines - 1.4% | | | |
| Robinsons Land Corp. | | 36,857,400 | 9,695,076 |
| Singapore - 1.3% | | | |
| Sea Ltd. ADR Class A (a) | | 100,800 | 9,480,240 |
| Taiwan - 12.1% | | | |
| Chailease Holding Co. Ltd. | | 1,525,000 | 7,164,501 |
| eMemory Technology, Inc. | | 69,000 | 6,731,055 |
| Taiwan Semiconductor Manufacturing Co. Ltd. | | 2,200,000 | 69,215,538 |
| Unimicron Technology Corp. | | 700,000 | 3,429,785 |
TOTAL TAIWAN | | | 86,540,879 |
| United States of America - 1.1% | | | |
| GI Dynamics, Inc. (a)(c) | | 111,225 | 1 |
| Newmont Corp. CDI | | 113,954 | 5,280,398 |
| Space Exploration Technologies Corp. (a)(b)(c) | | 22,539 | 2,635,260 |
TOTAL UNITED STATES OF AMERICA | | | 7,915,659 |
| TOTAL COMMON STOCKS (Cost $498,874,824) | | | 685,017,222 |
| | | | |
| Preferred Stocks - 3.7% |
| | | Shares | Value ($) |
| Convertible Preferred Stocks - 0.1% | | | |
| Australia - 0.0% | | | |
| Canva, Inc.: | | | |
| Series A (a)(b)(c) | | 85 | 94,749 |
| Series A2 (a)(b)(c) | | 15 | 16,720 |
| | | | 111,469 |
| China - 0.1% | | | |
| dMed Biopharmaceutical Co. Ltd. Series C (a)(b)(c) | | 87,773 | 475,730 |
| India - 0.0% | | | |
| Meesho: | | | |
| Series D2 (b)(c) | | 4,012 | 222,786 |
| Series E (b)(c) | | 668 | 37,094 |
| Series F (a)(b)(c) | | 620 | 35,030 |
| | | | 294,910 |
TOTAL CONVERTIBLE PREFERRED STOCKS | | | 882,109 |
| Nonconvertible Preferred Stocks - 3.6% | | | |
| Korea (South) - 3.6% | | | |
| Hyundai Motor Co. Ltd. Series 2 | | 30,440 | 3,528,440 |
| Samsung Electronics Co. Ltd. | | 474,290 | 16,369,148 |
| Samsung Fire & Marine Insurance Co. Ltd. | | 30,652 | 5,803,950 |
| | | | 25,701,538 |
| TOTAL PREFERRED STOCKS (Cost $27,756,168) | | | 26,583,647 |
| | | | |
| Money Market Funds - 3.4% |
| | | Shares | Value ($) |
| Fidelity Cash Central Fund 4.87% (f) | | 1,293,930 | 1,294,188 |
| Fidelity Securities Lending Cash Central Fund 4.87% (f)(g) | | 22,545,060 | 22,547,314 |
| TOTAL MONEY MARKET FUNDS (Cost $23,841,502) | | | 23,841,502 |
| | | | |
| TOTAL INVESTMENT IN SECURITIES - 102.8% (Cost $550,472,494) | 735,442,371 |
NET OTHER ASSETS (LIABILITIES) - (2.8)% | (19,756,652) |
| NET ASSETS - 100.0% | 715,685,719 |
| | |
Legend
| (b) | Restricted securities (including private placements) - Investment in securities not registered under the Securities Act of 1933 (excluding 144A issues). At the end of the period, the value of restricted securities (excluding 144A issues) amounted to $5,704,391 or 0.8% of net assets. |
| (d) | Security exempt from registration under Rule 144A of the Securities Act of 1933. These securities may be resold in transactions exempt from registration, normally to qualified institutional buyers. At the end of the period, the value of these securities amounted to $18,425,995 or 2.6% of net assets. |
| (e) | Security or a portion of the security is on loan at period end. |
| (f) | Affiliated fund that is generally available only to investment companies and other accounts managed by Fidelity Investments. The rate quoted is the annualized seven-day yield of the fund at period end. A complete unaudited listing of the fund's holdings as of its most recent quarter end is available upon request. In addition, each Fidelity Central Fund's financial statements, which are not covered by the Fund's Report of Independent Registered Public Accounting Firm, are available on the SEC's website or upon request. |
| (g) | Investment made with cash collateral received from securities on loan. |
| Additional information on each restricted holding is as follows: |
| Security | Acquisition Date | Acquisition Cost ($) |
| Canva, Inc. Class A | 3/18/24 - 5/03/24 | 2,092,789 |
| | | |
| Canva, Inc. Series A | 9/22/23 | 90,666 |
| | | |
| Canva, Inc. Series A2 | 9/22/23 | 16,000 |
| | | |
| dMed Biopharmaceutical Co. Ltd. Series C | 12/01/20 | 1,246,653 |
| | | |
| Meesho Series D2 | 7/15/24 | 224,672 |
| | | |
| Meesho Series E | 7/15/24 | 37,408 |
| | | |
| Meesho Series F | 7/15/24 | 34,720 |
| | | |
| Space Exploration Technologies Corp. | 2/16/21 - 5/24/22 | 1,437,725 |
| | | |
Affiliated Central Funds
Fiscal year to date information regarding the Fund's investments in Fidelity Central Funds, including the ownership percentage, is presented below.
| Affiliate | Value, beginning of period ($) | Purchases ($) | Sales Proceeds ($) | Dividend Income ($) | Realized Gain (loss) ($) | Change in Unrealized appreciation (depreciation) ($) | Value, end of period ($) | % ownership, end of period |
| Fidelity Cash Central Fund 4.87% | 2,803,622 | 215,163,975 | 216,673,590 | 187,105 | 181 | - | 1,294,188 | 0.0% |
| Fidelity Securities Lending Cash Central Fund 4.87% | 10,707,799 | 172,264,919 | 160,425,404 | 323,221 | - | - | 22,547,314 | 0.1% |
| Total | 13,511,421 | 387,428,894 | 377,098,994 | 510,326 | 181 | - | 23,841,502 | |
| | | | | | | | | |
Amounts in the dividend income column in the above table include any capital gain distributions from underlying funds, which are presented in the corresponding line item in the Statement of Operations, if applicable.
Amounts in the dividend income column for Fidelity Securities Lending Cash Central Fund represents the income earned on investing cash collateral, less rebates paid to borrowers and any lending agent fees associated with the loan, plus any premium payments received for lending certain types of securities.
Amounts included in the purchases and sales proceeds columns may include in-kind transactions, if applicable.
Investment Valuation
The following is a summary of the inputs used, as of October 31, 2024, involving the Fund's assets and liabilities carried at fair value. The inputs or methodology used for valuing securities may not be an indication of the risk associated with investing in those securities. For more information on valuation inputs, and their aggregation into the levels used below, please refer to the Investment Valuation section in the accompanying Notes to Financial Statements.
| Valuation Inputs at Reporting Date: |
| Description | Total ($) | Level 1 ($) | Level 2 ($) | Level 3 ($) |
Investments in Securities: | | | | |
|
| Equities: | | | | |
Communication Services | 92,206,276 | 40,346,885 | 51,859,391 | - |
Consumer Discretionary | 158,773,538 | 64,674,741 | 93,803,887 | 294,910 |
Consumer Staples | 7,855,959 | - | 7,855,959 | - |
Energy | 8,839,921 | - | 8,839,921 | - |
Financials | 111,141,936 | 8,887,648 | 102,254,288 | - |
Health Care | 49,867,346 | 4,916,794 | 44,474,821 | 475,731 |
Industrials | 75,671,133 | - | 73,035,873 | 2,635,260 |
Information Technology | 159,595,447 | - | 157,296,956 | 2,298,491 |
Materials | 26,785,490 | - | 26,785,487 | 3 |
Real Estate | 9,695,076 | - | 9,695,076 | - |
Utilities | 11,168,747 | - | 11,168,747 | - |
|
| Money Market Funds | 23,841,502 | 23,841,502 | - | - |
| Total Investments in Securities: | 735,442,371 | 142,667,570 | 587,070,406 | 5,704,395 |
Fidelity® Pacific Basin Fund
Financial Statements
| Statement of Assets and Liabilities |
As of October 31, 2024 |
| Assets | | | | |
| Investment in securities, at value (including securities loaned of $21,414,668) - See accompanying schedule: | | | | |
Unaffiliated issuers (cost $526,630,992) | $ | 711,600,869 | | |
Fidelity Central Funds (cost $23,841,502) | | 23,841,502 | | |
| | | | | |
| | | | | |
| Total Investment in Securities (cost $550,472,494) | | | $ | 735,442,371 |
| Foreign currency held at value (cost $6) | | | | 6 |
| Receivable for investments sold | | | | 1,342,839 |
| Receivable for fund shares sold | | | | 245,544 |
| Dividends receivable | | | | 1,855,914 |
| Distributions receivable from Fidelity Central Funds | | | | 56,215 |
| Prepaid expenses | | | | 816 |
| Other receivables | | | | 132,758 |
Total assets | | | | 739,076,463 |
| Liabilities | | | | |
| Payable for fund shares redeemed | $ | 250,182 | | |
| Accrued management fee | | 494,246 | | |
| Other payables and accrued expenses | | 99,002 | | |
| Collateral on securities loaned | | 22,547,314 | | |
| Total liabilities | | | | 23,390,744 |
| Net Assets | | | $ | 715,685,719 |
| Net Assets consist of: | | | | |
| Paid in capital | | | $ | 518,229,002 |
| Total accumulated earnings (loss) | | | | 197,456,717 |
| Net Assets | | | $ | 715,685,719 |
Net Asset Value, offering price and redemption price per share ($715,685,719 ÷ 21,140,031 shares) | | | $ | 33.85 |
| Statement of Operations |
| Year ended October 31, 2024 |
| Investment Income | | | | |
| Dividends | | | $ | 17,945,419 |
| Special dividends | | | | 8,662,098 |
| Income from Fidelity Central Funds (including $323,221 from security lending) | | | | 510,326 |
| Income before foreign taxes withheld | | | $ | 27,117,843 |
| Less foreign taxes withheld | | | | (1,395,484) |
| Total income | | | | 25,722,359 |
| Expenses | | | | |
| Management fee | | | | |
| Basic fee | $ | 5,329,691 | | |
| Performance adjustment | | (68,063) | | |
| Transfer agent fees | | 339,461 | | |
| Accounting fees | | 104,942 | | |
| Custodian fees and expenses | | 195,602 | | |
| Independent trustees' fees and expenses | | 3,113 | | |
| Registration fees | | 25,203 | | |
| Audit fees | | 87,100 | | |
| Legal | | 490 | | |
| Interest | | 9,310 | | |
| Miscellaneous | | 11,694 | | |
| Total expenses before reductions | | 6,038,543 | | |
| Expense reductions | | (30,313) | | |
| Total expenses after reductions | | | | 6,008,230 |
| Net Investment income (loss) | | | | 19,714,129 |
| Realized and Unrealized Gain (Loss) | | | | |
| Net realized gain (loss) on: | | | | |
| Investment Securities: | | | | |
| Unaffiliated issuers (net of foreign taxes of $452,602) | | 6,751,381 | | |
| Fidelity Central Funds | | 181 | | |
| Foreign currency transactions | | (317,277) | | |
| Total net realized gain (loss) | | | | 6,434,285 |
| Change in net unrealized appreciation (depreciation) on: | | | | |
| Investment Securities: | | | | |
| Unaffiliated issuers (net of decrease in deferred foreign taxes of $1,046,866) | | 145,578,723 | | |
| Assets and liabilities in foreign currencies | | (81,315) | | |
| Total change in net unrealized appreciation (depreciation) | | | | 145,497,408 |
| Net gain (loss) | | | | 151,931,693 |
| Net increase (decrease) in net assets resulting from operations | | | $ | 171,645,822 |
| Statement of Changes in Net Assets |
| |
| | Year ended October 31, 2024 | | Year ended October 31, 2023 |
| Increase (Decrease) in Net Assets | | | | |
| Operations | | | | |
| Net investment income (loss) | $ | 19,714,129 | $ | 7,981,660 |
| Net realized gain (loss) | | 6,434,285 | | 44,389,743 |
| Change in net unrealized appreciation (depreciation) | | 145,497,408 | | 56,085,701 |
| Net increase (decrease) in net assets resulting from operations | | 171,645,822 | | 108,457,104 |
| Distributions to shareholders | | (36,646,040) | | (59,141,027) |
| | | | | |
| Share transactions | | | | |
| Proceeds from sales of shares | | 40,195,016 | | 84,533,936 |
| Reinvestment of distributions | | 28,015,888 | | 44,008,733 |
| Cost of shares redeemed | | (137,490,015) | | (185,451,402) |
| | | | | |
Net increase (decrease) in net assets resulting from share transactions | | (69,279,111) | | (56,908,733) |
| Total increase (decrease) in net assets | | 65,720,671 | | (7,592,656) |
| | | | | |
| Net Assets | | | | |
| Beginning of period | | 649,965,048 | | 657,557,704 |
| End of period | $ | 715,685,719 | $ | 649,965,048 |
| | | | | |
| Other Information | | | | |
| Shares | | | | |
| Sold | | 1,319,130 | | 2,854,991 |
| Issued in reinvestment of distributions | | 1,000,210 | | 1,565,033 |
| Redeemed | | (4,570,449) | | (6,326,367) |
| Net increase (decrease) | | (2,251,109) | | (1,906,343) |
| | | | | |
Financial Highlights
Fidelity® Pacific Basin Fund |
| |
| Years ended October 31, | | 2024 | | 2023 | | 2022 | | 2021 | | 2020 |
Selected Per-Share Data | | | | | | | | | | |
| Net asset value, beginning of period | $ | 27.79 | $ | 25.99 | $ | 46.10 | $ | 40.16 | $ | 32.65 |
| Income from Investment Operations | | | | | | | | | | |
Net investment income (loss) A,B | | .88 C | | .32 D | | .22 | | .15 | | .16 |
| Net realized and unrealized gain (loss) | | 6.77 | | 3.88 | | (14.49) | | 7.74 | | 7.61 |
| Total from investment operations | | 7.65 | | 4.20 | | (14.27) | | 7.89 | | 7.77 |
| Distributions from net investment income | | (.25) | | - | | (1.17) E | | (.10) | | (.26) |
| Distributions from net realized gain | | (1.34) | | (2.40) | | (4.67) E | | (1.85) | | - |
| Total distributions | | (1.59) | | (2.40) | | (5.84) | | (1.95) | | (.26) |
| Net asset value, end of period | $ | 33.85 | $ | 27.79 | $ | 25.99 | $ | 46.10 | $ | 40.16 |
Total Return F | | | | 16.06% | | (35.11)% | | 20.08% | | 23.95% |
Ratios to Average Net Assets B,G,H | | | | | | | | | | |
| Expenses before reductions | | .88% | | 1.07% | | 1.12% | | 1.04% | | 1.11% |
| Expenses net of fee waivers, if any | | | | 1.07% | | 1.12% | | 1.04% | | 1.11% |
| Expenses net of all reductions | | .88% | | 1.07% | | 1.12% | | 1.04% | | 1.10% |
| Net investment income (loss) | | 2.88% C | | 1.08% D | | .64% | | .32% | | .47% |
| Supplemental Data | | | | | | | | | | |
| Net assets, end of period (000 omitted) | $ | 715,686 | $ | 649,965 | $ | 657,558 | $ | 1,214,726 | $ | 1,084,673 |
Portfolio turnover rate I | | | | 46% | | 29% | | 40% | | 27% |
ACalculated based on average shares outstanding during the period.
BNet investment income (loss) is affected by the timing of the declaration of dividends by any underlying mutual funds or exchange-traded funds (ETFs). Net investment income (loss) of any mutual funds or ETFs is not included in the Fund's net investment income (loss) ratio.
CNet investment income per share reflects one or more large, non-recurring dividend(s) which amounted to $.39 per share. Excluding such non-recurring dividend(s), the ratio of net investment income (loss) to average net assets would have been 1.61%.
DNet investment income per share reflects one or more large, non-recurring dividend(s) which amounted to $.07 per share. Excluding such non-recurring dividend(s), the ratio of net investment income (loss) to average net assets would have been .84%.
EThe amount shown reflects reclassifications related to book to tax differences that were made in the year shown.
FTotal returns would have been lower if certain expenses had not been reduced during the applicable periods shown.
GFees and expenses of any underlying mutual funds or exchange-traded funds (ETFs) are not included in the Fund's expense ratio. The Fund indirectly bears its proportionate share of these expenses. For additional expense information related to investments in Fidelity Central Funds, please refer to the "Investments in Fidelity Central Funds" note found in the Notes to Financial Statements section of the most recent Annual or Semi-Annual report.
HExpense ratios reflect operating expenses of the class. Expenses before reductions do not reflect amounts reimbursed, waived, or reduced through arrangements with the investment adviser, brokerage services, or other offset arrangements, if applicable, and do not represent the amount paid by the class during periods when reimbursements, waivers or reductions occur.
IAmount does not include the portfolio activity of any underlying mutual funds or exchange-traded funds (ETFs).
Notes to Financial Statements
For the period ended October 31, 2024
1. Organization.
Fidelity Pacific Basin Fund (the Fund) is a fund of Fidelity Investment Trust (the Trust) and is authorized to issue an unlimited number of shares. Share transactions on the Statement of Changes in Net Assets may contain exchanges between affiliated funds. The Trust is registered under the Investment Company Act of 1940, as amended (the 1940 Act), as an open-end management investment company organized as a Massachusetts business trust. The Fund's investments in emerging markets can be subject to social, economic, regulatory, and political uncertainties and can be extremely volatile.
2. Investments in Fidelity Central Funds.
Funds may invest in Fidelity Central Funds, which are open-end investment companies generally available only to other investment companies and accounts managed by the investment adviser and its affiliates. The Schedule of Investments lists any Fidelity Central Funds held as an investment as of period end, but does not include the underlying holdings of each Fidelity Central Fund. An investing fund indirectly bears its proportionate share of the expenses of the underlying Fidelity Central Funds.
Based on its investment objective, each Fidelity Central Fund may invest or participate in various investment vehicles or strategies that are similar to those of the investing fund. These strategies are consistent with the investment objectives of the investing fund and may involve certain economic risks which may cause a decline in value of each of the Fidelity Central Funds and thus a decline in the value of the investing fund.
| Fidelity Central Fund | Investment Manager | Investment Objective | Investment Practices | Expense RatioA |
| Fidelity Money Market Central Funds | Fidelity Management & Research Company LLC (FMR) | Each fund seeks to obtain a high level of current income consistent with the preservation of capital and liquidity. | Short-term Investments | Less than .005% |
A Expenses expressed as a percentage of average net assets and are as of each underlying Central Fund's most recent annual or semi-annual shareholder report.
A complete unaudited list of holdings for each Fidelity Central Fund is available upon request or at the Securities and Exchange Commission website at www.sec.gov. In addition, the financial statements of the Fidelity Central Funds which contain the significant accounting policies (including investment valuation policies) of those funds, and are not covered by the Report of Independent Registered Public Accounting Firm, are available on the Securities and Exchange Commission website or upon request.
3. Significant Accounting Policies.
The Fund is an investment company and applies the accounting and reporting guidance of the Financial Accounting Standards Board (FASB) Accounting Standards Codification Topic 946 Financial Services - Investment Companies. The financial statements have been prepared in conformity with accounting principles generally accepted in the United States of America (GAAP), which require management to make certain estimates and assumptions at the date of the financial statements. Actual results could differ from those estimates. Subsequent events, if any, through the date that the financial statements were issued have been evaluated in the preparation of the financial statements. The Fund's Schedule of Investments lists any underlying mutual funds or exchange-traded funds (ETFs) but does not include the underlying holdings of these funds. The following summarizes the significant accounting policies of the Fund:
Investment Valuation. Investments are valued as of 4:00 p.m. Eastern time on the last calendar day of the period. The Board of Trustees (the Board) has designated the Fund's investment adviser as the valuation designee responsible for the fair valuation function and performing fair value determinations as needed. The investment adviser has established a Fair Value Committee (the Committee) to carry out the day-to-day fair valuation responsibilities and has adopted policies and procedures to govern the fair valuation process and the activities of the Committee. In accordance with these fair valuation policies and procedures, which have been approved by the Board, the Fund attempts to obtain prices from one or more third party pricing services or brokers to value its investments. When current market prices, quotations or currency exchange rates are not readily available or reliable, investments will be fair valued in good faith by the Committee, in accordance with the policies and procedures. Factors used in determining fair value vary by investment type and may include market or investment specific events, transaction data, estimated cash flows, and market observations of comparable investments. The frequency that the fair valuation procedures are used cannot be predicted and they may be utilized to a significant extent. The Committee manages the Fund's fair valuation practices and maintains the fair valuation policies and procedures. The Fund's investment adviser reports to the Board information regarding the fair valuation process and related material matters.
The Fund categorizes the inputs to valuation techniques used to value its investments into a disclosure hierarchy consisting of three levels as shown below:
Level 1 - unadjusted quoted prices in active markets for identical investments
Level 2 - other significant observable inputs (including quoted prices for similar investments, interest rates, prepayment speeds, etc.)
Level 3 - unobservable inputs (including the Fund's own assumptions based on the best information available)
Valuation techniques used to value the Fund's investments by major category are as follows:
Equity securities, including restricted securities, for which market quotations are readily available, are valued at the last reported sale price or official closing price as reported by a third party pricing service on the primary market or exchange on which they are traded and are categorized as Level 1 in the hierarchy. In the event there were no sales during the day or closing prices are not available, securities are valued at the last quoted bid price or may be valued using the last available price and are generally categorized as Level 2 in the hierarchy. For foreign equity securities, when market or security specific events arise, comparisons to the valuation of American Depositary Receipts (ADRs), futures contracts, Exchange-Traded Funds (ETFs) and certain indexes as well as quoted prices for similar securities may be used and would be categorized as Level 2 in the hierarchy. For equity securities, including restricted securities, where observable inputs are limited, assumptions about market activity and risk are used and these securities may be categorized as Level 3 in the hierarchy.
Investments in open-end mutual funds, including the Fidelity Central Funds, are valued at their closing net asset value (NAV) each business day and are categorized as Level 1 in the hierarchy.
Changes in valuation techniques may result in transfers in or out of an assigned level within the disclosure hierarchy. The aggregate value of investments by input level as of October 31, 2024 is included at the end of the Fund's Schedule of Investments.
Foreign Currency. Certain Funds may use foreign currency contracts to facilitate transactions in foreign-denominated securities. Gains and losses from these transactions may arise from changes in the value of the foreign currency or if the counterparties do not perform under the contracts' terms.
Foreign-denominated assets, including investment securities, and liabilities are translated into U.S. dollars at the exchange rates at period end. Purchases and sales of investment securities, income and dividends received, and expenses denominated in foreign currencies are translated into U.S. dollars at the exchange rate in effect on the transaction date.
The effects of exchange rate fluctuations on investments are included with the net realized and unrealized gain (loss) on investment securities. Other foreign currency transactions resulting in realized and unrealized gain (loss) are disclosed separately.
Investment Transactions and Income. For financial reporting purposes, the Fund's investment holdings and NAV include trades executed through the end of the last business day of the period. The NAV per share for processing shareholder transactions is calculated as of the close of business of the New York Stock Exchange (NYSE), normally 4:00 p.m. Eastern time and includes trades executed through the end of the prior business day. Gains and losses on securities sold are determined on the basis of identified cost and include proceeds received from litigation. Commissions paid to certain brokers with whom the investment adviser, or its affiliates, places trades on behalf of a fund include an amount in addition to trade execution, which may be rebated back to a fund. Any such rebates are included in net realized gain (loss) on investments in the Statement of Operations. Dividend income is recorded on the ex-dividend date, except for certain dividends from foreign securities where the ex-dividend date may have passed, which are recorded as soon as the Fund is informed of the ex-dividend date. Non-cash dividends included in dividend income, if any, are recorded at the fair market value of the securities received. Income and capital gain distributions from Fidelity Central Funds, if any, are recorded on the ex-dividend date. Large, non-recurring dividends recognized by the Fund are presented separately on the Statement of Operations as "Special Dividends" and the impact of these dividends is presented in the Financial Highlights. Investment income is recorded net of foreign taxes withheld where recovery of such taxes is uncertain. Funds may file withholding tax reclaims in certain jurisdictions to recover a portion of amounts previously withheld. Any withholding tax reclaims income is included in the Statement of Operations in foreign taxes withheld. Any receivables for withholding tax reclaims are included in the Statement of Assets and Liabilities in dividends receivable.
Expenses. Expenses directly attributable to a fund are charged to that fund. Expenses attributable to more than one fund are allocated among the respective funds on the basis of relative net assets or other appropriate methods. Expenses included in the accompanying financial statements reflect the expenses of that fund and do not include any expenses associated with any underlying mutual funds or exchange-traded funds. Although not included in a fund's expenses, a fund indirectly bears its proportionate share of these expenses through the net asset value of each underlying mutual fund or exchange-traded fund. Expense estimates are accrued in the period to which they relate and adjustments are made when actual amounts are known.
Income Tax Information and Distributions to Shareholders. Each year, the Fund intends to qualify as a regulated investment company under Subchapter M of the Internal Revenue Code, including distributing substantially all of its taxable income and realized gains. As a result, no provision for U.S. Federal income taxes is required. As of October 31, 2024, the Fund did not have any unrecognized tax benefits in the financial statements; nor is the Fund aware of any tax positions for which it is reasonably possible that the total amounts of unrecognized tax benefits will significantly change in the next twelve months. The Fund files a U.S. federal tax return, in addition to state and local tax returns as required. The Fund's federal income tax returns are subject to examination by the Internal Revenue Service (IRS) for a period of three fiscal years after they are filed. State and local tax returns may be subject to examination for an additional fiscal year depending on the jurisdiction. Foreign taxes are provided for based on the Fund's understanding of the tax rules and rates that exist in the foreign markets in which it invests. The Fund is subject to a tax imposed on capital gains by certain countries in which it invests. An estimated deferred tax liability for net unrealized appreciation on the applicable securities is included in Other payables and accrued expenses on the Statement of Assets and Liabilities.
Distributions are declared and recorded on the ex-dividend date. Income and capital gain distributions are determined in accordance with income tax regulations, which may differ from GAAP. In addition, the Fund claimed a portion of the payment made to redeeming shareholders as a distribution for income tax purposes.
Capital accounts within the financial statements are adjusted for permanent book-tax differences. These adjustments have no impact on net assets or the results of operations. Capital accounts are not adjusted for temporary book-tax differences which will reverse in a subsequent period.
Book-tax differences are primarily due to foreign currency transactions, certain foreign taxes, passive foreign investment companies (PFIC), capital loss carryforwards and losses deferred due to wash sales.
As of period end, the cost and unrealized appreciation (depreciation) in securities, and derivatives if applicable, for federal income tax purposes were as follows:
| Gross unrealized appreciation | $203,707,010 |
| Gross unrealized depreciation | (43,015,303) |
| Net unrealized appreciation (depreciation) | $160,691,707 |
| Tax Cost | $574,750,664 |
The tax-based components of distributable earnings as of period end were as follows:
| Undistributed ordinary income | $37,507,039 |
| Capital loss carryforward | $(620,529) |
| Net unrealized appreciation (depreciation) on securities and other investments | $160,556,576 |
Capital loss carryforwards are only available to offset future capital gains of the Fund to the extent provided by regulations and may be limited. The capital loss carryforward information presented below, including any applicable limitation, is estimated as of fiscal period end and is subject to adjustment.
Short-term | $(620,529) |
| Total capital loss carryforward | $(620,529) |
The tax character of distributions paid was as follows:
| | October 31, 2024 | October 31, 2023 |
| Ordinary Income | $17,687,206 | $- |
| Long-term Capital Gains | 18,958,834 | 59,141,027 |
| Total | $36,646,040 | $ 59,141,027 |
Restricted Securities (including Private Placements). Funds may invest in securities that are subject to legal or contractual restrictions on resale. These securities generally may be resold in transactions exempt from registration or to the public if the securities are registered. Disposal of these securities may involve time-consuming negotiations and expense, and prompt sale at an acceptable price may be difficult. Information regarding restricted securities held at period end is included at the end of the Schedule of Investments, if applicable.
New Accounting Pronouncement. In November 2023, the FASB issued Accounting Standards Update (ASU) 2023-07 Segment Reporting (Topic 280): Improvements to Reportable Segment Disclosures. Effective for fiscal years beginning after December 15, 2023 and interim periods within fiscal years beginning after December 15, 2024, the amendments enhance required disclosures of segment information for public entities on an annual and interim basis. The ASU allows for early adoption with updates applied retrospectively. Management is currently evaluating the impact of the ASU but does not expect this guidance to materially impact the financial statements.
4. Purchases and Sales of Investments.
Purchases and sales of securities, other than short-term securities and in-kind transactions, as applicable, are noted in the table below.
| | Purchases ($) | Sales ($) |
| Fidelity Pacific Basin Fund | 416,775,693 | 503,348,821 |
5. Fees and Other Transactions with Affiliates.
Management Fee. Fidelity Management & Research Company LLC (the investment adviser) and its affiliates provide the Fund with investment management related services for which the Fund pays a monthly management fee.
Effective March 1, 2024, the Fund's management contract was amended to incorporate administrative services previously covered under separate services agreements (Transfer Agent and Accounting agreements). Any reference to "class" in this note shall mean "the Fund" as the Fund currently offers only one class of shares. The amended contract incorporates a basic fee rate that may vary by class (subject to a performance adjustment). The investment adviser or an affiliate pays certain expenses of managing and operating the Fund out of each class's management fee. Each class of the Fund pays a management fee to the investment adviser. The management fee is calculated and paid to the investment adviser every month. The management fee is determined by calculating a basic fee and then applying a performance adjustment. When determining a class's basic fee, a mandate rate is calculated based on the monthly average net assets of a group of funds advised by FMR within a designated asset class. A discount rate is subtracted from the mandate rate once the Fund's monthly average net assets reach a certain level. The mandate rate and discount rate may vary by class. The annual basic fee rate for a class of shares of the Fund is the lesser of (1) the class's mandate rate reduced by the class's discount rate (if applicable) or (2) the amount set forth in the following table.
| | Maximum Management Fee Rate % |
| Fidelity Pacific Basin Fund | .83 |
One-twelfth of the basic fee rate for a class is applied to the average net assets of the class for the month, giving a dollar amount which is the basic fee for the class for that month. A different management fee rate may be applicable to each class of the Fund. The difference between classes is the result of separate arrangements for class-level services and/or waivers of certain expenses. It is not the result of any difference in advisory or custodial fees or other expenses related to the management of the Fund's assets, which do not vary by class. For the portion of the reporting period on or after March 1, 2024, the total annualized management fee rates were as follows:
| | Total Management Fee Rate % |
| Fidelity Pacific Basin Fund | .83 |
Prior to March 1, 2024, the management fee was the sum of an individual fund fee rate that was based on an annual rate of .45% of the Fund's average net assets and an annualized group fee rate that averaged .22% during the period. The group fee rate was based upon the monthly average net assets of a group of registered investment companies with which the investment adviser has management contracts. The group fee rate decreased as assets under management increased and increased as assets under management decreased. For the portion of the reporting period prior to March 1, 2024, the total annualized management fee rate was .67%.
The performance adjustment rate is calculated monthly by comparing over the performance period the Fund's performance to that of the performance adjustment index listed below.
| | Performance Adjustment Index |
| Fidelity Pacific Basin Fund | MSCI All Country Pacific Index |
For the purposes of calculating the performance adjustment for the Fund, the Fund's investment performance is based on the performance of the Fund. To the extent that other classes of the Fund have higher expenses, this could result in those classes bearing a larger positive performance adjustment and smaller negative performance adjustment than would be the case if each class's own performance were considered. The performance period is the most recent 36 month period. The maximum annualized performance adjustment rate is ±.20% of the Fund's average net assets over the performance period. The performance adjustment rate is divided by twelve and multiplied by the Fund's average net assets over the performance period, and the resulting dollar amount is proportionately added to or subtracted from a class's basic fee. For the entire reporting period, the total annual performance adjustment was (.01)%.
Effective March 1, 2024, the Fund's sub-advisory agreements with FMR Investment Management (UK) Limited, Fidelity Management & Research (Hong Kong) Limited, and Fidelity Management & Research (Japan) Limited were amended to provide that the investment adviser pays each sub-adviser monthly fees equal to 110% of the sub-adviser's costs for providing sub-advisory services.
Effective March 1, 2024, the Fund's sub-advisory agreement with FIL Investment Advisors (FIA) was amended to provide that the investment adviser pays FIA monthly fees at an annual rate of 0.50% with respect to the average daily net assets of the Fund managed by FIA. FIA in turn pays FIA(UK).
Transfer Agent Fees. Fidelity Investments Institutional Operations Company LLC (FIIOC), an affiliate of the investment adviser, is the Fund's transfer, dividend disbursing and shareholder servicing agent. Effective March 1, 2024, each Fund's management contract was amended to incorporate transfer agent services and associated fees previously covered under a separate services agreement. FIIOC pays for typesetting, printing and mailing of shareholder reports, except proxy statements.
During the period December 1, 2023 through February 29, 2024, the transfer agent fees were a fixed annual rate of average net assets of .1515%.
Prior to December 1, 2023, FIIOC received account fees and asset-based fees that varied according to account size and type of account.
For the portion of the reporting period prior to March 1, 2024, the fees were equivalent to the annualized rate of .15% of average net assets.
Accounting Fees. Fidelity Service Company, Inc. (FSC), an affiliate of the investment adviser, maintains the Fund's accounting records. Effective March 1, 2024, the Fund's management contract was amended to incorporate accounting services and associated fees previously covered under a separate services agreement.
During the period December 1, 2023 through February 29, 2024, the accounting fees were a fixed annual rate of average net assets as follows:
| | % of Average Net Assets |
| Fidelity Pacific Basin Fund | .0464 |
Prior to December 1, 2023, the accounting fee was based on the level of average net assets for each month. For the portion of the reporting period prior to March 1, 2024, the fees were equivalent to the following annualized rates:
| | % of Average Net Assets |
| Fidelity Pacific Basin Fund | .05 |
Brokerage Commissions. A portion of portfolio transactions were placed with brokerage firms which are affiliates of the investment adviser. Brokerage commissions are included in net realized gain (loss) and change in net unrealized appreciation (depreciation) in the Statement of Operations. The commissions paid to these affiliated firms were as follows:
| | Amount ($) |
| Fidelity Pacific Basin Fund | 6,050 |
Interfund Lending Program. Pursuant to an Exemptive Order issued by the Securities and Exchange Commission (the SEC), the Fund, along with other registered investment companies having management contracts with Fidelity Management & Research Company LLC (FMR), or other affiliated entities of FMR, may participate in an interfund lending program. This program provides an alternative credit facility allowing the Fund to borrow from, or lend money to, other participating affiliated funds at rates that are beneficial to both the borrowing and lending fund. Borrowings under the program are generally for temporary or emergency purposes, including meeting fund shareholder redemptions. The interfund loan rate is determined, as specified in the Exemptive Order, by averaging, (1) the higher of the overnight time deposit rate and the current overnight repurchase agreement rate, and (2) a benchmark rate representing the lowest bank loan rate available to the funds. At period end, there were no interfund loans outstanding. Activity in this program during the period for which loans were outstanding was as follows:
| | Borrower or Lender | Average Loan Balance ($) | Weighted Average Interest Rate | Interest Expense ($) |
| Fidelity Pacific Basin Fund | Borrower | 3,559,000 | 5.40% | 9,310 |
Interfund Trades. Funds may purchase from or sell securities to other Fidelity Funds under procedures adopted by the Board. The procedures have been designed to ensure these interfund trades are executed in accordance with Rule 17a-7 of the 1940 Act. Any interfund trades are included within the respective purchases and sales amounts shown in the Purchases and Sales of Investments note. Interfund trades during the period are noted in the table below.
| | Purchases ($) | Sales ($) | Realized Gain (Loss)($) |
| Fidelity Pacific Basin Fund | 8,432,558 | 4,922,082 | 489,671 |
6. Committed Line of Credit.
Certain Funds participate with other funds managed by the investment adviser or an affiliate in a $4.25 billion credit facility (the "line of credit") to be utilized for temporary or emergency purposes to fund shareholder redemptions or for other short-term liquidity purposes. The participating funds have agreed to pay commitment fees on their pro-rata portion of the line of credit, which are reflected in Miscellaneous expenses on the Statement of Operations, and are listed below. During the period, there were no borrowings on this line of credit.
| | Amount ($) |
| Fidelity Pacific Basin Fund | 1,091 |
7. Security Lending.
Funds lend portfolio securities from time to time in order to earn additional income. Lending agents are used, including National Financial Services (NFS), an affiliate of the investment adviser. Pursuant to a securities lending agreement, NFS will receive a fee, which is capped at 9.9% of a fund's daily lending revenue, for its services as lending agent. A fund may lend securities to certain qualified borrowers, including NFS. On the settlement date of the loan, a fund receives collateral (in the form of U.S. Treasury obligations, letters of credit and/or cash) against the loaned securities and maintains collateral in an amount not less than 100% of the market value of the loaned securities during the period of the loan. The market value of the loaned securities is determined at the close of business of a fund and any additional required collateral is delivered to a fund on the next business day. A fund or borrower may terminate the loan at any time, and if the borrower defaults on its obligation to return the securities loaned because of insolvency or other reasons, a fund may apply collateral received from the borrower against the obligation. A fund may experience delays and costs in recovering the securities loaned. Any cash collateral received is invested in the Fidelity Securities Lending Cash Central Fund. Any loaned securities are identified as such in the Schedule of Investments, and the value of loaned securities and cash collateral at period end, as applicable, are presented in the Statement of Assets and Liabilities. Security lending income represents the income earned on investing cash collateral, less rebates paid to borrowers and any lending agent fees associated with the loan, plus any premium payments received for lending certain types of securities. Security lending income is presented in the Statement of Operations as a component of income from Fidelity Central Funds. Affiliated security lending activity, if any, was as follows:
| | Total Security Lending Fees Paid to NFS ($) | Security Lending Income From Securities Loaned to NFS ($) | Value of Securities Loaned to NFS at Period End ($) |
| Fidelity Pacific Basin Fund | 34,406 | - | - |
8. Expense Reductions.
In addition, during the period the investment adviser or an affiliate reimbursed and/or waived a portion of operating expenses in the amount of $30,313.
9. Other.
A fund's organizational documents provide former and current trustees and officers with a limited indemnification against liabilities arising in connection with the performance of their duties to the fund. In the normal course of business, a fund may also enter into contracts that provide general indemnifications. A fund's maximum exposure under these arrangements is unknown as this would be dependent on future claims that may be made against a fund. The risk of material loss from such claims is considered remote.
At the end of the period, the following mutual funds managed by the investment adviser or its affiliates were the owners of record of 10% or more of the total outstanding shares.
| | Strategic Advisers Fidelity International Fund |
| Fidelity Pacific Basin Fund | 17% |
10. Risk and Uncertainties.
Many factors affect a fund's performance. Developments that disrupt global economies and financial markets, such as pandemics, epidemics, outbreaks of infectious diseases, war, terrorism, and environmental disasters, may significantly affect a fund's investment performance. The effects of these developments to a fund will be impacted by the types of securities in which a fund invests, the financial condition, industry, economic sector, and geographic location of an issuer, and a fund's level of investment in the securities of that issuer. Significant concentrations in security types, issuers, industries, sectors, and geographic locations may magnify the factors that affect a fund's performance.
Report of Independent Registered Public Accounting Firm
To the Board of Trustees of Fidelity Investment Trust and Shareholders of Fidelity Canada Fund, Fidelity China Region Fund, Fidelity Emerging Asia Fund, Fidelity Emerging Markets Fund, Fidelity Europe Fund, Fidelity Japan Fund, Fidelity Japan Smaller Companies Fund, Fidelity Nordic Fund, and Fidelity Pacific Basin Fund
Opinions on the Financial Statements
We have audited the accompanying statements of assets and liabilities, including the schedules of investments, of Fidelity Canada Fund, Fidelity China Region Fund, Fidelity Emerging Asia Fund, Fidelity Emerging Markets Fund, Fidelity Europe Fund, Fidelity Japan Fund, Fidelity Japan Smaller Companies Fund, Fidelity Nordic Fund, and Fidelity Pacific Basin Fund (nine of the funds constituting Fidelity Investment Trust, hereafter collectively referred to as the "Funds") as of October 31, 2024, the related statements of operations for the year ended October 31, 2024, the statements of changes in net assets for each of the two years in the period ended October 31, 2024, including the related notes, and the financial highlights for each of the periods indicated therein (collectively referred to as the "financial statements"). In our opinion, the financial statements present fairly, in all material respects, the financial position of each of the Funds as of October 31, 2024, the results of each of their operations for the year then ended, the changes in each of their net assets for each of the two years in the period ended October 31, 2024 and each of the financial highlights for each of the periods indicated therein in conformity with accounting principles generally accepted in the United States of America.
Basis for Opinions
These financial statements are the responsibility of the Funds' management. Our responsibility is to express an opinion on the Funds' financial statements based on our audits. We are a public accounting firm registered with the Public Company Accounting Oversight Board (United States) (PCAOB) and are required to be independent with respect to the Funds in accordance with the U.S. federal securities laws and the applicable rules and regulations of the Securities and Exchange Commission and the PCAOB.
We conducted our audits of these financial statements in accordance with the standards of the PCAOB. Those standards require that we plan and perform the audit to obtain reasonable assurance about whether the financial statements are free of material misstatement, whether due to error or fraud.
Our audits included performing procedures to assess the risks of material misstatement of the financial statements, whether due to error or fraud, and performing procedures that respond to those risks. Such procedures included examining, on a test basis, evidence regarding the amounts and disclosures in the financial statements. Our audits also included evaluating the accounting principles used and significant estimates made by management, as well as evaluating the overall presentation of the financial statements. Our procedures included confirmation of securities owned as of October 31, 2024 by correspondence with the custodian, issuers of privately offered securities and brokers; when replies were not received from brokers, we performed other auditing procedures. We believe that our audits provide a reasonable basis for our opinions.
/s/PricewaterhouseCoopers LLP
Boston, Massachusetts
December 19, 2024
We have served as the auditor of one or more investment companies in the Fidelity group of funds since 1932.
Distributions
(Unaudited)The dividend and capital gains distributions for the fund(s) are available on Fidelity.com or Institutional.Fidelity.com.
The funds hereby designate as capital gain dividend the amounts noted below for the taxable year ended October 31, 2024, or, if subsequently determined to be different, the net capital gain of such year.
| Fidelity Canada Fund | $54,788,494 |
| Fidelity Japan Fund | $11,140,972 |
| Fidelity Japan Smaller Companies Fund | $9,023,340 |
| Fidelity Nordic Fund | $6,184,997 |
The funds hereby designate the percentages noted below of the short-term capital gain dividends distributed during the fiscal year as qualifying to be taxed as short-term capital gain dividends for nonresident alien shareholders:
| | December 2023 |
| Fidelity Pacific Basin Fund | 100% |
| | |
The funds hereby designate the amounts noted below as distributions paid during the fiscal year ended 2024 as qualifying to be taxed as section 163(j) interest dividends:
| Fidelity Canada Fund | $45,719 |
| Fidelity China Region Fund | $509,124 |
| Fidelity Emerging Markets Fund | $1,554,270 |
| Fidelity Japan Smaller Companies Fund | $109,001 |
A percentage of the dividends distributed during the fiscal year for the following funds qualify for the dividends-received deduction for corporate shareholders:
| | Class A | Class M | Class C | Retail | Class K | Class I | Class Z | |
| Fidelity China Region Fund | | | | | | | | |
| December 01, 2023 | 0% | 0% | 1% | 0% | - | 0% | 0% | |
| December 27, 2023 | 1% | 1% | 1% | 1% | - | 1% | 1% | |
| Fidelity Europe Fund | | | | | | | | |
| December 08, 2023 | 0% | 0% | 2% | 0% | - | 0% | 0% | |
| Fidelity Nordic Fund | | | | | | | | |
| December 08, 2023 | - | - | - | 7% | - | - | - | |
| December 27, 2023 | - | - | - | 7% | - | - | - | |
| Fidelity Pacific Basin Fund | | | | | | | | |
| December 08, 2023 | - | - | - | 1% | - | - | - | |
| | | | | | | | | |
A percentage of the dividends distributed during the fiscal year for the following funds may be taken into account as a dividend for purposes of the maximum rate under section 1(h)(11) of the Internal Revenue Code.
| | Class A | Class M | Class C | Retail | Class K | Class I | Class Z |
| Fidelity Canada Fund | | | | | | | |
| December 08, 2023 | 100% | 100% | 100% | 100% | - | 100% | 100% |
| Fidelity China Region Fund | | | | | | | |
| December 01, 2023 | 53.14% | 64.57% | 100% | 43.87% | - | 44.81% | 40.11% |
| December 27, 2023 | 60.83% | 60.83% | 60.83% | 60.83% | - | 60.83% | 60.83% |
| Fidelity Emerging Asia Fund | | | | | | | |
| December 01, 2023 | - | - | - | 25.37% | - | - | - |
| Fidelity Emerging Markets Fund | | | | | | | |
| December 08, 2023 | 93.96% | 100% | 100% | 75.32% | 68.39% | 74.37% | 68.65% |
| December 27, 2023 | 79.21% | 79.21% | 79.21% | 79.21% | 79.21% | 79.21% | 79.21% |
| Fidelity Europe Fund | | | | | | | |
| December 08, 2023 | 100% | 100% | 100% | 100% | - | 100% | 100% |
| Fidelity Japan Fund | | | | | | | |
| December 08, 2023 | 100% | 100% | - | 100% | - | 100% | 100% |
| Fidelity Japan Smaller Companies Fund | | | | | | | |
| December 08, 2023 | - | - | - | 57.93% | - | - | - |
| Fidelity Latin America Fund | | | | | | | |
| December 08, 2023 | 23.00% | 24.52% | 26.67% | 21.78% | - | 21.34% | 20.86% |
| December 29, 2023 | 12.42% | 12.42% | 12.42% | 12.42% | - | 12.42% | 12.42% |
| September 10, 2024 | 58.55% | 62.18% | 75.46% | 53.66% | - | 60.68% | 50.83% |
| Fidelity Nordic Fund | | | | | | | |
| December 08, 2023 | - | - | - | 100% | - | - | - |
| December 27, 2023 | - | - | - | 100% | - | - | - |
| Fidelity Pacific Basin Fund | | | | | | | |
| December 08, 2023 | - | - | - | 53.13% | - | - | - |
The amounts per share which represent income derived from sources within, and taxes paid to, foreign countries or possessions of the United States are as follows:
| | Pay Date | Income | Taxes |
| Fidelity Canada Fund | | | |
| Class A | 12/11/2023 | $0.8197 | $0.1742 |
| Class M | 12/11/2023 | $0.6673 | $0.1742 |
| Class C | 12/11/2023 | $0.3159 | $0.1742 |
| Canada | 12/11/2023 | $1.0187 | $0.1742 |
| Class I | 12/11/2023 | $1.0187 | $0.1742 |
| Class Z | 12/11/2023 | $1.1008 | $0.1742 |
| Fidelity China Region Fund | | | |
| Class A | 12/04/2023 | $0.5320 | $0.0768 |
| | 12/28/2023 | $0.0000 | $0.0000 |
| Class M | 12/04/2023 | $0.4378 | $0.0768 |
| | 12/28/2023 | $0.0000 | $0.0000 |
| Class C | 12/04/2023 | $0.2351 | $0.0768 |
| | 12/28/2023 | $0.0000 | $0.0000 |
| China Region | 12/04/2023 | $0.6443 | $0.0768 |
| | 12/28/2023 | $0.0000 | $0.0000 |
| Class I | 12/04/2023 | $0.6309 | $0.0768 |
| | 12/28/2023 | $0.0000 | $0.0000 |
| Class Z | 12/04/2023 | $0.7049 | $0.0768 |
| | 12/28/2023 | $0.0000 | $0.0000 |
| Fidelity Emerging Asia Fund | | | |
| Emerging Asia | 12/04/2023 | $0.1363 | $0.1246 |
| Fidelity Emerging Markets Fund | | | |
| Class A | 12/11/2023 | $0.3673 | $0.0976 |
| | 12/28/2023 | $0.0000 | $0.0000 |
| Class M | 12/11/2023 | $0.3092 | $0.0976 |
| | 12/28/2023 | $0.0000 | $0.0000 |
| Class C | 12/11/2023 | $0.1186 | $0.0976 |
| | 12/28/2023 | $0.0000 | $0.0000 |
| Emerging Markets | 12/11/2023 | $0.4582 | $0.0976 |
| | 12/28/2023 | $0.0000 | $0.0000 |
| Class K | 12/11/2023 | $0.5047 | $0.0976 |
| | 12/28/2023 | $0.0000 | $0.0000 |
| Class I | 12/11/2023 | $0.4640 | $0.0976 |
| | 12/28/2023 | $0.0000 | $0.0000 |
| Class Z | 12/11/2023 | $0.5027 | $0.0976 |
| | 12/28/2023 | $0.0000 | $0.0000 |
| Fidelity Europe Fund | | | |
| Class A | 12/11/2023 | $0.4575 | $0.0385 |
| Class M | 12/11/2023 | $0.3588 | $0.0385 |
| Class C | 12/11/2023 | $0.1128 | $0.0385 |
| Europe | 12/11/2023 | $0.5815 | $0.0385 |
| Class I | 12/11/2023 | $0.5873 | $0.0385 |
| Class Z | 12/11/2023 | $0.6322 | $0.0385 |
| Fidelity Japan Fund | | | |
| Class A | 12/11/2023 | $0.1235 | $0.0315 |
| Class M | 12/11/2023 | $0.0659 | $0.0315 |
| Class C | 12/11/2023 | $0.0000 | $0.0000 |
| Japan | 12/11/2023 | $0.1651 | $0.0315 |
| Class I | 12/11/2023 | $0.1671 | $0.0315 |
| Class Z | 12/11/2023 | $0.1909 | $0.0315 |
| Fidelity Japan Smaller Companies Fund | | | |
| Japan Smaller Companies | 12/11/2023 | $0.3417 | $0.0247 |
| Fidelity Latin America Fund | | | |
| Class A | 12/11/2023 | $0.8152 | $0.0472 |
| | 01/02/2024 | $0.0000 | $0.0000 |
| | 09/11/2024 | $0.3109 | $0.0494 |
| Class M | 12/11/2023 | $0.7645 | $0.0472 |
| | 01/02/2024 | $0.0000 | $0.0000 |
| | 09/11/2024 | $0.4749 | $0.0802 |
| Class C | 12/11/2023 | $0.7029 | $0.0472 |
| | 01/02/2024 | $0.0000 | $0.0000 |
| | 09/11/2024 | $0.3888 | $0.0472 |
| Latin America | 12/11/2023 | $0.8609 | $0.0472 |
| | 01/02/2024 | $0.0000 | $0.0000 |
| | 09/11/2024 | $0.3789 | $0.0472 |
| Class I | 12/11/2023 | $0.8788 | $0.0472 |
| | 01/02/2024 | $0.0000 | $0.0000 |
| | 09/11/2024 | $0.4265 | $0.0703 |
| Class Z | 12/11/2023 | $0.8987 | $0.0472 |
| | 01/02/2024 | $0.0000 | $0.0000 |
| | 09/11/2024 | $0.4879 | $0.0674 |
| Fidelity Pacific Basin Fund | | | |
| Pacific Basin | 12/11/2023 | $0.5335 | $0.0969 |
The funds will notify shareholders in January 2025 of amounts for use in preparing 2024 income tax returns.
Item 8: Changes in and Disagreements with Accountants for Open-End Management Investment Companies
(Unaudited)
Note: This is not applicable for any fund included in this document.
Item 9: Proxy Disclosures for Open-End Management Investment Companies
(Unaudited)
| A special meeting of shareholders was held on July 16, 2024. The results of votes taken among shareholders on the proposal before them are reported below. Each vote reported represents one dollar of net asset value held on the record date for the meeting. |
| Proposal 1 |
| To elect a Board of Trustees. |
| | # of Votes | % of Votes |
| Bettina Doulton |
| Affirmative | 128,529,177,643.56 | 98.18 |
| Withheld | 2,378,037,364.30 | 1.82 |
| TOTAL | 130,907,215,007.85 | 100.00 |
| Robert A. Lawrence |
| Affirmative | 128,253,389,899.05 | 97.97 |
| Withheld | 2,653,825,108.81 | 2.03 |
| TOTAL | 130,907,215,007.85 | 100.00 |
| Vijay C. Advani |
| Affirmative | 128,531,418,228.19 | 98.19 |
| Withheld | 2,375,796,779.66 | 1.81 |
| TOTAL | 130,907,215,007.85 | 100.00 |
| Thomas P. Bostick |
| Affirmative | 128,495,261,591.41 | 98.16 |
| Withheld | 2,411,953,416.44 | 1.84 |
| TOTAL | 130,907,215,007.85 | 100.00 |
| Donald F. Donahue |
| Affirmative | 128,407,878,996.00 | 98.09 |
| Withheld | 2,499,336,011.85 | 1.91 |
| TOTAL | 130,907,215,007.85 | 100.00 |
| Vicki L. Fuller |
| Affirmative | 128,625,540,095.19 | 98.26 |
| Withheld | 2,281,674,912.66 | 1.74 |
| TOTAL | 130,907,215,007.85 | 100.00 |
| Patricia L. Kampling |
| Affirmative | 128,668,729,281.34 | 98.29 |
| Withheld | 2,238,485,726.51 | 1.71 |
| TOTAL | 130,907,215,007.85 | 100.00 |
| Thomas A. Kennedy |
| Affirmative | 128,499,824,239.79 | 98.16 |
| Withheld | 2,407,390,768.06 | 1.84 |
| TOTAL | 130,907,215,007.85 | 100.00 |
| Oscar Munoz |
| Affirmative | 128,386,109,391.05 | 98.07 |
| Withheld | 2,521,105,616.80 | 1.93 |
| TOTAL | 130,907,215,007.85 | 100.00 |
| Karen B. Peetz |
| Affirmative | 128,603,731,113.82 | 98.24 |
| Withheld | 2,303,483,894.03 | 1.76 |
| TOTAL | 130,907,215,007.85 | 100.00 |
| David M. Thomas |
| Affirmative | 128,384,899,342.98 | 98.07 |
| Withheld | 2,522,315,664.88 | 1.93 |
| TOTAL | 130,907,215,007.85 | 100.00 |
| Susan Tomasky |
| Affirmative | 128,556,148,461.60 | 98.20 |
| Withheld | 2,351,066,546.25 | 1.80 |
| TOTAL | 130,907,215,007.85 | 100.00 |
| Michael E. Wiley |
| Affirmative | 128,264,934,978.34 | 97.98 |
| Withheld | 2,642,280,029.51 | 2.02 |
| TOTAL | 130,907,215,007.85 | 100.00 |
| | | |
| Proposal 1 reflects trust-wide proposal and voting results. |
Item 10: Remuneration Paid to Directors, Officers, and others of Open-End Management Investment Companies
(Unaudited)
Note: This information is disclosed as part of the financial statements for each Fund as part of Item 7: Financial Statements and Financial Highlights for Open-End Management Investment companies.
Item 11: Statement Regarding Basis for Approval of Investment Advisory Contract
(Unaudited)
Board Approval of Investment Advisory Contracts and Management Fees
Fidelity Canada Fund
Fidelity China Region Fund
Fidelity Emerging Asia Fund
Fidelity Emerging Markets Fund
Fidelity Europe Fund
Fidelity Japan Fund
Fidelity Japan Smaller Companies Fund
Fidelity Nordic Fund
Fidelity Pacific Basin Fund
Each year, the Board of Trustees, including the Independent Trustees (together, the Board), considers the renewal of each fund's management contract with Fidelity Management & Research Company LLC (FMR) and certain affiliates and the sub-advisory agreements (together, the Advisory Contracts) for each fund. FMR and the sub-advisers are referred to herein as the Investment Advisers. The Board, assisted by the advice of fund counsel and Independent Trustees' counsel, requests and considers a broad range of information relevant to the renewal of the Advisory Contracts throughout the year.
The Board meets regularly and, at each of its meetings, covers an extensive agenda of topics and materials and considers factors that are relevant to its annual consideration of the renewal of each fund's Advisory Contracts, including the services and support provided to each fund and its shareholders. The Board, acting directly and through its Committees (each of which is composed of and chaired by Independent Trustees), requests and receives information concerning the annual consideration of the renewal of each fund's Advisory Contracts. The Board also meets as needed to review matters specifically related to the Board's annual consideration of the renewal of the Advisory Contracts. Members of the Board may also meet with trustees of other Fidelity funds through joint ad hoc committees to discuss certain matters relevant to all of the Fidelity funds.
At its May 2024 meeting, the Board unanimously determined to renew each fund's Advisory Contracts. In reaching its determination, the Board considered all factors it believed relevant, including (i) the nature, extent, and quality of the services provided to each fund and its shareholders (including the investment performance of each fund); (ii) the competitiveness relative to peer funds of each fund's management fee and total expense ratio of the fund or a representative class, as applicable (the representative class was selected because it was the largest class without 12b-1 fees); (iii) the total costs of the services provided by and the profits realized by FMR and its affiliates (Fidelity) from its relationships with each fund; and (iv) the extent to which, if any, economies of scale exist and are realized as each fund grows, and whether any economies of scale are appropriately shared with fund shareholders. The Board also considered the broad range of investment choices available to shareholders from FMR's competitors and that each fund's shareholders have chosen to invest in that fund, which is part of the Fidelity family of funds. The Board's decision to renew the Advisory Contracts was not based on any single factor.
The Board reached a determination, with the assistance of fund counsel and Independent Trustees' counsel and through the exercise of its business judgment, that the renewal of the Advisory Contracts was in the best interests of each fund and its shareholders and that the compensation payable under the Advisory Contracts was fair and reasonable in light of all of the surrounding circumstances.
Nature, Extent, and Quality of Services Provided. The Board considered staffing as it relates to the funds, including the backgrounds and experience of investment personnel of the Investment Advisers, and also considered the Investment Advisers' implementation of each fund's investment program. The Independent Trustees also had discussions with senior management of Fidelity's investment operations and investment groups. The Board considered the structure of the investment personnel compensation program and whether this structure provides appropriate incentives to act in the best interests of each fund. Additionally, the Board considered the portfolio managers' investments, if any, in the funds that they manage.
Resources Dedicated to Investment Management and Support Services. The Board and the Fund Oversight and Research Committees reviewed the general qualifications and capabilities of Fidelity's investment staff, including its size, education, experience, and resources, as well as Fidelity's approach to recruiting, training, managing, and compensating investment personnel. The Board noted the resources devoted to expansion of Fidelity's global investment organization, and that Fidelity's analysts have extensive resources, tools and capabilities that allow them to conduct sophisticated quantitative and fundamental analysis, as well as credit analysis of issuers, counterparties, and guarantors. Further, the Board considered that Fidelity's investment professionals have sufficient access to global information and data so as to provide competitive investment results over time, and that those professionals also have access to sophisticated tools that permit them to assess portfolio construction and risk and performance attribution characteristics continuously, as well as to transmit new information and research conclusions rapidly around the world. Additionally, in its deliberations, the Board considered Fidelity's trading, risk management, compliance, and technology and operations capabilities and resources, which are integral parts of the investment management process.
Shareholder and Administrative Services. The Board considered (i) the nature, extent, quality, and cost of advisory, administrative, shareholder, transfer agency, and pricing and bookkeeping services performed by the Investment Advisers and their affiliates under the Advisory Contracts; (ii) the nature and extent of Fidelity's supervision of third party service providers, principally custodians, subcustodians, and pricing vendors; and (iii) the resources devoted by Fidelity to, and the record of compliance with, each fund's compliance policies and procedures. The Board also reviewed the allocation of fund brokerage, including allocations to brokers affiliated with the Investment Advisers, the use of brokerage commissions to pay fund expenses, and the use of "soft" commission dollars to pay for research services. The Board also considered each fund's securities lending activities and any payments made to Fidelity relating to securities lending under separate agreements.
The Board noted that the growth of fund assets over time across the complex allows Fidelity to reinvest in the development of services designed to enhance the value and convenience of the Fidelity funds as investment vehicles. These services include 24-hour access to account information and market information over the Internet and through telephone representatives, investor education materials, and asset allocation tools. The Board also considered that it reviews customer service metrics such as telephone response times, continuity of services on the website and metrics addressing services at Fidelity Investor Centers.
Investment in a Large Fund Family. The Board considered the benefits to shareholders of investing in a fund that is part of a large family of funds offering a variety of investment disciplines and providing a large variety of fund investor services. The Board noted that Fidelity had taken, or had made recommendations that resulted in the Fidelity funds taking, a number of actions over the previous year that benefited particular funds and/or the Fidelity funds in general.
Investment Performance. The Board took into account discussions that occur with representatives of the Investment Advisers, and reports that it receives, at Board meetings throughout the year, relating to fund investment performance. In this regard the Board noted that as part of regularly scheduled fund reviews and other reports to the Board on fund performance, the Board considered annualized return information for each fund for different time periods, measured against an appropriate securities market index (benchmark index) and, for Fidelity Emerging Markets Fund, Fidelity Europe Fund, and Fidelity Japan Fund, an appropriate peer group of funds with similar objectives (peer group). The Board also considered information about performance attribution. In its ongoing evaluation of fund investment performance, the Board gives particular attention to information indicating changes in performance of the funds over different time periods and discussed with the Investment Advisers the reasons for any overperformance or underperformance. Each of Fidelity Europe Fund and Fidelity Japan Fund underperformed its benchmark and peers for the one- and three-year periods ended February 29, 2024. As a result, the Board continues to engage in discussions with FMR about the steps it is taking to address the fund's performance.
In addition to reviewing absolute and relative fund performance, the Independent Trustees periodically consider the appropriateness of fund performance metrics in evaluating the results achieved. The Independent Trustees generally give greater weight to fund performance over longer time periods than over shorter time periods. Depending on the circumstances, the Independent Trustees may be satisfied with a fund's performance notwithstanding that it lags its benchmark index or peer group for certain periods.
Based on its review, the Board concluded that the nature, extent, and quality of services provided to each fund under the Advisory Contracts should continue to benefit the shareholders of each fund.
Competitiveness of Management Fee and Total Expense Ratio. The Board was provided with information regarding industry trends in management fees and expenses. The Board considered that, effective March 1, 2024, an amended Advisory Contract with FMR went into effect for each fund with each fund's management fee based on tiered schedules and subject to a maximum class-level rate (the management fee). The Board also considered that, in exchange for the variable management fee, each class of each fund receives investment advisory, management, administrative, transfer agent, and pricing and bookkeeping services. In its review of each fund's management fee and the total expense ratio of the fund (for Fidelity Emerging Asia Fund, Fidelity Japan Smaller Companies Fund, Fidelity Nordic Fund, and Fidelity Pacific Basin Fund) or the retail class of each fund (for Fidelity Canada Fund, Fidelity China Region Fund, Fidelity Emerging Markets Fund, Fidelity Europe Fund, and Fidelity Japan Fund), the Board considered each fund's or each retail class's pro rata management fee rate, as applicable, as if it had been in effect for the 12-month period ended September 30, 2023, as well as other third-party fund expenses, as applicable, such as custodial, legal, and audit fees and fund paid 12b-1 fees (for Fidelity Canada Fund, Fidelity China Region Fund, Fidelity Emerging Markets Fund, Fidelity Europe Fund, and Fidelity Japan Fund). The Board also noted that Fidelity may agree to waive fees or reimburse expenses from time to time, and the extent to which, if any, it has done so for each fund. The Board also considered information about the impact of each fund's performance adjustment for Fidelity Canada Fund, Fidelity Emerging Asia Fund, Fidelity Europe Fund, Fidelity Japan Fund, and Fidelity Pacific Basin Fund.
Comparisons of Management Fees and Total Expense Ratios. Among other things, the Board reviewed data for selected groups of competitive funds and classes (referred to as "mapped groups") that were compiled by Fidelity based on combining similar investment objective categories (as classified by Lipper) that have comparable investment mandates. The data reviewed by the Board included (i) gross management fee comparisons (before taking into account expense reimbursements or caps and without taking into account a fund's performance adjustment, if applicable) relative to the total universe of funds within the mapped group; (ii) gross management fee comparisons relative to a subset of non-Fidelity funds in the mapped group that are similar in size and management fee structure to each fund (referred to as the "asset size peer group"); (iii) total expense comparisons of the fund or the retail class, as applicable, relative to funds and classes in the mapped group that have a similar sales load structure to the fund or representative class, as applicable (referred to as the "similar sales load structure group"); and (iv) total expense comparisons of the fund or the retail class, as applicable, relative to funds and classes in the similar sales load structure group that are similar in size and management fee structure to the fund or class, as applicable (referred to as the "total expense asset size peer group"). The total expense asset size peer group comparison excludes performance adjustments and fund-paid 12b-1 fees to eliminate variability in fee structures.
The information provided to the Board indicated that each fund's management fee rate ranked below the competitive median of the mapped group for the 12-month period ended September 30, 2023 (for Fidelity Canada Fund, Fidelity China Region Fund, Fidelity Emerging Asia Fund, Fidelity Emerging Markets Fund, and Fidelity Nordic Fund) and above the competitive median of the mapped group for the 12-month period ended September 30, 2023 (for Fidelity Europe Fund, Fidelity Japan Fund, Fidelity Japan Smaller Companies Fund, and Fidelity Pacific Basin Fund). The information provided to the Board indicated that each fund's management fee rate ranked below the competitive median of the asset size peer group for the 12-month period ended September 30, 2023.
For each fund (except Fidelity Pacific Basin Fund), the information provided to the Board indicated that the total expense ratio of the fund or the retail class of the fund, as applicable, ranked below the competitive median of the similar sales load structure group for the 12-month period ended September 30, 2023 and below the competitive median of the asset size peer group for the 12-month period ended September 30, 2023.
For Fidelity Pacific Basin Fund, the information provided to the Board indicated that the total expense ratio of the fund ranked above the competitive median of the similar sales load structure group for the 12-month period ended September 30, 2023 and below the competitive median of the asset size peer group for the 12-month period ended September 30, 2023. When excluding the effect of the fund's positive performance adjustment, the total expense ratio for the fund would rank below the similar sales load structure group median.
For Fidelity Canada Fund, Fidelity China Region Fund, Fidelity Emerging Markets Fund, Fidelity Europe Fund, and Fidelity Japan Fund, the Board noted that a different variable management fee rate is applicable to each class of the fund. The Board considered that the difference in management fee rates between classes is the result of separate arrangements for class-level services and/or waivers of certain expenses and not the result of any difference in advisory or custodial fees or other expenses related to the management of the fund's assets, which do not vary by class.
For Fidelity Canada Fund, Fidelity Emerging Asia Fund, Fidelity Europe Fund, Fidelity Japan Fund and Fidelity Pacific Basin Fund, the Board also considered that each fund's management fee is subject to upward or downward adjustment depending upon whether, and to what extent, each fund's investment performance for the performance period (a rolling 36-month period) exceeds, or is exceeded by, a securities index, thus leading to a performance adjustment for the same period. The Board noted that the performance adjustment provides FMR with a strong economic incentive to seek to achieve superior long-term performance for each fund's shareholders and helps to more closely align the interests of FMR and the shareholders of each fund.
For Fidelity Canada Fund, Fidelity Europe Fund and Fidelity Japan Fund, in connection with its consideration of each fund's performance adjustment, the Board noted that the performance of the retail class is used for purposes of determining the performance adjustment. The Board noted that to the extent the performance adjustment was based on the performance of a share class with higher total annual operating expenses, the fund would be subject to a smaller positive and larger negative performance adjustment. The Board considered the appropriateness of the use of the retail class as the basis for the performance adjustment. The Board noted that the retail class is typically the largest class (reflecting the actual investment experience for the plurality of shareholders), employs a standard expense structure, and does not include fund-paid 12b-1 fees, which Fidelity believes makes it a more appropriate measurement of Fidelity's investment skill.
Fees Charged to Other Fidelity Clients. The Board also considered Fidelity fee structures and other information with respect to clients of Fidelity, such as other funds advised or subadvised by Fidelity, pension plan clients, and other institutional clients with similar mandates. The Board noted that a joint ad hoc committee created by it and the boards of other Fidelity funds periodically reviews and compares Fidelity's institutional investment advisory business with its business of providing services to the Fidelity funds and also noted the most recent findings of the committee. The Board noted that the committee's review included a consideration of the differences in services provided, fees charged, and costs incurred, as well as competition in the markets serving the different categories of clients.
Based on its review, the Board concluded that each fund's management fee, including the use of the retail class as the basis for the performance adjustment (for Fidelity Canada Fund, Fidelity Emerging Markets Fund, Fidelity Europe Fund and Fidelity Japan Fund), is fair and reasonable in light of the services that each fund receives and the other factors considered. Further, based on its review of total expense ratios and fees charged to other Fidelity clients, the Board concluded that the total expense ratio of each fund or each class of each fund, as applicable, was reasonable in light of the services that the fund and its shareholders receive and the other factors considered.
Costs of the Services and Profitability. The Board considered the revenues earned and the expenses incurred by Fidelity in conducting the business of developing, marketing, distributing, managing, administering and servicing each fund and servicing each fund's shareholders. The Board also considered the level of Fidelity's profits in respect of all the Fidelity funds.
On an annual basis, Fidelity presents to the Board information about the profitability of its relationships with each fund. Fidelity calculates profitability information for each fund, as well as aggregate profitability information for groups of Fidelity funds and all Fidelity funds, using a series of detailed revenue and cost allocation methodologies which originate with the books and records of Fidelity on which Fidelity's audited financial statements are based. The Audit Committee of the Board reviews any significant changes from the prior year's methodologies.
A public accounting firm has been engaged annually by the Board as part of the Board's assessment of Fidelity's profitability analysis. The engagement includes the review and assessment of the methodologies used by Fidelity in determining the revenues and expenses attributable to Fidelity's fund business, and completion of agreed-upon procedures in respect of the mathematical accuracy of certain fund profitability information and its conformity to established allocation methodologies. After considering the reports issued under the engagement and information provided by Fidelity, the Board concluded that while other allocation methods may also be reasonable, Fidelity's profitability methodologies are reasonable in all material respects.
The Board also reviewed Fidelity's non-fund businesses and potential indirect benefits such businesses may have received as a result of their association with Fidelity's fund business (i.e., fall-out benefits) as well as cases where Fidelity's affiliates may benefit from the funds' business. The Board considered areas where potential indirect benefits to the Fidelity funds from their relationships with Fidelity may exist. The Board's consideration of these matters was informed by the findings of a joint ad hoc committee created by it and the boards of other Fidelity funds to evaluate potential fall-out benefits.
The Board considered the costs of the services provided by and the profits realized by Fidelity in connection with the operation of each fund and was satisfied that the profitability was not excessive.
Economies of Scale. The Board considered whether there have been economies of scale in respect of the management of the Fidelity funds, whether the Fidelity funds (including each fund) have appropriately benefited from any such economies of scale, and whether there is potential for realization of any further economies of scale. The Board considered the extent to which each fund will benefit from economies of scale as assets grow through increased services to the fund, through waivers or reimbursements, or through fee or expense ratio reductions. The Board also noted that a committee created by it and the boards of other Fidelity funds periodically analyzes whether Fidelity attains economies of scale in respect of the management and servicing of the Fidelity funds, whether the Fidelity funds have appropriately benefited from such economies of scale, and whether there is potential for realization of any further economies of scale.
The Board recognized that each fund's management contract incorporates a variable management fee structure, which provides for breakpoints as a way to share, in part, any potential economies of scale that may exist at the asset class level and through a discount that considers both fund size and total assets of the four applicable asset classes. The Board considered that the variable management fee is designed to deliver the benefits of economies of scale to fund shareholders even if assets of any particular fund are unchanged or have declined, because some portion of Fidelity's costs are attributable to services provided to all Fidelity funds subject to the variable management fee, and all such funds benefit if those costs can be allocated among more assets. The Board concluded that, given the variable management fee structure, fund shareholders will benefit from lower management fees due to the application of the breakpoints and discount factor, regardless of whether Fidelity achieves any such economies of scale.
The Board concluded, taking into account the analysis of the committee, that economies of scale, if any, are being appropriately shared between fund shareholders and Fidelity.
Additional Information Requested by the Board. In order to develop fully the factual basis for consideration of the Fidelity funds' advisory contracts, the Board requested and received additional information on certain topics, including, but not limited to: (i) fund flow and performance trends, in particular the underperformance of certain funds and strategies, and Fidelity's long-term strategies for certain funds; (ii) the operation of performance fees and the rationale for implementing performance fees on certain categories of funds but not others; (iii) Fidelity's pricing philosophy compared to competitors; (iv) fund profitability methodology and data; (v) evaluation of competitive fund data and peer group classifications and fee and expense comparisons; (vi) the management fee and expense structures for different funds and classes and information about the differences between various fee and expense structures; (vii) the variable management fee implemented for certain funds effective March 1, 2024; and (viii) information regarding other accounts managed by Fidelity and the funds' sub-advisory arrangements.
Conclusion. Based on its evaluation of all of the conclusions noted above, and after considering all factors it believed relevant, the Board, including the Independent Trustees, concluded that the advisory and sub-advisory fee arrangements are fair and reasonable in light of all of the surrounding circumstances and that each fund's Advisory Contracts should be renewed through May 31, 2025.
1.754542.124
TIF-ANN-1224
Fidelity® International Small Cap Fund
Annual Report
October 31, 2024
Includes Fidelity and Fidelity Advisor share classes
Contents
To view a fund's proxy voting guidelines and proxy voting record for the 12-month period ended June 30, visit http://www.fidelity.com/proxyvotingresults or visit the Securities and Exchange Commission's (SEC) web site at http://www.sec.gov.
You may also call 1-800-544-8544 if you're an individual investing directly with Fidelity, call 1-800-835-5092 if you're a plan sponsor or participant with Fidelity as your recordkeeper or call 1-877-208-0098 on institutional accounts or if you're an advisor or invest through one to request a free copy of the proxy voting guidelines.
Standard & Poor's, S&P and S&P 500 are registered service marks of The McGraw-Hill Companies, Inc. and have been licensed for use by Fidelity Distributors Corporation.
Other third-party marks appearing herein are the property of their respective owners.
All other marks appearing herein are registered or unregistered trademarks or service marks of FMR LLC or an affiliated company. © 2024 FMR LLC. All rights reserved.
This report and the financial statements contained herein are submitted for the general information of the shareholders of the Fund. This report is not authorized for distribution to prospective investors in the Fund unless preceded or accompanied by an effective prospectus.
A fund files its complete schedule of portfolio holdings with the SEC for the first and third quarters of each fiscal year on Form N-PORT. Forms N-PORT are available on the SEC's web site at http://www.sec.gov. A fund's Forms N-PORT may be reviewed and copied at the SEC's Public Reference Room in Washington, DC. Information regarding the operation of the SEC's Public Reference Room may be obtained by calling 1-800-SEC-0330.
For a complete list of a fund's portfolio holdings, view the most recent holdings listing, semiannual report, or annual report on Fidelity's web site at http://www.fidelity.com, http://www.institutional.fidelity.com, or http://www.401k.com, as applicable.
NOT FDIC INSURED •MAY LOSE VALUE •NO BANK GUARANTEE
Neither the Fund nor Fidelity Distributors Corporation is a bank.
Item 7: Financial Statements and Financial Highlights for Open-End Management Investment Companies (Annual Report)
Fidelity® International Small Cap Fund
Schedule of Investments October 31, 2024
Showing Percentage of Net Assets
| Common Stocks - 95.8% |
| | | Shares | Value ($) |
| Australia - 3.3% | | | |
| Amotiv Ltd. | | 3,180,629 | 22,137,787 |
| Aub Group Ltd. | | 1,199,431 | 25,136,756 |
| Imdex Ltd. | | 15,235,985 | 25,883,372 |
| Inghams Group Ltd. | | 12,709,168 | 23,888,644 |
| National Storage REIT unit | | 10,281,996 | 16,915,917 |
| NIB Holdings Ltd. | | 5,191,035 | 19,649,883 |
| Servcorp Ltd. (a) | | 7,066,585 | 23,181,584 |
TOTAL AUSTRALIA | | | 156,793,943 |
| Austria - 2.2% | | | |
| EuroTeleSites AG (b) | | 2,464,193 | 13,294,913 |
| Mayr-Melnhof Karton AG | | 249,700 | 22,136,311 |
| Strabag SE | | 336,597 | 13,272,335 |
| Telekom Austria AG | | 3,160,400 | 26,229,843 |
| Wienerberger AG | | 946,000 | 28,503,619 |
TOTAL AUSTRIA | | | 103,437,021 |
| Belgium - 1.0% | | | |
| Econocom Group SA | | 4,581,895 | 9,828,362 |
| Fagron NV | | 1,854,100 | 37,391,421 |
TOTAL BELGIUM | | | 47,219,783 |
| Brazil - 1.3% | | | |
| Afya Ltd. Class A (b) | | 1,560,200 | 26,148,952 |
| Atacadao SA | | 11,486,200 | 14,882,049 |
| Hypera SA (b) | | 5,722,400 | 21,876,358 |
TOTAL BRAZIL | | | 62,907,359 |
| Canada - 4.2% | | | |
| CCL Industries, Inc. Class B | | 443,900 | 25,894,034 |
| ECN Capital Corp. | | 5,364,300 | 8,514,456 |
| Genesis Land Development Corp. (a) | | 4,888,699 | 14,606,233 |
| Lassonde Industries, Inc. Class A (sub. vtg.) | | 310,699 | 39,372,091 |
| North West Co., Inc. | | 1,234,900 | 46,483,362 |
| Open Text Corp. | | 755,296 | 22,653,184 |
| Parkland Corp. | | 711,400 | 16,554,286 |
| Quebecor, Inc. Class A | | 576,770 | 14,084,232 |
| Richelieu Hardware Ltd. | | 300,900 | 7,929,056 |
| Total Energy Services, Inc. | | 962,500 | 6,650,088 |
TOTAL CANADA | | | 202,741,022 |
| China - 3.1% | | | |
| Best Pacific International Holdings Ltd. | | 22,158,900 | 7,436,447 |
| Chervon Holdings Ltd. | | 1,329,000 | 3,499,813 |
| Far East Horizon Ltd. | | 28,280,000 | 19,739,142 |
| Impro Precision Industries Ltd. (c) | | 28,423,300 | 8,335,641 |
| Precision Tsugami China Corp. Ltd. | | 10,774,453 | 15,307,826 |
| Qingdao Port International Co. Ltd. (H Shares) (c) | | 40,373,000 | 28,286,771 |
| Shenzhen YUTO Packaging Technology Co. Ltd. (A Shares) | | 5,606,766 | 20,081,501 |
| Sinopharm Group Co. Ltd. (H Shares) | | 7,144,800 | 17,799,778 |
| Weifu High-Technology Group Co. Ltd. (B Shares) | | 8,579,471 | 13,966,093 |
| Xingda International Holdings Ltd. | | 78,454,353 | 12,802,069 |
TOTAL CHINA | | | 147,255,081 |
| Denmark - 0.6% | | | |
| Spar Nord Bank A/S | | 1,398,975 | 26,927,885 |
| Finland - 1.1% | | | |
| Huhtamaki Oyj | | 963,100 | 37,755,937 |
| Tokmanni Group Corp. | | 1,195,500 | 13,628,246 |
TOTAL FINLAND | | | 51,384,183 |
| France - 2.6% | | | |
| Altarea SCA | | 157,193 | 17,269,655 |
| Antin Infrastructure Partners SA | | 405,055 | 4,643,909 |
| ARGAN SA | | 337,200 | 24,941,672 |
| Ipsos SA | | 441,200 | 21,634,582 |
| Thermador Groupe SA | | 404,966 | 31,451,826 |
| Vallourec SA (b) | | 1,594,400 | 26,101,344 |
TOTAL FRANCE | | | 126,042,988 |
| Germany - 3.0% | | | |
| JOST Werke AG (c) | | 437,020 | 20,583,456 |
| NORMA Group AG | | 623,692 | 8,656,652 |
| Rheinmetall AG | | 120,725 | 62,139,970 |
| Stabilus Se | | 372,000 | 14,708,773 |
| Takkt AG | | 1,304,225 | 12,739,663 |
| Talanx AG | | 326,467 | 25,195,372 |
TOTAL GERMANY | | | 144,023,886 |
| Greece - 1.6% | | | |
| Athens International Airport SA | | 2,498,200 | 21,331,724 |
| Metlen Energy & Metals SA | | 1,101,416 | 38,409,972 |
| OPAP SA | | 969,300 | 16,532,303 |
TOTAL GREECE | | | 76,273,999 |
| Hong Kong - 2.1% | | | |
| ASMPT Ltd. | | 3,033,900 | 32,890,027 |
| China Metal Recycling (Holdings) Ltd. (b)(d) | | 436,800 | 1 |
| HKT Trust/HKT Ltd. unit | | 16,166,000 | 20,089,593 |
| Magnificent Hotel Investment Ltd. (b) | | 316,412,000 | 2,785,888 |
| Pico Far East Holdings Ltd. | | 61,300,071 | 14,498,035 |
| Sino Land Ltd. | | 13,064,375 | 13,074,277 |
| WH Group Ltd. (c) | | 22,648,500 | 17,627,700 |
TOTAL HONG KONG | | | 100,965,521 |
| Hungary - 0.9% | | | |
| Richter Gedeon PLC | | 1,497,000 | 43,242,140 |
| India - 2.5% | | | |
| Embassy Office Parks (REIT) | | 5,935,400 | 27,871,755 |
| IndusInd Bank Ltd. | | 1,084,400 | 13,566,102 |
| Mahanagar Gas Ltd. | | 1,841,800 | 31,492,669 |
| Shriram Finance Ltd. | | 1,216,052 | 45,147,427 |
TOTAL INDIA | | | 118,077,953 |
| Indonesia - 0.5% | | | |
| PT Selamat Sempurna Tbk | | 197,940,200 | 24,121,463 |
| Ireland - 1.6% | | | |
| AerCap Holdings NV | | 335,172 | 31,355,341 |
| Dalata Hotel Group PLC | | 5,341,409 | 24,867,304 |
| Irish Residential Properties REIT PLC | | 16,285,700 | 15,411,850 |
| Mincon Group PLC (a) | | 13,529,844 | 6,475,519 |
TOTAL IRELAND | | | 78,110,014 |
| Italy - 2.6% | | | |
| Banca Generali SpA | | 769,300 | 34,091,479 |
| BFF Bank SpA (c) | | 2,405,056 | 23,479,494 |
| MARR SpA | | 985,827 | 11,473,967 |
| Recordati SpA | | 571,211 | 32,371,541 |
| Sesa SpA | | 253,400 | 22,023,304 |
| Sesa SpA rights (b) | | 253,400 | 3 |
TOTAL ITALY | | | 123,439,788 |
| Japan - 21.9% | | | |
| Amano Corp. | | 1,146,850 | 33,077,832 |
| Arcland Sakamoto Co. Ltd. | | 2,194,589 | 23,977,552 |
| As One Corp. | | 1,259,100 | 23,546,265 |
| ASKUL Corp. | | 1,658,900 | 20,918,482 |
| BayCurrent Consulting, Inc. | | 1,344,700 | 43,701,495 |
| Capcom Co. Ltd. | | 1,705,900 | 33,757,141 |
| Central Automotive Products Ltd. | | 624,100 | 18,797,097 |
| Dexerials Corp. | | 2,331,600 | 35,597,880 |
| Ebara Corp. | | 2,203,600 | 33,116,592 |
| Fuji Electric Co. Ltd. | | 535,300 | 27,261,709 |
| Funai Soken Holdings, Inc. | | 1,484,900 | 23,634,796 |
| Hokuhoku Financial Group, Inc. | | 1,769,400 | 18,492,858 |
| Inaba Denki Sangyo Co. Ltd. | | 1,432,300 | 35,924,775 |
| Isuzu Motors Ltd. | | 1,833,300 | 23,707,847 |
| Justsystems Corp. | | 606,900 | 13,569,948 |
| Kamigumi Co. Ltd. | | 1,567,600 | 32,718,317 |
| Kansai Electric Power Co., Inc. | | 2,332,500 | 37,406,489 |
| Kuraray Co. Ltd. | | 2,684,600 | 36,380,274 |
| Kyoto Financial Group, Inc. | | 1,371,900 | 20,134,523 |
| Maruwa Ceramic Co. Ltd. | | 133,300 | 36,773,155 |
| Meitec Group Holdings, Inc. | | 1,123,100 | 21,522,267 |
| Mitani Shoji Co. Ltd. | | 1,283,900 | 15,789,980 |
| Net One Systems Co. Ltd. | | 1,610,700 | 39,105,932 |
| Nishimoto Co. Ltd. | | 1,308,200 | 11,273,288 |
| NOF Corp. | | 2,488,200 | 40,424,539 |
| NSD Co. Ltd. | | 1,521,900 | 32,869,990 |
| PALTAC Corp. | | 1,122,300 | 30,285,970 |
| Persol Holdings Co. Ltd. | | 13,000,500 | 21,834,790 |
| Prestige International, Inc. | | 3,604,500 | 16,113,191 |
| Renesas Electronics Corp. | | 2,940,200 | 39,393,743 |
| Roland Corp. | | 791,400 | 20,244,516 |
| S Foods, Inc. | | 1,137,623 | 20,767,339 |
| San-Ai Obbli Co. Ltd. | | 2,034,900 | 24,843,964 |
| Ship Healthcare Holdings, Inc. | | 2,109,800 | 32,082,247 |
| Sumco Corp. | | 1,626,200 | 15,548,786 |
| TechnoPro Holdings, Inc. | | 1,453,300 | 25,939,055 |
| TIS, Inc. | | 1,055,200 | 26,312,958 |
| TKC Corp. | | 632,000 | 16,389,135 |
| Tsuruha Holdings, Inc. | | 402,400 | 22,508,549 |
TOTAL JAPAN | | | 1,045,745,266 |
| Korea (South) - 1.0% | | | |
| Soulbrain Co. Ltd. | | 161,800 | 23,653,293 |
| Vitzrocell Co. Ltd. (a) | | 1,609,341 | 21,869,198 |
TOTAL KOREA (SOUTH) | | | 45,522,491 |
| Mexico - 3.1% | | | |
| Bolsa Mexicana de Valores S.A.B. de CV | | 11,308,682 | 18,492,220 |
| Genomma Lab Internacional SA de CV | | 17,543,761 | 23,427,337 |
| Gruma S.A.B. de CV Series B | | 2,276,800 | 39,328,976 |
| Grupo Comercial Chedraui S.A.B. de CV | | 5,947,819 | 37,634,792 |
| Qualitas Controladora S.A.B. de CV | | 4,041,435 | 28,274,594 |
TOTAL MEXICO | | | 147,157,919 |
| Netherlands - 1.3% | | | |
| Acomo NV | | 915,999 | 17,336,976 |
| Arcadis NV | | 475,950 | 32,952,535 |
| Van Lanschot Kempen NV (Bearer) | | 283,041 | 12,946,264 |
TOTAL NETHERLANDS | | | 63,235,775 |
| Norway - 1.6% | | | |
| Europris ASA (c) | | 5,267,900 | 32,612,497 |
| Selvaag Bolig ASA | | 2,186,000 | 6,547,945 |
| Sparebanken Midt-Norge | | 2,489,990 | 36,751,584 |
TOTAL NORWAY | | | 75,912,026 |
| Peru - 0.4% | | | |
| Intercorp Financial Services, Inc. | | 683,100 | 18,491,517 |
| Philippines - 1.5% | | | |
| Century Pacific Food, Inc. | | 69,526,800 | 50,009,889 |
| Robinsons Land Corp. | | 91,729,000 | 24,128,659 |
TOTAL PHILIPPINES | | | 74,138,548 |
| Puerto Rico - 0.2% | | | |
| Liberty Latin America Ltd. Class A (b) | | 911,024 | 8,918,925 |
| Romania - 0.8% | | | |
| Banca Transilvania SA | | 6,387,994 | 39,457,496 |
| Singapore - 1.6% | | | |
| Boustead Singapore Ltd. | | 15,240,966 | 11,863,080 |
| HRnetgroup Ltd. | | 33,660,600 | 17,270,967 |
| Mapletree Industrial (REIT) | | 16,650,531 | 30,066,152 |
| The Hour Glass Ltd. | | 15,272,380 | 17,998,707 |
TOTAL SINGAPORE | | | 77,198,906 |
| South Africa - 0.6% | | | |
| Pepkor Holdings Ltd. (c) | | 22,117,500 | 28,710,132 |
| Spain - 3.1% | | | |
| Cie Automotive SA | | 997,300 | 26,686,402 |
| Grupo Catalana Occidente SA | | 857,122 | 35,149,009 |
| Logista Integral SA | | 1,620,600 | 49,534,895 |
| Prosegur Compania de Seguridad SA (Reg.) (e) | | 8,217,481 | 16,858,134 |
| Viscofan Envolturas Celulosicas SA | | 323,921 | 21,633,987 |
TOTAL SPAIN | | | 149,862,427 |
| Sweden - 1.6% | | | |
| Alligo AB (B Shares) | | 991,848 | 11,729,529 |
| Beijer Alma AB (B Shares) | | 663,660 | 10,663,856 |
| Granges AB | | 2,249,076 | 26,555,205 |
| Haypp Group AB (b) | | 1,232,700 | 8,260,769 |
| HEXPOL AB (B Shares) | | 2,197,800 | 20,813,457 |
TOTAL SWEDEN | | | 78,022,816 |
| Switzerland - 0.4% | | | |
| Anhui Heli Co. Ltd. (UBS AG London Branch Bank Warrant Programme) ELS Class A warrants 12/8/25 (c) | | 8,014,256 | 20,039,021 |
| Taiwan - 4.0% | | | |
| Chailease Holding Co. Ltd. | | 5,363,513 | 25,197,962 |
| International Games Systems Co. Ltd. | | 1,337,000 | 42,322,752 |
| Lumax International Corp. Ltd. | | 4,537,292 | 15,412,199 |
| Sporton International, Inc. | | 2,313,977 | 15,148,736 |
| Test Research, Inc. | | 7,960,000 | 32,665,543 |
| Tripod Technology Corp. | | 5,125,000 | 30,349,227 |
| Yageo Corp. | | 1,185,149 | 20,223,151 |
| Yung Chi Paint & Varnish Manufacturing Co. Ltd. | | 3,312,000 | 8,013,685 |
TOTAL TAIWAN | | | 189,333,255 |
| Thailand - 0.3% | | | |
| Star Petroleum Refining PCL (For. Reg.) | | 82,343,000 | 16,355,612 |
| United Kingdom - 15.5% | | | |
| Ashtead Technology Holdings PLC (a) | | 6,435,800 | 45,808,505 |
| B&M European Value Retail SA | | 5,239,500 | 26,186,540 |
| Bodycote PLC | | 2,311,471 | 16,512,116 |
| ConvaTec Group PLC (c) | | 6,215,700 | 17,103,657 |
| Cranswick PLC | | 508,900 | 33,269,396 |
| DCC PLC (United Kingdom) | | 491,100 | 31,054,526 |
| Direct Line Insurance Group PLC | | 9,160,900 | 19,407,974 |
| Grainger Trust PLC | | 7,896,166 | 23,112,484 |
| Harbour Energy PLC | | 5,251,894 | 18,717,959 |
| Hiscox Ltd. | | 2,803,648 | 39,116,073 |
| Informa PLC | | 3,377,133 | 35,211,653 |
| Intermediate Capital Group PLC | | 875,000 | 23,264,902 |
| J.D. Wetherspoon PLC | | 1,180,802 | 9,348,673 |
| Jet2 PLC | | 1,891,000 | 35,039,089 |
| John Wood Group PLC (b) | | 11,829,800 | 19,296,229 |
| Lancashire Holdings Ltd. | | 2,403,500 | 19,555,908 |
| LSL Property Services PLC | | 4,367,735 | 16,952,247 |
| Luxfer Holdings PLC sponsored | | 1,121,159 | 16,099,843 |
| Mears Group PLC (a) | | 8,376,014 | 36,775,536 |
| On The Beach Group PLC (c) | | 6,731,236 | 12,585,409 |
| Pets At Home Group PLC | | 3,274,300 | 12,505,701 |
| Premier Foods PLC | | 22,932,500 | 55,710,468 |
| Rathbone Brothers PLC | | 992,700 | 21,299,816 |
| RS GROUP PLC | | 2,670,653 | 23,933,531 |
| Sabre Insurance Group PLC (c) | | 9,855,200 | 17,384,253 |
| Savills PLC | | 2,398,800 | 33,220,245 |
| Subsea 7 SA | | 1,501,200 | 22,967,942 |
| Tate & Lyle PLC | | 3,640,843 | 35,210,137 |
| Vistry Group PLC (b) | | 1,963,198 | 23,023,498 |
TOTAL UNITED KINGDOM | | | 739,674,310 |
| United States of America - 2.7% | | | |
| Adtalem Global Education, Inc. (b) | | 292,400 | 23,661,008 |
| Antero Resources Corp. (b) | | 1,076,800 | 27,867,584 |
| CONSOL Energy, Inc. | | 15,297 | 1,696,743 |
| GCC S.A.B. de CV | | 1,468,100 | 12,006,291 |
| RHI Magnesita NV | | 1,056,191 | 43,717,166 |
| Smurfit Westrock PLC | | 353,100 | 18,184,650 |
TOTAL UNITED STATES OF AMERICA | | | 127,133,442 |
| TOTAL COMMON STOCKS (Cost $4,075,816,863) | | | 4,577,873,913 |
| | | | |
| Money Market Funds - 1.8% |
| | | Shares | Value ($) |
| Fidelity Cash Central Fund 4.87% (f) | | 83,349,278 | 83,365,948 |
| Fidelity Securities Lending Cash Central Fund 4.87% (f)(g) | | 48,244 | 48,249 |
| TOTAL MONEY MARKET FUNDS (Cost $83,414,197) | | | 83,414,197 |
| | | | |
| TOTAL INVESTMENT IN SECURITIES - 97.6% (Cost $4,159,231,060) | 4,661,288,110 |
NET OTHER ASSETS (LIABILITIES) - 2.4% | 117,002,297 |
| NET ASSETS - 100.0% | 4,778,290,407 |
| | |
Security Type Abbreviations
| ELS | - | EQUITY-LINKED SECURITY |
Legend
| (c) | Security exempt from registration under Rule 144A of the Securities Act of 1933. These securities may be resold in transactions exempt from registration, normally to qualified institutional buyers. At the end of the period, the value of these securities amounted to $226,748,031 or 4.7% of net assets. |
| (e) | Security or a portion of the security is on loan at period end. |
| (f) | Affiliated fund that is generally available only to investment companies and other accounts managed by Fidelity Investments. The rate quoted is the annualized seven-day yield of the fund at period end. A complete unaudited listing of the fund's holdings as of its most recent quarter end is available upon request. In addition, each Fidelity Central Fund's financial statements, which are not covered by the Fund's Report of Independent Registered Public Accounting Firm, are available on the SEC's website or upon request. |
| (g) | Investment made with cash collateral received from securities on loan. |
Affiliated Central Funds
Fiscal year to date information regarding the Fund's investments in Fidelity Central Funds, including the ownership percentage, is presented below.
| Affiliate | Value, beginning of period ($) | Purchases ($) | Sales Proceeds ($) | Dividend Income ($) | Realized Gain (loss) ($) | Change in Unrealized appreciation (depreciation) ($) | Value, end of period ($) | % ownership, end of period |
| Fidelity Cash Central Fund 4.87% | 93,381,597 | 681,868,100 | 691,883,519 | 4,782,278 | (230) | - | 83,365,948 | 0.2% |
| Fidelity Securities Lending Cash Central Fund 4.87% | 31,092,349 | 362,013,683 | 393,057,783 | 132,162 | - | - | 48,249 | 0.0% |
| Total | 124,473,946 | 1,043,881,783 | 1,084,941,302 | 4,914,440 | (230) | - | 83,414,197 | |
| | | | | | | | | |
Amounts in the dividend income column in the above table include any capital gain distributions from underlying funds, which are presented in the corresponding line item in the Statement of Operations, if applicable.
Amounts in the dividend income column for Fidelity Securities Lending Cash Central Fund represents the income earned on investing cash collateral, less rebates paid to borrowers and any lending agent fees associated with the loan, plus any premium payments received for lending certain types of securities.
Amounts included in the purchases and sales proceeds columns may include in-kind transactions, if applicable.
Other Affiliated Issuers
An affiliated company is a company in which the Fund has ownership of at least 5% of the voting securities. Fiscal year to date transactions with companies which are or were affiliates are presented in the table below. Certain corporate actions, such as mergers, are excluded from the amounts in this table if applicable. A dash in the Value end of period ($) column means either the issuer is no longer held at period end, or the issuer is held at period end but is no longer an affiliate.
| Affiliate | Value, beginning of period ($) | Purchases ($) | Sales Proceeds ($) | Dividend Income ($) | Realized Gain (loss) ($) | Change in Unrealized appreciation (depreciation) ($) | Value, end of period ($) |
| Ashtead Technology Holdings PLC | 42,426,011 | 1,625,555 | 10,413,226 | 95,459 | 7,398,674 | 4,771,491 | 45,808,505 |
| Genesis Land Development Corp. | 7,126,596 | 2,083,863 | - | 477,533 | - | 5,395,774 | 14,606,233 |
| Mears Group PLC | 23,189,551 | 5,565,143 | 883,999 | 1,421,560 | (706,930) | 9,611,771 | 36,775,536 |
| Mincon Group PLC | 8,303,238 | - | - | 307,660 | - | (1,827,719) | 6,475,519 |
| Servcorp Ltd. | 13,569,097 | - | - | 1,174,223 | - | 9,612,487 | 23,181,584 |
| SomnoMed Ltd. | 1,718,117 | - | 955,876 | - | (4,395,986) | 3,633,745 | - |
| Ten Entertainment Group PLC | 21,267,175 | - | - | - | 17,753,663 | (7,913,930) | - |
| Vitzrocell Co. Ltd. | 17,271,915 | 3,274,973 | - | 221,507 | - | 1,322,310 | 21,869,198 |
| Western Forest Products, Inc. | 9,003,531 | - | 4,739,914 | - | (18,256,620) | 13,993,003 | - |
| Total | 143,875,231 | 12,549,534 | 16,993,015 | 3,697,942 | 1,792,801 | 38,598,932 | 148,716,575 |
Amounts included in the purchases and sales proceeds columns may include in-kind transactions, if applicable.
Investment Valuation
The following is a summary of the inputs used, as of October 31, 2024, involving the Fund's assets and liabilities carried at fair value. The inputs or methodology used for valuing securities may not be an indication of the risk associated with investing in those securities. For more information on valuation inputs, and their aggregation into the levels used below, please refer to the Investment Valuation section in the accompanying Notes to Financial Statements.
| Valuation Inputs at Reporting Date: |
| Description | Total ($) | Level 1 ($) | Level 2 ($) | Level 3 ($) |
Investments in Securities: | | | | |
|
| Equities: | | | | |
Communication Services | 230,041,669 | 119,374,148 | 110,667,521 | - |
Consumer Discretionary | 527,437,165 | 256,047,302 | 271,389,863 | - |
Consumer Staples | 498,411,610 | 352,336,201 | 146,075,409 | - |
Energy | 181,051,751 | 139,852,175 | 41,199,576 | - |
Financials | 639,508,858 | 452,444,205 | 187,064,653 | - |
Health Care | 248,840,744 | 175,412,454 | 73,428,290 | - |
Industrials | 1,063,495,923 | 596,016,382 | 467,479,541 | - |
Information Technology | 442,883,025 | 54,504,850 | 388,378,175 | - |
Materials | 390,003,335 | 235,566,670 | 154,436,664 | 1 |
Real Estate | 287,300,675 | 152,062,331 | 135,238,344 | - |
Utilities | 68,899,158 | - | 68,899,158 | - |
|
| Money Market Funds | 83,414,197 | 83,414,197 | - | - |
| Total Investments in Securities: | 4,661,288,110 | 2,617,030,915 | 2,044,257,194 | 1 |
Financial Statements
| Statement of Assets and Liabilities |
As of October 31, 2024 |
| Assets | | | | |
| Investment in securities, at value (including securities loaned of $40,181) - See accompanying schedule: | | | | |
Unaffiliated issuers (cost $3,960,578,936) | $ | 4,429,157,338 | | |
Fidelity Central Funds (cost $83,414,197) | | 83,414,197 | | |
Other affiliated issuers (cost $115,237,927) | | 148,716,575 | | |
| | | | | |
| | | | | |
| Total Investment in Securities (cost $4,159,231,060) | | | $ | 4,661,288,110 |
| Foreign currency held at value (cost $115,311,713) | | | | 113,731,084 |
| Receivable for investments sold | | | | 11,545,112 |
| Receivable for fund shares sold | | | | 5,029,037 |
| Dividends receivable | | | | 11,211,667 |
| Reclaims receivable | | | | 3,777,040 |
| Distributions receivable from Fidelity Central Funds | | | | 428,776 |
| Prepaid expenses | | | | 5,676 |
| Other receivables | | | | 34,783 |
Total assets | | | | 4,807,051,285 |
| Liabilities | | | | |
| Payable for investments purchased | $ | 15,351,913 | | |
| Payable for fund shares redeemed | | 3,162,126 | | |
| Accrued management fee | | 3,700,298 | | |
| Distribution and service plan fees payable | | 45,752 | | |
| Deferred taxes | | 6,201,889 | | |
| Other payables and accrued expenses | | 254,746 | | |
| Collateral on securities loaned | | 44,154 | | |
| Total liabilities | | | | 28,760,878 |
| Net Assets | | | $ | 4,778,290,407 |
| Net Assets consist of: | | | | |
| Paid in capital | | | $ | 4,300,125,369 |
| Total accumulated earnings (loss) | | | | 478,165,038 |
| Net Assets | | | $ | 4,778,290,407 |
| | | | | |
| Net Asset Value and Maximum Offering Price | | | | |
| Class A : | | | | |
Net Asset Value and redemption price per share ($124,940,779 ÷ 3,994,248 shares)(a) | | | $ | 31.28 |
| Maximum offering price per share (100/94.25 of $31.28) | | | $ | 33.19 |
| Class M : | | | | |
Net Asset Value and redemption price per share ($19,032,923 ÷ 611,864 shares)(a) | | | $ | 31.11 |
| Maximum offering price per share (100/96.50 of $31.11) | | | $ | 32.24 |
| Class C : | | | | |
Net Asset Value and offering price per share ($12,577,348 ÷ 421,117 shares)(a) | | | $ | 29.87 |
| International Small Cap : | | | | |
Net Asset Value, offering price and redemption price per share ($1,590,235,878 ÷ 49,652,534 shares) | | | $ | 32.03 |
| Class I : | | | | |
Net Asset Value, offering price and redemption price per share ($1,304,243,547 ÷ 40,447,741 shares) | | | $ | 32.25 |
| Class Z : | | | | |
Net Asset Value, offering price and redemption price per share ($1,727,259,932 ÷ 53,595,582 shares) | | | $ | 32.23 |
(a)Redemption price per share is equal to net asset value less any applicable contingent deferred sales charge. |
| Statement of Operations |
| Year ended October 31, 2024 |
| Investment Income | | | | |
| Dividends (including $3,697,942 earned from affiliated issuers) | | | $ | 154,165,132 |
| Income from Fidelity Central Funds (including $132,162 from security lending) | | | | 4,914,440 |
| Income before foreign taxes withheld | | | $ | 159,079,572 |
| Less foreign taxes withheld | | | | (13,814,916) |
| Total income | | | | 145,264,656 |
| Expenses | | | | |
| Management fee | | | | |
| Basic fee | $ | 38,401,568 | | |
| Performance adjustment | | 5,136,434 | | |
| Transfer agent fees | | 1,792,476 | | |
| Distribution and service plan fees | | 544,354 | | |
| Accounting fees | | 534,270 | | |
| Custodian fees and expenses | | 550,143 | | |
| Independent trustees' fees and expenses | | 19,971 | | |
| Registration fees | | 228,365 | | |
| Audit fees | | 111,444 | | |
| Legal | | 3,052 | | |
| Miscellaneous | | 151,832 | | |
| Total expenses before reductions | | 47,473,909 | | |
| Expense reductions | | (192,040) | | |
| Total expenses after reductions | | | | 47,281,869 |
| Net Investment income (loss) | | | | 97,982,787 |
| Realized and Unrealized Gain (Loss) | | | | |
| Net realized gain (loss) on: | | | | |
| Investment Securities: | | | | |
| Unaffiliated issuers | | 33,454,637 | | |
| Fidelity Central Funds | | (230) | | |
| Other affiliated issuers | | 1,792,801 | | |
| Foreign currency transactions | | 2,204,903 | | |
| Total net realized gain (loss) | | | | 37,452,111 |
| Change in net unrealized appreciation (depreciation) on: | | | | |
| Investment Securities: | | | | |
| Unaffiliated issuers (net of increase in deferred foreign taxes of $4,030,304) | | 525,273,979 | | |
| Affiliated issuers | | 38,598,933 | | |
| Assets and liabilities in foreign currencies | | (575,670) | | |
| Total change in net unrealized appreciation (depreciation) | | | | 563,297,242 |
| Net gain (loss) | | | | 600,749,353 |
| Net increase (decrease) in net assets resulting from operations | | | $ | 698,732,140 |
| Statement of Changes in Net Assets |
| |
| | Year ended October 31, 2024 | | Year ended October 31, 2023 |
| Increase (Decrease) in Net Assets | | | | |
| Operations | | | | |
| Net investment income (loss) | $ | 97,982,787 | $ | 65,046,236 |
| Net realized gain (loss) | | 37,452,111 | | (49,505,968) |
| Change in net unrealized appreciation (depreciation) | | 563,297,242 | | 332,949,836 |
| Net increase (decrease) in net assets resulting from operations | | 698,732,140 | | 348,490,104 |
| Distributions to shareholders | | (81,035,424) | | (22,796,062) |
| | | | | |
| Share transactions - net increase (decrease) | | 505,200,813 | | 398,485,883 |
| Total increase (decrease) in net assets | | 1,122,897,529 | | 724,179,925 |
| | | | | |
| Net Assets | | | | |
| Beginning of period | | 3,655,392,878 | | 2,931,212,953 |
| End of period | $ | 4,778,290,407 | $ | 3,655,392,878 |
| | | | | |
| | | | | |
Financial Highlights
Fidelity Advisor® International Small Cap Fund Class A |
| |
| Years ended October 31, | | 2024 | | 2023 | | 2022 | | 2021 | | 2020 |
Selected Per-Share Data | | | | | | | | | | |
| Net asset value, beginning of period | $ | 26.84 | $ | 23.88 | $ | 34.31 | $ | 24.75 | $ | 26.32 |
| Income from Investment Operations | | | | | | | | | | |
Net investment income (loss) A,B | | .58 | | .44 | | .58 | | .31 | | .27 |
| Net realized and unrealized gain (loss) | | 4.37 | | 2.63 | | (8.74) | | 9.42 | | (1.26) |
| Total from investment operations | | 4.95 | | 3.07 | | (8.16) | | 9.73 | | (.99) |
| Distributions from net investment income | | (.51) | | (.11) | | (.75) | | (.17) | | (.44) |
| Distributions from net realized gain | | - | | - | | (1.52) | | - | | (.14) |
| Total distributions | | (.51) | | (.11) | | (2.27) | | (.17) | | (.58) |
| Net asset value, end of period | $ | 31.28 | $ | 26.84 | $ | 23.88 | $ | 34.31 | $ | 24.75 |
Total Return C,D | | | | 12.87% | | (25.19)% | | 39.43% | | (3.91)% |
Ratios to Average Net Assets B,E,F | | | | | | | | | | |
| Expenses before reductions | | 1.32% | | 1.43% | | 1.29% | | 1.29% | | 1.36% |
| Expenses net of fee waivers, if any | | | | 1.43% | | 1.29% | | 1.29% | | 1.36% |
| Expenses net of all reductions | | 1.32% | | 1.43% | | 1.29% | | 1.29% | | 1.35% |
| Net investment income (loss) | | 1.85% | | 1.56% | | 2.06% | | .95% | | 1.09% |
| Supplemental Data | | | | | | | | | | |
| Net assets, end of period (000 omitted) | $ | 124,941 | $ | 108,866 | $ | 95,906 | $ | 136,131 | $ | 92,044 |
Portfolio turnover rate G | | | | 10% | | 17% | | 28% | | 43% |
ACalculated based on average shares outstanding during the period.
BNet investment income (loss) is affected by the timing of the declaration of dividends by any underlying mutual funds or exchange-traded funds (ETFs). Net investment income (loss) of any mutual funds or ETFs is not included in the Fund's net investment income (loss) ratio.
CTotal returns would have been lower if certain expenses had not been reduced during the applicable periods shown.
DTotal returns do not include the effect of the sales charges.
EFees and expenses of any underlying mutual funds or exchange-traded funds (ETFs) are not included in the Fund's expense ratio. The Fund indirectly bears its proportionate share of these expenses. For additional expense information related to investments in Fidelity Central Funds, please refer to the "Investments in Fidelity Central Funds" note found in the Notes to Financial Statements section of the most recent Annual or Semi-Annual report.
FExpense ratios reflect operating expenses of the class. Expenses before reductions do not reflect amounts reimbursed, waived, or reduced through arrangements with the investment adviser, brokerage services, or other offset arrangements, if applicable, and do not represent the amount paid by the class during periods when reimbursements, waivers or reductions occur.
GAmount does not include the portfolio activity of any underlying mutual funds or exchange-traded funds (ETFs).
Fidelity Advisor® International Small Cap Fund Class M |
| |
| Years ended October 31, | | 2024 | | 2023 | | 2022 | | 2021 | | 2020 |
Selected Per-Share Data | | | | | | | | | | |
| Net asset value, beginning of period | $ | 26.69 | $ | 23.73 | $ | 34.12 | $ | 24.62 | $ | 26.18 |
| Income from Investment Operations | | | | | | | | | | |
Net investment income (loss) A,B | | .50 | | .36 | | .50 | | .22 | | .19 |
| Net realized and unrealized gain (loss) | | 4.35 | | 2.64 | | (8.70) | | 9.38 | | (1.25) |
| Total from investment operations | | 4.85 | | 3.00 | | (8.20) | | 9.60 | | (1.06) |
| Distributions from net investment income | | (.43) | | (.04) | | (.66) | | (.10) | | (.36) |
| Distributions from net realized gain | | - | | - | | (1.52) | | - | | (.14) |
| Total distributions | | (.43) | | (.04) | | (2.19) C | | (.10) | | (.50) |
| Net asset value, end of period | $ | 31.11 | $ | 26.69 | $ | 23.73 | $ | 34.12 | $ | 24.62 |
Total Return D,E | | | | 12.62% | | (25.43)% | | 39.07% | | (4.19)% |
Ratios to Average Net Assets B,F,G | | | | | | | | | | |
| Expenses before reductions | | 1.58% | | 1.71% | | 1.57% | | 1.57% | | 1.67% |
| Expenses net of fee waivers, if any | | | | 1.70% | | 1.56% | | 1.57% | | 1.67% |
| Expenses net of all reductions | | 1.57% | | 1.70% | | 1.56% | | 1.57% | | 1.65% |
| Net investment income (loss) | | 1.60% | | 1.29% | | 1.79% | | .68% | | .78% |
| Supplemental Data | | | | | | | | | | |
| Net assets, end of period (000 omitted) | $ | 19,033 | $ | 15,515 | $ | 13,761 | $ | 19,926 | $ | 12,492 |
Portfolio turnover rate H | | | | 10% | | 17% | | 28% | | 43% |
ACalculated based on average shares outstanding during the period.
BNet investment income (loss) is affected by the timing of the declaration of dividends by any underlying mutual funds or exchange-traded funds (ETFs). Net investment income (loss) of any mutual funds or ETFs is not included in the Fund's net investment income (loss) ratio.
CTotal distributions per share do not sum due to rounding.
DTotal returns would have been lower if certain expenses had not been reduced during the applicable periods shown.
ETotal returns do not include the effect of the sales charges.
FFees and expenses of any underlying mutual funds or exchange-traded funds (ETFs) are not included in the Fund's expense ratio. The Fund indirectly bears its proportionate share of these expenses. For additional expense information related to investments in Fidelity Central Funds, please refer to the "Investments in Fidelity Central Funds" note found in the Notes to Financial Statements section of the most recent Annual or Semi-Annual report.
GExpense ratios reflect operating expenses of the class. Expenses before reductions do not reflect amounts reimbursed, waived, or reduced through arrangements with the investment adviser, brokerage services, or other offset arrangements, if applicable, and do not represent the amount paid by the class during periods when reimbursements, waivers or reductions occur.
HAmount does not include the portfolio activity of any underlying mutual funds or exchange-traded funds (ETFs).
Fidelity Advisor® International Small Cap Fund Class C |
| |
| Years ended October 31, | | 2024 | | 2023 | | 2022 | | 2021 | | 2020 |
Selected Per-Share Data | | | | | | | | | | |
| Net asset value, beginning of period | $ | 25.64 | $ | 22.88 | $ | 32.93 | $ | 23.80 | $ | 25.27 |
| Income from Investment Operations | | | | | | | | | | |
Net investment income (loss) A,B | | .33 | | .21 | | .35 | | .06 | | .08 |
| Net realized and unrealized gain (loss) | | 4.19 | | 2.55 | | (8.40) | | 9.07 | | (1.23) |
| Total from investment operations | | 4.52 | | 2.76 | | (8.05) | | 9.13 | | (1.15) |
| Distributions from net investment income | | (.29) | | - | | (.48) | | - | | (.18) |
| Distributions from net realized gain | | - | | - | | (1.52) | | - | | (.14) |
| Total distributions | | (.29) | | - | | (2.00) | | - | | (.32) |
| Net asset value, end of period | $ | 29.87 | $ | 25.64 | $ | 22.88 | $ | 32.93 | $ | 23.80 |
Total Return C,D | | | | 12.06% | | (25.77)% | | 38.36% | | (4.65)% |
Ratios to Average Net Assets B,E,F | | | | | | | | | | |
| Expenses before reductions | | 2.06% | | 2.20% | | 2.06% | | 2.05% | | 2.13% |
| Expenses net of fee waivers, if any | | | | 2.19% | | 2.05% | | 2.05% | | 2.13% |
| Expenses net of all reductions | | 2.06% | | 2.19% | | 2.05% | | 2.05% | | 2.11% |
| Net investment income (loss) | | 1.11% | | .80% | | 1.30% | | .19% | | .32% |
| Supplemental Data | | | | | | | | | | |
| Net assets, end of period (000 omitted) | $ | 12,577 | $ | 12,603 | $ | 13,556 | $ | 21,683 | $ | 17,659 |
Portfolio turnover rate G | | | | 10% | | 17% | | 28% | | 43% |
ACalculated based on average shares outstanding during the period.
BNet investment income (loss) is affected by the timing of the declaration of dividends by any underlying mutual funds or exchange-traded funds (ETFs). Net investment income (loss) of any mutual funds or ETFs is not included in the Fund's net investment income (loss) ratio.
CTotal returns would have been lower if certain expenses had not been reduced during the applicable periods shown.
DTotal returns do not include the effect of the contingent deferred sales charge.
EFees and expenses of any underlying mutual funds or exchange-traded funds (ETFs) are not included in the Fund's expense ratio. The Fund indirectly bears its proportionate share of these expenses. For additional expense information related to investments in Fidelity Central Funds, please refer to the "Investments in Fidelity Central Funds" note found in the Notes to Financial Statements section of the most recent Annual or Semi-Annual report.
FExpense ratios reflect operating expenses of the class. Expenses before reductions do not reflect amounts reimbursed, waived, or reduced through arrangements with the investment adviser, brokerage services, or other offset arrangements, if applicable, and do not represent the amount paid by the class during periods when reimbursements, waivers or reductions occur.
GAmount does not include the portfolio activity of any underlying mutual funds or exchange-traded funds (ETFs).
Fidelity® International Small Cap Fund |
| |
| Years ended October 31, | | 2024 | | 2023 | | 2022 | | 2021 | | 2020 |
Selected Per-Share Data | | | | | | | | | | |
| Net asset value, beginning of period | $ | 27.46 | $ | 24.43 | $ | 35.05 | $ | 25.28 | $ | 26.86 |
| Income from Investment Operations | | | | | | | | | | |
Net investment income (loss) A,B | | .68 | | .52 | | .67 | | .41 | | .34 |
| Net realized and unrealized gain (loss) | | 4.48 | | 2.70 | | (8.94) | | 9.61 | | (1.27) |
| Total from investment operations | | 5.16 | | 3.22 | | (8.27) | | 10.02 | | (.93) |
| Distributions from net investment income | | (.59) | | (.19) | | (.83) | | (.25) | | (.51) |
| Distributions from net realized gain | | - | | - | | (1.52) | | - | | (.14) |
| Total distributions | | (.59) | | (.19) | | (2.35) | | (.25) | | (.65) |
| Net asset value, end of period | $ | 32.03 | $ | 27.46 | $ | 24.43 | $ | 35.05 | $ | 25.28 |
Total Return C | | | | 13.19% | | (25.01)% | | 39.83% | | (3.61)% |
Ratios to Average Net Assets B,D,E | | | | | | | | | | |
| Expenses before reductions | | 1.04% | | 1.17% | | 1.02% | | 1.01% | | 1.08% |
| Expenses net of fee waivers, if any | | | | 1.16% | | 1.02% | | 1.01% | | 1.08% |
| Expenses net of all reductions | | 1.04% | | 1.16% | | 1.02% | | 1.01% | | 1.07% |
| Net investment income (loss) | | 2.13% | | 1.83% | | 2.33% | | 1.23% | | 1.37% |
| Supplemental Data | | | | | | | | | | |
| Net assets, end of period (000 omitted) | $ | 1,590,236 | $ | 1,342,755 | $ | 1,145,773 | $ | 1,534,214 | $ | 1,122,746 |
Portfolio turnover rate F | | | | 10% | | 17% | | 28% | | 43% |
ACalculated based on average shares outstanding during the period.
BNet investment income (loss) is affected by the timing of the declaration of dividends by any underlying mutual funds or exchange-traded funds (ETFs). Net investment income (loss) of any mutual funds or ETFs is not included in the Fund's net investment income (loss) ratio.
CTotal returns would have been lower if certain expenses had not been reduced during the applicable periods shown.
DFees and expenses of any underlying mutual funds or exchange-traded funds (ETFs) are not included in the Fund's expense ratio. The Fund indirectly bears its proportionate share of these expenses. For additional expense information related to investments in Fidelity Central Funds, please refer to the "Investments in Fidelity Central Funds" note found in the Notes to Financial Statements section of the most recent Annual or Semi-Annual report.
EExpense ratios reflect operating expenses of the class. Expenses before reductions do not reflect amounts reimbursed, waived, or reduced through arrangements with the investment adviser, brokerage services, or other offset arrangements, if applicable, and do not represent the amount paid by the class during periods when reimbursements, waivers or reductions occur.
FAmount does not include the portfolio activity of any underlying mutual funds or exchange-traded funds (ETFs).
Fidelity Advisor® International Small Cap Fund Class I |
| |
| Years ended October 31, | | 2024 | | 2023 | | 2022 | | 2021 | | 2020 |
Selected Per-Share Data | | | | | | | | | | |
| Net asset value, beginning of period | $ | 27.66 | $ | 24.60 | $ | 35.27 | $ | 25.44 | $ | 27.03 |
| Income from Investment Operations | | | | | | | | | | |
Net investment income (loss) A,B | | .67 | | .53 | | .68 | | .41 | | .35 |
| Net realized and unrealized gain (loss) | | 4.51 | | 2.71 | | (8.99) | | 9.67 | | (1.28) |
| Total from investment operations | | 5.18 | | 3.24 | | (8.31) | | 10.08 | | (.93) |
| Distributions from net investment income | | (.59) | | (.18) | | (.84) | | (.25) | | (.52) |
| Distributions from net realized gain | | - | | - | | (1.52) | | - | | (.14) |
| Total distributions | | (.59) | | (.18) | | (2.36) | | (.25) | | (.66) |
| Net asset value, end of period | $ | 32.25 | $ | 27.66 | $ | 24.60 | $ | 35.27 | $ | 25.44 |
Total Return C | | | | 13.20% | | (24.98)% | | 39.80% | | (3.62)% |
Ratios to Average Net Assets B,D,E | | | | | | | | | | |
| Expenses before reductions | | 1.08% | | 1.16% | | 1.02% | | 1.02% | | 1.08% |
| Expenses net of fee waivers, if any | | | | 1.15% | | 1.01% | | 1.02% | | 1.08% |
| Expenses net of all reductions | | 1.08% | | 1.15% | | 1.01% | | 1.02% | | 1.06% |
| Net investment income (loss) | | 2.09% | | 1.84% | | 2.34% | | 1.22% | | 1.38% |
| Supplemental Data | | | | | | | | | | |
| Net assets, end of period (000 omitted) | $ | 1,304,244 | $ | 924,094 | $ | 696,515 | $ | 1,080,258 | $ | 605,100 |
Portfolio turnover rate F | | | | 10% | | 17% | | 28% | | 43% |
ACalculated based on average shares outstanding during the period.
BNet investment income (loss) is affected by the timing of the declaration of dividends by any underlying mutual funds or exchange-traded funds (ETFs). Net investment income (loss) of any mutual funds or ETFs is not included in the Fund's net investment income (loss) ratio.
CTotal returns would have been lower if certain expenses had not been reduced during the applicable periods shown.
DFees and expenses of any underlying mutual funds or exchange-traded funds (ETFs) are not included in the Fund's expense ratio. The Fund indirectly bears its proportionate share of these expenses. For additional expense information related to investments in Fidelity Central Funds, please refer to the "Investments in Fidelity Central Funds" note found in the Notes to Financial Statements section of the most recent Annual or Semi-Annual report.
EExpense ratios reflect operating expenses of the class. Expenses before reductions do not reflect amounts reimbursed, waived, or reduced through arrangements with the investment adviser, brokerage services, or other offset arrangements, if applicable, and do not represent the amount paid by the class during periods when reimbursements, waivers or reductions occur.
FAmount does not include the portfolio activity of any underlying mutual funds or exchange-traded funds (ETFs).
Fidelity Advisor® International Small Cap Fund Class Z |
| |
| Years ended October 31, | | 2024 | | 2023 | | 2022 | | 2021 | | 2020 |
Selected Per-Share Data | | | | | | | | | | |
| Net asset value, beginning of period | $ | 27.65 | $ | 24.59 | $ | 35.26 | $ | 25.43 | $ | 27.03 |
| Income from Investment Operations | | | | | | | | | | |
Net investment income (loss) A,B | | .71 | | .56 | | .70 | | .45 | | .38 |
| Net realized and unrealized gain (loss) | | 4.50 | | 2.72 | | (8.97) | | 9.67 | | (1.28) |
| Total from investment operations | | 5.21 | | 3.28 | | (8.27) | | 10.12 | | (.90) |
| Distributions from net investment income | | (.63) | | (.22) | | (.88) | | (.29) | | (.56) |
| Distributions from net realized gain | | - | | - | | (1.52) | | - | | (.14) |
| Total distributions | | (.63) | | (.22) | | (2.40) | | (.29) | | (.70) |
| Net asset value, end of period | $ | 32.23 | $ | 27.65 | $ | 24.59 | $ | 35.26 | $ | 25.43 |
Total Return C | | | | 13.38% | | (24.89)% | | 39.99% | | (3.51)% |
Ratios to Average Net Assets B,D,E | | | | | | | | | | |
| Expenses before reductions | | .96% | | 1.03% | | .89% | | .89% | | .94% |
| Expenses net of fee waivers, if any | | | | 1.03% | | .89% | | .89% | | .94% |
| Expenses net of all reductions | | .96% | | 1.03% | | .89% | | .89% | | .93% |
| Net investment income (loss) | | 2.21% | | 1.96% | | 2.47% | | 1.35% | | 1.51% |
| Supplemental Data | | | | | | | | | | |
| Net assets, end of period (000 omitted) | $ | 1,727,260 | $ | 1,251,559 | $ | 965,701 | $ | 739,757 | $ | 275,127 |
Portfolio turnover rate F | | | | 10% | | 17% | | 28% | | 43% |
ACalculated based on average shares outstanding during the period.
BNet investment income (loss) is affected by the timing of the declaration of dividends by any underlying mutual funds or exchange-traded funds (ETFs). Net investment income (loss) of any mutual funds or ETFs is not included in the Fund's net investment income (loss) ratio.
CTotal returns would have been lower if certain expenses had not been reduced during the applicable periods shown.
DFees and expenses of any underlying mutual funds or exchange-traded funds (ETFs) are not included in the Fund's expense ratio. The Fund indirectly bears its proportionate share of these expenses. For additional expense information related to investments in Fidelity Central Funds, please refer to the "Investments in Fidelity Central Funds" note found in the Notes to Financial Statements section of the most recent Annual or Semi-Annual report.
EExpense ratios reflect operating expenses of the class. Expenses before reductions do not reflect amounts reimbursed, waived, or reduced through arrangements with the investment adviser, brokerage services, or other offset arrangements, if applicable, and do not represent the amount paid by the class during periods when reimbursements, waivers or reductions occur.
FAmount does not include the portfolio activity of any underlying mutual funds or exchange-traded funds (ETFs).
Notes to Financial Statements
For the period ended October 31, 2024
1. Organization.
Fidelity International Small Cap Fund (the Fund) is a fund of Fidelity Investment Trust (the Trust) and is authorized to issue an unlimited number of shares. The Trust is registered under the Investment Company Act of 1940, as amended (the 1940 Act), as an open-end management investment company organized as a Massachusetts business trust. The Fund offers Class A, Class M, Class C, International Small Cap, Class I and Class Z shares, each of which has equal rights as to assets and voting privileges. Class A, Class M, Class C, and Class I and Class Z are Fidelity Advisor classes. Each class has exclusive voting rights with respect to matters that affect that class. Class C shares will automatically convert to Class A shares after a holding period of eight years from the initial date of purchase, with certain exceptions. The Fund's investments in emerging markets can be subject to social, economic, regulatory, and political uncertainties and can be extremely volatile.
2. Investments in Fidelity Central Funds.
Funds may invest in Fidelity Central Funds, which are open-end investment companies generally available only to other investment companies and accounts managed by the investment adviser and its affiliates. The Schedule of Investments lists any Fidelity Central Funds held as an investment as of period end, but does not include the underlying holdings of each Fidelity Central Fund. An investing fund indirectly bears its proportionate share of the expenses of the underlying Fidelity Central Funds.
Based on its investment objective, each Fidelity Central Fund may invest or participate in various investment vehicles or strategies that are similar to those of the investing fund. These strategies are consistent with the investment objectives of the investing fund and may involve certain economic risks which may cause a decline in value of each of the Fidelity Central Funds and thus a decline in the value of the investing fund.
| Fidelity Central Fund | Investment Manager | Investment Objective | Investment Practices | Expense RatioA |
| Fidelity Money Market Central Funds | Fidelity Management & Research Company LLC (FMR) | Each fund seeks to obtain a high level of current income consistent with the preservation of capital and liquidity. | Short-term Investments | Less than .005% |
A Expenses expressed as a percentage of average net assets and are as of each underlying Central Fund's most recent annual or semi-annual shareholder report.
A complete unaudited list of holdings for each Fidelity Central Fund is available upon request or at the Securities and Exchange Commission website at www.sec.gov. In addition, the financial statements of the Fidelity Central Funds which contain the significant accounting policies (including investment valuation policies) of those funds, and are not covered by the Report of Independent Registered Public Accounting Firm, are available on the Securities and Exchange Commission website or upon request.
3. Significant Accounting Policies.
The Fund is an investment company and applies the accounting and reporting guidance of the Financial Accounting Standards Board (FASB) Accounting Standards Codification Topic 946 Financial Services - Investment Companies. The financial statements have been prepared in conformity with accounting principles generally accepted in the United States of America (GAAP), which require management to make certain estimates and assumptions at the date of the financial statements. Actual results could differ from those estimates. Subsequent events, if any, through the date that the financial statements were issued have been evaluated in the preparation of the financial statements. The Fund's Schedule of Investments lists any underlying mutual funds or exchange-traded funds (ETFs) but does not include the underlying holdings of these funds. The following summarizes the significant accounting policies of the Fund:
Investment Valuation. Investments are valued as of 4:00 p.m. Eastern time on the last calendar day of the period. The Board of Trustees (the Board) has designated the Fund's investment adviser as the valuation designee responsible for the fair valuation function and performing fair value determinations as needed. The investment adviser has established a Fair Value Committee (the Committee) to carry out the day-to-day fair valuation responsibilities and has adopted policies and procedures to govern the fair valuation process and the activities of the Committee. In accordance with these fair valuation policies and procedures, which have been approved by the Board, the Fund attempts to obtain prices from one or more third party pricing services or brokers to value its investments. When current market prices, quotations or currency exchange rates are not readily available or reliable, investments will be fair valued in good faith by the Committee, in accordance with the policies and procedures. Factors used in determining fair value vary by investment type and may include market or investment specific events, transaction data, estimated cash flows, and market observations of comparable investments. The frequency that the fair valuation procedures are used cannot be predicted and they may be utilized to a significant extent. The Committee manages the Fund's fair valuation practices and maintains the fair valuation policies and procedures. The Fund's investment adviser reports to the Board information regarding the fair valuation process and related material matters.
The Fund categorizes the inputs to valuation techniques used to value its investments into a disclosure hierarchy consisting of three levels as shown below:
Level 1 - unadjusted quoted prices in active markets for identical investments
Level 2 - other significant observable inputs (including quoted prices for similar investments, interest rates, prepayment speeds, etc.)
Level 3 - unobservable inputs (including the Fund's own assumptions based on the best information available)
Valuation techniques used to value the Fund's investments by major category are as follows:
Equity securities, including restricted securities, for which market quotations are readily available, are valued at the last reported sale price or official closing price as reported by a third party pricing service on the primary market or exchange on which they are traded and are categorized as Level 1 in the hierarchy. In the event there were no sales during the day or closing prices are not available, securities are valued at the last quoted bid price or may be valued using the last available price and are generally categorized as Level 2 in the hierarchy. For foreign equity securities, when market or security specific events arise, comparisons to the valuation of American Depositary Receipts (ADRs), futures contracts, Exchange-Traded Funds (ETFs) and certain indexes as well as quoted prices for similar securities may be used and would be categorized as Level 2 in the hierarchy. For equity securities, including restricted securities, where observable inputs are limited, assumptions about market activity and risk are used and these securities may be categorized as Level 3 in the hierarchy.
Investments in open-end mutual funds, including the Fidelity Central Funds, are valued at their closing net asset value (NAV) each business day and are categorized as Level 1 in the hierarchy.
Changes in valuation techniques may result in transfers in or out of an assigned level within the disclosure hierarchy. The aggregate value of investments by input level as of October 31, 2024 is included at the end of the Fund's Schedule of Investments.
Foreign Currency. Certain Funds may use foreign currency contracts to facilitate transactions in foreign-denominated securities. Gains and losses from these transactions may arise from changes in the value of the foreign currency or if the counterparties do not perform under the contracts' terms.
Foreign-denominated assets, including investment securities, and liabilities are translated into U.S. dollars at the exchange rates at period end. Purchases and sales of investment securities, income and dividends received, and expenses denominated in foreign currencies are translated into U.S. dollars at the exchange rate in effect on the transaction date.
The effects of exchange rate fluctuations on investments are included with the net realized and unrealized gain (loss) on investment securities. Other foreign currency transactions resulting in realized and unrealized gain (loss) are disclosed separately.
Investment Transactions and Income. For financial reporting purposes, the Fund's investment holdings and NAV include trades executed through the end of the last business day of the period. The NAV per share for processing shareholder transactions is calculated as of the close of business of the New York Stock Exchange (NYSE), normally 4:00 p.m. Eastern time and includes trades executed through the end of the prior business day. Gains and losses on securities sold are determined on the basis of identified cost and include proceeds received from litigation. Commissions paid to certain brokers with whom the investment adviser, or its affiliates, places trades on behalf of a fund include an amount in addition to trade execution, which may be rebated back to a fund. Any such rebates are included in net realized gain (loss) on investments in the Statement of Operations. Dividend income is recorded on the ex-dividend date, except for certain dividends from foreign securities where the ex-dividend date may have passed, which are recorded as soon as the Fund is informed of the ex-dividend date. Non-cash dividends included in dividend income, if any, are recorded at the fair market value of the securities received. Income and capital gain distributions from Fidelity Central Funds, if any, are recorded on the ex-dividend date. Interest income is accrued as earned and includes coupon interest and amortization of premium and accretion of discount on debt securities as applicable. Investment income is recorded net of foreign taxes withheld where recovery of such taxes is uncertain. Funds may file withholding tax reclaims in certain jurisdictions to recover a portion of amounts previously withheld. Any withholding tax reclaims income is included in the Statement of Operations in foreign taxes withheld. Any receivables for withholding tax reclaims are included in the Statement of Assets and Liabilities in reclaims receivable. The Fund has filed tax reclaims for previously withheld taxes on dividends earned in certain European Union (EU) countries. These additional filings are subject to various administrative proceedings by the local jurisdictions' tax authorities within the EU, as well as a number of related judicial proceedings. Income recognized for EU reclaims is included with other reclaims in the Statement of Operations in foreign taxes withheld. These reclaims are recorded when the amount is known and there are no significant uncertainties on collectability.
Class Allocations and Expenses. Investment income, realized and unrealized capital gains and losses, common expenses of a fund, and certain fund-level expense reductions, if any, are allocated daily on a pro-rata basis to each class based on the relative net assets of each class to the total net assets of a fund. Each class differs with respect to transfer agent and distribution and service plan fees incurred, as applicable. Certain expense reductions may also differ by class, if applicable. For the reporting period, the allocated portion of income and expenses to each class as a percent of its average net assets may vary due to the timing of recording these transactions in relation to fluctuating net assets of the classes. Expenses directly attributable to a fund are charged to that fund. Expenses attributable to more than one fund are allocated among the respective funds on the basis of relative net assets or other appropriate methods. Expenses included in the accompanying financial statements reflect the expenses of that fund and do not include any expenses associated with any underlying mutual funds or exchange-traded funds (ETFs). Although not included in a fund's expenses, a fund indirectly bears its proportionate share of these expenses through the net asset value of each underlying mutual fund or exchange-traded fund (ETF). Expense estimates are accrued in the period to which they relate and adjustments are made when actual amounts are known.
Income Tax Information and Distributions to Shareholders. Each year, the Fund intends to qualify as a regulated investment company under Subchapter M of the Internal Revenue Code, including distributing substantially all of its taxable income and realized gains. As a result, no provision for U.S. Federal income taxes is required. As of October 31, 2024, the Fund did not have any unrecognized tax benefits in the financial statements; nor is the Fund aware of any tax positions for which it is reasonably possible that the total amounts of unrecognized tax benefits will significantly change in the next twelve months. The Fund files a U.S. federal tax return, in addition to state and local tax returns as required. The Fund's federal income tax returns are subject to examination by the Internal Revenue Service (IRS) for a period of three fiscal years after they are filed. State and local tax returns may be subject to examination for an additional fiscal year depending on the jurisdiction. Foreign taxes are provided for based on the Fund's understanding of the tax rules and rates that exist in the foreign markets in which it invests. The Fund is subject to a tax imposed on capital gains by certain countries in which it invests. An estimated deferred tax liability for net unrealized appreciation on the applicable securities is included in Deferred taxes on the Statement of Assets and Liabilities.
Distributions are declared and recorded on the ex-dividend date. Income and capital gain distributions are declared separately for each class. Income and capital gain distributions are determined in accordance with income tax regulations, which may differ from GAAP. In addition, the Fund claimed a portion of the payment made to redeeming shareholders as a distribution for income tax purposes.
Capital accounts within the financial statements are adjusted for permanent book-tax differences. These adjustments have no impact on net assets or the results of operations. Capital accounts are not adjusted for temporary book-tax differences which will reverse in a subsequent period.
Book-tax differences are primarily due to foreign currency transactions, certain foreign taxes, passive foreign investment companies (PFIC), capital loss carryforwards and losses deferred due to wash sales.
As of period end, the cost and unrealized appreciation (depreciation) in securities, and derivatives if applicable, for federal income tax purposes were as follows:
| Gross unrealized appreciation | $922,103,951 |
| Gross unrealized depreciation | (484,400,432) |
| Net unrealized appreciation (depreciation) | $437,703,519 |
| Tax Cost | $4,223,584,591 |
The tax-based components of distributable earnings as of period end were as follows:
| Undistributed ordinary income | $108,471,250 |
| Capital loss carryforward | $(59,463,247) |
| Net unrealized appreciation (depreciation) on securities and other investments | $435,358,924 |
Capital loss carryforwards are only available to offset future capital gains of the Fund to the extent provided by regulations and may be limited. The capital loss carryforward information presented below, including any applicable limitation, is estimated as of fiscal period end and is subject to adjustment.
Short-term | $(48,289,622) |
Long-term | (11,173,625) |
| Total capital loss carryforward | $(59,463,247) |
The tax character of distributions paid was as follows:
| | October 31, 2024 | October 31, 2023 |
| Ordinary Income | $81,035,424 | $ 22,796,061 |
| Total | $81,035,424 | $ 22,796,061 |
Restricted Securities (including Private Placements). Funds may invest in securities that are subject to legal or contractual restrictions on resale. These securities generally may be resold in transactions exempt from registration or to the public if the securities are registered. Disposal of these securities may involve time-consuming negotiations and expense, and prompt sale at an acceptable price may be difficult. Information regarding restricted securities held at period end is included at the end of the Schedule of Investments, if applicable.
New Accounting Pronouncement. In November 2023, the FASB issued Accounting Standards Update (ASU) 2023-07 Segment Reporting (Topic 280): Improvements to Reportable Segment Disclosures. Effective for fiscal years beginning after December 15, 2023 and interim periods within fiscal years beginning after December 15, 2024, the amendments enhance required disclosures of segment information for public entities on an annual and interim basis. The ASU allows for early adoption with updates applied retrospectively. Management is currently evaluating the impact of the ASU but does not expect this guidance to materially impact the financial statements.
4. Purchases and Sales of Investments.
Purchases and sales of securities, other than short-term securities and in-kind transactions, as applicable, are noted in the table below.
| | Purchases ($) | Sales ($) |
| Fidelity International Small Cap Fund | 1,259,998,471 | 724,298,720 |
5. Fees and Other Transactions with Affiliates.
Management Fee. Fidelity Management & Research Company LLC (the investment adviser) and its affiliates provide the Fund with investment management related services for which the Fund pays a monthly management fee.
Effective March 1, 2024, the Fund's management contract was amended to incorporate administrative services previously covered under separate services agreements (Transfer Agent and Accounting agreements). The amended contract incorporates a basic fee rate that may vary by class (subject to a performance adjustment). The investment adviser or an affiliate pays certain expenses of managing and operating the Fund out of each class's management fee. Each class of the Fund pays a management fee to the investment adviser. The management fee is calculated and paid to the investment adviser every month. The management fee is determined by calculating a basic fee and then applying a performance adjustment. When determining a class's basic fee, a mandate rate is calculated based on the monthly average net assets of a group of funds advised by FMR within a designated asset class. A discount rate is subtracted from the mandate rate once the Fund's monthly average net assets reach a certain level. The mandate rate and discount rate may vary by class. The annual basic fee rate for a class of shares of the Fund is the lesser of (1) the class's mandate rate reduced by the class's discount rate (if applicable) or (2) the amount set forth in the following table.
| | Maximum Management Fee Rate % |
| Class A | 1.02 |
| Class M | 1.02 |
| Class C | 1.02 |
| International Small Cap | 1.00 |
| Class I | 1.00 |
| Class Z | .87 |
One-twelfth of the basic fee rate for a class is applied to the average net assets of the class for the month, giving a dollar amount which is the basic fee for the class for that month. A different management fee rate may be applicable to each class of the Fund. The difference between classes is the result of separate arrangements for class-level services and/or waivers of certain expenses. It is not the result of any difference in advisory or custodial fees or other expenses related to the management of the Fund's assets, which do not vary by class. For the portion of the reporting period on or after March 1, 2024, the total annualized management fee rates were as follows:
| | Total Management Fee Rate % |
| Class A | .90 |
| Class M | .90 |
| Class C | .90 |
| International Small Cap | .86 |
| Class I | .90 |
| Class Z | .78 |
Prior to March 1, 2024, the management fee was the sum of an individual fund fee rate that was based on an annual rate of .60% of the Fund's average net assets and an annualized group fee rate that averaged .22% during the period. The group fee rate was based upon the monthly average net assets of a group of registered investment companies with which the investment adviser has management contracts. The group fee rate decreased as assets under management increased and increased as assets under management decreased. For the portion of the reporting period prior to March 1, 2024, the total annualized management fee rate was .82%.
The performance adjustment rate is calculated monthly by comparing over the performance period the Fund's performance to that of the performance adjustment index listed below.
| | Performance Adjustment Index |
| Fidelity International Small Cap Fund | MSCI ACWI (All Country World Index) ex USA Small Cap Index |
For the purposes of calculating the performance adjustment for the Fund, the Fund's investment performance is based on the performance of International Small Cap. To the extent that other classes of the Fund have higher expenses, this could result in those classes bearing a larger positive performance adjustment and smaller negative performance adjustment than would be the case if each class's own performance were considered. The performance period is the most recent 36 month period. The maximum annualized performance adjustment rate is ±.20% of the Fund's average net assets over the performance period. The performance adjustment rate is divided by twelve and multiplied by the Fund's average net assets over the performance period, and the resulting dollar amount is proportionately added to or subtracted from a class's basic fee. For the entire reporting period, the total annual performance adjustment was .11%.
Effective March 1, 2024, the Fund's sub-advisory agreements with FMR Investment Management (UK) Limited, Fidelity Management & Research (Hong Kong) Limited, and Fidelity Management & Research (Japan) Limited were amended to provide that the investment adviser pays each sub-adviser monthly fees equal to 110% of the sub-adviser's costs for providing sub-advisory services.
Effective March 1, 2024, the Fund's sub-advisory agreement with FIL Investment Advisors (FIA) was amended to provide that the investment adviser pays FIA monthly fees at an annual rate of 0.44% with respect to the average daily net assets of the Fund managed by FIA. FIA in turn pays FIA(UK).
Distribution and Service Plan Fees. In accordance with Rule 12b-1 of the 1940 Act, the Fund has adopted separate Distribution and Service Plans for each class of shares. Certain classes pay Fidelity Distributors Company LLC (FDC), an affiliate of the investment adviser, separate Distribution and Service Fees, each of which is based on an annual percentage of each class' average net assets. In addition, FDC may pay financial intermediaries for selling shares of the Fund and providing shareholder support services. For the period, the Distribution and Service Fee rates, total fees and amounts retained by FDC were as follows:
| | Distribution Fee | Service Fee | Total Fees ($) | Retained by FDC ($) |
| Class A | - % | .25% | 318,575 | 3,992 |
| Class M | .25% | .25% | 88,895 | - |
| Class C | .75% | .25% | 136,884 | 11,830 |
| | | | 544,354 | 15,822 |
Sales Load. FDC may receive a front-end sales charge of up to 5.75% for selling Class A shares and 3.50% for selling Class M shares, some of which is paid to financial intermediaries for selling shares of the Fund. Depending on the holding period, FDC may receive contingent deferred sales charges levied on Class A, Class M and Class C redemptions. The deferred sales charges are 1.00% for Class C shares, 1.00% for certain purchases of Class A shares and .25% for certain purchases of Class M shares.
For the period, sales charge amounts retained by FDC were as follows:
| | Retained by FDC ($) |
| Class A | 16,227 |
| Class M | 1,066 |
Class CA | 17 |
| | 17,310 |
A When Class C shares are initially sold, FDC pays commissions from its own resources to financial intermediaries through which the sales are made.
Transfer Agent Fees. Fidelity Investments Institutional Operations Company LLC (FIIOC), an affiliate of the investment adviser, is the transfer, dividend disbursing and shareholder servicing agent for each class of the Fund. Effective March 1, 2024, the Fund's management contract was amended to incorporate transfer agent services and associated fees previously covered under a separate services agreement. FIIOC pays for typesetting, printing and mailing of shareholder reports, except proxy statements.
During the period December 1, 2023 through February 29, 2024, the transfer agent fees for each class were a fixed annual rate of class-level average net assets as follows:
| | % of Class-Level Average Net Assets |
| Class A | .1909 |
| Class M | .2000 |
| Class C | .2000 |
| International Small Cap | .1743 |
| Class I | .1723 |
| Class Z | .0420 |
Prior to December 1, 2023, FIIOC received account fees and asset-based fees that varied according to the account size and type of account of the shareholders of the respective classes of the Fund, except for Class Z. FIIOC received an asset-based fee of Class Z's average net assets. For the portion of the reporting period prior to March 1, 2024, the fees were equivalent to the following annualized rates:
| | Amount ($) | % of Class-Level Average Net Assets |
| Class A | 77,950 | .19 |
| Class M | 11,353 | .20 |
| Class C | 9,182 | .20 |
| International Small Cap | 861,865 | .18 |
| Class I | 626,562 | .17 |
| Class Z | 205,564 | .04 |
| 1,792,476 | |
Accounting Fees. Fidelity Service Company, Inc. (FSC), an affiliate of the investment adviser, maintains the Fund's accounting records. Effective March 1, 2024, the Fund's management contract was amended to incorporate accounting services and associated fees previously covered under a separate services agreement.
During the period December 1, 2023 through February 29, 2024, the accounting fees were a fixed annual rate of average net assets as follows:
| | % of Average Net Assets |
| Fidelity International Small Cap Fund | 0.0385 |
Prior to December 1, 2023, the accounting fee was based on the level of average net assets for each month. For the portion of the reporting period prior to March 1, 2024, the fees were equivalent to the following annualized rates:
| | % of Average Net Assets |
| Fidelity International Small Cap Fund | .04 |
Brokerage Commissions. A portion of portfolio transactions were placed with brokerage firms which are affiliates of the investment adviser. Brokerage commissions are included in net realized gain (loss) and change in net unrealized appreciation (depreciation) in the Statement of Operations. The commissions paid to these affiliated firms were as follows:
| | Amount ($) |
| Fidelity International Small Cap Fund | 1,737 |
Interfund Trades. Funds may purchase from or sell securities to other Fidelity Funds under procedures adopted by the Board. The procedures have been designed to ensure these interfund trades are executed in accordance with Rule 17a-7 of the 1940 Act. Any interfund trades are included within the respective purchases and sales amounts shown in the Purchases and Sales of Investments note. Interfund trades during the period are noted in the table below.
| | Purchases ($) | Sales ($) | Realized Gain (Loss)($) |
| Fidelity International Small Cap Fund | 48,868,552 | 16,970,830 | 5,847,016 |
6. Committed Line of Credit.
Certain Funds participate with other funds managed by the investment adviser or an affiliate in a $4.25 billion credit facility (the "line of credit") to be utilized for temporary or emergency purposes to fund shareholder redemptions or for other short-term liquidity purposes. The participating funds have agreed to pay commitment fees on their pro-rata portion of the line of credit, which are reflected in Miscellaneous expenses on the Statement of Operations, and are listed below. During the period, there were no borrowings on this line of credit.
| | Amount ($) |
| Fidelity International Small Cap Fund | 7,145 |
7. Security Lending.
Funds lend portfolio securities from time to time in order to earn additional income. Lending agents are used, including National Financial Services (NFS), an affiliate of the investment adviser. Pursuant to a securities lending agreement, NFS will receive a fee, which is capped at 9.9% of a fund's daily lending revenue, for its services as lending agent. A fund may lend securities to certain qualified borrowers, including NFS. On the settlement date of the loan, a fund receives collateral (in the form of U.S. Treasury obligations, letters of credit and/or cash) against the loaned securities and maintains collateral in an amount not less than 100% of the market value of the loaned securities during the period of the loan. The market value of the loaned securities is determined at the close of business of a fund and any additional required collateral is delivered to a fund on the next business day. A fund or borrower may terminate the loan at any time, and if the borrower defaults on its obligation to return the securities loaned because of insolvency or other reasons, a fund may apply collateral received from the borrower against the obligation. A fund may experience delays and costs in recovering the securities loaned. Any cash collateral received is invested in the Fidelity Securities Lending Cash Central Fund. Any loaned securities are identified as such in the Schedule of Investments, and the value of loaned securities and cash collateral at period end, as applicable, are presented in the Statement of Assets and Liabilities. Security lending income represents the income earned on investing cash collateral, less rebates paid to borrowers and any lending agent fees associated with the loan, plus any premium payments received for lending certain types of securities. Security lending income is presented in the Statement of Operations as a component of income from Fidelity Central Funds. Affiliated security lending activity, if any, was as follows:
| | Total Security Lending Fees Paid to NFS ($) | Security Lending Income From Securities Loaned to NFS ($) | Value of Securities Loaned to NFS at Period End ($) |
| Fidelity International Small Cap Fund | 14,263 | - | - |
8. Expense Reductions.
Through arrangements with the Fund's custodian, credits realized as a result of certain uninvested cash balances were used to reduce the Fund's expenses. During the period, custodian credits reduced the Fund's expenses by $730. During the period, transfer agent credits reduced each class' expenses as noted in the table below.
| | Expense reduction ($) |
| | |
| Class M | 35 |
| | 35 |
In addition, during the period the investment adviser or an affiliate reimbursed and/or waived a portion of fund-level operating expenses in the amount of $191,275.
9. Distributions to Shareholders.
Distributions to shareholders of each class were as follows:
| | Year ended October 31, 2024 | Year ended October 31, 2023 |
| Fidelity International Small Cap Fund | | |
| Distributions to shareholders | | |
| Class A | $2,098,372 | $440,641 |
| Class M | 241,727 | 19,955 |
| Class C | 139,497 | - |
| International Small Cap | 27,992,078 | 8,831,165 |
| Class I | 20,805,567 | 5,018,235 |
| Class Z | 29,758,183 | 8,486,066 |
Total | $81,035,424 | $22,796,062 |
10. Share Transactions.
Share transactions for each class were as follows and may contain in-kind transactions, automatic conversions between classes or exchanges between affiliated funds:
| | Shares | Shares | Dollars | Dollars |
| | Year ended October 31, 2024 | Year ended October 31, 2023 | Year ended October 31, 2024 | Year ended October 31, 2023 |
| Fidelity International Small Cap Fund | | | | |
| Class A | | | | |
| Shares sold | 727,649 | 918,692 | $22,252,808 | $25,838,409 |
| Reinvestment of distributions | 71,368 | 16,707 | 2,084,465 | 437,544 |
| Shares redeemed | (860,161) | (896,876) | (26,602,775) | (25,017,177) |
| Net increase (decrease) | (61,144) | 38,523 | $(2,265,502) | $1,258,776 |
| Class M | | | | |
| Shares sold | 123,660 | 114,850 | $3,890,067 | $3,220,186 |
| Reinvestment of distributions | 8,280 | 763 | 241,156 | 19,926 |
| Shares redeemed | (101,426) | (114,079) | (3,110,795) | (3,149,104) |
| Net increase (decrease) | 30,514 | 1,534 | $1,020,428 | $91,008 |
| Class C | | | | |
| Shares sold | 57,296 | 51,153 | $1,707,164 | $1,355,166 |
| Reinvestment of distributions | 4,960 | - | 139,376 | - |
| Shares redeemed | (132,703) | (152,016) | (3,971,313) | (4,049,390) |
| Net increase (decrease) | (70,447) | (100,863) | $(2,124,773) | $(2,694,224) |
| International Small Cap | | | | |
| Shares sold | 10,622,095 | 12,448,015 | $338,221,799 | $353,729,600 |
| Reinvestment of distributions | 843,925 | 303,022 | 25,168,669 | 8,099,784 |
| Shares redeemed | (10,703,729) | (10,758,826) | (336,929,002) | (307,464,961) |
| Net increase (decrease) | 762,291 | 1,992,211 | $26,461,466 | $54,364,423 |
| Class I | | | | |
| Shares sold | 13,931,167 | 14,669,013 | $442,942,466 | $422,708,769 |
| Reinvestment of distributions | 673,230 | 178,126 | 20,225,978 | 4,795,157 |
| Shares redeemed | (7,562,762) | (9,758,006) | (242,340,980) | (275,755,333) |
| Net increase (decrease) | 7,041,635 | 5,089,133 | $220,827,464 | $151,748,593 |
| Class Z | | | | |
| Shares sold | 16,036,560 | 18,575,488 | $510,478,803 | $542,508,039 |
| Reinvestment of distributions | 663,553 | 206,606 | 19,900,821 | 5,553,574 |
| Shares redeemed | (8,375,022) | (12,784,069) | (269,097,894) | (354,344,306) |
| Net increase (decrease) | 8,325,091 | 5,998,025 | $261,281,730 | $193,717,307 |
11. Other.
A fund's organizational documents provide former and current trustees and officers with a limited indemnification against liabilities arising in connection with the performance of their duties to the fund. In the normal course of business, a fund may also enter into contracts that provide general indemnifications. A fund's maximum exposure under these arrangements is unknown as this would be dependent on future claims that may be made against a fund. The risk of material loss from such claims is considered remote.
12. Risk and Uncertainties.
Many factors affect a fund's performance. Developments that disrupt global economies and financial markets, such as pandemics, epidemics, outbreaks of infectious diseases, war, terrorism, and environmental disasters, may significantly affect a fund's investment performance. The effects of these developments to a fund will be impacted by the types of securities in which a fund invests, the financial condition, industry, economic sector, and geographic location of an issuer, and a fund's level of investment in the securities of that issuer. Significant concentrations in security types, issuers, industries, sectors, and geographic locations may magnify the factors that affect a fund's performance.
Report of Independent Registered Public Accounting Firm
To the Board of Trustees of Fidelity Investment Trust and the Shareholders of Fidelity International Small Cap Fund:
Opinion on the Financial Statements and Financial Highlights
We have audited the accompanying statement of assets and liabilities of Fidelity International Small Cap Fund (the "Fund"), a fund of Fidelity Investment Trust, including the schedule of investments, as of October 31, 2024, the related statement of operations for the year then ended, the statement of changes in net assets for each of the two years in the period then ended, the financial highlights for each of the five years in the period then ended, and the related notes. In our opinion, the financial statements and financial highlights present fairly, in all material respects, the financial position of the Fund as of October 31, 2024, and the results of its operations for the year then ended, the changes in its net assets for each of the two years in the period then ended, and the financial highlights for each of the five years in the period then ended in conformity with accounting principles generally accepted in the United States of America.
Basis for Opinion
These financial statements and financial highlights are the responsibility of the Fund's management. Our responsibility is to express an opinion on the Fund's financial statements and financial highlights based on our audits. We are a public accounting firm registered with the Public Company Accounting Oversight Board (United States) (PCAOB) and are required to be independent with respect to the Fund in accordance with the U.S. federal securities laws and the applicable rules and regulations of the Securities and Exchange Commission and the PCAOB.
We conducted our audits in accordance with the standards of the PCAOB. Those standards require that we plan and perform the audit to obtain reasonable assurance about whether the financial statements and financial highlights are free of material misstatement, whether due to error or fraud. The Fund is not required to have, nor were we engaged to perform, an audit of its internal control over financial reporting. As part of our audits, we are required to obtain an understanding of internal control over financial reporting but not for the purpose of expressing an opinion on the effectiveness of the Fund's internal control over financial reporting. Accordingly, we express no such opinion.
Our audits included performing procedures to assess the risks of material misstatement of the financial statements and financial highlights, whether due to error or fraud, and performing procedures that respond to those risks. Such procedures included examining, on a test basis, evidence regarding the amounts and disclosures in the financial statements and financial highlights. Our audits also included evaluating the accounting principles used and significant estimates made by management, as well as evaluating the overall presentation of the financial statements and financial highlights. Our procedures included confirmation of securities owned as of October 31, 2024, by correspondence with the custodian and brokers; when replies were not received from brokers, we performed other auditing procedures. We believe that our audits provide a reasonable basis for our opinion.
/s/ Deloitte & Touche LLP
Boston, Massachusetts
December 16, 2024
We have served as the auditor of one or more of the Fidelity investment companies since 1999.
Distributions
(Unaudited)The dividend and capital gains distributions for the fund(s) are available on Fidelity.com or Institutional.Fidelity.com.
The fund designates $1,911,909 of distributions paid during the fiscal year ended 2024 as qualifying to be taxed as section 163(j) interest dividends.
A percentage of the dividends distributed during the fiscal year for the following funds qualify for the dividends-received deduction for corporate shareholders:
| | Class A | Class M | Class C | Retail | Class I | Class Z | |
| | | | | | | | |
| December 8, 2023 | 0% | 0% | 0% | 0% | 0% | 0% | |
| December 27, 2023 | 1% | 1% | 1% | 1% | 1% | 1% | |
A percentage of the dividends distributed during the fiscal year for the following funds may be taken into account as a dividend for purposes of the maximum rate under section 1(h)(11) of the Internal Revenue Code.
| | Class A | Class M | Class C | Retail | Class I | Class Z | |
| | | | | | | | |
| December 8, 2023 | 100% | 100% | 100% | 97.31% | 96.11% | 91.19% | |
| December 27, 2023 | 100% | 100% | 100% | 100% | 100% | 100% | |
The amounts per share which represent income derived from sources within, and taxes paid to, foreign countries or possessions of the United States are as follows:
| | Pay Date | Income | Taxes |
| | | | |
| Class A | 12/11/23 | $0.5502 | $0.0684 |
| | 12/28/23 | $0.0000 | $0.0000 |
| Class M | 12/11/23 | $0.4678 | $0.0684 |
| | 12/28/23 | $0.0000 | $0.0000 |
| Class C | 12/11/23 | $0.3310 | $0.0684 |
| | 12/28/23 | $0.0000 | $0.0000 |
| International Small Cap Fund | 12/11/23 | $0.6210 | $0.0684 |
| | 12/28/23 | $0.0000 | $0.0000 |
| Class I | 12/11/23 | $0.6287 | $0.0684 |
| | 12/28/23 | $0.0000 | $0.0000 |
| Class Z | 12/11/23 | $0.6627 | $0.0684 |
| | 12/28/23 | $0.0000 | $0.0000 |
| | | | |
The fund will notify shareholders in January 2025 of amounts for use in preparing 2024 income tax returns.
Item 8: Changes in and Disagreements with Accountants for Open-End Management Investment Companies
(Unaudited)
Note: This is not applicable for any fund included in this document.
Item 9: Proxy Disclosures for Open-End Management Investment Companies
(Unaudited)
| A special meeting of shareholders was held on July 16, 2024. The results of votes taken among shareholders on the proposal before them are reported below. Each vote reported represents one dollar of net asset value held on the record date for the meeting. |
| Proposal 1 |
| To elect a Board of Trustees. |
| | # of Votes | % of Votes |
| Bettina Doulton |
| Affirmative | 128,529,177,643.56 | 98.18 |
| Withheld | 2,378,037,364.30 | 1.82 |
| TOTAL | 130,907,215,007.85 | 100.00 |
| Robert A. Lawrence |
| Affirmative | 128,253,389,899.05 | 97.97 |
| Withheld | 2,653,825,108.81 | 2.03 |
| TOTAL | 130,907,215,007.85 | 100.00 |
| Vijay C. Advani |
| Affirmative | 128,531,418,228.19 | 98.19 |
| Withheld | 2,375,796,779.66 | 1.81 |
| TOTAL | 130,907,215,007.85 | 100.00 |
| Thomas P. Bostick |
| Affirmative | 128,495,261,591.41 | 98.16 |
| Withheld | 2,411,953,416.44 | 1.84 |
| TOTAL | 130,907,215,007.85 | 100.00 |
| Donald F. Donahue |
| Affirmative | 128,407,878,996.00 | 98.09 |
| Withheld | 2,499,336,011.85 | 1.91 |
| TOTAL | 130,907,215,007.85 | 100.00 |
| Vicki L. Fuller |
| Affirmative | 128,625,540,095.19 | 98.26 |
| Withheld | 2,281,674,912.66 | 1.74 |
| TOTAL | 130,907,215,007.85 | 100.00 |
| Patricia L. Kampling |
| Affirmative | 128,668,729,281.34 | 98.29 |
| Withheld | 2,238,485,726.51 | 1.71 |
| TOTAL | 130,907,215,007.85 | 100.00 |
| Thomas A. Kennedy |
| Affirmative | 128,499,824,239.79 | 98.16 |
| Withheld | 2,407,390,768.06 | 1.84 |
| TOTAL | 130,907,215,007.85 | 100.00 |
| Oscar Munoz |
| Affirmative | 128,386,109,391.05 | 98.07 |
| Withheld | 2,521,105,616.80 | 1.93 |
| TOTAL | 130,907,215,007.85 | 100.00 |
| Karen B. Peetz |
| Affirmative | 128,603,731,113.82 | 98.24 |
| Withheld | 2,303,483,894.03 | 1.76 |
| TOTAL | 130,907,215,007.85 | 100.00 |
| David M. Thomas |
| Affirmative | 128,384,899,342.98 | 98.07 |
| Withheld | 2,522,315,664.88 | 1.93 |
| TOTAL | 130,907,215,007.85 | 100.00 |
| Susan Tomasky |
| Affirmative | 128,556,148,461.60 | 98.20 |
| Withheld | 2,351,066,546.25 | 1.80 |
| TOTAL | 130,907,215,007.85 | 100.00 |
| Michael E. Wiley |
| Affirmative | 128,264,934,978.34 | 97.98 |
| Withheld | 2,642,280,029.51 | 2.02 |
| TOTAL | 130,907,215,007.85 | 100.00 |
| | | |
| Proposal 1 reflects trust-wide proposal and voting results. |
Item 10: Remuneration Paid to Directors, Officers, and others of Open-End Management Investment Companies
(Unaudited)
Note: This information is disclosed as part of the financial statements for each Fund as part of Item 7: Financial Statements and Financial Highlights for Open-End Management Investment companies.
Item 11: Statement Regarding Basis for Approval of Investment Advisory Contract
(Unaudited)
Board Approval of Investment Advisory Contracts and Management Fees
Fidelity International Small Cap Fund
Each year, the Board of Trustees, including the Independent Trustees (together, the Board), considers the renewal of the fund's management contract with Fidelity Management & Research Company LLC (FMR) and certain affiliates and the sub-advisory agreements (together, the Advisory Contracts) for the fund. FMR and the sub-advisers are referred to herein as the Investment Advisers. The Board, assisted by the advice of fund counsel and Independent Trustees' counsel, requests and considers a broad range of information relevant to the renewal of the Advisory Contracts throughout the year.
The Board meets regularly and, at each of its meetings, covers an extensive agenda of topics and materials and considers factors that are relevant to its annual consideration of the renewal of the fund's Advisory Contracts, including the services and support provided to the fund and its shareholders. The Board, acting directly and through its Committees (each of which is composed of and chaired by Independent Trustees), requests and receives information concerning the annual consideration of the renewal of the fund's Advisory Contracts. The Board also meets as needed to review matters specifically related to the Board's annual consideration of the renewal of the Advisory Contracts. Members of the Board may also meet with trustees of other Fidelity funds through joint ad hoc committees to discuss certain matters relevant to all of the Fidelity funds.
At its May 2024 meeting, the Board unanimously determined to renew the fund's Advisory Contracts. In reaching its determination, the Board considered all factors it believed relevant, including (i) the nature, extent, and quality of the services provided to the fund and its shareholders (including the investment performance of the fund); (ii) the competitiveness relative to peer funds of the fund's management fee and the total expense ratio of a representative class (the retail class, which was selected because it was the largest class without 12b-1 fees); (iii) the total costs of the services provided by and the profits realized by FMR and its affiliates (Fidelity) from its relationships with the fund; and (iv) the extent to which, if any, economies of scale exist and are realized as the fund grows, and whether any economies of scale are appropriately shared with fund shareholders. The Board also considered the broad range of investment choices available to shareholders from FMR's competitors and that the fund's shareholders have chosen to invest in the fund, which is part of the Fidelity family of funds. The Board's decision to renew the Advisory Contracts was not based on any single factor.
The Board reached a determination, with the assistance of fund counsel and Independent Trustees' counsel and through the exercise of its business judgment, that the renewal of the Advisory Contracts was in the best interests of the fund and its shareholders and that the compensation payable under the Advisory Contracts was fair and reasonable in light of all of the surrounding circumstances.
Nature, Extent, and Quality of Services Provided. The Board considered staffing as it relates to the fund, including the backgrounds and experience of investment personnel of the Investment Advisers, and also considered the Investment Advisers' implementation of the fund's investment program. The Independent Trustees also had discussions with senior management of Fidelity's investment operations and investment groups. The Board considered the structure of the investment personnel compensation program and whether this structure provides appropriate incentives to act in the best interests of the fund. Additionally, the Board considered the portfolio managers' investments, if any, in the funds that they manage.
Resources Dedicated to Investment Management and Support Services. The Board and the Fund Oversight and Research Committees reviewed the general qualifications and capabilities of Fidelity's investment staff, including its size, education, experience, and resources, as well as Fidelity's approach to recruiting, training, managing, and compensating investment personnel. The Board noted the resources devoted to expansion of Fidelity's global investment organization, and that Fidelity's analysts have extensive resources, tools, and capabilities that allow them to conduct sophisticated quantitative and fundamental analysis, as well as credit analysis of issuers, counterparties and guarantors. Further, the Board considered that Fidelity's investment professionals have sufficient access to global information and data so as to provide competitive investment results over time, and that those professionals also have access to sophisticated tools that permit them to assess portfolio construction and risk and performance attribution characteristics continuously, as well as to transmit new information and research conclusions rapidly around the world. Additionally, in its deliberations, the Board considered Fidelity's trading, risk management, compliance, and technology and operations capabilities and resources, which are integral parts of the investment management process.
Shareholder and Administrative Services. The Board considered (i) the nature, extent, quality, and cost of advisory, administrative, shareholder, transfer agency, and pricing and bookkeeping services performed by the Investment Advisers and their affiliates under the Advisory Contracts; (ii) the nature and extent of Fidelity's supervision of third party service providers, principally custodians, subcustodians, and pricing vendors; and (iii) the resources devoted by Fidelity to, and the record of compliance with, the fund's compliance policies and procedures. The Board also reviewed the allocation of fund brokerage, including allocations to brokers affiliated with the Investment Advisers, the use of brokerage commissions to pay fund expenses, and the use of "soft" commission dollars to pay for research services. The Board also considered the fund's securities lending activities and any payments made to Fidelity relating to securities lending under a separate agreement.
The Board noted that the growth of fund assets over time across the complex allows Fidelity to reinvest in the development of services designed to enhance the value and convenience of the Fidelity funds as investment vehicles. These services include 24-hour access to account information and market information over the Internet and through telephone representatives, investor education materials, and asset allocation tools. The Board also considered that it reviews customer service metrics such as telephone response times, continuity of services on the website and metrics addressing services at Fidelity Investor Centers.
Investment in a Large Fund Family. The Board considered the benefits to shareholders of investing in a fund that is part of a large family of funds offering a variety of investment disciplines and providing a large variety of fund investor services. The Board noted that Fidelity had taken, or had made recommendations that resulted in the Fidelity funds taking, a number of actions over the previous year that benefited particular funds and/or the Fidelity funds in general.
Investment Performance. The Board took into account discussions that occur with representatives of the Investment Advisers, and reports that it receives, at Board meetings throughout the year, relating to fund investment performance. In this regard the Board noted that as part of regularly scheduled fund reviews and other reports to the Board on fund performance, the Board considered annualized return information for the fund for different time periods, measured against an appropriate securities market index (benchmark index) and an appropriate peer group of funds with similar objectives (peer group). The Board also considered information about performance attribution. In its ongoing evaluation of fund investment performance, the Board gives particular attention to information indicating changes in performance of the funds over different time periods and discussed with the Investment Advisers the reasons for any overperformance or underperformance.
In addition to reviewing absolute and relative fund performance, the Independent Trustees periodically consider the appropriateness of fund performance metrics in evaluating the results achieved. The Independent Trustees generally give greater weight to fund performance over longer time periods than over shorter time periods. Depending on the circumstances, the Independent Trustees may be satisfied with a fund's performance notwithstanding that it lags its benchmark index or peer group for certain periods.
Based on its review, the Board concluded that the nature, extent, and quality of services provided to the fund under the Advisory Contracts should continue to benefit the shareholders of the fund.
Competitiveness of Management Fee and Total Expense Ratio. The Board was provided with information regarding industry trends in management fees and expenses. The Board considered that, effective March 1, 2024, an amended Advisory Contract with FMR went into effect with class-level management fees based on tiered schedules and subject to a maximum class-level rate (the management fee). The Board also considered that in exchange for the variable management fee, each class of the fund receives investment advisory, management, administrative, transfer agent, and pricing and bookkeeping services. In its review of the management fee and total expense ratio of the retail class, the Board considered a pro forma management fee rate for the retail class as if it had been in effect for the 12-month period ended September 30, 2023, as well as other third-party fund expenses, as applicable, such as custodial, legal, and audit fees and any fund-paid 12b-1 fees. The Board noted that Fidelity may agree to waive fees or reimburse expenses from time to time, and the extent to which, if any, it has done so for the fund. The Board also considered information about the impact of the fund's performance adjustment.
Comparisons of Management Fees and Total Expense Ratios. Among other things, the Board reviewed data for selected groups of competitive funds and classes (referred to as "mapped groups") that were compiled by Fidelity based on combining similar investment objective categories (as classified by Morningstar) that have comparable investment mandates. The data reviewed by the Board included (i) gross management fee comparisons (before taking into account expense reimbursements or caps and without taking into account the fund's performance adjustment) relative to the total universe of funds within the mapped group; (ii) gross management fee comparisons relative to a subset of non-Fidelity funds in the mapped group that are similar in size and management fee structure to the fund (referred to as the "asset size peer group"); (iii) total expense comparisons of the retail class of the fund relative to funds and classes in the mapped group that have a similar sales load structure to the retail class of the fund (referred to as the "similar sales load structure group"); and (iv) total expense comparisons of the retail class of the fund relative to funds and classes in the similar sales load structure group that are similar in size and management fee structure to the fund (referred to as the "total expense asset size peer group"). The total expense asset size peer group comparison excludes performance adjustments and fund-paid 12b-1 fees to eliminate variability in fee structures.
The information provided to the Board indicated that the fund's management fee rate ranked below the competitive median of the mapped group for the 12-month period ended September 30, 2023 and below the competitive median of the asset size peer group for the 12-month period ended September 30, 2023. Further, the information provided to the Board indicated that the total expense ratio of the retail class of the fund ranked below the competitive median of the similar sales load structure group for the 12-month period ended September 30, 2023 and below the competitive median of the total expense asset size peer group for the 12-month period ended September 30, 2023.
The Board noted that a different variable management fee rate is applicable to each class of the fund. The Board considered that the difference in management fee rates between classes is the result of separate arrangements for class-level services and/or waivers of certain expenses and not the result of any difference in advisory or custodial fees or other expenses related to the management of the fund's assets, which do not vary by class.
The Board also considered that the fund's management fee is subject to upward or downward adjustment depending upon whether, and to what extent, the fund's investment performance for the performance period (a rolling 36-month period) exceeds, or is exceeded by, a securities index, thus leading to a performance adjustment for the same period. The Board noted that the performance adjustment provides FMR with a strong economic incentive to seek to achieve superior long-term performance for the fund's shareholders and helps to more closely align the interests of FMR and the shareholders of the fund.
In connection with its consideration of the fund's performance adjustment, the Board noted that the performance of the retail class is used for purposes of determining the performance adjustment. The Board noted that to the extent the performance adjustment was based on the performance of a share class with higher total annual operating expenses, the fund would be subject to a smaller positive and larger negative performance adjustment. The Board considered the appropriateness of the use of the retail class as the basis for the performance adjustment. The Board noted that the retail class is typically the largest class (reflecting the actual investment experience for the plurality of shareholders), employs a standard expense structure, and does not include fund-paid 12b-1 fees, which Fidelity believes makes it a more appropriate measurement of Fidelity's investment skill.
Fees Charged to Other Fidelity Clients. The Board also considered Fidelity fee structures and other information with respect to clients of Fidelity, such as other funds advised or subadvised by Fidelity, pension plan clients, and other institutional clients with similar mandates. The Board noted that a joint ad hoc committee created by it and the boards of other Fidelity funds periodically reviews and compares Fidelity's institutional investment advisory business with its business of providing services to the Fidelity funds and also noted the most recent findings of the committee. The Board noted that the committee's review included a consideration of the differences in services provided, fees charged, and costs incurred, as well as competition in the markets serving the different categories of clients.
Based on its review, the Board concluded that the fund's management fee, including the use of the retail class as the basis for the performance adjustment, is fair and reasonable in light of the services that the fund receives and the other factors considered. Further, based on its review of total expense ratios and fees charged to other Fidelity clients, the Board concluded that the total expense ratio of each class of the fund was reasonable in light of the services that the fund and its shareholders receive and the other factors considered.
Costs of the Services and Profitability. The Board considered the revenues earned and the expenses incurred by Fidelity in conducting the business of developing, marketing, distributing, managing, administering and servicing the fund and servicing the fund's shareholders. The Board also considered the level of Fidelity's profits in respect of all the Fidelity funds.
On an annual basis, Fidelity presents to the Board information about the profitability of its relationships with the fund. Fidelity calculates profitability information for each fund, as well as aggregate profitability information for groups of Fidelity funds and all Fidelity funds, using a series of detailed revenue and cost allocation methodologies which originate with the books and records of Fidelity on which Fidelity's audited financial statements are based. The Audit Committee of the Board reviews any significant changes from the prior year's methodologies.
A public accounting firm has been engaged annually by the Board as part of the Board's assessment of Fidelity's profitability analysis. The engagement includes the review and assessment of the methodologies used by Fidelity in determining the revenues and expenses attributable to Fidelity's fund business, and completion of agreed-upon procedures in respect of the mathematical accuracy of certain fund profitability information and its conformity to established allocation methodologies. After considering the reports issued under the engagement and information provided by Fidelity, the Board concluded that while other allocation methods may also be reasonable, Fidelity's profitability methodologies are reasonable in all material respects.
The Board also reviewed Fidelity's non-fund businesses and potential indirect benefits such businesses may have received as a result of their association with Fidelity's fund business (i.e., fall-out benefits) as well as cases where Fidelity's affiliates may benefit from the funds' business. The Board considered areas where potential indirect benefits to the Fidelity funds from their relationships with Fidelity may exist. The Board's consideration of these matters was informed by the findings of a joint ad hoc committee created by it and the boards of other Fidelity funds to evaluate potential fall-out benefits.
The Board considered the costs of the services provided by and the profits realized by Fidelity in connection with the operation of the fund and was satisfied that the profitability was not excessive.
Economies of Scale. The Board considered whether there have been economies of scale in respect of the management of the Fidelity funds, whether the Fidelity funds (including the fund) have appropriately benefited from any such economies of scale, and whether there is potential for realization of any further economies of scale. The Board considered the extent to which the fund will benefit from economies of scale as assets grow through increased services to the fund, through waivers or reimbursements, or through fee or expense ratio reductions. The Board also noted that a committee created by it and the boards of other Fidelity funds periodically analyzes whether Fidelity attains economies of scale in respect of the management and servicing of the Fidelity funds, whether the Fidelity funds have appropriately benefited from such economies of scale, and whether there is potential for realization of any further economies of scale.
The Board recognized that the fund's management contract incorporates a variable management fee structure, which provides breakpoints as a way to share, in part, any potential economies of scale that may exist at the asset class level and through a discount that considers both fund size and total assets of the four applicable asset classes. The Board considered that the variable management fee is designed to deliver the benefits of economies of scale to fund shareholders even if assets of any particular fund are unchanged or have declined, because some portion of Fidelity's costs are attributable to services provided to all funds subject to the variable management fee, and all such funds benefit if those costs can be allocated among more assets. The Board concluded that, given the variable management fee structure, fund shareholders will benefit from lower management fees due to the application of the breakpoints and discount factor, regardless of whether Fidelity achieves any such economies of scale.
The Board concluded, taking into account the analysis of the committee, that economies of scale, if any, are being appropriately shared between fund shareholders and Fidelity.
Additional Information Requested by the Board. In order to develop fully the factual basis for consideration of the Fidelity funds' advisory contracts, the Board requested and received additional information on certain topics, including but not limited to: (i) fund flow and performance trends, in particular the underperformance of certain funds and strategies, and Fidelity's long-term strategies for certain funds; (ii) the operation of performance fees and the rationale for implementing performance fees on certain categories of funds but not others; (iii) Fidelity's pricing philosophy compared to competitors; (iv) fund profitability methodology and data; (v) evaluation of competitive fund data and peer group classifications and fee and expense comparisons; (vi) the management fee and expense structures for different funds and classes and information about the differences between various fee and expense structures; (vii) the variable management fee implemented for certain funds effective March 1, 2024; and (viii) information regarding other accounts managed by Fidelity and the funds' sub-advisory arrangements.
Conclusion. Based on its evaluation of all of the conclusions noted above, and after considering all factors it believed relevant, the Board, including the Independent Trustees, concluded that the advisory and sub-advisory fee arrangements are fair and reasonable in light of all of the surrounding circumstances and that the fund's Advisory Contracts should be renewed through May 31, 2025.
1.793585.121
ISC-ANN-1224
Fidelity® International Small Cap Opportunities Fund
Annual Report
October 31, 2024
Includes Fidelity and Fidelity Advisor share classes
Contents
To view a fund's proxy voting guidelines and proxy voting record for the 12-month period ended June 30, visit http://www.fidelity.com/proxyvotingresults or visit the Securities and Exchange Commission's (SEC) web site at http://www.sec.gov.
You may also call 1-800-544-8544 if you're an individual investing directly with Fidelity, call 1-800-835-5092 if you're a plan sponsor or participant with Fidelity as your recordkeeper or call 1-877-208-0098 on institutional accounts or if you're an advisor or invest through one to request a free copy of the proxy voting guidelines.
Standard & Poor's, S&P and S&P 500 are registered service marks of The McGraw-Hill Companies, Inc. and have been licensed for use by Fidelity Distributors Corporation.
Other third-party marks appearing herein are the property of their respective owners.
All other marks appearing herein are registered or unregistered trademarks or service marks of FMR LLC or an affiliated company. © 2024 FMR LLC. All rights reserved.
This report and the financial statements contained herein are submitted for the general information of the shareholders of the Fund. This report is not authorized for distribution to prospective investors in the Fund unless preceded or accompanied by an effective prospectus.
A fund files its complete schedule of portfolio holdings with the SEC for the first and third quarters of each fiscal year on Form N-PORT. Forms N-PORT are available on the SEC's web site at http://www.sec.gov. A fund's Forms N-PORT may be reviewed and copied at the SEC's Public Reference Room in Washington, DC. Information regarding the operation of the SEC's Public Reference Room may be obtained by calling 1-800-SEC-0330.
For a complete list of a fund's portfolio holdings, view the most recent holdings listing, semiannual report, or annual report on Fidelity's web site at http://www.fidelity.com, http://www.institutional.fidelity.com, or http://www.401k.com, as applicable.
NOT FDIC INSURED •MAY LOSE VALUE •NO BANK GUARANTEE
Neither the Fund nor Fidelity Distributors Corporation is a bank.
Item 7: Financial Statements and Financial Highlights for Open-End Management Investment Companies (Annual Report)
Fidelity® International Small Cap Opportunities Fund
Schedule of Investments October 31, 2024
Showing Percentage of Net Assets
| Common Stocks - 92.8% |
| | | Shares | Value ($) |
| Australia - 2.1% | | | |
| Imdex Ltd. | | 6,780,074 | 11,518,204 |
| Steadfast Group Ltd. | | 2,871,460 | 10,341,444 |
| Whitehaven Coal Ltd. | | 1,160,000 | 5,187,966 |
TOTAL AUSTRALIA | | | 27,047,614 |
| Bailiwick of Jersey - 0.5% | | | |
| JTC PLC (a) | | 495,000 | 6,561,495 |
| Belgium - 2.0% | | | |
| Azelis Group NV | | 420,600 | 8,340,364 |
| KBC Ancora | | 334,289 | 16,872,101 |
TOTAL BELGIUM | | | 25,212,465 |
| Canada - 3.6% | | | |
| CAE, Inc. (b) | | 255,600 | 4,497,576 |
| McCoy Global, Inc. | | 457,215 | 1,195,290 |
| Osisko Gold Royalties Ltd. | | 662,100 | 13,324,266 |
| Pason Systems, Inc. (c) | | 937,900 | 9,073,518 |
| Richelieu Hardware Ltd. (c) | | 672,063 | 17,709,621 |
TOTAL CANADA | | | 45,800,271 |
| China - 0.3% | | | |
| Chlitina Holding Ltd. | | 948,842 | 4,174,931 |
| Denmark - 0.7% | | | |
| Spar Nord Bank A/S | | 476,520 | 9,172,198 |
| Egypt - 0.2% | | | |
| Integrated Diagnostics Holdings PLC (a)(b) | | 5,696,716 | 2,836,965 |
| France - 2.5% | | | |
| Laurent-Perrier Group SA | | 39,132 | 4,277,866 |
| Lectra | | 434,742 | 12,058,711 |
| LISI | | 198,010 | 4,803,094 |
| Vetoquinol SA | | 121,442 | 10,554,673 |
TOTAL FRANCE | | | 31,694,344 |
| Germany - 7.8% | | | |
| CTS Eventim AG | | 493,054 | 51,728,015 |
| Nexus AG | | 245,558 | 12,861,140 |
| Rheinmetall AG | | 33,500 | 17,243,231 |
| Scout24 AG (a) | | 150,700 | 12,974,579 |
| Stabilus Se | | 102,336 | 4,046,336 |
TOTAL GERMANY | | | 98,853,301 |
| Greece - 0.3% | | | |
| Athens International Airport SA | | 388,700 | 3,319,046 |
| Ireland - 1.9% | | | |
| AerCap Holdings NV | | 151,200 | 14,144,760 |
| Cairn Homes PLC | | 2,385,691 | 5,524,908 |
| Irish Residential Properties REIT PLC | | 4,979,557 | 4,712,366 |
TOTAL IRELAND | | | 24,382,034 |
| Israel - 1.3% | | | |
| Ituran Location & Control Ltd. | | 362,877 | 9,699,702 |
| Tel Aviv Stock Exchange Ltd. | | 674,096 | 6,776,240 |
TOTAL ISRAEL | | | 16,475,942 |
| Italy - 2.4% | | | |
| Interpump Group SpA | | 674,905 | 29,981,784 |
| Japan - 25.1% | | | |
| Ai Holdings Corp. | | 172,500 | 2,628,654 |
| Artnature, Inc. | | 531,000 | 2,890,320 |
| Aucnet, Inc. (c) | | 281,977 | 4,401,051 |
| Azbil Corp. | | 5,172,368 | 40,220,141 |
| Broadleaf Co. Ltd. | | 2,072,198 | 7,667,780 |
| Central Automotive Products Ltd. | | 156,500 | 4,713,581 |
| Curves Holdings Co. Ltd. | | 2,377,078 | 12,581,664 |
| Daiichikosho Co. Ltd. | | 408,100 | 5,099,482 |
| Daikokutenbussan Co. Ltd. | | 74,100 | 5,134,222 |
| Digital Hearts Holdings Co. Ltd. | | 465,714 | 2,483,095 |
| Fujitec Co. Ltd. (c) | | 397,300 | 14,295,720 |
| Funai Soken Holdings, Inc. | | 196,950 | 3,134,806 |
| Gift Holdings, Inc. (c) | | 240,000 | 5,058,502 |
| Goldcrest Co. Ltd. | | 610,730 | 11,903,517 |
| Iwatsuka Confectionary Co. Ltd. | | 37,800 | 643,053 |
| Kansai Paint Co. Ltd. | | 289,100 | 4,708,470 |
| Koshidaka Holdings Co. Ltd. (c) | | 1,940,216 | 15,219,328 |
| Kusuri No Aoki Holdings Co. Ltd. | | 283,500 | 5,900,405 |
| Medikit Co. Ltd. | | 281,800 | 5,180,055 |
| Miroku Jyoho Service Co., Ltd. | | 261,700 | 3,116,905 |
| Misumi Group, Inc. | | 295,868 | 4,815,417 |
| Mitsuboshi Belting Ltd. | | 117,580 | 3,018,345 |
| Nagaileben Co. Ltd. | | 720,427 | 10,809,186 |
| Nihon Parkerizing Co. Ltd. | | 1,643,878 | 13,855,800 |
| NS Tool Co. Ltd. | | 598,900 | 2,892,854 |
| NSD Co. Ltd. | | 648,849 | 14,013,838 |
| OBIC Co. Ltd. | | 277,000 | 9,051,648 |
| OSG Corp. | | 519,800 | 6,135,213 |
| Paramount Bed Holdings Co. Ltd. | | 238,520 | 4,121,897 |
| ProNexus, Inc. (c) | | 476,400 | 4,043,564 |
| San-Ai Obbli Co. Ltd. | | 515,400 | 6,292,486 |
| SHO-BOND Holdings Co. Ltd. | | 484,400 | 17,040,488 |
| Shoei Co. Ltd. (c) | | 221,604 | 3,400,710 |
| SK Kaken Co. Ltd. | | 200,400 | 11,640,518 |
| Software Service, Inc. | | 66,400 | 5,518,408 |
| Techno Medica Co. Ltd. | | 80,791 | 956,359 |
| The Monogatari Corp. (c) | | 413,700 | 9,729,427 |
| TIS, Inc. | | 284,700 | 7,099,412 |
| Tocalo Co. Ltd. | | 608,636 | 7,079,967 |
| USS Co. Ltd. | | 971,680 | 8,137,599 |
| WingArc1st, Inc. | | 87,000 | 1,853,336 |
| YAKUODO Holdings Co. Ltd. | | 411,500 | 5,723,258 |
| YONEX Co. Ltd. | | 371,000 | 4,642,367 |
TOTAL JAPAN | | | 318,852,848 |
| Korea (South) - 0.4% | | | |
| BGF Retail Co. Ltd. | | 68,256 | 5,729,698 |
| Netherlands - 4.9% | | | |
| Aalberts Industries NV | | 762,980 | 27,520,528 |
| BE Semiconductor Industries NV | | 150,530 | 16,036,598 |
| IMCD NV | | 121,988 | 19,379,732 |
TOTAL NETHERLANDS | | | 62,936,858 |
| Norway - 2.0% | | | |
| Kongsberg Gruppen ASA | | 215,981 | 22,481,250 |
| Medistim ASA | | 185,242 | 2,694,380 |
TOTAL NORWAY | | | 25,175,630 |
| Philippines - 0.4% | | | |
| International Container Terminal Services, Inc. | | 695,000 | 4,704,107 |
| Spain - 0.3% | | | |
| Fluidra SA | | 154,201 | 4,146,338 |
| Sweden - 14.6% | | | |
| Addlife AB B Shares | | 437,218 | 5,556,248 |
| AddTech AB (B Shares) | | 1,848,275 | 51,243,876 |
| Autoliv, Inc. | | 183,000 | 16,997,040 |
| Bergman & Beving AB (B Shares) | | 417,154 | 11,726,222 |
| Hemnet Group AB | | 600,600 | 18,850,223 |
| INVISIO AB | | 383,163 | 9,637,918 |
| John Mattson Fastighetsforetagen AB (b) | | 942,052 | 5,817,892 |
| Lagercrantz Group AB (B Shares) | | 3,355,212 | 65,438,055 |
TOTAL SWEDEN | | | 185,267,474 |
| Switzerland - 0.5% | | | |
| Tecan Group AG | | 23,050 | 5,818,887 |
| Taiwan - 1.4% | | | |
| Addcn Technology Co. Ltd. | | 1,563,028 | 9,056,793 |
| eMemory Technology, Inc. | | 88,000 | 8,584,534 |
TOTAL TAIWAN | | | 17,641,327 |
| United Kingdom - 14.3% | | | |
| Baltic Classifieds Group PLC | | 3,124,002 | 12,709,111 |
| Bodycote PLC | | 2,399,726 | 17,142,570 |
| Clarkson PLC | | 183,153 | 8,301,257 |
| Diploma PLC | | 165,000 | 9,059,289 |
| DP Poland PLC (b) | | 18,541,591 | 2,629,930 |
| Games Workshop Group PLC | | 98,200 | 15,144,229 |
| Howden Joinery Group PLC | | 2,379,700 | 25,836,805 |
| InterContinental Hotel Group PLC ADR | | 204,000 | 22,735,800 |
| Oxford Instruments PLC | | 318,100 | 8,818,742 |
| Rightmove PLC | | 948,693 | 7,202,744 |
| Sage Group PLC | | 683,700 | 8,546,201 |
| Spectris PLC | | 1,035,478 | 33,593,559 |
| Spirax-Sarco Engineering PLC | | 25,691 | 2,138,365 |
| Unite Group PLC | | 722,900 | 8,160,915 |
TOTAL UNITED KINGDOM | | | 182,019,517 |
| United States of America - 3.3% | | | |
| Morningstar, Inc. | | 105,821 | 34,714,579 |
| PriceSmart, Inc. | | 94,060 | 7,814,505 |
TOTAL UNITED STATES OF AMERICA | | | 42,529,084 |
| TOTAL COMMON STOCKS (Cost $858,295,009) | | | 1,180,334,158 |
| | | | |
| Investment Companies - 4.8% |
| | | Shares | Value ($) |
| United States of America - 4.8% | | | |
iShares MSCI EAFE Small-Cap ETF (c) (Cost $60,617,672) | | 965,000 | 61,238,900 |
| | | | |
| Money Market Funds - 4.2% |
| | | Shares | Value ($) |
| Fidelity Cash Central Fund 4.87% (d) | | 34,768,012 | 34,774,965 |
| Fidelity Securities Lending Cash Central Fund 4.87% (d)(e) | | 18,100,290 | 18,102,100 |
| TOTAL MONEY MARKET FUNDS (Cost $52,877,065) | | | 52,877,065 |
| | | | |
| TOTAL INVESTMENT IN SECURITIES - 101.8% (Cost $971,789,746) | 1,294,450,123 |
NET OTHER ASSETS (LIABILITIES) - (1.8)% | (22,918,180) |
| NET ASSETS - 100.0% | 1,271,531,943 |
| | |
Security Type Abbreviations
Legend
| (a) | Security exempt from registration under Rule 144A of the Securities Act of 1933. These securities may be resold in transactions exempt from registration, normally to qualified institutional buyers. At the end of the period, the value of these securities amounted to $22,373,039 or 1.8% of net assets. |
| (c) | Security or a portion of the security is on loan at period end. |
| (d) | Affiliated fund that is generally available only to investment companies and other accounts managed by Fidelity Investments. The rate quoted is the annualized seven-day yield of the fund at period end. A complete unaudited listing of the fund's holdings as of its most recent quarter end is available upon request. In addition, each Fidelity Central Fund's financial statements, which are not covered by the Fund's Report of Independent Registered Public Accounting Firm, are available on the SEC's website or upon request. |
| (e) | Investment made with cash collateral received from securities on loan. |
Affiliated Central Funds
Fiscal year to date information regarding the Fund's investments in Fidelity Central Funds, including the ownership percentage, is presented below.
| Affiliate | Value, beginning of period ($) | Purchases ($) | Sales Proceeds ($) | Dividend Income ($) | Realized Gain (loss) ($) | Change in Unrealized appreciation (depreciation) ($) | Value, end of period ($) | % ownership, end of period |
| Fidelity Cash Central Fund 4.87% | 47,754,532 | 310,989,911 | 323,968,886 | 1,749,258 | (592) | - | 34,774,965 | 0.1% |
| Fidelity Securities Lending Cash Central Fund 4.87% | 4,475,514 | 341,263,027 | 327,636,441 | 85,857 | - | - | 18,102,100 | 0.1% |
| Total | 52,230,046 | 652,252,938 | 651,605,327 | 1,835,115 | (592) | - | 52,877,065 | |
| | | | | | | | | |
Amounts in the dividend income column in the above table include any capital gain distributions from underlying funds, which are presented in the corresponding line item in the Statement of Operations, if applicable.
Amounts in the dividend income column for Fidelity Securities Lending Cash Central Fund represents the income earned on investing cash collateral, less rebates paid to borrowers and any lending agent fees associated with the loan, plus any premium payments received for lending certain types of securities.
Amounts included in the purchases and sales proceeds columns may include in-kind transactions, if applicable.
Investment Valuation
The following is a summary of the inputs used, as of October 31, 2024, involving the Fund's assets and liabilities carried at fair value. The inputs or methodology used for valuing securities may not be an indication of the risk associated with investing in those securities. For more information on valuation inputs, and their aggregation into the levels used below, please refer to the Investment Valuation section in the accompanying Notes to Financial Statements.
| Valuation Inputs at Reporting Date: |
| Description | Total ($) | Level 1 ($) | Level 2 ($) | Level 3 ($) |
Investments in Securities: | | | | |
|
| Equities: | | | | |
Communication Services | 117,620,947 | 103,464,672 | 14,156,275 | - |
Consumer Discretionary | 130,916,136 | 63,031,907 | 67,884,229 | - |
Consumer Staples | 42,288,258 | 12,092,371 | 30,195,887 | - |
Energy | 21,749,260 | 10,268,808 | 11,480,452 | - |
Financials | 84,438,057 | 74,096,613 | 10,341,444 | - |
Health Care | 66,908,198 | 40,322,293 | 26,585,905 | - |
Industrials | 379,860,443 | 312,699,962 | 67,160,481 | - |
Information Technology | 250,910,911 | 154,191,568 | 96,719,343 | - |
Materials | 55,047,258 | 13,324,266 | 41,722,992 | - |
Real Estate | 30,594,690 | 18,691,173 | 11,903,517 | - |
|
| Investment Companies | 61,238,900 | 61,238,900 | - | - |
|
| Money Market Funds | 52,877,065 | 52,877,065 | - | - |
| Total Investments in Securities: | 1,294,450,123 | 916,299,598 | 378,150,525 | - |
Financial Statements
| Statement of Assets and Liabilities |
As of October 31, 2024 |
| Assets | | | | |
| Investment in securities, at value (including securities loaned of $17,742,616) - See accompanying schedule: | | | | |
Unaffiliated issuers (cost $918,912,681) | $ | 1,241,573,058 | | |
Fidelity Central Funds (cost $52,877,065) | | 52,877,065 | | |
| | | | | |
| | | | | |
| Total Investment in Securities (cost $971,789,746) | | | $ | 1,294,450,123 |
| Foreign currency held at value (cost $103,555) | | | | 102,835 |
| Receivable for investments sold | | | | 4,500,831 |
| Receivable for fund shares sold | | | | 1,544,148 |
| Dividends receivable | | | | 3,721,900 |
| Reclaims receivable | | | | 1,482,876 |
| Distributions receivable from Fidelity Central Funds | | | | 148,699 |
| Prepaid expenses | | | | 1,509 |
| Other receivables | | | | 14,542 |
Total assets | | | | 1,305,967,463 |
| Liabilities | | | | |
| Payable for investments purchased | $ | 347,730 | | |
| Payable for fund shares redeemed | | 14,990,757 | | |
| Accrued management fee | | 889,037 | | |
| Distribution and service plan fees payable | | 13,017 | | |
| Other payables and accrued expenses | | 89,269 | | |
| Collateral on securities loaned | | 18,105,710 | | |
| Total liabilities | | | | 34,435,520 |
| Net Assets | | | $ | 1,271,531,943 |
| Net Assets consist of: | | | | |
| Paid in capital | | | $ | 882,317,399 |
| Total accumulated earnings (loss) | | | | 389,214,544 |
| Net Assets | | | $ | 1,271,531,943 |
| | | | | |
| Net Asset Value and Maximum Offering Price | | | | |
| Class A : | | | | |
Net Asset Value and redemption price per share ($32,876,415 ÷ 1,615,055 shares)(a) | | | $ | 20.36 |
| Maximum offering price per share (100/94.25 of $20.36) | | | $ | 21.60 |
| Class M : | | | | |
Net Asset Value and redemption price per share ($9,932,787 ÷ 497,244 shares)(a) | | | $ | 19.98 |
| Maximum offering price per share (100/96.50 of $19.98) | | | $ | 20.70 |
| Class C : | | | | |
Net Asset Value and offering price per share ($2,034,822 ÷ 107,395 shares)(a) | | | $ | 18.95 |
| International Small Cap Opportunities : | | | | |
Net Asset Value, offering price and redemption price per share ($636,948,097 ÷ 30,605,629 shares) | | | $ | 20.81 |
| Class I : | | | | |
Net Asset Value, offering price and redemption price per share ($221,653,889 ÷ 10,674,080 shares) | | | $ | 20.77 |
| Class Z : | | | | |
Net Asset Value, offering price and redemption price per share ($368,085,933 ÷ 17,743,717 shares) | | | $ | 20.74 |
(a)Redemption price per share is equal to net asset value less any applicable contingent deferred sales charge. |
| Statement of Operations |
| Year ended October 31, 2024 |
| Investment Income | | | | |
| Dividends | | | $ | 25,441,681 |
| Income from Fidelity Central Funds (including $85,857 from security lending) | | | | 1,835,115 |
| Income before foreign taxes withheld | | | $ | 27,276,796 |
| Less foreign taxes withheld | | | | (2,481,112) |
| Total income | | | | 24,795,684 |
| Expenses | | | | |
| Management fee | | | | |
| Basic fee | $ | 10,651,111 | | |
| Performance adjustment | | (27,164) | | |
| Transfer agent fees | | 504,690 | | |
| Distribution and service plan fees | | 153,960 | | |
| Accounting fees | | 164,736 | | |
| Custodian fees and expenses | | 88,997 | | |
| Independent trustees' fees and expenses | | 5,339 | | |
| Registration fees | | 125,981 | | |
| Audit fees | | 149,097 | | |
| Legal | | 1,948 | | |
| Miscellaneous | | 26,057 | | |
| Total expenses before reductions | | 11,844,752 | | |
| Expense reductions | | (55,811) | | |
| Total expenses after reductions | | | | 11,788,941 |
| Net Investment income (loss) | | | | 13,006,743 |
| Realized and Unrealized Gain (Loss) | | | | |
| Net realized gain (loss) on: | | | | |
| Investment Securities: | | | | |
| Unaffiliated issuers (net of foreign taxes of $8,971) | | 66,938,410 | | |
| Fidelity Central Funds | | (592) | | |
| Foreign currency transactions | | (179,202) | | |
| Total net realized gain (loss) | | | | 66,758,616 |
| Change in net unrealized appreciation (depreciation) on: | | | | |
| Investment Securities: | | | | |
| Unaffiliated issuers (net of increase in deferred foreign taxes of $22,519) | | 179,641,857 | | |
| Assets and liabilities in foreign currencies | | (77,240) | | |
| Total change in net unrealized appreciation (depreciation) | | | | 179,564,617 |
| Net gain (loss) | | | | 246,323,233 |
| Net increase (decrease) in net assets resulting from operations | | | $ | 259,329,976 |
| Statement of Changes in Net Assets |
| |
| | Year ended October 31, 2024 | | Year ended October 31, 2023 |
| Increase (Decrease) in Net Assets | | | | |
| Operations | | | | |
| Net investment income (loss) | $ | 13,006,743 | $ | 9,421,923 |
| Net realized gain (loss) | | 66,758,616 | | 34,601,449 |
| Change in net unrealized appreciation (depreciation) | | 179,564,617 | | 6,132,385 |
| Net increase (decrease) in net assets resulting from operations | | 259,329,976 | | 50,155,757 |
| Distributions to shareholders | | (42,624,195) | | (64,708,392) |
| | | | | |
| Share transactions - net increase (decrease) | | 79,946,440 | | (52,713,432) |
| Total increase (decrease) in net assets | | 296,652,221 | | (67,266,067) |
| | | | | |
| Net Assets | | | | |
| Beginning of period | | 974,879,722 | | 1,042,145,789 |
| End of period | $ | 1,271,531,943 | $ | 974,879,722 |
| | | | | |
| | | | | |
Financial Highlights
Fidelity Advisor® International Small Cap Opportunities Fund Class A |
| |
| Years ended October 31, | | 2024 | | 2023 | | 2022 | | 2021 | | 2020 |
Selected Per-Share Data | | | | | | | | | | |
| Net asset value, beginning of period | $ | 16.75 | $ | 17.17 | $ | 28.35 | $ | 20.86 | $ | 19.02 |
| Income from Investment Operations | | | | | | | | | | |
Net investment income (loss) A,B | | .15 | | .10 | | .06 | | (.06) | | (.04) |
| Net realized and unrealized gain (loss) | | 4.14 | | .61 | | (8.93) | | 7.55 | | 2.05 |
| Total from investment operations | | 4.29 | | .71 | | (8.87) | | 7.49 | | 2.01 |
| Distributions from net investment income | | (.12) | | - | | - | | - | | (.11) |
| Distributions from net realized gain | | (.56) | | (1.13) | | (2.31) | | - | | (.05) |
| Total distributions | | (.68) | | (1.13) | | (2.31) | | - | | (.17) C |
| Net asset value, end of period | $ | 20.36 | $ | 16.75 | $ | 17.17 | $ | 28.35 | $ | 20.86 |
Total Return D,E | | | | 3.74% | | (33.79)% | | 35.91% | | 10.58% |
Ratios to Average Net Assets B,F,G | | | | | | | | | | |
| Expenses before reductions | | 1.27% | | 1.31% | | 1.49% | | 1.50% | | 1.57% |
| Expenses net of fee waivers, if any | | | | 1.31% | | 1.48% | | 1.50% | | 1.57% |
| Expenses net of all reductions | | 1.26% | | 1.31% | | 1.48% | | 1.50% | | 1.56% |
| Net investment income (loss) | | .77% | | .56% | | .30% | | (.25)% | | (.20)% |
| Supplemental Data | | | | | | | | | | |
| Net assets, end of period (000 omitted) | $ | 32,876 | $ | 26,559 | $ | 26,380 | $ | 45,981 | $ | 37,771 |
Portfolio turnover rate H | | | | 10% | | 13% | | 21% | | 20% |
ACalculated based on average shares outstanding during the period.
BNet investment income (loss) is affected by the timing of the declaration of dividends by any underlying mutual funds or exchange-traded funds (ETFs). Net investment income (loss) of any mutual funds or ETFs is not included in the Fund's net investment income (loss) ratio.
CTotal distributions per share do not sum due to rounding.
DTotal returns would have been lower if certain expenses had not been reduced during the applicable periods shown.
ETotal returns do not include the effect of the sales charges.
FFees and expenses of any underlying mutual funds or exchange-traded funds (ETFs) are not included in the Fund's expense ratio. The Fund indirectly bears its proportionate share of these expenses. For additional expense information related to investments in Fidelity Central Funds, please refer to the "Investments in Fidelity Central Funds" note found in the Notes to Financial Statements section of the most recent Annual or Semi-Annual report.
GExpense ratios reflect operating expenses of the class. Expenses before reductions do not reflect amounts reimbursed, waived, or reduced through arrangements with the investment adviser, brokerage services, or other offset arrangements, if applicable, and do not represent the amount paid by the class during periods when reimbursements, waivers or reductions occur.
HAmount does not include the portfolio activity of any underlying mutual funds or exchange-traded funds (ETFs).
Fidelity Advisor® International Small Cap Opportunities Fund Class M |
| |
| Years ended October 31, | | 2024 | | 2023 | | 2022 | | 2021 | | 2020 |
Selected Per-Share Data | | | | | | | | | | |
| Net asset value, beginning of period | $ | 16.43 | $ | 16.91 | $ | 28.02 | $ | 20.67 | $ | 18.85 |
| Income from Investment Operations | | | | | | | | | | |
Net investment income (loss) A,B | | .10 | | .06 | | .01 | | (.13) | | (.09) |
| Net realized and unrealized gain (loss) | | 4.07 | | .59 | | (8.81) | | 7.48 | | 2.03 |
| Total from investment operations | | 4.17 | | .65 | | (8.80) | | 7.35 | | 1.94 |
| Distributions from net investment income | | (.06) | | - | | - | | - | | (.06) |
| Distributions from net realized gain | | (.56) | | (1.13) | | (2.31) | | - | | (.05) |
| Total distributions | | (.62) | | (1.13) | | (2.31) | | - | | (.12) C |
| Net asset value, end of period | $ | 19.98 | $ | 16.43 | $ | 16.91 | $ | 28.02 | $ | 20.67 |
Total Return D,E | | | | 3.43% | | (33.95)% | | 35.56% | | 10.29% |
Ratios to Average Net Assets B,F,G | | | | | | | | | | |
| Expenses before reductions | | 1.53% | | 1.57% | | 1.74% | | 1.75% | | 1.84% |
| Expenses net of fee waivers, if any | | | | 1.56% | | 1.74% | | 1.75% | | 1.84% |
| Expenses net of all reductions | | 1.52% | | 1.56% | | 1.74% | | 1.75% | | 1.83% |
| Net investment income (loss) | | .51% | | .31% | | .05% | | (.50)% | | (.47)% |
| Supplemental Data | | | | | | | | | | |
| Net assets, end of period (000 omitted) | $ | 9,933 | $ | 9,589 | $ | 10,115 | $ | 16,378 | $ | 13,141 |
Portfolio turnover rate H | | | | 10% | | 13% | | 21% | | 20% |
ACalculated based on average shares outstanding during the period.
BNet investment income (loss) is affected by the timing of the declaration of dividends by any underlying mutual funds or exchange-traded funds (ETFs). Net investment income (loss) of any mutual funds or ETFs is not included in the Fund's net investment income (loss) ratio.
CTotal distributions per share do not sum due to rounding.
DTotal returns would have been lower if certain expenses had not been reduced during the applicable periods shown.
ETotal returns do not include the effect of the sales charges.
FFees and expenses of any underlying mutual funds or exchange-traded funds (ETFs) are not included in the Fund's expense ratio. The Fund indirectly bears its proportionate share of these expenses. For additional expense information related to investments in Fidelity Central Funds, please refer to the "Investments in Fidelity Central Funds" note found in the Notes to Financial Statements section of the most recent Annual or Semi-Annual report.
GExpense ratios reflect operating expenses of the class. Expenses before reductions do not reflect amounts reimbursed, waived, or reduced through arrangements with the investment adviser, brokerage services, or other offset arrangements, if applicable, and do not represent the amount paid by the class during periods when reimbursements, waivers or reductions occur.
HAmount does not include the portfolio activity of any underlying mutual funds or exchange-traded funds (ETFs).
Fidelity Advisor® International Small Cap Opportunities Fund Class C |
| |
| Years ended October 31, | | 2024 | | 2023 | | 2022 | | 2021 | | 2020 |
Selected Per-Share Data | | | | | | | | | | |
| Net asset value, beginning of period | $ | 15.64 | $ | 16.22 | $ | 27.10 | $ | 20.09 | $ | 18.31 |
| Income from Investment Operations | | | | | | | | | | |
Net investment income (loss) A,B | | - C | | (.04) | | (.09) | | (.25) | | (.18) |
| Net realized and unrealized gain (loss) | | 3.87 | | .59 | | (8.48) | | 7.26 | | 1.96 |
| Total from investment operations | | 3.87 | | .55 | | (8.57) | | 7.01 | | 1.78 |
| Distributions from net realized gain | | (.56) | | (1.13) | | (2.31) | | - | | - |
| Total distributions | | (.56) | | (1.13) | | (2.31) | | - | | - |
| Net asset value, end of period | $ | 18.95 | $ | 15.64 | $ | 16.22 | $ | 27.10 | $ | 20.09 |
Total Return D,E | | | | 2.93% | | (34.28)% | | 34.89% | | 9.72% |
Ratios to Average Net Assets B,F,G | | | | | | | | | | |
| Expenses before reductions | | 2.02% | | 2.10% | | 2.26% | | 2.26% | | 2.33% |
| Expenses net of fee waivers, if any | | | | 2.10% | | 2.25% | | 2.26% | | 2.33% |
| Expenses net of all reductions | | 2.02% | | 2.10% | | 2.25% | | 2.26% | | 2.33% |
| Net investment income (loss) | | .01% | | (.23)% | | (.47)% | | (1.01)% | | (.96)% |
| Supplemental Data | | | | | | | | | | |
| Net assets, end of period (000 omitted) | $ | 2,035 | $ | 2,036 | $ | 3,314 | $ | 6,770 | $ | 7,253 |
Portfolio turnover rate H | | | | 10% | | 13% | | 21% | | 20% |
ACalculated based on average shares outstanding during the period.
BNet investment income (loss) is affected by the timing of the declaration of dividends by any underlying mutual funds or exchange-traded funds (ETFs). Net investment income (loss) of any mutual funds or ETFs is not included in the Fund's net investment income (loss) ratio.
CAmount represents less than $.005 per share.
DTotal returns would have been lower if certain expenses had not been reduced during the applicable periods shown.
ETotal returns do not include the effect of the contingent deferred sales charge.
FFees and expenses of any underlying mutual funds or exchange-traded funds (ETFs) are not included in the Fund's expense ratio. The Fund indirectly bears its proportionate share of these expenses. For additional expense information related to investments in Fidelity Central Funds, please refer to the "Investments in Fidelity Central Funds" note found in the Notes to Financial Statements section of the most recent Annual or Semi-Annual report.
GExpense ratios reflect operating expenses of the class. Expenses before reductions do not reflect amounts reimbursed, waived, or reduced through arrangements with the investment adviser, brokerage services, or other offset arrangements, if applicable, and do not represent the amount paid by the class during periods when reimbursements, waivers or reductions occur.
HAmount does not include the portfolio activity of any underlying mutual funds or exchange-traded funds (ETFs).
Fidelity® International Small Cap Opportunities Fund |
| |
| Years ended October 31, | | 2024 | | 2023 | | 2022 | | 2021 | | 2020 |
Selected Per-Share Data | | | | | | | | | | |
| Net asset value, beginning of period | $ | 17.12 | $ | 17.47 | $ | 28.77 | $ | 21.10 | $ | 19.24 |
| Income from Investment Operations | | | | | | | | | | |
Net investment income (loss) A,B | | .21 | | .16 | | .13 | | .01 | | .02 |
| Net realized and unrealized gain (loss) | | 4.23 | | .63 | | (9.09) | | 7.66 | | 2.07 |
| Total from investment operations | | 4.44 | | .79 | | (8.96) | | 7.67 | | 2.09 |
| Distributions from net investment income | | (.19) | | - C | | (.04) | | - | | (.17) |
| Distributions from net realized gain | | (.56) | | (1.13) | | (2.31) | | - | | (.05) |
| Total distributions | | (.75) | | (1.14) D | | (2.34) D | | - | | (.23) D |
| Net asset value, end of period | $ | 20.81 | $ | 17.12 | $ | 17.47 | $ | 28.77 | $ | 21.10 |
Total Return E | | | | 4.11% | | (33.62)% | | 36.35% | | 10.90% |
Ratios to Average Net Assets A,F,G | | | | | | | | | | |
| Expenses before reductions | | .98% | | 1.01% | | 1.19% | | 1.21% | | 1.26% |
| Expenses net of fee waivers, if any | | | | 1.00% | | 1.19% | | 1.20% | | 1.26% |
| Expenses net of all reductions | | .98% | | 1.00% | | 1.19% | | 1.20% | | 1.25% |
| Net investment income (loss) | | 1.05% | | .87% | | .60% | | .05% | | .11% |
| Supplemental Data | | | | | | | | | | |
| Net assets, end of period (000 omitted) | $ | 636,948 | $ | 632,320 | $ | 700,271 | $ | 1,268,421 | $ | 1,152,472 |
Portfolio turnover rate H | | | | 10% | | 13% | | 21% | | 20% |
ANet investment income (loss) is affected by the timing of the declaration of dividends by any underlying mutual funds or exchange-traded funds (ETFs). Net investment income (loss) of any mutual funds or ETFs is not included in the Fund's net investment income (loss) ratio.
BCalculated based on average shares outstanding during the period.
CAmount represents less than $.005 per share.
DTotal distributions per share do not sum due to rounding.
ETotal returns would have been lower if certain expenses had not been reduced during the applicable periods shown.
FFees and expenses of any underlying mutual funds or exchange-traded funds (ETFs) are not included in the Fund's expense ratio. The Fund indirectly bears its proportionate share of these expenses. For additional expense information related to investments in Fidelity Central Funds, please refer to the "Investments in Fidelity Central Funds" note found in the Notes to Financial Statements section of the most recent Annual or Semi-Annual report.
GExpense ratios reflect operating expenses of the class. Expenses before reductions do not reflect amounts reimbursed, waived, or reduced through arrangements with the investment adviser, brokerage services, or other offset arrangements, if applicable, and do not represent the amount paid by the class during periods when reimbursements, waivers or reductions occur.
HAmount does not include the portfolio activity of any underlying mutual funds or exchange-traded funds (ETFs).
Fidelity Advisor® International Small Cap Opportunities Fund Class I |
| |
| Years ended October 31, | | 2024 | | 2023 | | 2022 | | 2021 | | 2020 |
Selected Per-Share Data | | | | | | | | | | |
| Net asset value, beginning of period | $ | 17.09 | $ | 17.46 | $ | 28.75 | $ | 21.09 | $ | 19.22 |
| Income from Investment Operations | | | | | | | | | | |
Net investment income (loss) A,B | | .21 | | .15 | | .13 | | .01 | | .02 |
| Net realized and unrealized gain (loss) | | 4.21 | | .62 | | (9.07) | | 7.65 | | 2.07 |
| Total from investment operations | | 4.42 | | .77 | | (8.94) | | 7.66 | | 2.09 |
| Distributions from net investment income | | (.18) | | (.01) | | (.04) | | - | | (.16) |
| Distributions from net realized gain | | (.56) | | (1.13) | | (2.31) | | - | | (.05) |
| Total distributions | | (.74) | | (1.14) | | (2.35) | | - | | (.22) C |
| Net asset value, end of period | $ | 20.77 | $ | 17.09 | $ | 17.46 | $ | 28.75 | $ | 21.09 |
Total Return D | | | | 4.02% | | (33.60)% | | 36.32% | | 10.90% |
Ratios to Average Net Assets B,E,F | | | | | | | | | | |
| Expenses before reductions | | .99% | | 1.05% | | 1.20% | | 1.22% | | 1.28% |
| Expenses net of fee waivers, if any | | | | 1.04% | | 1.19% | | 1.22% | | 1.27% |
| Expenses net of all reductions | | .98% | | 1.04% | | 1.19% | | 1.22% | | 1.27% |
| Net investment income (loss) | | 1.05% | | .83% | | .59% | | .04% | | .09% |
| Supplemental Data | | | | | | | | | | |
| Net assets, end of period (000 omitted) | $ | 221,654 | $ | 81,122 | $ | 82,705 | $ | 141,310 | $ | 113,041 |
Portfolio turnover rate G | | | | 10% | | 13% | | 21% | | 20% |
ACalculated based on average shares outstanding during the period.
BNet investment income (loss) is affected by the timing of the declaration of dividends by any underlying mutual funds or exchange-traded funds (ETFs). Net investment income (loss) of any mutual funds or ETFs is not included in the Fund's net investment income (loss) ratio.
CTotal distributions per share do not sum due to rounding.
DTotal returns would have been lower if certain expenses had not been reduced during the applicable periods shown.
EFees and expenses of any underlying mutual funds or exchange-traded funds (ETFs) are not included in the Fund's expense ratio. The Fund indirectly bears its proportionate share of these expenses. For additional expense information related to investments in Fidelity Central Funds, please refer to the "Investments in Fidelity Central Funds" note found in the Notes to Financial Statements section of the most recent Annual or Semi-Annual report.
FExpense ratios reflect operating expenses of the class. Expenses before reductions do not reflect amounts reimbursed, waived, or reduced through arrangements with the investment adviser, brokerage services, or other offset arrangements, if applicable, and do not represent the amount paid by the class during periods when reimbursements, waivers or reductions occur.
GAmount does not include the portfolio activity of any underlying mutual funds or exchange-traded funds (ETFs).
Fidelity Advisor® International Small Cap Opportunities Fund Class Z |
| |
| Years ended October 31, | | 2024 | | 2023 | | 2022 | | 2021 | | 2020 |
Selected Per-Share Data | | | | | | | | | | |
| Net asset value, beginning of period | $ | 17.07 | $ | 17.44 | $ | 28.73 | $ | 21.05 | $ | 19.20 |
| Income from Investment Operations | | | | | | | | | | |
Net investment income (loss) A,B | | .23 | | .18 | | .15 | | .04 | | .05 |
| Net realized and unrealized gain (loss) | | 4.21 | | .62 | | (9.05) | | 7.64 | | 2.05 |
| Total from investment operations | | 4.44 | | .80 | | (8.90) | | 7.68 | | 2.10 |
| Distributions from net investment income | | (.21) | | (.04) | | (.08) | | - | | (.20) |
| Distributions from net realized gain | | (.56) | | (1.13) | | (2.31) | | - | | (.05) |
| Total distributions | | (.77) | | (1.17) | | (2.39) | | - | | (.25) |
| Net asset value, end of period | $ | 20.74 | $ | 17.07 | $ | 17.44 | $ | 28.73 | $ | 21.05 |
Total Return C | | | | 4.19% | | (33.52)% | | 36.48% | | 11.03% |
Ratios to Average Net Assets B,D,E | | | | | | | | | | |
| Expenses before reductions | | .87% | | .89% | | 1.07% | | 1.09% | | 1.14% |
| Expenses net of fee waivers, if any | | | | .88% | | 1.07% | | 1.09% | | 1.13% |
| Expenses net of all reductions | | .87% | | .88% | | 1.07% | | 1.09% | | 1.13% |
| Net investment income (loss) | | 1.16% | | .98% | | .72% | | .16% | | .23% |
| Supplemental Data | | | | | | | | | | |
| Net assets, end of period (000 omitted) | $ | 368,086 | $ | 223,254 | $ | 219,360 | $ | 309,803 | $ | 82,476 |
Portfolio turnover rate F | | | | 10% | | 13% | | 21% | | 20% |
ACalculated based on average shares outstanding during the period.
BNet investment income (loss) is affected by the timing of the declaration of dividends by any underlying mutual funds or exchange-traded funds (ETFs). Net investment income (loss) of any mutual funds or ETFs is not included in the Fund's net investment income (loss) ratio.
CTotal returns would have been lower if certain expenses had not been reduced during the applicable periods shown.
DFees and expenses of any underlying mutual funds or exchange-traded funds (ETFs) are not included in the Fund's expense ratio. The Fund indirectly bears its proportionate share of these expenses. For additional expense information related to investments in Fidelity Central Funds, please refer to the "Investments in Fidelity Central Funds" note found in the Notes to Financial Statements section of the most recent Annual or Semi-Annual report.
EExpense ratios reflect operating expenses of the class. Expenses before reductions do not reflect amounts reimbursed, waived, or reduced through arrangements with the investment adviser, brokerage services, or other offset arrangements, if applicable, and do not represent the amount paid by the class during periods when reimbursements, waivers or reductions occur.
FAmount does not include the portfolio activity of any underlying mutual funds or exchange-traded funds (ETFs).
Notes to Financial Statements
For the period ended October 31, 2024
1. Organization.
Fidelity International Small Cap Opportunities Fund (the Fund) is a fund of Fidelity Investment Trust (the Trust) and is authorized to issue an unlimited number of shares. The Trust is registered under the Investment Company Act of 1940, as amended (the 1940 Act), as an open-end management investment company organized as a Massachusetts business trust. The Fund offers Class A, Class M, Class C, International Small Cap Opportunities, Class I and Class Z shares, each of which has equal rights as to assets and voting privileges. Class A, Class M, Class C, Class I and Class Z are Fidelity Advisor classes. Each class has exclusive voting rights with respect to matters that affect that class. Class C shares will automatically convert to Class A shares after a holding period of eight years from the initial date of purchase, with certain exceptions.
2. Investments in Fidelity Central Funds.
Funds may invest in Fidelity Central Funds, which are open-end investment companies generally available only to other investment companies and accounts managed by the investment adviser and its affiliates. The Schedule of Investments lists any Fidelity Central Funds held as an investment as of period end, but does not include the underlying holdings of each Fidelity Central Fund. An investing fund indirectly bears its proportionate share of the expenses of the underlying Fidelity Central Funds.
Based on its investment objective, each Fidelity Central Fund may invest or participate in various investment vehicles or strategies that are similar to those of the investing fund. These strategies are consistent with the investment objectives of the investing fund and may involve certain economic risks which may cause a decline in value of each of the Fidelity Central Funds and thus a decline in the value of the investing fund.
| Fidelity Central Fund | Investment Manager | Investment Objective | Investment Practices | Expense RatioA |
| Fidelity Money Market Central Funds | Fidelity Management & Research Company LLC (FMR) | Each fund seeks to obtain a high level of current income consistent with the preservation of capital and liquidity. | Short-term Investments | Less than .005% |
A Expenses expressed as a percentage of average net assets and are as of each underlying Central Fund's most recent annual or semi-annual shareholder report.
A complete unaudited list of holdings for each Fidelity Central Fund is available upon request or at the Securities and Exchange Commission website at www.sec.gov. In addition, the financial statements of the Fidelity Central Funds which contain the significant accounting policies (including investment valuation policies) of those funds, and are not covered by the Report of Independent Registered Public Accounting Firm, are available on the Securities and Exchange Commission website or upon request.
3. Significant Accounting Policies.
The Fund is an investment company and applies the accounting and reporting guidance of the Financial Accounting Standards Board (FASB) Accounting Standards Codification Topic 946 Financial Services - Investment Companies. The financial statements have been prepared in conformity with accounting principles generally accepted in the United States of America (GAAP), which require management to make certain estimates and assumptions at the date of the financial statements. Actual results could differ from those estimates. Subsequent events, if any, through the date that the financial statements were issued have been evaluated in the preparation of the financial statements. The Fund's Schedule of Investments lists any underlying mutual funds or exchange-traded funds (ETFs) but does not include the underlying holdings of these funds. The following summarizes the significant accounting policies of the Fund:
Investment Valuation. Investments are valued as of 4:00 p.m. Eastern time on the last calendar day of the period. The Board of Trustees (the Board) has designated the Fund's investment adviser as the valuation designee responsible for the fair valuation function and performing fair value determinations as needed. The investment adviser has established a Fair Value Committee (the Committee) to carry out the day-to-day fair valuation responsibilities and has adopted policies and procedures to govern the fair valuation process and the activities of the Committee. In accordance with these fair valuation policies and procedures, which have been approved by the Board, the Fund attempts to obtain prices from one or more third party pricing services or brokers to value its investments. When current market prices, quotations or currency exchange rates are not readily available or reliable, investments will be fair valued in good faith by the Committee, in accordance with the policies and procedures. Factors used in determining fair value vary by investment type and may include market or investment specific events, transaction data, estimated cash flows, and market observations of comparable investments. The frequency that the fair valuation procedures are used cannot be predicted and they may be utilized to a significant extent. The Committee manages the Fund's fair valuation practices and maintains the fair valuation policies and procedures. The Fund's investment adviser reports to the Board information regarding the fair valuation process and related material matters.
The Fund categorizes the inputs to valuation techniques used to value its investments into a disclosure hierarchy consisting of three levels as shown below:
Level 1 - unadjusted quoted prices in active markets for identical investments
Level 2 - other significant observable inputs (including quoted prices for similar investments, interest rates, prepayment speeds, etc.)
Level 3 - unobservable inputs (including the Fund's own assumptions based on the best information available)
Valuation techniques used to value the Fund's investments by major category are as follows:
Equity securities, including restricted securities, for which market quotations are readily available, are valued at the last reported sale price or official closing price as reported by a third party pricing service on the primary market or exchange on which they are traded and are categorized as Level 1 in the hierarchy. In the event there were no sales during the day or closing prices are not available, securities are valued at the last quoted bid price or may be valued using the last available price and are generally categorized as Level 2 in the hierarchy. For foreign equity securities, when market or security specific events arise, comparisons to the valuation of American Depositary Receipts (ADRs), futures contracts, Exchange-Traded Funds (ETFs) and certain indexes as well as quoted prices for similar securities may be used and would be categorized as Level 2 in the hierarchy. For equity securities, including restricted securities, where observable inputs are limited, assumptions about market activity and risk are used and these securities may be categorized as Level 3 in the hierarchy.
Investments in open-end mutual funds ,including the Fidelity Central Funds, are valued at their closing net asset value (NAV) each business day and are categorized as Level 1 in the hierarchy.
Changes in valuation techniques may result in transfers in or out of an assigned level within the disclosure hierarchy. The aggregate value of investments by input level as of October 31, 2024 is included at the end of the Fund's Schedule of Investments.
Foreign Currency. Certain Funds may use foreign currency contracts to facilitate transactions in foreign-denominated securities. Gains and losses from these transactions may arise from changes in the value of the foreign currency or if the counterparties do not perform under the contracts' terms.
Foreign-denominated assets, including investment securities, and liabilities are translated into U.S. dollars at the exchange rates at period end. Purchases and sales of investment securities, income and dividends received, and expenses denominated in foreign currencies are translated into U.S. dollars at the exchange rate in effect on the transaction date.
The effects of exchange rate fluctuations on investments are included with the net realized and unrealized gain (loss) on investment securities. Other foreign currency transactions resulting in realized and unrealized gain (loss) are disclosed separately.
Investment Transactions and Income. For financial reporting purposes, the Fund's investment holdings and NAV include trades executed through the end of the last business day of the period. The NAV per share for processing shareholder transactions is calculated as of the close of business of the New York Stock Exchange (NYSE), normally 4:00 p.m. Eastern time and includes trades executed through the end of the prior business day. Gains and losses on securities sold are determined on the basis of identified cost and include proceeds received from litigation. Commissions paid to certain brokers with whom the investment adviser, or its affiliates, places trades on behalf of a fund include an amount in addition to trade execution, which may be rebated back to a fund. Any such rebates are included in net realized gain (loss) on investments in the Statement of Operations. Dividend income is recorded on the ex-dividend date, except for certain dividends from foreign securities where the ex-dividend date may have passed, which are recorded as soon as the Fund is informed of the ex-dividend date. Non-cash dividends included in dividend income, if any, are recorded at the fair market value of the securities received. Income and capital gain distributions from Fidelity Central Funds, if any, are recorded on the ex-dividend date. Certain distributions received by the Fund represent a return of capital or capital gain. The Fund determines the components of these distributions subsequent to the ex-dividend date, based upon receipt of tax filings or other correspondence relating to the underlying investment. These distributions are recorded as a reduction of cost of investments and/or as a realized gain. Interest income is accrued as earned and includes coupon interest and amortization of premium and accretion of discount on debt securities as applicable. Investment income is recorded net of foreign taxes withheld where recovery of such taxes is uncertain. Funds may file withholding tax reclaims in certain jurisdictions to recover a portion of amounts previously withheld. Any withholding tax reclaims income is included in the Statement of Operations in foreign taxes withheld. Any receivables for withholding tax reclaims are included in the Statement of Assets and Liabilities in reclaims receivable. The Fund has filed tax reclaims for previously withheld taxes on dividends earned in certain European Union (EU) countries. These additional filings are subject to various administrative proceedings by the local jurisdictions' tax authorities within the EU, as well as a number of related judicial proceedings. Income recognized for EU reclaims is included with other reclaims in the Statement of Operations in foreign taxes withheld. These reclaims are recorded when the amount is known and there are no significant uncertainties on collectability.
Class Allocations and Expenses. Investment income, realized and unrealized capital gains and losses, common expenses of a fund, and certain fund-level expense reductions, if any, are allocated daily on a pro-rata basis to each class based on the relative net assets of each class to the total net assets of a fund. Each class differs with respect to transfer agent and distribution and service plan fees incurred, as applicable. Certain expense reductions may also differ by class, if applicable. For the reporting period, the allocated portion of income and expenses to each class as a percent of its average net assets may vary due to the timing of recording these transactions in relation to fluctuating net assets of the classes. Expenses directly attributable to a fund are charged to that fund. Expenses attributable to more than one fund are allocated among the respective funds on the basis of relative net assets or other appropriate methods. Expenses included in the accompanying financial statements reflect the expenses of that fund and do not include any expenses associated with any underlying mutual funds or exchange-traded funds (ETFs). Although not included in a fund's expenses, a fund indirectly bears its proportionate share of these expenses through the net asset value of each underlying mutual fund or exchange-traded fund (ETF). Expense estimates are accrued in the period to which they relate and adjustments are made when actual amounts are known.
Income Tax Information and Distributions to Shareholders. Each year, the Fund intends to qualify as a regulated investment company under Subchapter M of the Internal Revenue Code, including distributing substantially all of its taxable income and realized gains. As a result, no provision for U.S. Federal income taxes is required. As of October 31, 2024, the Fund did not have any unrecognized tax benefits in the financial statements; nor is the Fund aware of any tax positions for which it is reasonably possible that the total amounts of unrecognized tax benefits will significantly change in the next twelve months. The Fund files a U.S. federal tax return, in addition to state and local tax returns as required. The Fund's federal income tax returns are subject to examination by the Internal Revenue Service (IRS) for a period of three fiscal years after they are filed. State and local tax returns may be subject to examination for an additional fiscal year depending on the jurisdiction. Foreign taxes are provided for based on the Fund's understanding of the tax rules and rates that exist in the foreign markets in which it invests. The Fund is subject to a tax imposed on capital gains by certain countries in which it invests.
Distributions are declared and recorded on the ex-dividend date. Income and capital gain distributions are declared separately for each class. Income and capital gain distributions are determined in accordance with income tax regulations, which may differ from GAAP. In addition, the Fund claimed a portion of the payment made to redeeming shareholders as a distribution for income tax purposes.
Capital accounts within the financial statements are adjusted for permanent book-tax differences. These adjustments have no impact on net assets or the results of operations. Capital accounts are not adjusted for temporary book-tax differences which will reverse in a subsequent period.
Book-tax differences are primarily due to foreign currency transactions, certain foreign taxes, passive foreign investment companies (PFIC) and losses deferred due to wash sales.
As of period end, the cost and unrealized appreciation (depreciation) in securities, and derivatives if applicable, for federal income tax purposes were as follows:
| Gross unrealized appreciation | $395,921,695 |
| Gross unrealized depreciation | (82,742,690) |
| Net unrealized appreciation (depreciation) | $313,179,005 |
| Tax Cost | $981,271,118 |
The tax-based components of distributable earnings as of period end were as follows:
| Undistributed ordinary income | $17,472,766 |
| Undistributed long-term capital gain | $58,765,147 |
| Net unrealized appreciation (depreciation) on securities and other investments | $312,976,633 |
| | |
The tax character of distributions paid was as follows:
| | October 31, 2024 | October 31, 2023 |
| Ordinary Income | $10,695,320 | $ 593,300 |
| Long-term Capital Gains | 31,928,875 | 64,115,092 |
| Total | $42,624,195 | $ 64,708,392 |
Restricted Securities (including Private Placements). Funds may invest in securities that are subject to legal or contractual restrictions on resale. These securities generally may be resold in transactions exempt from registration or to the public if the securities are registered. Disposal of these securities may involve time-consuming negotiations and expense, and prompt sale at an acceptable price may be difficult. Information regarding restricted securities held at period end is included at the end of the Schedule of Investments, if applicable.
New Accounting Pronouncement. In November 2023, the FASB issued Accounting Standards Update (ASU) 2023-07 Segment Reporting (Topic 280): Improvements to Reportable Segment Disclosures. Effective for fiscal years beginning after December 15, 2023 and interim periods within fiscal years beginning after December 15, 2024, the amendments enhance required disclosures of segment information for public entities on an annual and interim basis. The ASU allows for early adoption with updates applied retrospectively. Management is currently evaluating the impact of the ASU but does not expect this guidance to materially impact the financial statements.
4. Purchases and Sales of Investments.
Purchases and sales of securities, other than short-term securities and in-kind transactions, as applicable, are noted in the table below.
| | Purchases ($) | Sales ($) |
| Fidelity International Small Cap Opportunities Fund | 392,579,058 | 314,439,664 |
5. Fees and Other Transactions with Affiliates.
Management Fee. Fidelity Management & Research Company LLC (the investment adviser) and its affiliates provide the Fund with investment management related services for which the Fund pays a monthly management fee.
Effective March 1, 2024, the Fund's management contract was amended to incorporate administrative services previously covered under separate services agreements (Transfer Agent and Accounting agreements). The amended contract incorporates a basic fee rate that may vary by class (subject to a performance adjustment). The investment adviser or an affiliate pays certain expenses of managing and operating the Fund out of each class's management fee. Each class of the Fund pays a management fee to the investment adviser. The management fee is calculated and paid to the investment adviser every month. The management fee is determined by calculating a basic fee and then applying a performance adjustment. When determining a class's basic fee, a mandate rate is calculated based on the monthly average net assets of a group of funds advised by FMR within a designated asset class. A discount rate is subtracted from the mandate rate once the Fund's monthly average net assets reach a certain level. The mandate rate and discount rate may vary by class. The annual basic fee rate for a class of shares of the Fund is the lesser of (1) the class's mandate rate reduced by the class's discount rate (if applicable) or (2) the amount set forth in the following table.
| | Maximum Management Fee Rate % |
| Class A | 1.02 |
| Class M | 1.02 |
| Class C | 1.02 |
| International Small Cap Opportunities | .99 |
| Class I | 1.02 |
| Class Z | .88 |
One-twelfth of the basic fee rate for a class is applied to the average net assets of the class for the month, giving a dollar amount which is the basic fee for the class for that month. A different management fee rate may be applicable to each class of the Fund. The difference between classes is the result of separate arrangements for class-level services and/or waivers of certain expenses. It is not the result of any difference in advisory or custodial fees or other expenses related to the management of the Fund's assets, which do not vary by class. For the portion of the reporting period on or after March 1, 2024, the total annualized management fee rates were as follows:
| | Total Management Fee Rate % |
| Class A | .95 |
| Class M | .95 |
| Class C | .95 |
| International Small Cap Opportunities | .91 |
| Class I | .95 |
| Class Z | .82 |
Prior to March 1, 2024, the management fee was the sum of an individual fund fee rate that was based on an annual rate of .60% of the Fund's average net assets and an annualized group fee rate that averaged .22% during the period. The group fee rate was based upon the monthly average net assets of a group of registered investment companies with which the investment adviser has management contracts. The group fee rate decreased as assets under management increased and increased as assets under management decreased. For the portion of the reporting period prior to March 1, 2024, the total annualized management fee rate was .82%.
The performance adjustment rate is calculated monthly by comparing over the performance period the Fund's performance to that of the performance adjustment index listed below.
| | Performance Adjustment Index |
| Fidelity International Small Cap Opportunities Fund | MSCI EAFE Small Cap Index |
For the purposes of calculating the performance adjustment for the Fund, the Fund's investment performance is based on the performance of International Small Cap Opportunities. To the extent that other classes of the Fund have higher expenses, this could result in those classes bearing a larger positive performance adjustment and smaller negative performance adjustment than would be the case if each class's own performance were considered. The performance period is the most recent 36 month period. The maximum annualized performance adjustment rate is ±.20% of the Fund's average net assets over the performance period. The performance adjustment rate is divided by twelve and multiplied by the Fund's average net assets over the performance period, and the resulting dollar amount is proportionately added to or subtracted from a class's basic fee. For the entire reporting period, the total annual performance adjustment was -%A.
A Amount represents less than 0.005%.
Effective March 1, 2024, the Fund's sub-advisory agreements with FMR Investment Management (UK) Limited, Fidelity Management & Research (Hong Kong) Limited, and Fidelity Management & Research (Japan) Limited were amended to provide that the investment adviser pays each sub-adviser monthly fees equal to 110% of the sub-adviser's costs for providing sub-advisory services.
Effective March 1, 2024, the Fund's sub-advisory agreement with FIL Investment Advisors (FIA) was amended to provide that the investment adviser pays FIA monthly fees at an annual rate of 0.44% with respect to the average daily net assets of the Fund managed by FIA. FIA in turn pays FIA(UK).
Distribution and Service Plan Fees. In accordance with Rule 12b-1 of the 1940 Act, the Fund has adopted separate Distribution and Service Plans for each class of shares. Certain classes pay Fidelity Distributors Company LLC (FDC), an affiliate of the investment adviser, separate Distribution and Service Fees, each of which is based on an annual percentage of each class' average net assets. In addition, FDC may pay financial intermediaries for selling shares of the Fund and providing shareholder support services. For the period, the Distribution and Service Fee rates, total fees and amounts retained by FDC were as follows:
| | Distribution Fee | Service Fee | Total Fees ($) | Retained by FDC ($) |
| Class A | - % | .25% | 79,982 | 1,068 |
| Class M | .25% | .25% | 53,426 | - |
| Class C | .75% | .25% | 20,552 | 1,729 |
| | | | 153,960 | 2,797 |
Sales Load. FDC may receive a front-end sales charge of up to 5.75% for selling Class A shares and 3.50% for selling Class M shares, some of which is paid to financial intermediaries for selling shares of the Fund. Depending on the holding period, FDC may receive contingent deferred sales charges levied on Class A, Class M and Class C redemptions. The deferred sales charges are 1.00% for Class C shares, 1.00% for certain purchases of Class A shares and .25% for certain purchases of Class M shares.
For the period, sales charge amounts retained by FDC were as follows:
| | Retained by FDC ($) |
| Class A | 3,237 |
| Class M | 272 |
Class CA | 59 |
| | 3,568 |
A When Class C shares are initially sold, FDC pays commissions from its own resources to financial intermediaries through which the sales are made.
Transfer Agent Fees. Fidelity Investments Institutional Operations Company LLC (FIIOC), an affiliate of the investment adviser, is the transfer, dividend disbursing and shareholder servicing agent for each class of the Fund. Effective March 1, 2024, the Fund's management contract was amended to incorporate transfer agent services and associated fees previously covered under a separate services agreement. FIIOC pays for typesetting, printing and mailing of shareholder reports, except proxy statements.
During the period December 1, 2023 through February 29, 2024, the transfer agent fees for each class were a fixed annual rate of class-level average net assets as follows:
| | % of Class-Level Average Net Assets |
| Class A | .2000 |
| Class M | .2000 |
| Class C | .2000 |
| International Small Cap Opportunities | .1547 |
| Class I | .2000 |
| Class Z | .0420 |
Prior to December 1, 2023, FIIOC received account fees and asset-based fees that varied according to the account size and type of account of the shareholders of the respective classes of the Fund, except for Class Z. FIIOC received an asset-based fee of Class Z's average net assets. For the portion of the reporting period prior to March 1, 2024, the fees were equivalent to the following annualized rates:
| | Amount ($) | % of Class-Level Average Net Assets |
| Class A | 20,656 | .20 |
| Class M | 7,396 | .20 |
| Class C | 1,448 | .20 |
| International Small Cap Opportunities | 371,104 | .15 |
| Class I | 68,301 | .21 |
| Class Z | 35,785 | .04 |
| 504,690 | |
Accounting Fees. Fidelity Service Company, Inc. (FSC), an affiliate of the investment adviser, maintains the Fund's accounting records. Effective March 1, 2024, the Fund's management contract was amended to incorporate accounting services and associated fees previously covered under a separate services agreement.
During the period December 1, 2023 through February 29, 2024, the accounting fees were a fixed annual rate of average net assets as follows:
| | % of Average Net Assets |
| Fidelity International Small Cap Opportunities Fund | 0.0441 |
Prior to December 1, 2023, the accounting fee was based on the level of average net assets for each month. For the portion of the reporting period prior to March 1, 2024, the fees were equivalent to the following annualized rates:
| | % of Average Net Assets |
| Fidelity International Small Cap Opportunities Fund | .04 |
Brokerage Commissions. A portion of portfolio transactions were placed with brokerage firms which are affiliates of the investment adviser. Brokerage commissions are included in net realized gain (loss) and change in net unrealized appreciation (depreciation) in the Statement of Operations. The commissions paid to these affiliated firms were as follows:
| | Amount ($) |
| Fidelity International Small Cap Opportunities Fund | 278 |
Interfund Trades. Funds may purchase from or sell securities to other Fidelity Funds under procedures adopted by the Board. The procedures have been designed to ensure these interfund trades are executed in accordance with Rule 17a-7 of the 1940 Act. Any interfund trades are included within the respective purchases and sales amounts shown in the Purchases and Sales of Investments note. Interfund trades during the period are noted in the table below.
| | Purchases ($) | Sales ($) | Realized Gain (Loss)($) |
| Fidelity International Small Cap Opportunities Fund | 12,965,582 | 4,908,015 | 2,509,323 |
6.Committed Line of Credit.
Certain Funds participate with other funds managed by the investment adviser or an affiliate in a $4.25 billion credit facility (the "line of credit") to be utilized for temporary or emergency purposes to fund shareholder redemptions or for other short-term liquidity purposes. The participating funds have agreed to pay commitment fees on their pro-rata portion of the line of credit, which are reflected in Miscellaneous expenses on the Statement of Operations, and are listed below. During the period, there were no borrowings on this line of credit.
| | Amount ($) |
| Fidelity International Small Cap Opportunities Fund | 1,905 |
7. Security Lending.
Funds lend portfolio securities from time to time in order to earn additional income. Lending agents are used, including National Financial Services (NFS), an affiliate of the investment adviser. Pursuant to a securities lending agreement, NFS will receive a fee, which is capped at 9.9% of a fund's daily lending revenue, for its services as lending agent. A fund may lend securities to certain qualified borrowers, including NFS. On the settlement date of the loan, a fund receives collateral (in the form of U.S. Treasury obligations, letters of credit and/or cash) against the loaned securities and maintains collateral in an amount not less than 100% of the market value of the loaned securities during the period of the loan. The market value of the loaned securities is determined at the close of business of a fund and any additional required collateral is delivered to a fund on the next business day. A fund or borrower may terminate the loan at any time, and if the borrower defaults on its obligation to return the securities loaned because of insolvency or other reasons, a fund may apply collateral received from the borrower against the obligation. A fund may experience delays and costs in recovering the securities loaned. Any cash collateral received is invested in the Fidelity Securities Lending Cash Central Fund. Any loaned securities are identified as such in the Schedule of Investments, and the value of loaned securities and cash collateral at period end, as applicable, are presented in the Statement of Assets and Liabilities. Security lending income represents the income earned on investing cash collateral, less rebates paid to borrowers and any lending agent fees associated with the loan, plus any premium payments received for lending certain types of securities. Security lending income is presented in the Statement of Operations as a component of income from Fidelity Central Funds. Affiliated security lending activity, if any, was as follows:
| | Total Security Lending Fees Paid to NFS ($) | Security Lending Income From Securities Loaned to NFS ($) | Value of Securities Loaned to NFS at Period End ($) |
| Fidelity International Small Cap Opportunities Fund | 9,329 | - | - |
8. Expense Reductions.
Through arrangements with the Fund's custodian, credits realized as a result of certain uninvested cash balances were used to reduce the Fund's expenses. During the period, custodian credits reduced the Fund's expenses by $4,740. During the period, transfer agent credits reduced each class' expenses as noted in the table below.
| | Expense reduction ($) |
| Class M | 39 |
In addition, during the period the investment adviser or an affiliate reimbursed and/or waived a portion of fund-level operating expenses in the amount of $51,032.
9. Distributions to Shareholders.
Distributions to shareholders of each class were as follows:
| | Year ended October 31, 2024 | Year ended October 31, 2023 |
| Fidelity International Small Cap Opportunities Fund | | |
| Distributions to shareholders | | |
| Class A | $1,071,393 | $1,724,252 |
| Class M | 359,747 | 668,890 |
| Class C | 67,234 | 228,866 |
| International Small Cap Opportunities | 27,456,391 | 42,205,549 |
| Class I | 3,627,918 | 5,288,952 |
| Class Z | 10,041,512 | 14,591,883 |
Total | $42,624,195 | $64,708,392 |
Share Transactions.
Share transactions for each class were as follows and may contain in-kind transactions, automatic conversions between classes or exchanges between affiliated funds:
| | Shares | Shares | Dollars | Dollars |
| | Year ended October 31, 2024 | Year ended October 31, 2023 | Year ended October 31, 2024 | Year ended October 31, 2023 |
| Fidelity International Small Cap Opportunities Fund | | | | |
| Class A | | | | |
| Shares sold | 225,403 | 171,839 | $4,421,268 | $3,136,955 |
| Reinvestment of distributions | 57,351 | 94,841 | 1,052,398 | 1,693,860 |
| Shares redeemed | (253,463) | (217,502) | (4,972,403) | (3,984,745) |
| Net increase (decrease) | 29,291 | 49,178 | $501,263 | $846,070 |
| Class M | | | | |
| Shares sold | 13,011 | 21,269 | $253,332 | $383,026 |
| Reinvestment of distributions | 19,865 | 37,879 | 358,562 | 665,150 |
| Shares redeemed | (119,085) | (74,046) | (2,319,634) | (1,330,926) |
| Net increase (decrease) | (86,209) | (14,898) | $(1,707,740) | $(282,750) |
| Class C | | | | |
| Shares sold | 17,556 | 7,494 | $327,256 | $129,355 |
| Reinvestment of distributions | 3,896 | 13,606 | 67,013 | 228,441 |
| Shares redeemed | (44,237) | (95,302) | (801,985) | (1,646,239) |
| Net increase (decrease) | (22,785) | (74,202) | $(407,716) | $(1,288,443) |
| International Small Cap Opportunities | | | | |
| Shares sold | 7,348,249 | 2,233,362 | $150,444,534 | $41,954,989 |
| Reinvestment of distributions | 1,228,945 | 1,900,059 | 22,993,567 | 34,581,075 |
| Shares redeemed | (14,912,938) | (7,265,881) | (304,809,170) | (137,436,859) |
| Net increase (decrease) | (6,335,744) | (3,132,460) | $(131,371,069) | $(60,900,795) |
| Class I | | | | |
| Shares sold | 11,400,627 | 2,306,791 | $231,485,694 | $42,956,688 |
| Reinvestment of distributions | 186,259 | 193,260 | 3,479,316 | 3,513,459 |
| Shares redeemed | (5,660,385) | (2,490,268) | (117,402,312) | (47,134,219) |
| Net increase (decrease) | 5,926,501 | 9,783 | $117,562,698 | $(664,072) |
| Class Z | | | | |
| Shares sold | 6,196,097 | 1,446,980 | $127,736,617 | $27,457,499 |
| Reinvestment of distributions | 493,559 | 741,352 | 9,199,948 | 13,440,712 |
| Shares redeemed | (2,022,168) | (1,687,699) | (41,567,561) | (31,321,653) |
| Net increase (decrease) | 4,667,488 | 500,633 | $95,369,004 | $9,576,558 |
11. Other.
A fund's organizational documents provide former and current trustees and officers with a limited indemnification against liabilities arising in connection with the performance of their duties to the fund. In the normal course of business, a fund may also enter into contracts that provide general indemnifications. A fund's maximum exposure under these arrangements is unknown as this would be dependent on future claims that may be made against a fund. The risk of material loss from such claims is considered remote.
Mutual funds managed by the investment adviser or its affiliates, in aggregate, were the owners of record of more than 20% of the total outstanding shares.
| Fund | % of shares held |
| Fidelity International Small Cap Opportunities Fund | 25% |
12. Risk and Uncertainties.
Many factors affect a fund's performance. Developments that disrupt global economies and financial markets, such as pandemics, epidemics, outbreaks of infectious diseases, war, terrorism, and environmental disasters, may significantly affect a fund's investment performance. The effects of these developments to a fund will be impacted by the types of securities in which a fund invests, the financial condition, industry, economic sector, and geographic location of an issuer, and a fund's level of investment in the securities of that issuer. Significant concentrations in security types, issuers, industries, sectors, and geographic locations may magnify the factors that affect a fund's performance.
Report of Independent Registered Public Accounting Firm
To the Board of Trustees of Fidelity Investment Trust and the Shareholders of Fidelity International Small Cap Opportunities Fund:
Opinion on the Financial Statements and Financial Highlights
We have audited the accompanying statement of assets and liabilities of Fidelity International Small Cap Opportunities Fund (the "Fund"), a fund of Fidelity Investment Trust, including the schedule of investments, as of October 31, 2024, the related statement of operations for the year then ended, the statement of changes in net assets for each of the two years in the period then ended, the financial highlights for each of the five years in the period then ended, and the related notes. In our opinion, the financial statements and financial highlights present fairly, in all material respects, the financial position of the Fund as of October 31, 2024, and the results of its operations for the year then ended, the changes in its net assets for each of the two years in the period then ended, and the financial highlights for each of the five years in the period then ended in conformity with accounting principles generally accepted in the United States of America.
Basis for Opinion
These financial statements and financial highlights are the responsibility of the Fund's management. Our responsibility is to express an opinion on the Fund's financial statements and financial highlights based on our audits. We are a public accounting firm registered with the Public Company Accounting Oversight Board (United States) (PCAOB) and are required to be independent with respect to the Fund in accordance with the U.S. federal securities laws and the applicable rules and regulations of the Securities and Exchange Commission and the PCAOB.
We conducted our audits in accordance with the standards of the PCAOB. Those standards require that we plan and perform the audit to obtain reasonable assurance about whether the financial statements and financial highlights are free of material misstatement, whether due to error or fraud. The Fund is not required to have, nor were we engaged to perform, an audit of its internal control over financial reporting. As part of our audits, we are required to obtain an understanding of internal control over financial reporting but not for the purpose of expressing an opinion on the effectiveness of the Fund's internal control over financial reporting. Accordingly, we express no such opinion.
Our audits included performing procedures to assess the risks of material misstatement of the financial statements and financial highlights, whether due to error or fraud, and performing procedures that respond to those risks. Such procedures included examining, on a test basis, evidence regarding the amounts and disclosures in the financial statements and financial highlights. Our audits also included evaluating the accounting principles used and significant estimates made by management, as well as evaluating the overall presentation of the financial statements and financial highlights. Our procedures included confirmation of securities owned as of October 31, 2024, by correspondence with the custodian and brokers; when replies were not received from brokers, we performed other auditing procedures. We believe that our audits provide a reasonable basis for our opinion.
/s/ Deloitte & Touche LLP
Boston, Massachusetts
December 13, 2024
We have served as the auditor of one or more of the Fidelity investment companies since 1999.
Distributions
(Unaudited)The dividend and capital gains distributions for the fund(s) are available on Fidelity.com or Institutional.Fidelity.com.
The fund hereby designates as a capital gain dividend with respect to the taxable year ended October 31, 2024, $62,494,464, or, if subsequently determined to be different, the net capital gain of such year.
Class A designates 8%; Class M designates 14%; International Small Cap Opportunities designates 6%; Class I designates 6%; and Class Z designates 5%; of the dividend distributed, respectively during the fiscal year as qualifying for the dividends-received deduction for corporate shareholders.
Class A, Class M, International Small Cap Opportunities, Class I and Class Z designate 100% of the dividend distributed during the fiscal year as amounts which may be taken into account as a dividend for purposes of the maximum rate under section 1(h)(11) of the Internal Revenue Code.
The amounts per share which represent income derived from sources within, and taxes paid to, foreign countries or possessions of the United States are as follows:
| | Pay Date | Income | Taxes |
| Fidelity International Small Cap Opportunities Fund | | | |
| Class A | 12/11/2023 | $0.1379 | $0.0349 |
| Class M | 12/11/2023 | $0.0857 | $0.0349 |
| Class C | 12/11/2023 | $0.0000 | $0.0000 |
| International Small Cap Opportunities | 12/11/2023 | $0.1945 | $0.0349 |
| Class I | 12/11/2023 | $0.1928 | $0.0349 |
| Class Z | 12/11/2023 | $0.2184 | $0.0349 |
The fund will notify shareholders in January 2025 of amounts for use in preparing 2024 income tax returns.
Item 8: Changes in and Disagreements with Accountants for Open-End Management Investment Companies
(Unaudited)
Note: This is not applicable for any fund included in this document.
Item 9: Proxy Disclosures for Open-End Management Investment Companies
(Unaudited)
| A special meeting of shareholders was held on July 16, 2024. The results of votes taken among shareholders on the proposal before them are reported below. Each vote reported represents one dollar of net asset value held on the record date for the meeting. |
| Proposal 1 |
| To elect a Board of Trustees. |
| | # of Votes | % of Votes |
| Bettina Doulton |
| Affirmative | 128,529,177,643.56 | 98.18 |
| Withheld | 2,378,037,364.30 | 1.82 |
| TOTAL | 130,907,215,007.85 | 100.00 |
| Robert A. Lawrence |
| Affirmative | 128,253,389,899.05 | 97.97 |
| Withheld | 2,653,825,108.81 | 2.03 |
| TOTAL | 130,907,215,007.85 | 100.00 |
| Vijay C. Advani |
| Affirmative | 128,531,418,228.19 | 98.19 |
| Withheld | 2,375,796,779.66 | 1.81 |
| TOTAL | 130,907,215,007.85 | 100.00 |
| Thomas P. Bostick |
| Affirmative | 128,495,261,591.41 | 98.16 |
| Withheld | 2,411,953,416.44 | 1.84 |
| TOTAL | 130,907,215,007.85 | 100.00 |
| Donald F. Donahue |
| Affirmative | 128,407,878,996.00 | 98.09 |
| Withheld | 2,499,336,011.85 | 1.91 |
| TOTAL | 130,907,215,007.85 | 100.00 |
| Vicki L. Fuller |
| Affirmative | 128,625,540,095.19 | 98.26 |
| Withheld | 2,281,674,912.66 | 1.74 |
| TOTAL | 130,907,215,007.85 | 100.00 |
| Patricia L. Kampling |
| Affirmative | 128,668,729,281.34 | 98.29 |
| Withheld | 2,238,485,726.51 | 1.71 |
| TOTAL | 130,907,215,007.85 | 100.00 |
| Thomas A. Kennedy |
| Affirmative | 128,499,824,239.79 | 98.16 |
| Withheld | 2,407,390,768.06 | 1.84 |
| TOTAL | 130,907,215,007.85 | 100.00 |
| Oscar Munoz |
| Affirmative | 128,386,109,391.05 | 98.07 |
| Withheld | 2,521,105,616.80 | 1.93 |
| TOTAL | 130,907,215,007.85 | 100.00 |
| Karen B. Peetz |
| Affirmative | 128,603,731,113.82 | 98.24 |
| Withheld | 2,303,483,894.03 | 1.76 |
| TOTAL | 130,907,215,007.85 | 100.00 |
| David M. Thomas |
| Affirmative | 128,384,899,342.98 | 98.07 |
| Withheld | 2,522,315,664.88 | 1.93 |
| TOTAL | 130,907,215,007.85 | 100.00 |
| Susan Tomasky |
| Affirmative | 128,556,148,461.60 | 98.20 |
| Withheld | 2,351,066,546.25 | 1.80 |
| TOTAL | 130,907,215,007.85 | 100.00 |
| Michael E. Wiley |
| Affirmative | 128,264,934,978.34 | 97.98 |
| Withheld | 2,642,280,029.51 | 2.02 |
| TOTAL | 130,907,215,007.85 | 100.00 |
| | | |
| Proposal 1 reflects trust-wide proposal and voting results. |
Item 10: Remuneration Paid to Directors, Officers, and others of Open-End Management Investment Companies
(Unaudited)
Note: This information is disclosed as part of the financial statements for each Fund as part of Item 7: Financial Statements and Financial Highlights for Open-End Management Investment companies.
Item 11: Statement Regarding Basis for Approval of Investment Advisory Contract
(Unaudited)
Board Approval of Investment Advisory Contracts and Management Fees
Fidelity International Small Cap Opportunities Fund
Each year, the Board of Trustees, including the Independent Trustees (together, the Board), considers the renewal of the fund's management contract with Fidelity Management & Research Company LLC (FMR) and certain affiliates and the sub-advisory agreements (together, the Advisory Contracts) for the fund. FMR and the sub-advisers are referred to herein as the Investment Advisers. The Board, assisted by the advice of fund counsel and Independent Trustees' counsel, requests and considers a broad range of information relevant to the renewal of the Advisory Contracts throughout the year.
The Board meets regularly and, at each of its meetings, covers an extensive agenda of topics and materials and considers factors that are relevant to its annual consideration of the renewal of the fund's Advisory Contracts, including the services and support provided to the fund and its shareholders. The Board, acting directly and through its Committees (each of which is composed of and chaired by Independent Trustees), requests and receives information concerning the annual consideration of the renewal of the fund's Advisory Contracts. The Board also meets as needed to review matters specifically related to the Board's annual consideration of the renewal of the Advisory Contracts. Members of the Board may also meet with trustees of other Fidelity funds through joint ad hoc committees to discuss certain matters relevant to all of the Fidelity funds.
At its May 2024 meeting, the Board unanimously determined to renew the fund's Advisory Contracts. In reaching its determination, the Board considered all factors it believed relevant, including (i) the nature, extent, and quality of the services provided to the fund and its shareholders (including the investment performance of the fund); (ii) the competitiveness relative to peer funds of the fund's management fee and the total expense ratio of a representative class (the retail class, which was selected because it was the largest class without 12b-1 fees); (iii) the total costs of the services provided by and the profits realized by FMR and its affiliates (Fidelity) from its relationships with the fund; and (iv) the extent to which, if any, economies of scale exist and are realized as the fund grows, and whether any economies of scale are appropriately shared with fund shareholders. The Board also considered the broad range of investment choices available to shareholders from FMR's competitors and that the fund's shareholders have chosen to invest in the fund, which is part of the Fidelity family of funds. The Board's decision to renew the Advisory Contracts was not based on any single factor.
The Board reached a determination, with the assistance of fund counsel and Independent Trustees' counsel and through the exercise of its business judgment, that the renewal of the Advisory Contracts was in the best interests of the fund and its shareholders and that the compensation payable under the Advisory Contracts was fair and reasonable in light of all of the surrounding circumstances.
Nature, Extent, and Quality of Services Provided. The Board considered staffing as it relates to the fund, including the backgrounds and experience of investment personnel of the Investment Advisers, and also considered the Investment Advisers' implementation of the fund's investment program. The Independent Trustees also had discussions with senior management of Fidelity's investment operations and investment groups. The Board considered the structure of the investment personnel compensation program and whether this structure provides appropriate incentives to act in the best interests of the fund. Additionally, the Board considered the portfolio managers' investments, if any, in the funds that they manage.
Resources Dedicated to Investment Management and Support Services. The Board and the Fund Oversight and Research Committees reviewed the general qualifications and capabilities of Fidelity's investment staff, including its size, education, experience, and resources, as well as Fidelity's approach to recruiting, training, managing, and compensating investment personnel. The Board noted the resources devoted to expansion of Fidelity's global investment organization, and that Fidelity's analysts have extensive resources, tools, and capabilities that allow them to conduct sophisticated quantitative and fundamental analysis, as well as credit analysis of issuers, counterparties and guarantors. Further, the Board considered that Fidelity's investment professionals have sufficient access to global information and data so as to provide competitive investment results over time, and that those professionals also have access to sophisticated tools that permit them to assess portfolio construction and risk and performance attribution characteristics continuously, as well as to transmit new information and research conclusions rapidly around the world. Additionally, in its deliberations, the Board considered Fidelity's trading, risk management, compliance, and technology and operations capabilities and resources, which are integral parts of the investment management process.
Shareholder and Administrative Services. The Board considered (i) the nature, extent, quality, and cost of advisory, administrative, shareholder, transfer agency, and pricing and bookkeeping services performed by the Investment Advisers and their affiliates under the Advisory Contracts; (ii) the nature and extent of Fidelity's supervision of third party service providers, principally custodians, subcustodians, and pricing vendors; and (iii) the resources devoted by Fidelity to, and the record of compliance with, the fund's compliance policies and procedures. The Board also reviewed the allocation of fund brokerage, including allocations to brokers affiliated with the Investment Advisers, the use of brokerage commissions to pay fund expenses, and the use of "soft" commission dollars to pay for research services. The Board also considered the fund's securities lending activities and any payments made to Fidelity relating to securities lending under a separate agreement.
The Board noted that the growth of fund assets over time across the complex allows Fidelity to reinvest in the development of services designed to enhance the value and convenience of the Fidelity funds as investment vehicles. These services include 24-hour access to account information and market information over the Internet and through telephone representatives, investor education materials, and asset allocation tools. The Board also considered that it reviews customer service metrics such as telephone response times, continuity of services on the website and metrics addressing services at Fidelity Investor Centers.
Investment in a Large Fund Family. The Board considered the benefits to shareholders of investing in a fund that is part of a large family of funds offering a variety of investment disciplines and providing a large variety of fund investor services. The Board noted that Fidelity had taken, or had made recommendations that resulted in the Fidelity funds taking, a number of actions over the previous year that benefited particular funds and/or the Fidelity funds in general.
Investment Performance. The Board took into account discussions that occur with representatives of the Investment Advisers, and reports that it receives, at Board meetings throughout the year, relating to fund investment performance. In this regard the Board noted that as part of regularly scheduled fund reviews and other reports to the Board on fund performance, the Board considered annualized return information for the fund for different time periods, measured against an appropriate securities market index (benchmark index) and an appropriate peer group of funds with similar objectives (peer group). The Board also considered information about performance attribution. In its ongoing evaluation of fund investment performance, the Board gives particular attention to information indicating changes in performance of the funds over different time periods and discussed with the Investment Advisers the reasons for any overperformance or underperformance.
In addition to reviewing absolute and relative fund performance, the Independent Trustees periodically consider the appropriateness of fund performance metrics in evaluating the results achieved. The Independent Trustees generally give greater weight to fund performance over longer time periods than over shorter time periods. Depending on the circumstances, the Independent Trustees may be satisfied with a fund's performance notwithstanding that it lags its benchmark index or peer group for certain periods.
Based on its review, the Board concluded that the nature, extent, and quality of services provided to the fund under the Advisory Contracts should continue to benefit the shareholders of the fund.
Competitiveness of Management Fee and Total Expense Ratio. The Board was provided with information regarding industry trends in management fees and expenses. The Board considered that, effective March 1, 2024, an amended Advisory Contract with FMR went into effect with class-level management fees based on tiered schedules and subject to a maximum class-level rate (the management fee). The Board also considered that in exchange for the variable management fee, each class of the fund receives investment advisory, management, administrative, transfer agent, and pricing and bookkeeping services. In its review of the management fee and total expense ratio of the retail class, the Board considered a pro forma management fee rate for the retail class as if it had been in effect for the 12-month period ended September 30, 2023, as well as other third-party fund expenses, as applicable, such as custodial, legal, and audit fees and any fund-paid 12b-1 fees. The Board noted that Fidelity may agree to waive fees or reimburse expenses from time to time, and the extent to which, if any, it has done so for the fund. The Board also considered information about the impact of the fund's performance adjustment.
Comparisons of Management Fees and Total Expense Ratios. Among other things, the Board reviewed data for selected groups of competitive funds and classes (referred to as "mapped groups") that were compiled by Fidelity based on combining similar investment objective categories (as classified by Morningstar) that have comparable investment mandates. The data reviewed by the Board included (i) gross management fee comparisons (before taking into account expense reimbursements or caps and without taking into account the fund's performance adjustment) relative to the total universe of funds within the mapped group; (ii) gross management fee comparisons relative to a subset of non-Fidelity funds in the mapped group that are similar in size and management fee structure to the fund (referred to as the "asset size peer group"); (iii) total expense comparisons of the retail class of the fund relative to funds and classes in the mapped group that have a similar sales load structure to the retail class of the fund (referred to as the "similar sales load structure group"); and (iv) total expense comparisons of the retail class of the fund relative to funds and classes in the similar sales load structure group that are similar in size and management fee structure to the fund (referred to as the "total expense asset size peer group"). The total expense asset size peer group comparison excludes performance adjustments and fund-paid 12b-1 fees to eliminate variability in fee structures.
The information provided to the Board indicated that the fund's management fee rate ranked below the competitive median of the mapped group for the 12-month period ended September 30, 2023 and below the competitive median of the asset size peer group for the 12-month period ended September 30, 2023. Further, the information provided to the Board indicated that the total expense ratio of the retail class of the fund ranked below the competitive median of the similar sales load structure group for the 12-month period ended September 30, 2023 and below the competitive median of the total expense asset size peer group for the 12-month period ended September 30, 2023.
The Board noted that a different variable management fee rate is applicable to each class of the fund. The Board considered that the difference in management fee rates between classes is the result of separate arrangements for class-level services and/or waivers of certain expenses and not the result of any difference in advisory or custodial fees or other expenses related to the management of the fund's assets, which do not vary by class.
The Board also considered that the fund's management fee is subject to upward or downward adjustment depending upon whether, and to what extent, the fund's investment performance for the performance period (a rolling 36-month period) exceeds, or is exceeded by, a securities index, thus leading to a performance adjustment for the same period. The Board noted that the performance adjustment provides FMR with a strong economic incentive to seek to achieve superior long-term performance for the fund's shareholders and helps to more closely align the interests of FMR and the shareholders of the fund.
In connection with its consideration of the fund's performance adjustment, the Board noted that the performance of the retail class is used for purposes of determining the performance adjustment. The Board noted that to the extent the performance adjustment was based on the performance of a share class with higher total annual operating expenses, the fund would be subject to a smaller positive and larger negative performance adjustment. The Board considered the appropriateness of the use of the retail class as the basis for the performance adjustment. The Board noted that the retail class is typically the largest class (reflecting the actual investment experience for the plurality of shareholders), employs a standard expense structure, and does not include fund-paid 12b-1 fees, which Fidelity believes makes it a more appropriate measurement of Fidelity's investment skill.
Fees Charged to Other Fidelity Clients. The Board also considered Fidelity fee structures and other information with respect to clients of Fidelity, such as other funds advised or subadvised by Fidelity, pension plan clients, and other institutional clients with similar mandates. The Board noted that a joint ad hoc committee created by it and the boards of other Fidelity funds periodically reviews and compares Fidelity's institutional investment advisory business with its business of providing services to the Fidelity funds and also noted the most recent findings of the committee. The Board noted that the committee's review included a consideration of the differences in services provided, fees charged, and costs incurred, as well as competition in the markets serving the different categories of clients.
Based on its review, the Board concluded that the fund's management fee, including the use of the retail class as the basis for the performance adjustment, is fair and reasonable in light of the services that the fund receives and the other factors considered. Further, based on its review of total expense ratios and fees charged to other Fidelity clients, the Board concluded that the total expense ratio of each class of the fund was reasonable in light of the services that the fund and its shareholders receive and the other factors considered.
Costs of the Services and Profitability. The Board considered the revenues earned and the expenses incurred by Fidelity in conducting the business of developing, marketing, distributing, managing, administering and servicing the fund and servicing the fund's shareholders. The Board also considered the level of Fidelity's profits in respect of all the Fidelity funds.
On an annual basis, Fidelity presents to the Board information about the profitability of its relationships with the fund. Fidelity calculates profitability information for each fund, as well as aggregate profitability information for groups of Fidelity funds and all Fidelity funds, using a series of detailed revenue and cost allocation methodologies which originate with the books and records of Fidelity on which Fidelity's audited financial statements are based. The Audit Committee of the Board reviews any significant changes from the prior year's methodologies.
A public accounting firm has been engaged annually by the Board as part of the Board's assessment of Fidelity's profitability analysis. The engagement includes the review and assessment of the methodologies used by Fidelity in determining the revenues and expenses attributable to Fidelity's fund business, and completion of agreed-upon procedures in respect of the mathematical accuracy of certain fund profitability information and its conformity to established allocation methodologies. After considering the reports issued under the engagement and information provided by Fidelity, the Board concluded that while other allocation methods may also be reasonable, Fidelity's profitability methodologies are reasonable in all material respects.
The Board also reviewed Fidelity's non-fund businesses and potential indirect benefits such businesses may have received as a result of their association with Fidelity's fund business (i.e., fall-out benefits) as well as cases where Fidelity's affiliates may benefit from the funds' business. The Board considered areas where potential indirect benefits to the Fidelity funds from their relationships with Fidelity may exist. The Board's consideration of these matters was informed by the findings of a joint ad hoc committee created by it and the boards of other Fidelity funds to evaluate potential fall-out benefits.
The Board considered the costs of the services provided by and the profits realized by Fidelity in connection with the operation of the fund and was satisfied that the profitability was not excessive.
Economies of Scale. The Board considered whether there have been economies of scale in respect of the management of the Fidelity funds, whether the Fidelity funds (including the fund) have appropriately benefited from any such economies of scale, and whether there is potential for realization of any further economies of scale. The Board considered the extent to which the fund will benefit from economies of scale as assets grow through increased services to the fund, through waivers or reimbursements, or through fee or expense ratio reductions. The Board also noted that a committee created by it and the boards of other Fidelity funds periodically analyzes whether Fidelity attains economies of scale in respect of the management and servicing of the Fidelity funds, whether the Fidelity funds have appropriately benefited from such economies of scale, and whether there is potential for realization of any further economies of scale.
The Board recognized that the fund's management contract incorporates a variable management fee structure, which provides breakpoints as a way to share, in part, any potential economies of scale that may exist at the asset class level and through a discount that considers both fund size and total assets of the four applicable asset classes. The Board considered that the variable management fee is designed to deliver the benefits of economies of scale to fund shareholders even if assets of any particular fund are unchanged or have declined, because some portion of Fidelity's costs are attributable to services provided to all funds subject to the variable management fee, and all such funds benefit if those costs can be allocated among more assets. The Board concluded that, given the variable management fee structure, fund shareholders will benefit from lower management fees due to the application of the breakpoints and discount factor, regardless of whether Fidelity achieves any such economies of scale.
The Board concluded, taking into account the analysis of the committee, that economies of scale, if any, are being appropriately shared between fund shareholders and Fidelity.
Additional Information Requested by the Board. In order to develop fully the factual basis for consideration of the Fidelity funds' advisory contracts, the Board requested and received additional information on certain topics, including but not limited to: (i) fund flow and performance trends, in particular the underperformance of certain funds and strategies, and Fidelity's long-term strategies for certain funds; (ii) the operation of performance fees and the rationale for implementing performance fees on certain categories of funds but not others; (iii) Fidelity's pricing philosophy compared to competitors; (iv) fund profitability methodology and data; (v) evaluation of competitive fund data and peer group classifications and fee and expense comparisons; (vi) the management fee and expense structures for different funds and classes and information about the differences between various fee and expense structures; (vii) the variable management fee implemented for certain funds effective March 1, 2024; and (viii) information regarding other accounts managed by Fidelity and the funds' sub-advisory arrangements.
Conclusion. Based on its evaluation of all of the conclusions noted above, and after considering all factors it believed relevant, the Board, including the Independent Trustees, concluded that the advisory and sub-advisory fee arrangements are fair and reasonable in light of all of the surrounding circumstances and that the fund's Advisory Contracts should be renewed through May 31, 2025.
1.815075.120
ILS-ANN-1224
Fidelity® International Growth Fund
Annual Report
October 31, 2024
Includes Fidelity and Fidelity Advisor share classes
Contents
To view a fund's proxy voting guidelines and proxy voting record for the 12-month period ended June 30, visit http://www.fidelity.com/proxyvotingresults or visit the Securities and Exchange Commission's (SEC) web site at http://www.sec.gov.
You may also call 1-800-544-8544 if you're an individual investing directly with Fidelity, call 1-800-835-5092 if you're a plan sponsor or participant with Fidelity as your recordkeeper or call 1-877-208-0098 on institutional accounts or if you're an advisor or invest through one to request a free copy of the proxy voting guidelines.
Standard & Poor's, S&P and S&P 500 are registered service marks of The McGraw-Hill Companies, Inc. and have been licensed for use by Fidelity Distributors Corporation.
Other third-party marks appearing herein are the property of their respective owners.
All other marks appearing herein are registered or unregistered trademarks or service marks of FMR LLC or an affiliated company. © 2024 FMR LLC. All rights reserved.
This report and the financial statements contained herein are submitted for the general information of the shareholders of the Fund. This report is not authorized for distribution to prospective investors in the Fund unless preceded or accompanied by an effective prospectus.
A fund files its complete schedule of portfolio holdings with the SEC for the first and third quarters of each fiscal year on Form N-PORT. Forms N-PORT are available on the SEC's web site at http://www.sec.gov. A fund's Forms N-PORT may be reviewed and copied at the SEC's Public Reference Room in Washington, DC. Information regarding the operation of the SEC's Public Reference Room may be obtained by calling 1-800-SEC-0330.
For a complete list of a fund's portfolio holdings, view the most recent holdings listing, semiannual report, or annual report on Fidelity's web site at http://www.fidelity.com, http://www.institutional.fidelity.com, or http://www.401k.com, as applicable.
NOT FDIC INSURED •MAY LOSE VALUE •NO BANK GUARANTEE
Neither the Fund nor Fidelity Distributors Corporation is a bank.
Item 7: Financial Statements and Financial Highlights for Open-End Management Investment Companies (Annual Report)
Fidelity® International Growth Fund
Schedule of Investments October 31, 2024
Showing Percentage of Net Assets
| Common Stocks - 96.7% |
| | | Shares | Value ($) |
| Belgium - 0.3% | | | |
| Azelis Group NV | | 992,905 | 19,688,991 |
| Canada - 3.0% | | | |
| CAE, Inc. (a) | | 668,511 | 11,763,220 |
| Canadian Pacific Kansas City Ltd. | | 1,608,500 | 124,084,451 |
| Franco-Nevada Corp. | | 340,380 | 45,181,909 |
TOTAL CANADA | | | 181,029,580 |
| Denmark - 5.1% | | | |
| Novo Nordisk A/S Series B | | 2,762,300 | 309,833,413 |
| Finland - 0.6% | | | |
| Kone OYJ (B Shares) | | 624,600 | 34,147,079 |
| France - 11.2% | | | |
| Airbus Group NV | | 824,400 | 125,754,991 |
| Edenred SA | | 1,045,122 | 33,593,370 |
| EssilorLuxottica SA | | 10,000 | 2,343,014 |
| Lectra | | 397,459 | 11,024,569 |
| Legrand SA | | 882,200 | 99,572,542 |
| LVMH Moet Hennessy Louis Vuitton SE | | 245,645 | 163,530,925 |
| Safran SA | | 1,059,900 | 239,925,009 |
TOTAL FRANCE | | | 675,744,420 |
| Germany - 6.6% | | | |
| Deutsche Borse AG | | 358,900 | 83,364,682 |
| SAP SE | | 1,362,900 | 318,216,839 |
TOTAL GERMANY | | | 401,581,521 |
| India - 1.2% | | | |
| HDFC Bank Ltd. | | 1,385,491 | 28,477,608 |
| Jio Financial Services Ltd. (a) | | 970,400 | 3,711,507 |
| Reliance Industries Ltd. | | 750,100 | 11,860,245 |
| Reliance Industries Ltd. (a) | | 750,100 | 11,775,429 |
| Reliance Industries Ltd. GDR (b) | | 252,400 | 15,800,240 |
TOTAL INDIA | | | 71,625,029 |
| Italy - 1.3% | | | |
| Interpump Group SpA | | 646,426 | 28,716,641 |
| Prada SpA | | 6,524,200 | 50,089,622 |
TOTAL ITALY | | | 78,806,263 |
| Japan - 9.6% | | | |
| Azbil Corp. | | 6,154,012 | 47,853,368 |
| DENSO Corp. | | 2,375,560 | 33,741,254 |
| Hoya Corp. | | 459,700 | 61,505,124 |
| Keyence Corp. | | 348,448 | 157,294,194 |
| Komatsu Ltd. | | 1,287,900 | 33,337,682 |
| Misumi Group, Inc. | | 931,985 | 15,168,576 |
| OSG Corp. | | 636,900 | 7,517,347 |
| Recruit Holdings Co. Ltd. | | 2,904,600 | 177,362,222 |
| SHO-BOND Holdings Co. Ltd. | | 671,000 | 23,604,805 |
| USS Co. Ltd. | | 2,551,800 | 21,370,745 |
TOTAL JAPAN | | | 578,755,317 |
| Netherlands - 6.1% | | | |
| Aalberts Industries NV | | 226,400 | 8,166,200 |
| ASML Holding NV (Netherlands) | | 431,100 | 291,298,710 |
| BE Semiconductor Industries NV | | 261,699 | 27,879,903 |
| IMCD NV | | 257,346 | 40,883,501 |
TOTAL NETHERLANDS | | | 368,228,314 |
| Spain - 0.6% | | | |
| Amadeus IT Holding SA Class A | | 537,900 | 38,967,708 |
| Sweden - 7.5% | | | |
| AddTech AB (B Shares) | | 370,000 | 10,258,340 |
| ASSA ABLOY AB (B Shares) | | 3,040,510 | 95,237,110 |
| Atlas Copco AB (A Shares) (c) | | 12,407,200 | 204,761,197 |
| Autoliv, Inc. | | 452,069 | 41,988,169 |
| Epiroc AB (A Shares) | | 4,093,717 | 79,951,552 |
| Lagercrantz Group AB (B Shares) | | 1,002,600 | 19,554,114 |
TOTAL SWEDEN | | | 451,750,482 |
| Switzerland - 2.5% | | | |
| Schindler Holding AG: | | | |
| (participation certificate) | | 138,468 | 40,311,337 |
| (Reg.) | | 18,350 | 5,227,375 |
| UBS Group AG | | 3,512,242 | 107,943,840 |
TOTAL SWITZERLAND | | | 153,482,552 |
| Taiwan - 3.3% | | | |
| Taiwan Semiconductor Manufacturing Co. Ltd. | | 6,326,000 | 199,026,149 |
| United Kingdom - 11.7% | | | |
| 3i Group PLC | | 697,800 | 28,615,186 |
| BAE Systems PLC | | 7,149,000 | 115,222,645 |
| Compass Group PLC | | 4,860,100 | 157,838,671 |
| InterContinental Hotel Group PLC ADR (c) | | 1,083,670 | 120,775,022 |
| London Stock Exchange Group PLC | | 831,200 | 112,657,435 |
| RELX PLC (London Stock Exchange) | | 1,960,700 | 89,917,122 |
| Rightmove PLC | | 1,630,130 | 12,376,406 |
| Sage Group PLC | | 2,923,000 | 36,537,290 |
| Spectris PLC | | 1,073,657 | 34,832,184 |
TOTAL UNITED KINGDOM | | | 708,771,961 |
| United States of America - 26.1% | | | |
| CRH PLC | | 2,458,566 | 234,620,953 |
| Experian PLC | | 2,941,600 | 143,263,352 |
| GE Vernova LLC | | 335,500 | 101,206,930 |
| Linde PLC | | 508,579 | 231,988,311 |
| Marsh & McLennan Companies, Inc. | | 578,051 | 126,153,850 |
| MasterCard, Inc. Class A | | 202,400 | 101,117,016 |
| Microsoft Corp. | | 99,600 | 40,472,460 |
| Moody's Corp. | | 275,300 | 124,997,212 |
| Nestle SA (Reg. S) | | 561,959 | 53,100,991 |
| Otis Worldwide Corp. | | 459,500 | 45,122,900 |
| PriceSmart, Inc. | | 177,798 | 14,771,458 |
| S&P Global, Inc. | | 246,300 | 118,312,668 |
| Sherwin-Williams Co. | | 388,900 | 139,525,653 |
| Visa, Inc. Class A | | 356,660 | 103,377,901 |
TOTAL UNITED STATES OF AMERICA | | | 1,578,031,655 |
| TOTAL COMMON STOCKS (Cost $3,857,375,691) | | | 5,849,470,434 |
| | | | |
| Convertible Preferred Stocks - 0.3% |
| | | Shares | Value ($) |
| China - 0.3% | | | |
ByteDance Ltd. Series E1 (a)(d)(e) (Cost $6,992,915) | | 63,819 | 15,901,780 |
| | | | |
| Money Market Funds - 4.9% |
| | | Shares | Value ($) |
| Fidelity Cash Central Fund 4.87% (f) | | 148,741,250 | 148,770,998 |
| Fidelity Securities Lending Cash Central Fund 4.87% (f)(g) | | 144,972,419 | 144,986,916 |
| TOTAL MONEY MARKET FUNDS (Cost $293,757,914) | | | 293,757,914 |
| | | | |
| TOTAL INVESTMENT IN SECURITIES - 101.9% (Cost $4,158,126,520) | 6,159,130,128 |
NET OTHER ASSETS (LIABILITIES) - (1.9)% | (112,514,826) |
| NET ASSETS - 100.0% | 6,046,615,302 |
| | |
Legend
| (b) | Security exempt from registration under Rule 144A of the Securities Act of 1933. These securities may be resold in transactions exempt from registration, normally to qualified institutional buyers. At the end of the period, the value of these securities amounted to $15,800,240 or 0.3% of net assets. |
| (c) | Security or a portion of the security is on loan at period end. |
| (d) | Restricted securities (including private placements) - Investment in securities not registered under the Securities Act of 1933 (excluding 144A issues). At the end of the period, the value of restricted securities (excluding 144A issues) amounted to $15,901,780 or 0.3% of net assets. |
| (f) | Affiliated fund that is generally available only to investment companies and other accounts managed by Fidelity Investments. The rate quoted is the annualized seven-day yield of the fund at period end. A complete unaudited listing of the fund's holdings as of its most recent quarter end is available upon request. In addition, each Fidelity Central Fund's financial statements, which are not covered by the Fund's Report of Independent Registered Public Accounting Firm, are available on the SEC's website or upon request. |
| (g) | Investment made with cash collateral received from securities on loan. |
| Additional information on each restricted holding is as follows: |
| Security | Acquisition Date | Acquisition Cost ($) |
| ByteDance Ltd. Series E1 | 11/18/20 | 6,992,915 |
| | | |
Affiliated Central Funds
Fiscal year to date information regarding the Fund's investments in Fidelity Central Funds, including the ownership percentage, is presented below.
| Affiliate | Value, beginning of period ($) | Purchases ($) | Sales Proceeds ($) | Dividend Income ($) | Realized Gain (loss) ($) | Change in Unrealized appreciation (depreciation) ($) | Value, end of period ($) | % ownership, end of period |
| Fidelity Cash Central Fund 4.87% | 71,840,035 | 1,719,472,734 | 1,642,543,131 | 5,840,445 | 1,360 | - | 148,770,998 | 0.3% |
| Fidelity Securities Lending Cash Central Fund 4.87% | 12,775,303 | 867,866,033 | 735,654,420 | 265,933 | - | - | 144,986,916 | 0.6% |
| Total | 84,615,338 | 2,587,338,767 | 2,378,197,551 | 6,106,378 | 1,360 | - | 293,757,914 | |
| | | | | | | | | |
Amounts in the dividend income column in the above table include any capital gain distributions from underlying funds, which are presented in the corresponding line item in the Statement of Operations, if applicable.
Amounts in the dividend income column for Fidelity Securities Lending Cash Central Fund represents the income earned on investing cash collateral, less rebates paid to borrowers and any lending agent fees associated with the loan, plus any premium payments received for lending certain types of securities.
Amounts included in the purchases and sales proceeds columns may include in-kind transactions, if applicable.
Investment Valuation
The following is a summary of the inputs used, as of October 31, 2024, involving the Fund's assets and liabilities carried at fair value. The inputs or methodology used for valuing securities may not be an indication of the risk associated with investing in those securities. For more information on valuation inputs, and their aggregation into the levels used below, please refer to the Investment Valuation section in the accompanying Notes to Financial Statements.
| Valuation Inputs at Reporting Date: |
| Description | Total ($) | Level 1 ($) | Level 2 ($) | Level 3 ($) |
Investments in Securities: | | | | |
|
| Equities: | | | | |
Communication Services | 28,278,186 | 12,376,406 | - | 15,901,780 |
Consumer Discretionary | 628,302,116 | 201,730,899 | 426,571,217 | - |
Consumer Staples | 67,872,449 | 14,771,458 | 53,100,991 | - |
Energy | 39,435,914 | 15,800,240 | 23,635,674 | - |
Financials | 972,322,275 | 715,495,857 | 256,826,418 | - |
Health Care | 373,681,551 | 2,343,014 | 371,338,537 | - |
Industrials | 1,920,173,117 | 612,840,317 | 1,307,332,800 | - |
Information Technology | 1,183,989,780 | 461,599,230 | 722,390,550 | - |
Materials | 651,316,826 | 651,316,826 | - | - |
|
| Money Market Funds | 293,757,914 | 293,757,914 | - | - |
| Total Investments in Securities: | 6,159,130,128 | 2,982,032,161 | 3,161,196,187 | 15,901,780 |
Financial Statements
| Statement of Assets and Liabilities |
As of October 31, 2024 |
| Assets | | | | |
| Investment in securities, at value (including securities loaned of $134,122,710) - See accompanying schedule: | | | | |
Unaffiliated issuers (cost $3,864,368,606) | $ | 5,865,372,214 | | |
Fidelity Central Funds (cost $293,757,914) | | 293,757,914 | | |
| | | | | |
| | | | | |
| Total Investment in Securities (cost $4,158,126,520) | | | $ | 6,159,130,128 |
| Foreign currency held at value (cost $3,861) | | | | 3,894 |
| Receivable for investments sold | | | | 22,500,753 |
| Receivable for fund shares sold | | | | 6,322,834 |
| Dividends receivable | | | | 5,182,051 |
| Reclaims receivable | | | | 11,332,119 |
| Distributions receivable from Fidelity Central Funds | | | | 557,414 |
| Prepaid expenses | | | | 6,965 |
| Other receivables | | | | 11,556 |
Total assets | | | | 6,205,047,714 |
| Liabilities | | | | |
| Payable for investments purchased | $ | 3,651,020 | | |
| Payable for fund shares redeemed | | 4,027,968 | | |
| Accrued management fee | | 4,096,123 | | |
| Distribution and service plan fees payable | | 78,463 | | |
| Other payables and accrued expenses | | 1,592,625 | | |
| Collateral on securities loaned | | 144,986,213 | | |
| Total liabilities | | | | 158,432,412 |
| Net Assets | | | $ | 6,046,615,302 |
| Net Assets consist of: | | | | |
| Paid in capital | | | $ | 4,015,686,248 |
| Total accumulated earnings (loss) | | | | 2,030,929,054 |
| Net Assets | | | $ | 6,046,615,302 |
| | | | | |
| Net Asset Value and Maximum Offering Price | | | | |
| Class A : | | | | |
Net Asset Value and redemption price per share ($204,715,989 ÷ 10,129,929 shares)(a) | | | $ | 20.21 |
| Maximum offering price per share (100/94.25 of $20.21) | | | $ | 21.44 |
| Class M : | | | | |
Net Asset Value and redemption price per share ($31,196,452 ÷ 1,559,439 shares)(a) | | | $ | 20.00 |
| Maximum offering price per share (100/96.50 of $20.00) | | | $ | 20.73 |
| Class C : | | | | |
Net Asset Value and offering price per share ($24,522,868 ÷ 1,277,811 shares)(a) | | | $ | 19.19 |
| International Growth : | | | | |
Net Asset Value, offering price and redemption price per share ($1,591,302,956 ÷ 77,845,099 shares) | | | $ | 20.44 |
| Class I : | | | | |
Net Asset Value, offering price and redemption price per share ($1,821,120,359 ÷ 89,343,262 shares) | | | $ | 20.38 |
| Class Z : | | | | |
Net Asset Value, offering price and redemption price per share ($2,373,756,678 ÷ 116,177,785 shares) | | | $ | 20.43 |
(a)Redemption price per share is equal to net asset value less any applicable contingent deferred sales charge. |
| Statement of Operations |
| Year ended October 31, 2024 |
| Investment Income | | | | |
| Dividends | | | $ | 77,768,825 |
| Interest | | | | 2,921 |
| Income from Fidelity Central Funds (including $265,933 from security lending) | | | | 6,106,378 |
| Income before foreign taxes withheld | | | $ | 83,878,124 |
| Less foreign taxes withheld | | | | (4,176,318) |
| Total income | | | | 79,701,806 |
| Expenses | | | | |
| Management fee | | | | |
| Basic fee | $ | 39,763,899 | | |
| Performance adjustment | | 4,380,873 | | |
| Transfer agent fees | | 2,139,569 | | |
| Distribution and service plan fees | | 952,637 | | |
| Accounting fees | | 490,504 | | |
| Custodian fees and expenses | | 286,730 | | |
| Independent trustees' fees and expenses | | 23,707 | | |
| Registration fees | | 183,273 | | |
| Audit fees | | 80,026 | | |
| Legal | | 5,999 | | |
| Interest | | 33,157 | | |
| Miscellaneous | | 118,389 | | |
| Total expenses before reductions | | 48,458,763 | | |
| Expense reductions | | (219,868) | | |
| Total expenses after reductions | | | | 48,238,895 |
| Net Investment income (loss) | | | | 31,462,911 |
| Realized and Unrealized Gain (Loss) | | | | |
| Net realized gain (loss) on: | | | | |
| Investment Securities: | | | | |
| Unaffiliated issuers (net of foreign taxes of $291,052) | | 104,707,653 | | |
| Fidelity Central Funds | | 1,360 | | |
| Foreign currency transactions | | (339,762) | | |
| Total net realized gain (loss) | | | | 104,369,251 |
| Change in net unrealized appreciation (depreciation) on: | | | | |
| Investment Securities: | | | | |
| Unaffiliated issuers (net of increase in deferred foreign taxes of $1,241,879) | | 923,648,706 | | |
| Assets and liabilities in foreign currencies | | 404,789 | | |
| Total change in net unrealized appreciation (depreciation) | | | | 924,053,495 |
| Net gain (loss) | | | | 1,028,422,746 |
| Net increase (decrease) in net assets resulting from operations | | | $ | 1,059,885,657 |
| Statement of Changes in Net Assets |
| |
| | Year ended October 31, 2024 | | Year ended October 31, 2023 |
| Increase (Decrease) in Net Assets | | | | |
| Operations | | | | |
| Net investment income (loss) | $ | 31,462,911 | $ | 23,770,653 |
| Net realized gain (loss) | | 104,369,251 | | (81,088,074) |
| Change in net unrealized appreciation (depreciation) | | 924,053,495 | | 420,336,910 |
| Net increase (decrease) in net assets resulting from operations | | 1,059,885,657 | | 363,019,489 |
| Distributions to shareholders | | (24,060,084) | | (63,050,595) |
| | | | | |
| Share transactions - net increase (decrease) | | 670,552,377 | | 265,402,755 |
| Total increase (decrease) in net assets | | 1,706,377,950 | | 565,371,649 |
| | | | | |
| Net Assets | | | | |
| Beginning of period | | 4,340,237,352 | | 3,774,865,703 |
| End of period | $ | 6,046,615,302 | $ | 4,340,237,352 |
| | | | | |
| | | | | |
Financial Highlights
Fidelity Advisor® International Growth Fund Class A |
| |
| Years ended October 31, | | 2024 | | 2023 | | 2022 | | 2021 | | 2020 |
Selected Per-Share Data | | | | | | | | | | |
| Net asset value, beginning of period | $ | 16.19 | $ | 14.89 | $ | 21.04 | $ | 16.06 | $ | 15.03 |
| Income from Investment Operations | | | | | | | | | | |
Net investment income (loss) A,B | | .06 | | .04 | | - C | | (.04) | | (.01) |
| Net realized and unrealized gain (loss) | | 4.00 | | 1.49 | | (5.80) | | 5.02 | | 1.16 |
| Total from investment operations | | 4.06 | | 1.53 | | (5.80) | | 4.98 | | 1.15 |
| Distributions from net investment income | | (.04) | | - | | (.03) | | - | | (.12) |
| Distributions from net realized gain | | - | | (.23) | | (.32) | | - | | - |
| Total distributions | | (.04) | | (.23) | | (.35) | | - | | (.12) |
| Net asset value, end of period | $ | 20.21 | $ | 16.19 | $ | 14.89 | $ | 21.04 | $ | 16.06 |
Total Return D,E | | | | 10.26% | | (28.00)% | | 31.01% | | 7.66% |
Ratios to Average Net Assets B,F,G | | | | | | | | | | |
| Expenses before reductions | | 1.18% | | 1.21% | | 1.30% | | 1.28% | | 1.30% |
| Expenses net of fee waivers, if any | | | | 1.21% | | 1.30% | | 1.28% | | 1.30% |
| Expenses net of all reductions | | 1.18% | | 1.21% | | 1.30% | | 1.28% | | 1.29% |
| Net investment income (loss) | | .28% | | .23% | | .02% | | (.20)% | | (.08)% |
| Supplemental Data | | | | | | | | | | |
| Net assets, end of period (000 omitted) | $ | 204,716 | $ | 171,656 | $ | 157,490 | $ | 232,527 | $ | 174,561 |
Portfolio turnover rate H | | | | 22% | | 22% | | 21% | | 23% |
ACalculated based on average shares outstanding during the period.
BNet investment income (loss) is affected by the timing of the declaration of dividends by any underlying mutual funds or exchange-traded funds (ETFs). Net investment income (loss) of any mutual funds or ETFs is not included in the Fund's net investment income (loss) ratio.
CAmount represents less than $.005 per share.
DTotal returns would have been lower if certain expenses had not been reduced during the applicable periods shown.
ETotal returns do not include the effect of the sales charges.
FFees and expenses of any underlying mutual funds or exchange-traded funds (ETFs) are not included in the Fund's expense ratio. The Fund indirectly bears its proportionate share of these expenses. For additional expense information related to investments in Fidelity Central Funds, please refer to the "Investments in Fidelity Central Funds" note found in the Notes to Financial Statements section of the most recent Annual or Semi-Annual report.
GExpense ratios reflect operating expenses of the class. Expenses before reductions do not reflect amounts reimbursed, waived, or reduced through arrangements with the investment adviser, brokerage services, or other offset arrangements, if applicable, and do not represent the amount paid by the class during periods when reimbursements, waivers or reductions occur.
HAmount does not include the portfolio activity of any underlying mutual funds or exchange-traded funds (ETFs).
Fidelity Advisor® International Growth Fund Class M |
| |
| Years ended October 31, | | 2024 | | 2023 | | 2022 | | 2021 | | 2020 |
Selected Per-Share Data | | | | | | | | | | |
| Net asset value, beginning of period | $ | 16.04 | $ | 14.79 | $ | 20.92 | $ | 16.01 | $ | 14.99 |
| Income from Investment Operations | | | | | | | | | | |
Net investment income (loss) A,B | | .01 | | (.01) | | (.04) | | (.09) | | (.06) |
| Net realized and unrealized gain (loss) | | 3.95 | | 1.49 | | (5.77) | | 5.00 | | 1.15 |
| Total from investment operations | | 3.96 | | 1.48 | | (5.81) | | 4.91 | | 1.09 |
| Distributions from net investment income | | - | | - | | - | | - | | (.07) |
| Distributions from net realized gain | | - | | (.23) | | (.32) | | - | | - |
| Total distributions | | - | | (.23) | | (.32) | | - | | (.07) |
| Net asset value, end of period | $ | 20.00 | $ | 16.04 | $ | 14.79 | $ | 20.92 | $ | 16.01 |
Total Return C,D | | | | 9.99% | | (28.18)% | | 30.67% | | 7.27% |
Ratios to Average Net Assets B,E,F | | | | | | | | | | |
| Expenses before reductions | | 1.44% | | 1.48% | | 1.57% | | 1.55% | | 1.59% |
| Expenses net of fee waivers, if any | | | | 1.48% | | 1.57% | | 1.55% | | 1.59% |
| Expenses net of all reductions | | 1.43% | | 1.47% | | 1.57% | | 1.55% | | 1.58% |
| Net investment income (loss) | | .03% | | (.03)% | | (.25)% | | (.48)% | | (.37)% |
| Supplemental Data | | | | | | | | | | |
| Net assets, end of period (000 omitted) | $ | 31,196 | $ | 27,016 | $ | 26,250 | $ | 38,761 | $ | 30,353 |
Portfolio turnover rate G | | | | 22% | | 22% | | 21% | | 23% |
ACalculated based on average shares outstanding during the period.
BNet investment income (loss) is affected by the timing of the declaration of dividends by any underlying mutual funds or exchange-traded funds (ETFs). Net investment income (loss) of any mutual funds or ETFs is not included in the Fund's net investment income (loss) ratio.
CTotal returns would have been lower if certain expenses had not been reduced during the applicable periods shown.
DTotal returns do not include the effect of the sales charges.
EFees and expenses of any underlying mutual funds or exchange-traded funds (ETFs) are not included in the Fund's expense ratio. The Fund indirectly bears its proportionate share of these expenses. For additional expense information related to investments in Fidelity Central Funds, please refer to the "Investments in Fidelity Central Funds" note found in the Notes to Financial Statements section of the most recent Annual or Semi-Annual report.
FExpense ratios reflect operating expenses of the class. Expenses before reductions do not reflect amounts reimbursed, waived, or reduced through arrangements with the investment adviser, brokerage services, or other offset arrangements, if applicable, and do not represent the amount paid by the class during periods when reimbursements, waivers or reductions occur.
GAmount does not include the portfolio activity of any underlying mutual funds or exchange-traded funds (ETFs).
Fidelity Advisor® International Growth Fund Class C |
| |
| Years ended October 31, | | 2024 | | 2023 | | 2022 | | 2021 | | 2020 |
Selected Per-Share Data | | | | | | | | | | |
| Net asset value, beginning of period | $ | 15.46 | $ | 14.33 | $ | 20.39 | $ | 15.68 | $ | 14.68 |
| Income from Investment Operations | | | | | | | | | | |
Net investment income (loss) A,B | | (.09) | | (.09) | | (.13) | | (.18) | | (.13) |
| Net realized and unrealized gain (loss) | | 3.82 | | 1.45 | | (5.61) | | 4.89 | | 1.13 |
| Total from investment operations | | 3.73 | | 1.36 | | (5.74) | | 4.71 | | 1.00 |
| Distributions from net realized gain | | - | | (.23) | | (.32) | | - | | - |
| Total distributions | | - | | (.23) | | (.32) | | - | | - |
| Net asset value, end of period | $ | 19.19 | $ | 15.46 | $ | 14.33 | $ | 20.39 | $ | 15.68 |
Total Return C,D | | | | 9.47% | | (28.58)% | | 30.04% | | 6.81% |
Ratios to Average Net Assets B,E,F | | | | | | | | | | |
| Expenses before reductions | | 1.94% | | 1.98% | | 2.07% | | 2.05% | | 2.07% |
| Expenses net of fee waivers, if any | | | | 1.97% | | 2.06% | | 2.05% | | 2.07% |
| Expenses net of all reductions | | 1.94% | | 1.97% | | 2.06% | | 2.05% | | 2.06% |
| Net investment income (loss) | | (.48)% | | (.53)% | | (.74)% | | (.97)% | | (.85)% |
| Supplemental Data | | | | | | | | | | |
| Net assets, end of period (000 omitted) | $ | 24,523 | $ | 27,270 | $ | 33,575 | $ | 58,867 | $ | 55,013 |
Portfolio turnover rate G | | | | 22% | | 22% | | 21% | | 23% |
ACalculated based on average shares outstanding during the period.
BNet investment income (loss) is affected by the timing of the declaration of dividends by any underlying mutual funds or exchange-traded funds (ETFs). Net investment income (loss) of any mutual funds or ETFs is not included in the Fund's net investment income (loss) ratio.
CTotal returns would have been lower if certain expenses had not been reduced during the applicable periods shown.
DTotal returns do not include the effect of the contingent deferred sales charge.
EFees and expenses of any underlying mutual funds or exchange-traded funds (ETFs) are not included in the Fund's expense ratio. The Fund indirectly bears its proportionate share of these expenses. For additional expense information related to investments in Fidelity Central Funds, please refer to the "Investments in Fidelity Central Funds" note found in the Notes to Financial Statements section of the most recent Annual or Semi-Annual report.
FExpense ratios reflect operating expenses of the class. Expenses before reductions do not reflect amounts reimbursed, waived, or reduced through arrangements with the investment adviser, brokerage services, or other offset arrangements, if applicable, and do not represent the amount paid by the class during periods when reimbursements, waivers or reductions occur.
GAmount does not include the portfolio activity of any underlying mutual funds or exchange-traded funds (ETFs).
Fidelity® International Growth Fund |
| |
| Years ended October 31, | | 2024 | | 2023 | | 2022 | | 2021 | | 2020 |
Selected Per-Share Data | | | | | | | | | | |
| Net asset value, beginning of period | $ | 16.38 | $ | 15.05 | $ | 21.26 | $ | 16.20 | $ | 15.16 |
| Income from Investment Operations | | | | | | | | | | |
Net investment income (loss) A,B | | .11 | | .09 | | .05 | | .02 | | .03 |
| Net realized and unrealized gain (loss) | | 4.04 | | 1.51 | | (5.85) | | 5.06 | | 1.17 |
| Total from investment operations | | 4.15 | | 1.60 | | (5.80) | | 5.08 | | 1.20 |
| Distributions from net investment income | | (.09) | | (.04) | | (.09) | | (.02) | | (.16) |
| Distributions from net realized gain | | - | | (.23) | | (.32) | | - | | - |
| Total distributions | | (.09) | | (.27) | | (.41) | | (.02) | | (.16) |
| Net asset value, end of period | $ | 20.44 | $ | 16.38 | $ | 15.05 | $ | 21.26 | $ | 16.20 |
Total Return C | | | | 10.59% | | (27.79)% | | 31.38% | | 7.93% |
Ratios to Average Net Assets B,D,E | | | | | | | | | | |
| Expenses before reductions | | .89% | | .93% | | 1.01% | | .99% | | 1.01% |
| Expenses net of fee waivers, if any | | | | .92% | | 1.01% | | .99% | | 1.01% |
| Expenses net of all reductions | | .89% | | .92% | | 1.01% | | .99% | | 1.00% |
| Net investment income (loss) | | .57% | | .52% | | .31% | | .09% | | .21% |
| Supplemental Data | | | | | | | | | | |
| Net assets, end of period (000 omitted) | $ | 1,591,303 | $ | 1,277,884 | $ | 1,194,442 | $ | 1,773,433 | $ | 1,292,392 |
Portfolio turnover rate F | | | | 22% | | 22% | | 21% | | 23% |
ACalculated based on average shares outstanding during the period.
BNet investment income (loss) is affected by the timing of the declaration of dividends by any underlying mutual funds or exchange-traded funds (ETFs). Net investment income (loss) of any mutual funds or ETFs is not included in the Fund's net investment income (loss) ratio.
CTotal returns would have been lower if certain expenses had not been reduced during the applicable periods shown.
DFees and expenses of any underlying mutual funds or exchange-traded funds (ETFs) are not included in the Fund's expense ratio. The Fund indirectly bears its proportionate share of these expenses. For additional expense information related to investments in Fidelity Central Funds, please refer to the "Investments in Fidelity Central Funds" note found in the Notes to Financial Statements section of the most recent Annual or Semi-Annual report.
EExpense ratios reflect operating expenses of the class. Expenses before reductions do not reflect amounts reimbursed, waived, or reduced through arrangements with the investment adviser, brokerage services, or other offset arrangements, if applicable, and do not represent the amount paid by the class during periods when reimbursements, waivers or reductions occur.
FAmount does not include the portfolio activity of any underlying mutual funds or exchange-traded funds (ETFs).
Fidelity Advisor® International Growth Fund Class I |
| |
| Years ended October 31, | | 2024 | | 2023 | | 2022 | | 2021 | | 2020 |
Selected Per-Share Data | | | | | | | | | | |
| Net asset value, beginning of period | $ | 16.34 | $ | 15.01 | $ | 21.20 | $ | 16.16 | $ | 15.13 |
| Income from Investment Operations | | | | | | | | | | |
Net investment income (loss) A,B | | .11 | | .09 | | .05 | | .01 | | .03 |
| Net realized and unrealized gain (loss) | | 4.02 | | 1.50 | | (5.83) | | 5.05 | | 1.16 |
| Total from investment operations | | 4.13 | | 1.59 | | (5.78) | | 5.06 | | 1.19 |
| Distributions from net investment income | | (.09) | | (.03) | | (.09) | | (.02) | | (.16) |
| Distributions from net realized gain | | - | | (.23) | | (.32) | | - | | - |
| Total distributions | | (.09) | | (.26) | | (.41) | | (.02) | | (.16) |
| Net asset value, end of period | $ | 20.38 | $ | 16.34 | $ | 15.01 | $ | 21.20 | $ | 16.16 |
Total Return C | | | | 10.59% | | (27.78)% | | 31.36% | | 7.90% |
Ratios to Average Net Assets B,D,E | | | | | | | | | | |
| Expenses before reductions | | .92% | | .94% | | 1.02% | | 1.00% | | 1.01% |
| Expenses net of fee waivers, if any | | | | .93% | | 1.02% | | 1.00% | | 1.01% |
| Expenses net of all reductions | | .92% | | .93% | | 1.02% | | 1.00% | | 1.00% |
| Net investment income (loss) | | .54% | | .51% | | .30% | | .07% | | .21% |
| Supplemental Data | | | | | | | | | | |
| Net assets, end of period (000 omitted) | $ | 1,821,120 | $ | 1,441,605 | $ | 1,373,850 | $ | 2,035,690 | $ | 1,382,837 |
Portfolio turnover rate F | | | | 22% | | 22% | | 21% | | 23% |
ACalculated based on average shares outstanding during the period.
BNet investment income (loss) is affected by the timing of the declaration of dividends by any underlying mutual funds or exchange-traded funds (ETFs). Net investment income (loss) of any mutual funds or ETFs is not included in the Fund's net investment income (loss) ratio.
CTotal returns would have been lower if certain expenses had not been reduced during the applicable periods shown.
DFees and expenses of any underlying mutual funds or exchange-traded funds (ETFs) are not included in the Fund's expense ratio. The Fund indirectly bears its proportionate share of these expenses. For additional expense information related to investments in Fidelity Central Funds, please refer to the "Investments in Fidelity Central Funds" note found in the Notes to Financial Statements section of the most recent Annual or Semi-Annual report.
EExpense ratios reflect operating expenses of the class. Expenses before reductions do not reflect amounts reimbursed, waived, or reduced through arrangements with the investment adviser, brokerage services, or other offset arrangements, if applicable, and do not represent the amount paid by the class during periods when reimbursements, waivers or reductions occur.
FAmount does not include the portfolio activity of any underlying mutual funds or exchange-traded funds (ETFs).
Fidelity Advisor® International Growth Fund Class Z |
| |
| Years ended October 31, | | 2024 | | 2023 | | 2022 | | 2021 | | 2020 |
Selected Per-Share Data | | | | | | | | | | |
| Net asset value, beginning of period | $ | 16.38 | $ | 15.05 | $ | 21.25 | $ | 16.19 | $ | 15.16 |
| Income from Investment Operations | | | | | | | | | | |
Net investment income (loss) A,B | | .14 | | .11 | | .08 | | .04 | | .05 |
| Net realized and unrealized gain (loss) | | 4.03 | | 1.51 | | (5.85) | | 5.06 | | 1.16 |
| Total from investment operations | | 4.17 | | 1.62 | | (5.77) | | 5.10 | | 1.21 |
| Distributions from net investment income | | (.12) | | (.06) | | (.11) | | (.04) | | (.18) |
| Distributions from net realized gain | | - | | (.23) | | (.32) | | - | | - |
| Total distributions | | (.12) | | (.29) | | (.43) | | (.04) | | (.18) |
| Net asset value, end of period | $ | 20.43 | $ | 16.38 | $ | 15.05 | $ | 21.25 | $ | 16.19 |
Total Return C | | | | 10.74% | | (27.68)% | | 31.55% | | 8.01% |
Ratios to Average Net Assets B,D,E | | | | | | | | | | |
| Expenses before reductions | | .79% | | .80% | | .89% | | .87% | | .88% |
| Expenses net of fee waivers, if any | | | | .79% | | .89% | | .87% | | .88% |
| Expenses net of all reductions | | .79% | | .79% | | .89% | | .87% | | .87% |
| Net investment income (loss) | | .67% | | .65% | | .43% | | .20% | | .34% |
| Supplemental Data | | | | | | | | | | |
| Net assets, end of period (000 omitted) | $ | 2,373,757 | $ | 1,394,806 | $ | 989,259 | $ | 1,277,877 | $ | 1,350,267 |
Portfolio turnover rate F | | | | 22% | | 22% | | 21% | | 23% |
ACalculated based on average shares outstanding during the period.
BNet investment income (loss) is affected by the timing of the declaration of dividends by any underlying mutual funds or exchange-traded funds (ETFs). Net investment income (loss) of any mutual funds or ETFs is not included in the Fund's net investment income (loss) ratio.
CTotal returns would have been lower if certain expenses had not been reduced during the applicable periods shown.
DFees and expenses of any underlying mutual funds or exchange-traded funds (ETFs) are not included in the Fund's expense ratio. The Fund indirectly bears its proportionate share of these expenses. For additional expense information related to investments in Fidelity Central Funds, please refer to the "Investments in Fidelity Central Funds" note found in the Notes to Financial Statements section of the most recent Annual or Semi-Annual report.
EExpense ratios reflect operating expenses of the class. Expenses before reductions do not reflect amounts reimbursed, waived, or reduced through arrangements with the investment adviser, brokerage services, or other offset arrangements, if applicable, and do not represent the amount paid by the class during periods when reimbursements, waivers or reductions occur.
FAmount does not include the portfolio activity of any underlying mutual funds or exchange-traded funds (ETFs).
Notes to Financial Statements
For the period ended October 31, 2024
1. Organization.
Fidelity International Growth Fund (the Fund) is a fund of Fidelity Investment Trust (the Trust) and is authorized to issue an unlimited number of shares. The Trust is registered under the Investment Company Act of 1940, as amended (the 1940 Act), as an open-end management investment company organized as a Massachusetts business trust. The Fund offers Class A, Class M, Class C, International Growth, Class I and Class Z shares, each of which has equal rights as to assets and voting privileges. Class A, Class M, Class C, Class I and Class Z are Fidelity Advisor classes. Each class has exclusive voting rights with respect to matters that affect that class. Class C shares will automatically convert to Class A shares after a holding period of eight years from the initial date of purchase, with certain exceptions.
2. Investments in Fidelity Central Funds.
Funds may invest in Fidelity Central Funds, which are open-end investment companies generally available only to other investment companies and accounts managed by the investment adviser and its affiliates. The Schedule of Investments lists any Fidelity Central Funds held as an investment as of period end, but does not include the underlying holdings of each Fidelity Central Fund. An investing fund indirectly bears its proportionate share of the expenses of the underlying Fidelity Central Funds.
Based on its investment objective, each Fidelity Central Fund may invest or participate in various investment vehicles or strategies that are similar to those of the investing fund. These strategies are consistent with the investment objectives of the investing fund and may involve certain economic risks which may cause a decline in value of each of the Fidelity Central Funds and thus a decline in the value of the investing fund.
| Fidelity Central Fund | Investment Manager | Investment Objective | Investment Practices | Expense RatioA |
| Fidelity Money Market Central Funds | Fidelity Management & Research Company LLC (FMR) | Each fund seeks to obtain a high level of current income consistent with the preservation of capital and liquidity. | Short-term Investments | Less than .005% |
A Expenses expressed as a percentage of average net assets and are as of each underlying Central Fund's most recent annual or semi-annual shareholder report.
A complete unaudited list of holdings for each Fidelity Central Fund is available upon request or at the Securities and Exchange Commission website at www.sec.gov. In addition, the financial statements of the Fidelity Central Funds which contain the significant accounting policies (including investment valuation policies) of those funds, and are not covered by the Report of Independent Registered Public Accounting Firm, are available on the Securities and Exchange Commission website or upon request.
3. Significant Accounting Policies.
The Fund is an investment company and applies the accounting and reporting guidance of the Financial Accounting Standards Board (FASB) Accounting Standards Codification Topic 946 Financial Services - Investment Companies. The financial statements have been prepared in conformity with accounting principles generally accepted in the United States of America (GAAP), which require management to make certain estimates and assumptions at the date of the financial statements. Actual results could differ from those estimates. Subsequent events, if any, through the date that the financial statements were issued have been evaluated in the preparation of the financial statements. The Fund's Schedule of Investments lists any underlying mutual funds or exchange-traded funds (ETFs) but does not include the underlying holdings of these funds. The following summarizes the significant accounting policies of the Fund:
Investment Valuation. Investments are valued as of 4:00 p.m. Eastern time on the last calendar day of the period. The Board of Trustees (the Board) has designated the Fund's investment adviser as the valuation designee responsible for the fair valuation function and performing fair value determinations as needed. The investment adviser has established a Fair Value Committee (the Committee) to carry out the day-to-day fair valuation responsibilities and has adopted policies and procedures to govern the fair valuation process and the activities of the Committee. In accordance with these fair valuation policies and procedures, which have been approved by the Board, the Fund attempts to obtain prices from one or more third party pricing services or brokers to value its investments. When current market prices, quotations or currency exchange rates are not readily available or reliable, investments will be fair valued in good faith by the Committee, in accordance with the policies and procedures. Factors used in determining fair value vary by investment type and may include market or investment specific events, transaction data, estimated cash flows, and market observations of comparable investments. The frequency that the fair valuation procedures are used cannot be predicted and they may be utilized to a significant extent. The Committee manages the Fund's fair valuation practices and maintains the fair valuation policies and procedures. The Fund's investment adviser reports to the Board information regarding the fair valuation process and related material matters.
The Fund categorizes the inputs to valuation techniques used to value its investments into a disclosure hierarchy consisting of three levels as shown below:
Level 1 - unadjusted quoted prices in active markets for identical investments
Level 2 - other significant observable inputs (including quoted prices for similar investments, interest rates, prepayment speeds, etc.)
Level 3 - unobservable inputs (including the Fund's own assumptions based on the best information available)
Valuation techniques used to value the Fund's investments by major category are as follows:
Equity securities, including restricted securities, for which market quotations are readily available, are valued at the last reported sale price or official closing price as reported by a third party pricing service on the primary market or exchange on which they are traded and are categorized as Level 1 in the hierarchy. In the event there were no sales during the day or closing prices are not available, securities are valued at the last quoted bid price or may be valued using the last available price and are generally categorized as Level 2 in the hierarchy. For foreign equity securities, when market or security specific events arise, comparisons to the valuation of American Depositary Receipts (ADRs), futures contracts, Exchange-Traded Funds (ETFs) and certain indexes as well as quoted prices for similar securities may be used and would be categorized as Level 2 in the hierarchy. For equity securities, including restricted securities, where observable inputs are limited, assumptions about market activity and risk are used and these securities may be categorized as Level 3 in the hierarchy.
Investments in open-end mutual funds, including the Fidelity Central Funds, are valued at their closing net asset value (NAV) each business day and are categorized as Level 1 in the hierarchy.
Changes in valuation techniques may result in transfers in or out of an assigned level within the disclosure hierarchy. The aggregate value of investments by input level as of October 31, 2024 is included at the end of the Fund's Schedule of Investments.
Foreign Currency. Certain Funds may use foreign currency contracts to facilitate transactions in foreign-denominated securities. Gains and losses from these transactions may arise from changes in the value of the foreign currency or if the counterparties do not perform under the contracts' terms.
Foreign-denominated assets, including investment securities, and liabilities are translated into U.S. dollars at the exchange rates at period end. Purchases and sales of investment securities, income and dividends received, and expenses denominated in foreign currencies are translated into U.S. dollars at the exchange rate in effect on the transaction date.
The effects of exchange rate fluctuations on investments are included with the net realized and unrealized gain (loss) on investment securities. Other foreign currency transactions resulting in realized and unrealized gain (loss) are disclosed separately.
Investment Transactions and Income. For financial reporting purposes, the Fund's investment holdings and NAV include trades executed through the end of the last business day of the period. The NAV per share for processing shareholder transactions is calculated as of the close of business of the New York Stock Exchange (NYSE), normally 4:00 p.m. Eastern time and includes trades executed through the end of the prior business day. Gains and losses on securities sold are determined on the basis of identified cost and include proceeds received from litigation. Commissions paid to certain brokers with whom the investment adviser, or its affiliates, places trades on behalf of a fund include an amount in addition to trade execution, which may be rebated back to a fund. Any such rebates are included in net realized gain (loss) on investments in the Statement of Operations. Dividend income is recorded on the ex-dividend date, except for certain dividends from foreign securities where the ex-dividend date may have passed, which are recorded as soon as the Fund is informed of the ex-dividend date. Non-cash dividends included in dividend income, if any, are recorded at the fair market value of the securities received. Income and capital gain distributions from Fidelity Central Funds, if any, are recorded on the ex-dividend date. Certain distributions received by the Fund represent a return of capital or capital gain. The Fund determines the components of these distributions subsequent to the ex-dividend date, based upon receipt of tax filings or other correspondence relating to the underlying investment. These distributions are recorded as a reduction of cost of investments and/or as a realized gain. Interest income is accrued as earned and includes coupon interest and amortization of premium and accretion of discount on debt securities as applicable. Investment income is recorded net of foreign taxes withheld where recovery of such taxes is uncertain. Funds may file withholding tax reclaims in certain jurisdictions to recover a portion of amounts previously withheld. Any withholding tax reclaims income is included in the Statement of Operations in foreign taxes withheld. Any receivables for withholding tax reclaims are included in the Statement of Assets and Liabilities in reclaims receivable. The Fund has filed tax reclaims for previously withheld taxes on dividends earned in certain European Union (EU) countries. These additional filings are subject to various administrative proceedings by the local jurisdictions' tax authorities within the EU, as well as a number of related judicial proceedings. Income recognized for EU reclaims is included with other reclaims in the Statement of Operations in foreign taxes withheld. These reclaims are recorded when the amount is known and there are no significant uncertainties on collectability.
Class Allocations and Expenses. Investment income, realized and unrealized capital gains and losses, common expenses of a fund, and certain fund-level expense reductions, if any, are allocated daily on a pro-rata basis to each class based on the relative net assets of each class to the total net assets of a fund. Each class differs with respect to transfer agent and distribution and service plan fees incurred, as applicable. Certain expense reductions may also differ by class, if applicable. For the reporting period, the allocated portion of income and expenses to each class as a percent of its average net assets may vary due to the timing of recording these transactions in relation to fluctuating net assets of the classes. Expenses directly attributable to a fund are charged to that fund. Expenses attributable to more than one fund are allocated among the respective funds on the basis of relative net assets or other appropriate methods. Expenses included in the accompanying financial statements reflect the expenses of that fund and do not include any expenses associated with any underlying mutual funds or exchange-traded funds (ETFs). Although not included in a fund's expenses, a fund indirectly bears its proportionate share of these expenses through the net asset value of each underlying mutual fund or exchange-traded fund (ETF). Expense estimates are accrued in the period to which they relate and adjustments are made when actual amounts are known.
Income Tax Information and Distributions to Shareholders. Each year, the Fund intends to qualify as a regulated investment company under Subchapter M of the Internal Revenue Code, including distributing substantially all of its taxable income and realized gains. As a result, no provision for U.S. Federal income taxes is required. As of October 31, 2024, the Fund did not have any unrecognized tax benefits in the financial statements; nor is the Fund aware of any tax positions for which it is reasonably possible that the total amounts of unrecognized tax benefits will significantly change in the next twelve months. The Fund files a U.S. federal tax return, in addition to state and local tax returns as required. The Fund's federal income tax returns are subject to examination by the Internal Revenue Service (IRS) for a period of three fiscal years after they are filed. State and local tax returns may be subject to examination for an additional fiscal year depending on the jurisdiction. Foreign taxes are provided for based on the Fund's understanding of the tax rules and rates that exist in the foreign markets in which it invests. The Fund is subject to a tax imposed on capital gains by certain countries in which it invests. An estimated deferred tax liability for net unrealized appreciation on the applicable securities is included in Other payables and accrued expenses on the Statement of Assets and Liabilities.
Distributions are declared and recorded on the ex-dividend date. Income and capital gain distributions are declared separately for each class. Income and capital gain distributions are determined in accordance with income tax regulations, which may differ from GAAP. In addition, the Fund claimed a portion of the payment made to redeeming shareholders as a distribution for income tax purposes.
Capital accounts within the financial statements are adjusted for permanent book-tax differences. These adjustments have no impact on net assets or the results of operations. Capital accounts are not adjusted for temporary book-tax differences which will reverse in a subsequent period.
Book-tax differences are primarily due to foreign currency transactions, certain foreign taxes, passive foreign investment companies (PFIC), capital loss carryforwards and losses deferred due to wash sales.
As of period end, the cost and unrealized appreciation (depreciation) in securities, and derivatives if applicable, for federal income tax purposes were as follows:
| Gross unrealized appreciation | $2,098,282,070 |
| Gross unrealized depreciation | (118,077,044) |
| Net unrealized appreciation (depreciation) | $1,980,205,026 |
| Tax Cost | $4,178,925,102 |
The tax-based components of distributable earnings as of period end were as follows:
| Undistributed ordinary income | $29,972,050 |
| Undistributed long-term capital gain | $21,953,411 |
| Net unrealized appreciation (depreciation) on securities and other investments | $1,980,416,469 |
The tax character of distributions paid was as follows:
| | October 31, 2024 | October 31, 2023 |
| Ordinary Income | $24,060,084 | $ 8,821,103 |
| Long-term Capital Gains | - | 54,229,492 |
| Total | $24,060,084 | $ 63,050,595 |
Restricted Securities (including Private Placements). Funds may invest in securities that are subject to legal or contractual restrictions on resale. These securities generally may be resold in transactions exempt from registration or to the public if the securities are registered. Disposal of these securities may involve time-consuming negotiations and expense, and prompt sale at an acceptable price may be difficult. Information regarding restricted securities held at period end is included at the end of the Schedule of Investments, if applicable.
New Accounting Pronouncement. In November 2023, the FASB issued Accounting Standards Update (ASU) 2023-07 Segment Reporting (Topic 280): Improvements to Reportable Segment Disclosures. Effective for fiscal years beginning after December 15, 2023 and interim periods within fiscal years beginning after December 15, 2024, the amendments enhance required disclosures of segment information for public entities on an annual and interim basis. The ASU allows for early adoption with updates applied retrospectively. Management is currently evaluating the impact of the ASU but does not expect this guidance to materially impact the financial statements.
4. Purchases and Sales of Investments.
Purchases and sales of securities, other than short-term securities and in-kind transactions, as applicable, are noted in the table below.
| | Purchases ($) | Sales ($) |
| Fidelity International Growth Fund | 2,243,066,310 | 1,661,088,083 |
5. Fees and Other Transactions with Affiliates.
Management Fee. Fidelity Management & Research Company LLC (the investment adviser) and its affiliates provide the Fund with investment management related services for which the Fund pays a monthly management fee.
Effective March 1, 2024, the Fund's management contract was amended to incorporate administrative services previously covered under separate services agreements (Transfer Agent and Accounting agreements). The amended contract incorporates a basic fee rate that may vary by class (subject to a performance adjustment). The investment adviser or an affiliate pays certain expenses of managing and operating the Fund out of each class's management fee. Each class of the Fund pays a management fee to the investment adviser. The management fee is calculated and paid to the investment adviser every month. The management fee is determined by calculating a basic fee and then applying a performance adjustment. When determining a class's basic fee, a mandate rate is calculated based on the monthly average net assets of a group of funds advised by FMR within a designated asset class. A discount rate is subtracted from the mandate rate once the Fund's monthly average net assets reach a certain level. The mandate rate and discount rate may vary by class. The annual basic fee rate for a class of shares of the Fund is the lesser of (1) the class's mandate rate reduced by the class's discount rate (if applicable) or (2) the amount set forth in the following table.
| | Maximum Management Fee Rate % |
| Class A | 0.87 |
| Class M | 0.87 |
| Class C | 0.87 |
| International Growth | 0.84 |
| Class I | 0.85 |
| Class Z | 0.71 |
One-twelfth of the basic fee rate for a class is applied to the average net assets of the class for the month, giving a dollar amount which is the basic fee for the class for that month. A different management fee rate may be applicable to each class of the Fund. The difference between classes is the result of separate arrangements for class-level services and/or waivers of certain expenses. It is not the result of any difference in advisory or custodial fees or other expenses related to the management of the Fund's assets, which do not vary by class. For the portion of the reporting period on or after March 1, 2024, the total annualized management fee rates were as follows:
| | Total Management Fee Rate % |
| Class A | .81 |
| Class M | .81 |
| Class C | .81 |
| International Growth | .77 |
| Class I | .81 |
| Class Z | .69 |
Prior to March 1, 2024, the management fee was the sum of an individual fund fee rate that was based on an annual rate of .45% of the Fund's average net assets and an annualized group fee rate that averaged .22% during the period. The group fee rate was based upon the monthly average net assets of a group of registered investment companies with which the investment adviser has management contracts. The group fee rate decreased as assets under management increased and increased as assets under management decreased. For the portion of the reporting period prior to March 1, 2024, the total annualized management fee rate was .67%.
The performance adjustment rate is calculated monthly by comparing over the performance period the Fund's performance to that of the performance adjustment index listed below.
| | Performance Adjustment Index |
| International Growth | MSCI EAFE Growth Index |
For the purposes of calculating the performance adjustment for the Fund, the Fund's investment performance is based on the performance of International Growth. To the extent that other classes of the Fund have higher expenses, this could result in those classes bearing a larger positive performance adjustment and smaller negative performance adjustment than would be the case if each class's own performance were considered. The performance period is the most recent 36 month period. The maximum annualized performance adjustment rate is ±.20% of the Fund's average net assets over the performance period. The performance adjustment rate is divided by twelve and multiplied by the Fund's average net assets over the performance period, and the resulting dollar amount is proportionately added to or subtracted from a class's basic fee. For the entire reporting period, the total annual performance adjustment was .08%.
Effective March 1, 2024, the Fund's sub-advisory agreements with FMR Investment Management (UK) Limited, Fidelity Management & Research (Hong Kong) Limited, and Fidelity Management & Research (Japan) Limited were amended to provide that the investment adviser pays each sub-adviser monthly fees equal to 110% of the sub-adviser's costs for providing sub-advisory services.
Effective March 1, 2024, the Fund's sub-advisory agreement with FIL Investment Advisors (FIA) was amended to provide that the investment adviser pays FIA monthly fees at an annual rate of 0.44% with respect to the average daily net assets of the Fund managed by FIA. FIA in turn pays FIA(UK)
Distribution and Service Plan Fees. In accordance with Rule 12b-1 of the 1940 Act, the Fund has adopted separate Distribution and Service Plans for each class of shares. Certain classes pay Fidelity Distributors Company LLC (FDC), an affiliate of the investment adviser, separate Distribution and Service Fees, each of which is based on an annual percentage of each class' average net assets. In addition, FDC may pay financial intermediaries for selling shares of the Fund and providing shareholder support services. For the period, the Distribution and Service Fee rates, total fees and amounts retained by FDC were as follows:
| | Distribution Fee | Service Fee | Total Fees ($) | Retained by FDC ($) |
| Class A | - % | .25% | 513,853 | 7,140 |
| Class M | .25% | .25% | 157,640 | 203 |
| Class C | .75% | .25% | 281,144 | 21,840 |
| | | | 952,637 | 29,183 |
Sales Load. FDC may receive a front-end sales charge of up to 5.75% for selling Class A shares and 3.50% for selling Class M shares, some of which is paid to financial intermediaries for selling shares of the Fund. Depending on the holding period, FDC may receive contingent deferred sales charges levied on Class A, Class M and Class C redemptions. The deferred sales charges are 1.00% for Class C shares, 1.00% for certain purchases of Class A shares and .25% for certain purchases of Class M shares.
For the period, sales charge amounts retained by FDC were as follows:
| | Retained by FDC ($) |
| Class A | 40,445 |
| Class M | 2,178 |
Class CA | 370 |
| | 42,993 |
A When Class C shares are initially sold, FDC pays commissions from its own resources to financial intermediaries through which the sales are made.
Transfer Agent Fees. Fidelity Investments Institutional Operations Company LLC (FIIOC), an affiliate of the investment adviser, is the transfer, dividend disbursing and shareholder servicing agent for each class of the Fund. Effective March 1, 2024, the Fund's management contract was amended to incorporate transfer agent services and associated fees previously covered under a separate services agreement. FIIOC pays for typesetting, printing and mailing of shareholder reports, except proxy statements.
During the period December 1, 2023 through February 29, 2024, the transfer agent fees for each class were a fixed annual rate of class-level average net assets as follows:
| | % of Class-Level Average Net Assets |
| Class A | .2000 |
| Class M | .2000 |
| Class C | .2000 |
| International Growth | .1672 |
| Class I | .1771 |
| Class Z | .0420 |
Prior to December 1, 2023, FIIOC received account fees and asset-based fees that varied according to the account size and type of account of the shareholders of the respective classes of the Fund, except for Class Z. FIIOC received an asset-based fee of Class Z's average net assets. For the portion of the reporting period prior to March 1, 2024, the fees were equivalent to the following annualized rates:
| | Amount ($) | % of Class-Level Average Net Assets |
| Class A | 130,920 | .20 |
| Class M | 20,774 | .20 |
| Class C | 19,864 | .20 |
| International Growth | 806,056 | .17 |
| Class I | 962,437 | .18 |
| Class Z | 199,518 | .04 |
| 2,139,569 | |
Accounting Fees. Fidelity Service Company, Inc. (FSC), an affiliate of the investment adviser, maintains the Fund's accounting records. Effective March 1, 2024, the Fund's management contract was amended to incorporate accounting services and associated fees previously covered under a separate services agreement.
During the period December 1, 2023 through February 29, 2024, the accounting fees were a fixed annual rate of average net assets as follows:
| | % of Average Net Assets |
| Fidelity International Growth Fund | .0302 |
Prior to December 1, 2023, the accounting fee was based on the level of average net assets for each month. For the portion of the reporting period prior to March 1, 2024, the fees were equivalent to the following annualized rates:
| | % of Average Net Assets |
| Fidelity International Growth Fund | .03 |
Brokerage Commissions. A portion of portfolio transactions were placed with brokerage firms which are affiliates of the investment adviser. Brokerage commissions are included in net realized gain (loss) and change in net unrealized appreciation (depreciation) in the Statement of Operations. The commissions paid to these affiliated firms were as follows:
| | Amount ($) |
| Fidelity International Growth Fund | 3,485 |
Interfund Lending Program. Pursuant to an Exemptive Order issued by the Securities and Exchange Commission (the SEC), the Fund, along with other registered investment companies having management contracts with Fidelity Management & Research Company LLC (FMR), or other affiliated entities of FMR, may participate in an interfund lending program. This program provides an alternative credit facility allowing the Fund to borrow from, or lend money to, other participating affiliated funds at rates that are beneficial to both the borrowing and lending fund. Borrowings under the program are generally for temporary or emergency purposes, including meeting fund shareholder redemptions. The interfund loan rate is determined, as specified in the Exemptive Order, by averaging, (1) the higher of the overnight time deposit rate and the current overnight repurchase agreement rate, and (2) a benchmark rate representing the lowest bank loan rate available to the funds. At period end, there were no interfund loans outstanding. Activity in this program during the period for which loans were outstanding was as follows:
| | Borrower or Lender | Average Loan Balance ($) | Weighted Average Interest Rate | Interest Expense ($) |
| Fidelity International Growth Fund | Borrower | 26,776,250 | 5.57% | 33,157 |
Interfund Trades. Funds may purchase from or sell securities to other Fidelity Funds under procedures adopted by the Board. The procedures have been designed to ensure these interfund trades are executed in accordance with Rule 17a-7 of the 1940 Act. Any interfund trades are included within the respective purchases and sales amounts shown in the Purchases and Sales of Investments note. Interfund trades during the period are noted in the table below.
| | Purchases ($) | Sales ($) | Realized Gain (Loss)($) |
| Fidelity International Growth Fund | 136,957,586 | 58,113,145 | 5,295,270 |
6. Committed Line of Credit.
Certain Funds participate with other funds managed by the investment adviser or an affiliate in a $4.25 billion credit facility (the "line of credit") to be utilized for temporary or emergency purposes to fund shareholder redemptions or for other short-term liquidity purposes. The participating funds have agreed to pay commitment fees on their pro-rata portion of the line of credit, which are reflected in Miscellaneous expenses on the Statement of Operations, and are listed below. During the period, there were no borrowings on this line of credit.
| | Amount ($) |
| Fidelity International Growth Fund | 8,435 |
7. Security Lending.
Funds lend portfolio securities from time to time in order to earn additional income. Lending agents are used, including National Financial Services (NFS), an affiliate of the investment adviser. Pursuant to a securities lending agreement, NFS will receive a fee, which is capped at 9.9% of a fund's daily lending revenue, for its services as lending agent. A fund may lend securities to certain qualified borrowers, including NFS. On the settlement date of the loan, a fund receives collateral (in the form of U.S. Treasury obligations, letters of credit and/or cash) against the loaned securities and maintains collateral in an amount not less than 100% of the market value of the loaned securities during the period of the loan. The market value of the loaned securities is determined at the close of business of a fund and any additional required collateral is delivered to a fund on the next business day. A fund or borrower may terminate the loan at any time, and if the borrower defaults on its obligation to return the securities loaned because of insolvency or other reasons, a fund may apply collateral received from the borrower against the obligation. A fund may experience delays and costs in recovering the securities loaned. Any cash collateral received is invested in the Fidelity Securities Lending Cash Central Fund. Any loaned securities are identified as such in the Schedule of Investments, and the value of loaned securities and cash collateral at period end, as applicable, are presented in the Statement of Assets and Liabilities. Security lending income represents the income earned on investing cash collateral, less rebates paid to borrowers and any lending agent fees associated with the loan, plus any premium payments received for lending certain types of securities. Security lending income is presented in the Statement of Operations as a component of income from Fidelity Central Funds. Affiliated security lending activity, if any, was as follows:
| | Total Security Lending Fees Paid to NFS ($) | Security Lending Income From Securities Loaned to NFS ($) | Value of Securities Loaned to NFS at Period End ($) |
| Fidelity International Growth Fund | 28,819 | - | - |
8. Expense Reductions.
Through arrangements with the Fund's custodian and each class' transfer agent, credits realized as a result of certain uninvested cash balances were used to reduce the Fund's expenses. During the period, custodian credits reduced the Fund's expenses by $1,752. During the period, transfer agent credits reduced each class' expenses as noted in the table below.
| | Expense reduction ($) |
| | |
| Class M | 72 |
In addition, during the period the investment adviser or an affiliate reimbursed and/or waived a portion of fund-level operating expenses in the amount of $218,044.
9. Distributions to Shareholders.
Distributions to shareholders of each class were as follows:
| | Year ended October 31, 2024 | Year ended October 31, 2023 |
| Fidelity International Growth Fund | | |
| Distributions to shareholders | | |
| Class A | $381,205 | $2,422,202 |
| Class M | - | 405,995 |
| Class C | - | 523,121 |
| International Growth | 7,052,424 | 20,712,364 |
| Class I | 7,886,338 | 22,283,776 |
| Class Z | 8,740,117 | 16,703,137 |
Total | $24,060,084 | $63,050,595 |
10. Share Transactions.
Share transactions for each class were as follows and may contain in-kind transactions, automatic conversions between classes or exchanges between affiliated funds:
| | Shares | Shares | Dollars | Dollars |
| | Year ended October 31, 2024 | Year ended October 31, 2023 | Year ended October 31, 2024 | Year ended October 31, 2023 |
| Fidelity International Growth Fund | | | | |
| Class A | | | | |
| Shares sold | 1,361,726 | 1,715,103 | $26,631,593 | $29,331,847 |
| Reinvestment of distributions | 21,028 | 147,890 | 380,612 | 2,418,006 |
| Shares redeemed | (1,854,663) | (1,838,431) | (36,470,900) | (31,184,405) |
| Net increase (decrease) | (471,909) | 24,562 | $(9,458,695) | $565,448 |
| Class M | | | | |
| Shares sold | 108,808 | 132,875 | $2,130,923 | $2,258,104 |
| Reinvestment of distributions | - | 25,006 | - | 405,854 |
| Shares redeemed | (234,072) | (248,334) | (4,543,640) | (4,205,991) |
| Net increase (decrease) | (125,264) | (90,453) | $(2,412,717) | $(1,542,033) |
| Class C | | | | |
| Shares sold | 107,281 | 198,976 | $2,006,178 | $3,272,412 |
| Reinvestment of distributions | - | 33,238 | - | 522,168 |
| Shares redeemed | (593,274) | (810,575) | (11,112,046) | (13,278,845) |
| Net increase (decrease) | (485,993) | (578,361) | $(9,105,868) | $(9,484,265) |
| International Growth | | | | |
| Shares sold | 14,283,815 | 14,951,508 | $286,244,273 | $259,687,765 |
| Reinvestment of distributions | 347,988 | 1,147,426 | 6,354,264 | 18,921,062 |
| Shares redeemed | (14,803,330) | (17,451,945) | (295,979,856) | (300,038,938) |
| Net increase (decrease) | (171,527) | (1,353,011) | $(3,381,319) | $(21,430,111) |
| Class I | | | | |
| Shares sold | 21,361,727 | 26,254,085 | $425,487,377 | $452,275,393 |
| Reinvestment of distributions | 424,789 | 1,326,495 | 7,735,409 | 21,820,838 |
| Shares redeemed | (20,686,405) | (30,872,229) | (410,163,686) | (525,218,348) |
| Net increase (decrease) | 1,100,111 | (3,291,649) | $23,059,100 | $(51,122,117) |
| Class Z | | | | |
| Shares sold | 68,973,110 | 46,420,503 | $1,408,702,342 | $799,082,627 |
| Reinvestment of distributions | 267,865 | 410,878 | 4,883,179 | 6,767,160 |
| Shares redeemed | (38,217,356) | (27,405,076) | (741,733,645) | (457,433,954) |
| Net increase (decrease) | 31,023,619 | 19,426,305 | $671,851,876 | $348,415,833 |
11. Other.
A fund's organizational documents provide former and current trustees and officers with a limited indemnification against liabilities arising in connection with the performance of their duties to the fund. In the normal course of business, a fund may also enter into contracts that provide general indemnifications. A fund's maximum exposure under these arrangements is unknown as this would be dependent on future claims that may be made against a fund. The risk of material loss from such claims is considered remote.
12. Risk and Uncertainties.
Many factors affect a fund's performance. Developments that disrupt global economies and financial markets, such as pandemics, epidemics, outbreaks of infectious diseases, war, terrorism, and environmental disasters, may significantly affect a fund's investment performance. The effects of these developments to a fund will be impacted by the types of securities in which a fund invests, the financial condition, industry, economic sector, and geographic location of an issuer, and a fund's level of investment in the securities of that issuer. Significant concentrations in security types, issuers, industries, sectors, and geographic locations may magnify the factors that affect a fund's performance.
Report of Independent Registered Public Accounting Firm
To the Board of Trustees of Fidelity Investment Trust and Shareholders of Fidelity International Growth Fund
Opinion on the Financial Statements
We have audited the accompanying statement of assets and liabilities, including the schedule of investments, of Fidelity International Growth Fund (one of the funds constituting Fidelity Investment Trust, referred to hereafter as the "Fund") as of October 31, 2024, the related statement of operations for the year ended October 31, 2024, the statement of changes in net assets for each of the two years in the period ended October 31, 2024, including the related notes, and the financial highlights for each of the five years in the period ended October 31, 2024 (collectively referred to as the "financial statements"). In our opinion, the financial statements present fairly, in all material respects, the financial position of the Fund as of October 31, 2024, the results of its operations for the year then ended, the changes in its net assets for each of the two years in the period ended October 31, 2024 and the financial highlights for each of the five years in the period ended October 31, 2024 in conformity with accounting principles generally accepted in the United States of America.
Basis for Opinion
These financial statements are the responsibility of the Fund's management. Our responsibility is to express an opinion on the Fund's financial statements based on our audits. We are a public accounting firm registered with the Public Company Accounting Oversight Board (United States) (PCAOB) and are required to be independent with respect to the Fund in accordance with the U.S. federal securities laws and the applicable rules and regulations of the Securities and Exchange Commission and the PCAOB.
We conducted our audits of these financial statements in accordance with the standards of the PCAOB. Those standards require that we plan and perform the audit to obtain reasonable assurance about whether the financial statements are free of material misstatement, whether due to error or fraud.
Our audits included performing procedures to assess the risks of material misstatement of the financial statements, whether due to error or fraud, and performing procedures that respond to those risks. Such procedures included examining, on a test basis, evidence regarding the amounts and disclosures in the financial statements. Our audits also included evaluating the accounting principles used and significant estimates made by management, as well as evaluating the overall presentation of the financial statements. Our procedures included confirmation of securities owned as of October 31, 2024 by correspondence with the custodian, issuers of privately offered securities and brokers; when replies were not received from brokers, we performed other auditing procedures. We believe that our audits provide a reasonable basis for our opinion.
/s/ PricewaterhouseCoopers LLP
Boston, Massachusetts
December 16, 2024
We have served as the auditor of one or more investment companies in the Fidelity group of funds since 1932.
Distributions
(Unaudited)The dividend and capital gains distributions for the fund(s) are available on Fidelity.com or Institutional.Fidelity.com.
The fund hereby designates as a capital gain dividend with respect to the taxable year ended October 31 2024, $29,329,886, or, if subsequently determined to be different, the net capital gain of such year.
Class A designates 67%, Fidelity International Growth Fund designates 34%, Class I designates 34%, and Class Z designates 27% of the dividends distributed, in December, respectively during the fiscal year as qualifying for the dividends-received deduction for corporate shareholders.
Class A, Fidelity International Growth Fund, Class I, and Class Z designate 100% of the dividends, in December, distributed during the fiscal year as amounts which may be taken into account as a dividend for purposes of the maximum rate under section 1(h)(11) of the Internal Revenue Code.
The amounts per share which represent income derived from sources within, and taxes paid to, foreign countries or possessions of the United States are as follows:
| | Pay Date | Income | Taxes |
| Fidelity International Growth Fund | | | |
| Class A | 12/11/23 | $0.0448 | $0.0192 |
| Class M | 12/11/23 | $0.0000 | $0.0000 |
| Class C | 12/11/23 | $0.0000 | $0.0000 |
Fidelity International Growth Fund Class I Class Z | 12/11/23 12/11/23 12/11/23 | $0.0895 $0.0886 $0.1106 | $0.0192 $0.0192 $0.0192 |
The fund will notify shareholders in January 2025 of amounts for use in preparing 2024 income tax returns.
Item 8: Changes in and Disagreements with Accountants for Open-End Management Investment Companies
(Unaudited)
Note: This is not applicable for any fund included in this document.
Item 9: Proxy Disclosures for Open-End Management Investment Companies
(Unaudited)
| A special meeting of shareholders was held on July 16, 2024. The results of votes taken among shareholders on the proposal before them are reported below. Each vote reported represents one dollar of net asset value held on the record date for the meeting. |
| Proposal 1 |
| To elect a Board of Trustees. |
| | # of Votes | % of Votes |
| Bettina Doulton |
| Affirmative | 128,529,177,643.56 | 98.18 |
| Withheld | 2,378,037,364.30 | 1.82 |
| TOTAL | 130,907,215,007.85 | 100.00 |
| Robert A. Lawrence |
| Affirmative | 128,253,389,899.05 | 97.97 |
| Withheld | 2,653,825,108.81 | 2.03 |
| TOTAL | 130,907,215,007.85 | 100.00 |
| Vijay C. Advani |
| Affirmative | 128,531,418,228.19 | 98.19 |
| Withheld | 2,375,796,779.66 | 1.81 |
| TOTAL | 130,907,215,007.85 | 100.00 |
| Thomas P. Bostick |
| Affirmative | 128,495,261,591.41 | 98.16 |
| Withheld | 2,411,953,416.44 | 1.84 |
| TOTAL | 130,907,215,007.85 | 100.00 |
| Donald F. Donahue |
| Affirmative | 128,407,878,996.00 | 98.09 |
| Withheld | 2,499,336,011.85 | 1.91 |
| TOTAL | 130,907,215,007.85 | 100.00 |
| Vicki L. Fuller |
| Affirmative | 128,625,540,095.19 | 98.26 |
| Withheld | 2,281,674,912.66 | 1.74 |
| TOTAL | 130,907,215,007.85 | 100.00 |
| Patricia L. Kampling |
| Affirmative | 128,668,729,281.34 | 98.29 |
| Withheld | 2,238,485,726.51 | 1.71 |
| TOTAL | 130,907,215,007.85 | 100.00 |
| Thomas A. Kennedy |
| Affirmative | 128,499,824,239.79 | 98.16 |
| Withheld | 2,407,390,768.06 | 1.84 |
| TOTAL | 130,907,215,007.85 | 100.00 |
| Oscar Munoz |
| Affirmative | 128,386,109,391.05 | 98.07 |
| Withheld | 2,521,105,616.80 | 1.93 |
| TOTAL | 130,907,215,007.85 | 100.00 |
| Karen B. Peetz |
| Affirmative | 128,603,731,113.82 | 98.24 |
| Withheld | 2,303,483,894.03 | 1.76 |
| TOTAL | 130,907,215,007.85 | 100.00 |
| David M. Thomas |
| Affirmative | 128,384,899,342.98 | 98.07 |
| Withheld | 2,522,315,664.88 | 1.93 |
| TOTAL | 130,907,215,007.85 | 100.00 |
| Susan Tomasky |
| Affirmative | 128,556,148,461.60 | 98.20 |
| Withheld | 2,351,066,546.25 | 1.80 |
| TOTAL | 130,907,215,007.85 | 100.00 |
| Michael E. Wiley |
| Affirmative | 128,264,934,978.34 | 97.98 |
| Withheld | 2,642,280,029.51 | 2.02 |
| TOTAL | 130,907,215,007.85 | 100.00 |
| | | |
| Proposal 1 reflects trust-wide proposal and voting results. |
Item 10: Remuneration Paid to Directors, Officers, and others of Open-End Management Investment Companies
(Unaudited)
Note: This information is disclosed as part of the financial statements for each Fund as part of Item 7: Financial Statements and Financial Highlights for Open-End Management Investment companies.
Item 11: Statement Regarding Basis for Approval of Investment Advisory Contract
(Unaudited)
Board Approval of Investment Advisory Contracts and Management Fees
Fidelity International Growth Fund
Each year, the Board of Trustees, including the Independent Trustees (together, the Board), considers the renewal of the fund's management contract with Fidelity Management & Research Company LLC (FMR) and certain affiliates and the sub-advisory agreements (together, the Advisory Contracts) for the fund. FMR and the sub-advisers are referred to herein as the Investment Advisers. The Board, assisted by the advice of fund counsel and Independent Trustees' counsel, requests and considers a broad range of information relevant to the renewal of the Advisory Contracts throughout the year.
The Board meets regularly and, at each of its meetings, covers an extensive agenda of topics and materials and considers factors that are relevant to its annual consideration of the renewal of the fund's Advisory Contracts, including the services and support provided to the fund and its shareholders. The Board, acting directly and through its Committees (each of which is composed of and chaired by Independent Trustees), requests and receives information concerning the annual consideration of the renewal of the fund's Advisory Contracts. The Board also meets as needed to review matters specifically related to the Board's annual consideration of the renewal of the Advisory Contracts. Members of the Board may also meet with trustees of other Fidelity funds through joint ad hoc committees to discuss certain matters relevant to all of the Fidelity funds.
At its May 2024 meeting, the Board unanimously determined to renew the fund's Advisory Contracts. In reaching its determination, the Board considered all factors it believed relevant, including (i) the nature, extent, and quality of the services provided to the fund and its shareholders (including the investment performance of the fund); (ii) the competitiveness relative to peer funds of the fund's management fee and the total expense ratio of a representative class (the retail class, which was selected because it was the largest class without 12b-1 fees); (iii) the total costs of the services provided by and the profits realized by FMR and its affiliates (Fidelity) from its relationships with the fund; and (iv) the extent to which, if any, economies of scale exist and are realized as the fund grows, and whether any economies of scale are appropriately shared with fund shareholders. The Board also considered the broad range of investment choices available to shareholders from FMR's competitors and that the fund's shareholders have chosen to invest in the fund, which is part of the Fidelity family of funds. The Board's decision to renew the Advisory Contracts was not based on any single factor.
The Board reached a determination, with the assistance of fund counsel and Independent Trustees' counsel and through the exercise of its business judgment, that the renewal of the Advisory Contracts was in the best interests of the fund and its shareholders and that the compensation payable under the Advisory Contracts was fair and reasonable in light of all of the surrounding circumstances.
Nature, Extent, and Quality of Services Provided. The Board considered staffing as it relates to the fund, including the backgrounds and experience of investment personnel of the Investment Advisers, and also considered the Investment Advisers' implementation of the fund's investment program. The Independent Trustees also had discussions with senior management of Fidelity's investment operations and investment groups. The Board considered the structure of the investment personnel compensation program and whether this structure provides appropriate incentives to act in the best interests of the fund. Additionally, the Board considered the portfolio managers' investments, if any, in the funds that they manage.
Resources Dedicated to Investment Management and Support Services. The Board and the Fund Oversight and Research Committees reviewed the general qualifications and capabilities of Fidelity's investment staff, including its size, education, experience, and resources, as well as Fidelity's approach to recruiting, training, managing, and compensating investment personnel. The Board noted the resources devoted to expansion of Fidelity's global investment organization, and that Fidelity's analysts have extensive resources, tools, and capabilities that allow them to conduct sophisticated quantitative and fundamental analysis, as well as credit analysis of issuers, counterparties, and guarantors. Further, the Board considered that Fidelity's investment professionals have sufficient access to global information and data so as to provide competitive investment results over time, and that those professionals also have access to sophisticated tools that permit them to assess portfolio construction and risk and performance attribution characteristics continuously, as well as to transmit new information and research conclusions rapidly around the world. Additionally, in its deliberations, the Board considered Fidelity's trading, risk management, compliance, and technology and operations capabilities and resources, which are integral parts of the investment management process.
Shareholder and Administrative Services. The Board considered (i) the nature, extent, quality, and cost of advisory, administrative, shareholder, transfer agency, and pricing and bookkeeping services performed by the Investment Advisers and their affiliates under the Advisory Contracts; (ii) the nature and extent of Fidelity's supervision of third party service providers, principally custodians, subcustodians, and pricing vendors; and (iii) the resources devoted by Fidelity to, and the record of compliance with, the fund's compliance policies and procedures. The Board also reviewed the allocation of fund brokerage, including allocations to brokers affiliated with the Investment Advisers, the use of brokerage commissions to pay fund expenses, and the use of "soft" commission dollars to pay for research services. The Board also considered the fund's securities lending activities and any payments made to Fidelity relating to securities lending under a separate agreement.
The Board noted that the growth of fund assets over time across the complex allows Fidelity to reinvest in the development of services designed to enhance the value and convenience of the Fidelity funds as investment vehicles. These services include 24-hour access to account information and market information over the Internet and through telephone representatives, investor education materials, and asset allocation tools. The Board also considered that it reviews customer service metrics such as telephone response times, continuity of services on the website and metrics addressing services at Fidelity Investor Centers.
Investment in a Large Fund Family. The Board considered the benefits to shareholders of investing in a fund that is part of a large family of funds offering a variety of investment disciplines and providing a large variety of fund investor services. The Board noted that Fidelity had taken, or had made recommendations that resulted in the Fidelity funds taking, a number of actions over the previous year that benefited particular funds and/or the Fidelity funds in general.
Investment Performance. The Board took into account discussions that occur with representatives of the Investment Advisers, and reports that it receives, at Board meetings throughout the year, relating to fund investment performance. In this regard the Board noted that as part of regularly scheduled fund reviews and other reports to the Board on fund performance, the Board considered annualized return information for the fund for different time periods, measured against an appropriate securities market index (benchmark index) and an appropriate peer group of funds with similar objectives (peer group). The Board also considered information about performance attribution. In its ongoing evaluation of fund investment performance, the Board gives particular attention to information indicating changes in performance of the funds over different time periods and discussed with the Investment Advisers the reasons for any overperformance or underperformance.
In addition to reviewing absolute and relative fund performance, the Independent Trustees periodically consider the appropriateness of fund performance metrics in evaluating the results achieved. The Independent Trustees generally give greater weight to fund performance over longer time periods than over shorter time periods. Depending on the circumstances, the Independent Trustees may be satisfied with a fund's performance notwithstanding that it lags its benchmark index or peer group for certain periods.
Based on its review, the Board concluded that the nature, extent, and quality of services provided to the fund under the Advisory Contracts should continue to benefit the shareholders of the fund.
Competitiveness of Management Fee and Total Expense Ratio. The Board was provided with information regarding industry trends in management fees and expenses. The Board considered that, effective March 1, 2024, an amended Advisory Contract with FMR went into effect with class-level management fees based on tiered schedules and subject to a maximum class-level rate (the management fee). The Board also considered that in exchange for the variable management fee, each class of the fund receives investment advisory, management, administrative, transfer agent, and pricing and bookkeeping services. In its review of the management fee and total expense ratio of the retail class, the Board considered a pro forma management fee rate for the retail class as if it had been in effect for the 12-month period ended September 30, 2023, as well as other third-party fund expenses, as applicable, such as custodial, legal, and audit fees and any fund-paid 12b-1 fees. The Board noted that Fidelity may agree to waive fees or reimburse expenses from time to time, and the extent to which, if any, it has done so for the fund. The Board also considered information about the impact of the fund's performance adjustment.
Comparisons of Management Fees and Total Expense Ratios. Among other things, the Board reviewed data for selected groups of competitive funds and classes (referred to as "mapped groups") that were compiled by Fidelity based on combining similar investment objective categories (as classified by Morningstar) that have comparable investment mandates. The data reviewed by the Board included (i) gross management fee comparisons (before taking into account expense reimbursements or caps and without taking into account the fund's performance adjustment) relative to the total universe of funds within the mapped group; (ii) gross management fee comparisons relative to a subset of non-Fidelity funds in the mapped group that are similar in size and management fee structure to the fund (referred to as the "asset size peer group"); (iii) total expense comparisons of the retail class of the fund relative to funds and classes in the mapped group that have a similar sales load structure to the retail class of the fund (referred to as the "similar sales load structure group"); and (iv) total expense comparisons of the retail class of the fund relative to funds and classes in the similar sales load structure group that are similar in size and management fee structure to the fund (referred to as the "total expense asset size peer group"). The total expense asset size peer group comparison excludes performance adjustments and fund-paid 12b-1 fees to eliminate variability in fee structures.
The information provided to the Board indicated that the fund's management fee rate ranked below the competitive median of the mapped group for the 12-month period ended September 30, 2023 and above the competitive median of the asset size peer group for the 12-month period ended September 30, 2023. Further, the information provided to the Board indicated that the total expense ratio of the retail class of the fund ranked below the competitive median of the similar sales load structure group for the 12-month period ended September 30, 2023 and below the competitive median of the total expense asset size peer group for the 12-month period ended September 30, 2023. The Board considered that the fund has a variable unified management fee that covers expenses for services beyond portfolio management.
The Board noted that a different variable management fee rate is applicable to each class of the fund. The Board considered that the difference in management fee rates between classes is the result of separate arrangements for class-level services and/or waivers of certain expenses and not the result of any difference in advisory or custodial fees or other expenses related to the management of the fund's assets, which do not vary by class.
The Board also considered that the fund's management fee is subject to upward or downward adjustment depending upon whether, and to what extent, the fund's investment performance for the performance period (a rolling 36-month period) exceeds, or is exceeded by, a securities index, thus leading to a performance adjustment for the same period. The Board noted that the performance adjustment provides FMR with a strong economic incentive to seek to achieve superior long-term performance for the fund's shareholders and helps to more closely align the interests of FMR and the shareholders of the fund.
In connection with its consideration of the fund's performance adjustment, the Board noted that the performance of the retail class is used for purposes of determining the performance adjustment. The Board noted that to the extent the performance adjustment was based on the performance of a share class with higher total annual operating expenses, the fund would be subject to a smaller positive and larger negative performance adjustment. The Board considered the appropriateness of the use of the retail class as the basis for the performance adjustment. The Board noted that the retail class is typically the largest class (reflecting the actual investment experience for the plurality of shareholders), employs a standard expense structure, and does not include fund-paid 12b-1 fees, which Fidelity believes makes it a more appropriate measurement of Fidelity's investment skill.
Fees Charged to Other Fidelity Clients. The Board also considered Fidelity fee structures and other information with respect to clients of Fidelity, such as other funds advised or subadvised by Fidelity, pension plan clients, and other institutional clients with similar mandates. The Board noted that a joint ad hoc committee created by it and the boards of other Fidelity funds periodically reviews and compares Fidelity's institutional investment advisory business with its business of providing services to the Fidelity funds and also noted the most recent findings of the committee. The Board noted that the committee's review included a consideration of the differences in services provided, fees charged, and costs incurred, as well as competition in the markets serving the different categories of clients.
Based on its review, the Board concluded that the fund's management fee, including the use of the retail class as the basis for the performance adjustment, is fair and reasonable in light of the services that the fund receives and the other factors considered. Further, based on its review of total expense ratios and fees charged to other Fidelity clients, the Board concluded that the total expense ratio of each class of the fund was reasonable in light of the services that the fund and its shareholders receive and the other factors considered.
Costs of the Services and Profitability. The Board considered the revenues earned and the expenses incurred by Fidelity in conducting the business of developing, marketing, distributing, managing, administering and servicing the fund and servicing the fund's shareholders. The Board also considered the level of Fidelity's profits in respect of all the Fidelity funds.
On an annual basis, Fidelity presents to the Board information about the profitability of its relationships with the fund. Fidelity calculates profitability information for each fund, as well as aggregate profitability information for groups of Fidelity funds and all Fidelity funds, using a series of detailed revenue and cost allocation methodologies which originate with the books and records of Fidelity on which Fidelity's audited financial statements are based. The Audit Committee of the Board reviews any significant changes from the prior year's methodologies.
A public accounting firm has been engaged annually by the Board as part of the Board's assessment of Fidelity's profitability analysis. The engagement includes the review and assessment of the methodologies used by Fidelity in determining the revenues and expenses attributable to Fidelity's fund business, and completion of agreed-upon procedures in respect of the mathematical accuracy of certain fund profitability information and its conformity to established allocation methodologies. After considering the reports issued under the engagement and information provided by Fidelity, the Board concluded that while other allocation methods may also be reasonable, Fidelity's profitability methodologies are reasonable in all material respects.
The Board also reviewed Fidelity's non-fund businesses and potential indirect benefits such businesses may have received as a result of their association with Fidelity's fund business (i.e., fall-out benefits) as well as cases where Fidelity's affiliates may benefit from the funds' business. The Board considered areas where potential indirect benefits to the Fidelity funds from their relationships with Fidelity may exist. The Board's consideration of these matters was informed by the findings of a joint ad hoc committee created by it and the boards of other Fidelity funds to evaluate potential fall-out benefits.
The Board considered the costs of the services provided by and the profits realized by Fidelity in connection with the operation of the fund and was satisfied that the profitability was not excessive.
Economies of Scale. The Board considered whether there have been economies of scale in respect of the management of the Fidelity funds, whether the Fidelity funds (including the fund) have appropriately benefited from any such economies of scale, and whether there is potential for realization of any further economies of scale. The Board considered the extent to which the fund will benefit from economies of scale as assets grow through increased services to the fund, through waivers or reimbursements, or through fee or expense ratio reductions. The Board also noted that a committee created by it and the boards of other Fidelity funds periodically analyzes whether Fidelity attains economies of scale in respect of the management and servicing of the Fidelity funds, whether the Fidelity funds have appropriately benefited from such economies of scale, and whether there is potential for realization of any further economies of scale.
The Board recognized that the fund's management contract incorporates a variable management fee structure, which provides breakpoints as a way to share, in part, any potential economies of scale that may exist at the asset class level and through a discount that considers both fund size and total assets of the four applicable asset classes. The Board considered that the variable management fee is designed to deliver the benefits of economies of scale to fund shareholders even if assets of any particular fund are unchanged or have declined, because some portion of Fidelity's costs are attributable to services provided to all funds subject to the variable management fee, and all such funds benefit if those costs can be allocated among more assets. The Board concluded that, given the variable management fee structure, fund shareholders will benefit from lower management fees due to the application of the breakpoints and discount factor, regardless of whether Fidelity achieves any such economies of scale.
The Board concluded, taking into account the analysis of the committee, that economies of scale, if any, are being appropriately shared between fund shareholders and Fidelity.
Additional Information Requested by the Board. In order to develop fully the factual basis for consideration of the Fidelity funds' advisory contracts, the Board requested and received additional information on certain topics, including but not limited to: (i) fund flow and performance trends, in particular the underperformance of certain funds and strategies, and Fidelity's long-term strategies for certain funds; (ii) the operation of performance fees and the rationale for implementing performance fees on certain categories of funds but not others; (iii) Fidelity's pricing philosophy compared to competitors; (iv) fund profitability methodology and data; (v) evaluation of competitive fund data and peer group classifications and fee and expense comparisons; (vi) the management fee and expense structures for different funds and classes and information about the differences between various fee and expense structures; (vii) the variable management fee implemented for certain funds effective March 1, 2024; and (viii) information regarding other accounts managed by Fidelity and the funds' sub-advisory arrangements.
Conclusion. Based on its evaluation of all of the conclusions noted above, and after considering all factors it believed relevant, the Board, including the Independent Trustees, concluded that the advisory and sub-advisory fee arrangements are fair and reasonable in light of all of the surrounding circumstances and that the fund's Advisory Contracts should be renewed through May 31, 2025.
1.912350.114
IGF-ANN-1224
Fidelity® Total International Equity Fund
Annual Report
October 31, 2024
Includes Fidelity and Fidelity Advisor share classes
Contents
To view a fund's proxy voting guidelines and proxy voting record for the 12-month period ended June 30, visit http://www.fidelity.com/proxyvotingresults or visit the Securities and Exchange Commission's (SEC) web site at http://www.sec.gov.
You may also call 1-800-544-8544 if you're an individual investing directly with Fidelity, call 1-800-835-5092 if you're a plan sponsor or participant with Fidelity as your recordkeeper or call 1-877-208-0098 on institutional accounts or if you're an advisor or invest through one to request a free copy of the proxy voting guidelines.
Standard & Poor's, S&P and S&P 500 are registered service marks of The McGraw-Hill Companies, Inc. and have been licensed for use by Fidelity Distributors Corporation.
Other third-party marks appearing herein are the property of their respective owners.
All other marks appearing herein are registered or unregistered trademarks or service marks of FMR LLC or an affiliated company. © 2024 FMR LLC. All rights reserved.
This report and the financial statements contained herein are submitted for the general information of the shareholders of the Fund. This report is not authorized for distribution to prospective investors in the Fund unless preceded or accompanied by an effective prospectus.
A fund files its complete schedule of portfolio holdings with the SEC for the first and third quarters of each fiscal year on Form N-PORT. Forms N-PORT are available on the SEC's web site at http://www.sec.gov. A fund's Forms N-PORT may be reviewed and copied at the SEC's Public Reference Room in Washington, DC. Information regarding the operation of the SEC's Public Reference Room may be obtained by calling 1-800-SEC-0330.
For a complete list of a fund's portfolio holdings, view the most recent holdings listing, semiannual report, or annual report on Fidelity's web site at http://www.fidelity.com, http://www.institutional.fidelity.com, or http://www.401k.com, as applicable.
NOT FDIC INSURED •MAY LOSE VALUE •NO BANK GUARANTEE
Neither the Fund nor Fidelity Distributors Corporation is a bank.
Item 7: Financial Statements and Financial Highlights for Open-End Management Investment Companies (Annual Report)
Fidelity® Total International Equity Fund
Schedule of Investments October 31, 2024
Showing Percentage of Net Assets
| Common Stocks - 96.4% |
| | | Shares | Value ($) |
| Australia - 2.2% | | | |
| BHP Group Ltd. | | 74,391 | 2,066,774 |
| Commonwealth Bank of Australia | | 5,829 | 543,697 |
| Glencore PLC | | 318,801 | 1,671,997 |
| Imdex Ltd. | | 61,721 | 104,854 |
| Macquarie Group Ltd. | | 8,373 | 1,267,223 |
| Paladin Energy Ltd. (Australia) (a) | | 122,963 | 809,540 |
| Steadfast Group Ltd. | | 26,314 | 94,769 |
| Whitehaven Coal Ltd. | | 11,000 | 49,196 |
| Woodside Energy Group Ltd. | | 26,234 | 412,883 |
TOTAL AUSTRALIA | | | 7,020,933 |
| Bailiwick of Jersey - 0.0% | | | |
| JTC PLC (b) | | 4,700 | 62,301 |
| Belgium - 0.7% | | | |
| Azelis Group NV | | 19,563 | 387,928 |
| KBC Ancora | | 3,121 | 157,522 |
| KBC Group NV | | 11,699 | 848,542 |
| UCB SA | | 5,207 | 1,001,380 |
TOTAL BELGIUM | | | 2,395,372 |
| Brazil - 1.3% | | | |
| Gerdau SA sponsored ADR | | 434,963 | 1,357,085 |
| Itau Unibanco Holding SA | | 285,493 | 1,729,482 |
| Petroleo Brasileiro SA - Petrobras sponsored ADR | | 90,764 | 1,220,776 |
TOTAL BRAZIL | | | 4,307,343 |
| Canada - 6.3% | | | |
| Barrick Gold Corp. | | 69,924 | 1,350,932 |
| CAE, Inc. (a) | | 35,429 | 623,414 |
| Cameco Corp. | | 27,670 | 1,445,951 |
| Canadian Natural Resources Ltd. | | 31,930 | 1,085,852 |
| Canadian Pacific Kansas City Ltd. | | 58,708 | 4,528,909 |
| Constellation Software, Inc. | | 821 | 2,475,966 |
| Constellation Software, Inc. warrants 3/31/40 (a)(c) | | 921 | 0 |
| Franco-Nevada Corp. | | 13,397 | 1,778,313 |
| Intact Financial Corp. | | 5,900 | 1,126,735 |
| Nutrien Ltd. | | 16,669 | 794,811 |
| Osisko Gold Royalties Ltd. | | 6,079 | 122,335 |
| Pason Systems, Inc. | | 8,625 | 83,441 |
| Richelieu Hardware Ltd. | | 30,230 | 796,595 |
| Royal Bank of Canada | | 24,300 | 2,938,828 |
| Suncor Energy, Inc. | | 29,159 | 1,100,727 |
TOTAL CANADA | | | 20,252,809 |
| Chile - 0.4% | | | |
| Antofagasta PLC | | 57,814 | 1,291,176 |
| China - 9.3% | | | |
| China Construction Bank Corp. (H Shares) | | 1,969,677 | 1,528,935 |
| China Life Insurance Co. Ltd. (H Shares) | | 1,200,830 | 2,545,451 |
| Chlitina Holding Ltd. | | 9,477 | 41,699 |
| Haier Smart Home Co. Ltd. (A Shares) | | 674,600 | 2,771,407 |
| Hansoh Pharmaceutical Group Co. Ltd. (b) | | 679,734 | 1,584,834 |
| Kweichow Moutai Co. Ltd. (A Shares) | | 3,800 | 815,877 |
| Meituan Class B (a)(b) | | 138,652 | 3,276,398 |
| New Oriental Education & Technology Group, Inc. | | 215,212 | 1,346,809 |
| PDD Holdings, Inc. ADR (a) | | 19,193 | 2,314,484 |
| Shandong Sinocera Functional Material Co. Ltd. (A Shares) | | 159,200 | 427,058 |
| Shangri-La Asia Ltd. | | 1,136,271 | 820,797 |
| Shenzhen Inovance Technology Co. Ltd. (A Shares) | | 267,000 | 2,083,969 |
| Tencent Holdings Ltd. | | 153,953 | 8,027,437 |
| Tsingtao Brewery Co. Ltd. (H Shares) | | 107,934 | 694,997 |
| WuXi AppTec Co. Ltd. (H Shares) (b)(d) | | 213,705 | 1,421,209 |
TOTAL CHINA | | | 29,701,361 |
| Denmark - 1.7% | | | |
| DSV A/S | | 1,877 | 407,957 |
| Novo Nordisk A/S Series B | | 43,871 | 4,920,791 |
| Spar Nord Bank A/S | | 4,421 | 85,097 |
TOTAL DENMARK | | | 5,413,845 |
| Egypt - 0.0% | | | |
| Integrated Diagnostics Holdings PLC (a)(b) | | 57,949 | 28,859 |
| Finland - 0.5% | | | |
| Kone OYJ (B Shares) | | 10,284 | 562,230 |
| Mandatum Holding OY | | 15,224 | 70,280 |
| Sampo Oyj (A Shares) | | 22,653 | 1,002,881 |
TOTAL FINLAND | | | 1,635,391 |
| France - 6.5% | | | |
| Air Liquide SA | | 7,161 | 1,283,977 |
| Airbus Group NV | | 12,701 | 1,937,426 |
| Alten SA | | 3,114 | 263,190 |
| AXA SA | | 60,147 | 2,258,468 |
| BNP Paribas SA | | 19,048 | 1,300,865 |
| Capgemini SA | | 3,038 | 527,035 |
| Danone SA | | 17,653 | 1,261,105 |
| Edenred SA | | 16,968 | 545,403 |
| EssilorLuxottica SA | | 600 | 140,581 |
| Laurent-Perrier Group SA | | 393 | 42,962 |
| Lectra | | 11,652 | 323,199 |
| Legrand SA | | 14,076 | 1,588,736 |
| LISI | | 1,912 | 46,379 |
| LVMH Moet Hennessy Louis Vuitton SE | | 3,919 | 2,608,959 |
| Safran SA | | 16,911 | 3,828,070 |
| TotalEnergies SE | | 31,146 | 1,954,589 |
| Vetoquinol SA | | 1,238 | 107,596 |
| Vivendi SA | | 73,014 | 777,849 |
TOTAL FRANCE | | | 20,796,389 |
| Germany - 5.7% | | | |
| Bayer AG | | 7,225 | 194,692 |
| Bayerische Motoren Werke AG (BMW) | | 3,735 | 293,818 |
| Commerzbank AG | | 5,675 | 100,805 |
| Covestro AG (a)(b) | | 4,757 | 301,152 |
| CTS Eventim AG | | 4,403 | 461,934 |
| Daimler Truck Holding AG | | 8,411 | 347,756 |
| Deutsche Borse AG | | 5,726 | 1,330,026 |
| Deutsche Post AG ADR | | 19,846 | 797,205 |
| Fresenius SE & Co. KGaA (a) | | 22,366 | 815,495 |
| Hannover Reuck SE | | 4,011 | 1,053,656 |
| Muenchener Rueckversicherungs-Gesellschaft AG in Muenchen | | 3,144 | 1,607,780 |
| Nexus AG | | 2,020 | 105,798 |
| Rheinmetall AG | | 4,351 | 2,239,561 |
| RWE AG | | 19,038 | 616,495 |
| SAP SE | | 21,745 | 5,077,133 |
| Scout24 AG (b) | | 1,401 | 120,620 |
| Siemens AG | | 8,987 | 1,748,420 |
| Stabilus Se | | 967 | 38,235 |
| Vonovia SE | | 27,823 | 912,776 |
TOTAL GERMANY | | | 18,163,357 |
| Greece - 0.6% | | | |
| Athens International Airport SA | | 5,000 | 42,694 |
| National Bank of Greece SA | | 256,366 | 2,002,230 |
TOTAL GREECE | | | 2,044,924 |
| Hong Kong - 0.4% | | | |
| Pacific Basin Shipping Ltd. | | 2,598,723 | 715,731 |
| Prudential PLC | | 79,089 | 658,404 |
TOTAL HONG KONG | | | 1,374,135 |
| Hungary - 0.5% | | | |
| Richter Gedeon PLC | | 52,553 | 1,518,039 |
| India - 3.7% | | | |
| Axis Bank Ltd. | | 98,843 | 1,357,786 |
| HDFC Bank Ltd. | | 104,856 | 2,155,227 |
| ICICI Bank Ltd. | | 109,657 | 1,682,045 |
| Jio Financial Services Ltd. (a) | | 14,881 | 56,916 |
| JK Cement Ltd. | | 16,084 | 824,588 |
| Larsen & Toubro Ltd. | | 24,128 | 1,036,432 |
| Reliance Industries Ltd. (a) | | 11,101 | 174,269 |
| Reliance Industries Ltd. | | 11,101 | 175,524 |
| Reliance Industries Ltd. GDR (b) | | 14,311 | 895,869 |
| Solar Industries India Ltd. | | 6,118 | 741,897 |
| Tata Consultancy Services Ltd. | | 54,996 | 2,586,784 |
TOTAL INDIA | | | 11,687,337 |
| Indonesia - 0.2% | | | |
| PT Bank Central Asia Tbk | | 973,074 | 629,770 |
| Ireland - 0.2% | | | |
| AerCap Holdings NV | | 1,469 | 137,425 |
| Bank of Ireland Group PLC | | 44,003 | 405,027 |
| Cairn Homes PLC | | 22,004 | 50,958 |
| Irish Residential Properties REIT PLC | | 46,251 | 43,769 |
TOTAL IRELAND | | | 637,179 |
| Israel - 0.1% | | | |
| Ituran Location & Control Ltd. | | 3,644 | 97,404 |
| Tel Aviv Stock Exchange Ltd. | | 7,200 | 72,377 |
TOTAL ISRAEL | | | 169,781 |
| Italy - 2.0% | | | |
| Eni SpA | | 76,582 | 1,166,588 |
| Interpump Group SpA | | 17,624 | 782,923 |
| Mediobanca SpA | | 81,120 | 1,338,575 |
| Prada SpA | | 104,000 | 798,461 |
| Prysmian SpA | | 11,437 | 806,399 |
| Ryanair Holdings PLC sponsored ADR | | 10,823 | 479,026 |
| UniCredit SpA | | 24,240 | 1,072,359 |
TOTAL ITALY | | | 6,444,331 |
| Japan - 10.8% | | | |
| Ai Holdings Corp. | | 1,750 | 26,668 |
| Artnature, Inc. | | 5,300 | 28,849 |
| Aucnet, Inc. | | 3,000 | 46,824 |
| Azbil Corp. | | 171,600 | 1,334,355 |
| Broadleaf Co. Ltd. | | 16,100 | 59,575 |
| Central Automotive Products Ltd. | | 1,600 | 48,190 |
| Curves Holdings Co. Ltd. | | 18,700 | 98,977 |
| Daiichikosho Co. Ltd. | | 3,800 | 47,484 |
| Daikokutenbussan Co. Ltd. | | 800 | 55,430 |
| DENSO Corp. | | 113,233 | 1,608,304 |
| Eisai Co. Ltd. | | 3,492 | 118,309 |
| FUJIFILM Holdings Corp. | | 37,523 | 892,609 |
| Fujitec Co. Ltd. | | 3,700 | 133,134 |
| Fujitsu Ltd. | | 42,127 | 809,927 |
| Funai Soken Holdings, Inc. | | 1,750 | 27,854 |
| Gift Holdings, Inc. | | 2,400 | 50,585 |
| Goldcrest Co. Ltd. | | 5,560 | 108,368 |
| Hitachi Ltd. | | 107,222 | 2,693,938 |
| Hoya Corp. | | 10,613 | 1,419,956 |
| Ibiden Co. Ltd. | | 10,363 | 329,178 |
| INPEX Corp. | | 32,750 | 431,712 |
| Itochu Corp. | | 38,339 | 1,896,547 |
| Kansai Paint Co. Ltd. | | 3,500 | 57,003 |
| Keyence Corp. | | 5,584 | 2,520,694 |
| Komatsu Ltd. | | 20,600 | 533,237 |
| Koshidaka Holdings Co. Ltd. | | 19,200 | 150,608 |
| Kusuri No Aoki Holdings Co. Ltd. | | 2,900 | 60,357 |
| LY Corp. | | 74,215 | 202,443 |
| Medikit Co. Ltd. | | 2,800 | 51,470 |
| Minebea Mitsumi, Inc. | | 16,184 | 284,911 |
| Miroku Jyoho Service Co., Ltd. | | 2,600 | 30,967 |
| Misumi Group, Inc. | | 16,124 | 262,427 |
| Mitsubishi Heavy Industries Ltd. | | 112,752 | 1,591,715 |
| Mitsubishi UFJ Financial Group, Inc. | | 182,784 | 1,926,588 |
| Mitsuboshi Belting Ltd. | | 1,100 | 28,238 |
| Mitsui & Co. Ltd. | | 21,920 | 446,897 |
| Nagaileben Co. Ltd. | | 6,400 | 96,025 |
| Nihon Parkerizing Co. Ltd. | | 15,100 | 127,274 |
| Nintendo Co. Ltd. | | 7,170 | 378,741 |
| NOF Corp. | | 20,625 | 335,084 |
| NS Tool Co. Ltd. | | 4,100 | 19,804 |
| NSD Co. Ltd. | | 6,200 | 133,908 |
| OBIC Co. Ltd. | | 2,550 | 83,327 |
| ORIX Corp. | | 50,085 | 1,055,285 |
| Paramount Bed Holdings Co. Ltd. | | 2,400 | 41,475 |
| ProNexus, Inc. | | 4,000 | 33,951 |
| Recruit Holdings Co. Ltd. | | 46,200 | 2,821,089 |
| Renesas Electronics Corp. | | 57,134 | 765,500 |
| San-Ai Obbli Co. Ltd. | | 5,200 | 63,486 |
| Shin-Etsu Chemical Co. Ltd. | | 39,724 | 1,455,645 |
| SHO-BOND Holdings Co. Ltd. | | 17,380 | 611,403 |
| Shoei Co. Ltd. | | 2,000 | 30,692 |
| SK Kaken Co. Ltd. | | 2,200 | 127,790 |
| SoftBank Group Corp. | | 11,203 | 667,906 |
| Software Service, Inc. | | 600 | 49,865 |
| Sony Group Corp. | | 33,412 | 587,968 |
| Sumitomo Forestry Co. Ltd. | | 11,014 | 424,302 |
| Sumitomo Mitsui Financial Group, Inc. | | 87,059 | 1,846,917 |
| Techno Medica Co. Ltd. | | 500 | 5,919 |
| The Monogatari Corp. | | 3,860 | 90,780 |
| TIS, Inc. | | 16,928 | 422,124 |
| Tocalo Co. Ltd. | | 6,600 | 76,775 |
| Tokio Marine Holdings, Inc. | | 34,057 | 1,226,603 |
| USS Co. Ltd. | | 49,700 | 416,226 |
| WingArc1st, Inc. | | 1,500 | 31,954 |
| YAKUODO Holdings Co. Ltd. | | 4,000 | 55,633 |
| YONEX Co. Ltd. | | 3,400 | 42,545 |
TOTAL JAPAN | | | 34,540,324 |
| Korea (South) - 3.9% | | | |
| BGF Retail Co. Ltd. | | 631 | 52,969 |
| Hd Hyundai Mipo (a) | | 13,079 | 1,037,910 |
| Hyundai Mobis | | 6,287 | 1,133,681 |
| Hyundai Motor Co. Ltd. | | 4,750 | 734,041 |
| Korea Aerospace Industries Ltd. | | 54,165 | 2,291,922 |
| Samsung Biologics Co. Ltd. (a)(b) | | 2,025 | 1,469,359 |
| Samsung Electronics Co. Ltd. | | 133,876 | 5,703,125 |
TOTAL KOREA (SOUTH) | | | 12,423,007 |
| Malaysia - 0.3% | | | |
| CIMB Group Holdings Bhd | | 511,900 | 928,243 |
| Mexico - 1.7% | | | |
| Fomento Economico Mexicano S.A.B. de CV sponsored ADR | | 14,600 | 1,414,594 |
| Grupo Financiero Banorte S.A.B. de CV | | 108,427 | 754,998 |
| Wal-Mart de Mexico SA de CV Series V | | 1,190,457 | 3,273,392 |
TOTAL MEXICO | | | 5,442,984 |
| Netherlands - 2.3% | | | |
| Aalberts Industries NV | | 13,075 | 471,613 |
| ASML Holding NV (Netherlands) | | 6,922 | 4,677,267 |
| BE Semiconductor Industries NV | | 5,553 | 591,585 |
| IMCD NV | | 5,331 | 846,914 |
| Nebius Group NV Series A (a) | | 15,421 | 329,701 |
| Universal Music Group NV | | 11,470 | 288,656 |
TOTAL NETHERLANDS | | | 7,205,736 |
| Norway - 0.1% | | | |
| Kongsberg Gruppen ASA | | 2,015 | 209,739 |
| Medistim ASA | | 1,929 | 28,058 |
TOTAL NORWAY | | | 237,797 |
| Peru - 0.7% | | | |
| Credicorp Ltd. (United States) | | 12,304 | 2,265,536 |
| Philippines - 0.0% | | | |
| International Container Terminal Services, Inc. | | 6,500 | 43,995 |
| Poland - 0.7% | | | |
| Powszechna Kasa Oszczednosci Bank SA | | 159,500 | 2,223,496 |
| Russia - 0.0% | | | |
| LUKOIL PJSC sponsored ADR (a)(c) | | 15,040 | 0 |
| Sberbank of Russia sponsored ADR (a)(c) | | 62,556 | 1 |
TOTAL RUSSIA | | | 1 |
| Singapore - 0.4% | | | |
| United Overseas Bank Ltd. | | 48,004 | 1,166,932 |
| South Africa - 1.9% | | | |
| Anglo American PLC (United Kingdom) | | 35,046 | 1,086,441 |
| FirstRand Ltd. | | 452,951 | 1,990,129 |
| Impala Platinum Holdings Ltd. (a) | | 255,683 | 1,687,643 |
| MTN Group Ltd. | | 251,234 | 1,247,765 |
| Thungela Resources Ltd. | | 4,647 | 33,196 |
TOTAL SOUTH AFRICA | | | 6,045,174 |
| Spain - 1.2% | | | |
| Amadeus IT Holding SA Class A | | 8,582 | 621,716 |
| Banco Santander SA (Spain) | | 482,029 | 2,355,277 |
| Bankinter SA | | 50,629 | 412,487 |
| Cellnex Telecom SA (b) | | 15,672 | 574,491 |
| Fluidra SA | | 1,401 | 37,672 |
TOTAL SPAIN | | | 4,001,643 |
| Sweden - 3.4% | | | |
| Addlife AB B Shares | | 3,962 | 50,350 |
| AddTech AB (B Shares) | | 28,956 | 802,812 |
| ASSA ABLOY AB (B Shares) | | 48,513 | 1,519,560 |
| Atlas Copco AB (A Shares) | | 197,962 | 3,267,049 |
| Autoliv, Inc. | | 8,860 | 822,917 |
| Bergman & Beving AB (B Shares) | | 5,200 | 146,172 |
| Epiroc AB (A Shares) | | 65,317 | 1,275,661 |
| Hemnet Group AB | | 5,515 | 173,092 |
| Investor AB (B Shares) | | 62,352 | 1,764,130 |
| INVISIO AB | | 3,473 | 87,358 |
| John Mattson Fastighetsforetagen AB (a) | | 10,132 | 62,573 |
| Lagercrantz Group AB (B Shares) | | 45,994 | 897,040 |
TOTAL SWEDEN | | | 10,868,714 |
| Switzerland - 1.8% | | | |
| Schindler Holding AG: | | | |
| (participation certificate) | | 2,389 | 695,495 |
| (Reg.) | | 107 | 30,481 |
| Swiss Life Holding AG | | 1,059 | 863,829 |
| Tecan Group AG | | 214 | 54,024 |
| UBS Group AG | | 56,039 | 1,722,280 |
| UBS Group AG | | 15,410 | 472,779 |
| Zurich Insurance Group Ltd. | | 3,198 | 1,885,558 |
TOTAL SWITZERLAND | | | 5,724,446 |
| Taiwan - 4.8% | | | |
| Addcn Technology Co. Ltd. | | 14,662 | 84,957 |
| ECLAT Textile Co. Ltd. | | 88,293 | 1,480,633 |
| eMemory Technology, Inc. | | 800 | 78,041 |
| HIWIN Technologies Corp. | | 198,273 | 1,448,723 |
| Taiwan Semiconductor Manufacturing Co. Ltd. | | 345,291 | 10,863,399 |
| Yageo Corp. | | 85,917 | 1,466,071 |
TOTAL TAIWAN | | | 15,421,824 |
| United Arab Emirates - 0.4% | | | |
| Adnoc Gas PLC | | 1,353,300 | 1,219,538 |
| United Kingdom - 8.6% | | | |
| 3i Group PLC | | 11,222 | 460,189 |
| AstraZeneca PLC (United Kingdom) | | 7,990 | 1,136,926 |
| B&M European Value Retail SA | | 41,594 | 207,883 |
| BAE Systems PLC | | 242,600 | 3,910,059 |
| Baltic Classifieds Group PLC | | 28,300 | 115,130 |
| Barratt Developments PLC | | 237,329 | 1,366,091 |
| Beazley PLC | | 56,189 | 547,382 |
| Bodycote PLC | | 22,668 | 161,930 |
| Bunzl PLC | | 12,352 | 543,439 |
| Clarkson PLC | | 1,639 | 74,286 |
| Compass Group PLC | | 77,545 | 2,518,384 |
| Diploma PLC | | 1,600 | 87,848 |
| DP Poland PLC (a) | | 175,000 | 24,822 |
| Flutter Entertainment PLC (a) | | 1,279 | 299,166 |
| Games Workshop Group PLC | | 960 | 148,049 |
| Howden Joinery Group PLC | | 21,994 | 238,793 |
| HSBC Holdings PLC (United Kingdom) | | 156,650 | 1,437,737 |
| Imperial Brands PLC | | 29,474 | 889,467 |
| InterContinental Hotel Group PLC ADR | | 18,793 | 2,094,480 |
| JD Sports Fashion PLC | | 158,642 | 253,656 |
| Lloyds Banking Group PLC | | 1,847,058 | 1,267,821 |
| London Stock Exchange Group PLC | | 19,267 | 2,611,370 |
| Oxford Instruments PLC | | 3,100 | 85,942 |
| RELX PLC (London Stock Exchange) | | 31,284 | 1,434,675 |
| Rightmove PLC | | 34,877 | 264,796 |
| Rolls-Royce Holdings PLC (a) | | 112,078 | 773,383 |
| Sage Group PLC | | 52,940 | 661,746 |
| Spectris PLC | | 28,593 | 927,630 |
| Spirax-Sarco Engineering PLC | | 260 | 21,641 |
| Standard Chartered PLC (United Kingdom) | | 100,047 | 1,160,184 |
| Unilever PLC | | 27,577 | 1,682,253 |
| Unite Group PLC | | 6,500 | 73,379 |
TOTAL UNITED KINGDOM | | | 27,480,537 |
| United States of America - 11.1% | | | |
| CRH PLC | | 61,651 | 5,883,355 |
| Experian PLC | | 46,935 | 2,285,853 |
| Ferguson Enterprises, Inc. | | 3,827 | 756,000 |
| GE Vernova LLC | | 5,353 | 1,614,786 |
| GSK PLC | | 48,799 | 881,240 |
| Holcim AG | | 12,493 | 1,230,855 |
| Linde PLC | | 10,778 | 4,916,385 |
| Marsh & McLennan Companies, Inc. | | 9,223 | 2,012,828 |
| MasterCard, Inc. Class A | | 3,229 | 1,613,176 |
| Microsoft Corp. | | 1,608 | 653,411 |
| Moody's Corp. | | 4,392 | 1,994,144 |
| Morningstar, Inc. | | 974 | 319,521 |
| Nestle SA (Reg. S) | | 8,728 | 824,732 |
| Otis Worldwide Corp. | | 7,331 | 719,904 |
| PriceSmart, Inc. | | 3,706 | 307,894 |
| S&P Global, Inc. | | 3,929 | 1,887,334 |
| Shell PLC ADR | | 54,118 | 3,655,671 |
| Sherwin-Williams Co. | | 6,205 | 2,226,168 |
| Visa, Inc. Class A | | 5,690 | 1,649,247 |
TOTAL UNITED STATES OF AMERICA | | | 35,432,504 |
| TOTAL COMMON STOCKS (Cost $244,000,775) | | | 308,247,063 |
| | | | |
| Preferred Stocks - 0.2% |
| | | Shares | Value ($) |
| Convertible Preferred Stocks - 0.0% | | | |
| China - 0.0% | | | |
| ByteDance Ltd. Series E1 (a)(c)(e) | | 577 | 143,771 |
| Nonconvertible Preferred Stocks - 0.2% | | | |
| Germany - 0.2% | | | |
| Porsche Automobil Holding SE (Germany) | | 12,064 | 501,178 |
| TOTAL PREFERRED STOCKS (Cost $831,538) | | | 644,949 |
| | | | |
| Money Market Funds - 3.3% |
| | | Shares | Value ($) |
| Fidelity Cash Central Fund 4.87% (f) | | 9,754,165 | 9,756,116 |
| Fidelity Securities Lending Cash Central Fund 4.87% (f)(g) | | 897,457 | 897,547 |
| TOTAL MONEY MARKET FUNDS (Cost $10,653,659) | | | 10,653,663 |
| | | | |
| TOTAL INVESTMENT IN SECURITIES - 99.9% (Cost $255,485,972) | 319,545,675 |
NET OTHER ASSETS (LIABILITIES) - 0.1% | 213,663 |
| NET ASSETS - 100.0% | 319,759,338 |
| | |
Legend
| (b) | Security exempt from registration under Rule 144A of the Securities Act of 1933. These securities may be resold in transactions exempt from registration, normally to qualified institutional buyers. At the end of the period, the value of these securities amounted to $9,735,092 or 3.0% of net assets. |
| (d) | Security or a portion of the security is on loan at period end. |
| (e) | Restricted securities (including private placements) - Investment in securities not registered under the Securities Act of 1933 (excluding 144A issues). At the end of the period, the value of restricted securities (excluding 144A issues) amounted to $143,771 or 0.0% of net assets. |
| (f) | Affiliated fund that is generally available only to investment companies and other accounts managed by Fidelity Investments. The rate quoted is the annualized seven-day yield of the fund at period end. A complete unaudited listing of the fund's holdings as of its most recent quarter end is available upon request. In addition, each Fidelity Central Fund's financial statements, which are not covered by the Fund's Report of Independent Registered Public Accounting Firm, are available on the SEC's website or upon request. |
| (g) | Investment made with cash collateral received from securities on loan. |
| Additional information on each restricted holding is as follows: |
| Security | Acquisition Date | Acquisition Cost ($) |
| ByteDance Ltd. Series E1 | 11/18/20 | 63,224 |
| | | |
Affiliated Central Funds
Fiscal year to date information regarding the Fund's investments in Fidelity Central Funds, including the ownership percentage, is presented below.
| Affiliate | Value, beginning of period ($) | Purchases ($) | Sales Proceeds ($) | Dividend Income ($) | Realized Gain (loss) ($) | Change in Unrealized appreciation (depreciation) ($) | Value, end of period ($) | % ownership, end of period |
| Fidelity Cash Central Fund 4.87% | 5,162,285 | 134,447,931 | 129,854,003 | 395,604 | (98) | 1 | 9,756,116 | 0.0% |
| Fidelity Securities Lending Cash Central Fund 4.87% | 21,697 | 23,474,544 | 22,598,694 | 5,070 | - | - | 897,547 | 0.0% |
| Total | 5,183,982 | 157,922,475 | 152,452,697 | 400,674 | (98) | 1 | 10,653,663 | |
| | | | | | | | | |
Amounts in the dividend income column in the above table include any capital gain distributions from underlying funds, which are presented in the corresponding line item in the Statement of Operations, if applicable.
Amounts in the dividend income column for Fidelity Securities Lending Cash Central Fund represents the income earned on investing cash collateral, less rebates paid to borrowers and any lending agent fees associated with the loan, plus any premium payments received for lending certain types of securities.
Amounts included in the purchases and sales proceeds columns may include in-kind transactions, if applicable.
Investment Valuation
The following is a summary of the inputs used, as of October 31, 2024, involving the Fund's assets and liabilities carried at fair value. The inputs or methodology used for valuing securities may not be an indication of the risk associated with investing in those securities. For more information on valuation inputs, and their aggregation into the levels used below, please refer to the Investment Valuation section in the accompanying Notes to Financial Statements.
| Valuation Inputs at Reporting Date: |
| Description | Total ($) | Level 1 ($) | Level 2 ($) | Level 3 ($) |
Investments in Securities: | | | | |
|
| Equities: | | | | |
Communication Services | 13,906,773 | 2,817,613 | 10,945,389 | 143,771 |
Consumer Discretionary | 30,084,789 | 8,498,040 | 21,586,749 | - |
Consumer Staples | 11,502,210 | 5,038,842 | 6,463,368 | - |
Energy | 15,978,808 | 10,741,021 | 5,237,787 | - |
Financials | 75,451,463 | 38,656,653 | 36,794,809 | 1 |
Health Care | 17,242,250 | 3,850,180 | 13,392,070 | - |
Industrials | 64,261,013 | 22,060,167 | 42,200,846 | - |
Information Technology | 45,396,754 | 11,654,380 | 33,742,374 | - |
Materials | 33,250,592 | 21,252,567 | 11,998,025 | - |
Real Estate | 1,200,865 | 1,092,497 | 108,368 | - |
Utilities | 616,495 | 616,495 | - | - |
|
| Money Market Funds | 10,653,663 | 10,653,663 | - | - |
| Total Investments in Securities: | 319,545,675 | 136,932,118 | 182,469,785 | 143,772 |
Financial Statements
| Statement of Assets and Liabilities |
As of October 31, 2024 |
| Assets | | | | |
| Investment in securities, at value (including securities loaned of $852,761) - See accompanying schedule: | | | | |
Unaffiliated issuers (cost $244,832,313) | $ | 308,892,012 | | |
Fidelity Central Funds (cost $10,653,659) | | 10,653,663 | | |
| | | | | |
| | | | | |
| Total Investment in Securities (cost $255,485,972) | | | $ | 319,545,675 |
| Foreign currency held at value (cost $83,704) | | | | 83,776 |
| Receivable for investments sold | | | | 747,116 |
| Receivable for fund shares sold | | | | 1,052,099 |
| Dividends receivable | | | | 517,384 |
| Reclaims receivable | | | | 356,036 |
| Interest receivable | | | | 2 |
| Distributions receivable from Fidelity Central Funds | | | | 38,055 |
| Prepaid expenses | | | | 345 |
| Receivable from investment adviser for expense reductions | | | | 15,870 |
| Other receivables | | | | 20,905 |
Total assets | | | | 322,377,263 |
| Liabilities | | | | |
| Payable for investments purchased | $ | 1,081,408 | | |
| Payable for fund shares redeemed | | 79,190 | | |
| Accrued management fee | | 222,168 | | |
| Distribution and service plan fees payable | | 13,310 | | |
| Other payables and accrued expenses | | 324,302 | | |
| Collateral on securities loaned | | 897,547 | | |
| Total liabilities | | | | 2,617,925 |
| Net Assets | | | $ | 319,759,338 |
| Net Assets consist of: | | | | |
| Paid in capital | | | $ | 259,739,915 |
| Total accumulated earnings (loss) | | | | 60,019,423 |
| Net Assets | | | $ | 319,759,338 |
| | | | | |
| Net Asset Value and Maximum Offering Price | | | | |
| Class A : | | | | |
Net Asset Value and redemption price per share ($24,151,573 ÷ 2,039,868 shares)(a) | | | $ | 11.84 |
| Maximum offering price per share (100/94.25 of $11.84) | | | $ | 12.56 |
| Class M : | | | | |
Net Asset Value and redemption price per share ($13,014,764 ÷ 1,092,702 shares)(a) | | | $ | 11.91 |
| Maximum offering price per share (100/96.50 of $11.91) | | | $ | 12.34 |
| Class C : | | | | |
Net Asset Value and offering price per share ($2,950,388 ÷ 250,142 shares)(a) | | | $ | 11.79 |
| Total International Equity : | | | | |
Net Asset Value, offering price and redemption price per share ($163,406,321 ÷ 13,734,475 shares) | | | $ | 11.90 |
| Class I : | | | | |
Net Asset Value, offering price and redemption price per share ($69,378,591 ÷ 5,855,679 shares) | | | $ | 11.85 |
| Class Z : | | | | |
Net Asset Value, offering price and redemption price per share ($46,857,701 ÷ 3,926,912 shares) | | | $ | 11.93 |
(a)Redemption price per share is equal to net asset value less any applicable contingent deferred sales charge. |
| Statement of Operations |
| Year ended October 31, 2024 |
| Investment Income | | | | |
| Dividends | | | $ | 6,753,204 |
| Interest | | | | 65 |
| Income from Fidelity Central Funds (including $5,070 from security lending) | | | | 400,674 |
| Income before foreign taxes withheld | | | $ | 7,153,943 |
| Less foreign taxes withheld | | | | (572,167) |
| Total income | | | | 6,581,776 |
| Expenses | | | | |
| Management fee | | | | |
| Basic fee | $ | 2,173,418 | | |
| Performance adjustment | | 84,496 | | |
| Transfer agent fees | | 137,711 | | |
| Distribution and service plan fees | | 147,716 | | |
| Accounting fees | | 41,953 | | |
| Custodian fees and expenses | | 102,718 | | |
| Independent trustees' fees and expenses | | 1,214 | | |
| Registration fees | | 96,808 | | |
| Audit fees | | 104,166 | | |
| Legal | | 3,402 | | |
| Miscellaneous | | 6,578 | | |
| Total expenses before reductions | | 2,900,180 | | |
| Expense reductions | | (51,292) | | |
| Total expenses after reductions | | | | 2,848,888 |
| Net Investment income (loss) | | | | 3,732,888 |
| Realized and Unrealized Gain (Loss) | | | | |
| Net realized gain (loss) on: | | | | |
| Investment Securities: | | | | |
| Unaffiliated issuers (net of foreign taxes of $320,756) | | 4,401,730 | | |
| Fidelity Central Funds | | (98) | | |
| Foreign currency transactions | | (41,690) | | |
| Total net realized gain (loss) | | | | 4,359,942 |
| Change in net unrealized appreciation (depreciation) on: | | | | |
| Investment Securities: | | | | |
| Unaffiliated issuers (net of increase in deferred foreign taxes of $70,800) | | 50,006,009 | | |
| Fidelity Central Funds | | 1 | | |
| Assets and liabilities in foreign currencies | | (4,657) | | |
| Total change in net unrealized appreciation (depreciation) | | | | 50,001,353 |
| Net gain (loss) | | | | 54,361,295 |
| Net increase (decrease) in net assets resulting from operations | | | $ | 58,094,183 |
| Statement of Changes in Net Assets |
| |
| | Year ended October 31, 2024 | | Year ended October 31, 2023 |
| Increase (Decrease) in Net Assets | | | | |
| Operations | | | | |
| Net investment income (loss) | $ | 3,732,888 | $ | 3,409,289 |
| Net realized gain (loss) | | 4,359,942 | | (5,236,290) |
| Change in net unrealized appreciation (depreciation) | | 50,001,353 | | 20,080,804 |
| Net increase (decrease) in net assets resulting from operations | | 58,094,183 | | 18,253,803 |
| Distributions to shareholders | | (3,300,481) | | (1,806,040) |
| | | | | |
| Share transactions - net increase (decrease) | | 42,264,083 | | 52,136,162 |
| Total increase (decrease) in net assets | | 97,057,785 | | 68,583,925 |
| | | | | |
| Net Assets | | | | |
| Beginning of period | | 222,701,553 | | 154,117,628 |
| End of period | $ | 319,759,338 | $ | 222,701,553 |
| | | | | |
| | | | | |
Financial Highlights
Fidelity Advisor® Total International Equity Fund Class A |
| |
| Years ended October 31, | | 2024 | | 2023 | | 2022 | | 2021 | | 2020 |
Selected Per-Share Data | | | | | | | | | | |
| Net asset value, beginning of period | $ | 9.56 | $ | 8.56 | $ | 12.48 | $ | 9.60 | $ | 9.34 |
| Income from Investment Operations | | | | | | | | | | |
Net investment income (loss) A,B | | .13 | | .13 | | .15 | | .11 C | | .05 |
| Net realized and unrealized gain (loss) | | 2.27 | | .95 | | (3.10) | | 3.03 | | .35 |
| Total from investment operations | | 2.40 | | 1.08 | | (2.95) | | 3.14 | | .40 |
| Distributions from net investment income | | (.12) | | (.08) | | (.19) | | (.06) | | (.14) |
| Distributions from net realized gain | | - | | - | | (.77) | | (.20) | | - |
| Total distributions | | (.12) | | (.08) | | (.97) D | | (.26) | | (.14) |
| Net asset value, end of period | $ | 11.84 | $ | 9.56 | $ | 8.56 | $ | 12.48 | $ | 9.60 |
Total Return E,F | | | | 12.66% | | (25.44)% | | 33.04% | | 4.31% |
Ratios to Average Net Assets B,G,H | | | | | | | | | | |
| Expenses before reductions | | 1.28% | | 1.39% | | 1.56% | | 1.60% | | 1.66% |
| Expenses net of fee waivers, if any | | | | 1.29% | | 1.30% | | 1.34% | | 1.39% |
| Expenses net of all reductions | | 1.24% | | 1.29% | | 1.30% | | 1.34% | | 1.37% |
| Net investment income (loss) | | 1.11% | | 1.33% | | 1.55% | | .91% C | | .58% |
| Supplemental Data | | | | | | | | | | |
| Net assets, end of period (000 omitted) | $ | 24,152 | $ | 17,343 | $ | 12,786 | $ | 8,642 | $ | 6,091 |
Portfolio turnover rate I | | | | 28% | | 31% | | 39% | | 37% |
ACalculated based on average shares outstanding during the period.
BNet investment income (loss) is affected by the timing of the declaration of dividends by any underlying mutual funds or exchange-traded funds (ETFs). Net investment income (loss) of any mutual funds or ETFs is not included in the Fund's net investment income (loss) ratio.
CNet investment income per share reflects one or more large, non-recurring dividend(s) which amounted to $.03 per share. Excluding such non-recurring dividend(s), the ratio of net investment income (loss) to average net assets would have been .64%.
DTotal distributions per share do not sum due to rounding.
ETotal returns would have been lower if certain expenses had not been reduced during the applicable periods shown.
FTotal returns do not include the effect of the sales charges.
GFees and expenses of any underlying mutual funds or exchange-traded funds (ETFs) are not included in the Fund's expense ratio. The Fund indirectly bears its proportionate share of these expenses. For additional expense information related to investments in Fidelity Central Funds, please refer to the "Investments in Fidelity Central Funds" note found in the Notes to Financial Statements section of the most recent Annual or Semi-Annual report.
HExpense ratios reflect operating expenses of the class. Expenses before reductions do not reflect amounts reimbursed, waived, or reduced through arrangements with the investment adviser, brokerage services, or other offset arrangements, if applicable, and do not represent the amount paid by the class during periods when reimbursements, waivers or reductions occur.
IAmount does not include the portfolio activity of any underlying mutual funds or exchange-traded funds (ETFs).
Fidelity Advisor® Total International Equity Fund Class M |
| |
| Years ended October 31, | | 2024 | | 2023 | | 2022 | | 2021 | | 2020 |
Selected Per-Share Data | | | | | | | | | | |
| Net asset value, beginning of period | $ | 9.62 | $ | 8.61 | $ | 12.53 | $ | 9.65 | $ | 9.38 |
| Income from Investment Operations | | | | | | | | | | |
Net investment income (loss) A,B | | .10 | | .11 | | .13 | | .08 C | | .03 |
| Net realized and unrealized gain (loss) | | 2.28 | | .95 | | (3.12) | | 3.04 | | .36 |
| Total from investment operations | | 2.38 | | 1.06 | | (2.99) | | 3.12 | | .39 |
| Distributions from net investment income | | (.09) | | (.05) | | (.15) | | (.04) | | (.12) |
| Distributions from net realized gain | | - | | - | | (.77) | | (.20) | | - |
| Total distributions | | (.09) | | (.05) | | (.93) D | | (.24) | | (.12) |
| Net asset value, end of period | $ | 11.91 | $ | 9.62 | $ | 8.61 | $ | 12.53 | $ | 9.65 |
Total Return E,F | | | | 12.34% | | (25.59)% | | 32.63% | | 4.13% |
Ratios to Average Net Assets B,G,H | | | | | | | | | | |
| Expenses before reductions | | 1.52% | | 1.66% | | 1.80% | | 1.83% | | 1.90% |
| Expenses net of fee waivers, if any | | | | 1.54% | | 1.55% | | 1.59% | | 1.64% |
| Expenses net of all reductions | | 1.48% | | 1.54% | | 1.55% | | 1.59% | | 1.62% |
| Net investment income (loss) | | .87% | | 1.09% | | 1.29% | | .65% C | | .33% |
| Supplemental Data | | | | | | | | | | |
| Net assets, end of period (000 omitted) | $ | 13,015 | $ | 10,624 | $ | 9,876 | $ | 12,936 | $ | 10,620 |
Portfolio turnover rate I | | | | 28% | | 31% | | 39% | | 37% |
ACalculated based on average shares outstanding during the period.
BNet investment income (loss) is affected by the timing of the declaration of dividends by any underlying mutual funds or exchange-traded funds (ETFs). Net investment income (loss) of any mutual funds or ETFs is not included in the Fund's net investment income (loss) ratio.
CNet investment income per share reflects one or more large, non-recurring dividend(s) which amounted to $.03 per share. Excluding such non-recurring dividend(s), the ratio of net investment income (loss) to average net assets would have been .38%.
DTotal distributions per share do not sum due to rounding.
ETotal returns would have been lower if certain expenses had not been reduced during the applicable periods shown.
FTotal returns do not include the effect of the sales charges.
GFees and expenses of any underlying mutual funds or exchange-traded funds (ETFs) are not included in the Fund's expense ratio. The Fund indirectly bears its proportionate share of these expenses. For additional expense information related to investments in Fidelity Central Funds, please refer to the "Investments in Fidelity Central Funds" note found in the Notes to Financial Statements section of the most recent Annual or Semi-Annual report.
HExpense ratios reflect operating expenses of the class. Expenses before reductions do not reflect amounts reimbursed, waived, or reduced through arrangements with the investment adviser, brokerage services, or other offset arrangements, if applicable, and do not represent the amount paid by the class during periods when reimbursements, waivers or reductions occur.
IAmount does not include the portfolio activity of any underlying mutual funds or exchange-traded funds (ETFs).
Fidelity Advisor® Total International Equity Fund Class C |
| |
| Years ended October 31, | | 2024 | | 2023 | | 2022 | | 2021 | | 2020 |
Selected Per-Share Data | | | | | | | | | | |
| Net asset value, beginning of period | $ | 9.53 | $ | 8.53 | $ | 12.41 | $ | 9.57 | $ | 9.30 |
| Income from Investment Operations | | | | | | | | | | |
Net investment income (loss) A,B | | .04 | | .06 | | .08 | | .02 C | | (.02) |
| Net realized and unrealized gain (loss) | | 2.27 | | .95 | | (3.11) | | 3.02 | | .36 |
| Total from investment operations | | 2.31 | | 1.01 | | (3.03) | | 3.04 | | .34 |
| Distributions from net investment income | | (.05) | | (.01) | | (.07) | | - | | (.07) |
| Distributions from net realized gain | | - | | - | | (.77) | | (.20) | | - |
| Total distributions | | (.05) | | (.01) | | (.85) D | | (.20) | | (.07) |
| Net asset value, end of period | $ | 11.79 | $ | 9.53 | $ | 8.53 | $ | 12.41 | $ | 9.57 |
Total Return E,F | | | | 11.82% | | (26.04)% | | 32.00% | | 3.62% |
Ratios to Average Net Assets B,G,H | | | | | | | | | | |
| Expenses before reductions | | 2.02% | | 2.18% | | 2.34% | | 2.40% | | 2.46% |
| Expenses net of fee waivers, if any | | | | 2.04% | | 2.05% | | 2.10% | | 2.14% |
| Expenses net of all reductions | | 1.99% | | 2.04% | | 2.05% | | 2.10% | | 2.12% |
| Net investment income (loss) | | .36% | | .58% | | .79% | | .15% C | | (.17)% |
| Supplemental Data | | | | | | | | | | |
| Net assets, end of period (000 omitted) | $ | 2,950 | $ | 2,475 | $ | 1,893 | $ | 1,982 | $ | 1,827 |
Portfolio turnover rate I | | | | 28% | | 31% | | 39% | | 37% |
ACalculated based on average shares outstanding during the period.
BNet investment income (loss) is affected by the timing of the declaration of dividends by any underlying mutual funds or exchange-traded funds (ETFs). Net investment income (loss) of any mutual funds or ETFs is not included in the Fund's net investment income (loss) ratio.
CNet investment income per share reflects one or more large, non-recurring dividend(s) which amounted to $.03 per share. Excluding such non-recurring dividend(s), the ratio of net investment income (loss) to average net assets would have been (.12)%.
DTotal distributions per share do not sum due to rounding.
ETotal returns would have been lower if certain expenses had not been reduced during the applicable periods shown.
FTotal returns do not include the effect of the contingent deferred sales charge.
GFees and expenses of any underlying mutual funds or exchange-traded funds (ETFs) are not included in the Fund's expense ratio. The Fund indirectly bears its proportionate share of these expenses. For additional expense information related to investments in Fidelity Central Funds, please refer to the "Investments in Fidelity Central Funds" note found in the Notes to Financial Statements section of the most recent Annual or Semi-Annual report.
HExpense ratios reflect operating expenses of the class. Expenses before reductions do not reflect amounts reimbursed, waived, or reduced through arrangements with the investment adviser, brokerage services, or other offset arrangements, if applicable, and do not represent the amount paid by the class during periods when reimbursements, waivers or reductions occur.
IAmount does not include the portfolio activity of any underlying mutual funds or exchange-traded funds (ETFs).
Fidelity® Total International Equity Fund |
| |
| Years ended October 31, | | 2024 | | 2023 | | 2022 | | 2021 | | 2020 |
Selected Per-Share Data | | | | | | | | | | |
| Net asset value, beginning of period | $ | 9.60 | $ | 8.60 | $ | 12.54 | $ | 9.64 | $ | 9.37 |
| Income from Investment Operations | | | | | | | | | | |
Net investment income (loss) A,B | | .16 | | .16 | | .18 | | .14 C | | .08 |
| Net realized and unrealized gain (loss) | | 2.28 | | .94 | | (3.12) | | 3.04 | | .35 |
| Total from investment operations | | 2.44 | | 1.10 | | (2.94) | | 3.18 | | .43 |
| Distributions from net investment income | | (.14) | | (.10) | | (.23) | | (.08) | | (.16) |
| Distributions from net realized gain | | - | | - | | (.77) | | (.20) | | - |
| Total distributions | | (.14) | | (.10) | | (1.00) | | (.28) | | (.16) |
| Net asset value, end of period | $ | 11.90 | $ | 9.60 | $ | 8.60 | $ | 12.54 | $ | 9.64 |
Total Return D | | | | 12.80% | | (25.25)% | | 33.37% | | 4.65% |
Ratios to Average Net Assets B,E,F | | | | | | | | | | |
| Expenses before reductions | | .99% | | 1.11% | | 1.23% | | 1.27% | | 1.34% |
| Expenses net of fee waivers, if any | | | | 1.04% | | 1.05% | | 1.09% | | 1.14% |
| Expenses net of all reductions | | .99% | | 1.04% | | 1.05% | | 1.09% | | 1.12% |
| Net investment income (loss) | | 1.36% | | 1.58% | | 1.79% | | 1.16% C | | .83% |
| Supplemental Data | | | | | | | | | | |
| Net assets, end of period (000 omitted) | $ | 163,406 | $ | 108,561 | $ | 86,458 | $ | 82,604 | $ | 61,362 |
Portfolio turnover rate G | | | | 28% | | 31% | | 39% | | 37% |
ACalculated based on average shares outstanding during the period.
BNet investment income (loss) is affected by the timing of the declaration of dividends by any underlying mutual funds or exchange-traded funds (ETFs). Net investment income (loss) of any mutual funds or ETFs is not included in the Fund's net investment income (loss) ratio.
CNet investment income per share reflects one or more large, non-recurring dividend(s) which amounted to $.03 per share. Excluding such non-recurring dividend(s), the ratio of net investment income (loss) to average net assets would have been .89%.
DTotal returns would have been lower if certain expenses had not been reduced during the applicable periods shown.
EFees and expenses of any underlying mutual funds or exchange-traded funds (ETFs) are not included in the Fund's expense ratio. The Fund indirectly bears its proportionate share of these expenses. For additional expense information related to investments in Fidelity Central Funds, please refer to the "Investments in Fidelity Central Funds" note found in the Notes to Financial Statements section of the most recent Annual or Semi-Annual report.
FExpense ratios reflect operating expenses of the class. Expenses before reductions do not reflect amounts reimbursed, waived, or reduced through arrangements with the investment adviser, brokerage services, or other offset arrangements, if applicable, and do not represent the amount paid by the class during periods when reimbursements, waivers or reductions occur.
GAmount does not include the portfolio activity of any underlying mutual funds or exchange-traded funds (ETFs).
Fidelity Advisor® Total International Equity Fund Class I |
| |
| Years ended October 31, | | 2024 | | 2023 | | 2022 | | 2021 | | 2020 |
Selected Per-Share Data | | | | | | | | | | |
| Net asset value, beginning of period | $ | 9.56 | $ | 8.56 | $ | 12.49 | $ | 9.60 | $ | 9.35 |
| Income from Investment Operations | | | | | | | | | | |
Net investment income (loss) A,B | | .16 | | .16 | | .17 | | .14 C | | .08 |
| Net realized and unrealized gain (loss) | | 2.27 | | .94 | | (3.10) | | 3.03 | | .34 |
| Total from investment operations | | 2.43 | | 1.10 | | (2.93) | | 3.17 | | .42 |
| Distributions from net investment income | | (.14) | | (.10) | | (.23) | | (.08) | | (.17) |
| Distributions from net realized gain | | - | | - | | (.77) | | (.20) | | - |
| Total distributions | | (.14) | | (.10) | | (1.00) | | (.28) | | (.17) |
| Net asset value, end of period | $ | 11.85 | $ | 9.56 | $ | 8.56 | $ | 12.49 | $ | 9.60 |
Total Return D | | | | 12.86% | | (25.28)% | | 33.40% | | 4.50% |
Ratios to Average Net Assets B,E,F | | | | | | | | | | |
| Expenses before reductions | | .99% | | 1.09% | | 1.22% | | 1.26% | | 1.33% |
| Expenses net of fee waivers, if any | | | | 1.04% | | 1.04% | | 1.06% | | 1.14% |
| Expenses net of all reductions | | .97% | | 1.04% | | 1.04% | | 1.06% | | 1.13% |
| Net investment income (loss) | | 1.38% | | 1.58% | | 1.80% | | 1.18% C | | .82% |
| Supplemental Data | | | | | | | | | | |
| Net assets, end of period (000 omitted) | $ | 69,379 | $ | 57,299 | $ | 35,423 | $ | 5,714 | $ | 2,073 |
Portfolio turnover rate G | | | | 28% | | 31% | | 39% | | 37% |
ACalculated based on average shares outstanding during the period.
BNet investment income (loss) is affected by the timing of the declaration of dividends by any underlying mutual funds or exchange-traded funds (ETFs). Net investment income (loss) of any mutual funds or ETFs is not included in the Fund's net investment income (loss) ratio.
CNet investment income per share reflects one or more large, non-recurring dividend(s) which amounted to $.03 per share. Excluding such non-recurring dividend(s), the ratio of net investment income (loss) to average net assets would have been .91%.
DTotal returns would have been lower if certain expenses had not been reduced during the applicable periods shown.
EFees and expenses of any underlying mutual funds or exchange-traded funds (ETFs) are not included in the Fund's expense ratio. The Fund indirectly bears its proportionate share of these expenses. For additional expense information related to investments in Fidelity Central Funds, please refer to the "Investments in Fidelity Central Funds" note found in the Notes to Financial Statements section of the most recent Annual or Semi-Annual report.
FExpense ratios reflect operating expenses of the class. Expenses before reductions do not reflect amounts reimbursed, waived, or reduced through arrangements with the investment adviser, brokerage services, or other offset arrangements, if applicable, and do not represent the amount paid by the class during periods when reimbursements, waivers or reductions occur.
GAmount does not include the portfolio activity of any underlying mutual funds or exchange-traded funds (ETFs).
Fidelity Advisor® Total International Equity Fund Class Z |
| |
| Years ended October 31, | | 2024 | | 2023 | | 2022 | | 2021 | | 2020 |
Selected Per-Share Data | | | | | | | | | | |
| Net asset value, beginning of period | $ | 9.63 | $ | 8.61 | $ | 12.53 | $ | 9.62 | $ | 9.36 |
| Income from Investment Operations | | | | | | | | | | |
Net investment income (loss) A,B | | .17 | | .17 | | .19 | | .16 C | | .09 |
| Net realized and unrealized gain (loss) | | 2.28 | | .95 | | (3.11) | | 3.03 | | .35 |
| Total from investment operations | | 2.45 | | 1.12 | | (2.92) | | 3.19 | | .44 |
| Distributions from net investment income | | (.15) | | (.10) | | (.23) | | (.08) | | (.18) |
| Distributions from net realized gain | | - | | - | | (.77) | | (.20) | | - |
| Total distributions | | (.15) | | (.10) | | (1.00) | | (.28) | | (.18) |
| Net asset value, end of period | $ | 11.93 | $ | 9.63 | $ | 8.61 | $ | 12.53 | $ | 9.62 |
Total Return D | | | | 13.04% | | (25.09)% | | 33.54% | | 4.74% |
Ratios to Average Net Assets B,E,F | | | | | | | | | | |
| Expenses before reductions | | .89% | | .95% | | 1.10% | | 1.16% | | 1.22% |
| Expenses net of fee waivers, if any | | | | .89% | | .90% | | .94% | | .98% |
| Expenses net of all reductions | | .85% | | .89% | | .90% | | .94% | | .97% |
| Net investment income (loss) | | 1.50% | | 1.74% | | 1.94% | | 1.31% C | | .99% |
| Supplemental Data | | | | | | | | | | |
| Net assets, end of period (000 omitted) | $ | 46,858 | $ | 26,401 | $ | 7,681 | $ | 5,752 | $ | 3,422 |
Portfolio turnover rate G | | | | 28% | | 31% | | 39% | | 37% |
ACalculated based on average shares outstanding during the period.
BNet investment income (loss) is affected by the timing of the declaration of dividends by any underlying mutual funds or exchange-traded funds (ETFs). Net investment income (loss) of any mutual funds or ETFs is not included in the Fund's net investment income (loss) ratio.
CNet investment income per share reflects one or more large, non-recurring dividend(s) which amounted to $.03 per share. Excluding such non-recurring dividend(s), the ratio of net investment income (loss) to average net assets would have been 1.04%.
DTotal returns would have been lower if certain expenses had not been reduced during the applicable periods shown.
EFees and expenses of any underlying mutual funds or exchange-traded funds (ETFs) are not included in the Fund's expense ratio. The Fund indirectly bears its proportionate share of these expenses. For additional expense information related to investments in Fidelity Central Funds, please refer to the "Investments in Fidelity Central Funds" note found in the Notes to Financial Statements section of the most recent Annual or Semi-Annual report.
FExpense ratios reflect operating expenses of the class. Expenses before reductions do not reflect amounts reimbursed, waived, or reduced through arrangements with the investment adviser, brokerage services, or other offset arrangements, if applicable, and do not represent the amount paid by the class during periods when reimbursements, waivers or reductions occur.
GAmount does not include the portfolio activity of any underlying mutual funds or exchange-traded funds (ETFs).
Notes to Financial Statements
For the period ended October 31, 2024
1. Organization.
Fidelity Total International Equity Fund (the Fund) is a fund of Fidelity Investment Trust (the Trust) and is authorized to issue an unlimited number of shares. The Trust is registered under the Investment Company Act of 1940, as amended (the 1940 Act), as an open-end management investment company organized as a Massachusetts business trust. The Fund offers Class A, Class M, Class C, Total International Equity, Class I and Class Z shares, each of which has equal rights as to assets and voting privileges. Class A, Class M, Class C, Class I and Class Z are Fidelity Advisor classes. Each class has exclusive voting rights with respect to matters that affect that class. Class C shares will automatically convert to Class A shares after a holding period of eight years from the initial date of purchase, with certain exceptions. The Fund's investments in emerging markets can be subject to social, economic, regulatory, and political uncertainties and can be extremely volatile.
2. Investments in Fidelity Central Funds.
Funds may invest in Fidelity Central Funds, which are open-end investment companies generally available only to other investment companies and accounts managed by the investment adviser and its affiliates. The Schedule of Investments lists any Fidelity Central Funds held as an investment as of period end, but does not include the underlying holdings of each Fidelity Central Fund. An investing fund indirectly bears its proportionate share of the expenses of the underlying Fidelity Central Funds.
Based on its investment objective, each Fidelity Central Fund may invest or participate in various investment vehicles or strategies that are similar to those of the investing fund. These strategies are consistent with the investment objectives of the investing fund and may involve certain economic risks which may cause a decline in value of each of the Fidelity Central Funds and thus a decline in the value of the investing fund.
| Fidelity Central Fund | Investment Manager | Investment Objective | Investment Practices | Expense RatioA |
| Fidelity Money Market Central Funds | Fidelity Management & Research Company LLC (FMR) | Each fund seeks to obtain a high level of current income consistent with the preservation of capital and liquidity. | Short-term Investments | Less than .005% |
A Expenses expressed as a percentage of average net assets and are as of each underlying Central Fund's most recent annual or semi-annual shareholder report.
A complete unaudited list of holdings for each Fidelity Central Fund is available upon request or at the Securities and Exchange Commission website at www.sec.gov. In addition, the financial statements of the Fidelity Central Funds which contain the significant accounting policies (including investment valuation policies) of those funds, and are not covered by the Report of Independent Registered Public Accounting Firm, are available on the Securities and Exchange Commission website or upon request.
3. Significant Accounting Policies.
The Fund is an investment company and applies the accounting and reporting guidance of the Financial Accounting Standards Board (FASB) Accounting Standards Codification Topic 946 Financial Services - Investment Companies. The financial statements have been prepared in conformity with accounting principles generally accepted in the United States of America (GAAP), which require management to make certain estimates and assumptions at the date of the financial statements. Actual results could differ from those estimates. Subsequent events, if any, through the date that the financial statements were issued have been evaluated in the preparation of the financial statements. The Fund's Schedule of Investments lists any underlying mutual funds or exchange-traded funds (ETFs) but does not include the underlying holdings of these funds. The following summarizes the significant accounting policies of the Fund:
Investment Valuation. Investments are valued as of 4:00 p.m. Eastern time on the last calendar day of the period. The Board of Trustees (the Board) has designated the Fund's investment adviser as the valuation designee responsible for the fair valuation function and performing fair value determinations as needed. The investment adviser has established a Fair Value Committee (the Committee) to carry out the day-to-day fair valuation responsibilities and has adopted policies and procedures to govern the fair valuation process and the activities of the Committee. In accordance with these fair valuation policies and procedures, which have been approved by the Board, the Fund attempts to obtain prices from one or more third party pricing services or brokers to value its investments. When current market prices, quotations or currency exchange rates are not readily available or reliable, investments will be fair valued in good faith by the Committee, in accordance with the policies and procedures. Factors used in determining fair value vary by investment type and may include market or investment specific events, transaction data, estimated cash flows, and market observations of comparable investments. The frequency that the fair valuation procedures are used cannot be predicted and they may be utilized to a significant extent. The Committee manages the Fund's fair valuation practices and maintains the fair valuation policies and procedures. The Fund's investment adviser reports to the Board information regarding the fair valuation process and related material matters.
The Fund categorizes the inputs to valuation techniques used to value its investments into a disclosure hierarchy consisting of three levels as shown below:
Level 1 - unadjusted quoted prices in active markets for identical investments
Level 2 - other significant observable inputs (including quoted prices for similar investments, interest rates, prepayment speeds, etc.)
Level 3 - unobservable inputs (including the Fund's own assumptions based on the best information available)
Valuation techniques used to value the Fund's investments by major category are as follows:
Equity securities, including restricted securities, for which market quotations are readily available, are valued at the last reported sale price or official closing price as reported by a third party pricing service on the primary market or exchange on which they are traded and are categorized as Level 1 in the hierarchy. In the event there were no sales during the day or closing prices are not available, securities are valued at the last quoted bid price or may be valued using the last available price and are generally categorized as Level 2 in the hierarchy. For foreign equity securities, when market or security specific events arise, comparisons to the valuation of American Depositary Receipts (ADRs), futures contracts, Exchange-Traded Funds (ETFs) and certain indexes as well as quoted prices for similar securities may be used and would be categorized as Level 2 in the hierarchy. For equity securities, including restricted securities, where observable inputs are limited, assumptions about market activity and risk are used and these securities may be categorized as Level 3 in the hierarchy.
Investments in open-end mutual funds ,including the Fidelity Central Funds, are valued at their closing net asset value (NAV) each business day and are categorized as Level 1 in the hierarchy.
Changes in valuation techniques may result in transfers in or out of an assigned level within the disclosure hierarchy. The aggregate value of investments by input level as of October 31, 2024 is included at the end of the Fund's Schedule of Investments.
Foreign Currency. Certain Funds may use foreign currency contracts to facilitate transactions in foreign-denominated securities. Gains and losses from these transactions may arise from changes in the value of the foreign currency or if the counterparties do not perform under the contracts' terms.
Foreign-denominated assets, including investment securities, and liabilities are translated into U.S. dollars at the exchange rates at period end. Purchases and sales of investment securities, income and dividends received, and expenses denominated in foreign currencies are translated into U.S. dollars at the exchange rate in effect on the transaction date.
The effects of exchange rate fluctuations on investments are included with the net realized and unrealized gain (loss) on investment securities. Other foreign currency transactions resulting in realized and unrealized gain (loss) are disclosed separately.
Investment Transactions and Income. For financial reporting purposes, the Fund's investment holdings and NAV include trades executed through the end of the last business day of the period. The NAV per share for processing shareholder transactions is calculated as of the close of business of the New York Stock Exchange (NYSE), normally 4:00 p.m. Eastern time and includes trades executed through the end of the prior business day. Gains and losses on securities sold are determined on the basis of identified cost and include proceeds received from litigation. Commissions paid to certain brokers with whom the investment adviser, or its affiliates, places trades on behalf of a fund include an amount in addition to trade execution, which may be rebated back to a fund. Any such rebates are included in net realized gain (loss) on investments in the Statement of Operations. Dividend income is recorded on the ex-dividend date, except for certain dividends from foreign securities where the ex-dividend date may have passed, which are recorded as soon as the Fund is informed of the ex-dividend date. Non-cash dividends included in dividend income, if any, are recorded at the fair market value of the securities received. Income and capital gain distributions from Fidelity Central Funds, if any, are recorded on the ex-dividend date. Interest income is accrued as earned and includes coupon interest and amortization of premium and accretion of discount on debt securities as applicable. Investment income is recorded net of foreign taxes withheld where recovery of such taxes is uncertain. Funds may file withholding tax reclaims in certain jurisdictions to recover a portion of amounts previously withheld. Any withholding tax reclaims income is included in the Statement of Operations in foreign taxes withheld. Any receivables for withholding tax reclaims are included in the Statement of Assets and Liabilities in reclaims receivable.
Class Allocations and Expenses. Investment income, realized and unrealized capital gains and losses, common expenses of a fund, and certain fund-level expense reductions, if any, are allocated daily on a pro-rata basis to each class based on the relative net assets of each class to the total net assets of a fund. Each class differs with respect to transfer agent and distribution and service plan fees incurred, as applicable. Certain expense reductions may also differ by class, if applicable. For the reporting period, the allocated portion of income and expenses to each class as a percent of its average net assets may vary due to the timing of recording these transactions in relation to fluctuating net assets of the classes. Expenses directly attributable to a fund are charged to that fund. Expenses attributable to more than one fund are allocated among the respective funds on the basis of relative net assets or other appropriate methods. Expenses included in the accompanying financial statements reflect the expenses of that fund and do not include any expenses associated with any underlying mutual funds or exchange-traded funds (ETFs). Although not included in a fund's expenses, a fund indirectly bears its proportionate share of these expenses through the net asset value of each underlying mutual fund or exchange-traded fund (ETF). Expense estimates are accrued in the period to which they relate and adjustments are made when actual amounts are known.
Income Tax Information and Distributions to Shareholders. Each year, the Fund intends to qualify as a regulated investment company under Subchapter M of the Internal Revenue Code, including distributing substantially all of its taxable income and realized gains. As a result, no provision for U.S. Federal income taxes is required. As of October 31, 2024, the Fund did not have any unrecognized tax benefits in the financial statements; nor is the Fund aware of any tax positions for which it is reasonably possible that the total amounts of unrecognized tax benefits will significantly change in the next twelve months. The Fund files a U.S. federal tax return, in addition to state and local tax returns as required. The Fund's federal income tax returns are subject to examination by the Internal Revenue Service (IRS) for a period of three fiscal years after they are filed. State and local tax returns may be subject to examination for an additional fiscal year depending on the jurisdiction. Foreign taxes are provided for based on the Fund's understanding of the tax rules and rates that exist in the foreign markets in which it invests. The Fund is subject to a tax imposed on capital gains by certain countries in which it invests. An estimated deferred tax liability for net unrealized appreciation on the applicable securities is included in Deferred taxes on the Statement of Assets and Liabilities.
Distributions are declared and recorded on the ex-dividend date. Income and capital gain distributions are declared separately for each class. Income and capital gain distributions are determined in accordance with income tax regulations, which may differ from GAAP. In addition, the Fund claimed a portion of the payment made to redeeming shareholders as a distribution for income tax purposes.
Capital accounts within the financial statements are adjusted for permanent book-tax differences. These adjustments have no impact on net assets or the results of operations. Capital accounts are not adjusted for temporary book-tax differences which will reverse in a subsequent period.
Book-tax differences are primarily due to foreign currency transactions, certain foreign taxes, passive foreign investment companies (PFIC), capital loss carryforwards and losses deferred due to wash sales.
As of period end, the cost and unrealized appreciation (depreciation) in securities, and derivatives if applicable, for federal income tax purposes were as follows:
| Gross unrealized appreciation | $74,544,714 |
| Gross unrealized depreciation | (13,625,325) |
| Net unrealized appreciation (depreciation) | $60,919,389 |
| Tax Cost | $258,626,286 |
The tax-based components of distributable earnings as of period end were as follows:
| Undistributed ordinary income | $3,867,549 |
| Capital loss carryforward | $(4,514,700) |
| Net unrealized appreciation (depreciation) on securities and other investments | $60,900,464 |
Capital loss carryforwards are only available to offset future capital gains of the Fund to the extent provided by regulations and may be limited. The capital loss carryforward information presented below, including any applicable limitation, is estimated as of fiscal period end and is subject to adjustment.
Short-term | $(4,514,700) |
Long-term | (-) |
| Total capital loss carryforward | $(4,514,700) |
The tax character of distributions paid was as follows:
| | October 31, 2024 | October 31, 2023 |
| Ordinary Income | $3,300,481 | $ 1,806,040 |
| Total | $3,300,481 | $ 1,806,040 |
Restricted Securities (including Private Placements). Funds may invest in securities that are subject to legal or contractual restrictions on resale. These securities generally may be resold in transactions exempt from registration or to the public if the securities are registered. Disposal of these securities may involve time-consuming negotiations and expense, and prompt sale at an acceptable price may be difficult. Information regarding restricted securities held at period end is included at the end of the Schedule of Investments, if applicable.
New Accounting Pronouncement. In November 2023, the FASB issued Accounting Standards Update (ASU) 2023-07 Segment Reporting (Topic 280): Improvements to Reportable Segment Disclosures. Effective for fiscal years beginning after December 15, 2023 and interim periods within fiscal years beginning after December 15, 2024, the amendments enhance required disclosures of segment information for public entities on an annual and interim basis. The ASU allows for early adoption with updates applied retrospectively. Management is currently evaluating the impact of the ASU but does not expect this guidance to materially impact the financial statements.
4. Purchases and Sales of Investments.
Purchases and sales of securities, other than short-term securities and in-kind transactions, as applicable, are noted in the table below.
| | Purchases ($) | Sales ($) |
| Fidelity Total International Equity Fund | 125,681,982 | 89,001,264 |
5. Fees and Other Transactions with Affiliates.
Management Fee. Fidelity Management & Research Company LLC (the investment adviser) and its affiliates provide the Fund with investment management related services for which the Fund pays a monthly management fee.
Effective March 1, 2024, the Fund's management contract was amended to incorporate administrative services previously covered under separate services agreements (Transfer Agent and Accounting agreements). The amended contract incorporates a basic fee rate that may vary by class (subject to a performance adjustment). The investment adviser or an affiliate pays certain expenses of managing and operating the Fund out of each class's management fee. Each class of the Fund pays a management fee to the investment adviser. The management fee is calculated and paid to the investment adviser every month. The management fee is determined by calculating a basic fee and then applying a performance adjustment. When determining a class's basic fee, a mandate rate is calculated based on the monthly average net assets of a group of funds advised by FMR within a designated asset class. A discount rate is subtracted from the mandate rate once the Fund's monthly average net assets reach a certain level. The mandate rate and discount rate may vary by class. The annual basic fee rate for a class of shares of the Fund is the lesser of (1) the class's mandate rate reduced by the class's discount rate (if applicable) or (2) the amount set forth in the following table.
| | Maximum Management Fee Rate % |
| Class A | .88 |
| Class M | .88 |
| Class C | .88 |
| Total International Equity | .87 |
| Class I | .85 |
| Class Z | .72 |
One-twelfth of the basic fee rate for a class is applied to the average net assets of the class for the month, giving a dollar amount which is the basic fee for the class for that month. A different management fee rate may be applicable to each class of the Fund. The difference between classes is the result of separate arrangements for class-level services and/or waivers of certain expenses. It is not the result of any difference in advisory or custodial fees or other expenses related to the management of the Fund's assets, which do not vary by class. For the portion of the reporting period on or after March 1, 2024, the total annualized management fee rates were as follows:
| | Total Management Fee Rate % |
| Class A | .87 |
| Class M | .87 |
| Class C | .87 |
| Total International Equity | .83 |
| Class I | .85 |
| Class Z | .72 |
Prior to March 1, 2024, the management fee was the sum of an individual fund fee rate that was based on an annual rate of .45% of the Fund's average net assets and an annualized group fee rate that averaged .22% during the period. The group fee rate was based upon the monthly average net assets of a group of registered investment companies with which the investment adviser has management contracts. The group fee rate decreased as assets under management increased and increased as assets under management decreased. For the portion of the reporting period prior to March 1, 2024, the total annualized management fee rate was .67%.
The performance adjustment rate is calculated monthly by comparing over the performance period the Fund's performance to that of the performance adjustment index listed below.
| | Performance Adjustment Index |
| Fidelity Total International Equity Fund | MSCI All Country World ex USA Index |
For the purposes of calculating the performance adjustment for the Fund, the Fund's investment performance is based on the performance of Total International Equity. To the extent that other classes of the Fund have higher expenses, this could result in those classes bearing a larger positive performance adjustment and smaller negative performance adjustment than would be the case if each class's own performance were considered. The performance period is the most recent 36 month period. The maximum annualized performance adjustment rate is ±.20% of the Fund's average net assets over the performance period. The performance adjustment rate is divided by twelve and multiplied by the Fund's average net assets over the performance period, and the resulting dollar amount is proportionately added to or subtracted from a class's basic fee. For the entire reporting period, the total annual performance adjustment was .03%.
Effective March 1, 2024, the Fund's sub-advisory agreements with Fidelity Management & Research (Hong Kong) Limited and Fidelity Management & Research (Japan) Limited was amended to provide that the investment adviser pays each sub-adviser monthly fees equal to 110% of the sub-adviser's costs for providing sub-advisory services.
Effective March 1, 2024, the Fund's sub-advisory agreement with FIL Investment Advisors (FIA) was amended to provide that the investment adviser pays FIA monthly fees at an annual rate of 0.44% respect to the average daily net assets of the Fund managed by FIA. FIA in turn pays FIA(UK).
Distribution and Service Plan Fees. In accordance with Rule 12b-1 of the 1940 Act, the Fund has adopted separate Distribution and Service Plans for each class of shares. Certain classes pay Fidelity Distributors Company LLC (FDC), an affiliate of the investment adviser, separate Distribution and Service Fees, each of which is based on an annual percentage of each class' average net assets. In addition, FDC may pay financial intermediaries for selling shares of the Fund and providing shareholder support services. For the period, the Distribution and Service Fee rates, total fees and amounts retained by FDC were as follows:
| | Distribution Fee | Service Fee | Total Fees ($) | Retained by FDC ($) |
| Class A | - % | .25% | 54,915 | 626 |
| Class M | .25% | .25% | 62,132 | - |
| Class C | .75% | .25% | 30,669 | 8,416 |
| | | | 147,716 | 9,042 |
Sales Load. FDC may receive a front-end sales charge of up to 5.75% for selling Class A shares and 3.50% for selling Class M shares, some of which is paid to financial intermediaries for selling shares of the Fund. Depending on the holding period, FDC may receive contingent deferred sales charges levied on Class A, Class M and Class C redemptions. The deferred sales charges are 1.00% for Class C shares, 1.00% for certain purchases of Class A shares and .25% for certain purchases of Class M shares.
For the period, sales charge amounts retained by FDC were as follows:
| | Retained by FDC ($) |
| Class A | 6,190 |
| Class M | 501 |
Class CA | 46 |
| | 6,737 |
A When Class C shares are initially sold, FDC pays commissions from its own resources to financial intermediaries through which the sales are made.
Transfer Agent Fees. Fidelity Investments Institutional Operations Company LLC (FIIOC), an affiliate of the investment adviser, is the transfer, dividend disbursing and shareholder servicing agent for each class of the Fund. Effective March 1, 2024, the Fund's management contract was amended to incorporate transfer agent services and associated fees previously covered under a separate services agreement. FIIOC pays for typesetting, printing and mailing of shareholder reports, except proxy statements.
During the period December 1, 2023 through February 29, 2024, the transfer agent fees for each class were a fixed annual rate of class-level average net assets as follows:
| | % of Class-Level Average Net Assets |
| Class A | .2000 |
| Class M | .2000 |
| Class C | .2000 |
| Total International Equity | .1875 |
| Class I | .1643 |
| Class Z | .0420 |
Prior to December 1, 2023, FIIOC received account fees and asset-based fees that varied according to the account size and type of account of the shareholders of the respective classes of the Fund, except for Class Z. FIIOC received an asset-based fee of Class Z's average net assets. For the portion of the reporting period prior to March 1, 2024, the fees were equivalent to the following annualized rates:
| | Amount ($) | % of Class-Level Average Net Assets |
| Class A | 13,490 | .20 |
| Class M | 8,049 | .21 |
| Class C | 2,032 | .21 |
| Total International Equity | 74,318 | .18 |
| Class I | 35,680 | .16 |
| Class Z | 4,142 | .04 |
| 137,711 | |
Accounting Fees. Fidelity Service Company, Inc. (FSC), an affiliate of the investment adviser, maintains the Fund's accounting records. Effective March 1, 2024, the Fund's management contract was amended to incorporate accounting services and associated fees previously covered under a separate services agreement.
During the period December 1, 2023 through February 29, 2024, the accounting fees were a fixed annual rate of average net assets as follows:
| | % of Average Net Assets |
| Fidelity Total International Equity Fund | .0497 |
Prior to December 1, 2023, the accounting fee was based on the level of average net assets for each month. For the portion of the reporting period prior to March 1, 2024, the fees were equivalent to the following annualized rates:
| | % of Average Net Assets |
| Fidelity Total International Equity Fund | .05 |
Brokerage Commissions. A portion of portfolio transactions were placed with brokerage firms which are affiliates of the investment adviser. Brokerage commissions are included in net realized gain (loss) and change in net unrealized appreciation (depreciation) in the Statement of Operations. The commissions paid to these affiliated firms were as follows:
| | Amount ($) |
| Fidelity Total International Equity Fund | 420 |
Interfund Trades. Funds may purchase from or sell securities to other Fidelity Funds under procedures adopted by the Board. The procedures have been designed to ensure these interfund trades are executed in accordance with Rule 17a-7 of the 1940 Act. Any interfund trades are included within the respective purchases and sales amounts shown in the Purchases and Sales of Investments note. Interfund trades during the period are noted in the table below.
| | Purchases ($) | Sales ($) | Realized Gain (Loss)($) |
| Fidelity Total International Equity Fund | 3,615,541 | 2,648,254 | 599,338 |
6. Committed Line of Credit.
Certain Funds participate with other funds managed by the investment adviser or an affiliate in a $4.25 billion credit facility (the "line of credit") to be utilized for temporary or emergency purposes to fund shareholder redemptions or for other short-term liquidity purposes. The participating funds have agreed to pay commitment fees on their pro-rata portion of the line of credit, which are reflected in Miscellaneous expenses on the Statement of Operations, and are listed below. During the period, there were no borrowings on this line of credit.
| | Amount ($) |
| Fidelity Total International Equity Fund | 433 |
7. Security Lending.
Funds lend portfolio securities from time to time in order to earn additional income. Lending agents are used, including National Financial Services (NFS), an affiliate of the investment adviser. Pursuant to a securities lending agreement, NFS will receive a fee, which is capped at 9.9% of a fund's daily lending revenue, for its services as lending agent. A fund may lend securities to certain qualified borrowers, including NFS. On the settlement date of the loan, a fund receives collateral (in the form of U.S. Treasury obligations, letters of credit and/or cash) against the loaned securities and maintains collateral in an amount not less than 100% of the market value of the loaned securities during the period of the loan. The market value of the loaned securities is determined at the close of business of a fund and any additional required collateral is delivered to a fund on the next business day. A fund or borrower may terminate the loan at any time, and if the borrower defaults on its obligation to return the securities loaned because of insolvency or other reasons, a fund may apply collateral received from the borrower against the obligation. A fund may experience delays and costs in recovering the securities loaned. Any cash collateral received is invested in the Fidelity Securities Lending Cash Central Fund. Any loaned securities are identified as such in the Schedule of Investments, and the value of loaned securities and cash collateral at period end, as applicable, are presented in the Statement of Assets and Liabilities. Security lending income represents the income earned on investing cash collateral, less rebates paid to borrowers and any lending agent fees associated with the loan, plus any premium payments received for lending certain types of securities. Security lending income is presented in the Statement of Operations as a component of income from Fidelity Central Funds. Affiliated security lending activity, if any, was as follows:
| | Total Security Lending Fees Paid to NFS ($) | Security Lending Income From Securities Loaned to NFS ($) | Value of Securities Loaned to NFS at Period End ($) |
| Fidelity Total International Equity Fund | 554 | - | - |
8. Expense Reductions.
The investment adviser contractually agreed to reimburse expenses of each class to the extent annual operating expenses exceeded certain levels of class-level average net assets as noted in the table below. This reimbursement will remain in place through February 28, 2026. Some expenses, for example the compensation of the independent Trustees, and certain miscellaneous expenses such as proxy and shareholder meeting expenses, are excluded from this reimbursement.
The following classes were in reimbursement during the period:
| | Expense Limitations | Reimbursement ($) |
| Class A | 1.30%/1.20%A | 7,798 |
| Class M | 1.55%/1.45%A | 4,171 |
| Class C | 2.05%/1.95%A | 926 |
| Total International Equity | 1.05%/.95%A | 1,869 |
| Class I | 1.05%/.95%A | 11,767 |
| Class Z | .90%/.80%A | 13,231 |
| | | 39,762 |
A Expense Limitation effective March 1, 2024
Through arrangements with each class' transfer agent, credits realized as a result of certain uninvested cash balances were used to reduce the Fund's expenses. During the period, transfer agent credits reduced each class' expenses as noted in the table below.
| | Expense reduction ($) |
| | |
| Class M | 19 |
In addition, during the period the investment adviser or an affiliate reimbursed and/or waived a portion of fund-level operating expenses in the amount of $11,511.
9. Distributions to Shareholders.
Distributions to shareholders of each class were as follows:
| | Year ended October 31, 2024 | Year ended October 31, 2023 |
| Fidelity Total International Equity Fund | | |
| Distributions to shareholders | | |
| Class A | $214,708 | $136,043 |
| Class M | 103,563 | 60,649 |
| Class C | 12,847 | 1,760 |
| Total International Equity | 1,657,937 | 1,034,854 |
| Class I | 886,527 | 451,131 |
| Class Z | 424,899 | 121,603 |
Total | $3,300,481 | $1,806,040 |
10. Share Transactions.
Share transactions for each class were as follows and may contain in-kind transactions, automatic conversions between classes or exchanges between affiliated funds:
| | Shares | Shares | Dollars | Dollars |
| | Year ended October 31, 2024 | Year ended October 31, 2023 | Year ended October 31, 2024 | Year ended October 31, 2023 |
| Fidelity Total International Equity Fund | | | | |
| Class A | | | | |
| Shares sold | 549,290 | 883,201 | $6,240,487 | $8,694,442 |
| Reinvestment of distributions | 20,725 | 14,206 | 213,883 | 135,808 |
| Shares redeemed | (344,770) | (575,856) | (3,941,834) | (5,858,395) |
| Net increase (decrease) | 225,245 | 321,551 | $2,512,536 | $2,971,855 |
| Class M | | | | |
| Shares sold | 137,040 | 117,155 | $1,587,737 | $1,168,097 |
| Reinvestment of distributions | 9,958 | 6,291 | 103,562 | 60,649 |
| Shares redeemed | (159,164) | (165,757) | (1,820,564) | (1,635,862) |
| Net increase (decrease) | (12,166) | (42,311) | $(129,265) | $(407,116) |
| Class C | | | | |
| Shares sold | 57,438 | 113,803 | $630,153 | $1,148,641 |
| Reinvestment of distributions | 1,241 | 183 | 12,847 | 1,757 |
| Shares redeemed | (68,257) | (76,111) | (785,305) | (745,659) |
| Net increase (decrease) | (9,578) | 37,875 | $(142,305) | $404,739 |
| Total International Equity | | | | |
| Shares sold | 4,737,578 | 4,599,531 | $54,385,150 | $45,831,869 |
| Reinvestment of distributions | 144,359 | 97,973 | 1,492,669 | 939,562 |
| Shares redeemed | (2,451,059) | (3,448,548) | (27,787,042) | (34,371,636) |
| Net increase (decrease) | 2,430,878 | 1,248,956 | $28,090,777 | $12,399,795 |
| Class I | | | | |
| Shares sold | 2,162,129 | 3,922,899 | $24,037,565 | $39,216,121 |
| Reinvestment of distributions | 85,453 | 46,910 | 880,163 | 447,992 |
| Shares redeemed | (2,382,839) | (2,115,326) | (26,892,945) | (21,232,217) |
| Net increase (decrease) | (135,257) | 1,854,483 | $(1,975,217) | $18,431,896 |
| Class Z | | | | |
| Shares sold | 2,618,679 | 2,772,393 | $30,191,085 | $27,649,951 |
| Reinvestment of distributions | 37,496 | 10,898 | 388,454 | 104,625 |
| Shares redeemed | (1,471,673) | (933,308) | (16,671,982) | (9,419,583) |
| Net increase (decrease) | 1,184,502 | 1,849,983 | $13,907,557 | $18,334,993 |
11. Other.
A fund's organizational documents provide former and current trustees and officers with a limited indemnification against liabilities arising in connection with the performance of their duties to the fund. In the normal course of business, a fund may also enter into contracts that provide general indemnifications. A fund's maximum exposure under these arrangements is unknown as this would be dependent on future claims that may be made against a fund. The risk of material loss from such claims is considered remote.
12. Risk and Uncertainties.
Many factors affect a fund's performance. Developments that disrupt global economies and financial markets, such as pandemics, epidemics, outbreaks of infectious diseases, war, terrorism, and environmental disasters, may significantly affect a fund's investment performance. The effects of these developments to a fund will be impacted by the types of securities in which a fund invests, the financial condition, industry, economic sector, and geographic location of an issuer, and a fund's level of investment in the securities of that issuer. Significant concentrations in security types, issuers, industries, sectors, and geographic locations may magnify the factors that affect a fund's performance.
Report of Independent Registered Public Accounting Firm
To the Board of Trustees of Fidelity Investment Trust and the Shareholders of Fidelity Total International Equity Fund:
Opinion on the Financial Statements and Financial Highlights
We have audited the accompanying statement of assets and liabilities of Fidelity Total International Equity Fund (the "Fund"), a fund of Fidelity Investment Trust, including the schedule of investments, as of October 31, 2024, the related statement of operations for the year then ended, the statement of changes in net assets for each of the two years in the period then ended, the financial highlights for each of the five years in the period then ended, and the related notes. In our opinion, the financial statements and financial highlights present fairly, in all material respects, the financial position of the Fund as of October 31, 2024, and the results of its operations for the year then ended, the changes in its net assets for each of the two years in the period then ended, and the financial highlights for each of the five years in the period then ended in conformity with accounting principles generally accepted in the United States of America.
Basis for Opinion
These financial statements and financial highlights are the responsibility of the Fund's management. Our responsibility is to express an opinion on the Fund's financial statements and financial highlights based on our audits. We are a public accounting firm registered with the Public Company Accounting Oversight Board (United States) (PCAOB) and are required to be independent with respect to the Fund in accordance with the U.S. federal securities laws and the applicable rules and regulations of the Securities and Exchange Commission and the PCAOB.
We conducted our audits in accordance with the standards of the PCAOB. Those standards require that we plan and perform the audit to obtain reasonable assurance about whether the financial statements and financial highlights are free of material misstatement, whether due to error or fraud. The Fund is not required to have, nor were we engaged to perform, an audit of its internal control over financial reporting. As part of our audits, we are required to obtain an understanding of internal control over financial reporting but not for the purpose of expressing an opinion on the effectiveness of the Fund's internal control over financial reporting. Accordingly, we express no such opinion.
Our audits included performing procedures to assess the risks of material misstatement of the financial statements and financial highlights, whether due to error or fraud, and performing procedures that respond to those risks. Such procedures included examining, on a test basis, evidence regarding the amounts and disclosures in the financial statements and financial highlights. Our audits also included evaluating the accounting principles used and significant estimates made by management, as well as evaluating the overall presentation of the financial statements and financial highlights. Our procedures included confirmation of securities owned as of October 31, 2024, by correspondence with the custodian and brokers; when replies were not received from brokers, we performed other auditing procedures. We believe that our audits provide a reasonable basis for our opinion.
/s/ Deloitte & Touche LLP
Boston, Massachusetts
December 12, 2024
We have served as the auditor of one or more of the Fidelity investment companies since 1999.
Distributions
(Unaudited)The dividend and capital gains distributions for the fund(s) are available on Fidelity.com or Institutional.Fidelity.com.
The fund designates $93,145 of distributions paid during the fiscal year ended 2024 as qualifying to be taxed as section 163(j) interest dividends.
Class A designates 4%; Class M designates 5%; Class C designates 8%; Total International Equity designates 3%; Class I designates 3%; and Class Z designates 3%; of the dividends distributed during the fiscal year as qualifying for the dividends-received deduction for corporate shareholders.
Class A, Class M, Class C, Total International Equity, Class I and Class Z designates 100% of each dividend distributed during the fiscal year as amounts which may be taken into account as a dividend for purposes of the maximum rate under section 1(h)(11) of the Internal Revenue Code.
The amounts per share which represent income derived from sources within, and taxes paid to, foreign countries or possessions of the United States are as follows:| | Pay Date | Income | Taxes |
| Fidelity Total International Equity Fund | | | |
| Class A | 12/11/2023 | $0.1318 | $0.0237 |
| Class M | 12/11/2023 | $0.1093 | $0.0237 |
| Class C | 12/11/2023 | $0.0662 | $0.0237 |
| Total International Equity | 12/11/2023 | $0.1571 | $0.0237 |
| Class I | 12/11/2023 | $0.1571 | $0.0237 |
| Class Z | 12/11/2023 | $0.1665 | $0.0237 |
The fund will notify shareholders in January 2025 of amounts for use in preparing 2024 income tax returns.
Item 8: Changes in and Disagreements with Accountants for Open-End Management Investment Companies
(Unaudited)
Note: This is not applicable for any fund included in this document.
Item 9: Proxy Disclosures for Open-End Management Investment Companies
(Unaudited)
| A special meeting of shareholders was held on July 16, 2024. The results of votes taken among shareholders on the proposal before them are reported below. Each vote reported represents one dollar of net asset value held on the record date for the meeting. |
| Proposal 1 |
| To elect a Board of Trustees. |
| | # of Votes | % of Votes |
| Bettina Doulton |
| Affirmative | 128,529,177,643.56 | 98.18 |
| Withheld | 2,378,037,364.30 | 1.82 |
| TOTAL | 130,907,215,007.85 | 100.00 |
| Robert A. Lawrence |
| Affirmative | 128,253,389,899.05 | 97.97 |
| Withheld | 2,653,825,108.81 | 2.03 |
| TOTAL | 130,907,215,007.85 | 100.00 |
| Vijay C. Advani |
| Affirmative | 128,531,418,228.19 | 98.19 |
| Withheld | 2,375,796,779.66 | 1.81 |
| TOTAL | 130,907,215,007.85 | 100.00 |
| Thomas P. Bostick |
| Affirmative | 128,495,261,591.41 | 98.16 |
| Withheld | 2,411,953,416.44 | 1.84 |
| TOTAL | 130,907,215,007.85 | 100.00 |
| Donald F. Donahue |
| Affirmative | 128,407,878,996.00 | 98.09 |
| Withheld | 2,499,336,011.85 | 1.91 |
| TOTAL | 130,907,215,007.85 | 100.00 |
| Vicki L. Fuller |
| Affirmative | 128,625,540,095.19 | 98.26 |
| Withheld | 2,281,674,912.66 | 1.74 |
| TOTAL | 130,907,215,007.85 | 100.00 |
| Patricia L. Kampling |
| Affirmative | 128,668,729,281.34 | 98.29 |
| Withheld | 2,238,485,726.51 | 1.71 |
| TOTAL | 130,907,215,007.85 | 100.00 |
| Thomas A. Kennedy |
| Affirmative | 128,499,824,239.79 | 98.16 |
| Withheld | 2,407,390,768.06 | 1.84 |
| TOTAL | 130,907,215,007.85 | 100.00 |
| Oscar Munoz |
| Affirmative | 128,386,109,391.05 | 98.07 |
| Withheld | 2,521,105,616.80 | 1.93 |
| TOTAL | 130,907,215,007.85 | 100.00 |
| Karen B. Peetz |
| Affirmative | 128,603,731,113.82 | 98.24 |
| Withheld | 2,303,483,894.03 | 1.76 |
| TOTAL | 130,907,215,007.85 | 100.00 |
| David M. Thomas |
| Affirmative | 128,384,899,342.98 | 98.07 |
| Withheld | 2,522,315,664.88 | 1.93 |
| TOTAL | 130,907,215,007.85 | 100.00 |
| Susan Tomasky |
| Affirmative | 128,556,148,461.60 | 98.20 |
| Withheld | 2,351,066,546.25 | 1.80 |
| TOTAL | 130,907,215,007.85 | 100.00 |
| Michael E. Wiley |
| Affirmative | 128,264,934,978.34 | 97.98 |
| Withheld | 2,642,280,029.51 | 2.02 |
| TOTAL | 130,907,215,007.85 | 100.00 |
| | | |
| Proposal 1 reflects trust-wide proposal and voting results. |
Item 10: Remuneration Paid to Directors, Officers, and others of Open-End Management Investment Companies
(Unaudited)
Note: This information is disclosed as part of the financial statements for each Fund as part of Item 7: Financial Statements and Financial Highlights for Open-End Management Investment companies.
Item 11: Statement Regarding Basis for Approval of Investment Advisory Contract
(Unaudited)
Board Approval of Investment Advisory Contracts and Management Fees
Fidelity Total International Equity Fund
Each year, the Board of Trustees, including the Independent Trustees (together, the Board), considers the renewal of the fund's management contract with Fidelity Management & Research Company LLC (FMR) and certain affiliates and the sub-advisory agreements (together, the Advisory Contracts) for the fund. FMR and the sub-advisers are referred to herein as the Investment Advisers. The Board, assisted by the advice of fund counsel and Independent Trustees' counsel, requests and considers a broad range of information relevant to the renewal of the Advisory Contracts throughout the year.
The Board meets regularly and, at each of its meetings, covers an extensive agenda of topics and materials and considers factors that are relevant to its annual consideration of the renewal of the fund's Advisory Contracts, including the services and support provided to the fund and its shareholders. The Board, acting directly and through its Committees (each of which is composed of and chaired by Independent Trustees), requests and receives information concerning the annual consideration of the renewal of the fund's Advisory Contracts. The Board also meets as needed to review matters specifically related to the Board's annual consideration of the renewal of the Advisory Contracts. Members of the Board may also meet with trustees of other Fidelity funds through joint ad hoc committees to discuss certain matters relevant to all of the Fidelity funds.
At its May 2024 meeting, the Board unanimously determined to renew the fund's Advisory Contracts. In reaching its determination, the Board considered all factors it believed relevant, including (i) the nature, extent, and quality of the services provided to the fund and its shareholders (including the investment performance of the fund); (ii) the competitiveness relative to peer funds of the fund's management fee and the total expense ratio of a representative class (the retail class, which was selected because it was the largest class without 12b-1 fees); (iii) the total costs of the services provided by and the profits realized by FMR and its affiliates (Fidelity) from its relationships with the fund; and (iv) the extent to which, if any, economies of scale exist and are realized as the fund grows, and whether any economies of scale are appropriately shared with fund shareholders. The Board also considered the broad range of investment choices available to shareholders from FMR's competitors and that the fund's shareholders have chosen to invest in the fund, which is part of the Fidelity family of funds. The Board's decision to renew the Advisory Contracts was not based on any single factor.
The Board reached a determination, with the assistance of fund counsel and Independent Trustees' counsel and through the exercise of its business judgment, that the renewal of the Advisory Contracts was in the best interests of the fund and its shareholders and that the compensation payable under the Advisory Contracts was fair and reasonable in light of all of the surrounding circumstances.
Nature, Extent, and Quality of Services Provided. The Board considered staffing as it relates to the fund, including the backgrounds and experience of investment personnel of the Investment Advisers, and also considered the Investment Advisers' implementation of the fund's investment program. The Independent Trustees also had discussions with senior management of Fidelity's investment operations and investment groups. The Board considered the structure of the investment personnel compensation program and whether this structure provides appropriate incentives to act in the best interests of the fund. Additionally, the Board considered the portfolio managers' investments, if any, in the funds that they manage.
Resources Dedicated to Investment Management and Support Services. The Board and the Fund Oversight and Research Committees reviewed the general qualifications and capabilities of Fidelity's investment staff, including its size, education, experience, and resources, as well as Fidelity's approach to recruiting, training, managing, and compensating investment personnel. The Board noted the resources devoted to expansion of Fidelity's global investment organization, and that Fidelity's analysts have extensive resources, tools and capabilities that allow them to conduct sophisticated quantitative and fundamental analysis, as well as credit analysis of issuers, counterparties and guarantors. Further, the Board considered that Fidelity's investment professionals have sufficient access to global information and data so as to provide competitive investment results over time, and that those professionals also have access to sophisticated tools that permit them to assess portfolio construction and risk and performance attribution characteristics continuously, as well as to transmit new information and research conclusions rapidly around the world. Additionally, in its deliberations, the Board considered Fidelity's trading, risk management, compliance, and technology and operations capabilities and resources, which are integral parts of the investment management process.
Shareholder and Administrative Services. The Board considered (i) the nature, extent, quality, and cost of advisory, administrative, shareholder, transfer agency, and pricing and bookkeeping services performed by the Investment Advisers and their affiliates under the Advisory Contracts; (ii) the nature and extent of Fidelity's supervision of third party service providers, principally custodians, subcustodians, and pricing vendors; and (iii) the resources devoted by Fidelity to, and the record of compliance with, the fund's compliance policies and procedures. The Board also reviewed the allocation of fund brokerage, including allocations to brokers affiliated with the Investment Advisers, the use of brokerage commissions to pay fund expenses, and the use of "soft" commission dollars to pay for research services. The Board also considered the fund's securities lending activities and any payments made to Fidelity relating to securities lending under a separate agreement.
The Board noted that the growth of fund assets over time across the complex allows Fidelity to reinvest in the development of services designed to enhance the value and convenience of the Fidelity funds as investment vehicles. These services include 24-hour access to account information and market information over the Internet and through telephone representatives, investor education materials and asset allocation tools. The Board also considered that it reviews customer service metrics such as telephone response times, continuity of services on the website and metrics addressing services at Fidelity Investor Centers.
Investment in a Large Fund Family. The Board considered the benefits to shareholders of investing in a fund that is part of a large family of funds offering a variety of investment disciplines and providing a large variety of fund investor services. The Board noted that Fidelity had taken, or had made recommendations that resulted in the Fidelity funds taking, a number of actions over the previous year that benefited particular funds and/or the Fidelity funds in general.
Investment Performance. The Board took into account discussions that occur with representatives of the Investment Advisers, and reports that it receives, at Board meetings throughout the year, relating to fund investment performance. In this regard the Board noted that as part of regularly scheduled fund reviews and other reports to the Board on fund performance, the Board considered annualized return information for the fund for different time periods, measured against an appropriate securities market index (benchmark index) and an appropriate peer group of funds with similar objectives (peer group). The Board also considered information about performance attribution. In its ongoing evaluation of fund investment performance, the Board gives particular attention to information indicating changes in performance of the funds over different time periods and discussed with the Investment Advisers the reasons for any overperformance or underperformance.
In addition to reviewing absolute and relative fund performance, the Independent Trustees periodically consider the appropriateness of fund performance metrics in evaluating the results achieved. The Independent Trustees generally give greater weight to fund performance over longer time periods than over shorter time periods. Depending on the circumstances, the Independent Trustees may be satisfied with a fund's performance notwithstanding that it lags its benchmark index or peer group for certain periods.
Based on its review, the Board concluded that the nature, extent, and quality of services provided to the fund under the Advisory Contracts should continue to benefit the shareholders of the fund.
Competitiveness of Management Fee and Total Expense Ratio. The Board was provided with information regarding industry trends in management fees and expenses. The Board considered that, effective March 1, 2024, an amended Advisory Contract with FMR went into effect with class-level management fees based on tiered schedules and subject to a maximum class-level rate (the management fee). The Board also considered that in exchange for the variable management fee, each class of the fund receives investment advisory, management, administrative, transfer agent, and pricing and bookkeeping services. In its review of the management fee and total expense ratio of the retail class, the Board considered a pro forma management fee rate for the retail class as if it had been in effect for the 12-month period ended September 30, 2023, as well as other third-party fund expenses, as applicable, such as custodial, legal, and audit fees and any fund-paid 12b-1 fees. The Board noted that Fidelity may agree to waive fees or reimburse expenses from time to time, and the extent to which, if any, it has done so for the fund. The Board also considered information about the impact of the fund's performance adjustment.
Comparisons of Management Fees and Total Expense Ratios. Among other things, the Board reviewed data for selected groups of competitive funds and classes (referred to as "mapped groups") that were compiled by Fidelity based on combining similar investment objective categories (as classified by Morningstar) that have comparable investment mandates. The data reviewed by the Board included (i) gross management fee comparisons (before taking into account expense reimbursements or caps and without taking into account the fund's performance adjustment) relative to the total universe of funds within the mapped group; (ii) gross management fee comparisons relative to a subset of non-Fidelity funds in the mapped group that are similar in size and management fee structure to the fund (referred to as the "asset size peer group"); (iii) total expense comparisons of the retail class of the fund relative to funds and classes in the mapped group that have a similar sales load structure to the retail class of the fund (referred to as the "similar sales load structure group"); and (iv) total expense comparisons of the retail class of the fund relative to funds and classes in the similar sales load structure group that are similar in size and management fee structure to the fund (referred to as the "total expense asset size peer group"). The total expense asset size peer group comparison excludes performance adjustments and fund-paid 12b-1 fees to eliminate variability in fee structures.
The information provided to the Board indicated that the fund's management fee rate ranked above the competitive median of the mapped group for the 12-month period ended September 30, 2023 and below the competitive median of the asset size peer group for the 12-month period ended September 30, 2023. Further, the information provided to the Board indicated that the total expense ratio of the retail class of the fund ranked above the competitive median of the similar sales load structure group for the 12-month period ended September 30, 2023 and below the competitive median of the total expense asset size peer group for the 12-month period ended September 30, 2023. The Board considered that the fund has a variable unified management fee that covers expenses for services beyond portfolio management. The Board noted that the total expense ratio of the retail class was 1 basis point above the similar sales load group median due to the fund's positive performance adjustment.
The Board noted that a different variable management fee rate is applicable to each class of the fund. The Board considered that the difference in management fee rates between classes is the result of separate arrangements for class-level services and/or waivers of certain expenses and not the result of any difference in advisory or custodial fees or other expenses related to the management of the fund's assets, which do not vary by class.
The Board also considered that the fund's management fee is subject to upward or downward adjustment depending upon whether, and to what extent, the fund's investment performance for the performance period (a rolling 36-month period) exceeds, or is exceeded by, a securities index, thus leading to a performance adjustment for the same period. The Board noted that the performance adjustment provides FMR with a strong economic incentive to seek to achieve superior long-term performance for the fund's shareholders and helps to more closely align the interests of FMR and the shareholders of the fund.
In connection with its consideration of the fund's performance adjustment, the Board noted that the performance of the retail class is used for purposes of determining the performance adjustment. The Board noted that to the extent the performance adjustment was based on the performance of a share class with higher total annual operating expenses, the fund would be subject to a smaller positive and larger negative performance adjustment. The Board considered the appropriateness of the use of the retail class as the basis for the performance adjustment. The Board noted that the retail class is typically the largest class (reflecting the actual investment experience for the plurality of shareholders), employs a standard expense structure, and does not include fund-paid 12b-1 fees, which Fidelity believes makes it a more appropriate measurement of Fidelity's investment skill.
Other Contractual Arrangements. The Board further considered that FMR has contractually agreed to reimburse Class A, Class M, Class C, Class I, Class Z, and the retail class of the fund to the extent that total operating expenses, with certain exceptions, as a percentage of their respective average net assets, exceed 1.20%, 1.45%, 1.95%, 0.95%, 0.80%, and 0.95% through February 28, 2025.
Fees Charged to Other Fidelity Clients. The Board also considered Fidelity fee structures and other information with respect to clients of Fidelity, such as other funds advised or subadvised by Fidelity, pension plan clients, and other institutional clients with similar mandates. The Board noted that a joint ad hoc committee created by it and the boards of other Fidelity funds periodically reviews and compares Fidelity's institutional investment advisory business with its business of providing services to the Fidelity funds and also noted the most recent findings of the committee. The Board noted that the committee's review included a consideration of the differences in services provided, fees charged, and costs incurred, as well as competition in the markets serving the different categories of clients.
Based on its review, the Board concluded that the fund's management fee, including the use of the retail class as the basis for the performance adjustment, is fair and reasonable in light of the services that the fund receives and the other factors considered. Further, based on its review of total expense ratios and fees charged to other Fidelity clients, the Board concluded that the total expense ratio of each class of the fund was reasonable in light of the services that the fund and its shareholders receive and the other factors considered.
Costs of the Services and Profitability. The Board considered the revenues earned and the expenses incurred by Fidelity in conducting the business of developing, marketing, distributing, managing, administering and servicing the fund and servicing the fund's shareholders. The Board also considered the level of Fidelity's profits in respect of all the Fidelity funds.
On an annual basis, Fidelity presents to the Board information about the profitability of its relationships with the fund. Fidelity calculates profitability information for each fund, as well as aggregate profitability information for groups of Fidelity funds and all Fidelity funds, using a series of detailed revenue and cost allocation methodologies which originate with the books and records of Fidelity on which Fidelity's audited financial statements are based. The Audit Committee of the Board reviews any significant changes from the prior year's methodologies.
A public accounting firm has been engaged annually by the Board as part of the Board's assessment of Fidelity's profitability analysis. The engagement includes the review and assessment of the methodologies used by Fidelity in determining the revenues and expenses attributable to Fidelity's fund business, and completion of agreed-upon procedures in respect of the mathematical accuracy of certain fund profitability information and its conformity to established allocation methodologies. After considering the reports issued under the engagement and information provided by Fidelity, the Board concluded that while other allocation methods may also be reasonable, Fidelity's profitability methodologies are reasonable in all material respects.
The Board also reviewed Fidelity's non-fund businesses and potential indirect benefits such businesses may have received as a result of their association with Fidelity's fund business (i.e., fall-out benefits) as well as cases where Fidelity's affiliates may benefit from the funds' business. The Board considered areas where potential indirect benefits to the Fidelity funds from their relationships with Fidelity may exist. The Board's consideration of these matters was informed by the findings of a joint ad hoc committee created by it and the boards of other Fidelity funds to evaluate potential fall-out benefits.
The Board considered the costs of the services provided by and the profits realized by Fidelity in connection with the operation of the fund and was satisfied that the profitability was not excessive.
Economies of Scale. The Board considered whether there have been economies of scale in respect of the management of the Fidelity funds, whether the Fidelity funds (including the fund) have appropriately benefited from any such economies of scale, and whether there is potential for realization of any further economies of scale. The Board considered the extent to which the fund will benefit from economies of scale as assets grow through increased services to the fund, through waivers or reimbursements, or through fee or expense ratio reductions. The Board also noted that a committee created by it and the boards of other Fidelity funds periodically analyzes whether Fidelity attains economies of scale in respect of the management and servicing of the Fidelity funds, whether the Fidelity funds have appropriately benefited from such economies of scale, and whether there is potential for realization of any further economies of scale.
The Board recognized that the fund's management contract incorporates a variable management fee structure, which provides breakpoints as a way to share, in part, any potential economies of scale that may exist at the asset class level and through a discount that considers both fund size and total assets of the four applicable asset classes. The Board considered that the variable management fee is designed to deliver the benefits of economies of scale to fund shareholders even if assets of any particular fund are unchanged or have declined, because some portion of Fidelity's costs are attributable to services provided to all funds subject to the variable management fee, and all such funds benefit if those costs can be allocated among more assets. The Board concluded that, given the variable management fee structure, fund shareholders will benefit from lower management fees due to the application of the breakpoints and discount factor, regardless of whether Fidelity achieves any such economies of scale.
The Board concluded, taking into account the analysis of the committee, that economies of scale, if any, are being appropriately shared between fund shareholders and Fidelity.
Additional Information Requested by the Board. In order to develop fully the factual basis for consideration of the Fidelity funds' advisory contracts, the Board requested and received additional information on certain topics, including but not limited to: (i) fund flow and performance trends, in particular the underperformance of certain funds and strategies, and Fidelity's long-term strategies for certain funds; (ii) the operation of performance fees and the rationale for implementing performance fees on certain categories of funds but not others; (iii) Fidelity's pricing philosophy compared to competitors; (iv) fund profitability methodology and data; (v) evaluation of competitive fund data and peer group classifications and fee and expense comparisons; (vi) the management fee and expense structures for different funds and classes and information about the differences between various fee and expense structures; (vii) the variable management fee implemented for certain funds effective March 1, 2024; and (viii) information regarding other accounts managed by Fidelity and the funds' sub-advisory arrangements.
Conclusion. Based on its evaluation of all of the conclusions noted above, and after considering all factors it believed relevant, the Board, including the Independent Trustees, concluded that the advisory and sub-advisory fee arrangements are fair and reasonable in light of all of the surrounding circumstances and that the fund's Advisory Contracts should be renewed through May 31, 2025.
1.912358.114
TIE-ANN-1224
Fidelity® International Value Fund
Annual Report
October 31, 2024
Includes Fidelity and Fidelity Advisor share classes
Contents
To view a fund's proxy voting guidelines and proxy voting record for the 12-month period ended June 30, visit http://www.fidelity.com/proxyvotingresults or visit the Securities and Exchange Commission's (SEC) web site at http://www.sec.gov.
You may also call 1-800-544-8544 if you're an individual investing directly with Fidelity, call 1-800-835-5092 if you're a plan sponsor or participant with Fidelity as your recordkeeper or call 1-877-208-0098 on institutional accounts or if you're an advisor or invest through one to request a free copy of the proxy voting guidelines.
Standard & Poor's, S&P and S&P 500 are registered service marks of The McGraw-Hill Companies, Inc. and have been licensed for use by Fidelity Distributors Corporation.
Other third-party marks appearing herein are the property of their respective owners.
All other marks appearing herein are registered or unregistered trademarks or service marks of FMR LLC or an affiliated company. © 2024 FMR LLC. All rights reserved.
This report and the financial statements contained herein are submitted for the general information of the shareholders of the Fund. This report is not authorized for distribution to prospective investors in the Fund unless preceded or accompanied by an effective prospectus.
A fund files its complete schedule of portfolio holdings with the SEC for the first and third quarters of each fiscal year on Form N-PORT. Forms N-PORT are available on the SEC's web site at http://www.sec.gov. A fund's Forms N-PORT may be reviewed and copied at the SEC's Public Reference Room in Washington, DC. Information regarding the operation of the SEC's Public Reference Room may be obtained by calling 1-800-SEC-0330.
For a complete list of a fund's portfolio holdings, view the most recent holdings listing, semiannual report, or annual report on Fidelity's web site at http://www.fidelity.com, http://www.institutional.fidelity.com, or http://www.401k.com, as applicable.
NOT FDIC INSURED •MAY LOSE VALUE •NO BANK GUARANTEE
Neither the Fund nor Fidelity Distributors Corporation is a bank.
Item 7: Financial Statements and Financial Highlights for Open-End Management Investment Companies (Annual Report)
Fidelity® International Value Fund
Schedule of Investments October 31, 2024
Showing Percentage of Net Assets
| Common Stocks - 96.4% |
| | | Shares | Value ($) |
| Australia - 6.1% | | | |
| BHP Group Ltd. | | 1,117,258 | 31,040,310 |
| Commonwealth Bank of Australia | | 89,036 | 8,304,780 |
| Glencore PLC | | 4,788,000 | 25,111,339 |
| Macquarie Group Ltd. | | 125,754 | 19,032,412 |
| Woodside Energy Group Ltd. | | 398,383 | 6,269,935 |
TOTAL AUSTRALIA | | | 89,758,776 |
| Belgium - 1.9% | | | |
| KBC Group NV | | 175,716 | 12,744,887 |
| UCB SA | | 75,900 | 14,596,648 |
TOTAL BELGIUM | | | 27,341,535 |
| Denmark - 0.4% | | | |
| DSV A/S | | 28,188 | 6,126,530 |
| Finland - 1.1% | | | |
| Mandatum Holding OY | | 253,034 | 1,168,109 |
| Sampo Oyj (A Shares) | | 340,234 | 15,062,644 |
TOTAL FINLAND | | | 16,230,753 |
| France - 9.8% | | | |
| Air Liquide SA | | 107,507 | 19,276,156 |
| Alten SA | | 46,600 | 3,938,547 |
| AXA SA | | 903,305 | 33,918,317 |
| BNP Paribas SA | | 286,000 | 19,532,093 |
| Capgemini SA | | 46,093 | 7,996,253 |
| Danone SA | | 265,100 | 18,938,359 |
| TotalEnergies SE | | 467,705 | 29,351,156 |
| Vivendi SA | | 1,096,492 | 11,681,394 |
TOTAL FRANCE | | | 144,632,275 |
| Germany - 10.9% | | | |
| Bayer AG | | 104,300 | 2,810,565 |
| Bayerische Motoren Werke AG (BMW) | | 56,700 | 4,460,367 |
| Commerzbank AG | | 97,900 | 1,738,994 |
| Covestro AG (a)(b) | | 72,400 | 4,583,430 |
| Daimler Truck Holding AG | | 120,200 | 4,969,714 |
| Deutsche Post AG ADR | | 298,000 | 11,970,520 |
| Fresenius SE & Co. KGaA (a) | | 335,900 | 12,247,378 |
| Hannover Reuck SE | | 60,200 | 15,814,036 |
| Muenchener Rueckversicherungs-Gesellschaft AG in Muenchen | | 47,235 | 24,155,047 |
| Rheinmetall AG | | 55,850 | 28,747,296 |
| RWE AG | | 292,700 | 9,478,304 |
| Siemens AG | | 134,939 | 26,252,364 |
| Vonovia SE | | 416,679 | 13,669,796 |
TOTAL GERMANY | | | 160,897,811 |
| Hong Kong - 0.7% | | | |
| Prudential PLC | | 1,177,646 | 9,803,726 |
| India - 0.6% | | | |
| Reliance Industries Ltd. GDR (b) | | 151,600 | 9,490,160 |
| Indonesia - 0.6% | | | |
| PT Bank Central Asia Tbk | | 14,553,600 | 9,419,040 |
| Ireland - 0.4% | | | |
| Bank of Ireland Group PLC | | 666,700 | 6,136,667 |
| Italy - 5.0% | | | |
| Eni SpA | | 1,150,100 | 17,519,690 |
| Mediobanca SpA | | 1,218,325 | 20,103,785 |
| Prysmian SpA | | 171,700 | 12,106,216 |
| Ryanair Holdings PLC sponsored ADR | | 166,500 | 7,369,290 |
| UniCredit SpA | | 364,000 | 16,103,074 |
TOTAL ITALY | | | 73,202,055 |
| Japan - 22.7% | | | |
| DENSO Corp. | | 1,131,500 | 16,071,254 |
| Eisai Co. Ltd. | | 51,700 | 1,751,602 |
| FUJIFILM Holdings Corp. | | 565,300 | 13,447,538 |
| Fujitsu Ltd. | | 632,700 | 12,164,190 |
| Hitachi Ltd. | | 1,610,300 | 40,458,562 |
| Hoya Corp. | | 49,600 | 6,636,185 |
| Ibiden Co. Ltd. | | 150,100 | 4,767,883 |
| INPEX Corp. (c) | | 515,000 | 6,788,759 |
| Itochu Corp. | | 575,800 | 28,483,577 |
| LY Corp. | | 1,124,500 | 3,067,397 |
| Minebea Mitsumi, Inc. | | 244,870 | 4,310,809 |
| Mitsubishi Heavy Industries Ltd. | | 1,693,400 | 23,905,646 |
| Mitsubishi UFJ Financial Group, Inc. | | 2,745,161 | 28,934,666 |
| Mitsui & Co. Ltd. | | 328,400 | 6,695,304 |
| Nintendo Co. Ltd. | | 108,600 | 5,736,576 |
| NOF Corp. | | 300,500 | 4,882,073 |
| ORIX Corp. | | 752,200 | 15,848,765 |
| Renesas Electronics Corp. | | 858,017 | 11,495,987 |
| Shin-Etsu Chemical Co. Ltd. | | 596,600 | 21,861,789 |
| SoftBank Group Corp. | | 168,300 | 10,033,792 |
| Sony Group Corp. | | 504,400 | 8,876,188 |
| Sumitomo Forestry Co. Ltd. | | 165,200 | 6,364,143 |
| Sumitomo Mitsui Financial Group, Inc. | | 1,307,500 | 27,738,013 |
| TIS, Inc. | | 215,501 | 5,373,833 |
| Tokio Marine Holdings, Inc. | | 511,444 | 18,420,251 |
TOTAL JAPAN | | | 334,114,782 |
| Korea (South) - 0.3% | | | |
| Samsung Electronics Co. Ltd. | | 119,820 | 5,104,339 |
| Netherlands - 0.3% | | | |
| Universal Music Group NV | | 171,794 | 4,323,401 |
| Singapore - 1.2% | | | |
| United Overseas Bank Ltd. | | 695,805 | 16,914,359 |
| South Africa - 1.2% | | | |
| Anglo American PLC (United Kingdom) | | 526,361 | 16,317,411 |
| Thungela Resources Ltd. | | 85,381 | 609,924 |
TOTAL SOUTH AFRICA | | | 16,927,335 |
| Spain - 3.4% | | | |
| Banco Santander SA (Spain) | | 7,239,382 | 35,372,873 |
| Bankinter SA | | 775,300 | 6,316,561 |
| Cellnex Telecom SA (b) | | 236,100 | 8,654,759 |
TOTAL SPAIN | | | 50,344,193 |
| Sweden - 1.8% | | | |
| Investor AB (B Shares) | | 936,440 | 26,494,769 |
| Switzerland - 3.3% | | | |
| Swiss Life Holding AG | | 15,903 | 12,972,119 |
| UBS Group AG (c) | | 226,726 | 6,955,954 |
| Zurich Insurance Group Ltd. | | 48,031 | 28,319,328 |
TOTAL SWITZERLAND | | | 48,247,401 |
| United Kingdom - 14.7% | | | |
| AstraZeneca PLC (United Kingdom) | | 120,012 | 17,076,940 |
| B&M European Value Retail SA | | 624,200 | 3,119,694 |
| BAE Systems PLC | | 1,930,351 | 31,112,064 |
| Barratt Developments PLC | | 3,568,361 | 20,539,860 |
| Beazley PLC | | 828,900 | 8,074,974 |
| Bunzl PLC | | 187,000 | 8,227,258 |
| Flutter Entertainment PLC (a) | | 19,100 | 4,467,609 |
| HSBC Holdings PLC (United Kingdom) | | 2,352,600 | 21,592,218 |
| Imperial Brands PLC | | 437,940 | 13,216,165 |
| JD Sports Fashion PLC | | 2,315,400 | 3,702,135 |
| Lloyds Banking Group PLC | | 27,740,239 | 19,040,910 |
| London Stock Exchange Group PLC | | 90,200 | 12,225,338 |
| Rolls-Royce Holdings PLC (a) | | 1,683,200 | 11,614,751 |
| Standard Chartered PLC (United Kingdom) | | 1,502,549 | 17,424,136 |
| Unilever PLC | | 414,185 | 25,266,126 |
TOTAL UNITED KINGDOM | | | 216,700,178 |
| United States of America - 10.0% | | | |
| CRH PLC | | 333,902 | 31,864,268 |
| Ferguson Enterprises, Inc. | | 57,416 | 11,342,171 |
| GSK PLC | | 732,852 | 13,234,263 |
| Holcim AG | | 188,410 | 18,562,820 |
| Linde PLC | | 40,014 | 18,252,386 |
| Shell PLC ADR | | 808,100 | 54,587,153 |
TOTAL UNITED STATES OF AMERICA | | | 147,843,061 |
| TOTAL COMMON STOCKS (Cost $1,204,839,849) | | | 1,420,053,146 |
| | | | |
| Nonconvertible Preferred Stocks - 0.5% |
| | | Shares | Value ($) |
| Germany - 0.5% | | | |
Porsche Automobil Holding SE (Germany) (Cost $10,828,265) | | 180,900 | 7,515,177 |
| | | | |
| Money Market Funds - 4.5% |
| | | Shares | Value ($) |
| Fidelity Cash Central Fund 4.87% (d) | | 62,029,872 | 62,042,278 |
| Fidelity Securities Lending Cash Central Fund 4.87% (d)(e) | | 4,014,853 | 4,015,254 |
| TOTAL MONEY MARKET FUNDS (Cost $66,057,532) | | | 66,057,532 |
| | | | |
| TOTAL INVESTMENT IN SECURITIES - 101.4% (Cost $1,281,725,646) | 1,493,625,855 |
NET OTHER ASSETS (LIABILITIES) - (1.4)% | (21,341,658) |
| NET ASSETS - 100.0% | 1,472,284,197 |
| | |
Legend
| (b) | Security exempt from registration under Rule 144A of the Securities Act of 1933. These securities may be resold in transactions exempt from registration, normally to qualified institutional buyers. At the end of the period, the value of these securities amounted to $22,728,349 or 1.5% of net assets. |
| (c) | Security or a portion of the security is on loan at period end. |
| (d) | Affiliated fund that is generally available only to investment companies and other accounts managed by Fidelity Investments. The rate quoted is the annualized seven-day yield of the fund at period end. A complete unaudited listing of the fund's holdings as of its most recent quarter end is available upon request. In addition, each Fidelity Central Fund's financial statements, which are not covered by the Fund's Report of Independent Registered Public Accounting Firm, are available on the SEC's website or upon request. |
| (e) | Investment made with cash collateral received from securities on loan. |
Affiliated Central Funds
Fiscal year to date information regarding the Fund's investments in Fidelity Central Funds, including the ownership percentage, is presented below.
| Affiliate | Value, beginning of period ($) | Purchases ($) | Sales Proceeds ($) | Dividend Income ($) | Realized Gain (loss) ($) | Change in Unrealized appreciation (depreciation) ($) | Value, end of period ($) | % ownership, end of period |
| Fidelity Cash Central Fund 4.87% | 17,765,904 | 492,950,692 | 448,676,335 | 1,863,507 | 2,017 | - | 62,042,278 | 0.1% |
| Fidelity Securities Lending Cash Central Fund 4.87% | - | 42,688,746 | 38,673,492 | 4,345 | - | - | 4,015,254 | 0.0% |
| Total | 17,765,904 | 535,639,438 | 487,349,827 | 1,867,852 | 2,017 | - | 66,057,532 | |
| | | | | | | | | |
Amounts in the dividend income column in the above table include any capital gain distributions from underlying funds, which are presented in the corresponding line item in the Statement of Operations, if applicable.
Amounts in the dividend income column for Fidelity Securities Lending Cash Central Fund represents the income earned on investing cash collateral, less rebates paid to borrowers and any lending agent fees associated with the loan, plus any premium payments received for lending certain types of securities.
Amounts included in the purchases and sales proceeds columns may include in-kind transactions, if applicable.
Investment Valuation
The following is a summary of the inputs used, as of October 31, 2024, involving the Fund's assets and liabilities carried at fair value. The inputs or methodology used for valuing securities may not be an indication of the risk associated with investing in those securities. For more information on valuation inputs, and their aggregation into the levels used below, please refer to the Investment Valuation section in the accompanying Notes to Financial Statements.
| Valuation Inputs at Reporting Date: |
| Description | Total ($) | Level 1 ($) | Level 2 ($) | Level 3 ($) |
Investments in Securities: | | | | |
|
| Equities: | | | | |
Communication Services | 43,497,319 | 20,336,153 | 23,161,166 | - |
Consumer Discretionary | 75,116,427 | 36,289,665 | 38,826,762 | - |
Consumer Staples | 57,420,650 | - | 57,420,650 | - |
Energy | 124,616,777 | 64,687,237 | 59,929,540 | - |
Financials | 515,682,845 | 202,874,689 | 312,808,156 | - |
Health Care | 68,353,581 | 26,844,026 | 41,509,555 | - |
Industrials | 263,692,072 | 78,888,475 | 184,803,597 | - |
Information Technology | 64,288,570 | 3,938,547 | 60,350,023 | - |
Materials | 191,751,982 | 73,262,904 | 118,489,078 | - |
Real Estate | 13,669,796 | 13,669,796 | - | - |
Utilities | 9,478,304 | 9,478,304 | - | - |
|
| Money Market Funds | 66,057,532 | 66,057,532 | - | - |
| Total Investments in Securities: | 1,493,625,855 | 596,327,328 | 897,298,527 | - |
Financial Statements
| Statement of Assets and Liabilities |
As of October 31, 2024 |
| Assets | | | | |
| Investment in securities, at value (including securities loaned of $3,847,761) - See accompanying schedule: | | | | |
Unaffiliated issuers (cost $1,215,668,114) | $ | 1,427,568,323 | | |
Fidelity Central Funds (cost $66,057,532) | | 66,057,532 | | |
| | | | | |
| | | | | |
| Total Investment in Securities (cost $1,281,725,646) | | | $ | 1,493,625,855 |
| Foreign currency held at value (cost $41) | | | | 41 |
| Receivable for investments sold | | | | 2,263,237 |
| Receivable for fund shares sold | | | | 22,844,211 |
| Dividends receivable | | | | 4,419,216 |
| Reclaims receivable | | | | 2,608,290 |
| Distributions receivable from Fidelity Central Funds | | | | 164,106 |
| Prepaid expenses | | | | 1,436 |
| Other receivables | | | | 1,901 |
Total assets | | | | 1,525,928,293 |
| Liabilities | | | | |
| Payable for investments purchased | $ | 43,640,365 | | |
| Payable for fund shares redeemed | | 4,939,700 | | |
| Accrued management fee | | 935,665 | | |
| Distribution and service plan fees payable | | 8,499 | | |
| Other payables and accrued expenses | | 104,613 | | |
| Collateral on securities loaned | | 4,015,254 | | |
| Total liabilities | | | | 53,644,096 |
| Net Assets | | | $ | 1,472,284,197 |
| Net Assets consist of: | | | | |
| Paid in capital | | | $ | 1,338,300,238 |
| Total accumulated earnings (loss) | | | | 133,983,959 |
| Net Assets | | | $ | 1,472,284,197 |
| | | | | |
| Net Asset Value and Maximum Offering Price | | | | |
| Class A : | | | | |
Net Asset Value and redemption price per share ($20,609,449 ÷ 1,925,981 shares)(a) | | | $ | 10.70 |
| Maximum offering price per share (100/94.25 of $10.70) | | | $ | 11.35 |
| Class M : | | | | |
Net Asset Value and redemption price per share ($4,729,704 ÷ 442,314 shares)(a) | | | $ | 10.69 |
| Maximum offering price per share (100/96.50 of $10.69) | | | $ | 11.08 |
| Class C : | | | | |
Net Asset Value and offering price per share ($2,365,403 ÷ 220,755 shares)(a) | | | $ | 10.72 |
| International Value : | | | | |
Net Asset Value, offering price and redemption price per share ($885,896,134 ÷ 82,627,126 shares) | | | $ | 10.72 |
| Class I : | | | | |
Net Asset Value, offering price and redemption price per share ($164,277,317 ÷ 15,303,743 shares) | | | $ | 10.73 |
| Class Z : | | | | |
Net Asset Value, offering price and redemption price per share ($394,406,190 ÷ 36,729,064 shares) | | | $ | 10.74 |
(a)Redemption price per share is equal to net asset value less any applicable contingent deferred sales charge. |
| Statement of Operations |
| Year ended October 31, 2024 |
| Investment Income | | | | |
| Dividends | | | $ | 35,976,004 |
| Income from Fidelity Central Funds (including $4,345 from security lending) | | | | 1,867,852 |
| Income before foreign taxes withheld | | | $ | 37,843,856 |
| Less foreign taxes withheld | | | | (1,988,523) |
| Total income | | | | 35,855,333 |
| Expenses | | | | |
| Management fee | | | | |
| Basic fee | $ | 8,358,515 | | |
| Performance adjustment | | 298,539 | | |
| Transfer agent fees | | 431,250 | | |
| Distribution and service plan fees | | 99,755 | | |
| Accounting fees | | 130,449 | | |
| Custodian fees and expenses | | 87,391 | | |
| Independent trustees' fees and expenses | | 4,472 | | |
| Registration fees | | 157,642 | | |
| Audit fees | | 67,872 | | |
| Legal | | 635 | | |
| Interest | | 2,079 | | |
| Miscellaneous | | 40,795 | | |
| Total expenses before reductions | | 9,679,394 | | |
| Expense reductions | | (38,582) | | |
| Total expenses after reductions | | | | 9,640,812 |
| Net Investment income (loss) | | | | 26,214,521 |
| Realized and Unrealized Gain (Loss) | | | | |
| Net realized gain (loss) on: | | | | |
| Investment Securities: | | | | |
| Unaffiliated issuers | | (2,935,391) | | |
| Fidelity Central Funds | | 2,017 | | |
| Foreign currency transactions | | (107,303) | | |
| Total net realized gain (loss) | | | | (3,040,677) |
| Change in net unrealized appreciation (depreciation) on: | | | | |
| Investment Securities: | | | | |
| Unaffiliated issuers | | 158,258,155 | | |
| Assets and liabilities in foreign currencies | | (8,233) | | |
| Total change in net unrealized appreciation (depreciation) | | | | 158,249,922 |
| Net gain (loss) | | | | 155,209,245 |
| Net increase (decrease) in net assets resulting from operations | | | $ | 181,423,766 |
| Statement of Changes in Net Assets |
| |
| | Year ended October 31, 2024 | | Year ended October 31, 2023 |
| Increase (Decrease) in Net Assets | | | | |
| Operations | | | | |
| Net investment income (loss) | $ | 26,214,521 | $ | 18,147,329 |
| Net realized gain (loss) | | (3,040,677) | | (17,312,969) |
| Change in net unrealized appreciation (depreciation) | | 158,249,922 | | 104,612,501 |
| Net increase (decrease) in net assets resulting from operations | | 181,423,766 | | 105,446,861 |
| Distributions to shareholders | | (16,926,327) | | (11,902,522) |
| | | | | |
| Share transactions - net increase (decrease) | | 590,603,012 | | 45,467,490 |
| Total increase (decrease) in net assets | | 755,100,451 | | 139,011,829 |
| | | | | |
| Net Assets | | | | |
| Beginning of period | | 717,183,746 | | 578,171,917 |
| End of period | $ | 1,472,284,197 | $ | 717,183,746 |
| | | | | |
| | | | | |
Financial Highlights
Fidelity Advisor® International Value Fund Class A |
| |
| Years ended October 31, | | 2024 | | 2023 | | 2022 | | 2021 | | 2020 |
Selected Per-Share Data | | | | | | | | | | |
| Net asset value, beginning of period | $ | 8.85 | $ | 7.64 | $ | 9.65 | $ | 6.87 | $ | 8.25 |
| Income from Investment Operations | | | | | | | | | | |
Net investment income (loss) A,B | | .22 | | .20 | | .24 | | .25 C | | .13 |
| Net realized and unrealized gain (loss) | | 1.81 | | 1.15 | | (1.87) | | 2.66 | | (1.24) |
| Total from investment operations | | 2.03 | | 1.35 | | (1.63) | | 2.91 | | (1.11) |
| Distributions from net investment income | | (.18) | | (.14) | | (.38) | | (.13) | | (.24) |
| Distributions from net realized gain | | - | | - | | - | | - | | (.03) |
| Total distributions | | (.18) | | (.14) | | (.38) | | (.13) | | (.27) |
| Net asset value, end of period | $ | 10.70 | $ | 8.85 | $ | 7.64 | $ | 9.65 | $ | 6.87 |
Total Return D,E | | | | 17.72% | | (17.43)% | | 42.56% | | (14.01)% |
Ratios to Average Net Assets B,F,G | | | | | | | | | | |
| Expenses before reductions | | 1.15% | | 1.33% | | 1.46% | | 1.37% | | 1.30% |
| Expenses net of fee waivers, if any | | | | 1.29% | | 1.30% | | 1.33% | | 1.30% |
| Expenses net of all reductions | | 1.14% | | 1.29% | | 1.30% | | 1.33% | | 1.28% |
| Net investment income (loss) | | 2.12% | | 2.21% | | 2.85% | | 2.77% C | | 1.71% |
| Supplemental Data | | | | | | | | | | |
| Net assets, end of period (000 omitted) | $ | 20,609 | $ | 17,133 | $ | 12,080 | $ | 10,566 | $ | 5,947 |
Portfolio turnover rate H | | | | 29% | | 25% | | 29% I | | 36% |
ACalculated based on average shares outstanding during the period.
BNet investment income (loss) is affected by the timing of the declaration of dividends by any underlying mutual funds or exchange-traded funds (ETFs). Net investment income (loss) of any mutual funds or ETFs is not included in the Fund's net investment income (loss) ratio.
CNet investment income per share reflects one or more large, non-recurring dividend(s) which amounted to $.09 per share. Excluding such non-recurring dividend(s), the ratio of net investment income (loss) to average net assets would have been 1.73%.
DTotal returns would have been lower if certain expenses had not been reduced during the applicable periods shown.
ETotal returns do not include the effect of the sales charges.
FFees and expenses of any underlying mutual funds or exchange-traded funds (ETFs) are not included in the Fund's expense ratio. The Fund indirectly bears its proportionate share of these expenses. For additional expense information related to investments in Fidelity Central Funds, please refer to the "Investments in Fidelity Central Funds" note found in the Notes to Financial Statements section of the most recent Annual or Semi-Annual report.
GExpense ratios reflect operating expenses of the class. Expenses before reductions do not reflect amounts reimbursed, waived, or reduced through arrangements with the investment adviser, brokerage services, or other offset arrangements, if applicable, and do not represent the amount paid by the class during periods when reimbursements, waivers or reductions occur.
HAmount does not include the portfolio activity of any underlying mutual funds or exchange-traded funds (ETFs).
IPortfolio turnover rate excludes securities received or delivered in-kind.
Fidelity Advisor® International Value Fund Class M |
| |
| Years ended October 31, | | 2024 | | 2023 | | 2022 | | 2021 | | 2020 |
Selected Per-Share Data | | | | | | | | | | |
| Net asset value, beginning of period | $ | 8.84 | $ | 7.63 | $ | 9.63 | $ | 6.86 | $ | 8.24 |
| Income from Investment Operations | | | | | | | | | | |
Net investment income (loss) A,B | | .19 | | .18 | | .22 | | .23 C | | .11 |
| Net realized and unrealized gain (loss) | | 1.81 | | 1.15 | | (1.87) | | 2.65 | | (1.25) |
| Total from investment operations | | 2.00 | | 1.33 | | (1.65) | | 2.88 | | (1.14) |
| Distributions from net investment income | | (.15) | | (.12) | | (.35) | | (.11) | | (.21) |
| Distributions from net realized gain | | - | | - | | - | | - | | (.03) |
| Total distributions | | (.15) | | (.12) | | (.35) | | (.11) | | (.24) |
| Net asset value, end of period | $ | 10.69 | $ | 8.84 | $ | 7.63 | $ | 9.63 | $ | 6.86 |
Total Return D,E | | | | 17.45% | | (17.65)% | | 42.20% | | (14.29)% |
Ratios to Average Net Assets B,F,G | | | | | | | | | | |
| Expenses before reductions | | 1.39% | | 1.59% | | 1.72% | | 1.62% | | 1.57% |
| Expenses net of fee waivers, if any | | | | 1.54% | | 1.55% | | 1.58% | | 1.57% |
| Expenses net of all reductions | | 1.39% | | 1.54% | | 1.55% | | 1.58% | | 1.55% |
| Net investment income (loss) | | 1.88% | | 1.97% | | 2.60% | | 2.51% C | | 1.44% |
| Supplemental Data | | | | | | | | | | |
| Net assets, end of period (000 omitted) | $ | 4,730 | $ | 4,196 | $ | 3,498 | $ | 4,375 | $ | 2,884 |
Portfolio turnover rate H | | | | 29% | | 25% | | 29% I | | 36% |
ACalculated based on average shares outstanding during the period.
BNet investment income (loss) is affected by the timing of the declaration of dividends by any underlying mutual funds or exchange-traded funds (ETFs). Net investment income (loss) of any mutual funds or ETFs is not included in the Fund's net investment income (loss) ratio.
CNet investment income per share reflects one or more large, non-recurring dividend(s) which amounted to $.09 per share. Excluding such non-recurring dividend(s), the ratio of net investment income (loss) to average net assets would have been 1.48%.
DTotal returns would have been lower if certain expenses had not been reduced during the applicable periods shown.
ETotal returns do not include the effect of the sales charges.
FFees and expenses of any underlying mutual funds or exchange-traded funds (ETFs) are not included in the Fund's expense ratio. The Fund indirectly bears its proportionate share of these expenses. For additional expense information related to investments in Fidelity Central Funds, please refer to the "Investments in Fidelity Central Funds" note found in the Notes to Financial Statements section of the most recent Annual or Semi-Annual report.
GExpense ratios reflect operating expenses of the class. Expenses before reductions do not reflect amounts reimbursed, waived, or reduced through arrangements with the investment adviser, brokerage services, or other offset arrangements, if applicable, and do not represent the amount paid by the class during periods when reimbursements, waivers or reductions occur.
HAmount does not include the portfolio activity of any underlying mutual funds or exchange-traded funds (ETFs).
IPortfolio turnover rate excludes securities received or delivered in-kind.
Fidelity Advisor® International Value Fund Class C |
| |
| Years ended October 31, | | 2024 | | 2023 | | 2022 | | 2021 | | 2020 |
Selected Per-Share Data | | | | | | | | | | |
| Net asset value, beginning of period | $ | 8.85 | $ | 7.64 | $ | 9.60 | $ | 6.85 | $ | 8.22 |
| Income from Investment Operations | | | | | | | | | | |
Net investment income (loss) A,B | | .14 | | .13 | | .18 | | .18 C | | .07 |
| Net realized and unrealized gain (loss) | | 1.83 | | 1.15 | | (1.87) | | 2.65 | | (1.24) |
| Total from investment operations | | 1.97 | | 1.28 | | (1.69) | | 2.83 | | (1.17) |
| Distributions from net investment income | | (.10) | | (.07) | | (.27) | | (.08) | | (.17) |
| Distributions from net realized gain | | - | | - | | - | | - | | (.03) |
| Total distributions | | (.10) | | (.07) | | (.27) | | (.08) | | (.20) |
| Net asset value, end of period | $ | 10.72 | $ | 8.85 | $ | 7.64 | $ | 9.60 | $ | 6.85 |
Total Return D,E | | | | 16.74% | | (18.01)% | | 41.45% | | (14.67)% |
Ratios to Average Net Assets B,F,G | | | | | | | | | | |
| Expenses before reductions | | 1.88% | | 2.09% | | 2.23% | | 2.12% | | 2.07% |
| Expenses net of fee waivers, if any | | | | 2.05% | | 2.05% | | 2.09% | | 2.07% |
| Expenses net of all reductions | | 1.88% | | 2.05% | | 2.05% | | 2.09% | | 2.05% |
| Net investment income (loss) | | 1.38% | | 1.46% | | 2.09% | | 2.00% C | | .94% |
| Supplemental Data | | | | | | | | | | |
| Net assets, end of period (000 omitted) | $ | 2,365 | $ | 2,366 | $ | 2,190 | $ | 3,177 | $ | 2,947 |
Portfolio turnover rate H | | | | 29% | | 25% | | 29% I | | 36% |
ACalculated based on average shares outstanding during the period.
BNet investment income (loss) is affected by the timing of the declaration of dividends by any underlying mutual funds or exchange-traded funds (ETFs). Net investment income (loss) of any mutual funds or ETFs is not included in the Fund's net investment income (loss) ratio.
CNet investment income per share reflects one or more large, non-recurring dividend(s) which amounted to $.09 per share. Excluding such non-recurring dividend(s), the ratio of net investment income (loss) to average net assets would have been .97%.
DTotal returns would have been lower if certain expenses had not been reduced during the applicable periods shown.
ETotal returns do not include the effect of the contingent deferred sales charge.
FFees and expenses of any underlying mutual funds or exchange-traded funds (ETFs) are not included in the Fund's expense ratio. The Fund indirectly bears its proportionate share of these expenses. For additional expense information related to investments in Fidelity Central Funds, please refer to the "Investments in Fidelity Central Funds" note found in the Notes to Financial Statements section of the most recent Annual or Semi-Annual report.
GExpense ratios reflect operating expenses of the class. Expenses before reductions do not reflect amounts reimbursed, waived, or reduced through arrangements with the investment adviser, brokerage services, or other offset arrangements, if applicable, and do not represent the amount paid by the class during periods when reimbursements, waivers or reductions occur.
HAmount does not include the portfolio activity of any underlying mutual funds or exchange-traded funds (ETFs).
IPortfolio turnover rate excludes securities received or delivered in-kind.
Fidelity® International Value Fund |
| |
| Years ended October 31, | | 2024 | | 2023 | | 2022 | | 2021 | | 2020 |
Selected Per-Share Data | | | | | | | | | | |
| Net asset value, beginning of period | $ | 8.86 | $ | 7.65 | $ | 9.66 | $ | 6.87 | $ | 8.25 |
| Income from Investment Operations | | | | | | | | | | |
Net investment income (loss) A,B | | .25 | | .22 | | .26 | | .28 C | | .15 |
| Net realized and unrealized gain (loss) | | 1.81 | | 1.15 | | (1.86) | | 2.66 | | (1.23) |
| Total from investment operations | | 2.06 | | 1.37 | | (1.60) | | 2.94 | | (1.08) |
| Distributions from net investment income | | (.20) | | (.16) | | (.41) | | (.15) | | (.27) |
| Distributions from net realized gain | | - | | - | | - | | - | | (.03) |
| Total distributions | | (.20) | | (.16) | | (.41) | | (.15) | | (.30) |
| Net asset value, end of period | $ | 10.72 | $ | 8.86 | $ | 7.65 | $ | 9.66 | $ | 6.87 |
Total Return D | | | | 17.96% | | (17.20)% | | 43.08% | | (13.70)% |
Ratios to Average Net Assets B,E,F | | | | | | | | | | |
| Expenses before reductions | | .89% | | 1.01% | | 1.13% | | 1.01% | | .94% |
| Expenses net of fee waivers, if any | | | | 1.01% | | 1.05% | | 1.01% | | .94% |
| Expenses net of all reductions | | .89% | | 1.01% | | 1.05% | | 1.01% | | .92% |
| Net investment income (loss) | | 2.37% | | 2.50% | | 3.10% | | 3.09% C | | 2.07% |
| Supplemental Data | | | | | | | | | | |
| Net assets, end of period (000 omitted) | $ | 885,896 | $ | 443,836 | $ | 367,478 | $ | 372,441 | $ | 406,661 |
Portfolio turnover rate G | | | | 29% | | 25% | | 29% H | | 36% |
ACalculated based on average shares outstanding during the period.
BNet investment income (loss) is affected by the timing of the declaration of dividends by any underlying mutual funds or exchange-traded funds (ETFs). Net investment income (loss) of any mutual funds or ETFs is not included in the Fund's net investment income (loss) ratio.
CNet investment income per share reflects one or more large, non-recurring dividend(s) which amounted to $.09 per share. Excluding such non-recurring dividend(s), the ratio of net investment income (loss) to average net assets would have been 2.05%.
DTotal returns would have been lower if certain expenses had not been reduced during the applicable periods shown.
EFees and expenses of any underlying mutual funds or exchange-traded funds (ETFs) are not included in the Fund's expense ratio. The Fund indirectly bears its proportionate share of these expenses. For additional expense information related to investments in Fidelity Central Funds, please refer to the "Investments in Fidelity Central Funds" note found in the Notes to Financial Statements section of the most recent Annual or Semi-Annual report.
FExpense ratios reflect operating expenses of the class. Expenses before reductions do not reflect amounts reimbursed, waived, or reduced through arrangements with the investment adviser, brokerage services, or other offset arrangements, if applicable, and do not represent the amount paid by the class during periods when reimbursements, waivers or reductions occur.
GAmount does not include the portfolio activity of any underlying mutual funds or exchange-traded funds (ETFs).
HPortfolio turnover rate excludes securities received or delivered in-kind.
Fidelity Advisor® International Value Fund Class I |
| |
| Years ended October 31, | | 2024 | | 2023 | | 2022 | | 2021 | | 2020 |
Selected Per-Share Data | | | | | | | | | | |
| Net asset value, beginning of period | $ | 8.87 | $ | 7.66 | $ | 9.67 | $ | 6.88 | $ | 8.26 |
| Income from Investment Operations | | | | | | | | | | |
Net investment income (loss) A,B | | .24 | | .22 | | .25 | | .28 C | | .15 |
| Net realized and unrealized gain (loss) | | 1.82 | | 1.15 | | (1.86) | | 2.66 | | (1.24) |
| Total from investment operations | | 2.06 | | 1.37 | | (1.61) | | 2.94 | | (1.09) |
| Distributions from net investment income | | (.20) | | (.16) | | (.40) | | (.15) | | (.26) |
| Distributions from net realized gain | | - | | - | | - | | - | | (.03) |
| Total distributions | | (.20) | | (.16) | | (.40) | | (.15) | | (.29) |
| Net asset value, end of period | $ | 10.73 | $ | 8.87 | $ | 7.66 | $ | 9.67 | $ | 6.88 |
Total Return D | | | | 17.97% | | (17.23)% | | 43.05% | | (13.75)% |
Ratios to Average Net Assets B,E,F | | | | | | | | | | |
| Expenses before reductions | | .92% | | 1.02% | | 1.09% | | 1.07% | | .98% |
| Expenses net of fee waivers, if any | | | | 1.01% | | 1.04% | | 1.05% | | .98% |
| Expenses net of all reductions | | .92% | | 1.01% | | 1.04% | | 1.05% | | .97% |
| Net investment income (loss) | | 2.34% | | 2.50% | | 3.10% | | 3.05% C | | 2.03% |
| Supplemental Data | | | | | | | | | | |
| Net assets, end of period (000 omitted) | $ | 164,277 | $ | 91,052 | $ | 74,751 | $ | 6,661 | $ | 10,406 |
Portfolio turnover rate G | | | | 29% | | 25% | | 29% H | | 36% |
ACalculated based on average shares outstanding during the period.
BNet investment income (loss) is affected by the timing of the declaration of dividends by any underlying mutual funds or exchange-traded funds (ETFs). Net investment income (loss) of any mutual funds or ETFs is not included in the Fund's net investment income (loss) ratio.
CNet investment income per share reflects one or more large, non-recurring dividend(s) which amounted to $.10 per share. Excluding such non-recurring dividend(s), the ratio of net investment income (loss) to average net assets would have been 2.01%.
DTotal returns would have been lower if certain expenses had not been reduced during the applicable periods shown.
EFees and expenses of any underlying mutual funds or exchange-traded funds (ETFs) are not included in the Fund's expense ratio. The Fund indirectly bears its proportionate share of these expenses. For additional expense information related to investments in Fidelity Central Funds, please refer to the "Investments in Fidelity Central Funds" note found in the Notes to Financial Statements section of the most recent Annual or Semi-Annual report.
FExpense ratios reflect operating expenses of the class. Expenses before reductions do not reflect amounts reimbursed, waived, or reduced through arrangements with the investment adviser, brokerage services, or other offset arrangements, if applicable, and do not represent the amount paid by the class during periods when reimbursements, waivers or reductions occur.
GAmount does not include the portfolio activity of any underlying mutual funds or exchange-traded funds (ETFs).
HPortfolio turnover rate excludes securities received or delivered in-kind.
Fidelity Advisor® International Value Fund Class Z |
| |
| Years ended October 31, | | 2024 | | 2023 | | 2022 | | 2021 | | 2020 |
Selected Per-Share Data | | | | | | | | | | |
| Net asset value, beginning of period | $ | 8.88 | $ | 7.66 | $ | 9.67 | $ | 6.87 | $ | 8.25 |
| Income from Investment Operations | | | | | | | | | | |
Net investment income (loss) A,B | | .26 | | .24 | | .26 | | .30 C | | .16 |
| Net realized and unrealized gain (loss) | | 1.82 | | 1.15 | | (1.86) | | 2.65 | | (1.23) |
| Total from investment operations | | 2.08 | | 1.39 | | (1.60) | | 2.95 | | (1.07) |
| Distributions from net investment income | | (.22) | | (.17) | | (.41) | | (.15) | | (.28) |
| Distributions from net realized gain | | - | | - | | - | | - | | (.03) |
| Total distributions | | (.22) | | (.17) | | (.41) | | (.15) | | (.31) |
| Net asset value, end of period | $ | 10.74 | $ | 8.88 | $ | 7.66 | $ | 9.67 | $ | 6.87 |
Total Return D | | | | 18.20% | | (17.13)% | | 43.35% | | (13.58)% |
Ratios to Average Net Assets B,E,F | | | | | | | | | | |
| Expenses before reductions | | .79% | | .87% | | .94% | | .89% | | .82% |
| Expenses net of fee waivers, if any | | | | .86% | | .89% | | .89% | | .82% |
| Expenses net of all reductions | | .79% | | .86% | | .89% | | .89% | | .81% |
| Net investment income (loss) | | 2.47% | | 2.65% | | 3.25% | | 3.21% C | | 2.19% |
| Supplemental Data | | | | | | | | | | |
| Net assets, end of period (000 omitted) | $ | 394,406 | $ | 158,601 | $ | 118,176 | $ | 11,946 | $ | 2,549 |
Portfolio turnover rate G | | | | 29% | | 25% | | 29% H | | 36% |
ACalculated based on average shares outstanding during the period.
BNet investment income (loss) is affected by the timing of the declaration of dividends by any underlying mutual funds or exchange-traded funds (ETFs). Net investment income (loss) of any mutual funds or ETFs is not included in the Fund's net investment income (loss) ratio.
CNet investment income per share reflects one or more large, non-recurring dividend(s) which amounted to $.10 per share. Excluding such non-recurring dividend(s), the ratio of net investment income (loss) to average net assets would have been 2.17%.
DTotal returns would have been lower if certain expenses had not been reduced during the applicable periods shown.
EFees and expenses of any underlying mutual funds or exchange-traded funds (ETFs) are not included in the Fund's expense ratio. The Fund indirectly bears its proportionate share of these expenses. For additional expense information related to investments in Fidelity Central Funds, please refer to the "Investments in Fidelity Central Funds" note found in the Notes to Financial Statements section of the most recent Annual or Semi-Annual report.
FExpense ratios reflect operating expenses of the class. Expenses before reductions do not reflect amounts reimbursed, waived, or reduced through arrangements with the investment adviser, brokerage services, or other offset arrangements, if applicable, and do not represent the amount paid by the class during periods when reimbursements, waivers or reductions occur.
GAmount does not include the portfolio activity of any underlying mutual funds or exchange-traded funds (ETFs).
HPortfolio turnover rate excludes securities received or delivered in-kind.
Notes to Financial Statements
For the period ended October 31, 2024
1. Organization.
Fidelity International Value Fund (the Fund) is a fund of Fidelity Investment Trust (the Trust) and is authorized to issue an unlimited number of shares. The Trust is registered under the Investment Company Act of 1940, as amended (the 1940 Act), as an open-end management investment company organized as a Massachusetts business trust. Fund offers Class A, Class M, Class C, International Value, Class I and Class Z shares, each of which has equal rights as to assets and voting privileges. Class A, Class M, Class C, Class I and Class Z are Fidelity Advisor classes. Each class has exclusive voting rights with respect to matters that affect that class. Class C shares will automatically convert to Class A shares after a holding period of eight years from the initial date of purchase, with certain exceptions.
2. Investments in Fidelity Central Funds.
Funds may invest in Fidelity Central Funds, which are open-end investment companies generally available only to other investment companies and accounts managed by the investment adviser and its affiliates. The Schedule of Investments lists any Fidelity Central Funds held as an investment as of period end, but does not include the underlying holdings of each Fidelity Central Fund. An investing fund indirectly bears its proportionate share of the expenses of the underlying Fidelity Central Funds.
Based on its investment objective, each Fidelity Central Fund may invest or participate in various investment vehicles or strategies that are similar to those of the investing fund. These strategies are consistent with the investment objectives of the investing fund and may involve certain economic risks which may cause a decline in value of each of the Fidelity Central Funds and thus a decline in the value of the investing fund.
| Fidelity Central Fund | Investment Manager | Investment Objective | Investment Practices | Expense RatioA |
| Fidelity Money Market Central Funds | Fidelity Management & Research Company LLC (FMR) | Each fund seeks to obtain a high level of current income consistent with the preservation of capital and liquidity. | Short-term Investments | Less than .005% |
A Expenses expressed as a percentage of average net assets and are as of each underlying Central Fund's most recent annual or semi-annual shareholder report.
A complete unaudited list of holdings for each Fidelity Central Fund is available upon request or at the Securities and Exchange Commission website at www.sec.gov. In addition, the financial statements of the Fidelity Central Funds which contain the significant accounting policies (including investment valuation policies) of those funds, and are not covered by the Report of Independent Registered Public Accounting Firm, are available on the Securities and Exchange Commission website or upon request.
3. Significant Accounting Policies.
The Fund is an investment company and applies the accounting and reporting guidance of the Financial Accounting Standards Board (FASB) Accounting Standards Codification Topic 946 Financial Services - Investment Companies. The financial statements have been prepared in conformity with accounting principles generally accepted in the United States of America (GAAP), which require management to make certain estimates and assumptions at the date of the financial statements. Actual results could differ from those estimates. Subsequent events, if any, through the date that the financial statements were issued have been evaluated in the preparation of the financial statements. The Fund's Schedule of Investments lists any underlying mutual funds or exchange-traded funds (ETFs) but does not include the underlying holdings of these funds. The following summarizes the significant accounting policies of the Fund:
Investment Valuation. Investments are valued as of 4:00 p.m. Eastern time on the last calendar day of the period. The Board of Trustees (the Board) has designated the Fund's investment adviser as the valuation designee responsible for the fair valuation function and performing fair value determinations as needed. The investment adviser has established a Fair Value Committee (the Committee) to carry out the day-to-day fair valuation responsibilities and has adopted policies and procedures to govern the fair valuation process and the activities of the Committee. In accordance with these fair valuation policies and procedures, which have been approved by the Board, the Fund attempts to obtain prices from one or more third party pricing services or brokers to value its investments. When current market prices, quotations or currency exchange rates are not readily available or reliable, investments will be fair valued in good faith by the Committee, in accordance with the policies and procedures. Factors used in determining fair value vary by investment type and may include market or investment specific events, transaction data, estimated cash flows, and market observations of comparable investments. The frequency that the fair valuation procedures are used cannot be predicted and they may be utilized to a significant extent. The Committee manages the Fund's fair valuation practices and maintains the fair valuation policies and procedures. The Fund's investment adviser reports to the Board information regarding the fair valuation process and related material matters.
The Fund categorizes the inputs to valuation techniques used to value its investments into a disclosure hierarchy consisting of three levels as shown below:
Level 1 - unadjusted quoted prices in active markets for identical investments
Level 2 - other significant observable inputs (including quoted prices for similar investments, interest rates, prepayment speeds, etc.)
Level 3 - unobservable inputs (including the Fund's own assumptions based on the best information available)
Valuation techniques used to value the Fund's investments by major category are as follows:
Equity securities, including restricted securities, for which market quotations are readily available, are valued at the last reported sale price or official closing price as reported by a third party pricing service on the primary market or exchange on which they are traded and are categorized as Level 1 in the hierarchy. In the event there were no sales during the day or closing prices are not available, securities are valued at the last quoted bid price or may be valued using the last available price and are generally categorized as Level 2 in the hierarchy. For foreign equity securities, when market or security specific events arise, comparisons to the valuation of American Depositary Receipts (ADRs), futures contracts, Exchange-Traded Funds (ETFs) and certain indexes as well as quoted prices for similar securities may be used and would be categorized as Level 2 in the hierarchy. For equity securities, including restricted securities, where observable inputs are limited, assumptions about market activity and risk are used and these securities may be categorized as Level 3 in the hierarchy.
Investments in open-end mutual funds, including the Fidelity Central Funds, are valued at their closing net asset value (NAV) each business day and are categorized as Level 1 in the hierarchy.
Changes in valuation techniques may result in transfers in or out of an assigned level within the disclosure hierarchy. The aggregate value of investments by input level as of October 31, 2024 is included at the end of the Fund's Schedule of Investments.
Foreign Currency. Certain Funds may use foreign currency contracts to facilitate transactions in foreign-denominated securities. Gains and losses from these transactions may arise from changes in the value of the foreign currency or if the counterparties do not perform under the contracts' terms.
Foreign-denominated assets, including investment securities, and liabilities are translated into U.S. dollars at the exchange rates at period end. Purchases and sales of investment securities, income and dividends received, and expenses denominated in foreign currencies are translated into U.S. dollars at the exchange rate in effect on the transaction date.
The effects of exchange rate fluctuations on investments are included with the net realized and unrealized gain (loss) on investment securities. Other foreign currency transactions resulting in realized and unrealized gain (loss) are disclosed separately.
Investment Transactions and Income. For financial reporting purposes, the Fund's investment holdings and NAV include trades executed through the end of the last business day of the period. The NAV per share for processing shareholder transactions is calculated as of the close of business of the New York Stock Exchange (NYSE), normally 4:00 p.m. Eastern time and includes trades executed through the end of the prior business day. Gains and losses on securities sold are determined on the basis of identified cost and include proceeds received from litigation. Commissions paid to certain brokers with whom the investment adviser, or its affiliates, places trades on behalf of a fund include an amount in addition to trade execution, which may be rebated back to a fund. Any such rebates are included in net realized gain (loss) on investments in the Statement of Operations. Dividend income is recorded on the ex-dividend date, except for certain dividends from foreign securities where the ex-dividend date may have passed, which are recorded as soon as the Fund is informed of the ex-dividend date. Non-cash dividends included in dividend income, if any, are recorded at the fair market value of the securities received. Income and capital gain distributions from Fidelity Central Funds, if any, are recorded on the ex-dividend date. Investment income is recorded net of foreign taxes withheld where recovery of such taxes is uncertain. Funds may file withholding tax reclaims in certain jurisdictions to recover a portion of amounts previously withheld. Any withholding tax reclaims income is included in the Statement of Operations in foreign taxes withheld. Any receivables for withholding tax reclaims are included in the Statement of Assets and Liabilities in reclaims receivable. The Fund has filed tax reclaims for previously withheld taxes on dividends earned in certain European Union (EU) countries. These additional filings are subject to various administrative proceedings by the local jurisdictions' tax authorities within the EU, as well as a number of related judicial proceedings. Income recognized for EU reclaims is included with other reclaims in the Statement of Operations in foreign taxes withheld. These reclaims are recorded when the amount is known and there are no significant uncertainties on collectability.
Class Allocations and Expenses. Investment income, realized and unrealized capital gains and losses, common expenses of a fund, and certain fund-level expense reductions, if any, are allocated daily on a pro-rata basis to each class based on the relative net assets of each class to the total net assets of a fund. Each class differs with respect to transfer agent and distribution and service plan fees incurred, as applicable. Certain expense reductions may also differ by class, if applicable. For the reporting period, the allocated portion of income and expenses to each class as a percent of its average net assets may vary due to the timing of recording these transactions in relation to fluctuating net assets of the classes. Expenses directly attributable to a fund are charged to that fund. Expenses attributable to more than one fund are allocated among the respective funds on the basis of relative net assets or other appropriate methods. Expenses included in the accompanying financial statements reflect the expenses of that fund and do not include any expenses associated with any underlying mutual funds or exchange-traded funds (ETFs). Although not included in a fund's expenses, a fund indirectly bears its proportionate share of these expenses through the net asset value of each underlying mutual fund or exchange-traded fund (ETF). Expense estimates are accrued in the period to which they relate and adjustments are made when actual amounts are known.
Income Tax Information and Distributions to Shareholders. Each year, the Fund intends to qualify as a regulated investment company under Subchapter M of the Internal Revenue Code, including distributing substantially all of its taxable income and realized gains. As a result, no provision for U.S. Federal income taxes is required. As of October 31, 2024, the Fund did not have any unrecognized tax benefits in the financial statements; nor is the Fund aware of any tax positions for which it is reasonably possible that the total amounts of unrecognized tax benefits will significantly change in the next twelve months. The Fund files a U.S. federal tax return, in addition to state and local tax returns as required. The Fund's federal income tax returns are subject to examination by the Internal Revenue Service (IRS) for a period of three fiscal years after they are filed. State and local tax returns may be subject to examination for an additional fiscal year depending on the jurisdiction. Foreign taxes are provided for based on the Fund's understanding of the tax rules and rates that exist in the foreign markets in which it invests.
Distributions are declared and recorded on the ex-dividend date. Income and capital gain distributions are declared separately for each class. Income and capital gain distributions are determined in accordance with income tax regulations, which may differ from GAAP. In addition, the Fund claimed a portion of the payment made to redeeming shareholders as a distribution for income tax purposes.
Capital accounts within the financial statements are adjusted for permanent book-tax differences. These adjustments have no impact on net assets or the results of operations. Capital accounts are not adjusted for temporary book-tax differences which will reverse in a subsequent period.
Book-tax differences are primarily due to foreign currency transactions, passive foreign investment companies(PFIC), capital loss carryforwards and losses deferred due to wash sales.
As of period end, the cost and unrealized appreciation (depreciation) in securities, and derivatives if applicable, for federal income tax purposes were as follows:
| Gross unrealized appreciation | $247,348,887 |
| Gross unrealized depreciation | (56,728,861) |
| Net unrealized appreciation (depreciation) | $190,620,026 |
| Tax Cost | $1,303,005,829 |
The tax-based components of distributable earnings as of period end were as follows:
| Undistributed ordinary income | $31,190,247 |
| Capital loss carryforward | $(87,713,748) |
| Net unrealized appreciation (depreciation) on securities and other investments | $190,507,459 |
Capital loss carryforwards are only available to offset future capital gains of the Fund to the extent provided by regulations and may be limited. The capital loss carryforward information presented below, including any applicable limitation, is estimated as of fiscal period end and is subject to adjustment.
Short-term | $(39,068,564) |
Long-term | (48,645,184) |
| Total capital loss carryforward | $(87,713,748) |
Due to large redemptions in a prior period, approximately $26,969,064 of the Fund's realized capital losses are subject to limitation. Due to this limitation, the Fund will only be permitted to use approximately $5,836,972 of those capital losses per year to offset capital gains.
The tax character of distributions paid was as follows:
| | October 31, 2024 | October 31, 2023 |
| Ordinary Income | $16,926,327 | $ 11,902,522 |
| Total | $16,926,327 | $ 11,902,522 |
Restricted Securities (including Private Placements). Funds may invest in securities that are subject to legal or contractual restrictions on resale. These securities generally may be resold in transactions exempt from registration or to the public if the securities are registered. Disposal of these securities may involve time-consuming negotiations and expense, and prompt sale at an acceptable price may be difficult. Information regarding restricted securities held at period end is included at the end of the Schedule of Investments, if applicable.
New Accounting Pronouncement. In November 2023, the FASB issued Accounting Standards Update (ASU) 2023-07 Segment Reporting (Topic 280): Improvements to Reportable Segment Disclosures. Effective for fiscal years beginning after December 15, 2023 and interim periods within fiscal years beginning after December 15, 2024, the amendments enhance required disclosures of segment information for public entities on an annual and interim basis. The ASU allows for early adoption with updates applied retrospectively. Management is currently evaluating the impact of the ASU but does not expect this guidance to materially impact the financial statements.
4. Purchases and Sales of Investments.
Purchases and sales of securities, other than short-term securities and in-kind transactions, as applicable, are noted in the table below.
| | Purchases ($) | Sales ($) |
| Fidelity International Value Fund | 886,772,470 | 311,424,446 |
5. Fees and Other Transactions with Affiliates
Management Fee. Fidelity Management & Research Company LLC (the investment adviser) and its affiliates provide the Fund with investment management related services for which the Fund pays a monthly management fee.
Effective March 1, 2024, the Fund's management contract was amended to incorporate administrative services previously covered under separate services agreements (Transfer Agent and Accounting agreements). The amended contract incorporates a basic fee rate that may vary by class (subject to a performance adjustment). The investment adviser or an affiliate pays certain expenses of managing and operating the Fund out of each class's management fee. Each class of the Fund pays a management fee to the investment adviser. The management fee is calculated and paid to the investment adviser every month. The management fee is determined by calculating a basic fee and then applying a performance adjustment. When determining a class's basic fee, a mandate rate is calculated based on the monthly average net assets of a group of funds advised by FMR within a designated asset class. A discount rate is subtracted from the mandate rate once the Fund's monthly average net assets reach a certain level. The mandate rate and discount rate may vary by class. The annual basic fee rate for a class of shares of the Fund is the lesser of (1) the class's mandate rate reduced by the class's discount rate (if applicable) or (2) the amount set forth in the following table.
| | Maximum Management Fee Rate % |
| Class A | .88 |
| Class M | .88 |
| Class C | .88 |
| International Value | .87 |
| Class I | .87 |
| Class Z | .72 |
One-twelfth of the basic fee rate for a class is applied to the average net assets of the class for the month, giving a dollar amount which is the basic fee for the class for that month. A different management fee rate may be applicable to each class of the Fund. The difference between classes is the result of separate arrangements for class-level services and/or waivers of certain expenses. It is not the result of any difference in advisory or custodial fees or other expenses related to the management of the Fund's assets, which do not vary by class. For the portion of the reporting period on or after March 1, 2024, the total annualized management fee rates were as follows:
| | Total Management Fee Rate % |
| Class A | .86 |
| Class M | .86 |
| Class C | .86 |
| International Value | .81 |
| Class I | .85 |
| Class Z | .72 |
Prior to March 1, 2024, the management fee was the sum of an individual fund fee rate that was based on an annual rate of .45% of the Fund's average net assets and an annualized group fee rate that averaged .22% during the period. The group fee rate was based upon the monthly average net assets of a group of registered investment companies with which the investment adviser has management contracts. The group fee rate decreased as assets under management increased and increased as assets under management decreased. For the portion of the reporting period prior to March 1, 2024, the total annualized management fee rate was .67%.
The performance adjustment rate is calculated monthly by comparing over the performance period the Fund's performance to that of the performance adjustment index listed below.
| | Performance Adjustment Index |
| Fidelity International Value Fund | MSCI EAFE Value Index |
For the purposes of calculating the performance adjustment for the Fund, the Fund's investment performance is based on the performance of International Value. To the extent that other classes of the Fund have higher expenses, this could result in those classes bearing a larger positive performance adjustment and smaller negative performance adjustment than would be the case if each class's own performance were considered. The performance period is the most recent 36 month period. The maximum annualized performance adjustment rate is ±.20% of the Fund's average net assets over the performance period. The performance adjustment rate is divided by twelve and multiplied by the Fund's average net assets over the performance period, and the resulting dollar amount is proportionately added to or subtracted from a class's basic fee. For the entire reporting period, the total annual performance adjustment was .03%.
Effective March 1, 2024, the Fund's sub-advisory agreements with FMR Investment Management (UK) Limited, Fidelity Management & Research (Hong Kong) Limited, and Fidelity Management & Research (Japan) Limited were amended to provide that the investment adviser pays each sub-adviser monthly fees equal to 110% of the sub-adviser's costs for providing sub-advisory services.
Effective March 1, 2024, the Fund's sub-advisory agreement with FIL Investment Advisors (FIA) was amended to provide that the investment adviser pays FIA monthly fees at an annual rate of 0.44% with respect to the average daily net assets of the Fund managed by FIA. FIA in turn pays FIA(UK).
Distribution and Service Plan Fees. In accordance with Rule 12b-1 of the 1940 Act, the Fund has adopted separate Distribution and Service Plans for each class of shares. Certain classes pay Fidelity Distributors Company LLC (FDC), an affiliate of the investment adviser, separate Distribution and Service Fees, each of which is based on an annual percentage of each class' average net assets. In addition, FDC may pay financial intermediaries for selling shares of the Fund and providing shareholder support services. For the period, the Distribution and Service Fee rates, total fees and amounts retained by FDC were as follows:
| | Distribution Fee | Service Fee | Total Fees ($) | Retained by FDC ($) |
| Class A | - % | .25% | 50,689 | 4,442 |
| Class M | .25% | .25% | 24,010 | - |
| Class C | .75% | .25% | 25,056 | 2,789 |
| | | | 99,755 | 7,231 |
Sales Load. FDC may receive a front-end sales charge of up to 5.75% for selling Class A shares and 3.50% for selling Class M shares, some of which is paid to financial intermediaries for selling shares of the Fund. Depending on the holding period, FDC may receive contingent deferred sales charges levied on Class A, Class M and Class C redemptions. The deferred sales charges are 1.00% for Class C shares, 1.00% for certain purchases of Class A shares and .25% for certain purchases of Class M shares.
For the period, sales charge amounts retained by FDC were as follows:
| | Retained by FDC ($) |
| Class A | 7,667 |
| Class M | 390 |
Class CA | 157 |
| | 8,214 |
A When Class C shares are initially sold, FDC pays commissions from its own resources to financial intermediaries through which the sales are made.
Transfer Agent Fees. Fidelity Investments Institutional Operations Company LLC (FIIOC), an affiliate of the investment adviser, is the transfer, dividend disbursing and shareholder servicing agent for each class of the Fund. Effective March 1, 2024, the Fund's management contract was amended to incorporate transfer agent services and associated fees previously covered under a separate services agreement. FIIOC pays for typesetting, printing and mailing of shareholder reports, except proxy statements.
During the period December 1, 2023 through February 29, 2024, the transfer agent fees for each class were a fixed annual rate of class-level average net assets as follows:
| | % of Class-Level Average Net Assets |
| Class A | .2000 |
| Class M | .2000 |
| Class C | .2000 |
| International Value | .1862 |
| Class I | .1887 |
| Class Z | .0420 |
Prior to December 1, 2023, FIIOC received account fees and asset-based fees that varied according to the account size and type of account of the shareholders of the respective classes of the Fund Class Z. FIIOC received an asset-based fee of Class Z's average net assets. For the portion of the reporting period prior to March 1, 2024, the fees were equivalent to the following annualized rates:
| | Amount ($) | % of Class-Level Average Net Assets |
| Class A | 13,318 | .21 |
| Class M | 3,233 | .21 |
| Class C | 1,788 | .21 |
| International Value | 320,255 | .19 |
| Class I | 64,834 | .19 |
| Class Z | 27,822 | .04 |
| 431,250 | |
Accounting Fees. Fidelity Service Company, Inc. (FSC), an affiliate of the investment adviser, maintains the Fund's accounting records. Effective March 1, 2024, the Fund's management contract was amended to incorporate accounting services and associated fees previously covered under a separate services agreement.
During the period December 1, 2023 through February 29, 2024, the accounting fees were a fixed annual rate of average net assets as follows:
| | % of Average Net Assets |
| Fidelity International Value Fund | .0464 |
Prior to December 1, 2023, the accounting fee was based on the level of average net assets for each month. For the portion of the reporting period prior to March 1, 2024, the fees were equivalent to the following annualized rates:
| | % of Average Net Assets |
| Fidelity International Value Fund | .05 |
Brokerage Commissions. A portion of portfolio transactions were placed with brokerage firms which are affiliates of the investment adviser. Brokerage commissions are included in net realized gain (loss) and change in net unrealized appreciation (depreciation) in the Statement of Operations. The commissions paid to these affiliated firms were as follows:
| | Amount ($) |
| Fidelity International Value Fund | 223 |
Interfund Lending Program. Pursuant to an Exemptive Order issued by the Securities and Exchange Commission (the SEC), the Fund, along with other registered investment companies having management contracts with Fidelity Management & Research Company LLC (FMR), or other affiliated entities of FMR, may participate in an interfund lending program. This program provides an alternative credit facility allowing the Fund to borrow from, or lend money to, other participating affiliated funds at rates that are beneficial to both the borrowing and lending fund. Borrowings under the program are generally for temporary or emergency purposes, including meeting fund shareholder redemptions. The interfund loan rate is determined, as specified in the Exemptive Order, by averaging, (1) the higher of the overnight time deposit rate and the current overnight repurchase agreement rate, and (2) a benchmark rate representing the lowest bank loan rate available to the funds. At period end, there were no interfund loans outstanding. Activity in this program during the period for which loans were outstanding was as follows:
| | Borrower or Lender | Average Loan Balance ($) | Weighted Average Interest Rate | Interest Expense ($) |
| Fidelity International Value Fund | Borrower | 6,717,500 | 5.57% | 2,079 |
Interfund Trades. Funds may purchase from or sell securities to other Fidelity Funds under procedures adopted by the Board. The procedures have been designed to ensure these interfund trades are executed in accordance with Rule 17a-7 of the 1940 Act. Any interfund trades are included within the respective purchases and sales amounts shown in the Purchases and Sales of Investments note. Interfund trades during the period are noted in the table below.
| | Purchases ($) | Sales ($) | Realized Gain (Loss)($) |
| Fidelity International Value Fund | 57,269,315 | 17,011,297 | 2,036,115 |
6. Committed Line of Credit.
Certain Funds participate with other funds managed by the investment adviser or an affiliate in a $4.25 billion credit facility (the "line of credit") to be utilized for temporary or emergency purposes to fund shareholder redemptions or for other short-term liquidity purposes. The participating funds have agreed to pay commitment fees on their pro-rata portion of the line of credit, which are reflected in Miscellaneous expenses on the Statement of Operations, and are listed below. During the period, there were no borrowings on this line of credit.
| | Amount ($) |
| Fidelity International Value Fund | 1,623 |
7. Security Lending.
Funds lend portfolio securities from time to time in order to earn additional income. Lending agents are used, including National Financial Services (NFS), an affiliate of the investment adviser. Pursuant to a securities lending agreement, NFS will receive a fee, which is capped at 9.9% of a fund's daily lending revenue, for its services as lending agent. A fund may lend securities to certain qualified borrowers, including NFS. On the settlement date of the loan, a fund receives collateral (in the form of U.S. Treasury obligations, letters of credit and/or cash) against the loaned securities and maintains collateral in an amount not less than 100% of the market value of the loaned securities during the period of the loan. The market value of the loaned securities is determined at the close of business of a fund and any additional required collateral is delivered to a fund on the next business day. A fund or borrower may terminate the loan at any time, and if the borrower defaults on its obligation to return the securities loaned because of insolvency or other reasons, a fund may apply collateral received from the borrower against the obligation. A fund may experience delays and costs in recovering the securities loaned. Any cash collateral received is invested in the Fidelity Securities Lending Cash Central Fund. Any loaned securities are identified as such in the Schedule of Investments, and the value of loaned securities and cash collateral at period end, as applicable, are presented in the Statement of Assets and Liabilities. Security lending income represents the income earned on investing cash collateral, less rebates paid to borrowers and any lending agent fees associated with the loan, plus any premium payments received for lending certain types of securities. Security lending income is presented in the Statement of Operations as a component of income from Fidelity Central Funds. Affiliated security lending activity, if any, was as follows:
| | Total Security Lending Fees Paid to NFS ($) | Security Lending Income From Securities Loaned to NFS ($) | Value of Securities Loaned to NFS at Period End ($) |
| Fidelity International Value Fund | 483 | - | - |
8. Expense Reductions.
Through arrangements with the Fund's custodian and each class' transfer agent, credits realized as a result of certain uninvested cash balances were used to reduce the Fund's expenses. During the period, transfer agent credits reduced each class' expenses as noted in the table below.
| | Expense reduction ($) |
| | |
| Class M | 9 |
In addition, during the period the investment adviser or an affiliate reimbursed and/or waived a portion of fund-level operating expenses in the amount of $38,573.
9. Distributions to Shareholders.
Distributions to shareholders of each class were as follows:
| | Year ended October 31, 2024 | Year ended October 31, 2023 |
| Fidelity International Value Fund | | |
| Distributions to shareholders | | |
| Class A | $348,977 | $221,998 |
| Class M | 72,953 | 54,560 |
| Class C | 27,673 | 19,445 |
| International Value | 10,313,599 | 7,434,045 |
| Class I | 2,133,490 | 1,572,298 |
| Class Z | 4,029,635 | 2,600,176 |
Total | $16,926,327 | $11,902,522 |
10. Share Transactions.
Share transactions for each class were as follows and may contain in-kind transactions, automatic conversions between classes or exchanges between affiliated funds:
| | Shares | Shares | Dollars | Dollars |
| | Year ended October 31, 2024 | Year ended October 31, 2023 | Year ended October 31, 2024 | Year ended October 31, 2023 |
| Fidelity International Value Fund | | | | |
| Class A | | | | |
| Shares sold | 409,712 | 623,112 | $4,210,717 | $5,518,527 |
| Reinvestment of distributions | 36,641 | 26,113 | 346,659 | 219,873 |
| Shares redeemed | (457,274) | (293,310) | (4,730,489) | (2,616,908) |
| Net increase (decrease) | (10,921) | 355,915 | $(173,113) | $3,121,492 |
| Class M | | | | |
| Shares sold | 25,444 | 71,877 | $257,449 | $625,739 |
| Reinvestment of distributions | 7,505 | 6,304 | 71,094 | 53,141 |
| Shares redeemed | (65,455) | (61,576) | (674,620) | (547,185) |
| Net increase (decrease) | (32,506) | 16,605 | $(346,077) | $131,695 |
| Class C | | | | |
| Shares sold | 24,053 | 71,043 | $245,624 | $632,329 |
| Reinvestment of distributions | 2,901 | 2,290 | 27,673 | 19,445 |
| Shares redeemed | (73,408) | (92,669) | (749,686) | (826,342) |
| Net increase (decrease) | (46,454) | (19,336) | $(476,389) | $(174,568) |
| International Value | | | | |
| Shares sold | 43,576,697 | 14,718,149 | $455,952,864 | $131,108,890 |
| Reinvestment of distributions | 930,687 | 764,993 | 8,794,774 | 6,441,242 |
| Shares redeemed | (11,974,365) | (13,435,468) | (123,234,962) | (119,112,195) |
| Net increase (decrease) | 32,533,019 | 2,047,674 | $341,512,676 | $18,437,937 |
| Class I | | | | |
| Shares sold | 11,977,758 | 6,837,587 | $126,009,409 | $61,109,496 |
| Reinvestment of distributions | 221,911 | 184,152 | 2,101,443 | 1,552,405 |
| Shares redeemed | (7,158,179) | (6,517,142) | (75,842,662) | (59,256,457) |
| Net increase (decrease) | 5,041,490 | 504,597 | $52,268,190 | $3,405,444 |
| Class Z | | | | |
| Shares sold | 25,315,241 | 10,634,134 | $265,920,733 | $95,268,462 |
| Reinvestment of distributions | 352,743 | 273,689 | 3,336,691 | 2,304,458 |
| Shares redeemed | (6,806,180) | (8,469,262) | (71,439,699) | (77,027,430) |
| Net increase (decrease) | 18,861,804 | 2,438,561 | $197,817,725 | $20,545,490 |
11. Other.
A fund's organizational documents provide former and current trustees and officers with a limited indemnification against liabilities arising in connection with the performance of their duties to the fund. In the normal course of business, a fund may also enter into contracts that provide general indemnifications. A fund's maximum exposure under these arrangements is unknown as this would be dependent on future claims that may be made against a fund. The risk of material loss from such claims is considered remote.
12. Risk and Uncertainties.
Many factors affect a fund's performance. Developments that disrupt global economies and financial markets, such as pandemics, epidemics, outbreaks of infectious diseases, war, terrorism, and environmental disasters, may significantly affect a fund's investment performance. The effects of these developments to a fund will be impacted by the types of securities in which a fund invests, the financial condition, industry, economic sector, and geographic location of an issuer, and a fund's level of investment in the securities of that issuer. Significant concentrations in security types, issuers, industries, sectors, and geographic locations may magnify the factors that affect a fund's performance.
Report of Independent Registered Public Accounting Firm
To the Board of Trustees of Fidelity Investment Trust and the Shareholders of Fidelity International Value Fund:
Opinion on the Financial Statements and Financial Highlights
We have audited the accompanying statement of assets and liabilities of Fidelity International Value Fund (the "Fund"), a fund of Fidelity Investment Trust, including the schedule of investments, as of October 31, 2024, the related statement of operations for the year then ended, the statement of changes in net assets for each of the two years in the period then ended, the financial highlights for each of the five years in the period then ended, and the related notes. In our opinion, the financial statements and financial highlights present fairly, in all material respects, the financial position of the Fund as of October 31, 2024, and the results of its operations for the year then ended, the changes in its net assets for each of the two years in the period then ended, and the financial highlights for each of the five years in the period then ended in conformity with accounting principles generally accepted in the United States of America.
Basis for Opinion
These financial statements and financial highlights are the responsibility of the Fund's management. Our responsibility is to express an opinion on the Fund's financial statements and financial highlights based on our audits. We are a public accounting firm registered with the Public Company Accounting Oversight Board (United States) (PCAOB) and are required to be independent with respect to the Fund in accordance with the U.S. federal securities laws and the applicable rules and regulations of the Securities and Exchange Commission and the PCAOB.
We conducted our audits in accordance with the standards of the PCAOB. Those standards require that we plan and perform the audit to obtain reasonable assurance about whether the financial statements and financial highlights are free of material misstatement, whether due to error or fraud. The Fund is not required to have, nor were we engaged to perform, an audit of its internal control over financial reporting. As part of our audits, we are required to obtain an understanding of internal control over financial reporting but not for the purpose of expressing an opinion on the effectiveness of the Fund's internal control over financial reporting. Accordingly, we express no such opinion.
Our audits included performing procedures to assess the risks of material misstatement of the financial statements and financial highlights, whether due to error or fraud, and performing procedures that respond to those risks. Such procedures included examining, on a test basis, evidence regarding the amounts and disclosures in the financial statements and financial highlights. Our audits also included evaluating the accounting principles used and significant estimates made by management, as well as evaluating the overall presentation of the financial statements and financial highlights. Our procedures included confirmation of securities owned as of October 31, 2024, by correspondence with the custodian and brokers; when replies were not received from brokers, we performed other auditing procedures. We believe that our audits provide a reasonable basis for our opinion.
/s/ Deloitte & Touche LLP
Boston, Massachusetts
December 16, 2024
We have served as the auditor of one or more of the Fidelity investment companies since 1999.
Distributions
(Unaudited)The dividend and capital gains distributions for the fund(s) are available on Fidelity.com or Institutional.Fidelity.com.
The fund designates $672,350 of distributions paid during the fiscal year ended 2024 as qualifying to be taxed as section 163(j) interest dividends.
Class A, Class M, Class C, International Value, Class I and Class Z designates 100% of each dividend distributed during the fiscal year as amounts which may be taken into account as a dividend for purposes of the maximum rate under section 1(h)(11) of the Internal Revenue Code.
The amounts per share which represent income derived from sources within, and taxes paid to, foreign countries or possessions of the United States are as follows:
| | Pay Date | Income | Taxes |
| Fidelity International Value Fund | | | |
| Class A | 12/11/2023 | 0.1812 | 0.0160 |
| Class M | 12/11/2023 | 0.1563 | 0.0160 |
| Class C | 12/11/2023 | 0.1093 | 0.0160 |
| International Value | 12/11/2023 | 0.2042 | 0.0160 |
| Class I | 12/11/2023 | 0.2042 | 0.0160 |
| Class Z | 12/11/2023 | 0.2177 | 0.0160 |
The fund will notify shareholders in January 2025 of amounts for use in preparing 2024 income tax returns.
Item 8: Changes in and Disagreements with Accountants for Open-End Management Investment Companies
(Unaudited)
Note: This is not applicable for any fund included in this document.
Item 9: Proxy Disclosures for Open-End Management Investment Companies
(Unaudited)
| A special meeting of shareholders was held on July 16, 2024. The results of votes taken among shareholders on the proposal before them are reported below. Each vote reported represents one dollar of net asset value held on the record date for the meeting. |
| Proposal 1 |
| To elect a Board of Trustees. |
| | # of Votes | % of Votes |
| Bettina Doulton |
| Affirmative | 128,529,177,643.56 | 98.18 |
| Withheld | 2,378,037,364.30 | 1.82 |
| TOTAL | 130,907,215,007.85 | 100.00 |
| Robert A. Lawrence |
| Affirmative | 128,253,389,899.05 | 97.97 |
| Withheld | 2,653,825,108.81 | 2.03 |
| TOTAL | 130,907,215,007.85 | 100.00 |
| Vijay C. Advani |
| Affirmative | 128,531,418,228.19 | 98.19 |
| Withheld | 2,375,796,779.66 | 1.81 |
| TOTAL | 130,907,215,007.85 | 100.00 |
| Thomas P. Bostick |
| Affirmative | 128,495,261,591.41 | 98.16 |
| Withheld | 2,411,953,416.44 | 1.84 |
| TOTAL | 130,907,215,007.85 | 100.00 |
| Donald F. Donahue |
| Affirmative | 128,407,878,996.00 | 98.09 |
| Withheld | 2,499,336,011.85 | 1.91 |
| TOTAL | 130,907,215,007.85 | 100.00 |
| Vicki L. Fuller |
| Affirmative | 128,625,540,095.19 | 98.26 |
| Withheld | 2,281,674,912.66 | 1.74 |
| TOTAL | 130,907,215,007.85 | 100.00 |
| Patricia L. Kampling |
| Affirmative | 128,668,729,281.34 | 98.29 |
| Withheld | 2,238,485,726.51 | 1.71 |
| TOTAL | 130,907,215,007.85 | 100.00 |
| Thomas A. Kennedy |
| Affirmative | 128,499,824,239.79 | 98.16 |
| Withheld | 2,407,390,768.06 | 1.84 |
| TOTAL | 130,907,215,007.85 | 100.00 |
| Oscar Munoz |
| Affirmative | 128,386,109,391.05 | 98.07 |
| Withheld | 2,521,105,616.80 | 1.93 |
| TOTAL | 130,907,215,007.85 | 100.00 |
| Karen B. Peetz |
| Affirmative | 128,603,731,113.82 | 98.24 |
| Withheld | 2,303,483,894.03 | 1.76 |
| TOTAL | 130,907,215,007.85 | 100.00 |
| David M. Thomas |
| Affirmative | 128,384,899,342.98 | 98.07 |
| Withheld | 2,522,315,664.88 | 1.93 |
| TOTAL | 130,907,215,007.85 | 100.00 |
| Susan Tomasky |
| Affirmative | 128,556,148,461.60 | 98.20 |
| Withheld | 2,351,066,546.25 | 1.80 |
| TOTAL | 130,907,215,007.85 | 100.00 |
| Michael E. Wiley |
| Affirmative | 128,264,934,978.34 | 97.98 |
| Withheld | 2,642,280,029.51 | 2.02 |
| TOTAL | 130,907,215,007.85 | 100.00 |
| | | |
| Proposal 1 reflects trust-wide proposal and voting results. |
Item 10: Remuneration Paid to Directors, Officers, and others of Open-End Management Investment Companies
(Unaudited)
Note: This information is disclosed as part of the financial statements for each Fund as part of Item 7: Financial Statements and Financial Highlights for Open-End Management Investment companies.
Item 11: Statement Regarding Basis for Approval of Investment Advisory Contract
(Unaudited)
Board Approval of Investment Advisory Contracts and Management Fees
Fidelity International Value Fund
Each year, the Board of Trustees, including the Independent Trustees (together, the Board), considers the renewal of the fund's management contract with Fidelity Management & Research Company LLC (FMR) and certain affiliates and the sub-advisory agreements (together, the Advisory Contracts) for the fund. FMR and the sub-advisers are referred to herein as the Investment Advisers. The Board, assisted by the advice of fund counsel and Independent Trustees' counsel, requests and considers a broad range of information relevant to the renewal of the Advisory Contracts throughout the year.
The Board meets regularly and, at each of its meetings, covers an extensive agenda of topics and materials and considers factors that are relevant to its annual consideration of the renewal of the fund's Advisory Contracts, including the services and support provided to the fund and its shareholders. The Board, acting directly and through its Committees (each of which is composed of and chaired by Independent Trustees), requests and receives information concerning the annual consideration of the renewal of the fund's Advisory Contracts. The Board also meets as needed to review matters specifically related to the Board's annual consideration of the renewal of the Advisory Contracts. Members of the Board may also meet with trustees of other Fidelity funds through joint ad hoc committees to discuss certain matters relevant to all of the Fidelity funds.
At its May 2024 meeting, the Board unanimously determined to renew the fund's Advisory Contracts. In reaching its determination, the Board considered all factors it believed relevant, including (i) the nature, extent, and quality of the services provided to the fund and its shareholders (including the investment performance of the fund); (ii) the competitiveness relative to peer funds of the fund's management fee and the total expense ratio of a representative class (the retail class, which was selected because it was the largest class without 12b-1 fees); (iii) the total costs of the services provided by and the profits realized by FMR and its affiliates (Fidelity) from its relationships with the fund; and (iv) the extent to which, if any, economies of scale exist and are realized as the fund grows, and whether any economies of scale are appropriately shared with fund shareholders. The Board also considered the broad range of investment choices available to shareholders from FMR's competitors and that the fund's shareholders have chosen to invest in the fund, which is part of the Fidelity family of funds. The Board's decision to renew the Advisory Contracts was not based on any single factor.
The Board reached a determination, with the assistance of fund counsel and Independent Trustees' counsel and through the exercise of its business judgment, that the renewal of the Advisory Contracts was in the best interests of the fund and its shareholders and that the compensation payable under the Advisory Contracts was fair and reasonable in light of all of the surrounding circumstances.
Nature, Extent, and Quality of Services Provided. The Board considered staffing as it relates to the fund, including the backgrounds and experience of investment personnel of the Investment Advisers, and also considered the Investment Advisers' implementation of the fund's investment program. The Independent Trustees also had discussions with senior management of Fidelity's investment operations and investment groups. The Board considered the structure of the investment personnel compensation program and whether this structure provides appropriate incentives to act in the best interests of the fund. Additionally, the Board considered the portfolio managers' investments, if any, in the funds that they manage.
Resources Dedicated to Investment Management and Support Services. The Board and the Fund Oversight and Research Committees reviewed the general qualifications and capabilities of Fidelity's investment staff, including its size, education, experience, and resources, as well as Fidelity's approach to recruiting, training, managing, and compensating investment personnel. The Board noted the resources devoted to expansion of Fidelity's global investment organization, and that Fidelity's analysts have extensive resources, tools, and capabilities that allow them to conduct sophisticated quantitative and fundamental analysis, as well as credit analysis of issuers, counterparties, and guarantors. Further, the Board considered that Fidelity's investment professionals have sufficient access to global information and data so as to provide competitive investment results over time, and that those professionals also have access to sophisticated tools that permit them to assess portfolio construction and risk and performance attribution characteristics continuously, as well as to transmit new information and research conclusions rapidly around the world. Additionally, in its deliberations, the Board considered Fidelity's trading, risk management, compliance, and technology and operations capabilities and resources, which are integral parts of the investment management process.
Shareholder and Administrative Services. The Board considered (i) the nature, extent, quality, and cost of advisory, administrative, shareholder, transfer agency, and pricing and bookkeeping services performed by the Investment Advisers and their affiliates under the Advisory Contracts; (ii) the nature and extent of Fidelity's supervision of third party service providers, principally custodians, subcustodians, and pricing vendors; and (iii) the resources devoted by Fidelity to, and the record of compliance with, the fund's compliance policies and procedures. The Board also reviewed the allocation of fund brokerage, including allocations to brokers affiliated with the Investment Advisers, the use of brokerage commissions to pay fund expenses, and the use of "soft" commission dollars to pay for research services. The Board also considered the fund's securities lending activities and any payments made to Fidelity relating to securities lending under a separate agreement.
The Board noted that the growth of fund assets over time across the complex allows Fidelity to reinvest in the development of services designed to enhance the value and convenience of the Fidelity funds as investment vehicles. These services include 24-hour access to account information and market information over the Internet and through telephone representatives, investor education materials, and asset allocation tools. The Board also considered that it reviews customer service metrics such as telephone response times, continuity of services on the website and metrics addressing services at Fidelity Investor Centers.
Investment in a Large Fund Family. The Board considered the benefits to shareholders of investing in a fund that is part of a large family of funds offering a variety of investment disciplines and providing a large variety of fund investor services. The Board noted that Fidelity had taken, or had made recommendations that resulted in the Fidelity funds taking, a number of actions over the previous year that benefited particular funds and/or the Fidelity funds in general.
Investment Performance. The Board took into account discussions that occur with representatives of the Investment Advisers, and reports that it receives, at Board meetings throughout the year, relating to fund investment performance. In this regard the Board noted that as part of regularly scheduled fund reviews and other reports to the Board on fund performance, the Board considered annualized return information for the fund for different time periods, measured against an appropriate securities market index (benchmark index) and an appropriate peer group of funds with similar objectives (peer group). The Board also considered information about performance attribution. In its ongoing evaluation of fund investment performance, the Board gives particular attention to information indicating changes in performance of the funds over different time periods and discussed with the Investment Advisers the reasons for any overperformance or underperformance.
In addition to reviewing absolute and relative fund performance, the Independent Trustees periodically consider the appropriateness of fund performance metrics in evaluating the results achieved. The Independent Trustees generally give greater weight to fund performance over longer time periods than over shorter time periods. Depending on the circumstances, the Independent Trustees may be satisfied with a fund's performance notwithstanding that it lags its benchmark index or peer group for certain periods.
Based on its review, the Board concluded that the nature, extent, and quality of services provided to the fund under the Advisory Contracts should continue to benefit the shareholders of the fund.
Competitiveness of Management Fee and Total Expense Ratio. The Board was provided with information regarding industry trends in management fees and expenses. The Board considered that, effective March 1, 2024, an amended Advisory Contract with FMR went into effect with class-level management fees based on tiered schedules and subject to a maximum class-level rate (the management fee). The Board also considered that in exchange for the variable management fee, each class of the fund receives investment advisory, management, administrative, transfer agent, and pricing and bookkeeping services. In its review of the management fee and total expense ratio of the retail class, the Board considered a pro forma management fee rate for the retail class as if it had been in effect for the 12-month period ended September 30, 2023, as well as other third-party fund expenses, as applicable, such as custodial, legal, and audit fees and any fund-paid 12b-1 fees. The Board noted that Fidelity may agree to waive fees or reimburse expenses from time to time, and the extent to which, if any, it has done so for the fund. The Board also considered information about the impact of the fund's performance adjustment.
Comparisons of Management Fees and Total Expense Ratios. Among other things, the Board reviewed data for selected groups of competitive funds and classes (referred to as "mapped groups") that were compiled by Fidelity based on combining similar investment objective categories (as classified by Morningstar) that have comparable investment mandates. The data reviewed by the Board included (i) gross management fee comparisons (before taking into account expense reimbursements or caps and without taking into account the fund's performance adjustment) relative to the total universe of funds within the mapped group; (ii) gross management fee comparisons relative to a subset of non-Fidelity funds in the mapped group that are similar in size and management fee structure to the fund (referred to as the "asset size peer group"); (iii) total expense comparisons of the retail class of the fund relative to funds and classes in the mapped group that have a similar sales load structure to the retail class of the fund (referred to as the "similar sales load structure group"); and (iv) total expense comparisons of the retail class of the fund relative to funds and classes in the similar sales load structure group that are similar in size and management fee structure to the fund (referred to as the "total expense asset size peer group"). The total expense asset size peer group comparison excludes performance adjustments and fund-paid 12b-1 fees to eliminate variability in fee structures.
The information provided to the Board indicated that the fund's management fee rate ranked below the competitive median of the mapped group for the 12-month period ended September 30, 2023 and above the competitive median of the asset size peer group for the 12-month period ended September 30, 2023. Further, the information provided to the Board indicated that the total expense ratio of the retail class of the fund ranked equal to the competitive median of the similar sales load structure group for the 12-month period ended September 30, 2023 and below the competitive median of the total expense asset size peer group for the 12-month period ended September 30, 2023. The Board considered that the fund has a variable unified management fee that covers expenses for services beyond portfolio management.
The Board noted that a different variable management fee rate is applicable to each class of the fund. The Board considered that the difference in management fee rates between classes is the result of separate arrangements for class-level services and/or waivers of certain expenses and not the result of any difference in advisory or custodial fees or other expenses related to the management of the fund's assets, which do not vary by class.
The Board also considered that the fund's management fee is subject to upward or downward adjustment depending upon whether, and to what extent, the fund's investment performance for the performance period (a rolling 36-month period) exceeds, or is exceeded by, a securities index, thus leading to a performance adjustment for the same period. The Board noted that the performance adjustment provides FMR with a strong economic incentive to seek to achieve superior long-term performance for the fund's shareholders and helps to more closely align the interests of FMR and the shareholders of the fund.
In connection with its consideration of the fund's performance adjustment, the Board noted that the performance of the retail class is used for purposes of determining the performance adjustment. The Board noted that to the extent the performance adjustment was based on the performance of a share class with higher total annual operating expenses, the fund would be subject to a smaller positive and larger negative performance adjustment. The Board considered the appropriateness of the use of the retail class as the basis for the performance adjustment. The Board noted that the retail class is typically the largest class (reflecting the actual investment experience for the plurality of shareholders), employs a standard expense structure, and does not include fund-paid 12b-1 fees, which Fidelity believes makes it a more appropriate measurement of Fidelity's investment skill.
Other Contractual Arrangements. The Board further considered that FMR has contractually agreed to reimburse Class A, Class M, Class C, Class I, Class Z, and the retail class of the fund to the extent that total operating expenses, with certain exceptions, as a percentage of their respective average net assets, exceed 1.30%, 1.55%, 2.05%, 1.05%, 0.90%, and 1.05% through February 28, 2025.
Fees Charged to Other Fidelity Clients. The Board also considered Fidelity fee structures and other information with respect to clients of Fidelity, such as other funds advised or subadvised by Fidelity, pension plan clients, and other institutional clients with similar mandates. The Board noted that a joint ad hoc committee created by it and the boards of other Fidelity funds periodically reviews and compares Fidelity's institutional investment advisory business with its business of providing services to the Fidelity funds and also noted the most recent findings of the committee. The Board noted that the committee's review included a consideration of the differences in services provided, fees charged, and costs incurred, as well as competition in the markets serving the different categories of clients.
Based on its review, the Board concluded that the fund's management fee, including the use of the retail class as the basis for the performance adjustment, is fair and reasonable in light of the services that the fund receives and the other factors considered. Further, based on its review of total expense ratios and fees charged to other Fidelity clients, the Board concluded that the total expense ratio of each class of the fund was reasonable in light of the services that the fund and its shareholders receive and the other factors considered.
Costs of the Services and Profitability. The Board considered the revenues earned and the expenses incurred by Fidelity in conducting the business of developing, marketing, distributing, managing, administering and servicing the fund and servicing the fund's shareholders. The Board also considered the level of Fidelity's profits in respect of all the Fidelity funds.
On an annual basis, Fidelity presents to the Board information about the profitability of its relationships with the fund. Fidelity calculates profitability information for each fund, as well as aggregate profitability information for groups of Fidelity funds and all Fidelity funds, using a series of detailed revenue and cost allocation methodologies which originate with the books and records of Fidelity on which Fidelity's audited financial statements are based. The Audit Committee of the Board reviews any significant changes from the prior year's methodologies.
A public accounting firm has been engaged annually by the Board as part of the Board's assessment of Fidelity's profitability analysis. The engagement includes the review and assessment of the methodologies used by Fidelity in determining the revenues and expenses attributable to Fidelity's fund business, and completion of agreed-upon procedures in respect of the mathematical accuracy of certain fund profitability information and its conformity to established allocation methodologies. After considering the reports issued under the engagement and information provided by Fidelity, the Board concluded that while other allocation methods may also be reasonable, Fidelity's profitability methodologies are reasonable in all material respects.
The Board also reviewed Fidelity's non-fund businesses and potential indirect benefits such businesses may have received as a result of their association with Fidelity's fund business (i.e., fall-out benefits) as well as cases where Fidelity's affiliates may benefit from the funds' business. The Board considered areas where potential indirect benefits to the Fidelity funds from their relationships with Fidelity may exist. The Board's consideration of these matters was informed by the findings of a joint ad hoc committee created by it and the boards of other Fidelity funds to evaluate potential fall-out benefits.
The Board considered the costs of the services provided by and the profits realized by Fidelity in connection with the operation of the fund and was satisfied that the profitability was not excessive.
Economies of Scale. The Board considered whether there have been economies of scale in respect of the management of the Fidelity funds, whether the Fidelity funds (including the fund) have appropriately benefited from any such economies of scale, and whether there is potential for realization of any further economies of scale. The Board considered the extent to which the fund will benefit from economies of scale as assets grow through increased services to the fund, through waivers or reimbursements, or through fee or expense ratio reductions. The Board also noted that a committee created by it and the boards of other Fidelity funds periodically analyzes whether Fidelity attains economies of scale in respect of the management and servicing of the Fidelity funds, whether the Fidelity funds have appropriately benefited from such economies of scale, and whether there is potential for realization of any further economies of scale.
The Board recognized that the fund's management contract incorporates a variable management fee structure, which provides breakpoints as a way to share, in part, any potential economies of scale that may exist at the asset class level and through a discount that considers both fund size and total assets of the four applicable asset classes. The Board considered that the variable management fee is designed to deliver the benefits of economies of scale to fund shareholders even if assets of any particular fund are unchanged or have declined, because some portion of Fidelity's costs are attributable to services provided to all funds subject to the variable management fee, and all such funds benefit if those costs can be allocated among more assets. The Board concluded that, given the variable management fee structure, fund shareholders will benefit from lower management fees due to the application of the breakpoints and discount factor, regardless of whether Fidelity achieves any such economies of scale.
The Board concluded, taking into account the analysis of the committee, that economies of scale, if any, are being appropriately shared between fund shareholders and Fidelity.
Additional Information Requested by the Board. In order to develop fully the factual basis for consideration of the Fidelity funds' advisory contracts, the Board requested and received additional information on certain topics, including but not limited to: (i) fund flow and performance trends, in particular the underperformance of certain funds and strategies, and Fidelity's long-term strategies for certain funds; (ii) the operation of performance fees and the rationale for implementing performance fees on certain categories of funds but not others; (iii) Fidelity's pricing philosophy compared to competitors; (iv) fund profitability methodology and data; (v) evaluation of competitive fund data and peer group classifications and fee and expense comparisons; (vi) the management fee and expense structures for different funds and classes and information about the differences between various fee and expense structures; (vii) the variable management fee implemented for certain funds effective March 1, 2024; and (viii) information regarding other accounts managed by Fidelity and the funds' sub-advisory arrangements.
Conclusion. Based on its evaluation of all of the conclusions noted above, and after considering all factors it believed relevant, the Board, including the Independent Trustees, concluded that the advisory and sub-advisory fee arrangements are fair and reasonable in light of all of the surrounding circumstances and that the fund's Advisory Contracts should be renewed through May 31, 2025.
1.827482.118
FIV-ANN-1224
Fidelity® Emerging Markets Discovery Fund
Annual Report
October 31, 2024
Includes Fidelity and Fidelity Advisor share classes
Contents
To view a fund's proxy voting guidelines and proxy voting record for the 12-month period ended June 30, visit http://www.fidelity.com/proxyvotingresults or visit the Securities and Exchange Commission's (SEC) web site at http://www.sec.gov.
You may also call 1-800-544-8544 if you're an individual investing directly with Fidelity, call 1-800-835-5092 if you're a plan sponsor or participant with Fidelity as your recordkeeper or call 1-877-208-0098 on institutional accounts or if you're an advisor or invest through one to request a free copy of the proxy voting guidelines.
Standard & Poor's, S&P and S&P 500 are registered service marks of The McGraw-Hill Companies, Inc. and have been licensed for use by Fidelity Distributors Corporation.
Other third-party marks appearing herein are the property of their respective owners.
All other marks appearing herein are registered or unregistered trademarks or service marks of FMR LLC or an affiliated company. © 2024 FMR LLC. All rights reserved.
This report and the financial statements contained herein are submitted for the general information of the shareholders of the Fund. This report is not authorized for distribution to prospective investors in the Fund unless preceded or accompanied by an effective prospectus.
A fund files its complete schedule of portfolio holdings with the SEC for the first and third quarters of each fiscal year on Form N-PORT. Forms N-PORT are available on the SEC's web site at http://www.sec.gov. A fund's Forms N-PORT may be reviewed and copied at the SEC's Public Reference Room in Washington, DC. Information regarding the operation of the SEC's Public Reference Room may be obtained by calling 1-800-SEC-0330.
For a complete list of a fund's portfolio holdings, view the most recent holdings listing, semiannual report, or annual report on Fidelity's web site at http://www.fidelity.com, http://www.institutional.fidelity.com, or http://www.401k.com, as applicable.
NOT FDIC INSURED •MAY LOSE VALUE •NO BANK GUARANTEE
Neither the Fund nor Fidelity Distributors Corporation is a bank.
Item 7: Financial Statements and Financial Highlights for Open-End Management Investment Companies (Annual Report)
Fidelity® Emerging Markets Discovery Fund
Schedule of Investments October 31, 2024
Showing Percentage of Net Assets
| Common Stocks - 99.5% |
| | | Shares | Value ($) |
| Brazil - 11.7% | | | |
| Afya Ltd. Class A (a)(b) | | 728,459 | 12,208,973 |
| Atacadao SA | | 5,656,194 | 7,328,425 |
| Caixa Seguridade Participacoes | | 4,438,190 | 11,055,361 |
| Companhia de Saneamento Basico do Estado de Sao Paulo (SABESP) | | 56,300 | 896,764 |
| Equatorial Energia SA | | 2,238,320 | 12,436,617 |
| Hapvida Participacoes e Investimentos SA (a)(c) | | 13,804,280 | 8,405,450 |
| Hypera SA (a) | | 2,243,499 | 8,576,749 |
| Localiza Rent a Car SA | | 1,335,849 | 9,709,972 |
| LOG Commercial Properties e Participacoes SA | | 2,601,156 | 10,178,026 |
| Lojas Renner SA | | 3,820,340 | 12,272,088 |
| Orizon Valorizacao de Residuos SA (a) | | 1,412,810 | 11,332,491 |
| PRIO SA | | 1,731,810 | 12,276,561 |
| Rumo SA | | 3,550,856 | 12,223,362 |
| XP, Inc. Class A | | 574,482 | 10,030,456 |
TOTAL BRAZIL | | | 138,931,295 |
| Chile - 1.0% | | | |
| Banco de Chile sponsored ADR | | 501,379 | 11,631,993 |
| China - 21.4% | | | |
| Airtac International Group | | 449,330 | 12,477,934 |
| China Communications Services Corp. Ltd. (H Shares) | | 25,852,394 | 13,889,166 |
| China Resources Beer Holdings Co. Ltd. | | 3,349,083 | 12,405,994 |
| Cloud Music, Inc. (a)(c) | | 297,780 | 4,765,503 |
| DouYu International Holdings Ltd. ADR | | 574,703 | 6,218,286 |
| Far East Horizon Ltd. | | 14,856,244 | 10,369,502 |
| Fu Shou Yuan International Group Ltd. | | 17,848,916 | 9,064,736 |
| Guangdong Investment Ltd. | | 21,384,860 | 13,613,120 |
| Haier Smart Home Co. Ltd. (A Shares) | | 3,340,261 | 13,722,535 |
| Haitian International Holdings Ltd. | | 4,452,227 | 12,314,777 |
| Hansoh Pharmaceutical Group Co. Ltd. (c) | | 5,137,968 | 11,979,431 |
| Li Ning Co. Ltd. | | 5,903,190 | 12,044,921 |
| New Oriental Education & Technology Group, Inc. sponsored ADR | | 97,450 | 6,100,370 |
| Proya Cosmetics Co. Ltd. (A Shares) | | 74,600 | 1,005,534 |
| Shenzhen Inovance Technology Co. Ltd. (A Shares) | | 1,813,937 | 14,158,012 |
| Shenzhen YUTO Packaging Technology Co. Ltd. (A Shares) | | 3,317,073 | 11,880,611 |
| Sinopec Engineering Group Co. Ltd. (H Shares) | | 21,204,232 | 14,723,521 |
| Sinotruk Hong Kong Ltd. | | 5,450,485 | 14,711,296 |
| SITC International Holdings Co. Ltd. | | 5,814,390 | 16,433,278 |
| TAL Education Group ADR (a) | | 752,510 | 8,367,911 |
| Tencent Music Entertainment Group ADR | | 689,730 | 7,676,695 |
| Tongdao Liepin Group (a)(b) | | 11,555,797 | 3,387,854 |
| TravelSky Technology Ltd. (H Shares) | | 9,891,419 | 13,863,674 |
| Tsingtao Brewery Co. Ltd. (H Shares) | | 1,158,266 | 7,458,178 |
TOTAL CHINA | | | 252,632,839 |
| Georgia - 1.1% | | | |
| Bank of Georgia Group PLC | | 233,426 | 12,521,232 |
| Greece - 1.9% | | | |
| Athens International Airport SA | | 884,730 | 7,554,566 |
| OPAP SA | | 858,290 | 14,638,926 |
TOTAL GREECE | | | 22,193,492 |
| Hong Kong - 2.2% | | | |
| ASMPT Ltd. | | 1,137,733 | 12,333,982 |
| WH Group Ltd. (c) | | 18,011,743 | 14,018,836 |
TOTAL HONG KONG | | | 26,352,818 |
| Hungary - 0.9% | | | |
| Richter Gedeon PLC | | 367,685 | 10,620,899 |
| India - 13.3% | | | |
| Bharat Electronics Ltd. | | 3,135,123 | 10,582,631 |
| Computer Age Management Services Private Ltd. | | 246,610 | 12,992,503 |
| Deccan Cements Ltd. (d) | | 730,039 | 5,077,547 |
| Eicher Motors Ltd. | | 251,913 | 14,620,048 |
| Embassy Office Parks (REIT) | | 3,159,365 | 14,835,908 |
| Hindustan Aeronautics Ltd. | | 192,760 | 9,699,793 |
| Indraprastha Gas Ltd. | | 1,816,383 | 9,056,864 |
| ITC Ltd. | | 2,410,885 | 13,987,325 |
| Mahanagar Gas Ltd. | | 589,800 | 10,084,904 |
| Manappuram Finance Ltd. | | 5,207,593 | 9,683,859 |
| Oberoi Realty Ltd. | | 616,791 | 14,370,770 |
| Shriram Finance Ltd. | | 450,697 | 16,732,681 |
| Torrent Pharmaceuticals Ltd. | | 416,598 | 15,834,735 |
TOTAL INDIA | | | 157,559,568 |
| Indonesia - 2.1% | | | |
| First Resources Ltd. | | 9,294,741 | 10,235,687 |
| PT United Tractors Tbk | | 8,203,290 | 14,319,016 |
TOTAL INDONESIA | | | 24,554,703 |
| Korea (South) - 6.2% | | | |
| Coway Co. Ltd. | | 328,719 | 15,067,389 |
| Db Insurance Co. Ltd. | | 184,445 | 14,585,410 |
| Fila Holdings Corp. | | 361,245 | 10,460,304 |
| Hansol Chemical Co. Ltd. | | 85,668 | 7,792,231 |
| Hyundai Marine & Fire Insurance Co. Ltd. | | 358,879 | 7,900,220 |
| KT&G Corp. | | 22,225 | 1,771,208 |
| SFA Engineering Corp. | | 467,810 | 7,129,142 |
| Soulbrain Co. Ltd. | | 58,867 | 8,605,676 |
TOTAL KOREA (SOUTH) | | | 73,311,580 |
| Malaysia - 0.0% | | | |
| Scientex Bhd warrants 1/14/26 (a) | | 130,640 | 14,694 |
| Mexico - 4.8% | | | |
| Corporacion Inmobiliaria Vesta S.A.B. de CV | | 3,294,270 | 8,608,780 |
| FIBRA Macquarie Mexican (REIT) (c) | | 5,190,385 | 8,591,197 |
| Fibra Uno Administracion SA de CV | | 6,293,836 | 7,247,057 |
| Gruma S.A.B. de CV Series B | | 70,368 | 1,215,522 |
| Grupo Comercial Chedraui S.A.B. de CV (b) | | 2,008,973 | 12,711,765 |
| Qualitas Controladora S.A.B. de CV | | 1,396,363 | 9,769,202 |
| Regional S.A.B. de CV | | 1,444,162 | 9,171,127 |
TOTAL MEXICO | | | 57,314,650 |
| Panama - 1.1% | | | |
| Copa Holdings SA Class A | | 139,510 | 13,574,323 |
| Philippines - 0.8% | | | |
| Robinsons Land Corp. | | 38,069,229 | 10,013,839 |
| Poland - 1.6% | | | |
| Allegro.eu SA (a)(c) | | 996,340 | 8,741,855 |
| Dino Polska SA (a)(c) | | 117,710 | 9,754,396 |
TOTAL POLAND | | | 18,496,251 |
| Russia - 0.0% | | | |
| LSR Group OJSC (a)(e) | | 67,346 | 0 |
| TCS Group Holding PLC GDR (a)(e) | | 59,253 | 0 |
TOTAL RUSSIA | | | 0 |
| Saudi Arabia - 2.3% | | | |
| Bupa Arabia for Cooperative Insurance Co. | | 244,271 | 13,099,071 |
| Catrion Catering Holding Co. | | 450,860 | 14,285,577 |
TOTAL SAUDI ARABIA | | | 27,384,648 |
| South Africa - 5.4% | | | |
| Bidvest Group Ltd./The | | 897,607 | 14,525,197 |
| FirstRand Ltd. | | 3,021,536 | 13,275,708 |
| Impala Platinum Holdings Ltd. (a) | | 3,079,750 | 20,327,981 |
| Mr Price Group Ltd. | | 1,079,938 | 15,752,872 |
TOTAL SOUTH AFRICA | | | 63,881,758 |
| Taiwan - 17.6% | | | |
| BizLink Holding, Inc. | | 1,106,788 | 16,006,888 |
| Chailease Holding Co. Ltd. | | 2,514,621 | 11,813,773 |
| Cleanaway Co. Ltd. | | 1,910,105 | 10,913,399 |
| E Ink Holdings, Inc. | | 1,434,650 | 13,470,917 |
| Innodisk Corp. | | 1,229,280 | 9,802,534 |
| International Games Systems Co. Ltd. | | 479,800 | 15,188,075 |
| King Yuan Electronics Co. Ltd. | | 3,739,870 | 14,141,095 |
| Makalot Industrial Co. Ltd. | | 1,081,768 | 11,643,511 |
| Nanya Technology Corp. (a) | | 7,322,900 | 9,513,628 |
| Nien Made Enterprise Co. Ltd. | | 1,014,960 | 15,173,423 |
| Parade Technologies Ltd. | | 543,735 | 11,875,530 |
| Poya International Co. Ltd. | | 802,947 | 12,520,495 |
| Realtek Semiconductor Corp. | | 1,014,372 | 14,931,813 |
| Unimicron Technology Corp. | | 2,730,504 | 13,378,630 |
| Wiwynn Corp. | | 220,590 | 12,581,918 |
| Yageo Corp. | | 926,600 | 15,811,321 |
TOTAL TAIWAN | | | 208,766,950 |
| Turkey - 0.9% | | | |
| Mavi Jeans Class B (c) | | 4,549,692 | 10,117,803 |
| United Arab Emirates - 2.2% | | | |
| ADNOC Drilling Co. PJSC | | 9,245,700 | 12,762,064 |
| Aldar Properties PJSC | | 6,224,111 | 12,912,355 |
TOTAL UNITED ARAB EMIRATES | | | 25,674,419 |
| United States of America - 0.9% | | | |
| FirstCash Holdings, Inc. | | 102,540 | 10,609,814 |
| Vietnam - 0.1% | | | |
| FPT Corp. | | 259,494 | 1,389,181 |
| TOTAL COMMON STOCKS (Cost $1,051,672,297) | | | 1,177,548,749 |
| | | | |
| Money Market Funds - 2.5% |
| | | Shares | Value ($) |
| Fidelity Cash Central Fund 4.87% (f) | | 15,111,127 | 15,114,149 |
| Fidelity Securities Lending Cash Central Fund 4.87% (f)(g) | | 14,199,040 | 14,200,460 |
| TOTAL MONEY MARKET FUNDS (Cost $29,314,609) | | | 29,314,609 |
| | | | |
| TOTAL INVESTMENT IN SECURITIES - 102.0% (Cost $1,080,986,906) | 1,206,863,358 |
NET OTHER ASSETS (LIABILITIES) - (2.0)% | (23,625,749) |
| NET ASSETS - 100.0% | 1,183,237,609 |
| | |
Legend
| (b) | Security or a portion of the security is on loan at period end. |
| (c) | Security exempt from registration under Rule 144A of the Securities Act of 1933. These securities may be resold in transactions exempt from registration, normally to qualified institutional buyers. At the end of the period, the value of these securities amounted to $76,374,471 or 6.5% of net assets. |
| (f) | Affiliated fund that is generally available only to investment companies and other accounts managed by Fidelity Investments. The rate quoted is the annualized seven-day yield of the fund at period end. A complete unaudited listing of the fund's holdings as of its most recent quarter end is available upon request. In addition, each Fidelity Central Fund's financial statements, which are not covered by the Fund's Report of Independent Registered Public Accounting Firm, are available on the SEC's website or upon request. |
| (g) | Investment made with cash collateral received from securities on loan. |
Affiliated Central Funds
Fiscal year to date information regarding the Fund's investments in Fidelity Central Funds, including the ownership percentage, is presented below.
| Affiliate | Value, beginning of period ($) | Purchases ($) | Sales Proceeds ($) | Dividend Income ($) | Realized Gain (loss) ($) | Change in Unrealized appreciation (depreciation) ($) | Value, end of period ($) | % ownership, end of period |
| Fidelity Cash Central Fund 4.87% | 41,349,421 | 379,474,507 | 405,709,717 | 1,501,921 | (62) | - | 15,114,149 | 0.0% |
| Fidelity Securities Lending Cash Central Fund 4.87% | 11,126,496 | 176,028,363 | 172,954,399 | 519,971 | - | - | 14,200,460 | 0.1% |
| Total | 52,475,917 | 555,502,870 | 578,664,116 | 2,021,892 | (62) | - | 29,314,609 | |
| | | | | | | | | |
Amounts in the dividend income column in the above table include any capital gain distributions from underlying funds, which are presented in the corresponding line item in the Statement of Operations, if applicable.
Amounts in the dividend income column for Fidelity Securities Lending Cash Central Fund represents the income earned on investing cash collateral, less rebates paid to borrowers and any lending agent fees associated with the loan, plus any premium payments received for lending certain types of securities.
Amounts included in the purchases and sales proceeds columns may include in-kind transactions, if applicable.
Other Affiliated Issuers
An affiliated company is a company in which the Fund has ownership of at least 5% of the voting securities. Fiscal year to date transactions with companies which are or were affiliates are presented in the table below. Certain corporate actions, such as mergers, are excluded from the amounts in this table if applicable. A dash in the Value end of period ($) column means either the issuer is no longer held at period end, or the issuer is held at period end but is no longer an affiliate.
| Affiliate | Value, beginning of period ($) | Purchases ($) | Sales Proceeds ($) | Dividend Income ($) | Realized Gain (loss) ($) | Change in Unrealized appreciation (depreciation) ($) | Value, end of period ($) |
| Deccan Cements Ltd. | 4,283,550 | 283,827 | 125,952 | 20,766 | (30,613) | 666,735 | 5,077,547 |
| Total | 4,283,550 | 283,827 | 125,952 | 20,766 | (30,613) | 666,735 | 5,077,547 |
Amounts included in the purchases and sales proceeds columns may include in-kind transactions, if applicable.
Investment Valuation
The following is a summary of the inputs used, as of October 31, 2024, involving the Fund's assets and liabilities carried at fair value. The inputs or methodology used for valuing securities may not be an indication of the risk associated with investing in those securities. For more information on valuation inputs, and their aggregation into the levels used below, please refer to the Investment Valuation section in the accompanying Notes to Financial Statements.
| Valuation Inputs at Reporting Date: |
| Description | Total ($) | Level 1 ($) | Level 2 ($) | Level 3 ($) |
Investments in Securities: | | | | |
|
| Equities: | | | | |
Communication Services | 37,236,413 | 13,894,981 | 23,341,432 | - |
Consumer Discretionary | 216,381,834 | 72,447,926 | 143,933,908 | - |
Consumer Staples | 91,892,870 | 31,010,108 | 60,882,762 | - |
Energy | 39,357,641 | 25,038,625 | 14,319,016 | - |
Financials | 172,249,409 | 87,888,256 | 84,361,153 | - |
Health Care | 55,417,264 | 27,603,098 | 27,814,166 | - |
Industrials | 249,237,828 | 68,680,291 | 180,557,537 | - |
Information Technology | 129,230,549 | - | 129,230,549 | - |
Materials | 53,698,740 | - | 53,698,740 | - |
Real Estate | 86,757,932 | 47,537,415 | 39,220,517 | - |
Utilities | 46,088,269 | 13,333,381 | 32,754,888 | - |
|
| Money Market Funds | 29,314,609 | 29,314,609 | - | - |
| Total Investments in Securities: | 1,206,863,358 | 416,748,690 | 790,114,668 | - |
Fidelity® Emerging Markets Discovery Fund
Financial Statements
| Statement of Assets and Liabilities |
As of October 31, 2024 |
| Assets | | | | |
| Investment in securities, at value (including securities loaned of $13,645,459) - See accompanying schedule: | | | | |
Unaffiliated issuers (cost $1,046,576,769) | $ | 1,172,471,202 | | |
Fidelity Central Funds (cost $29,314,609) | | 29,314,609 | | |
Other affiliated issuers (cost $5,095,528) | | 5,077,547 | | |
| | | | | |
| | | | | |
| Total Investment in Securities (cost $1,080,986,906) | | | $ | 1,206,863,358 |
| Cash | | | | 43,050 |
| Foreign currency held at value (cost $1,011,427) | | | | 1,008,648 |
| Receivable for fund shares sold | | | | 1,039,042 |
| Dividends receivable | | | | 1,356,489 |
| Distributions receivable from Fidelity Central Funds | | | | 53,119 |
| Prepaid expenses | | | | 1,505 |
| Other receivables | | | | 117,976 |
Total assets | | | | 1,210,483,187 |
| Liabilities | | | | |
| Payable for investments purchased | $ | 1,777,902 | | |
| Payable for fund shares redeemed | | 1,148,731 | | |
| Accrued management fee | | 939,324 | | |
| Distribution and service plan fees payable | | 11,659 | | |
| Deferred taxes | | 8,954,830 | | |
| Other payables and accrued expenses | | 212,672 | | |
| Collateral on securities loaned | | 14,200,460 | | |
| Total liabilities | | | | 27,245,578 |
| Net Assets | | | $ | 1,183,237,609 |
| Net Assets consist of: | | | | |
| Paid in capital | | | $ | 1,056,581,883 |
| Total accumulated earnings (loss) | | | | 126,655,726 |
| Net Assets | | | $ | 1,183,237,609 |
| | | | | |
| Net Asset Value and Maximum Offering Price | | | | |
| Class A : | | | | |
Net Asset Value and redemption price per share ($30,907,114 ÷ 1,880,143 shares)(a) | | | $ | 16.44 |
| Maximum offering price per share (100/94.25 of $16.44) | | | $ | 17.44 |
| Class M : | | | | |
Net Asset Value and redemption price per share ($5,103,473 ÷ 311,392 shares)(a) | | | $ | 16.39 |
| Maximum offering price per share (100/96.50 of $16.39) | | | $ | 16.98 |
| Class C : | | | | |
Net Asset Value and offering price per share ($3,145,677 ÷ 197,534 shares)(a) | | | $ | 15.92 |
| Emerging Markets Discovery : | | | | |
Net Asset Value, offering price and redemption price per share ($411,219,829 ÷ 24,817,756 shares) | | | $ | 16.57 |
| Class I : | | | | |
Net Asset Value, offering price and redemption price per share ($553,443,539 ÷ 33,314,841 shares) | | | $ | 16.61 |
| Class Z : | | | | |
Net Asset Value, offering price and redemption price per share ($179,417,977 ÷ 10,815,737 shares) | | | $ | 16.59 |
(a)Redemption price per share is equal to net asset value less any applicable contingent deferred sales charge. |
| Statement of Operations |
| Year ended October 31, 2024 |
| Investment Income | | | | |
| Dividends (including $20,766 earned from affiliated issuers) | | | $ | 41,656,617 |
| Special dividends | | | | 5,609,101 |
| Interest | | | | 2,667 |
| Income from Fidelity Central Funds (including $519,971 from security lending) | | | | 2,021,892 |
| Income before foreign taxes withheld | | | $ | 49,290,277 |
| Less foreign taxes withheld | | | | (4,301,451) |
| Total income | | | | 44,988,826 |
| Expenses | | | | |
| Management fee | $ | 10,662,307 | | |
| Transfer agent fees | | 622,458 | | |
| Distribution and service plan fees | | 138,113 | | |
| Accounting fees | | 167,037 | | |
| Custodian fees and expenses | | 395,619 | | |
| Independent trustees' fees and expenses | | 5,229 | | |
| Registration fees | | 149,468 | | |
| Audit fees | | 93,036 | | |
| Legal | | 800 | | |
| Interest | | 19,574 | | |
| Miscellaneous | | 49,001 | | |
| Total expenses before reductions | | 12,302,642 | | |
| Expense reductions | | (51,636) | | |
| Total expenses after reductions | | | | 12,251,006 |
| Net Investment income (loss) | | | | 32,737,820 |
| Realized and Unrealized Gain (Loss) | | | | |
| Net realized gain (loss) on: | | | | |
| Investment Securities: | | | | |
| Unaffiliated issuers (net of foreign taxes of $5,730,976) | | 2,695,328 | | |
| Fidelity Central Funds | | (62) | | |
| Other affiliated issuers | | (30,613) | | |
| Foreign currency transactions | | 79,897 | | |
| Total net realized gain (loss) | | | | 2,744,550 |
| Change in net unrealized appreciation (depreciation) on: | | | | |
| Investment Securities: | | | | |
| Unaffiliated issuers (net of increase in deferred foreign taxes of $4,939,770) | | 108,824,794 | | |
| Affiliated issuers | | 666,735 | | |
| Assets and liabilities in foreign currencies | | (68,602) | | |
| Total change in net unrealized appreciation (depreciation) | | | | 109,422,927 |
| Net gain (loss) | | | | 112,167,477 |
| Net increase (decrease) in net assets resulting from operations | | | $ | 144,905,297 |
| Statement of Changes in Net Assets |
| |
| | Year ended October 31, 2024 | | Year ended October 31, 2023 |
| Increase (Decrease) in Net Assets | | | | |
| Operations | | | | |
| Net investment income (loss) | $ | 32,737,820 | $ | 16,742,394 |
| Net realized gain (loss) | | 2,744,550 | | (3,777,524) |
| Change in net unrealized appreciation (depreciation) | | 109,422,927 | | 49,069,215 |
| Net increase (decrease) in net assets resulting from operations | | 144,905,297 | | 62,034,085 |
| Distributions to shareholders | | (23,040,155) | | (8,639,871) |
| | | | | |
| Share transactions - net increase (decrease) | | 132,171,089 | | 444,710,316 |
| Total increase (decrease) in net assets | | 254,036,231 | | 498,104,530 |
| | | | | |
| Net Assets | | | | |
| Beginning of period | | 929,201,378 | | 431,096,848 |
| End of period | $ | 1,183,237,609 | $ | 929,201,378 |
| | | | | |
| | | | | |
Financial Highlights
Fidelity Advisor® Emerging Markets Discovery Fund Class A |
| |
| Years ended October 31, | | 2024 | | 2023 | | 2022 | | 2021 | | 2020 |
Selected Per-Share Data | | | | | | | | | | |
| Net asset value, beginning of period | $ | 14.69 | $ | 12.89 | $ | 18.36 | $ | 13.93 | $ | 13.66 |
| Income from Investment Operations | | | | | | | | | | |
Net investment income (loss) A,B | | .40 C | | .31 | | .31 | | .11 | | .04 |
| Net realized and unrealized gain (loss) | | 1.65 | | 1.69 | | (3.92) | | 4.37 | | .34 |
| Total from investment operations | | 2.05 | | 2.00 | | (3.61) | | 4.48 | | .38 |
| Distributions from net investment income | | (.30) | | (.20) | | (.37) | | (.05) | | (.11) |
| Distributions from net realized gain | | - | | - | | (1.49) | | - | | - |
| Total distributions | | (.30) | | (.20) | | (1.86) | | (.05) | | (.11) |
| Net asset value, end of period | $ | 16.44 | $ | 14.69 | $ | 12.89 | $ | 18.36 | $ | 13.93 |
Total Return D,E | | | | 15.56% | | (21.58)% | | 32.23% | | 2.76% |
Ratios to Average Net Assets B,F,G | | | | | | | | | | |
| Expenses before reductions | | 1.30% | | 1.43% | | 1.49% | | 1.49% | | 1.54% |
| Expenses net of fee waivers, if any | | | | 1.42% | | 1.49% | | 1.49% | | 1.53% |
| Expenses net of all reductions | | 1.29% | | 1.42% | | 1.49% | | 1.49% | | 1.51% |
| Net investment income (loss) | | 2.45% C | | 2.07% | | 2.11% | | .60% | | .33% |
| Supplemental Data | | | | | | | | | | |
| Net assets, end of period (000 omitted) | $ | 30,907 | $ | 23,373 | $ | 16,063 | $ | 18,900 | $ | 11,745 |
Portfolio turnover rate H | | | | 30% | | 33% | | 64% | | 43% |
ACalculated based on average shares outstanding during the period.
BNet investment income (loss) is affected by the timing of the declaration of dividends by any underlying mutual funds or exchange-traded funds (ETFs). Net investment income (loss) of any mutual funds or ETFs is not included in the Fund's net investment income (loss) ratio.
CNet investment income per share reflects one or more large, non-recurring dividend(s) which amounted to $.08 per share. Excluding such non-recurring dividend(s), the ratio of net investment income (loss) to average net assets would have been 1.99%.
DTotal returns would have been lower if certain expenses had not been reduced during the applicable periods shown.
ETotal returns do not include the effect of the sales charges.
FFees and expenses of any underlying mutual funds or exchange-traded funds (ETFs) are not included in the Fund's expense ratio. The Fund indirectly bears its proportionate share of these expenses. For additional expense information related to investments in Fidelity Central Funds, please refer to the "Investments in Fidelity Central Funds" note found in the Notes to Financial Statements section of the most recent Annual or Semi-Annual report.
GExpense ratios reflect operating expenses of the class. Expenses before reductions do not reflect amounts reimbursed, waived, or reduced through arrangements with the investment adviser, brokerage services, or other offset arrangements, if applicable, and do not represent the amount paid by the class during periods when reimbursements, waivers or reductions occur.
HAmount does not include the portfolio activity of any underlying mutual funds or exchange-traded funds (ETFs).
Fidelity Advisor® Emerging Markets Discovery Fund Class M |
| |
| Years ended October 31, | | 2024 | | 2023 | | 2022 | | 2021 | | 2020 |
Selected Per-Share Data | | | | | | | | | | |
| Net asset value, beginning of period | $ | 14.65 | $ | 12.85 | $ | 18.30 | $ | 13.89 | $ | 13.62 |
| Income from Investment Operations | | | | | | | | | | |
Net investment income (loss) A,B | | .36 C | | .27 | | .27 | | .06 | | - D |
| Net realized and unrealized gain (loss) | | 1.65 | | 1.68 | | (3.91) | | 4.36 | | .34 |
| Total from investment operations | | 2.01 | | 1.95 | | (3.64) | | 4.42 | | .34 |
| Distributions from net investment income | | (.27) | | (.15) | | (.32) | | (.01) | | (.07) |
| Distributions from net realized gain | | - | | - | | (1.49) | | - | | - |
| Total distributions | | (.27) | | (.15) | | (1.81) | | (.01) | | (.07) |
| Net asset value, end of period | $ | 16.39 | $ | 14.65 | $ | 12.85 | $ | 18.30 | $ | 13.89 |
Total Return E,F | | | | 15.25% | | (21.77)% | | 31.82% | | 2.49% |
Ratios to Average Net Assets B,G,H | | | | | | | | | | |
| Expenses before reductions | | 1.50% | | 1.69% | | 1.75% | | 1.76% | | 1.83% |
| Expenses net of fee waivers, if any | | | | 1.69% | | 1.75% | | 1.76% | | 1.83% |
| Expenses net of all reductions | | 1.50% | | 1.68% | | 1.75% | | 1.76% | | 1.80% |
| Net investment income (loss) | | 2.25% C | | 1.80% | | 1.85% | | .33% | | .03% |
| Supplemental Data | | | | | | | | | | |
| Net assets, end of period (000 omitted) | $ | 5,103 | $ | 6,560 | $ | 4,355 | $ | 6,095 | $ | 4,552 |
Portfolio turnover rate I | | | | 30% | | 33% | | 64% | | 43% |
ACalculated based on average shares outstanding during the period.
BNet investment income (loss) is affected by the timing of the declaration of dividends by any underlying mutual funds or exchange-traded funds (ETFs). Net investment income (loss) of any mutual funds or ETFs is not included in the Fund's net investment income (loss) ratio.
CNet investment income per share reflects one or more large, non-recurring dividend(s) which amounted to $.08 per share. Excluding such non-recurring dividend(s), the ratio of net investment income (loss) to average net assets would have been 1.78%.
DAmount represents less than $.005 per share.
ETotal returns would have been lower if certain expenses had not been reduced during the applicable periods shown.
FTotal returns do not include the effect of the sales charges.
GFees and expenses of any underlying mutual funds or exchange-traded funds (ETFs) are not included in the Fund's expense ratio. The Fund indirectly bears its proportionate share of these expenses. For additional expense information related to investments in Fidelity Central Funds, please refer to the "Investments in Fidelity Central Funds" note found in the Notes to Financial Statements section of the most recent Annual or Semi-Annual report.
HExpense ratios reflect operating expenses of the class. Expenses before reductions do not reflect amounts reimbursed, waived, or reduced through arrangements with the investment adviser, brokerage services, or other offset arrangements, if applicable, and do not represent the amount paid by the class during periods when reimbursements, waivers or reductions occur.
IAmount does not include the portfolio activity of any underlying mutual funds or exchange-traded funds (ETFs).
Fidelity Advisor® Emerging Markets Discovery Fund Class C |
| |
| Years ended October 31, | | 2024 | | 2023 | | 2022 | | 2021 | | 2020 |
Selected Per-Share Data | | | | | | | | | | |
| Net asset value, beginning of period | $ | 14.23 | $ | 12.47 | $ | 17.78 | $ | 13.55 | $ | 13.29 |
| Income from Investment Operations | | | | | | | | | | |
Net investment income (loss) A,B | | .27 C | | .19 | | .19 | | (.03) | | (.06) |
| Net realized and unrealized gain (loss) | | 1.59 | | 1.65 | | (3.81) | | 4.26 | | .32 |
| Total from investment operations | | 1.86 | | 1.84 | | (3.62) | | 4.23 | | .26 |
| Distributions from net investment income | | (.17) | | (.08) | | (.20) | | - | | - |
| Distributions from net realized gain | | - | | - | | (1.49) | | - | | - |
| Total distributions | | (.17) | | (.08) | | (1.69) | | - | | - |
| Net asset value, end of period | $ | 15.92 | $ | 14.23 | $ | 12.47 | $ | 17.78 | $ | 13.55 |
Total Return D,E | | | | 14.76% | | (22.21)% | | 31.22% | | 1.96% |
Ratios to Average Net Assets B,F,G | | | | | | | | | | |
| Expenses before reductions | | 2.02% | | 2.20% | | 2.25% | | 2.25% | | 2.32% |
| Expenses net of fee waivers, if any | | | | 2.19% | | 2.25% | | 2.25% | | 2.31% |
| Expenses net of all reductions | | 2.02% | | 2.19% | | 2.25% | | 2.25% | | 2.29% |
| Net investment income (loss) | | 1.73% C | | 1.29% | | 1.35% | | (.16)% | | (.45)% |
| Supplemental Data | | | | | | | | | | |
| Net assets, end of period (000 omitted) | $ | 3,146 | $ | 3,300 | $ | 3,079 | $ | 4,995 | $ | 5,080 |
Portfolio turnover rate H | | | | 30% | | 33% | | 64% | | 43% |
ACalculated based on average shares outstanding during the period.
BNet investment income (loss) is affected by the timing of the declaration of dividends by any underlying mutual funds or exchange-traded funds (ETFs). Net investment income (loss) of any mutual funds or ETFs is not included in the Fund's net investment income (loss) ratio.
CNet investment income per share reflects one or more large, non-recurring dividend(s) which amounted to $.07 per share. Excluding such non-recurring dividend(s), the ratio of net investment income (loss) to average net assets would have been 1.26%.
DTotal returns would have been lower if certain expenses had not been reduced during the applicable periods shown.
ETotal returns do not include the effect of the contingent deferred sales charge.
FFees and expenses of any underlying mutual funds or exchange-traded funds (ETFs) are not included in the Fund's expense ratio. The Fund indirectly bears its proportionate share of these expenses. For additional expense information related to investments in Fidelity Central Funds, please refer to the "Investments in Fidelity Central Funds" note found in the Notes to Financial Statements section of the most recent Annual or Semi-Annual report.
GExpense ratios reflect operating expenses of the class. Expenses before reductions do not reflect amounts reimbursed, waived, or reduced through arrangements with the investment adviser, brokerage services, or other offset arrangements, if applicable, and do not represent the amount paid by the class during periods when reimbursements, waivers or reductions occur.
HAmount does not include the portfolio activity of any underlying mutual funds or exchange-traded funds (ETFs).
Fidelity® Emerging Markets Discovery Fund |
| |
| Years ended October 31, | | 2024 | | 2023 | | 2022 | | 2021 | | 2020 |
Selected Per-Share Data | | | | | | | | | | |
| Net asset value, beginning of period | $ | 14.80 | $ | 12.98 | $ | 18.48 | $ | 14.02 | $ | 13.75 |
| Income from Investment Operations | | | | | | | | | | |
Net investment income (loss) A,B | | .45 C | | .35 | | .36 | | .16 | | .08 |
| Net realized and unrealized gain (loss) | | 1.66 | | 1.71 | | (3.95) | | 4.40 | | .34 |
| Total from investment operations | | 2.11 | | 2.06 | | (3.59) | | 4.56 | | .42 |
| Distributions from net investment income | | (.34) | | (.24) | | (.42) | | (.10) | | (.15) |
| Distributions from net realized gain | | - | | - | | (1.49) | | - | | - |
| Total distributions | | (.34) | | (.24) | | (1.91) | | (.10) | | (.15) |
| Net asset value, end of period | $ | 16.57 | $ | 14.80 | $ | 12.98 | $ | 18.48 | $ | 14.02 |
Total Return D | | | | 15.94% | | (21.37)% | | 32.63% | | 3.07% |
Ratios to Average Net Assets B,E,F | | | | | | | | | | |
| Expenses before reductions | | 1.01% | | 1.15% | | 1.19% | | 1.19% | | 1.23% |
| Expenses net of fee waivers, if any | | | | 1.15% | | 1.19% | | 1.18% | | 1.23% |
| Expenses net of all reductions | | 1.00% | | 1.15% | | 1.19% | | 1.18% | | 1.20% |
| Net investment income (loss) | | 2.74% C | | 2.34% | | 2.41% | | .90% | | .63% |
| Supplemental Data | | | | | | | | | | |
| Net assets, end of period (000 omitted) | $ | 411,220 | $ | 368,811 | $ | 248,805 | $ | 283,133 | $ | 189,784 |
Portfolio turnover rate G | | | | 30% | | 33% | | 64% | | 43% |
ACalculated based on average shares outstanding during the period.
BNet investment income (loss) is affected by the timing of the declaration of dividends by any underlying mutual funds or exchange-traded funds (ETFs). Net investment income (loss) of any mutual funds or ETFs is not included in the Fund's net investment income (loss) ratio.
CNet investment income per share reflects one or more large, non-recurring dividend(s) which amounted to $.08 per share. Excluding such non-recurring dividend(s), the ratio of net investment income (loss) to average net assets would have been 2.28%.
DTotal returns would have been lower if certain expenses had not been reduced during the applicable periods shown.
EFees and expenses of any underlying mutual funds or exchange-traded funds (ETFs) are not included in the Fund's expense ratio. The Fund indirectly bears its proportionate share of these expenses. For additional expense information related to investments in Fidelity Central Funds, please refer to the "Investments in Fidelity Central Funds" note found in the Notes to Financial Statements section of the most recent Annual or Semi-Annual report.
FExpense ratios reflect operating expenses of the class. Expenses before reductions do not reflect amounts reimbursed, waived, or reduced through arrangements with the investment adviser, brokerage services, or other offset arrangements, if applicable, and do not represent the amount paid by the class during periods when reimbursements, waivers or reductions occur.
GAmount does not include the portfolio activity of any underlying mutual funds or exchange-traded funds (ETFs).
Fidelity Advisor® Emerging Markets Discovery Fund Class I |
| |
| Years ended October 31, | | 2024 | | 2023 | | 2022 | | 2021 | | 2020 |
Selected Per-Share Data | | | | | | | | | | |
| Net asset value, beginning of period | $ | 14.85 | $ | 13.03 | $ | 18.54 | $ | 14.06 | $ | 13.79 |
| Income from Investment Operations | | | | | | | | | | |
Net investment income (loss) A,B | | .45 C | | .36 | | .34 | | .16 | | .08 |
| Net realized and unrealized gain (loss) | | 1.66 | | 1.71 | | (3.95) | | 4.41 | | .34 |
| Total from investment operations | | 2.11 | | 2.07 | | (3.61) | | 4.57 | | .42 |
| Distributions from net investment income | | (.35) | | (.25) | | (.41) | | (.09) | | (.15) |
| Distributions from net realized gain | | - | | - | | (1.49) | | - | | - |
| Total distributions | | (.35) | | (.25) | | (1.90) | | (.09) | | (.15) |
| Net asset value, end of period | $ | 16.61 | $ | 14.85 | $ | 13.03 | $ | 18.54 | $ | 14.06 |
Total Return D | | | | 15.99% | | (21.37)% | | 32.62% | | 3.07% |
Ratios to Average Net Assets B,E,F | | | | | | | | | | |
| Expenses before reductions | | 1.04% | | 1.12% | | 1.17% | | 1.19% | | 1.24% |
| Expenses net of fee waivers, if any | | | | 1.11% | | 1.16% | | 1.19% | | 1.23% |
| Expenses net of all reductions | | 1.04% | | 1.11% | | 1.16% | | 1.19% | | 1.21% |
| Net investment income (loss) | | 2.71% C | | 2.37% | | 2.44% | | .90% | | .63% |
| Supplemental Data | | | | | | | | | | |
| Net assets, end of period (000 omitted) | $ | 553,444 | $ | 404,844 | $ | 129,250 | $ | 27,397 | $ | 28,034 |
Portfolio turnover rate G | | | | 30% | | 33% | | 64% | | 43% |
ACalculated based on average shares outstanding during the period.
BNet investment income (loss) is affected by the timing of the declaration of dividends by any underlying mutual funds or exchange-traded funds (ETFs). Net investment income (loss) of any mutual funds or ETFs is not included in the Fund's net investment income (loss) ratio.
CNet investment income per share reflects one or more large, non-recurring dividend(s) which amounted to $.08 per share. Excluding such non-recurring dividend(s), the ratio of net investment income (loss) to average net assets would have been 2.24%.
DTotal returns would have been lower if certain expenses had not been reduced during the applicable periods shown.
EFees and expenses of any underlying mutual funds or exchange-traded funds (ETFs) are not included in the Fund's expense ratio. The Fund indirectly bears its proportionate share of these expenses. For additional expense information related to investments in Fidelity Central Funds, please refer to the "Investments in Fidelity Central Funds" note found in the Notes to Financial Statements section of the most recent Annual or Semi-Annual report.
FExpense ratios reflect operating expenses of the class. Expenses before reductions do not reflect amounts reimbursed, waived, or reduced through arrangements with the investment adviser, brokerage services, or other offset arrangements, if applicable, and do not represent the amount paid by the class during periods when reimbursements, waivers or reductions occur.
GAmount does not include the portfolio activity of any underlying mutual funds or exchange-traded funds (ETFs).
Fidelity Advisor® Emerging Markets Discovery Fund Class Z |
| |
| Years ended October 31, | | 2024 | | 2023 | | 2022 | | 2021 | | 2020 |
Selected Per-Share Data | | | | | | | | | | |
| Net asset value, beginning of period | $ | 14.82 | $ | 13.00 | $ | 18.51 | $ | 14.04 | $ | 13.77 |
| Income from Investment Operations | | | | | | | | | | |
Net investment income (loss) A,B | | .46 C | | .38 | | .37 | | .19 | | .10 |
| Net realized and unrealized gain (loss) | | 1.67 | | 1.70 | | (3.95) | | 4.40 | | .35 |
| Total from investment operations | | 2.13 | | 2.08 | | (3.58) | | 4.59 | | .45 |
| Distributions from net investment income | | (.36) | | (.26) | | (.44) | | (.12) | | (.18) |
| Distributions from net realized gain | | - | | - | | (1.49) | | - | | - |
| Total distributions | | (.36) | | (.26) | | (1.93) | | (.12) | | (.18) |
| Net asset value, end of period | $ | 16.59 | $ | 14.82 | $ | 13.00 | $ | 18.51 | $ | 14.04 |
Total Return D | | | | 16.10% | | (21.27)% | | 32.82% | | 3.24% |
Ratios to Average Net Assets B,E,F | | | | | | | | | | |
| Expenses before reductions | | .93% | | .99% | | 1.03% | | 1.05% | | 1.09% |
| Expenses net of fee waivers, if any | | | | .98% | | 1.03% | | 1.05% | | 1.08% |
| Expenses net of all reductions | | .92% | | .98% | | 1.03% | | 1.05% | | 1.06% |
| Net investment income (loss) | | 2.82% C | | 2.50% | | 2.57% | | 1.04% | | .78% |
| Supplemental Data | | | | | | | | | | |
| Net assets, end of period (000 omitted) | $ | 179,418 | $ | 122,312 | $ | 29,546 | $ | 16,365 | $ | 11,561 |
Portfolio turnover rate G | | | | 30% | | 33% | | 64% | | 43% |
ACalculated based on average shares outstanding during the period.
BNet investment income (loss) is affected by the timing of the declaration of dividends by any underlying mutual funds or exchange-traded funds (ETFs). Net investment income (loss) of any mutual funds or ETFs is not included in the Fund's net investment income (loss) ratio.
CNet investment income per share reflects one or more large, non-recurring dividend(s) which amounted to $.08 per share. Excluding such non-recurring dividend(s), the ratio of net investment income (loss) to average net assets would have been 2.35%.
DTotal returns would have been lower if certain expenses had not been reduced during the applicable periods shown.
EFees and expenses of any underlying mutual funds or exchange-traded funds (ETFs) are not included in the Fund's expense ratio. The Fund indirectly bears its proportionate share of these expenses. For additional expense information related to investments in Fidelity Central Funds, please refer to the "Investments in Fidelity Central Funds" note found in the Notes to Financial Statements section of the most recent Annual or Semi-Annual report.
FExpense ratios reflect operating expenses of the class. Expenses before reductions do not reflect amounts reimbursed, waived, or reduced through arrangements with the investment adviser, brokerage services, or other offset arrangements, if applicable, and do not represent the amount paid by the class during periods when reimbursements, waivers or reductions occur.
GAmount does not include the portfolio activity of any underlying mutual funds or exchange-traded funds (ETFs).
Notes to Financial Statements
For the period ended October 31, 2024
1. Organization.
Fidelity Emerging Markets Discovery Fund (the Fund) is a fund of Fidelity Investment Trust (the Trust) and is authorized to issue an unlimited number of shares. The Trust is registered under the Investment Company Act of 1940, as amended (the 1940 Act), as an open-end management investment company organized as a Massachusetts business trust. The Fund offers Class A, Class M, Class C, Emerging Markets Discovery, Class I and Class Z shares, each of which has equal rights as to assets and voting privileges. Class A, Class M, Class C, Class I and Class Z are Fidelity Advisor classes. Each class has exclusive voting rights with respect to matters that affect that class. Class C shares will automatically convert to Class A shares after a holding period of eight years from the initial date of purchase, with certain exceptions. The Fund's investments in emerging markets can be subject to social, economic, regulatory, and political uncertainties and can be extremely volatile.
2. Investments in Fidelity Central Funds.
Funds may invest in Fidelity Central Funds, which are open-end investment companies generally available only to other investment companies and accounts managed by the investment adviser and its affiliates. The Schedule of Investments lists any Fidelity Central Funds held as an investment as of period end, but does not include the underlying holdings of each Fidelity Central Fund. An investing fund indirectly bears its proportionate share of the expenses of the underlying Fidelity Central Funds.
Based on its investment objective, each Fidelity Central Fund may invest or participate in various investment vehicles or strategies that are similar to those of the investing fund. These strategies are consistent with the investment objectives of the investing fund and may involve certain economic risks which may cause a decline in value of each of the Fidelity Central Funds and thus a decline in the value of the investing fund.
| Fidelity Central Fund | Investment Manager | Investment Objective | Investment Practices | Expense RatioA |
| Fidelity Money Market Central Funds | Fidelity Management & Research Company LLC (FMR) | Each fund seeks to obtain a high level of current income consistent with the preservation of capital and liquidity. | Short-term Investments | Less than .005% |
A Expenses expressed as a percentage of average net assets and are as of each underlying Central Fund's most recent annual or semi-annual shareholder report.
A complete unaudited list of holdings for each Fidelity Central Fund is available upon request or at the Securities and Exchange Commission website at www.sec.gov. In addition, the financial statements of the Fidelity Central Funds which contain the significant accounting policies (including investment valuation policies) of those funds, and are not covered by the Report of Independent Registered Public Accounting Firm, are available on the Securities and Exchange Commission website or upon request.
3. Significant Accounting Policies.
The Fund is an investment company and applies the accounting and reporting guidance of the Financial Accounting Standards Board (FASB) Accounting Standards Codification Topic 946 Financial Services - Investment Companies. The financial statements have been prepared in conformity with accounting principles generally accepted in the United States of America (GAAP), which require management to make certain estimates and assumptions at the date of the financial statements. Actual results could differ from those estimates. Subsequent events, if any, through the date that the financial statements were issued have been evaluated in the preparation of the financial statements. The Fund's Schedule of Investments lists any underlying mutual funds or exchange-traded funds (ETFs) but does not include the underlying holdings of these funds. The following summarizes the significant accounting policies of the Fund:
Investment Valuation. Investments are valued as of 4:00 p.m. Eastern time on the last calendar day of the period. The Board of Trustees (the Board) has designated the Fund's investment adviser as the valuation designee responsible for the fair valuation function and performing fair value determinations as needed. The investment adviser has established a Fair Value Committee (the Committee) to carry out the day-to-day fair valuation responsibilities and has adopted policies and procedures to govern the fair valuation process and the activities of the Committee. In accordance with these fair valuation policies and procedures, which have been approved by the Board, the Fund attempts to obtain prices from one or more third party pricing services or brokers to value its investments. When current market prices, quotations or currency exchange rates are not readily available or reliable, investments will be fair valued in good faith by the Committee, in accordance with the policies and procedures. Factors used in determining fair value vary by investment type and may include market or investment specific events, transaction data, estimated cash flows, and market observations of comparable investments. The frequency that the fair valuation procedures are used cannot be predicted and they may be utilized to a significant extent. The Committee manages the Fund's fair valuation practices and maintains the fair valuation policies and procedures. The Fund's investment adviser reports to the Board information regarding the fair valuation process and related material matters.
The Fund categorizes the inputs to valuation techniques used to value its investments into a disclosure hierarchy consisting of three levels as shown below:
Level 1 - unadjusted quoted prices in active markets for identical investments
Level 2 - other significant observable inputs (including quoted prices for similar investments, interest rates, prepayment speeds, etc.)
Level 3 - unobservable inputs (including the Fund's own assumptions based on the best information available)
Valuation techniques used to value the Fund's investments by major category are as follows:
Equity securities, including restricted securities, for which market quotations are readily available, are valued at the last reported sale price or official closing price as reported by a third party pricing service on the primary market or exchange on which they are traded and are categorized as Level 1 in the hierarchy. In the event there were no sales during the day or closing prices are not available, securities are valued at the last quoted bid price or may be valued using the last available price and are generally categorized as Level 2 in the hierarchy. For foreign equity securities, when market or security specific events arise, comparisons to the valuation of American Depositary Receipts (ADRs), futures contracts, Exchange-Traded Funds (ETFs) and certain indexes as well as quoted prices for similar securities may be used and would be categorized as Level 2 in the hierarchy. For equity securities, including restricted securities, where observable inputs are limited, assumptions about market activity and risk are used and these securities may be categorized as Level 3 in the hierarchy.
Investments in open-end mutual funds, including the Fidelity Central Funds, are valued at their closing net asset value (NAV) each business day and are categorized as Level 1 in the hierarchy.
Changes in valuation techniques may result in transfers in or out of an assigned level within the disclosure hierarchy. The aggregate value of investments by input level as of October 31, 2024 is included at the end of the Fund's Schedule of Investments.
Foreign Currency. Certain Funds may use foreign currency contracts to facilitate transactions in foreign-denominated securities. Gains and losses from these transactions may arise from changes in the value of the foreign currency or if the counterparties do not perform under the contracts' terms.
Foreign-denominated assets, including investment securities, and liabilities are translated into U.S. dollars at the exchange rates at period end. Purchases and sales of investment securities, income and dividends received, and expenses denominated in foreign currencies are translated into U.S. dollars at the exchange rate in effect on the transaction date.
The effects of exchange rate fluctuations on investments are included with the net realized and unrealized gain (loss) on investment securities. Other foreign currency transactions resulting in realized and unrealized gain (loss) are disclosed separately.
Investment Transactions and Income. For financial reporting purposes, the Fund's investment holdings and NAV include trades executed through the end of the last business day of the period. The NAV per share for processing shareholder transactions is calculated as of the close of business of the New York Stock Exchange (NYSE), normally 4:00 p.m. Eastern time and includes trades executed through the end of the prior business day. Gains and losses on securities sold are determined on the basis of identified cost and include proceeds received from litigation. Commissions paid to certain brokers with whom the investment adviser, or its affiliates, places trades on behalf of a fund include an amount in addition to trade execution, which may be rebated back to a fund. Any such rebates are included in net realized gain (loss) on investments in the Statement of Operations. Dividend income is recorded on the ex-dividend date, except for certain dividends from foreign securities where the ex-dividend date may have passed, which are recorded as soon as the Fund is informed of the ex-dividend date. Non-cash dividends included in dividend income, if any, are recorded at the fair market value of the securities received. Income and capital gain distributions from Fidelity Central Funds, if any, are recorded on the ex-dividend date. Large, non-recurring dividends recognized by the Fund are presented separately on the Statement of Operations as "Special Dividends" and the impact of these dividends is presented in the Financial Highlights. Interest income is accrued as earned and includes coupon interest and amortization of premium and accretion of discount on debt securities as applicable. Investment income is recorded net of foreign taxes withheld where recovery of such taxes is uncertain. Funds may file withholding tax reclaims in certain jurisdictions to recover a portion of amounts previously withheld. Any withholding tax reclaims income is included in the Statement of Operations in foreign taxes withheld. Any receivables for withholding tax reclaims are included in the Statement of Assets and Liabilities in dividends receivable.
Class Allocations and Expenses. Investment income, realized and unrealized capital gains and losses, common expenses of a fund, and certain fund-level expense reductions, if any, are allocated daily on a pro-rata basis to each class based on the relative net assets of each class to the total net assets of a fund. Each class differs with respect to transfer agent and distribution and service plan fees incurred, as applicable. Certain expense reductions may also differ by class, if applicable. For the reporting period, the allocated portion of income and expenses to each class as a percent of its average net assets may vary due to the timing of recording these transactions in relation to fluctuating net assets of the classes. Expenses directly attributable to a fund are charged to that fund. Expenses attributable to more than one fund are allocated among the respective funds on the basis of relative net assets or other appropriate methods. Expenses included in the accompanying financial statements reflect the expenses of that fund and do not include any expenses associated with any underlying mutual funds or exchange-traded funds (ETFs). Although not included in a fund's expenses, a fund indirectly bears its proportionate share of these expenses through the net asset value of each underlying mutual fund or exchange-traded fund (ETF). Expense estimates are accrued in the period to which they relate and adjustments are made when actual amounts are known.
Income Tax Information and Distributions to Shareholders. Each year, the Fund intends to qualify as a regulated investment company under Subchapter M of the Internal Revenue Code, including distributing substantially all of its taxable income and realized gains. As a result, no provision for U.S. Federal income taxes is required. As of October 31, 2024, the Fund did not have any unrecognized tax benefits in the financial statements; nor is the Fund aware of any tax positions for which it is reasonably possible that the total amounts of unrecognized tax benefits will significantly change in the next twelve months. The Fund files a U.S. federal tax return, in addition to state and local tax returns as required. The Fund's federal income tax returns are subject to examination by the Internal Revenue Service (IRS) for a period of three fiscal years after they are filed. State and local tax returns may be subject to examination for an additional fiscal year depending on the jurisdiction. Foreign taxes are provided for based on the Fund's understanding of the tax rules and rates that exist in the foreign markets in which it invests. The Fund is subject to a tax imposed on capital gains by certain countries in which it invests. An estimated deferred tax liability for net unrealized appreciation on the applicable securities is included in Deferred taxes on the Statement of Assets and Liabilities.
Distributions are declared and recorded on the ex-dividend date. Income and capital gain distributions are declared separately for each class. Income and capital gain distributions are determined in accordance with income tax regulations, which may differ from GAAP. In addition, the Fund claimed a portion of the payment made to redeeming shareholders as a distribution for income tax purposes.
Capital accounts within the financial statements are adjusted for permanent book-tax differences. These adjustments have no impact on net assets or the results of operations. Capital accounts are not adjusted for temporary book-tax differences which will reverse in a subsequent period.
Book-tax differences are primarily due to foreign currency transactions, certain foreign taxes, passive foreign investment companies (PFIC), capital loss carryforwards and losses deferred due to wash sales.
As of period end, the cost and unrealized appreciation (depreciation) in securities, and derivatives if applicable, for federal income tax purposes were as follows:
| Gross unrealized appreciation | $230,277,161 |
| Gross unrealized depreciation | (127,658,371) |
| Net unrealized appreciation (depreciation) | $102,618,790 |
| Tax Cost | $1,104,244,568 |
The tax-based components of distributable earnings as of period end were as follows:
| Undistributed ordinary income | $39,366,739 |
| Capital loss carryforward | $(6,274,551) |
| Net unrealized appreciation (depreciation) on securities and other investments | $102,518,367 |
Capital loss carryforwards are only available to offset future capital gains of the Fund to the extent provided by regulations and may be limited. The capital loss carryforward information presented below, including any applicable limitation, is estimated as of fiscal period end and is subject to adjustment.
| Short-term | $(6,274,551) |
| Long-term | - |
| Total capital loss carryforward | $(6,274,551) |
The tax character of distributions paid was as follows:
| | October 31, 2024 | October 31, 2023 |
| Ordinary Income | $23,040,155 | $ 8,639,871 |
Restricted Securities (including Private Placements). Funds may invest in securities that are subject to legal or contractual restrictions on resale. These securities generally may be resold in transactions exempt from registration or to the public if the securities are registered. Disposal of these securities may involve time-consuming negotiations and expense, and prompt sale at an acceptable price may be difficult. Information regarding restricted securities held at period end is included at the end of the Schedule of Investments, if applicable.
New Accounting Pronouncement. In November 2023, the FASB issued Accounting Standards Update (ASU) 2023-07 Segment Reporting (Topic 280): Improvements to Reportable Segment Disclosures. Effective for fiscal years beginning after December 15, 2023 and interim periods within fiscal years beginning after December 15, 2024, the amendments enhance required disclosures of segment information for public entities on an annual and interim basis. The ASU allows for early adoption with updates applied retrospectively. Management is currently evaluating the impact of the ASU but does not expect this guidance to materially impact the financial statements.
4. Purchases and Sales of Investments.
Purchases and sales of securities, other than short-term securities and in-kind transactions, as applicable, are noted in the table below.
| | Purchases ($) | Sales ($) |
| Fidelity Emerging Markets Discovery Fund | 503,190,198 | 335,845,048 |
5. Fees and Other Transactions with Affiliates.
Management Fee. Fidelity Management & Research Company LLC (the investment adviser) and its affiliates provide the Fund with investment management related services for which the Fund pays a monthly management fee.
Effective March 1, 2024, the Fund's management contract was amended to incorporate administrative services previously covered under separate services agreements (Transfer Agent and Accounting agreements). The amended contract incorporates a management fee rate that may vary by class. The investment adviser or an affiliate pays certain expenses of managing and operating the Fund out of each class's management fee. Each class of the Fund pays a management fee to the investment adviser. The management fee is calculated and paid to the investment adviser every month. When determining a class's management fee, a mandate rate is calculated based on the monthly average net assets of a group of funds advised by FMR within a designated asset class. A discount rate is subtracted from the mandate rate once the Fund's monthly average net assets reach a certain level. The mandate rate and discount rate may vary by class. The annual management fee rate for a class of shares of the Fund is the lesser of (1) the class's mandate rate reduced by the class's discount rate (if applicable) or (2) the amount set forth in the following table.
| | Maximum Management Fee Rate % |
| Class A | 1.02 |
| Class M | 1.02 |
| Class C | 1.02 |
| Emerging Markets Discovery | 1.00 |
| Class I | 1.01 |
| Class Z | 0.88 |
One-twelfth of the management fee rate for a class is applied to the average net assets of the class for the month, giving a dollar amount which is the management fee for the class for that month. A different management fee rate may be applicable to each class of the Fund. The difference between classes is the result of separate arrangements for class-level services and/or waivers of certain expenses. It is not the result of any difference in advisory or custodial fees or other expenses related to the management of the Fund's assets, which do not vary by class. For the portion of the reporting period on or after March 1, 2024, the total annualized management fee rates were as follows:
| | Total Management Fee Rate % |
| Class A | .95 |
| Class M | .95 |
| Class C | .95 |
| Emerging Markets Discovery | .91 |
| Class I | .95 |
| Class Z | .83 |
Prior to March 1, 2024, the management fee was the sum of an individual fund fee rate that was based on an annual rate of .60% of the Fund's average net assets and an annualized group fee rate that averaged .22% during the period. The group fee rate was based upon the monthly average net assets of a group of registered investment companies with which the investment adviser has management contracts. The group fee rate decreased as assets under management increased and increased as assets under management decreased. For the portion of the reporting period prior to March 1, 2024, the total annualized management fee rate was .82%.
Effective March 1, 2024, the Fund's sub-advisory agreements with FMR Investment Management (UK) Limited, Fidelity Management & Research (Hong Kong) Limited, and Fidelity Management & Research (Japan) Limited were amended to provide that the investment adviser pays each sub-adviser monthly fees equal to 110% of the sub-adviser's costs for providing sub-advisory services.
Effective March 1, 2024, the Fund's sub-advisory agreement with FIL Investment Advisors (FIA) was amended to provide that the investment adviser pays FIA monthly fees at an annual rate of 0.50% with respect to the average daily net assets of the Fund managed by FIA. FIA in turn pays FIA(UK).
Distribution and Service Plan Fees. In accordance with Rule 12b-1 of the 1940 Act, the Fund has adopted separate Distribution and Service Plans for each class of shares. Certain classes pay Fidelity Distributors Company LLC (FDC), an affiliate of the investment adviser, separate Distribution and Service Fees, each of which is based on an annual percentage of each class' average net assets. In addition, FDC may pay financial intermediaries for selling shares of the Fund and providing shareholder support services. For the period, the Distribution and Service Fee rates, total fees and amounts retained by FDC were as follows:
| | Distribution Fee | Service Fee | Total Fees ($) | Retained by FDC ($) |
| Class A | - % | .25% | 73,743 | 5,896 |
| Class M | .25% | .25% | 30,390 | 12 |
| Class C | .75% | .25% | 33,980 | 3,645 |
| | | | 138,113 | 9,553 |
Sales Load. FDC may receive a front-end sales charge of up to 5.75% for selling Class A shares and 3.50% for selling Class M shares, some of which is paid to financial intermediaries for selling shares of the Fund. Depending on the holding period, FDC may receive contingent deferred sales charges levied on Class A, Class M and Class C redemptions. The deferred sales charges are 1.00% for Class C shares, 1.00% for certain purchases of Class A shares and .25% for certain purchases of Class M shares.
For the period, sales charge amounts retained by FDC were as follows:
| | Retained by FDC ($) |
| Class A | 8,721 |
| Class M | 684 |
Class CA | 164 |
| | 9,569 |
A When Class C shares are initially sold, FDC pays commissions from its own resources to financial intermediaries through which the sales are made.
Transfer Agent Fees. Fidelity Investments Institutional Operations Company LLC (FIIOC), an affiliate of the investment adviser, is the transfer, dividend disbursing and shareholder servicing agent for each class of the Fund. Effective March 1, 2024, the Fund's management contract was amended to incorporate transfer agent services and associated fees previously covered under a separate services agreement. FIIOC pays for typesetting, printing and mailing of shareholder reports, except proxy statements.
During the period December 1, 2023 through February 29, 2024, the transfer agent fees for each class were a fixed annual rate of class-level average net assets as follows:
| | % of Class-Level Average Net Assets | |
| Class A | 0.2000 | |
| Class M | 0.2000 | |
| Class C | 0.2000 | |
| Emerging Markets Discovery | 0.2000 | |
| Class I | 0.1752 | |
| Class Z | 0.0420 | |
| | |
| | | |
Prior to December 1, 2023, FIIOC received account fees and asset-based fees that varied according to the account size and type of account of the shareholders of the respective classes of the Fund, except for Class Z. FIIOC received an asset-based fee of Class Z's average net assets. For the portion of the reporting period prior to March 1, 2024, the fees were equivalent to the following annualized rates:
| | Amount ($) | % of Class-Level Average Net Assets |
| Class A | 18,487 | .20 |
| Class M | 4,771 | .21 |
| Class C | 2,429 | .21 |
| Emerging Markets Discovery | 283,822 | .20 |
| Class I | 292,454 | .17 |
| Class Z | 20,495 | .04 |
| 622,458 | |
Accounting Fees. Fidelity Service Company, Inc. (FSC), an affiliate of the investment adviser, maintains the Fund's accounting records. Effective March 1, 2024, the Fund's management contract was amended to incorporate accounting services and associated fees previously covered under a separate services agreement.
During the period December 1, 2023 through February 29, 2024, the accounting fees were a fixed annual rate of average net assets as follows:
| | % of Average Net Assets |
| Fidelity Emerging Markets Discovery Fund | .0455 |
Prior to December 1, 2023, the accounting fee was based on the level of average net assets for each month. For the portion of the reporting period prior to March 1, 2024, the fees were equivalent to the following annualized rates:
| | % of Average Net Assets |
| Fidelity Emerging Markets Discovery Fund | .05 |
Brokerage Commissions. A portion of portfolio transactions were placed with brokerage firms which are affiliates of the investment adviser. Brokerage commissions are included in net realized gain (loss) and change in net unrealized appreciation (depreciation) in the Statement of Operations. The commissions paid to these affiliated firms were as follows:
| | Amount ($) |
| Fidelity Emerging Markets Discovery Fund | 937 |
Interfund Lending Program. Pursuant to an Exemptive Order issued by the Securities and Exchange Commission (the SEC), the Fund, along with other registered investment companies having management contracts with Fidelity Management & Research Company LLC (FMR), or other affiliated entities of FMR, may participate in an interfund lending program. This program provides an alternative credit facility allowing the Fund to borrow from, or lend money to, other participating affiliated funds at rates that are beneficial to both the borrowing and lending fund. Borrowings under the program are generally for temporary or emergency purposes, including meeting fund shareholder redemptions. The interfund loan rate is determined, as specified in the Exemptive Order, by averaging, (1) the higher of the overnight time deposit rate and the current overnight repurchase agreement rate, and (2) a benchmark rate representing the lowest bank loan rate available to the funds. At period end, there were no interfund loans outstanding. Activity in this program during the period for which loans were outstanding was as follows:
| | Borrower or Lender | Average Loan Balance ($) | Weighted Average Interest Rate | Interest Expense ($) |
Fidelity Emerging Markets Discovery Fund | Borrower | 6,016,190 | 5.48% | 19,217 |
Interfund Trades. Funds may purchase from or sell securities to other Fidelity Funds under procedures adopted by the Board. The procedures have been designed to ensure these interfund trades are executed in accordance with Rule 17a-7 of the 1940 Act. Any interfund trades are included within the respective purchases and sales amounts shown in the Purchases and Sales of Investments note. Interfund trades during the period are noted in the table below.
| | Purchases ($) | Sales ($) | Realized Gain (Loss)($) |
| Fidelity Emerging Markets Discovery Fund | 1,344,442 | 9,916,279 | (839,589) |
6. Committed Line of Credit.
Certain Funds participate with other funds managed by the investment adviser or an affiliate in a $4.25 billion credit facility (the "line of credit") to be utilized for temporary or emergency purposes to fund shareholder redemptions or for other short-term liquidity purposes. The participating funds have agreed to pay commitment fees on their pro-rata portion of the line of credit, which are reflected in Miscellaneous expenses on the Statement of Operations, and are listed below. During the period, there were no borrowings on this line of credit.
| | Amount ($) |
| Fidelity Emerging Markets Discovery Fund | 1,884 |
7. Security Lending.
Funds lend portfolio securities from time to time in order to earn additional income. Lending agents are used, including National Financial Services (NFS), an affiliate of the investment adviser. Pursuant to a securities lending agreement, NFS will receive a fee, which is capped at 9.9% of a fund's daily lending revenue, for its services as lending agent. A fund may lend securities to certain qualified borrowers, including NFS. On the settlement date of the loan, a fund receives collateral (in the form of U.S. Treasury obligations, letters of credit and/or cash) against the loaned securities and maintains collateral in an amount not less than 100% of the market value of the loaned securities during the period of the loan. The market value of the loaned securities is determined at the close of business of a fund and any additional required collateral is delivered to a fund on the next business day. A fund or borrower may terminate the loan at any time, and if the borrower defaults on its obligation to return the securities loaned because of insolvency or other reasons, a fund may apply collateral received from the borrower against the obligation. A fund may experience delays and costs in recovering the securities loaned. Any cash collateral received is invested in the Fidelity Securities Lending Cash Central Fund. Any loaned securities are identified as such in the Schedule of Investments, and the value of loaned securities and cash collateral at period end, as applicable, are presented in the Statement of Assets and Liabilities. Security lending income represents the income earned on investing cash collateral, less rebates paid to borrowers and any lending agent fees associated with the loan, plus any premium payments received for lending certain types of securities. Security lending income is presented in the Statement of Operations as a component of income from Fidelity Central Funds. Affiliated security lending activity, if any, was as follows:
| | Total Security Lending Fees Paid to NFS ($) | Security Lending Income From Securities Loaned to NFS ($) | Value of Securities Loaned to NFS at Period End ($) |
| Fidelity Emerging Markets Discovery Fund | 56,433 | - | - |
8. Bank Borrowings.
The Fund is permitted to have bank borrowings for temporary or emergency purposes to fund shareholder redemptions or for other short-term liquidity requirements. The Fund has established borrowing arrangements with certain banks. The interest rate on the borrowings is the bank's base rate, as revised from time to time. Any open loans, including accrued interest, at period end are presented under the caption "Notes payable" in the Statement of Assets and Liabilities, if applicable. Activity in this program during the period for which loans were outstanding was as follows:| | Average Loan Balance ($) | Weighted Average Interest Rate | Interest Expense ($) |
| Fidelity Emerging Markets Discovery Fund | 2,201,000 | 5.83% | 357 |
9. Expense Reductions.
Through arrangements with the Fund's custodian and each class' transfer agent, credits realized as a result of certain uninvested cash balances were used to reduce the Fund's expenses. During the period, custodian credits reduced the Fund's expenses by $1,062. During the period, transfer agent credits reduced each class' expenses as noted in the table below.
| | Expense reduction ($) |
| | |
| Class M | 30 |
In addition, during the period the investment adviser or an affiliate reimbursed and/or waived a portion of fund-level operating expenses in the amount of $50,544.
10. Distributions to Shareholders.
Distributions to shareholders of each class were as follows:
| | Year ended October 31, 2024 | Year ended October 31, 2023 |
| Fidelity Emerging Markets Discovery Fund | | |
| Distributions to shareholders | | |
| Class A | $509,536 | $244,475 |
| Class M | 117,571 | 51,851 |
| Class C | 40,122 | 19,009 |
| Emerging Markets Discovery | 8,637,465 | 4,513,320 |
| Class I | 10,634,852 | 3,021,352 |
| Class Z | 3,100,609 | 789,864 |
Total | $23,040,155 | $8,639,871 |
11. Share Transactions.
Share transactions for each class were as follows and may contain in-kind transactions, automatic conversions between classes or exchanges between affiliated funds:
| | Shares | Shares | Dollars | Dollars |
| | Year ended October 31, 2024 | Year ended October 31, 2023 | Year ended October 31, 2024 | Year ended October 31, 2023 |
| Fidelity Emerging Markets Discovery Fund | | | | |
| Class A | | | | |
| Shares sold | 589,656 | 510,197 | $9,506,630 | $7,644,504 |
| Reinvestment of distributions | 32,877 | 17,518 | 509,269 | 244,303 |
| Shares redeemed | (333,376) | (183,067) | (5,440,815) | (2,708,612) |
| Net increase (decrease) | 289,157 | 344,648 | $4,575,084 | $5,180,195 |
| Class M | | | | |
| Shares sold | 32,443 | 154,343 | $528,491 | $2,297,021 |
| Reinvestment of distributions | 7,600 | 3,721 | 117,571 | 51,851 |
| Shares redeemed | (176,394) | (49,285) | (2,861,973) | (724,267) |
| Net increase (decrease) | (136,351) | 108,779 | $(2,215,911) | $1,624,605 |
| Class C | | | | |
| Shares sold | 39,779 | 67,155 | $631,296 | $954,938 |
| Reinvestment of distributions | 2,657 | 1,399 | 40,122 | 19,009 |
| Shares redeemed | (76,848) | (83,426) | (1,216,417) | (1,201,723) |
| Net increase (decrease) | (34,412) | (14,872) | $(544,999) | $(227,776) |
| Emerging Markets Discovery | | | | |
| Shares sold | 8,550,200 | 10,451,564 | $138,799,157 | $157,422,112 |
| Reinvestment of distributions | 500,754 | 291,173 | 7,796,740 | 4,078,445 |
| Shares redeemed | (9,155,683) | (4,985,788) | (150,486,850) | (74,007,673) |
| Net increase (decrease) | (104,729) | 5,756,949 | $(3,890,953) | $87,492,884 |
| Class I | | | | |
| Shares sold | 21,327,643 | 21,737,486 | $346,080,275 | $328,505,575 |
| Reinvestment of distributions | 647,193 | 205,837 | 10,102,677 | 2,893,435 |
| Shares redeemed | (15,930,728) | (4,589,758) | (262,986,812) | (69,325,801) |
| Net increase (decrease) | 6,044,108 | 17,353,565 | $93,196,140 | $262,073,209 |
| Class Z | | | | |
| Shares sold | 6,301,582 | 7,691,312 | $103,483,546 | $114,184,599 |
| Reinvestment of distributions | 169,011 | 55,484 | 2,631,506 | 777,160 |
| Shares redeemed | (3,907,594) | (1,766,483) | (65,063,324) | (26,394,560) |
| Net increase (decrease) | 2,562,999 | 5,980,313 | $41,051,728 | $88,567,199 |
12. Other.
A fund's organizational documents provide former and current trustees and officers with a limited indemnification against liabilities arising in connection with the performance of their duties to the fund. In the normal course of business, a fund may also enter into contracts that provide general indemnifications. A fund's maximum exposure under these arrangements is unknown as this would be dependent on future claims that may be made against a fund. The risk of material loss from such claims is considered remote.
13. Risk and Uncertainties.
Many factors affect a fund's performance. Developments that disrupt global economies and financial markets, such as pandemics, epidemics, outbreaks of infectious diseases, war, terrorism, and environmental disasters, may significantly affect a fund's investment performance. The effects of these developments to a fund will be impacted by the types of securities in which a fund invests, the financial condition, industry, economic sector, and geographic location of an issuer, and a fund's level of investment in the securities of that issuer. Significant concentrations in security types, issuers, industries, sectors, and geographic locations may magnify the factors that affect a fund's performance.
Report of Independent Registered Public Accounting Firm
To the Board of Trustees of Fidelity Investment Trust and Shareholders of Fidelity Emerging Markets Discovery Fund
Opinion on the Financial Statements
We have audited the accompanying statement of assets and liabilities, including the schedule of investments, of Fidelity Emerging Markets Discovery Fund (one of the funds constituting Fidelity Investment Trust, referred to hereafter as the "Fund") as of October 31, 2024, the related statement of operations for the year ended October 31, 2024, the statement of changes in net assets for each of the two years in the period ended October 31, 2024, including the related notes, and the financial highlights for each of the five years in the period ended October 31, 2024 (collectively referred to as the "financial statements"). In our opinion, the financial statements present fairly, in all material respects, the financial position of the Fund as of October 31, 2024, the results of its operations for the year then ended, the changes in its net assets for each of the two years in the period ended October 31, 2024 and the financial highlights for each of the five years in the period ended October 31, 2024 in conformity with accounting principles generally accepted in the United States of America.
Basis for Opinion
These financial statements are the responsibility of the Fund's management. Our responsibility is to express an opinion on the Fund's financial statements based on our audits. We are a public accounting firm registered with the Public Company Accounting Oversight Board (United States) (PCAOB) and are required to be independent with respect to the Fund in accordance with the U.S. federal securities laws and the applicable rules and regulations of the Securities and Exchange Commission and the PCAOB.
We conducted our audits of these financial statements in accordance with the standards of the PCAOB. Those standards require that we plan and perform the audit to obtain reasonable assurance about whether the financial statements are free of material misstatement, whether due to error or fraud.
Our audits included performing procedures to assess the risks of material misstatement of the financial statements, whether due to error or fraud, and performing procedures that respond to those risks. Such procedures included examining, on a test basis, evidence regarding the amounts and disclosures in the financial statements. Our audits also included evaluating the accounting principles used and significant estimates made by management, as well as evaluating the overall presentation of the financial statements. Our procedures included confirmation of securities owned as of October 31, 2024 by correspondence with the custodian and brokers; when replies were not received from brokers, we performed other auditing procedures. We believe that our audits provide a reasonable basis for our opinion.
/s/ PricewaterhouseCoopers LLP
Boston, Massachusetts
December 12, 2024
We have served as the auditor of one or more investment companies in the Fidelity group of funds since 1932.
Distributions
(Unaudited)The dividend and capital gains distributions for the fund(s) are available on Fidelity.com or Institutional.Fidelity.com.
The fund designates $1,011,550 of distributions paid during the fiscal year ended 2024 as qualifying to be taxed as section 163(j) interest dividends.
Class A designates 68.29%, Class M designates 76.22%, Class C designates 100%, Retail Class designates 62.01%, Class I designates 60.42%, and Class Z designates 58.33% of the dividend distributed in December, respectively during the fiscal year as amounts which may be taken into account as a dividend for purposes of the maximum rate under section 1(h)(11) of the Internal Revenue Code.
The amounts per share which represent income derived from sources within, and taxes paid to, foreign countries or possessions of the United States are as follows:
| | Pay Date | Income | Taxes |
| Fidelity Emerging Markets Discovery Fund | | | |
| Class A | 12/11/2023 | $0.3277 | $0.0436 |
| Class M | 12/11/2023 | $0.2936 | $0.0436 |
| Class C | 12/11/2023 | $0.2054 | $0.0436 |
| Retail Class | 12/11/2023 | $0.3609 | $0.0436 |
| Class I | 12/11/2023 | $0.3704 | $0.0436 |
| Class Z | 12/11/2023 | $0.3836 | $0.0436 |
The fund will notify shareholders in January 2025 of amounts for use in preparing 2024 income tax returns.
Item 8: Changes in and Disagreements with Accountants for Open-End Management Investment Companies
(Unaudited)
Note: This is not applicable for any fund included in this document.
Item 9: Proxy Disclosures for Open-End Management Investment Companies
(Unaudited)
| A special meeting of shareholders was held on July 16, 2024. The results of votes taken among shareholders on the proposal before them are reported below. Each vote reported represents one dollar of net asset value held on the record date for the meeting. |
| Proposal 1 |
| To elect a Board of Trustees. |
| | # of Votes | % of Votes |
| Bettina Doulton |
| Affirmative | 128,529,177,643.56 | 98.18 |
| Withheld | 2,378,037,364.30 | 1.82 |
| TOTAL | 130,907,215,007.85 | 100.00 |
| Robert A. Lawrence |
| Affirmative | 128,253,389,899.05 | 97.97 |
| Withheld | 2,653,825,108.81 | 2.03 |
| TOTAL | 130,907,215,007.85 | 100.00 |
| Vijay C. Advani |
| Affirmative | 128,531,418,228.19 | 98.19 |
| Withheld | 2,375,796,779.66 | 1.81 |
| TOTAL | 130,907,215,007.85 | 100.00 |
| Thomas P. Bostick |
| Affirmative | 128,495,261,591.41 | 98.16 |
| Withheld | 2,411,953,416.44 | 1.84 |
| TOTAL | 130,907,215,007.85 | 100.00 |
| Donald F. Donahue |
| Affirmative | 128,407,878,996.00 | 98.09 |
| Withheld | 2,499,336,011.85 | 1.91 |
| TOTAL | 130,907,215,007.85 | 100.00 |
| Vicki L. Fuller |
| Affirmative | 128,625,540,095.19 | 98.26 |
| Withheld | 2,281,674,912.66 | 1.74 |
| TOTAL | 130,907,215,007.85 | 100.00 |
| Patricia L. Kampling |
| Affirmative | 128,668,729,281.34 | 98.29 |
| Withheld | 2,238,485,726.51 | 1.71 |
| TOTAL | 130,907,215,007.85 | 100.00 |
| Thomas A. Kennedy |
| Affirmative | 128,499,824,239.79 | 98.16 |
| Withheld | 2,407,390,768.06 | 1.84 |
| TOTAL | 130,907,215,007.85 | 100.00 |
| Oscar Munoz |
| Affirmative | 128,386,109,391.05 | 98.07 |
| Withheld | 2,521,105,616.80 | 1.93 |
| TOTAL | 130,907,215,007.85 | 100.00 |
| Karen B. Peetz |
| Affirmative | 128,603,731,113.82 | 98.24 |
| Withheld | 2,303,483,894.03 | 1.76 |
| TOTAL | 130,907,215,007.85 | 100.00 |
| David M. Thomas |
| Affirmative | 128,384,899,342.98 | 98.07 |
| Withheld | 2,522,315,664.88 | 1.93 |
| TOTAL | 130,907,215,007.85 | 100.00 |
| Susan Tomasky |
| Affirmative | 128,556,148,461.60 | 98.20 |
| Withheld | 2,351,066,546.25 | 1.80 |
| TOTAL | 130,907,215,007.85 | 100.00 |
| Michael E. Wiley |
| Affirmative | 128,264,934,978.34 | 97.98 |
| Withheld | 2,642,280,029.51 | 2.02 |
| TOTAL | 130,907,215,007.85 | 100.00 |
| | | |
| Proposal 1 reflects trust-wide proposal and voting results. |
Item 10: Remuneration Paid to Directors, Officers, and others of Open-End Management Investment Companies
(Unaudited)
Note: This information is disclosed as part of the financial statements for each Fund as part of Item 7: Financial Statements and Financial Highlights for Open-End Management Investment companies.
Item 11: Statement Regarding Basis for Approval of Investment Advisory Contract
(Unaudited)
Board Approval of Investment Advisory Contracts and Management Fees
Fidelity Emerging Markets Discovery Fund
Each year, the Board of Trustees, including the Independent Trustees (together, the Board), considers the renewal of the fund's management contract with Fidelity Management & Research Company LLC (FMR) and certain affiliates and the sub-advisory agreements (together, the Advisory Contracts) for the fund. FMR and the sub-advisers are referred to herein as the Investment Advisers. The Board, assisted by the advice of fund counsel and Independent Trustees' counsel, requests and considers a broad range of information relevant to the renewal of the Advisory Contracts throughout the year.
The Board meets regularly and, at each of its meetings, covers an extensive agenda of topics and materials and considers factors that are relevant to its annual consideration of the renewal of the fund's Advisory Contracts, including the services and support provided to the fund and its shareholders. The Board, acting directly and through its Committees (each of which is composed of and chaired by Independent Trustees), requests and receives information concerning the annual consideration of the renewal of the fund's Advisory Contracts. The Board also meets as needed to review matters specifically related to the Board's annual consideration of the renewal of the Advisory Contracts. Members of the Board may also meet with trustees of other Fidelity funds through joint ad hoc committees to discuss certain matters relevant to all of the Fidelity funds.
At its May 2024 meeting, the Board unanimously determined to renew the fund's Advisory Contracts. In reaching its determination, the Board considered all factors it believed relevant, including (i) the nature, extent, and quality of the services provided to the fund and its shareholders (including the investment performance of the fund); (ii) the competitiveness relative to peer funds of the fund's management fee and the total expense ratio of a representative class (the retail class, which was selected because it was the largest class without 12b-1 fees); (iii) the total costs of the services provided by and the profits realized by FMR and its affiliates (Fidelity) from its relationships with the fund; and (iv) the extent to which, if any, economies of scale exist and are realized as the fund grows, and whether any economies of scale are appropriately shared with fund shareholders. The Board also considered the broad range of investment choices available to shareholders from FMR's competitors and that the fund's shareholders have chosen to invest in the fund, which is part of the Fidelity family of funds. The Board's decision to renew the Advisory Contracts was not based on any single factor.
The Board reached a determination, with the assistance of fund counsel and Independent Trustees' counsel and through the exercise of its business judgment, that the renewal of the Advisory Contracts was in the best interests of the fund and its shareholders and that the compensation payable under the Advisory Contracts was fair and reasonable in light of all of the surrounding circumstances.
Nature, Extent, and Quality of Services Provided. The Board considered staffing as it relates to the fund, including the backgrounds and experience of investment personnel of the Investment Advisers, and also considered the Investment Advisers' implementation of the fund's investment program. The Independent Trustees also had discussions with senior management of Fidelity's investment operations and investment groups. The Board considered the structure of the investment personnel compensation program and whether this structure provides appropriate incentives to act in the best interests of the fund. Additionally, the Board considered the portfolio managers' investments, if any, in the funds that they manage.
Resources Dedicated to Investment Management and Support Services. The Board and the Fund Oversight and Research Committees reviewed the general qualifications and capabilities of Fidelity's investment staff, including its size, education, experience, and resources, as well as Fidelity's approach to recruiting, training, managing, and compensating investment personnel. The Board noted the resources devoted to expansion of Fidelity's global investment organization, and that Fidelity's analysts have extensive resources, tools, and capabilities that allow them to conduct sophisticated quantitative and fundamental analysis, as well as credit analysis of issuers, counterparties, and guarantors. Further, the Board considered that Fidelity's investment professionals have sufficient access to global information and data so as to provide competitive investment results over time, and that those professionals also have access to sophisticated tools that permit them to assess portfolio construction and risk and performance attribution characteristics continuously, as well as to transmit new information and research conclusions rapidly around the world. Additionally, in its deliberations, the Board considered Fidelity's trading, risk management, compliance, and technology and operations capabilities and resources, which are integral parts of the investment management process.
Shareholder and Administrative Services. The Board considered (i) the nature, extent, quality, and cost of advisory, administrative, shareholder, transfer agency, and pricing and bookkeeping services performed by the Investment Advisers and their affiliates under the Advisory Contracts; (ii) the nature and extent of Fidelity's supervision of third party service providers, principally custodians, subcustodians, and pricing vendors; and (iii) the resources devoted by Fidelity to, and the record of compliance with, the fund's compliance policies and procedures. The Board also reviewed the allocation of fund brokerage, including allocations to brokers affiliated with the Investment Advisers, the use of brokerage commissions to pay fund expenses, and the use of "soft" commission dollars to pay for research services. The Board also considered the fund's securities lending activities and any payments made to Fidelity relating to securities lending under a separate agreement.
The Board noted that the growth of fund assets over time across the complex allows Fidelity to reinvest in the development of services designed to enhance the value and convenience of the Fidelity funds as investment vehicles. These services include 24-hour access to account information and market information over the Internet and through telephone representatives, investor education materials, and asset allocation tools. The Board also considered that it reviews customer service metrics such as telephone response times, continuity of services on the website and metrics addressing services at Fidelity Investor Centers.
Investment in a Large Fund Family. The Board considered the benefits to shareholders of investing in a fund that is part of a large family of funds offering a variety of investment disciplines and providing a large variety of fund investor services. The Board noted that Fidelity had taken, or had made recommendations that resulted in the Fidelity funds taking, a number of actions over the previous year that benefited particular funds and/or the Fidelity funds in general.
Investment Performance. The Board took into account discussions that occur with representatives of the Investment Advisers, and reports that it receives, at Board meetings throughout the year, relating to fund investment performance. In this regard the Board noted that as part of regularly scheduled fund reviews and other reports to the Board on fund performance, the Board considered annualized return information for the fund for different time periods, measured against an appropriate securities market index (benchmark index) and an appropriate peer group of funds with similar objectives (peer group). The Board also considered information about performance attribution. In its ongoing evaluation of fund investment performance, the Board gives particular attention to information indicating changes in performance of the funds over different time periods and discussed with the Investment Advisers the reasons for any overperformance or underperformance.
In addition to reviewing absolute and relative fund performance, the Independent Trustees periodically consider the appropriateness of fund performance metrics in evaluating the results achieved. The Independent Trustees generally give greater weight to fund performance over longer time periods than over shorter time periods. Depending on the circumstances, the Independent Trustees may be satisfied with a fund's performance notwithstanding that it lags its benchmark index or peer group for certain periods.
Based on its review, the Board concluded that the nature, extent, and quality of services provided to the fund under the Advisory Contracts should continue to benefit the shareholders of the fund.
Competitiveness of Management Fee and Total Expense Ratio. The Board was provided with information regarding industry trends in management fees and expenses. The Board considered that, effective March 1, 2024, an amended Advisory Contract with FMR went into effect with class-level management fees based on tiered schedules and subject to a maximum class-level rate (the management fee). The Board also considered that in exchange for the variable management fee, each class of the fund receives investment advisory, management, administrative, transfer agent, and pricing and bookkeeping services. In its review of the management fee and total expense ratio of the retail class, the Board considered a pro forma management fee rate for the retail class as if it had been in effect for the 12-month period ended September 30, 2023, as well as other third-party fund expenses, as applicable, such as custodial, legal, and audit fees and any fund-paid 12b-1 fees. The Board noted that Fidelity may agree to waive fees or reimburse expenses from time to time, and the extent to which, if any, it has done so for the fund.
Comparisons of Management Fees and Total Expense Ratios. Among other things, the Board reviewed data for selected groups of competitive funds and classes (referred to as "mapped groups") that were compiled by Fidelity based on combining similar investment objective categories (as classified by Morningstar) that have comparable investment mandates. The data reviewed by the Board included (i) gross management fee comparisons (before taking into account expense reimbursements or caps) relative to the total universe of funds within the mapped group; (ii) gross management fee comparisons relative to a subset of non-Fidelity funds in the mapped group that are similar in size and management fee structure to the fund (referred to as the "asset size peer group"); (iii) total expense comparisons of the retail class of the fund relative to funds and classes in the mapped group that have a similar sales load structure to the retail class of the fund (referred to as the "similar sales load structure group"); and (iv) total expense comparisons of the retail class of the fund relative to funds and classes in the similar sales load structure group that are similar in size and management fee structure to the fund (referred to as the "total expense asset size peer group"). The total expense asset size peer group comparison excludes performance adjustments and fund-paid 12b-1 fees to eliminate variability in fee structures.
The information provided to the Board indicated that the fund's management fee rate ranked below the competitive median of the mapped group for the 12-month period ended September 30, 2023 and below the competitive median of the asset size peer group for the 12-month period ended September 30, 2023. Further, the information provided to the Board indicated that the total expense ratio of the retail class of the fund ranked below the competitive median of the similar sales load structure group for the 12-month period ended September 30, 2023 and below the competitive median of the total expense asset size peer group for the 12-month period ended September 30, 2023.
The Board noted that a different variable management fee rate is applicable to each class of the fund. The Board considered that the difference in management fee rates between classes is the result of separate arrangements for class-level services and/or waivers of certain expenses and not the result of any difference in advisory or custodial fees or other expenses related to the management of the fund's assets, which do not vary by class.
Other Contractual Arrangements. The Board further considered that FMR has contractually agreed to reimburse Class A, Class M, Class C, Class I, Class Z, and the retail class of the fund to the extent that total operating expenses, with certain exceptions, as a percentage of their respective average net assets, exceed 1.55%, 1.80%, 2.30%, 1.30%, 1.15%, and 1.30% through February 28, 2025.
Fees Charged to Other Fidelity Clients. The Board also considered Fidelity fee structures and other information with respect to clients of Fidelity, such as other funds advised or subadvised by Fidelity, pension plan clients, and other institutional clients with similar mandates. The Board noted that a joint ad hoc committee created by it and the boards of other Fidelity funds periodically reviews and compares Fidelity's institutional investment advisory business with its business of providing services to the Fidelity funds and also noted the most recent findings of the committee. The Board noted that the committee's review included a consideration of the differences in services provided, fees charged, and costs incurred, as well as competition in the markets serving the different categories of clients.
Based on its review, the Board concluded that the fund's management fee is fair and reasonable in light of the services that the fund receives and the other factors considered. Further, based on its review of total expense ratios and fees charged to other Fidelity clients, the Board concluded that the total expense ratio of each class of the fund was reasonable in light of the services that the fund and its shareholders receive and the other factors considered.
Costs of the Services and Profitability. The Board considered the revenues earned and the expenses incurred by Fidelity in conducting the business of developing, marketing, distributing, managing, administering and servicing the fund and servicing the fund's shareholders. The Board also considered the level of Fidelity's profits in respect of all the Fidelity funds.
On an annual basis, Fidelity presents to the Board information about the profitability of its relationships with the fund. Fidelity calculates profitability information for each fund, as well as aggregate profitability information for groups of Fidelity funds and all Fidelity funds, using a series of detailed revenue and cost allocation methodologies which originate with the books and records of Fidelity on which Fidelity's audited financial statements are based. The Audit Committee of the Board reviews any significant changes from the prior year's methodologies.
A public accounting firm has been engaged annually by the Board as part of the Board's assessment of Fidelity's profitability analysis. The engagement includes the review and assessment of the methodologies used by Fidelity in determining the revenues and expenses attributable to Fidelity's fund business, and completion of agreed-upon procedures in respect of the mathematical accuracy of certain fund profitability information and its conformity to established allocation methodologies. After considering the reports issued under the engagement and information provided by Fidelity, the Board concluded that while other allocation methods may also be reasonable, Fidelity's profitability methodologies are reasonable in all material respects.
The Board also reviewed Fidelity's non-fund businesses and potential indirect benefits such businesses may have received as a result of their association with Fidelity's fund business (i.e., fall-out benefits) as well as cases where Fidelity's affiliates may benefit from the funds' business. The Board considered areas where potential indirect benefits to the Fidelity funds from their relationships with Fidelity may exist. The Board's consideration of these matters was informed by the findings of a joint ad hoc committee created by it and the boards of other Fidelity funds to evaluate potential fall-out benefits.
The Board considered the costs of the services provided by and the profits realized by Fidelity in connection with the operation of the fund and was satisfied that the profitability was not excessive.
Economies of Scale. The Board considered whether there have been economies of scale in respect of the management of the Fidelity funds, whether the Fidelity funds (including the fund) have appropriately benefited from any such economies of scale, and whether there is potential for realization of any further economies of scale. The Board considered the extent to which the fund will benefit from economies of scale as assets grow through increased services to the fund, through waivers or reimbursements, or through fee or expense ratio reductions. The Board also noted that a committee created by it and the boards of other Fidelity funds periodically analyzes whether Fidelity attains economies of scale in respect of the management and servicing of the Fidelity funds, whether the Fidelity funds have appropriately benefited from such economies of scale, and whether there is potential for realization of any further economies of scale.
The Board recognized that the fund's management contract incorporates a variable management fee structure, which provides breakpoints as a way to share, in part, any potential economies of scale that may exist at the asset class level and through a discount that considers both fund size and total assets of the four applicable asset classes. The Board considered that the variable management fee is designed to deliver the benefits of economies of scale to fund shareholders even if assets of any particular fund are unchanged or have declined, because some portion of Fidelity's costs are attributable to services provided to all funds subject to the variable management fee, and all such funds benefit if those costs can be allocated among more assets. The Board concluded that, given the variable management fee structure, fund shareholders will benefit from lower management fees due to the application of the breakpoints and discount factor, regardless of whether Fidelity achieves any such economies of scale.
The Board concluded, taking into account the analysis of the committee, that economies of scale, if any, are being appropriately shared between fund shareholders and Fidelity.
Additional Information Requested by the Board. In order to develop fully the factual basis for consideration of the Fidelity funds' advisory contracts, the Board requested and received additional information on certain topics, including but not limited to: (i) fund flow and performance trends, in particular the underperformance of certain funds and strategies, and Fidelity's long-term strategies for certain funds; (ii) the operation of performance fees and the rationale for implementing performance fees on certain categories of funds but not others; (iii) Fidelity's pricing philosophy compared to competitors; (iv) fund profitability methodology and data; (v) evaluation of competitive fund data and peer group classifications and fee and expense comparisons; (vi) the management fee and expense structures for different funds and classes and information about the differences between various fee and expense structures; (vii) the variable management fee implemented for certain funds effective March 1, 2024; and (viii) information regarding other accounts managed by Fidelity and the funds' sub-advisory arrangements.
Conclusion. Based on its evaluation of all of the conclusions noted above, and after considering all factors it believed relevant, the Board, including the Independent Trustees, concluded that the advisory and sub-advisory fee arrangements are fair and reasonable in light of all of the surrounding circumstances and that the fund's Advisory Contracts should be renewed through May 31, 2025.
1.931237.112
EMD-TEK-ANN-1224
Fidelity® International Discovery Fund
Annual Report
October 31, 2024
Includes Fidelity and Fidelity Advisor share classes
Contents
To view a fund's proxy voting guidelines and proxy voting record for the 12-month period ended June 30, visit http://www.fidelity.com/proxyvotingresults or visit the Securities and Exchange Commission's (SEC) web site at http://www.sec.gov.
You may also call 1-800-544-8544 if you're an individual investing directly with Fidelity, call 1-800-835-5092 if you're a plan sponsor or participant with Fidelity as your recordkeeper or call 1-877-208-0098 on institutional accounts or if you're an advisor or invest through one to request a free copy of the proxy voting guidelines.
Standard & Poor's, S&P and S&P 500 are registered service marks of The McGraw-Hill Companies, Inc. and have been licensed for use by Fidelity Distributors Corporation.
Other third-party marks appearing herein are the property of their respective owners.
All other marks appearing herein are registered or unregistered trademarks or service marks of FMR LLC or an affiliated company. © 2024 FMR LLC. All rights reserved.
This report and the financial statements contained herein are submitted for the general information of the shareholders of the Fund. This report is not authorized for distribution to prospective investors in the Fund unless preceded or accompanied by an effective prospectus.
A fund files its complete schedule of portfolio holdings with the SEC for the first and third quarters of each fiscal year on Form N-PORT. Forms N-PORT are available on the SEC's web site at http://www.sec.gov. A fund's Forms N-PORT may be reviewed and copied at the SEC's Public Reference Room in Washington, DC. Information regarding the operation of the SEC's Public Reference Room may be obtained by calling 1-800-SEC-0330.
For a complete list of a fund's portfolio holdings, view the most recent holdings listing, semiannual report, or annual report on Fidelity's web site at http://www.fidelity.com, http://www.institutional.fidelity.com, or http://www.401k.com, as applicable.
NOT FDIC INSURED •MAY LOSE VALUE •NO BANK GUARANTEE
Neither the Fund nor Fidelity Distributors Corporation is a bank.
Item 7: Financial Statements and Financial Highlights for Open-End Management Investment Companies (Annual Report)
Fidelity® International Discovery Fund
Schedule of Investments October 31, 2024
Showing Percentage of Net Assets
| Common Stocks - 96.2% |
| | | Shares | Value ($) (000s) |
| Australia - 2.5% | | | |
| Aristocrat Leisure Ltd. | | 1,676,246 | 67,452 |
| Brazilian Rare Earths Ltd. | | 3,982,215 | 7,010 |
| Canva, Inc. Class A (a)(b) | | 5,900 | 6,577 |
| CAR Group Ltd. | | 2,310,342 | 56,906 |
| IperionX Ltd. (c)(d) | | 22,329,668 | 48,121 |
| National Storage REIT unit | | 38,936,591 | 64,058 |
TOTAL AUSTRALIA | | | 250,124 |
| Bailiwick of Jersey - 0.5% | | | |
| JTC PLC (e) | | 3,742,797 | 49,613 |
| Belgium - 1.7% | | | |
| UCB SA | | 853,149 | 164,073 |
| Brazil - 2.0% | | | |
| Localiza Rent a Car SA | | 2,682,900 | 19,501 |
| MercadoLibre, Inc. (c) | | 55,551 | 113,167 |
| Nu Holdings Ltd. Class A (c) | | 3,873,730 | 58,455 |
TOTAL BRAZIL | | | 191,123 |
| Canada - 4.6% | | | |
| Alimentation Couche-Tard, Inc. (multi-vtg.) | | 1,263,730 | 65,903 |
| Cameco Corp. | | 1,034,217 | 54,045 |
| Canadian Natural Resources Ltd. | | 3,484,580 | 118,501 |
| Constellation Software, Inc. | | 63,924 | 192,782 |
| Constellation Software, Inc. warrants 3/31/40 (b)(c) | | 50,942 | 0 |
| Definity Financial Corp. | | 504,279 | 19,460 |
| Lumine Group, Inc. (c) | | 158,132 | 3,682 |
TOTAL CANADA | | | 454,373 |
| China - 1.3% | | | |
| Advanced Micro-Fabrication Equipment, Inc., China (A Shares) | | 1,102,200 | 29,761 |
| Chervon Holdings Ltd. | | 2,739,147 | 7,213 |
| JD.com, Inc. sponsored ADR | | 1,236,500 | 50,227 |
| PDD Holdings, Inc. ADR (c) | | 364,100 | 43,907 |
TOTAL CHINA | | | 131,108 |
| Denmark - 3.5% | | | |
| DSV A/S | | 192,800 | 41,904 |
| Novo Nordisk A/S Series B | | 2,330,724 | 261,426 |
| Tryg A/S | | 1,570,146 | 36,977 |
TOTAL DENMARK | | | 340,307 |
| France - 9.0% | | | |
| Air Liquide SA | | 770,868 | 138,218 |
| AXA SA | | 4,055,599 | 152,284 |
| BNP Paribas SA | | 659,267 | 45,024 |
| Danone SA | | 724,200 | 51,736 |
| EssilorLuxottica SA | | 439,962 | 103,084 |
| Hermes International SCA | | 69,401 | 156,568 |
| L'Oreal SA | | 169,985 | 63,773 |
| LVMH Moet Hennessy Louis Vuitton SE | | 83,667 | 55,699 |
| Safran SA | | 542,475 | 122,798 |
TOTAL FRANCE | | | 889,184 |
| Germany - 6.9% | | | |
| adidas AG | | 269,744 | 64,601 |
| CTS Eventim AG | | 250,700 | 26,302 |
| Merck KGaA | | 429,609 | 71,031 |
| Muenchener Rueckversicherungs-Gesellschaft AG in Muenchen | | 189,982 | 97,153 |
| Nexus AG | | 563,060 | 29,490 |
| Rheinmetall AG | | 263,902 | 135,837 |
| SAP SE | | 631,621 | 147,474 |
| Siemens AG | | 563,237 | 109,578 |
| Talanx AG | | 1 | 0 |
TOTAL GERMANY | | | 681,466 |
| Hong Kong - 0.6% | | | |
| AIA Group Ltd. | | 7,963,934 | 62,854 |
| Hungary - 0.3% | | | |
| Richter Gedeon PLC | | 846,525 | 24,453 |
| India - 2.7% | | | |
| 360 ONE WAM Ltd. | | 2,167,100 | 28,042 |
| Avenue Supermarts Ltd. (c)(e) | | 505,358 | 23,586 |
| Computer Age Management Services Private Ltd. | | 717,700 | 37,812 |
| HDFC Bank Ltd. | | 4,958,019 | 101,908 |
| HDFC Bank Ltd. sponsored ADR | | 404 | 25 |
| Larsen & Toubro Ltd. | | 964,673 | 41,438 |
| Lenskart Solutions Pvt Ltd. (a)(b)(c) | | 3,274,000 | 9,471 |
| Pine Labs Private Ltd. (a)(b)(c) | | 8,672 | 3,228 |
| Zomato Ltd. (c) | | 8,245,300 | 23,655 |
TOTAL INDIA | | | 269,165 |
| Ireland - 1.8% | | | |
| Cairn Homes PLC | | 26,936,301 | 62,380 |
| Dalata Hotel Group PLC | | 4,261,993 | 19,842 |
| Kingspan Group PLC (Ireland) | | 1,098,237 | 96,345 |
TOTAL IRELAND | | | 178,567 |
| Israel - 0.4% | | | |
| Wix.com Ltd. (c) | | 253,030 | 42,286 |
| Italy - 5.0% | | | |
| BFF Bank SpA (e) | | 3,140,339 | 30,658 |
| Ferrari NV (f) | | 158,013 | 75,195 |
| FinecoBank SpA | | 1,617,890 | 25,844 |
| Prysmian SpA | | 1,118,596 | 78,870 |
| Recordati SpA | | 215,547 | 12,215 |
| UniCredit SpA | | 5,996,302 | 265,272 |
TOTAL ITALY | | | 488,054 |
| Japan - 17.5% | | | |
| Capcom Co. Ltd. | | 2,836,342 | 56,127 |
| Daiichi Sankyo Co. Ltd. | | 1,957,017 | 63,697 |
| Fast Retailing Co. Ltd. | | 380,780 | 121,744 |
| Fuji Electric Co. Ltd. | | 1,113,615 | 56,714 |
| Hitachi Ltd. | | 11,562,855 | 290,514 |
| Hoya Corp. | | 709,721 | 94,956 |
| Itochu Corp. | | 3,201,267 | 158,360 |
| JEOL Ltd. | | 584,500 | 21,682 |
| Mitsubishi Heavy Industries Ltd. | | 5,844,891 | 82,512 |
| Mitsubishi UFJ Financial Group, Inc. | | 8,726,686 | 91,981 |
| ORIX Corp. | | 5,659,074 | 119,236 |
| Pan Pacific International Holdings Ltd. | | 2,267,144 | 56,244 |
| Recruit Holdings Co. Ltd. | | 1,429,800 | 87,307 |
| Renesas Electronics Corp. | | 2,085,544 | 27,943 |
| Shin-Etsu Chemical Co. Ltd. | | 3,556,468 | 130,323 |
| Sony Group Corp. | | 4,537,715 | 79,853 |
| Sumitomo Mitsui Financial Group, Inc. | | 3,268,818 | 69,346 |
| Tokio Marine Holdings, Inc. | | 2,103,564 | 75,762 |
| Tokyo Seimitsu Co. Ltd. | | 398,311 | 21,433 |
| Visional, Inc. (c) | | 360,594 | 19,295 |
TOTAL JAPAN | | | 1,725,029 |
| Kazakhstan - 0.2% | | | |
| Kaspi.KZ JSC ADR | | 131,410 | 14,473 |
| Korea (South) - 0.4% | | | |
| SK Hynix, Inc. | | 256,870 | 33,738 |
| Luxembourg - 0.7% | | | |
| CVC Capital Partners PLC (c)(e) | | 3,023,118 | 63,433 |
| Netherlands - 5.9% | | | |
| ASML Holding NV (Netherlands) | | 304,544 | 205,784 |
| BE Semiconductor Industries NV | | 723,750 | 77,104 |
| EXOR NV | | 211,710 | 22,384 |
| IMCD NV | | 224,144 | 35,609 |
| ING Groep NV (Certificaten Van Aandelen) | | 4,822,779 | 81,844 |
| Topicus.Com, Inc. | | 101,061 | 8,651 |
| Wolters Kluwer NV | | 900,685 | 151,563 |
TOTAL NETHERLANDS | | | 582,939 |
| Puerto Rico - 0.3% | | | |
| Liberty Latin America Ltd.: | | | |
| Class A (c) | | 2,078,340 | 20,347 |
| Class C (c) | | 1,347,944 | 13,048 |
TOTAL PUERTO RICO | | | 33,395 |
| Spain - 1.1% | | | |
| CaixaBank SA (f) | | 17,131,653 | 104,396 |
| Puig Brands SA Class B | | 336,393 | 7,757 |
TOTAL SPAIN | | | 112,153 |
| Sweden - 3.6% | | | |
| ASSA ABLOY AB (B Shares) | | 1,444,195 | 45,236 |
| Indutrade AB | | 3,886,822 | 105,282 |
| Investor AB (B Shares) | | 5,149,033 | 145,682 |
| Kry International AB (a)(b)(c) | | 194,526 | 4,077 |
| Lagercrantz Group AB (B Shares) | | 2,925,397 | 57,055 |
TOTAL SWEDEN | | | 357,332 |
| Switzerland - 1.1% | | | |
| Partners Group Holding AG | | 76,176 | 105,238 |
| Taiwan - 2.0% | | | |
| Taiwan Semiconductor Manufacturing Co. Ltd. | | 6,378,000 | 200,662 |
| United Kingdom - 15.2% | | | |
| 3i Group PLC | | 3,492,099 | 143,203 |
| AstraZeneca PLC (United Kingdom) | | 1,008,455 | 143,497 |
| BAE Systems PLC | | 7,197,767 | 116,009 |
| Baltic Classifieds Group PLC | | 4,756,761 | 19,352 |
| Bellway PLC | | 619,500 | 22,654 |
| Berkeley Group Holdings PLC | | 409,100 | 23,345 |
| Big Yellow Group PLC | | 1,839,512 | 28,653 |
| Compass Group PLC | | 5,059,305 | 164,308 |
| Diploma PLC | | 734,597 | 40,333 |
| Flutter Entertainment PLC (c)(f) | | 313,857 | 73,413 |
| Games Workshop Group PLC | | 424,330 | 65,439 |
| JD Sports Fashion PLC | | 11,516,386 | 18,414 |
| London Stock Exchange Group PLC | | 1,121,820 | 152,047 |
| RELX PLC (London Stock Exchange) | | 3,349,079 | 153,588 |
| Sage Group PLC | | 1,828,090 | 22,851 |
| Starling Bank Ltd. Series D (a)(b)(c) | | 6,223,100 | 25,437 |
| Unilever PLC | | 3,153,489 | 192,369 |
| Zegona Communications PLC (c) | | 20,350,692 | 87,121 |
TOTAL UNITED KINGDOM | | | 1,492,033 |
| United States of America - 5.4% | | | |
| CRH PLC | | 1,215,042 | 115,844 |
| Linde PLC | | 216,132 | 98,589 |
| NVIDIA Corp. | | 376,100 | 49,931 |
| Schneider Electric SA | | 520,565 | 134,852 |
| Shell PLC (London) | | 3,825,942 | 127,738 |
TOTAL UNITED STATES OF AMERICA | | | 526,954 |
| TOTAL COMMON STOCKS (Cost $6,735,491) | | | 9,464,129 |
| | | | |
| Convertible Preferred Stocks - 0.7% |
| | | Shares | Value ($) (000s) |
| Australia - 0.0% | | | |
| Canva, Inc.: | | | |
| Series A (a)(b)(c) | | 931 | 1,038 |
| Series A2 (a)(b)(c) | | 169 | 188 |
TOTAL AUSTRALIA | | | 1,226 |
| China - 0.4% | | | |
| ByteDance Ltd. Series E1 (a)(b)(c) | | 131,235 | 32,700 |
| dMed Biopharmaceutical Co. Ltd. Series C (a)(b)(c) | | 727,754 | 3,944 |
TOTAL CHINA | | | 36,644 |
| Estonia - 0.1% | | | |
| Bolt Technology OU Series E (a)(b)(c) | | 87,239 | 16,012 |
| India - 0.2% | | | |
| Pine Labs Private Ltd.: | | | |
| Series 1 (a)(b)(c) | | 20,726 | 7,715 |
| Series A (a)(b)(c) | | 5,179 | 1,928 |
| Series B (a)(b)(c) | | 5,635 | 2,098 |
| Series B2 (a)(b)(c) | | 4,558 | 1,697 |
| Series C (a)(b)(c) | | 8,478 | 3,156 |
| Series C1 (a)(b)(c) | | 1,786 | 665 |
| Series D (a)(b)(c) | | 1,910 | 711 |
TOTAL INDIA | | | 17,970 |
| TOTAL CONVERTIBLE PREFERRED STOCKS (Cost $66,551) | | | 71,852 |
| | | | |
| Money Market Funds - 3.0% |
| | | Shares | Value ($) (000s) |
| Fidelity Cash Central Fund 4.87% (g) | | 267,474,756 | 267,528 |
| Fidelity Securities Lending Cash Central Fund 4.87% (g)(h) | | 23,904,787 | 23,907 |
| TOTAL MONEY MARKET FUNDS (Cost $291,435) | | | 291,435 |
| | | | |
| TOTAL INVESTMENT IN SECURITIES - 99.9% (Cost $7,093,477) | 9,827,416 |
NET OTHER ASSETS (LIABILITIES) - 0.1% | 13,618 |
| NET ASSETS - 100.0% | 9,841,034 |
| | |
Any values shown as $0 in the Schedule of Investments may reflect amounts less than $500.
Legend
| (a) | Restricted securities (including private placements) - Investment in securities not registered under the Securities Act of 1933 (excluding 144A issues). At the end of the period, the value of restricted securities (excluding 144A issues) amounted to $120,642,000 or 1.2% of net assets. |
| (e) | Security exempt from registration under Rule 144A of the Securities Act of 1933. These securities may be resold in transactions exempt from registration, normally to qualified institutional buyers. At the end of the period, the value of these securities amounted to $167,290,000 or 1.7% of net assets. |
| (f) | Security or a portion of the security is on loan at period end. |
| (g) | Affiliated fund that is generally available only to investment companies and other accounts managed by Fidelity Investments. The rate quoted is the annualized seven-day yield of the fund at period end. A complete unaudited listing of the fund's holdings as of its most recent quarter end is available upon request. In addition, each Fidelity Central Fund's financial statements, which are not covered by the Fund's Report of Independent Registered Public Accounting Firm, are available on the SEC's website or upon request. |
| (h) | Investment made with cash collateral received from securities on loan. |
| Additional information on each restricted holding is as follows: |
| Security | Acquisition Date | Acquisition Cost ($) (000s) |
| Bolt Technology OU Series E | 1/03/22 | 22,664 |
| | | |
| ByteDance Ltd. Series E1 | 11/18/20 | 14,380 |
| | | |
| Canva, Inc. Class A | 3/18/24 | 6,293 |
| | | |
| Canva, Inc. Series A | 9/22/23 | 993 |
| | | |
| Canva, Inc. Series A2 | 9/22/23 | 180 |
| | | |
| dMed Biopharmaceutical Co. Ltd. Series C | 12/01/20 | 10,336 |
| | | |
| Kry International AB | 5/14/21 - 10/30/24 | 12,864 |
| | | |
| Lenskart Solutions Pvt Ltd. | 4/30/24 | 9,023 |
| | | |
| Pine Labs Private Ltd. | 6/30/21 | 3,233 |
| | | |
| Pine Labs Private Ltd. Series 1 | 6/30/21 | 7,728 |
| | | |
| Pine Labs Private Ltd. Series A | 6/30/21 | 1,931 |
| | | |
| Pine Labs Private Ltd. Series B | 6/30/21 | 2,101 |
| | | |
| Pine Labs Private Ltd. Series B2 | 6/30/21 | 1,699 |
| | | |
| Pine Labs Private Ltd. Series C | 6/30/21 | 3,161 |
| | | |
| Pine Labs Private Ltd. Series C1 | 6/30/21 | 666 |
| | | |
| Pine Labs Private Ltd. Series D | 6/30/21 | 712 |
| | | |
| Starling Bank Ltd. Series D | 6/18/21 | 11,126 |
| | | |
Affiliated Central Funds
Fiscal year to date information regarding the Fund's investments in Fidelity Central Funds, including the ownership percentage, is presented below.
| Affiliate (Amounts in thousands) | Value, beginning of period ($) | Purchases ($) | Sales Proceeds ($) | Dividend Income ($) | Realized Gain (loss) ($) | Change in Unrealized appreciation (depreciation) ($) | Value, end of period ($) | % ownership, end of period |
| Fidelity Cash Central Fund 4.87% | 264,603 | 2,785,030 | 2,782,105 | 12,728 | - | - | 267,528 | 0.5% |
| Fidelity Securities Lending Cash Central Fund 4.87% | 31,747 | 790,100 | 797,940 | 380 | - | - | 23,907 | 0.1% |
| Total | 296,350 | 3,575,130 | 3,580,045 | 13,108 | - | - | 291,435 | |
| | | | | | | | | |
Amounts in the dividend income column in the above table include any capital gain distributions from underlying funds, which are presented in the corresponding line item in the Statement of Operations, if applicable.
Amounts in the dividend income column for Fidelity Securities Lending Cash Central Fund represents the income earned on investing cash collateral, less rebates paid to borrowers and any lending agent fees associated with the loan, plus any premium payments received for lending certain types of securities.
Amounts included in the purchases and sales proceeds columns may include in-kind transactions, if applicable.
Other Affiliated Issuers
An affiliated company is a company in which the Fund has ownership of at least 5% of the voting securities. Fiscal year to date transactions with companies which are or were affiliates are presented in the table below. Certain corporate actions, such as mergers, are excluded from the amounts in this table if applicable. A dash in the Value end of period ($) column means either the issuer is no longer held at period end, or the issuer is held at period end but is no longer an affiliate.
| Affiliate (Amounts in thousands) | Value, beginning of period ($) | Purchases ($) | Sales Proceeds ($) | Dividend Income ($) | Realized Gain (loss) ($) | Change in Unrealized appreciation (depreciation) ($) | Value, end of period ($) |
| IperionX Ltd. | 13,105 | 8,501 | 41 | - | 18 | 26,538 | 48,121 |
| Zegona Communications PLC | 122 | 36,973 | 87 | - | 29 | 50,083 | - |
| Total | 13,227 | 45,474 | 128 | - | 47 | 76,621 | 48,121 |
Amounts included in the purchases and sales proceeds columns may include in-kind transactions, if applicable.
Investment Valuation
The following is a summary of the inputs used, as of October 31, 2024, involving the Fund's assets and liabilities carried at fair value. The inputs or methodology used for valuing securities may not be an indication of the risk associated with investing in those securities. For more information on valuation inputs, and their aggregation into the levels used below, please refer to the Investment Valuation section in the accompanying Notes to Financial Statements.
| Valuation Inputs at Reporting Date: |
Description (Amounts in thousands) | Total ($) | Level 1 ($) | Level 2 ($) | Level 3 ($) |
Investments in Securities: | | | | |
|
| Equities: | | | | |
Communication Services | 311,903 | 166,170 | 113,033 | 32,700 |
Consumer Discretionary | 1,374,791 | 701,206 | 664,114 | 9,471 |
Consumer Staples | 405,124 | 73,660 | 331,464 | - |
Energy | 300,284 | 172,546 | 127,738 | - |
Financials | 2,188,031 | 724,526 | 1,438,068 | 25,437 |
Health Care | 971,866 | 404,346 | 563,576 | 3,944 |
Industrials | 2,161,257 | 705,244 | 1,456,013 | - |
Information Technology | 1,191,909 | 660,126 | 482,693 | 49,090 |
Materials | 538,105 | 214,433 | 323,672 | - |
Real Estate | 92,711 | 28,653 | 64,058 | - |
|
| Money Market Funds | 291,435 | 291,435 | - | - |
| Total Investments in Securities: | 9,827,416 | 4,142,345 | 5,564,429 | 120,642 |
The following is a reconciliation of Investments in Securities for which Level 3 inputs were used in determining value:
| (Amounts in thousands) | |
| Investments in Securities: | |
| Beginning Balance | $ | 101,024 | |
| Net Realized Gain (Loss) on Investment Securities | | (5,589) | |
| Net Unrealized Gain (Loss) on Investment Securities | | 23,568 | |
| Cost of Purchases | | 15,849 | |
| Proceeds of Sales | | (983) | |
| Amortization/Accretion | | - | |
| Transfers into Level 3 | | - | |
| Transfers out of Level 3 | | (13,227) | |
| Ending Balance | $ | 120,642 | |
| The change in unrealized gain (loss) for the period attributable to Level 3 securities held at October 31, 2024 | $ | 18,931 | |
| The information used in the above reconciliation represents fiscal year to date activity for any Investments in Securities identified as using Level 3 inputs at either the beginning or the end of the current fiscal period. Cost of purchases and proceeds of sales may include securities received and/or delivered through in-kind transactions, corporate actions or exchanges. Transfers into Level 3 were attributable to a lack of observable market data resulting from decreases in market activity, decreases in liquidity, security restructurings or corporate actions. Transfers out of Level 3 were attributable to observable market data becoming available for those securities. Transfers in or out of Level 3 represent the beginning value of any Security or Instrument where a change in the pricing level occurred from the beginning to the end of the period. Realized and unrealized gains (losses) disclosed in the reconciliation are included in Net Gain (Loss) on the Fund's Statement of Operations. | |
Financial Statements
| Statement of Assets and Liabilities |
As of October 31, 2024 Amounts in thousands (except per-share amounts) |
| Assets | | | | |
| Investment in securities, at value (including securities loaned of $23,026) - See accompanying schedule: | | | | |
Unaffiliated issuers (cost $6,780,383) | $ | 9,487,860 | | |
Fidelity Central Funds (cost $291,435) | | 291,435 | | |
Other affiliated issuers (cost $21,659) | | 48,121 | | |
| | | | | |
| | | | | |
| Total Investment in Securities (cost $7,093,477) | | | $ | 9,827,416 |
| Foreign currency held at value (cost $1,484) | | | | 1,485 |
| Receivable for investments sold | | | | 64,975 |
| Receivable for fund shares sold | | | | 6,713 |
| Dividends receivable | | | | 15,371 |
| Reclaims receivable | | | | 22,885 |
| Distributions receivable from Fidelity Central Funds | | | | 1,114 |
| Prepaid expenses | | | | 12 |
| Other receivables | | | | 3,719 |
Total assets | | | | 9,943,690 |
| Liabilities | | | | |
| Payable for investments purchased | $ | 5,845 | | |
| Payable for fund shares redeemed | | 54,985 | | |
| Accrued management fee | | 4,636 | | |
| Distribution and service plan fees payable | | 42 | | |
| Deferred taxes | | 12,406 | | |
| Other payables and accrued expenses | | 835 | | |
| Collateral on securities loaned | | 23,907 | | |
| Total liabilities | | | | 102,656 |
| Net Assets | | | $ | 9,841,034 |
| Net Assets consist of: | | | | |
| Paid in capital | | | $ | 7,373,820 |
| Total accumulated earnings (loss) | | | | 2,467,214 |
| Net Assets | | | $ | 9,841,034 |
| | | | | |
| Net Asset Value and Maximum Offering Price | | | | |
| Class A : | | | | |
Net Asset Value and redemption price per share ($143,018 ÷ 2,878 shares)(a)(b) | | | $ | 49.70 |
| Maximum offering price per share (100/94.25 of $49.70) | | | $ | 52.73 |
| Class M : | | | | |
Net Asset Value and redemption price per share ($17,503 ÷ 356 shares)(a)(b) | | | $ | 49.16 |
| Maximum offering price per share (100/96.50 of $49.16) | | | $ | 50.94 |
| Class C : | | | | |
Net Asset Value and offering price per share ($4,485 ÷ 93 shares)(a)(b) | | | $ | 48.41 |
| International Discovery : | | | | |
Net Asset Value, offering price and redemption price per share ($3,704,910 ÷ 73,848 shares) | | | $ | 50.17 |
| Class K : | | | | |
Net Asset Value, offering price and redemption price per share ($645,612 ÷ 12,910 shares) | | | $ | 50.01 |
| Class I : | | | | |
Net Asset Value, offering price and redemption price per share ($776,727 ÷ 15,546 shares) | | | $ | 49.96 |
| Class Z : | | | | |
Net Asset Value, offering price and redemption price per share ($4,548,779 ÷ 91,096 shares) | | | $ | 49.93 |
(a)Redemption price per share is equal to net asset value less any applicable contingent deferred sales charge. |
(b)Corresponding Net Asset Value does not calculate due to rounding of fractional net assets and/or shares. |
| Statement of Operations |
| Year ended October 31, 2024 Amounts in thousands |
| Investment Income | | | | |
| Dividends | | | $ | 175,185 |
| Income from Fidelity Central Funds (including $380 from security lending) | | | | 13,108 |
| Income before foreign taxes withheld | | | $ | 188,293 |
| Less foreign taxes withheld | | | | (12,972) |
| Total income | | | | 175,321 |
| Expenses | | | | |
| Management fee | | | | |
| Basic fee | $ | 63,878 | | |
| Performance adjustment | | (17,840) | | |
| Transfer agent fees | | 2,692 | | |
| Distribution and service plan fees | | 493 | | |
| Accounting fees | | 547 | | |
| Custodian fees and expenses | | 684 | | |
| Independent trustees' fees and expenses | | 40 | | |
| Registration fees | | 160 | | |
| Audit fees | | 154 | | |
| Legal | | 8 | | |
| Interest | | 1 | | |
| Miscellaneous | | 126 | | |
| Total expenses before reductions | | 50,943 | | |
| Expense reductions | | (375) | | |
| Total expenses after reductions | | | | 50,568 |
| Net Investment income (loss) | | | | 124,753 |
| Realized and Unrealized Gain (Loss) | | | | |
| Net realized gain (loss) on: | | | | |
| Investment Securities: | | | | |
| Unaffiliated issuers (net of foreign taxes of $861) | | 262,628 | | |
| Redemptions in-kind | | 9,303 | | |
| Affiliated issuers | | 47 | | |
| Foreign currency transactions | | 631 | | |
| Total net realized gain (loss) | | | | 272,609 |
| Change in net unrealized appreciation (depreciation) on: | | | | |
| Investment Securities: | | | | |
| Unaffiliated issuers (net of increase in deferred foreign taxes of $5,260) | | 1,658,064 | | |
| Affiliated issuers | | 76,621 | | |
| Assets and liabilities in foreign currencies | | 7 | | |
| Total change in net unrealized appreciation (depreciation) | | | | 1,734,692 |
| Net gain (loss) | | | | 2,007,301 |
| Net increase (decrease) in net assets resulting from operations | | | $ | 2,132,054 |
| Statement of Changes in Net Assets |
| |
| Amount in thousands | | Year ended October 31, 2024 | | Year ended October 31, 2023 |
| Increase (Decrease) in Net Assets | | | | |
| Operations | | | | |
| Net investment income (loss) | $ | 124,753 | $ | 121,221 |
| Net realized gain (loss) | | 272,609 | | (92,662) |
| Change in net unrealized appreciation (depreciation) | | 1,734,692 | | 524,383 |
| Net increase (decrease) in net assets resulting from operations | | 2,132,054 | | 552,942 |
| Distributions to shareholders | | (157,784) | | (30,708) |
| | | | | |
| Share transactions - net increase (decrease) | | 731,094 | | (756,854) |
| Total increase (decrease) in net assets | | 2,705,364 | | (234,620) |
| | | | | |
| Net Assets | | | | |
| Beginning of period | | 7,135,670 | | 7,370,290 |
| End of period | $ | 9,841,034 | $ | 7,135,670 |
| | | | | |
| | | | | |
Financial Highlights
Fidelity Advisor® International Discovery Fund Class A |
| |
| Years ended October 31, | | 2024 | | 2023 | | 2022 | | 2021 | | 2020 |
Selected Per-Share Data | | | | | | | | | | |
| Net asset value, beginning of period | $ | 39.12 | $ | 36.68 | $ | 58.79 | $ | 45.84 | $ | 43.31 |
| Income from Investment Operations | | | | | | | | | | |
Net investment income (loss) A,B | | .50 | | .49 | | .56 C | | .18 | | .16 |
| Net realized and unrealized gain (loss) | | 10.78 | | 1.95 | | (16.91) | | 14.60 | | 3.27 |
| Total from investment operations | | 11.28 | | 2.44 | | (16.35) | | 14.78 | | 3.43 |
| Distributions from net investment income | | (.70) | | - | | (1.38) | | (.12) | | (.62) |
| Distributions from net realized gain | | - | | - | | (4.38) | | (1.71) | | (.28) |
| Total distributions | | (.70) | | - | | (5.76) | | (1.83) | | (.90) |
| Net asset value, end of period | $ | 49.70 | $ | 39.12 | $ | 36.68 | $ | 58.79 | $ | 45.84 |
Total Return D,E | | | | 6.65% | | (30.57)% | | 32.86% | | 8.02% |
Ratios to Average Net Assets B,F,G | | | | | | | | | | |
| Expenses before reductions | | .88% | | 1.00% | | 1.31% | | 1.32% | | 1.36% |
| Expenses net of fee waivers, if any | | | | .99% | | 1.30% | | 1.32% | | 1.36% |
| Expenses net of all reductions | | .87% | | .99% | | 1.30% | | 1.32% | | 1.36% |
| Net investment income (loss) | | 1.05% | | 1.17% | | 1.27% C | | .32% | | .38% |
| Supplemental Data | | | | | | | | | | |
| Net assets, end of period (in millions) | $ | 143 | $ | 122 | $ | 131 | $ | 206 | $ | 173 |
Portfolio turnover rate H | | | | 49% I | | 43% I | | 41% I | | 34% I |
ACalculated based on average shares outstanding during the period.
BNet investment income (loss) is affected by the timing of the declaration of dividends by any underlying mutual funds or exchange-traded funds (ETFs). Net investment income (loss) of any mutual funds or ETFs is not included in the Fund's net investment income (loss) ratio.
CNet investment income per share reflects one or more large, non-recurring dividend(s) which amounted to $.16 per share. Excluding such non-recurring dividend(s), the ratio of net investment income (loss) to average net assets would have been .92%.
DTotal returns would have been lower if certain expenses had not been reduced during the applicable periods shown.
ETotal returns do not include the effect of the sales charges.
FFees and expenses of any underlying mutual funds or exchange-traded funds (ETFs) are not included in the Fund's expense ratio. The Fund indirectly bears its proportionate share of these expenses. For additional expense information related to investments in Fidelity Central Funds, please refer to the "Investments in Fidelity Central Funds" note found in the Notes to Financial Statements section of the most recent Annual or Semi-Annual report.
GExpense ratios reflect operating expenses of the class. Expenses before reductions do not reflect amounts reimbursed, waived, or reduced through arrangements with the investment adviser, brokerage services, or other offset arrangements, if applicable, and do not represent the amount paid by the class during periods when reimbursements, waivers or reductions occur.
HAmount does not include the portfolio activity of any underlying mutual funds or exchange-traded funds (ETFs).
IPortfolio turnover rate excludes securities received or delivered in-kind.
Fidelity Advisor® International Discovery Fund Class M |
| |
| Years ended October 31, | | 2024 | | 2023 | | 2022 | | 2021 | | 2020 |
Selected Per-Share Data | | | | | | | | | | |
| Net asset value, beginning of period | $ | 38.71 | $ | 36.38 | $ | 58.35 | $ | 45.53 | $ | 43.01 |
| Income from Investment Operations | | | | | | | | | | |
Net investment income (loss) A,B | | .38 | | .38 | | .45 C | | .04 | | .06 |
| Net realized and unrealized gain (loss) | | 10.67 | | 1.95 | | (16.81) | | 14.51 | | 3.24 |
| Total from investment operations | | 11.05 | | 2.33 | | (16.36) | | 14.55 | | 3.30 |
| Distributions from net investment income | | (.60) | | - | | (1.23) | | (.02) | | (.51) |
| Distributions from net realized gain | | - | | - | | (4.38) | | (1.71) | | (.28) |
| Total distributions | | (.60) | | - | | (5.61) | | (1.73) | | (.78) D |
| Net asset value, end of period | $ | 49.16 | $ | 38.71 | $ | 36.38 | $ | 58.35 | $ | 45.53 |
Total Return E,F | | | | 6.40% | | (30.76)% | | 32.53% | | 7.77% |
Ratios to Average Net Assets B,G,H | | | | | | | | | | |
| Expenses before reductions | | 1.13% | | 1.24% | | 1.55% | | 1.57% | | 1.61% |
| Expenses net of fee waivers, if any | | | | 1.24% | | 1.55% | | 1.57% | | 1.61% |
| Expenses net of all reductions | | 1.12% | | 1.23% | | 1.55% | | 1.57% | | 1.60% |
| Net investment income (loss) | | .80% | | .93% | | 1.02% C | | .07% | | .13% |
| Supplemental Data | | | | | | | | | | |
| Net assets, end of period (in millions) | $ | 18 | $ | 15 | $ | 16 | $ | 25 | $ | 21 |
Portfolio turnover rate I | | | | 49% J | | 43% J | | 41% J | | 34% J |
ACalculated based on average shares outstanding during the period.
BNet investment income (loss) is affected by the timing of the declaration of dividends by any underlying mutual funds or exchange-traded funds (ETFs). Net investment income (loss) of any mutual funds or ETFs is not included in the Fund's net investment income (loss) ratio.
CNet investment income per share reflects one or more large, non-recurring dividend(s) which amounted to $.16 per share. Excluding such non-recurring dividend(s), the ratio of net investment income (loss) to average net assets would have been .67%.
DTotal distributions per share do not sum due to rounding.
ETotal returns would have been lower if certain expenses had not been reduced during the applicable periods shown.
FTotal returns do not include the effect of the sales charges.
GFees and expenses of any underlying mutual funds or exchange-traded funds (ETFs) are not included in the Fund's expense ratio. The Fund indirectly bears its proportionate share of these expenses. For additional expense information related to investments in Fidelity Central Funds, please refer to the "Investments in Fidelity Central Funds" note found in the Notes to Financial Statements section of the most recent Annual or Semi-Annual report.
HExpense ratios reflect operating expenses of the class. Expenses before reductions do not reflect amounts reimbursed, waived, or reduced through arrangements with the investment adviser, brokerage services, or other offset arrangements, if applicable, and do not represent the amount paid by the class during periods when reimbursements, waivers or reductions occur.
IAmount does not include the portfolio activity of any underlying mutual funds or exchange-traded funds (ETFs).
JPortfolio turnover rate excludes securities received or delivered in-kind.
Fidelity Advisor® International Discovery Fund Class C |
| |
| Years ended October 31, | | 2024 | | 2023 | | 2022 | | 2021 | | 2020 |
Selected Per-Share Data | | | | | | | | | | |
| Net asset value, beginning of period | $ | 38.06 | $ | 35.96 | $ | 57.59 | $ | 45.18 | $ | 42.60 |
| Income from Investment Operations | | | | | | | | | | |
Net investment income (loss) A,B | | .14 | | .16 | | .21 C | | (.27) | | (.18) |
| Net realized and unrealized gain (loss) | | 10.54 | | 1.94 | | (16.66) | | 14.38 | | 3.22 |
| Total from investment operations | | 10.68 | | 2.10 | | (16.45) | | 14.11 | | 3.04 |
| Distributions from net investment income | | (.33) | | - | | (.80) | | - | | (.19) |
| Distributions from net realized gain | | - | | - | | (4.38) | | (1.70) | | (.28) |
| Total distributions | | (.33) | | - | | (5.18) | | (1.70) | | (.46) D |
| Net asset value, end of period | $ | 48.41 | $ | 38.06 | $ | 35.96 | $ | 57.59 | $ | 45.18 |
Total Return E,F | | | | 5.84% | | (31.14)% | | 31.79% | | 7.19% |
Ratios to Average Net Assets B,G,H | | | | | | | | | | |
| Expenses before reductions | | 1.62% | | 1.77% | | 2.10% | | 2.14% | | 2.16% |
| Expenses net of fee waivers, if any | | | | 1.76% | | 2.10% | | 2.13% | | 2.15% |
| Expenses net of all reductions | | 1.62% | | 1.76% | | 2.10% | | 2.13% | | 2.15% |
| Net investment income (loss) | | .31% | | .40% | | .48% C | | (.50)% | | (.41)% |
| Supplemental Data | | | | | | | | | | |
| Net assets, end of period (in millions) | $ | 4 | $ | 4 | $ | 5 | $ | 10 | $ | 11 |
Portfolio turnover rate I | | | | 49% J | | 43% J | | 41% J | | 34% J |
ACalculated based on average shares outstanding during the period.
BNet investment income (loss) is affected by the timing of the declaration of dividends by any underlying mutual funds or exchange-traded funds (ETFs). Net investment income (loss) of any mutual funds or ETFs is not included in the Fund's net investment income (loss) ratio.
CNet investment income per share reflects one or more large, non-recurring dividend(s) which amounted to $.16 per share. Excluding such non-recurring dividend(s), the ratio of net investment income (loss) to average net assets would have been .12%.
DTotal distributions per share do not sum due to rounding.
ETotal returns would have been lower if certain expenses had not been reduced during the applicable periods shown.
FTotal returns do not include the effect of the contingent deferred sales charge.
GFees and expenses of any underlying mutual funds or exchange-traded funds (ETFs) are not included in the Fund's expense ratio. The Fund indirectly bears its proportionate share of these expenses. For additional expense information related to investments in Fidelity Central Funds, please refer to the "Investments in Fidelity Central Funds" note found in the Notes to Financial Statements section of the most recent Annual or Semi-Annual report.
HExpense ratios reflect operating expenses of the class. Expenses before reductions do not reflect amounts reimbursed, waived, or reduced through arrangements with the investment adviser, brokerage services, or other offset arrangements, if applicable, and do not represent the amount paid by the class during periods when reimbursements, waivers or reductions occur.
IAmount does not include the portfolio activity of any underlying mutual funds or exchange-traded funds (ETFs).
JPortfolio turnover rate excludes securities received or delivered in-kind.
Fidelity® International Discovery Fund |
| |
| Years ended October 31, | | 2024 | | 2023 | | 2022 | | 2021 | | 2020 |
Selected Per-Share Data | | | | | | | | | | |
| Net asset value, beginning of period | $ | 39.51 | $ | 37.04 | $ | 59.31 | $ | 46.20 | $ | 43.65 |
| Income from Investment Operations | | | | | | | | | | |
Net investment income (loss) A,B | | .65 | | .63 | | .72 C | | .36 | | .32 |
| Net realized and unrealized gain (loss) | | 10.86 | | 1.98 | | (17.07) | | 14.71 | | 3.29 |
| Total from investment operations | | 11.51 | | 2.61 | | (16.35) | | 15.07 | | 3.61 |
| Distributions from net investment income | | (.85) | | (.14) | | (1.54) | | (.25) | | (.78) |
| Distributions from net realized gain | | - | | - | | (4.38) | | (1.71) | | (.28) |
| Total distributions | | (.85) | | (.14) | | (5.92) | | (1.96) | | (1.06) |
| Net asset value, end of period | $ | 50.17 | $ | 39.51 | $ | 37.04 | $ | 59.31 | $ | 46.20 |
Total Return D | | | | 7.04% | | (30.36)% | | 33.29% | | 8.39% |
Ratios to Average Net Assets B,E,F | | | | | | | | | | |
| Expenses before reductions | | .58% | | .66% | | .98% | | .99% | | 1.02% |
| Expenses net of fee waivers, if any | | | | .65% | | .97% | | .99% | | 1.02% |
| Expenses net of all reductions | | .58% | | .65% | | .97% | | .99% | | 1.01% |
| Net investment income (loss) | | 1.35% | | 1.51% | | 1.60% C | | .65% | | .72% |
| Supplemental Data | | | | | | | | | | |
| Net assets, end of period (in millions) | $ | 3,705 | $ | 3,353 | $ | 3,386 | $ | 5,117 | $ | 6,784 |
Portfolio turnover rate G | | | | 49% H | | 43% H | | 41% H | | 34% H |
ACalculated based on average shares outstanding during the period.
BNet investment income (loss) is affected by the timing of the declaration of dividends by any underlying mutual funds or exchange-traded funds (ETFs). Net investment income (loss) of any mutual funds or ETFs is not included in the Fund's net investment income (loss) ratio.
CNet investment income per share reflects one or more large, non-recurring dividend(s) which amounted to $.16 per share. Excluding such non-recurring dividend(s), the ratio of net investment income (loss) to average net assets would have been 1.25%.
DTotal returns would have been lower if certain expenses had not been reduced during the applicable periods shown.
EFees and expenses of any underlying mutual funds or exchange-traded funds (ETFs) are not included in the Fund's expense ratio. The Fund indirectly bears its proportionate share of these expenses. For additional expense information related to investments in Fidelity Central Funds, please refer to the "Investments in Fidelity Central Funds" note found in the Notes to Financial Statements section of the most recent Annual or Semi-Annual report.
FExpense ratios reflect operating expenses of the class. Expenses before reductions do not reflect amounts reimbursed, waived, or reduced through arrangements with the investment adviser, brokerage services, or other offset arrangements, if applicable, and do not represent the amount paid by the class during periods when reimbursements, waivers or reductions occur.
GAmount does not include the portfolio activity of any underlying mutual funds or exchange-traded funds (ETFs).
HPortfolio turnover rate excludes securities received or delivered in-kind.
Fidelity® International Discovery Fund Class K |
| |
| Years ended October 31, | | 2024 | | 2023 | | 2022 | | 2021 | | 2020 |
Selected Per-Share Data | | | | | | | | | | |
| Net asset value, beginning of period | $ | 39.39 | $ | 36.93 | $ | 59.18 | $ | 46.10 | $ | 43.55 |
| Income from Investment Operations | | | | | | | | | | |
Net investment income (loss) A,B | | .68 | | .68 | | .78 C | | .41 | | .36 |
| Net realized and unrealized gain (loss) | | 10.83 | | 1.96 | | (17.02) | | 14.67 | | 3.29 |
| Total from investment operations | | 11.51 | | 2.64 | | (16.24) | | 15.08 | | 3.65 |
| Distributions from net investment income | | (.89) | | (.18) | | (1.62) | | (.29) | | (.82) |
| Distributions from net realized gain | | - | | - | | (4.38) | | (1.71) | | (.28) |
| Total distributions | | (.89) | | (.18) | | (6.01) D | | (2.00) | | (1.10) |
| Net asset value, end of period | $ | 50.01 | $ | 39.39 | $ | 36.93 | $ | 59.18 | $ | 46.10 |
Total Return E | | | | 7.15% | | (30.28)% | | 33.40% | | 8.52% |
Ratios to Average Net Assets B,F,G | | | | | | | | | | |
| Expenses before reductions | | .51% | | .55% | | .87% | | .90% | | .91% |
| Expenses net of fee waivers, if any | | | | .54% | | .87% | | .90% | | .91% |
| Expenses net of all reductions | | .51% | | .54% | | .87% | | .90% | | .91% |
| Net investment income (loss) | | 1.41% | | 1.62% | | 1.71% C | | .74% | | .83% |
| Supplemental Data | | | | | | | | | | |
| Net assets, end of period (in millions) | $ | 646 | $ | 476 | $ | 603 | $ | 1,371 | $ | 1,401 |
Portfolio turnover rate H | | | | 49% I | | 43% I | | 41% I | | 34% I |
ACalculated based on average shares outstanding during the period.
BNet investment income (loss) is affected by the timing of the declaration of dividends by any underlying mutual funds or exchange-traded funds (ETFs). Net investment income (loss) of any mutual funds or ETFs is not included in the Fund's net investment income (loss) ratio.
CNet investment income per share reflects one or more large, non-recurring dividend(s) which amounted to $.16 per share. Excluding such non-recurring dividend(s), the ratio of net investment income (loss) to average net assets would have been 1.35%.
DTotal distributions per share do not sum due to rounding.
ETotal returns would have been lower if certain expenses had not been reduced during the applicable periods shown.
FFees and expenses of any underlying mutual funds or exchange-traded funds (ETFs) are not included in the Fund's expense ratio. The Fund indirectly bears its proportionate share of these expenses. For additional expense information related to investments in Fidelity Central Funds, please refer to the "Investments in Fidelity Central Funds" note found in the Notes to Financial Statements section of the most recent Annual or Semi-Annual report.
GExpense ratios reflect operating expenses of the class. Expenses before reductions do not reflect amounts reimbursed, waived, or reduced through arrangements with the investment adviser, brokerage services, or other offset arrangements, if applicable, and do not represent the amount paid by the class during periods when reimbursements, waivers or reductions occur.
HAmount does not include the portfolio activity of any underlying mutual funds or exchange-traded funds (ETFs).
IPortfolio turnover rate excludes securities received or delivered in-kind.
Fidelity Advisor® International Discovery Fund Class I |
| |
| Years ended October 31, | | 2024 | | 2023 | | 2022 | | 2021 | | 2020 |
Selected Per-Share Data | | | | | | | | | | |
| Net asset value, beginning of period | $ | 39.35 | $ | 36.90 | $ | 59.15 | $ | 46.08 | $ | 43.53 |
| Income from Investment Operations | | | | | | | | | | |
Net investment income (loss) A,B | | .62 | | .63 | | .69 C | | .35 | | .31 |
| Net realized and unrealized gain (loss) | | 10.83 | | 1.96 | | (16.99) | | 14.67 | | 3.28 |
| Total from investment operations | | 11.45 | | 2.59 | | (16.30) | | 15.02 | | 3.59 |
| Distributions from net investment income | | (.84) | | (.14) | | (1.57) | | (.24) | | (.76) |
| Distributions from net realized gain | | - | | - | | (4.38) | | (1.71) | | (.28) |
| Total distributions | | (.84) | | (.14) | | (5.95) | | (1.95) | | (1.04) |
| Net asset value, end of period | $ | 49.96 | $ | 39.35 | $ | 36.90 | $ | 59.15 | $ | 46.08 |
Total Return D | | | | 7.01% | | (30.37)% | | 33.26% | | 8.37% |
Ratios to Average Net Assets B,E,F | | | | | | | | | | |
| Expenses before reductions | | .62% | | .67% | | .99% | | 1.02% | | 1.04% |
| Expenses net of fee waivers, if any | | | | .66% | | .99% | | 1.02% | | 1.04% |
| Expenses net of all reductions | | .62% | | .66% | | .99% | | 1.02% | | 1.03% |
| Net investment income (loss) | | 1.30% | | 1.50% | | 1.59% C | | .62% | | .70% |
| Supplemental Data | | | | | | | | | | |
| Net assets, end of period (in millions) | $ | 777 | $ | 497 | $ | 509 | $ | 566 | $ | 388 |
Portfolio turnover rate G | | | | 49% H | | 43% H | | 41% H | | 34% H |
ACalculated based on average shares outstanding during the period.
BNet investment income (loss) is affected by the timing of the declaration of dividends by any underlying mutual funds or exchange-traded funds (ETFs). Net investment income (loss) of any mutual funds or ETFs is not included in the Fund's net investment income (loss) ratio.
CNet investment income per share reflects one or more large, non-recurring dividend(s) which amounted to $.16 per share. Excluding such non-recurring dividend(s), the ratio of net investment income (loss) to average net assets would have been 1.23%.
DTotal returns would have been lower if certain expenses had not been reduced during the applicable periods shown.
EFees and expenses of any underlying mutual funds or exchange-traded funds (ETFs) are not included in the Fund's expense ratio. The Fund indirectly bears its proportionate share of these expenses. For additional expense information related to investments in Fidelity Central Funds, please refer to the "Investments in Fidelity Central Funds" note found in the Notes to Financial Statements section of the most recent Annual or Semi-Annual report.
FExpense ratios reflect operating expenses of the class. Expenses before reductions do not reflect amounts reimbursed, waived, or reduced through arrangements with the investment adviser, brokerage services, or other offset arrangements, if applicable, and do not represent the amount paid by the class during periods when reimbursements, waivers or reductions occur.
GAmount does not include the portfolio activity of any underlying mutual funds or exchange-traded funds (ETFs).
HPortfolio turnover rate excludes securities received or delivered in-kind.
Fidelity Advisor® International Discovery Fund Class Z |
| |
| Years ended October 31, | | 2024 | | 2023 | | 2022 | | 2021 | | 2020 |
Selected Per-Share Data | | | | | | | | | | |
| Net asset value, beginning of period | $ | 39.33 | $ | 36.88 | $ | 59.14 | $ | 46.07 | $ | 43.52 |
| Income from Investment Operations | | | | | | | | | | |
Net investment income (loss) A,B | | .68 | | .67 | | .76 C | | .43 | | .36 |
| Net realized and unrealized gain (loss) | | 10.82 | | 1.97 | | (16.99) | | 14.64 | | 3.29 |
| Total from investment operations | | 11.50 | | 2.64 | | (16.23) | | 15.07 | | 3.65 |
| Distributions from net investment income | | (.90) | | (.19) | | (1.65) | | (.29) | | (.82) |
| Distributions from net realized gain | | - | | - | | (4.38) | | (1.71) | | (.28) |
| Total distributions | | (.90) | | (.19) | | (6.03) | | (2.00) | | (1.10) |
| Net asset value, end of period | $ | 49.93 | $ | 39.33 | $ | 36.88 | $ | 59.14 | $ | 46.07 |
Total Return D | | | | 7.14% | | (30.29)% | | 33.40% | | 8.53% |
Ratios to Average Net Assets B,E,F | | | | | | | | | | |
| Expenses before reductions | | .52% | | .55% | | .87% | | .90% | | .91% |
| Expenses net of fee waivers, if any | | | | .54% | | .87% | | .90% | | .91% |
| Expenses net of all reductions | | .51% | | .54% | | .87% | | .90% | | .91% |
| Net investment income (loss) | | 1.41% | | 1.62% | | 1.71% C | | .74% | | .83% |
| Supplemental Data | | | | | | | | | | |
| Net assets, end of period (in millions) | $ | 4,549 | $ | 2,668 | $ | 2,720 | $ | 3,972 | $ | 54 |
Portfolio turnover rate G | | | | 49% H | | 43% H | | 41% H | | 34% H |
ACalculated based on average shares outstanding during the period.
BNet investment income (loss) is affected by the timing of the declaration of dividends by any underlying mutual funds or exchange-traded funds (ETFs). Net investment income (loss) of any mutual funds or ETFs is not included in the Fund's net investment income (loss) ratio.
CNet investment income per share reflects one or more large, non-recurring dividend(s) which amounted to $.16 per share. Excluding such non-recurring dividend(s), the ratio of net investment income (loss) to average net assets would have been 1.35%.
DTotal returns would have been lower if certain expenses had not been reduced during the applicable periods shown.
EFees and expenses of any underlying mutual funds or exchange-traded funds (ETFs) are not included in the Fund's expense ratio. The Fund indirectly bears its proportionate share of these expenses. For additional expense information related to investments in Fidelity Central Funds, please refer to the "Investments in Fidelity Central Funds" note found in the Notes to Financial Statements section of the most recent Annual or Semi-Annual report.
FExpense ratios reflect operating expenses of the class. Expenses before reductions do not reflect amounts reimbursed, waived, or reduced through arrangements with the investment adviser, brokerage services, or other offset arrangements, if applicable, and do not represent the amount paid by the class during periods when reimbursements, waivers or reductions occur.
GAmount does not include the portfolio activity of any underlying mutual funds or exchange-traded funds (ETFs).
HPortfolio turnover rate excludes securities received or delivered in-kind.
Notes to Financial Statements
For the period ended October 31, 2024
(Amounts in thousands except percentages)
1. Organization.
Fidelity International Discovery Fund (the Fund) is a fund of Fidelity Investment Trust (the Trust) and is authorized to issue an unlimited number of shares. The Trust is registered under the Investment Company Act of 1940, as amended (the 1940 Act), as an open-end management investment company organized as a Massachusetts business trust. The Fund offers Class A, Class M, Class C, International Discovery, Class K, Class I and Class Z shares, each of which has equal rights as to assets and voting privileges. Class A, Class M, Class C, Class I and Class Z are Fidelity Advisor classes. Each class has exclusive voting rights with respect to matters that affect that class. Class C shares will automatically convert to Class A shares after a holding period of eight years from the initial date of purchase, with certain exceptions.
2. Investments in Fidelity Central Funds.
Funds may invest in Fidelity Central Funds, which are open-end investment companies generally available only to other investment companies and accounts managed by the investment adviser and its affiliates. The Schedule of Investments lists any Fidelity Central Funds held as an investment as of period end, but does not include the underlying holdings of each Fidelity Central Fund. An investing fund indirectly bears its proportionate share of the expenses of the underlying Fidelity Central Funds.
Based on its investment objective, each Fidelity Central Fund may invest or participate in various investment vehicles or strategies that are similar to those of the investing fund. These strategies are consistent with the investment objectives of the investing fund and may involve certain economic risks which may cause a decline in value of each of the Fidelity Central Funds and thus a decline in the value of the investing fund.
| Fidelity Central Fund | Investment Manager | Investment Objective | Investment Practices | Expense RatioA |
| Fidelity Money Market Central Funds | Fidelity Management & Research Company LLC (FMR) | Each fund seeks to obtain a high level of current income consistent with the preservation of capital and liquidity. | Short-term Investments | Less than .005% |
A Expenses expressed as a percentage of average net assets and are as of each underlying Central Fund's most recent annual or semi-annual shareholder report.
A complete unaudited list of holdings for each Fidelity Central Fund is available upon request or at the Securities and Exchange Commission website at www.sec.gov. In addition, the financial statements of the Fidelity Central Funds which contain the significant accounting policies (including investment valuation policies) of those funds, and are not covered by the Report of Independent Registered Public Accounting Firm, are available on the Securities and Exchange Commission website or upon request.
3. Significant Accounting Policies.
The Fund is an investment company and applies the accounting and reporting guidance of the Financial Accounting Standards Board (FASB) Accounting Standards Codification Topic 946 Financial Services - Investment Companies. The financial statements have been prepared in conformity with accounting principles generally accepted in the United States of America (GAAP), which require management to make certain estimates and assumptions at the date of the financial statements. Actual results could differ from those estimates. Subsequent events, if any, through the date that the financial statements were issued have been evaluated in the preparation of the financial statements. The Fund's Schedule of Investments lists any underlying mutual funds or exchange-traded funds (ETFs) but does not include the underlying holdings of these funds. The following summarizes the significant accounting policies of the Fund:
Investment Valuation. Investments are valued as of 4:00 p.m. Eastern time on the last calendar day of the period. The Board of Trustees (the Board) has designated the Fund's investment adviser as the valuation designee responsible for the fair valuation function and performing fair value determinations as needed. The investment adviser has established a Fair Value Committee (the Committee) to carry out the day-to-day fair valuation responsibilities and has adopted policies and procedures to govern the fair valuation process and the activities of the Committee. In accordance with these fair valuation policies and procedures, which have been approved by the Board, the Fund attempts to obtain prices from one or more third party pricing services or brokers to value its investments. When current market prices, quotations or currency exchange rates are not readily available or reliable, investments will be fair valued in good faith by the Committee, in accordance with the policies and procedures. Factors used in determining fair value vary by investment type and may include market or investment specific events, transaction data, estimated cash flows, and market observations of comparable investments. The frequency that the fair valuation procedures are used cannot be predicted and they may be utilized to a significant extent. The Committee manages the Fund's fair valuation practices and maintains the fair valuation policies and procedures. The Fund's investment adviser reports to the Board information regarding the fair valuation process and related material matters.
The Fund categorizes the inputs to valuation techniques used to value its investments into a disclosure hierarchy consisting of three levels as shown below:
Level 1 - unadjusted quoted prices in active markets for identical investments
Level 2 - other significant observable inputs (including quoted prices for similar investments, interest rates, prepayment speeds, etc.)
Level 3 - unobservable inputs (including the Fund's own assumptions based on the best information available)
Valuation techniques used to value the Fund's investments by major category are as follows:
Equity securities, including restricted securities, for which market quotations are readily available, are valued at the last reported sale price or official closing price as reported by a third party pricing service on the primary market or exchange on which they are traded and are categorized as Level 1 in the hierarchy. In the event there were no sales during the day or closing prices are not available, securities are valued at the last quoted bid price or may be valued using the last available price and are generally categorized as Level 2 in the hierarchy. For foreign equity securities, when market or security specific events arise, comparisons to the valuation of American Depositary Receipts (ADRs), futures contracts, Exchange-Traded Funds (ETFs) and certain indexes as well as quoted prices for similar securities may be used and would be categorized as Level 2 in the hierarchy. For equity securities, including restricted securities, where observable inputs are limited, assumptions about market activity and risk are used and these securities may be categorized as Level 3 in the hierarchy. Securities, including private placements or other restricted securities, for which observable inputs are not available are valued using alternate valuation approaches, including the market approach, the income approach and cost approach, and are categorized as Level 3 in the hierarchy. The market approach considers factors including the price of recent investments in the same or a similar security or financial metrics of comparable securities. The income approach considers factors including expected future cash flows, security specific risks and corresponding discount rates. The cost approach considers factors including the value of the security's underlying assets and liabilities.
Investments in open-end mutual funds, including the Fidelity Central Funds, are valued at their closing net asset value (NAV) each business day and are categorized as Level 1 in the hierarchy.
The following provides information on Level 3 securities held by the Fund that were valued at period end based on unobservable inputs. These amounts exclude valuations provided by a broker.
| Asset Type | Fair Value | Valuation Technique(s) | Unobservable Input | Amount or Range/Weighted Average | Impact to Valuation from an Increase in InputA |
| Equities | $120,642 | Market comparable | Enterprise value/Revenue multiple (EV/R) | 2.5 - 12.8 / 5.2 | Increase |
| | | | Enterprise value/EBITDA multiple (EV/EBITDA) | 6.0 | Increase |
| | | | Enterprise value/Net income multiple (EV/NI) | 16.0 | Increase |
| | | Recovery value | Recovery value | $0.00 | Increase |
| | | Black scholes | Discount rate | 2.2% - 4.0% / 3.1% | Increase |
| | | | Term | 2.0 - 3.0 / 2.5 | Increase |
| | | | Volatility | 60.0% - 65.0% / 62.5% | Increase |
A Represents the directional change in the fair value of the Level 3 investments that could have resulted from an increase in the corresponding input as of period end. A decrease to the unobservable input would have had the opposite effect. Significant changes in these inputs may have resulted in a significantly higher or lower fair value measurement at period end.
Changes in valuation techniques may result in transfers in or out of an assigned level within the disclosure hierarchy. The aggregate value of investments by input level as of October 31, 2024, as well as a roll forward of Level 3 investments, is included at the end of the Fund's Schedule of Investments.
Foreign Currency. Certain Funds may use foreign currency contracts to facilitate transactions in foreign-denominated securities. Gains and losses from these transactions may arise from changes in the value of the foreign currency or if the counterparties do not perform under the contracts' terms.
Foreign-denominated assets, including investment securities, and liabilities are translated into U.S. dollars at the exchange rates at period end. Purchases and sales of investment securities, income and dividends received, and expenses denominated in foreign currencies are translated into U.S. dollars at the exchange rate in effect on the transaction date.
The effects of exchange rate fluctuations on investments are included with the net realized and unrealized gain (loss) on investment securities. Other foreign currency transactions resulting in realized and unrealized gain (loss) are disclosed separately.
Investment Transactions and Income. For financial reporting purposes, the Fund's investment holdings and NAV include trades executed through the end of the last business day of the period. The NAV per share for processing shareholder transactions is calculated as of the close of business of the New York Stock Exchange (NYSE), normally 4:00 p.m. Eastern time and includes trades executed through the end of the prior business day. Gains and losses on securities sold are determined on the basis of identified cost and include proceeds received from litigation. Commissions paid to certain brokers with whom the investment adviser, or its affiliates, places trades on behalf of a fund include an amount in addition to trade execution, which may be rebated back to a fund. Any such rebates are included in net realized gain (loss) on investments in the Statement of Operations. Dividend income is recorded on the ex-dividend date, except for certain dividends from foreign securities where the ex-dividend date may have passed, which are recorded as soon as the Fund is informed of the ex-dividend date. Non-cash dividends included in dividend income, if any, are recorded at the fair market value of the securities received. Income and capital gain distributions from Fidelity Central Funds, if any, are recorded on the ex-dividend date. Investment income is recorded net of foreign taxes withheld where recovery of such taxes is uncertain. Funds may file withholding tax reclaims in certain jurisdictions to recover a portion of amounts previously withheld. Any withholding tax reclaims income is included in the Statement of Operations in foreign taxes withheld. Any receivables for withholding tax reclaims are included in the Statement of Assets and Liabilities in reclaims receivable. The Fund has filed tax reclaims for previously withheld taxes on dividends earned in certain European Union (EU) countries. These additional filings are subject to various administrative proceedings by the local jurisdictions' tax authorities within the EU, as well as a number of related judicial proceedings. Income recognized for EU reclaims is included with other reclaims in the Statement of Operations in foreign taxes withheld. These reclaims are recorded when the amount is known and there are no significant uncertainties on collectability.
Class Allocations and Expenses. Investment income, realized and unrealized capital gains and losses, common expenses of a fund, and certain fund-level expense reductions, if any, are allocated daily on a pro-rata basis to each class based on the relative net assets of each class to the total net assets of a fund. Each class differs with respect to transfer agent and distribution and service plan fees incurred, as applicable. Certain expense reductions may also differ by class, if applicable. For the reporting period, the allocated portion of income and expenses to each class as a percent of its average net assets may vary due to the timing of recording these transactions in relation to fluctuating net assets of the classes. Expenses directly attributable to a fund are charged to that fund. Expenses attributable to more than one fund are allocated among the respective funds on the basis of relative net assets or other appropriate methods. Expenses included in the accompanying financial statements reflect the expenses of that fund and do not include any expenses associated with any underlying mutual funds or exchange-traded funds (ETFs). Although not included in a fund's expenses, a fund indirectly bears its proportionate share of these expenses through the net asset value of each underlying mutual fund or exchange-traded fund (ETF). Expense estimates are accrued in the period to which they relate and adjustments are made when actual amounts are known.
Deferred Trustee Compensation. Under a Deferred Compensation Plan (the Plan) for certain Funds, certain independent Trustees have elected to defer receipt of a portion of their annual compensation. Deferred amounts are invested in affiliated mutual funds, are marked-to-market and remain in a fund until distributed in accordance with the Plan. The investment of deferred amounts and the offsetting payable to the Trustees presented below are included in the accompanying Statement of Assets and Liabilities in other receivables and other payables and accrued expenses, as applicable.
| Fidelity International Discovery Fund | $455 |
Income Tax Information and Distributions to Shareholders. Each year, the Fund intends to qualify as a regulated investment company under Subchapter M of the Internal Revenue Code, including distributing substantially all of its taxable income and realized gains. As a result, no provision for U.S. Federal income taxes is required. As of October 31, 2024, the Fund did not have any unrecognized tax benefits in the financial statements; nor is the Fund aware of any tax positions for which it is reasonably possible that the total amounts of unrecognized tax benefits will significantly change in the next twelve months. The Fund files a U.S. federal tax return, in addition to state and local tax returns as required. The Fund's federal income tax returns are subject to examination by the Internal Revenue Service (IRS) for a period of three fiscal years after they are filed. State and local tax returns may be subject to examination for an additional fiscal year depending on the jurisdiction. Foreign taxes are provided for based on the Fund's understanding of the tax rules and rates that exist in the foreign markets in which it invests. The Fund is subject to a tax imposed on capital gains by certain countries in which it invests. An estimated deferred tax liability for net unrealized appreciation on the applicable securities is included in Deferred taxes on the Statement of Assets and Liabilities.
Distributions are declared and recorded on the ex-dividend date. Income and capital gain distributions are declared separately for each class. Income and capital gain distributions are determined in accordance with income tax regulations, which may differ from GAAP. In addition, the Fund claimed a portion of the payment made to redeeming shareholders as a distribution for income tax purposes.
Capital accounts within the financial statements are adjusted for permanent book-tax differences. These adjustments have no impact on net assets or the results of operations. Capital accounts are not adjusted for temporary book-tax differences which will reverse in a subsequent period.
Book-tax differences are primarily due to foreign currency transactions, certain foreign taxes, passive foreign investment companies (PFIC), redemptions in-kind, deferred Trustee compensation, capital loss carryforwards, and losses deferred due to wash sales.
As of period end, the cost and unrealized appreciation (depreciation) in securities, and derivatives if applicable, for federal income tax purposes were as follows:
| Gross unrealized appreciation | $2,648,280 |
| Gross unrealized depreciation | (151,892) |
| Net unrealized appreciation (depreciation) | $2,496,388 |
| Tax Cost | $7,331,028 |
The tax-based components of distributable earnings as of period end were as follows:
| Undistributed ordinary income | $265,725 |
| Capital loss carryforward | $(278,890) |
| Net unrealized appreciation (depreciation) on securities and other investments | $2,493,014 |
Capital loss carryforwards are only available to offset future capital gains of the Fund to the extent provided by regulations and may be limited. The capital loss carryforward information presented below, including any applicable limitation, is estimated as of fiscal period end and is subject to adjustment.
Short-term | $(278,890) |
| Long-term | - |
| Total capital loss carryforward | $(278,890) |
The tax character of distributions paid was as follows:
| | October 31, 2024 | October 31, 2023 |
| Ordinary Income | $157,784 | $30,708 |
Restricted Securities (including Private Placements). Funds may invest in securities that are subject to legal or contractual restrictions on resale. These securities generally may be resold in transactions exempt from registration or to the public if the securities are registered. Disposal of these securities may involve time-consuming negotiations and expense, and prompt sale at an acceptable price may be difficult. Information regarding restricted securities held at period end is included at the end of the Schedule of Investments, if applicable.
New Accounting Pronouncement. In November 2023, the FASB issued Accounting Standards Update (ASU) 2023-07 Segment Reporting (Topic 280): Improvements to Reportable Segment Disclosures. Effective for fiscal years beginning after December 15, 2023 and interim periods within fiscal years beginning after December 15, 2024, the amendments enhance required disclosures of segment information for public entities on an annual and interim basis. The ASU allows for early adoption with updates applied retrospectively. Management is currently evaluating the impact of the ASU but does not expect this guidance to materially impact the financial statements.
4. Purchases and Sales of Investments.
Purchases and sales of securities, other than short-term securities and in-kind transactions, as applicable, are noted in the table below.
| | Purchases ($) | Sales ($) |
| Fidelity International Discovery Fund | 4,623,083 | 3,912,728 |
Unaffiliated Redemptions In-Kind. Shares that were redeemed in-kind for investments, including accrued interest and cash, if any, are shown in the table below. The net realized gain or loss on investments delivered through in-kind redemptions is included in the "Net realized gain (loss) on: Redemptions in-kind" line in the accompanying Statement of Operations. The amount of the in-kind redemptions is included in share transactions in the accompanying Statement of Changes in Net Assets. There was no gain or loss for federal income tax purposes.
| | Shares | Total net realized gain or loss ($) | Total Proceeds ($) |
| Fidelity International Discovery Fund | 873 | 9,303 | 36,397 |
Unaffiliated Exchanges In-Kind. Shares that were exchanged for investments, including accrued interest and cash, if any, are shown in the table below. The amount of in-kind exchanges is included in share transactions in the accompanying Statement of Changes in Net Assets.
| | Shares | Total Proceeds ($) |
| Fidelity International Discovery Fund | 95 | 4,687 |
Prior Fiscal Year Unaffiliated Redemptions In-Kind. Shares that were redeemed in-kind for investments, including accrued interest and cash, if any, are shown in the table below; along with realized gain or loss on investments delivered through in-kind redemptions. The amount of the in-kind redemptions is included in share transactions in the accompanying Statement of Changes in Net Assets. There was no gain or loss for federal income tax purposes.
| | Shares | Total net realized gain or loss ($) | Total Proceeds ($) |
| Fidelity International Discovery Fund | 2,746 | 29,458 | 115,652 |
5. Fees and Other Transactions with Affiliates.
Management Fee. Fidelity Management & Research Company LLC (the investment adviser) and its affiliates provide the Fund with investment management related services for which the Fund pays a monthly management fee.
Effective March 1, 2024, the Fund's management contract was amended to incorporate administrative services previously covered under separate services agreements (Transfer Agent and Accounting agreements). The amended contract incorporates a basic fee rate that may vary by class (subject to a performance adjustment). The investment adviser or an affiliate pays certain expenses of managing and operating the Fund out of each class's management fee. Each class of the Fund pays a management fee to the investment adviser. The management fee is calculated and paid to the investment adviser every month. The management fee is determined by calculating a basic fee and then applying a performance adjustment. When determining a class's basic fee, a mandate rate is calculated based on the monthly average net assets of a group of funds advised by FMR within a designated asset class. A discount rate is subtracted from the mandate rate once the Fund's monthly average net assets reach a certain level. The mandate rate and discount rate may vary by class. The annual basic fee rate for a class of shares of the Fund is the lesser of (1) the class's mandate rate reduced by the class's discount rate (if applicable) or (2) the amount set forth in the following table.
| | Maximum Management Fee Rate % |
| Class A | .84 |
| Class M | .84 |
| Class C | .84 |
| International Discovery | .78 |
| Class K | .68 |
| Class I | .80 |
| Class Z | .68 |
One-twelfth of the basic fee rate for a class is applied to the average net assets of the class for the month, giving a dollar amount which is the basic fee for the class for that month. A different management fee rate may be applicable to each class of the Fund. The difference between classes is the result of separate arrangements for class-level services and/or waivers of certain expenses. It is not the result of any difference in advisory or custodial fees or other expenses related to the management of the Fund's assets, which do not vary by class. For the portion of the reporting period on or after March 1, 2024, the total annualized management fee rates were as follows:
| | Total Management Fee Rate % |
| Class A | .80 |
| Class M | .80 |
| Class C | .80 |
| International Discovery | .76 |
| Class K | .68 |
| Class I | .80 |
| Class Z | .68 |
Prior to March 1, 2024, the management fee was the sum of an individual fund fee rate that was based on an annual rate of .42% of the Fund's average net assets and an annualized group fee rate that averaged .22% during the period. The group fee rate was based upon the monthly average net assets of a group of registered investment companies with which the investment adviser has management contracts. The group fee rate decreased as assets under management increased and increased as assets under management decreased. For the portion of the reporting period prior to March 1, 2024, the total annualized management fee rate was .65%.
The performance adjustment rate is calculated monthly by comparing over the performance period the Fund's performance to that of the performance adjustment index listed below.
| | Performance Adjustment Index |
| Fidelity International Discovery Fund | MSCI EAFE Index |
For the purposes of calculating the performance adjustment for the Fund, the Fund's investment performance is based on the performance of International Discovery. To the extent that other classes of the Fund have higher expenses, this could result in those classes bearing a larger positive performance adjustment and smaller negative performance adjustment than would be the case if each class's own performance were considered. The performance period is the most recent 36 month period. The maximum annualized performance adjustment rate is ±.20% of the Fund's average net assets over the performance period. The performance adjustment rate is divided by twelve and multiplied by the Fund's average net assets over the performance period, and the resulting dollar amount is proportionately added to or subtracted from a class's basic fee. For the entire reporting period, the total annual performance adjustment was (.20)%.
Effective March 1, 2024, the Fund's sub-advisory agreements with FMR Investment Management (UK) Limited, Fidelity Management & Research (Hong Kong) Limited, and Fidelity Management & Research (Japan) Limited were amended to provide that the investment adviser pays each sub-adviser monthly fees equal to 110% of the sub-adviser's costs for providing sub-advisory services.
Effective March 1, 2024, the Fund's sub-advisory agreement with FIL Investment Advisors (FIA) was amended to provide that the investment adviser pays FIA monthly fees at an annual rate of 0.44% with respect to the average daily net assets of the Fund managed by FIA. FIA in turn pays FIA(UK).
Distribution and Service Plan Fees. In accordance with Rule 12b-1 of the 1940 Act, the Fund has adopted separate Distribution and Service Plans for each class of shares. Certain classes pay Fidelity Distributors Company LLC (FDC), an affiliate of the investment adviser, separate Distribution and Service Fees, each of which is based on an annual percentage of each class' average net assets. In addition, FDC may pay financial intermediaries for selling shares of the Fund and providing shareholder support services. For the period, the Distribution and Service Fee rates, total fees and amounts retained by FDC were as follows:
| | Distribution Fee | Service Fee | Total Fees ($) | Retained by FDC ($) |
| Class A | - % | .25% | 357 | -A |
| Class M | .25% | .25% | 89 | - |
| Class C | .75% | .25% | 47 | 4 |
| | | | 493 | 4 |
A In the amount of the less than five hundred dollars.
Sales Load. FDC may receive a front-end sales charge of up to 5.75% for selling Class A shares and 3.50% for selling Class M shares, some of which is paid to financial intermediaries for selling shares of the Fund. Depending on the holding period, FDC may receive contingent deferred sales charges levied on Class A, Class M and Class C redemptions. The deferred sales charges are 1.00% for Class C shares, 1.00% for certain purchases of Class A shares and .25% for certain purchases of Class M shares.
For the period, sales charge amounts retained by FDC were as follows:
| | Retained by FDC ($) |
| Class A | 9 |
| Class M | 1 |
Class CA | -B |
| | 10 |
A When Class C shares are initially sold, FDC pays commissions from its own resources to financial intermediaries through which the sales are made.
B In the amount of the less than five hundred dollars.
Transfer Agent Fees. Fidelity Investments Institutional Operations Company LLC (FIIOC), an affiliate of the investment adviser, is the transfer, dividend disbursing and shareholder servicing agent for each class of the Fund. Effective March 1, 2024, the Fund's management contract was amended to incorporate transfer agent services and associated fees previously covered under a separate services agreement. FIIOC pays for typesetting, printing and mailing of shareholder reports, except proxy statements.
During the period December 1, 2023 through February 29, 2024, the transfer agent fees for each class were a fixed annual rate of class-level average net assets as follows:
| | % of Class-Level Average Net Assets | |
| Class A | .2000 | |
| Class M | .2000 | |
| Class C | .2000 | |
| International Discovery | .1447 | |
| Class K | .0420 | |
| Class I | .1603 | |
| Class Z | .0420 | |
| | |
| | | |
Prior to December 1, 2023, FIIOC received account fees and asset-based fees that varied according to the account size and type of account of the shareholders of the respective classes of the Fund, except for Class K and Class Z. FIIOC received an asset-based fee of Class K's and Class Z's average net assets. For the portion of the reporting period prior to March 1, 2024, the fees were equivalent to the following annualized rates:
| | Amount ($) | % of Class-Level Average Net Assets |
| Class A | 93 | .21 |
| Class M | 12 | .21 |
| Class C | 3 | .21 |
| International Discovery | 1,775 | .14 |
| Class K | 69 | .04 |
| Class I | 292 | .16 |
| Class Z | 448 | .04 |
| | 2,692 | |
Accounting Fees. Fidelity Service Company, Inc. (FSC), an affiliate of the investment adviser, maintains the Fund's accounting records. Effective March 1, 2024, the Fund's management contract was amended to incorporate accounting services and associated fees previously covered under a separate services agreement.
During the period December 1, 2023 through February 29, 2024, the accounting fees were a fixed annual rate of average net assets as follows:
| | % of Average Net Assets |
| Fidelity International Discovery Fund | .0200 |
Prior to December 1, 2023, the accounting fee was based on the level of average net assets for each month. For the portion of the reporting period prior to March 1, 2024, the fees were equivalent to the following annualized rates:
| | % of Average Net Assets |
| Fidelity International Discovery Fund | .02 |
Brokerage Commissions. A portion of portfolio transactions were placed with brokerage firms which are affiliates of the investment adviser. Brokerage commissions are included in net realized gain (loss) and change in net unrealized appreciation (depreciation) in the Statement of Operations. The commissions paid to these affiliated firms were as follows:
| | Amount ($) |
| Fidelity International Discovery Fund | 4 |
Interfund Lending Program. Pursuant to an Exemptive Order issued by the Securities and Exchange Commission (the SEC), the Fund, along with other registered investment companies having management contracts with Fidelity Management & Research Company LLC (FMR), or other affiliated entities of FMR, may participate in an interfund lending program. This program provides an alternative credit facility allowing the Fund to borrow from, or lend money to, other participating affiliated funds at rates that are beneficial to both the borrowing and lending fund. Borrowings under the program are generally for temporary or emergency purposes, including meeting fund shareholder redemptions. The interfund loan rate is determined, as specified in the Exemptive Order, by averaging, (1) the higher of the overnight time deposit rate and the current overnight repurchase agreement rate, and (2) a benchmark rate representing the lowest bank loan rate available to the funds. At period end, there were no interfund loans outstanding. Activity in this program during the period for which loans were outstanding was as follows:
| | Borrower or Lender | Average Loan Balance ($) | Weighted Average Interest Rate | Interest Expense ($) |
| Fidelity International Discovery Fund | Borrower | 4,624 | 5.57% | 1 |
Interfund Trades. Funds may purchase from or sell securities to other Fidelity Funds under procedures adopted by the Board. The procedures have been designed to ensure these interfund trades are executed in accordance with Rule 17a-7 of the 1940 Act. Any interfund trades are included within the respective purchases and sales amounts shown in the Purchases and Sales of Investments note. Interfund trades during the period are noted in the table below.
| | Purchases ($) | Sales ($) | Realized Gain (Loss)($) |
| Fidelity International Discovery Fund | 94,333 | 166,828 | 415 |
6. Committed Line of Credit.
Certain Funds participate with other funds managed by the investment adviser or an affiliate in a $4.25 billion credit facility (the "line of credit") to be utilized for temporary or emergency purposes to fund shareholder redemptions or for other short-term liquidity purposes. The participating funds have agreed to pay commitment fees on their pro-rata portion of the line of credit, which are reflected in Miscellaneous expenses on the Statement of Operations, and are listed below. During the period, there were no borrowings on this line of credit.
| | Amount ($) |
| Fidelity International Discovery Fund | 14 |
7. Security Lending.
Funds lend portfolio securities from time to time in order to earn additional income. Lending agents are used, including National Financial Services (NFS), an affiliate of the investment adviser. Pursuant to a securities lending agreement, NFS will receive a fee, which is capped at 9.9% of a fund's daily lending revenue, for its services as lending agent. A fund may lend securities to certain qualified borrowers, including NFS. On the settlement date of the loan, a fund receives collateral (in the form of U.S. Treasury obligations, letters of credit and/or cash) against the loaned securities and maintains collateral in an amount not less than 100% of the market value of the loaned securities during the period of the loan. The market value of the loaned securities is determined at the close of business of a fund and any additional required collateral is delivered to a fund on the next business day. A fund or borrower may terminate the loan at any time, and if the borrower defaults on its obligation to return the securities loaned because of insolvency or other reasons, a fund may apply collateral received from the borrower against the obligation. A fund may experience delays and costs in recovering the securities loaned. Any cash collateral received is invested in the Fidelity Securities Lending Cash Central Fund. Any loaned securities are identified as such in the Schedule of Investments, and the value of loaned securities and cash collateral at period end, as applicable, are presented in the Statement of Assets and Liabilities. Security lending income represents the income earned on investing cash collateral, less rebates paid to borrowers and any lending agent fees associated with the loan, plus any premium payments received for lending certain types of securities. Security lending income is presented in the Statement of Operations as a component of income from Fidelity Central Funds. Affiliated security lending activity, if any, was as follows:
| | Total Security Lending Fees Paid to NFS ($) | Security Lending Income From Securities Loaned to NFS ($) | Value of Securities Loaned to NFS at Period End ($) |
| Fidelity International Discovery Fund | 41 | - | - |
8. Expense Reductions.
Through arrangements with the Fund's custodian and each class' transfer agent, credits realized as a result of certain uninvested cash balances were used to reduce the Fund's expenses. During the period, custodian credits reduced the Fund's expenses by $5. During the period, transfer agent credits reduced each class' expenses as noted in the table below.
| | Expense reduction |
Class M | -A |
A In the amount of the less than five hundred dollars.
In addition, during the period the investment adviser or an affiliate reimbursed and/or waived a portion of fund-level operating expenses in the amount of $370.
9. Distributions to Shareholders.
Distributions to shareholders of each class were as follows:
| | Year ended October 31, 2024 | Year ended October 31, 2023 |
| Fidelity International Discovery Fund | | |
| Distributions to shareholders | | |
| Class A | $2,140 | $ - |
| Class M | 233 | - |
| Class C | 37 | - |
| International Discovery | 70,858 | 12,630 |
| Class K | 9,876 | 2,923 |
| Class I | 10,534 | 1,852 |
| Class Z | 64,106 | 13,303 |
Total | $157,784 | $30,708 |
10. Share Transactions.
Share transactions for each class were as follows and may contain in-kind transactions, automatic conversions between classes or exchanges between affiliated funds:
| | Shares | Shares | Dollars | Dollars |
| | Year ended October 31, 2024 | Year ended October 31, 2023 | Year ended October 31, 2024 | Year ended October 31, 2023 |
| Fidelity International Discovery Fund | | | | |
| Class A | | | | |
| Shares sold | 129 | 180 | $6,134 | $7,469 |
| Reinvestment of distributions | 50 | - | 2,114 | - |
| Shares redeemed | (428) | (617) | (20,181) | (25,738) |
| Net increase (decrease) | (249) | (437) | $(11,933) | $(18,269) |
| Class M | | | | |
| Shares sold | 10 | 16 | $514 | $693 |
| Reinvestment of distributions | 6 | - | 231 | - |
| Shares redeemed | (55) | (64) | (2,577) | (2,637) |
| Net increase (decrease) | (39) | (48) | $(1,832) | $(1,944) |
| Class C | | | | |
| Shares sold | 13 | 14 | $580 | $581 |
| Reinvestment of distributions | 1 | - | 37 | - |
| Shares redeemed | (36) | (50) | (1,658) | (2,029) |
| Net increase (decrease) | (22) | (36) | $(1,041) | $(1,448) |
| International Discovery | | | | |
| Shares sold | 6,202 | 4,512 | $302,448 | $188,209 |
| Reinvestment of distributions | 1,539 | 286 | 65,254 | 11,602 |
| Shares redeemed | (18,763) | (11,328) | (912,041) | (472,160) |
| Net increase (decrease) | (11,022) | (6,530) | $(544,339) | $(272,349) |
| Class K | | | | |
| Shares sold | 3,777 | 1,401 | $182,665 | $58,356 |
| Reinvestment of distributions | 234 | 72 | 9,876 | 2,923 |
| Shares redeemed | (3,189) | (5,700) | (146,660) | (236,604) |
| Net increase (decrease) | 822 | (4,227) | $45,881 | $(175,325) |
| Class I | | | | |
| Shares sold | 5,546 | 2,991 | $270,048 | $122,437 |
| Reinvestment of distributions | 48 | 9 | 2,029 | 373 |
| Shares redeemed | (2,674) | (4,177) | (125,180) | (170,989) |
| Net increase (decrease) | 2,920 | (1,177) | $146,897 | $(48,179) |
| Class Z | | | | |
| Shares sold | 22,189 | 576 | $1,054,487 | $24,069 |
| Reinvestment of distributions | 1,513 | 329 | 63,826 | 13,272 |
| Shares redeemed | (434) | (6,831) | (20,852) | (276,681) |
| Net increase (decrease) | 23,268 | (5,926) | $1,097,461 | $(239,340) |
11. Other.
A fund's organizational documents provide former and current trustees and officers with a limited indemnification against liabilities arising in connection with the performance of their duties to the fund. In the normal course of business, a fund may also enter into contracts that provide general indemnifications. A fund's maximum exposure under these arrangements is unknown as this would be dependent on future claims that may be made against a fund. The risk of material loss from such claims is considered remote.
At the end of the period, the following mutual funds managed by the investment adviser or its affiliates were the owners of record of 10% or more of the total outstanding shares.
| | Strategic Advisers Fidelity International Fund |
| Fidelity International Discovery Fund | 35% |
Mutual funds managed by the investment adviser or its affiliates, in aggregate, were the owners of record of more than 20% of the total outstanding shares.
| Fund | % of shares held |
| Fidelity International Discovery Fund | 47% |
12. Risk and Uncertainties.
Many factors affect a fund's performance. Developments that disrupt global economies and financial markets, such as pandemics, epidemics, outbreaks of infectious diseases, war, terrorism, and environmental disasters, may significantly affect a fund's investment performance. The effects of these developments to a fund will be impacted by the types of securities in which a fund invests, the financial condition, industry, economic sector, and geographic location of an issuer, and a fund's level of investment in the securities of that issuer. Significant concentrations in security types, issuers, industries, sectors, and geographic locations may magnify the factors that affect a fund's performance.
Report of Independent Registered Public Accounting Firm
To the Board of Trustees of Fidelity Investment Trust and Shareholders of Fidelity International Discovery Fund
Opinion on the Financial Statements
We have audited the accompanying statement of assets and liabilities, including the schedule of investments, of Fidelity International Discovery Fund (one of the funds constituting Fidelity Investment Trust, referred to hereafter as the "Fund") as of October 31, 2024, the related statement of operations for the year ended October 31, 2024, the statement of changes in net assets for each of the two years in the period ended October 31, 2024, including the related notes, and the financial highlights for each of the five years in the period ended October 31, 2024 (collectively referred to as the "financial statements"). In our opinion, the financial statements present fairly, in all material respects, the financial position of the Fund as of October 31, 2024, the results of its operations for the year then ended, the changes in its net assets for each of the two years in the period ended October 31, 2024 and the financial highlights for each of the five years in the period ended October 31, 2024 in conformity with accounting principles generally accepted in the United States of America.
Basis for Opinion
These financial statements are the responsibility of the Fund's management. Our responsibility is to express an opinion on the Fund's financial statements based on our audits. We are a public accounting firm registered with the Public Company Accounting Oversight Board (United States) (PCAOB) and are required to be independent with respect to the Fund in accordance with the U.S. federal securities laws and the applicable rules and regulations of the Securities and Exchange Commission and the PCAOB.
We conducted our audits of these financial statements in accordance with the standards of the PCAOB. Those standards require that we plan and perform the audit to obtain reasonable assurance about whether the financial statements are free of material misstatement, whether due to error or fraud.
Our audits included performing procedures to assess the risks of material misstatement of the financial statements, whether due to error or fraud, and performing procedures that respond to those risks. Such procedures included examining, on a test basis, evidence regarding the amounts and disclosures in the financial statements. Our audits also included evaluating the accounting principles used and significant estimates made by management, as well as evaluating the overall presentation of the financial statements. Our procedures included confirmation of securities owned as of October 31, 2024 by correspondence with the custodian, issuers of privately offered securities and brokers; when replies were not received from brokers, we performed other auditing procedures. We believe that our audits provide a reasonable basis for our opinion.
/s/ PricewaterhouseCoopers LLP
Boston, Massachusetts
December 16, 2024
We have served as the auditor of one or more investment companies in the Fidelity group of funds since 1932.
Distributions
(Unaudited)The dividend and capital gains distributions for the fund(s) are available on Fidelity.com or Institutional.Fidelity.com.
The fund designates $7,563,235 of distributions paid during the fiscal year ended 2024 as qualifying to be taxed as section 163(j) interest dividends.
Class A designates 100%; Class M designates 100%; Class C designates 100%; International Discovery designates 84.88%; Class K designates 80.92%; Class I designates 85.43%; and Class Z designates 80.59% of dividends distributed respectively during the fiscal year as amounts which may be taken into account as a dividend for purposes of the maximum rate under section 1(h)(11) of the Internal Revenue Code.
The amounts per share which represent income derived from sources within, and taxes paid to, foreign countries or possessions of the United States are as follows:
| | Pay Date | Income | Taxes |
| Fidelity International Discovery Fund | | | |
| Class A | 12/11/23 | $0.7247 | $0.0746 |
| Class M | 12/11/23 | $0.6305 | $0.0746 |
| Class C | 12/11/23 | $0.3782 | $0.0746 |
| International Discovery | 12/11/23 | $0.8678 | $0.0746 |
| Class K | 12/11/23 | $0.9102 | $0.0746 |
| Class I | 12/11/23 | $0.8621 | $0.0746 |
| Class Z | 12/11/23 | $0.9139 | $0.0746 |
The fund will notify shareholders in January 2025 of amounts for use in preparing 2024 income tax returns.
Item 8: Changes in and Disagreements with Accountants for Open-End Management Investment Companies
(Unaudited)
Note: This is not applicable for any fund included in this document.
Item 9: Proxy Disclosures for Open-End Management Investment Companies
(Unaudited)
| A special meeting of shareholders was held on July 16, 2024. The results of votes taken among shareholders on the proposal before them are reported below. Each vote reported represents one dollar of net asset value held on the record date for the meeting. |
| Proposal 1 |
| To elect a Board of Trustees. |
| | # of Votes | % of Votes |
| Bettina Doulton |
| Affirmative | 128,529,177,643.56 | 98.18 |
| Withheld | 2,378,037,364.30 | 1.82 |
| TOTAL | 130,907,215,007.85 | 100.00 |
| Robert A. Lawrence |
| Affirmative | 128,253,389,899.05 | 97.97 |
| Withheld | 2,653,825,108.81 | 2.03 |
| TOTAL | 130,907,215,007.85 | 100.00 |
| Vijay C. Advani |
| Affirmative | 128,531,418,228.19 | 98.19 |
| Withheld | 2,375,796,779.66 | 1.81 |
| TOTAL | 130,907,215,007.85 | 100.00 |
| Thomas P. Bostick |
| Affirmative | 128,495,261,591.41 | 98.16 |
| Withheld | 2,411,953,416.44 | 1.84 |
| TOTAL | 130,907,215,007.85 | 100.00 |
| Donald F. Donahue |
| Affirmative | 128,407,878,996.00 | 98.09 |
| Withheld | 2,499,336,011.85 | 1.91 |
| TOTAL | 130,907,215,007.85 | 100.00 |
| Vicki L. Fuller |
| Affirmative | 128,625,540,095.19 | 98.26 |
| Withheld | 2,281,674,912.66 | 1.74 |
| TOTAL | 130,907,215,007.85 | 100.00 |
| Patricia L. Kampling |
| Affirmative | 128,668,729,281.34 | 98.29 |
| Withheld | 2,238,485,726.51 | 1.71 |
| TOTAL | 130,907,215,007.85 | 100.00 |
| Thomas A. Kennedy |
| Affirmative | 128,499,824,239.79 | 98.16 |
| Withheld | 2,407,390,768.06 | 1.84 |
| TOTAL | 130,907,215,007.85 | 100.00 |
| Oscar Munoz |
| Affirmative | 128,386,109,391.05 | 98.07 |
| Withheld | 2,521,105,616.80 | 1.93 |
| TOTAL | 130,907,215,007.85 | 100.00 |
| Karen B. Peetz |
| Affirmative | 128,603,731,113.82 | 98.24 |
| Withheld | 2,303,483,894.03 | 1.76 |
| TOTAL | 130,907,215,007.85 | 100.00 |
| David M. Thomas |
| Affirmative | 128,384,899,342.98 | 98.07 |
| Withheld | 2,522,315,664.88 | 1.93 |
| TOTAL | 130,907,215,007.85 | 100.00 |
| Susan Tomasky |
| Affirmative | 128,556,148,461.60 | 98.20 |
| Withheld | 2,351,066,546.25 | 1.80 |
| TOTAL | 130,907,215,007.85 | 100.00 |
| Michael E. Wiley |
| Affirmative | 128,264,934,978.34 | 97.98 |
| Withheld | 2,642,280,029.51 | 2.02 |
| TOTAL | 130,907,215,007.85 | 100.00 |
| | | |
| Proposal 1 reflects trust-wide proposal and voting results. |
Item 10: Remuneration Paid to Directors, Officers, and others of Open-End Management Investment Companies
(Unaudited)
Note: This information is disclosed as part of the financial statements for each Fund as part of Item 7: Financial Statements and Financial Highlights for Open-End Management Investment companies.
Item 11: Statement Regarding Basis for Approval of Investment Advisory Contract
(Unaudited)
Board Approval of Investment Advisory Contracts and Management Fees
Fidelity International Discovery Fund
Each year, the Board of Trustees, including the Independent Trustees (together, the Board), considers the renewal of the fund's management contract with Fidelity Management & Research Company LLC (FMR) and certain affiliates and the sub-advisory agreements (together, the Advisory Contracts) for the fund. FMR and the sub-advisers are referred to herein as the Investment Advisers. The Board, assisted by the advice of fund counsel and Independent Trustees' counsel, requests and considers a broad range of information relevant to the renewal of the Advisory Contracts throughout the year.
The Board meets regularly and, at each of its meetings, covers an extensive agenda of topics and materials and considers factors that are relevant to its annual consideration of the renewal of the fund's Advisory Contracts, including the services and support provided to the fund and its shareholders. The Board, acting directly and through its Committees (each of which is composed of and chaired by Independent Trustees), requests and receives information concerning the annual consideration of the renewal of the fund's Advisory Contracts. The Board also meets as needed to review matters specifically related to the Board's annual consideration of the renewal of the Advisory Contracts. Members of the Board may also meet with trustees of other Fidelity funds through joint ad hoc committees to discuss certain matters relevant to all of the Fidelity funds.
At its May 2024 meeting, the Board unanimously determined to renew the fund's Advisory Contracts. In reaching its determination, the Board considered all factors it believed relevant, including (i) the nature, extent, and quality of the services provided to the fund and its shareholders (including the investment performance of the fund); (ii) the competitiveness relative to peer funds of the fund's management fee and the total expense ratio of a representative class (the retail class, which was selected because it was the largest class without 12b-1 fees); (iii) the total costs of the services provided by and the profits realized by FMR and its affiliates (Fidelity) from its relationships with the fund; and (iv) the extent to which, if any, economies of scale exist and are realized as the fund grows, and whether any economies of scale are appropriately shared with fund shareholders. The Board also considered the broad range of investment choices available to shareholders from FMR's competitors and that the fund's shareholders have chosen to invest in the fund, which is part of the Fidelity family of funds. The Board's decision to renew the Advisory Contracts was not based on any single factor.
The Board reached a determination, with the assistance of fund counsel and Independent Trustees' counsel and through the exercise of its business judgment, that the renewal of the Advisory Contracts was in the best interests of the fund and its shareholders and that the compensation payable under the Advisory Contracts was fair and reasonable in light of all of the surrounding circumstances.
Nature, Extent, and Quality of Services Provided. The Board considered staffing as it relates to the fund, including the backgrounds and experience of investment personnel of the Investment Advisers, and also considered the Investment Advisers' implementation of the fund's investment program. The Independent Trustees also had discussions with senior management of Fidelity's investment operations and investment groups. The Board considered the structure of the investment personnel compensation program and whether this structure provides appropriate incentives to act in the best interests of the fund. Additionally, the Board considered the portfolio managers' investments, if any, in the funds that they manage.
Resources Dedicated to Investment Management and Support Services. The Board and the Fund Oversight and Research Committees reviewed the general qualifications and capabilities of Fidelity's investment staff, including its size, education, experience, and resources, as well as Fidelity's approach to recruiting, training, managing, and compensating investment personnel. The Board noted the resources devoted to expansion of Fidelity's global investment organization, and that Fidelity's analysts have extensive resources, tools, and capabilities that allow them to conduct sophisticated quantitative and fundamental analysis, as well as credit analysis of issuers, counterparties, and guarantors. Further, the Board considered that Fidelity's investment professionals have sufficient access to global information and data so as to provide competitive investment results over time, and that those professionals also have access to sophisticated tools that permit them to assess portfolio construction and risk and performance attribution characteristics continuously, as well as to transmit new information and research conclusions rapidly around the world. Additionally, in its deliberations, the Board considered Fidelity's trading, risk management, compliance, and technology and operations capabilities and resources, which are integral parts of the investment management process.
Shareholder and Administrative Services. The Board considered (i) the nature, extent, quality, and cost of advisory, administrative, shareholder, transfer agency, and pricing and bookkeeping services performed by the Investment Advisers and their affiliates under the Advisory Contracts; (ii) the nature and extent of Fidelity's supervision of third party service providers, principally custodians, subcustodians, and pricing vendors; and (iii) the resources devoted by Fidelity to, and the record of compliance with, the fund's compliance policies and procedures. The Board also reviewed the allocation of fund brokerage, including allocations to brokers affiliated with the Investment Advisers, the use of brokerage commissions to pay fund expenses, and the use of "soft" commission dollars to pay for research services. The Board also considered the fund's securities lending activities and any payments made to Fidelity relating to securities lending under a separate agreement.
The Board noted that the growth of fund assets over time across the complex allows Fidelity to reinvest in the development of services designed to enhance the value and convenience of the Fidelity funds as investment vehicles. These services include 24-hour access to account information and market information over the Internet and through telephone representatives, investor education materials, and asset allocation tools. The Board also considered that it reviews customer service metrics such as telephone response times, continuity of services on the website and metrics addressing services at Fidelity Investor Centers.
Investment in a Large Fund Family. The Board considered the benefits to shareholders of investing in a fund that is part of a large family of funds offering a variety of investment disciplines and providing a large variety of fund investor services. The Board noted that Fidelity had taken, or had made recommendations that resulted in the Fidelity funds taking, a number of actions over the previous year that benefited particular funds and/or the Fidelity funds in general.
Investment Performance. The Board took into account discussions that occur with representatives of the Investment Advisers, and reports that it receives, at Board meetings throughout the year, relating to fund investment performance. In this regard the Board noted that as part of regularly scheduled fund reviews and other reports to the Board on fund performance, the Board considered annualized return information for the fund for different time periods, measured against an appropriate securities market index (benchmark index) and an appropriate peer group of funds with similar objectives (peer group). The Board also considered information about performance attribution. In its ongoing evaluation of fund investment performance, the Board gives particular attention to information indicating changes in performance of the funds over different time periods and discussed with the Investment Advisers the reasons for any overperformance or underperformance.
In addition to reviewing absolute and relative fund performance, the Independent Trustees periodically consider the appropriateness of fund performance metrics in evaluating the results achieved. The Independent Trustees generally give greater weight to fund performance over longer time periods than over shorter time periods. Depending on the circumstances, the Independent Trustees may be satisfied with a fund's performance notwithstanding that it lags its benchmark index or peer group for certain periods.
Based on its review, the Board concluded that the nature, extent, and quality of services provided to the fund under the Advisory Contracts should continue to benefit the shareholders of the fund.
Competitiveness of Management Fee and Total Expense Ratio. The Board was provided with information regarding industry trends in management fees and expenses. The Board considered that, effective March 1, 2024, an amended Advisory Contract with FMR went into effect with class-level management fees based on tiered schedules and subject to a maximum class-level rate (the management fee). The Board also considered that in exchange for the variable management fee, each class of the fund receives investment advisory, management, administrative, transfer agent, and pricing and bookkeeping services. In its review of the management fee and total expense ratio of the retail class, the Board considered a pro forma management fee rate for the retail class as if it had been in effect for the 12-month period ended September 30, 2023, as well as other third-party fund expenses, as applicable, such as custodial, legal, and audit fees and any fund-paid 12b-1 fees. The Board noted that Fidelity may agree to waive fees or reimburse expenses from time to time, and the extent to which, if any, it has done so for the fund. The Board also considered information about the impact of the fund's performance adjustment.
Comparisons of Management Fees and Total Expense Ratios. Among other things, the Board reviewed data for selected groups of competitive funds and classes (referred to as "mapped groups") that were compiled by Fidelity based on combining similar investment objective categories (as classified by Morningstar) that have comparable investment mandates. The data reviewed by the Board included (i) gross management fee comparisons (before taking into account expense reimbursements or caps and without taking into account the fund's performance adjustment) relative to the total universe of funds within the mapped group; (ii) gross management fee comparisons relative to a subset of non-Fidelity funds in the mapped group that are similar in size and management fee structure to the fund (referred to as the "asset size peer group"); (iii) total expense comparisons of the retail class of the fund relative to funds and classes in the mapped group that have a similar sales load structure to the retail class of the fund (referred to as the "similar sales load structure group"); and (iv) total expense comparisons of the retail class of the fund relative to funds and classes in the similar sales load structure group that are similar in size and management fee structure to the fund (referred to as the "total expense asset size peer group"). The total expense asset size peer group comparison excludes performance adjustments and fund-paid 12b-1 fees to eliminate variability in fee structures.
The information provided to the Board indicated that the fund's management fee rate ranked below the competitive median of the mapped group for the 12-month period ended September 30, 2023 and above the competitive median of the asset size peer group for the 12-month period ended September 30, 2023. Further, the information provided to the Board indicated that the total expense ratio of the retail class of the fund ranked below the competitive median of the similar sales load structure group for the 12-month period ended September 30, 2023 and above the competitive median of the total expense asset size peer group for the 12-month period ended September 30, 2023. The Board considered that the fund has a variable unified management fee that covers expenses for services beyond portfolio management.
The Board noted that a different variable management fee rate is applicable to each class of the fund. The Board considered that the difference in management fee rates between classes is the result of separate arrangements for class-level services and/or waivers of certain expenses and not the result of any difference in advisory or custodial fees or other expenses related to the management of the fund's assets, which do not vary by class.
The Board also considered that the fund's management fee is subject to upward or downward adjustment depending upon whether, and to what extent, the fund's investment performance for the performance period (a rolling 36-month period) exceeds, or is exceeded by, a securities index, thus leading to a performance adjustment for the same period. The Board noted that the performance adjustment provides FMR with a strong economic incentive to seek to achieve superior long-term performance for the fund's shareholders and helps to more closely align the interests of FMR and the shareholders of the fund.
In connection with its consideration of the fund's performance adjustment, the Board noted that the performance of the retail class is used for purposes of determining the performance adjustment. The Board noted that to the extent the performance adjustment was based on the performance of a share class with higher total annual operating expenses, the fund would be subject to a smaller positive and larger negative performance adjustment. The Board considered the appropriateness of the use of the retail class as the basis for the performance adjustment. The Board noted that the retail class is typically the largest class (reflecting the actual investment experience for the plurality of shareholders), employs a standard expense structure, and does not include fund-paid 12b-1 fees, which Fidelity believes makes it a more appropriate measurement of Fidelity's investment skill.
Fees Charged to Other Fidelity Clients. The Board also considered Fidelity fee structures and other information with respect to clients of Fidelity, such as other funds advised or subadvised by Fidelity, pension plan clients, and other institutional clients with similar mandates. The Board noted that a joint ad hoc committee created by it and the boards of other Fidelity funds periodically reviews and compares Fidelity's institutional investment advisory business with its business of providing services to the Fidelity funds and also noted the most recent findings of the committee. The Board noted that the committee's review included a consideration of the differences in services provided, fees charged, and costs incurred, as well as competition in the markets serving the different categories of clients.
Based on its review, the Board concluded that the fund's management fee, including the use of the retail class as the basis for the performance adjustment, is fair and reasonable in light of the services that the fund receives and the other factors considered. Further, based on its review of total expense ratios and fees charged to other Fidelity clients, the Board concluded that the total expense ratio of each class of the fund was reasonable in light of the services that the fund and its shareholders receive and the other factors considered.
Costs of the Services and Profitability. The Board considered the revenues earned and the expenses incurred by Fidelity in conducting the business of developing, marketing, distributing, managing, administering and servicing the fund and servicing the fund's shareholders. The Board also considered the level of Fidelity's profits in respect of all the Fidelity funds.
On an annual basis, Fidelity presents to the Board information about the profitability of its relationships with the fund. Fidelity calculates profitability information for each fund, as well as aggregate profitability information for groups of Fidelity funds and all Fidelity funds, using a series of detailed revenue and cost allocation methodologies which originate with the books and records of Fidelity on which Fidelity's audited financial statements are based. The Audit Committee of the Board reviews any significant changes from the prior year's methodologies.
A public accounting firm has been engaged annually by the Board as part of the Board's assessment of Fidelity's profitability analysis. The engagement includes the review and assessment of the methodologies used by Fidelity in determining the revenues and expenses attributable to Fidelity's fund business, and completion of agreed-upon procedures in respect of the mathematical accuracy of certain fund profitability information and its conformity to established allocation methodologies. After considering the reports issued under the engagement and information provided by Fidelity, the Board concluded that while other allocation methods may also be reasonable, Fidelity's profitability methodologies are reasonable in all material respects.
The Board also reviewed Fidelity's non-fund businesses and potential indirect benefits such businesses may have received as a result of their association with Fidelity's fund business (i.e., fall-out benefits) as well as cases where Fidelity's affiliates may benefit from the funds' business. The Board considered areas where potential indirect benefits to the Fidelity funds from their relationships with Fidelity may exist. The Board's consideration of these matters was informed by the findings of a joint ad hoc committee created by it and the boards of other Fidelity funds to evaluate potential fall-out benefits.
The Board considered the costs of the services provided by and the profits realized by Fidelity in connection with the operation of the fund and was satisfied that the profitability was not excessive.
Economies of Scale. The Board considered whether there have been economies of scale in respect of the management of the Fidelity funds, whether the Fidelity funds (including the fund) have appropriately benefited from any such economies of scale, and whether there is potential for realization of any further economies of scale. The Board considered the extent to which the fund will benefit from economies of scale as assets grow through increased services to the fund, through waivers or reimbursements, or through fee or expense ratio reductions. The Board also noted that a committee created by it and the boards of other Fidelity funds periodically analyzes whether Fidelity attains economies of scale in respect of the management and servicing of the Fidelity funds, whether the Fidelity funds have appropriately benefited from such economies of scale, and whether there is potential for realization of any further economies of scale.
The Board recognized that the fund's management contract incorporates a variable management fee structure, which provides breakpoints as a way to share, in part, any potential economies of scale that may exist at the asset class level and through a discount that considers both fund size and total assets of the four applicable asset classes. The Board considered that the variable management fee is designed to deliver the benefits of economies of scale to fund shareholders even if assets of any particular fund are unchanged or have declined, because some portion of Fidelity's costs are attributable to services provided to all funds subject to the variable management fee, and all such funds benefit if those costs can be allocated among more assets. The Board concluded that, given the variable management fee structure, fund shareholders will benefit from lower management fees due to the application of the breakpoints and discount factor, regardless of whether Fidelity achieves any such economies of scale.
The Board concluded, taking into account the analysis of the committee, that economies of scale, if any, are being appropriately shared between fund shareholders and Fidelity.
Additional Information Requested by the Board. In order to develop fully the factual basis for consideration of the Fidelity funds' advisory contracts, the Board requested and received additional information on certain topics, including but not limited to: (i) fund flow and performance trends, in particular the underperformance of certain funds and strategies, and Fidelity's long-term strategies for certain funds; (ii) the operation of performance fees and the rationale for implementing performance fees on certain categories of funds but not others; (iii) Fidelity's pricing philosophy compared to competitors; (iv) fund profitability methodology and data; (v) evaluation of competitive fund data and peer group classifications and fee and expense comparisons; (vi) the management fee and expense structures for different funds and classes and information about the differences between various fee and expense structures; (vii) the variable management fee implemented for certain funds effective March 1, 2024; and (viii) information regarding other accounts managed by Fidelity and the funds' sub-advisory arrangements.
Conclusion. Based on its evaluation of all of the conclusions noted above, and after considering all factors it believed relevant, the Board, including the Independent Trustees, concluded that the advisory and sub-advisory fee arrangements are fair and reasonable in light of all of the surrounding circumstances and that the fund's Advisory Contracts should be renewed through May 31, 2025.
1.807258.120
IGI-ANN-1224
Fidelity's Broadly Diversified International Equity Funds
Fidelity® Diversified International Fund
Fidelity® International Capital Appreciation Fund
Fidelity® Overseas Fund
Fidelity® Worldwide Fund
Annual Report
October 31, 2024
Includes Fidelity and Fidelity Advisor share classes
Contents
To view a fund's proxy voting guidelines and proxy voting record for the 12-month period ended June 30, visit http://www.fidelity.com/proxyvotingresults or visit the Securities and Exchange Commission's (SEC) web site at http://www.sec.gov.
You may also call 1-800-544-8544 if you're an individual investing directly with Fidelity, call 1-800-835-5092 if you're a plan sponsor or participant with Fidelity as your recordkeeper or call 1-877-208-0098 on institutional accounts or if you're an advisor or invest through one to request a free copy of the proxy voting guidelines.
Standard & Poor's, S&P and S&P 500 are registered service marks of The McGraw-Hill Companies, Inc. and have been licensed for use by Fidelity Distributors Corporation.
Other third-party marks appearing herein are the property of their respective owners.
All other marks appearing herein are registered or unregistered trademarks or service marks of FMR LLC or an affiliated company. © 2024 FMR LLC. All rights reserved.
This report and the financial statements contained herein are submitted for the general information of the shareholders of the Funds. This report is not authorized for distribution to prospective investors in the Funds unless preceded or accompanied by an effective prospectus.
A fund files its complete schedule of portfolio holdings with the SEC for the first and third quarters of each fiscal year on Form N-PORT. Forms N-PORT are available on the SEC's web site at http://www.sec.gov. A fund's Forms N-PORT may be reviewed and copied at the SEC's Public Reference Room in Washington, DC. Information regarding the operation of the SEC's Public Reference Room may be obtained by calling 1-800-SEC-0330.
For a complete list of a fund's portfolio holdings, view the most recent holdings listing, semiannual report, or annual report on Fidelity's web site at http://www.fidelity.com, http://www.institutional.fidelity.com, or http://www.401k.com, as applicable.
NOT FDIC INSURED •MAY LOSE VALUE •NO BANK GUARANTEE
Neither the Funds nor Fidelity Distributors Corporation is a bank.
Item 7: Financial Statements and Financial Highlights for Open-End Management Investment Companies (Annual Report)
Fidelity® Diversified International Fund
Schedule of Investments October 31, 2024
Showing Percentage of Net Assets
| Common Stocks - 95.0% |
| | | Shares | Value ($) |
| Australia - 1.0% | | | |
| Aristocrat Leisure Ltd. | | 1,860,041 | 74,847,405 |
| CAR Group Ltd. | | 701,147 | 17,269,975 |
| Steadfast Group Ltd. | | 3,990,884 | 14,373,003 |
TOTAL AUSTRALIA | | | 106,490,383 |
| Belgium - 0.8% | | | |
| UCB SA | | 464,733 | 89,374,755 |
| Canada - 6.4% | | | |
| Alimentation Couche-Tard, Inc. (multi-vtg.) | | 1,908,259 | 99,514,264 |
| Cameco Corp. | | 1,113,180 | 58,171,420 |
| Canadian Natural Resources Ltd. | | 3,172,113 | 107,874,852 |
| Constellation Software, Inc. | | 38,320 | 115,565,205 |
| Constellation Software, Inc. warrants 3/31/40 (a)(b) | | 50,399 | 4 |
| Franco-Nevada Corp. | | 544,483 | 72,274,463 |
| Imperial Oil Ltd. | | 1,141,989 | 85,217,551 |
| Ivanhoe Mines Ltd. (a) | | 5,641,744 | 74,596,550 |
| Lumine Group, Inc. (a) | | 150,931 | 3,514,334 |
| MEG Energy Corp. | | 1,409,278 | 25,759,418 |
| South Bow Corp. | | 514,800 | 12,855,673 |
| Thomson Reuters Corp. | | 311,421 | 50,975,660 |
TOTAL CANADA | | | 706,319,394 |
| China - 0.8% | | | |
| Chervon Holdings Ltd. | | 2,050,209 | 5,399,058 |
| NXP Semiconductors NV | | 338,891 | 79,469,940 |
TOTAL CHINA | | | 84,868,998 |
| Denmark - 3.4% | | | |
| DSV A/S | | 494,022 | 107,373,379 |
| Novo Nordisk A/S Series B | | 2,416,386 | 271,033,965 |
TOTAL DENMARK | | | 378,407,344 |
| France - 8.0% | | | |
| Air Liquide SA | | 742,818 | 133,188,310 |
| Alten SA | | 67,260 | 5,684,692 |
| AXA SA | | 2,283,819 | 85,755,417 |
| Capgemini SA | | 613,117 | 106,364,057 |
| Danone SA | | 323,930 | 23,141,089 |
| EssilorLuxottica SA | | 408,011 | 95,597,528 |
| Legrand SA | | 712,437 | 80,411,656 |
| LVMH Moet Hennessy Louis Vuitton SE | | 248,979 | 165,750,437 |
| Pernod Ricard SA | | 1,893 | 235,253 |
| Safran SA | | 468,339 | 106,015,887 |
| Thales SA | | 516,253 | 83,194,255 |
TOTAL FRANCE | | | 885,338,581 |
| Germany - 8.6% | | | |
| Allianz SE | | 525,358 | 165,385,516 |
| BioNTech SE ADR (a) | | 245,910 | 27,812,421 |
| Deutsche Borse AG | | 497,008 | 115,444,174 |
| Fresenius SE & Co. KGaA (a) | | 1,377,964 | 50,242,469 |
| Hannover Reuck SE | | 291,863 | 76,669,966 |
| HeidelbergCement AG | | 198,000 | 21,795,899 |
| Merck KGaA | | 537,372 | 88,848,012 |
| Muenchener Rueckversicherungs-Gesellschaft AG in Muenchen | | 195,578 | 100,014,729 |
| Rheinmetall AG | | 5,587 | 2,875,759 |
| SAP SE | | 1,111,409 | 259,497,441 |
| Siemens AG | | 173,745 | 33,802,066 |
TOTAL GERMANY | | | 942,388,452 |
| Hong Kong - 0.8% | | | |
| AIA Group Ltd. | | 11,165,439 | 88,121,202 |
| India - 2.2% | | | |
| Axis Bank Ltd. | | 2,819,600 | 38,732,263 |
| Fairfax India Holdings Corp. (a)(c) | | 1,331,788 | 19,510,694 |
| HDFC Bank Ltd. | | 5,598,004 | 115,062,288 |
| Hindustan Aeronautics Ltd. | | 242,300 | 12,192,674 |
| Reliance Industries Ltd. (a) | | 1,927,746 | 30,262,680 |
| Reliance Industries Ltd. | | 1,927,746 | 30,480,657 |
TOTAL INDIA | | | 246,241,256 |
| Indonesia - 0.6% | | | |
| PT Bank Central Asia Tbk | | 94,261,908 | 61,005,983 |
| Ireland - 0.7% | | | |
| Kingspan Group PLC (Ireland) | | 924,239 | 81,080,749 |
| Italy - 2.7% | | | |
| FinecoBank SpA | | 3,540,439 | 56,553,587 |
| Interpump Group SpA | | 238,225 | 10,582,838 |
| Prysmian SpA | | 529,710 | 37,348,769 |
| Ryanair Holdings PLC sponsored ADR | | 657,177 | 29,086,654 |
| UniCredit SpA | | 3,765,770 | 166,594,704 |
TOTAL ITALY | | | 300,166,552 |
| Japan - 16.9% | | | |
| BayCurrent Consulting, Inc. | | 924,512 | 30,045,777 |
| Capcom Co. Ltd. | | 1,488,445 | 29,454,041 |
| Fast Retailing Co. Ltd. | | 243,918 | 77,985,831 |
| Fuji Electric Co. Ltd. | | 1,145,401 | 58,332,876 |
| FUJIFILM Holdings Corp. | | 3,313,384 | 78,819,842 |
| Fujitsu Ltd. | | 2,800,914 | 53,849,927 |
| Hitachi Ltd. | | 12,376,664 | 310,961,952 |
| Hoya Corp. | | 1,039,011 | 139,013,487 |
| IHI Corp. | | 209,769 | 11,167,875 |
| Itochu Corp. | | 2,443,240 | 120,861,782 |
| Kansai Paint Co. Ltd. | | 963,697 | 15,695,395 |
| Keyence Corp. | | 198,046 | 89,400,674 |
| Mitsubishi Electric Corp. | | 3,496,019 | 61,503,823 |
| Mitsubishi Heavy Industries Ltd. | | 11,146,782 | 157,358,584 |
| Mitsui & Co. Ltd. | | 1,666,019 | 33,966,211 |
| ORIX Corp. | | 3,716,613 | 78,308,595 |
| Renesas Electronics Corp. | | 4,041,355 | 54,147,371 |
| Rohto Pharmaceutical Co. Ltd. | | 514,904 | 11,578,834 |
| Shin-Etsu Chemical Co. Ltd. | | 4,456,380 | 163,299,430 |
| Sumitomo Mitsui Financial Group, Inc. | | 3,248,853 | 68,922,927 |
| Suzuki Motor Corp. | | 1,705,883 | 16,928,050 |
| Tokio Marine Holdings, Inc. | | 3,854,951 | 138,840,551 |
| Tokyo Electron Ltd. | | 418,610 | 61,599,741 |
TOTAL JAPAN | | | 1,862,043,576 |
| Luxembourg - 0.5% | | | |
| CVC Capital Partners PLC (c) | | 2,327,065 | 48,828,101 |
| Netherlands - 5.2% | | | |
| ASML Holding NV (depository receipt) | | 446,429 | 300,245,824 |
| BE Semiconductor Industries NV | | 368,114 | 39,216,743 |
| IMCD NV | | 399,201 | 63,419,421 |
| Wolters Kluwer NV | | 1,034,212 | 174,031,947 |
TOTAL NETHERLANDS | | | 576,913,935 |
| Portugal - 0.2% | | | |
| Galp Energia SGPS SA | | 983,288 | 16,760,186 |
| Spain - 2.3% | | | |
| Banco Santander SA (Spain) | | 19,573,710 | 95,640,533 |
| CaixaBank SA (d) | | 14,552,808 | 88,681,369 |
| Industria de Diseno Textil SA (d) | | 1,263,884 | 71,901,508 |
TOTAL SPAIN | | | 256,223,410 |
| Sweden - 2.9% | | | |
| Atlas Copco AB (A Shares) | | 4,742,283 | 78,263,874 |
| Indutrade AB | | 4,011,923 | 108,671,035 |
| Investor AB (B Shares) | | 4,698,645 | 132,939,123 |
| Kry International AB (a)(b)(e) | | 123,307 | 2,584,631 |
TOTAL SWEDEN | | | 322,458,663 |
| Switzerland - 2.2% | | | |
| Compagnie Financiere Richemont SA Series A | | 533,572 | 77,688,348 |
| Galderma Group AG | | 293,816 | 27,494,958 |
| Partners Group Holding AG | | 27,010 | 37,314,493 |
| Sika AG | | 226,913 | 63,195,619 |
| UBS Group AG | | 1,159,324 | 35,630,200 |
TOTAL SWITZERLAND | | | 241,323,618 |
| Taiwan - 2.5% | | | |
| Taiwan Semiconductor Manufacturing Co. Ltd. sponsored ADR | | 1,415,743 | 269,755,671 |
| United Kingdom - 14.2% | | | |
| 3i Group PLC | | 2,056,721 | 84,341,435 |
| Ashtead Group PLC | | 585,686 | 43,711,718 |
| AstraZeneca PLC (United Kingdom) | | 1,412,000 | 200,918,569 |
| B&M European Value Retail SA | | 2,128,837 | 10,639,732 |
| BAE Systems PLC | | 8,684,593 | 139,972,272 |
| Big Yellow Group PLC | | 1,107,597 | 17,252,547 |
| Compass Group PLC | | 4,135,937 | 134,320,446 |
| Diageo PLC | | 1,717,660 | 53,044,396 |
| Flutter Entertainment PLC (a) | | 192,435 | 45,011,745 |
| Games Workshop Group PLC | | 167,038 | 25,760,303 |
| InterContinental Hotel Group PLC | | 868,649 | 95,809,857 |
| Lloyds Banking Group PLC | | 142,154,088 | 97,574,615 |
| London Stock Exchange Group PLC | | 1,267,590 | 171,803,944 |
| RELX PLC (Euronext N.V.) | | 4,182,559 | 193,903,038 |
| Rolls-Royce Holdings PLC (a) | | 16,707,177 | 115,286,183 |
| RS GROUP PLC | | 4,690,454 | 42,034,336 |
| Sage Group PLC | | 3,815,441 | 47,692,739 |
| Starling Bank Ltd. Series D (a)(b)(e) | | 8,636,400 | 35,301,773 |
| Unilever PLC | | 178,599 | 10,894,902 |
TOTAL UNITED KINGDOM | | | 1,565,274,550 |
| United States of America - 12.1% | | | |
| Alcon, Inc. (Switzerland) | | 1,496,556 | 137,914,338 |
| CRH PLC | | 1,323,720 | 126,206,023 |
| Experian PLC | | 1,189,348 | 57,924,252 |
| Ferguson Enterprises, Inc. | | 602,336 | 118,987,706 |
| Holcim AG | | 1,112,121 | 109,570,094 |
| Linde PLC | | 296,789 | 135,380,302 |
| Marsh & McLennan Companies, Inc. | | 454,938 | 99,285,669 |
| Marvell Technology, Inc. | | 1,093,487 | 87,599,244 |
| MasterCard, Inc. Class A | | 169,000 | 84,430,710 |
| Nestle SA (Reg. S) | | 109,806 | 10,375,859 |
| S&P Global, Inc. | | 147,897 | 71,043,803 |
| Schneider Electric SA | | 498,373 | 129,102,906 |
| Shell PLC (London) | | 5,078,647 | 169,562,415 |
TOTAL UNITED STATES OF AMERICA | | | 1,337,383,321 |
| TOTAL COMMON STOCKS (Cost $6,756,791,624) | | | 10,466,768,680 |
| | | | |
| Convertible Preferred Stocks - 0.5% |
| | | Shares | Value ($) |
| Estonia - 0.1% | | | |
| Bolt Technology OU Series E (a)(b)(e) | | 79,275 | 14,550,683 |
| United States of America - 0.4% | | | |
| Wasabi Holdings, Inc. Series C (a)(b)(e) | | 2,976,172 | 40,118,799 |
| TOTAL CONVERTIBLE PREFERRED STOCKS (Cost $52,930,286) | | | 54,669,482 |
| | | | |
| Money Market Funds - 4.7% |
| | | Shares | Value ($) |
| Fidelity Cash Central Fund 4.87% (f) | | 433,699,360 | 433,786,100 |
| Fidelity Securities Lending Cash Central Fund 4.87% (f)(g) | | 81,042,396 | 81,050,500 |
| TOTAL MONEY MARKET FUNDS (Cost $514,835,643) | | | 514,836,600 |
| | | | |
| TOTAL INVESTMENT IN SECURITIES - 100.2% (Cost $7,324,557,553) | 11,036,274,762 |
NET OTHER ASSETS (LIABILITIES) - (0.2)% | (18,112,357) |
| NET ASSETS - 100.0% | 11,018,162,405 |
| | |
Legend
| (c) | Security exempt from registration under Rule 144A of the Securities Act of 1933. These securities may be resold in transactions exempt from registration, normally to qualified institutional buyers. At the end of the period, the value of these securities amounted to $68,338,795 or 0.6% of net assets. |
| (d) | Security or a portion of the security is on loan at period end. |
| (e) | Restricted securities (including private placements) - Investment in securities not registered under the Securities Act of 1933 (excluding 144A issues). At the end of the period, the value of restricted securities (excluding 144A issues) amounted to $92,555,886 or 0.8% of net assets. |
| (f) | Affiliated fund that is generally available only to investment companies and other accounts managed by Fidelity Investments. The rate quoted is the annualized seven-day yield of the fund at period end. A complete unaudited listing of the fund's holdings as of its most recent quarter end is available upon request. In addition, each Fidelity Central Fund's financial statements, which are not covered by the Fund's Report of Independent Registered Public Accounting Firm, are available on the SEC's website or upon request. |
| (g) | Investment made with cash collateral received from securities on loan. |
| Additional information on each restricted holding is as follows: |
| Security | Acquisition Date | Acquisition Cost ($) |
| Bolt Technology OU Series E | 1/03/22 | 20,595,368 |
| | | |
| Kry International AB | 5/14/21 - 10/30/24 | 8,153,901 |
| | | |
| Starling Bank Ltd. Series D | 6/18/21 | 15,440,896 |
| | | |
| Wasabi Holdings, Inc. Series C | 3/31/21 | 32,334,918 |
| | | |
Affiliated Central Funds
Fiscal year to date information regarding the Fund's investments in Fidelity Central Funds, including the ownership percentage, is presented below.
| Affiliate | Value, beginning of period ($) | Purchases ($) | Sales Proceeds ($) | Dividend Income ($) | Realized Gain (loss) ($) | Change in Unrealized appreciation (depreciation) ($) | Value, end of period ($) | % ownership, end of period |
| Fidelity Cash Central Fund 4.87% | 345,681,349 | 2,148,841,980 | 2,060,738,869 | 22,063,798 | 1,640 | - | 433,786,100 | 0.9% |
| Fidelity Securities Lending Cash Central Fund 4.87% | 221,672,979 | 812,840,673 | 953,463,152 | 222,027 | - | - | 81,050,500 | 0.3% |
| Total | 567,354,328 | 2,961,682,653 | 3,014,202,021 | 22,285,825 | 1,640 | - | 514,836,600 | |
| | | | | | | | | |
Amounts in the dividend income column in the above table include any capital gain distributions from underlying funds, which are presented in the corresponding line item in the Statement of Operations, if applicable.
Amounts in the dividend income column for Fidelity Securities Lending Cash Central Fund represents the income earned on investing cash collateral, less rebates paid to borrowers and any lending agent fees associated with the loan, plus any premium payments received for lending certain types of securities.
Amounts included in the purchases and sales proceeds columns may include in-kind transactions, if applicable.
Investment Valuation
The following is a summary of the inputs used, as of October 31, 2024, involving the Fund's assets and liabilities carried at fair value. The inputs or methodology used for valuing securities may not be an indication of the risk associated with investing in those securities. For more information on valuation inputs, and their aggregation into the levels used below, please refer to the Investment Valuation section in the accompanying Notes to Financial Statements.
| Valuation Inputs at Reporting Date: |
| Description | Total ($) | Level 1 ($) | Level 2 ($) | Level 3 ($) |
Investments in Securities: | | | | |
|
| Equities: | | | | |
Communication Services | 46,724,016 | - | 46,724,016 | - |
Consumer Discretionary | 802,042,720 | 153,313,288 | 648,729,432 | - |
Consumer Staples | 208,784,597 | 99,749,517 | 109,035,080 | - |
Energy | 536,944,852 | 306,639,100 | 230,305,752 | - |
Financials | 2,472,111,367 | 843,602,296 | 1,593,207,298 | 35,301,773 |
Health Care | 1,128,250,502 | 517,284,481 | 610,966,021 | - |
Industrials | 2,684,447,914 | 1,205,201,516 | 1,479,246,398 | - |
Information Technology | 1,709,677,562 | 948,744,392 | 703,679,053 | 57,254,117 |
Materials | 915,202,085 | 603,018,950 | 312,183,135 | - |
Real Estate | 17,252,547 | 17,252,547 | - | - |
|
| Money Market Funds | 514,836,600 | 514,836,600 | - | - |
| Total Investments in Securities: | 11,036,274,762 | 5,209,642,687 | 5,734,076,185 | 92,555,890 |
Fidelity® Diversified International Fund
Financial Statements
| Statement of Assets and Liabilities |
As of October 31, 2024 |
| Assets | | | | |
| Investment in securities, at value (including securities loaned of $75,805,145) - See accompanying schedule: | | | | |
Unaffiliated issuers (cost $6,809,721,910) | $ | 10,521,438,162 | | |
Fidelity Central Funds (cost $514,835,643) | | 514,836,600 | | |
| | | | | |
| | | | | |
| Total Investment in Securities (cost $7,324,557,553) | | | $ | 11,036,274,762 |
| Foreign currency held at value (cost $9,100,702) | | | | 9,083,816 |
| Receivable for investments sold | | | | 50,393,888 |
| Receivable for fund shares sold | | | | 2,923,190 |
| Dividends receivable | | | | 18,494,796 |
| Reclaims receivable | | | | 29,790,431 |
| Distributions receivable from Fidelity Central Funds | | | | 2,154,600 |
| Prepaid expenses | | | | 12,951 |
| Other receivables | | | | 2,455,495 |
Total assets | | | | 11,151,583,929 |
| Liabilities | | | | |
| Payable for investments purchased | $ | 31,023,054 | | |
| Payable for fund shares redeemed | | 4,331,014 | | |
| Accrued management fee | | 5,398,664 | | |
| Other payables and accrued expenses | | 11,618,292 | | |
| Collateral on securities loaned | | 81,050,500 | | |
| Total liabilities | | | | 133,421,524 |
| Net Assets | | | $ | 11,018,162,405 |
| Net Assets consist of: | | | | |
| Paid in capital | | | $ | 7,026,200,787 |
| Total accumulated earnings (loss) | | | | 3,991,961,618 |
| Net Assets | | | $ | 11,018,162,405 |
| | | | | |
| Net Asset Value and Maximum Offering Price | | | | |
| Diversified International : | | | | |
Net Asset Value, offering price and redemption price per share ($9,913,805,807 ÷ 220,440,199 shares) | | | $ | 44.97 |
| Class K : | | | | |
Net Asset Value, offering price and redemption price per share ($1,104,356,598 ÷ 24,599,031 shares) | | | $ | 44.89 |
| Statement of Operations |
| Year ended October 31, 2024 |
| Investment Income | | | | |
| Dividends | | | $ | 204,014,058 |
| Interest | | | | 243,557 |
| Income from Fidelity Central Funds (including $222,027 from security lending) | | | | 22,285,825 |
| Income before foreign taxes withheld | | | $ | 226,543,440 |
| Less foreign taxes withheld | | | | (12,795,321) |
| Total income | | | | 213,748,119 |
| Expenses | | | | |
| Management fee | | | | |
| Basic fee | $ | 74,851,613 | | |
| Performance adjustment | | (19,088,628) | | |
| Transfer agent fees | | 4,358,521 | | |
| Accounting fees | | 553,373 | | |
| Custodian fees and expenses | | 746,983 | | |
| Independent trustees' fees and expenses | | 45,634 | | |
| Registration fees | | 106,660 | | |
| Audit fees | | 95,363 | | |
| Legal | | 9,176 | | |
| Miscellaneous | | 168,411 | | |
| Total expenses before reductions | | 61,847,106 | | |
| Expense reductions | | (435,927) | | |
| Total expenses after reductions | | | | 61,411,179 |
| Net Investment income (loss) | | | | 152,336,940 |
| Realized and Unrealized Gain (Loss) | | | | |
| Net realized gain (loss) on: | | | | |
| Investment Securities: | | | | |
| Unaffiliated issuers (net of foreign taxes of $5,770,895) | | 249,563,909 | | |
| Redemptions in-kind | | 43,852,349 | | |
| Fidelity Central Funds | | 1,640 | | |
| Foreign currency transactions | | (1,211,631) | | |
| Total net realized gain (loss) | | | | 292,206,267 |
| Change in net unrealized appreciation (depreciation) on: | | | | |
| Investment Securities: | | | | |
| Unaffiliated issuers (net of decrease in deferred foreign taxes of $2,299,828) | | 1,669,230,076 | | |
| Assets and liabilities in foreign currencies | | 744,245 | | |
| Total change in net unrealized appreciation (depreciation) | | | | 1,669,974,321 |
| Net gain (loss) | | | | 1,962,180,588 |
| Net increase (decrease) in net assets resulting from operations | | | $ | 2,114,517,528 |
| Statement of Changes in Net Assets |
| |
| | Year ended October 31, 2024 | | Year ended October 31, 2023 |
| Increase (Decrease) in Net Assets | | | | |
| Operations | | | | |
| Net investment income (loss) | $ | 152,336,940 | $ | 137,662,353 |
| Net realized gain (loss) | | 292,206,267 | | 414,150,038 |
| Change in net unrealized appreciation (depreciation) | | 1,669,974,321 | | 527,960,774 |
| Net increase (decrease) in net assets resulting from operations | | 2,114,517,528 | | 1,079,773,165 |
| Distributions to shareholders | | (399,892,110) | | (123,021,576) |
| | | | | |
| Share transactions - net increase (decrease) | | 833,287,676 | | (1,113,876,746) |
| | | | | |
| Total increase (decrease) in net assets | | 2,547,913,094 | | (157,125,157) |
| | | | | |
| Net Assets | | | | |
| Beginning of period | | 8,470,249,311 | | 8,627,374,468 |
| End of period | $ | 11,018,162,405 | $ | 8,470,249,311 |
| | | | | |
| | | | | |
Financial Highlights
Fidelity® Diversified International Fund |
| |
| Years ended October 31, | | 2024 | | 2023 | | 2022 | | 2021 | | 2020 |
Selected Per-Share Data | | | | | | | | | | |
| Net asset value, beginning of period | $ | 37.63 | $ | 33.99 | $ | 53.38 | $ | 41.61 | $ | 38.67 |
| Income from Investment Operations | | | | | | | | | | |
Net investment income (loss) A,B | | .63 | | .57 | | .33 | | .16 | | .10 |
| Net realized and unrealized gain (loss) | | 8.47 | | 3.56 | | (14.58) | | 12.07 | | 3.37 |
| Total from investment operations | | 9.10 | | 4.13 | | (14.25) | | 12.23 | | 3.47 |
| Distributions from net investment income | | (.70) | | (.14) | | (.57) | | (.02) | | (.53) |
| Distributions from net realized gain | | (1.06) | | (.35) | | (4.57) | | (.45) | | - |
| Total distributions | | (1.76) | | (.49) | | (5.14) | | (.46) C | | (.53) |
| Net asset value, end of period | $ | 44.97 | $ | 37.63 | $ | 33.99 | $ | 53.38 | $ | 41.61 |
Total Return D | | | | 12.15% | | (29.36)% | | 29.58% | | 9.07% |
Ratios to Average Net Assets B,E,F | | | | | | | | | | |
| Expenses before reductions | | .61% | | .65% | | .99% | | 1.01% | | 1.05% |
| Expenses net of fee waivers, if any | | | | .65% | | .99% | | 1.01% | | 1.05% |
| Expenses net of all reductions | | .60% | | .65% | | .99% | | 1.01% | | 1.04% |
| Net investment income (loss) | | 1.45% | | 1.45% | | .80% | | .32% | | .26% |
| Supplemental Data | | | | | | | | | | |
| Net assets, end of period (000 omitted) | $ | 9,913,806 | $ | 7,407,098 | $ | 7,230,515 | $ | 11,529,722 | $ | 9,419,192 |
Portfolio turnover rate G,H | | | | 22% | | 20% | | 29% | | 29% |
ACalculated based on average shares outstanding during the period.
BNet investment income (loss) is affected by the timing of the declaration of dividends by any underlying mutual funds or exchange-traded funds (ETFs). Net investment income (loss) of any mutual funds or ETFs is not included in the Fund's net investment income (loss) ratio.
CTotal distributions per share do not sum due to rounding.
DTotal returns would have been lower if certain expenses had not been reduced during the applicable periods shown.
EFees and expenses of any underlying mutual funds or exchange-traded funds (ETFs) are not included in the Fund's expense ratio. The Fund indirectly bears its proportionate share of these expenses. For additional expense information related to investments in Fidelity Central Funds, please refer to the "Investments in Fidelity Central Funds" note found in the Notes to Financial Statements section of the most recent Annual or Semi-Annual report.
FExpense ratios reflect operating expenses of the class. Expenses before reductions do not reflect amounts reimbursed, waived, or reduced through arrangements with the investment adviser, brokerage services, or other offset arrangements, if applicable, and do not represent the amount paid by the class during periods when reimbursements, waivers or reductions occur.
GAmount does not include the portfolio activity of any underlying mutual funds or exchange-traded funds (ETFs).
HPortfolio turnover rate excludes securities received or delivered in-kind.
Fidelity® Diversified International Fund Class K |
| |
| Years ended October 31, | | 2024 | | 2023 | | 2022 | | 2021 | | 2020 |
Selected Per-Share Data | | | | | | | | | | |
| Net asset value, beginning of period | $ | 37.57 | $ | 33.94 | $ | 53.32 | $ | 41.56 | $ | 38.61 |
| Income from Investment Operations | | | | | | | | | | |
Net investment income (loss) A,B | | .68 | | .61 | | .38 | | .21 | | .15 |
| Net realized and unrealized gain (loss) | | 8.44 | | 3.56 | | (14.58) | | 12.06 | | 3.37 |
| Total from investment operations | | 9.12 | | 4.17 | | (14.20) | | 12.27 | | 3.52 |
| Distributions from net investment income | | (.75) | | (.19) | | (.62) | | (.06) | | (.57) |
| Distributions from net realized gain | | (1.06) | | (.35) | | (4.57) | | (.45) | | - |
| Total distributions | | (1.80) C | | (.54) | | (5.18) C | | (.51) | | (.57) |
| Net asset value, end of period | $ | 44.89 | $ | 37.57 | $ | 33.94 | $ | 53.32 | $ | 41.56 |
Total Return D | | | | 12.29% | | (29.31)% | | 29.71% | | 9.22% |
Ratios to Average Net Assets B,E,F | | | | | | | | | | |
| Expenses before reductions | | .50% | | .54% | | .88% | | .91% | | .94% |
| Expenses net of fee waivers, if any | | | | .54% | | .88% | | .91% | | .94% |
| Expenses net of all reductions | | .50% | | .54% | | .88% | | .91% | | .93% |
| Net investment income (loss) | | 1.56% | | 1.56% | | .91% | | .42% | | .38% |
| Supplemental Data | | | | | | | | | | |
| Net assets, end of period (000 omitted) | $ | 1,104,357 | $ | 1,063,151 | $ | 1,396,859 | $ | 3,306,774 | $ | 3,761,267 |
Portfolio turnover rate G,H | | | | 22% | | 20% | | 29% | | 29% |
ACalculated based on average shares outstanding during the period.
BNet investment income (loss) is affected by the timing of the declaration of dividends by any underlying mutual funds or exchange-traded funds (ETFs). Net investment income (loss) of any mutual funds or ETFs is not included in the Fund's net investment income (loss) ratio.
CTotal distributions per share do not sum due to rounding.
DTotal returns would have been lower if certain expenses had not been reduced during the applicable periods shown.
EFees and expenses of any underlying mutual funds or exchange-traded funds (ETFs) are not included in the Fund's expense ratio. The Fund indirectly bears its proportionate share of these expenses. For additional expense information related to investments in Fidelity Central Funds, please refer to the "Investments in Fidelity Central Funds" note found in the Notes to Financial Statements section of the most recent Annual or Semi-Annual report.
FExpense ratios reflect operating expenses of the class. Expenses before reductions do not reflect amounts reimbursed, waived, or reduced through arrangements with the investment adviser, brokerage services, or other offset arrangements, if applicable, and do not represent the amount paid by the class during periods when reimbursements, waivers or reductions occur.
GAmount does not include the portfolio activity of any underlying mutual funds or exchange-traded funds (ETFs).
HPortfolio turnover rate excludes securities received or delivered in-kind.
Notes to Financial Statements
For the period ended October 31, 2024
1. Organization.
Fidelity Diversified International Fund (the Fund) is a fund of Fidelity Investment Trust (the Trust) and is authorized to issue an unlimited number of shares. The Trust is registered under the Investment Company Act of 1940, as amended (the 1940 Act), as an open-end management investment company organized as a Massachusetts business trust. The Fund offers Diversified International and Class K shares, each of which has equal rights as to assets and voting privileges. Each class has exclusive voting rights with respect to matters that affect that class.
2. Investments in Fidelity Central Funds.
Funds may invest in Fidelity Central Funds, which are open-end investment companies generally available only to other investment companies and accounts managed by the investment adviser and its affiliates. The Schedule of Investments lists any Fidelity Central Funds held as an investment as of period end, but does not include the underlying holdings of each Fidelity Central Fund. An investing fund indirectly bears its proportionate share of the expenses of the underlying Fidelity Central Funds.
Based on its investment objective, each Fidelity Central Fund may invest or participate in various investment vehicles or strategies that are similar to those of the investing fund. These strategies are consistent with the investment objectives of the investing fund and may involve certain economic risks which may cause a decline in value of each of the Fidelity Central Funds and thus a decline in the value of the investing fund.
| Fidelity Central Fund | Investment Manager | Investment Objective | Investment Practices | Expense RatioA |
| Fidelity Money Market Central Funds | Fidelity Management & Research Company LLC (FMR) | Each fund seeks to obtain a high level of current income consistent with the preservation of capital and liquidity. | Short-term Investments | Less than .005% |
A Expenses expressed as a percentage of average net assets and are as of each underlying Central Fund's most recent annual or semi-annual shareholder report.
A complete unaudited list of holdings for each Fidelity Central Fund is available upon request or at the Securities and Exchange Commission website at www.sec.gov. In addition, the financial statements of the Fidelity Central Funds which contain the significant accounting policies (including investment valuation policies) of those funds, and are not covered by the Report of Independent Registered Public Accounting Firm, are available on the Securities and Exchange Commission website or upon request.
3. Significant Accounting Policies.
The Fund is an investment company and applies the accounting and reporting guidance of the Financial Accounting Standards Board (FASB) Accounting Standards Codification Topic 946 Financial Services - Investment Companies. The financial statements have been prepared in conformity with accounting principles generally accepted in the United States of America (GAAP), which require management to make certain estimates and assumptions at the date of the financial statements. Actual results could differ from those estimates. Subsequent events, if any, through the date that the financial statements were issued have been evaluated in the preparation of the financial statements. The Fund's Schedule of Investments lists any underlying mutual funds or exchange-traded funds (ETFs) but does not include the underlying holdings of these funds. The following summarizes the significant accounting policies of the Fund:
Investment Valuation. Investments are valued as of 4:00 p.m. Eastern time on the last calendar day of the period. The Board of Trustees (the Board) has designated the Fund's investment adviser as the valuation designee responsible for the fair valuation function and performing fair value determinations as needed. The investment adviser has established a Fair Value Committee (the Committee) to carry out the day-to-day fair valuation responsibilities and has adopted policies and procedures to govern the fair valuation process and the activities of the Committee. In accordance with these fair valuation policies and procedures, which have been approved by the Board, the Fund attempts to obtain prices from one or more third party pricing services or brokers to value its investments. When current market prices, quotations or currency exchange rates are not readily available or reliable, investments will be fair valued in good faith by the Committee, in accordance with the policies and procedures. Factors used in determining fair value vary by investment type and may include market or investment specific events, transaction data, estimated cash flows, and market observations of comparable investments. The frequency that the fair valuation procedures are used cannot be predicted and they may be utilized to a significant extent. The Committee manages the Fund's fair valuation practices and maintains the fair valuation policies and procedures. The Fund's investment adviser reports to the Board information regarding the fair valuation process and related material matters.
The Fund categorizes the inputs to valuation techniques used to value its investments into a disclosure hierarchy consisting of three levels as shown below:
Level 1 - unadjusted quoted prices in active markets for identical investments
Level 2 - other significant observable inputs (including quoted prices for similar investments, interest rates, prepayment speeds, etc.)
Level 3 - unobservable inputs (including the Fund's own assumptions based on the best information available)
Valuation techniques used to value the Fund's investments by major category are as follows:
Equity securities, including restricted securities, for which market quotations are readily available, are valued at the last reported sale price or official closing price as reported by a third party pricing service on the primary market or exchange on which they are traded and are categorized as Level 1 in the hierarchy. In the event there were no sales during the day or closing prices are not available, securities are valued at the last quoted bid price or may be valued using the last available price and are generally categorized as Level 2 in the hierarchy. For foreign equity securities, when market or security specific events arise, comparisons to the valuation of American Depositary Receipts (ADRs), futures contracts, Exchange-Traded Funds (ETFs) and certain indexes as well as quoted prices for similar securities may be used and would be categorized as Level 2 in the hierarchy. For equity securities, including restricted securities, where observable inputs are limited, assumptions about market activity and risk are used and these securities may be categorized as Level 3 in the hierarchy.
Investments in open-end mutual funds, including the Fidelity Central Funds, are valued at their closing net asset value (NAV) each business day and are categorized as Level 1 in the hierarchy.
Changes in valuation techniques may result in transfers in or out of an assigned level within the disclosure hierarchy. The aggregate value of investments by input level as of October 31, 2024 is included at the end of the Fund's Schedule of Investments.
Foreign Currency. Foreign-denominated assets, including investment securities, and liabilities are translated into U.S. dollars at the exchange rates at period end. Purchases and sales of investment securities, income and dividends received, and expenses denominated in foreign currencies are translated into U.S. dollars at the exchange rate in effect on the transaction date.
The effects of exchange rate fluctuations on investments are included with the net realized and unrealized gain (loss) on investment securities. Other foreign currency transactions resulting in realized and unrealized gain (loss) are disclosed separately.
Realized gains and losses on foreign currency transactions arise from the disposition of foreign currency, realized changes in the value of foreign currency between the trade and settlement dates on security transactions, and the difference between the amounts of dividends, interest and foreign withholding taxes recorded on transaction date and the U.S. dollar equivalent of the amounts actually received or paid. Unrealized gains and losses on assets and liabilities in foreign currencies arise from changes in the value of foreign currency, and from assets and liabilities denominated in foreign currencies, other than investments, which are held at period end.
Investment Transactions and Income. For financial reporting purposes, the Fund's investment holdings and NAV include trades executed through the end of the last business day of the period. The NAV per share for processing shareholder transactions is calculated as of the close of business of the New York Stock Exchange (NYSE), normally 4:00 p.m. Eastern time and includes trades executed through the end of the prior business day. Gains and losses on securities sold are determined on the basis of identified cost and include proceeds received from litigation. Commissions paid to certain brokers with whom the investment adviser, or its affiliates, places trades on behalf of a fund include an amount in addition to trade execution, which may be rebated back to a fund. Any such rebates are included in net realized gain (loss) on investments in the Statement of Operations. Dividend income is recorded on the ex-dividend date, except for certain dividends from foreign securities where the ex-dividend date may have passed, which are recorded as soon as the Fund is informed of the ex-dividend date. Non-cash dividends included in dividend income, if any, are recorded at the fair market value of the securities received. Income and capital gain distributions from Fidelity Central Funds, if any, are recorded on the ex-dividend date. Interest income is accrued as earned and includes coupon interest and amortization of premium and accretion of discount on debt securities as applicable. Investment income is recorded net of foreign taxes withheld where recovery of such taxes is uncertain. Funds may file withholding tax reclaims in certain jurisdictions to recover a portion of amounts previously withheld. Any withholding tax reclaims income is included in the Statement of Operations in foreign taxes withheld. Any receivables for withholding tax reclaims are included in the Statement of Assets and Liabilities in reclaims receivable. The Fund has filed tax reclaims for previously withheld taxes on dividends earned in certain European Union (EU) countries. These additional filings are subject to various administrative proceedings by the local jurisdictions' tax authorities within the EU, as well as a number of related judicial proceedings. Income recognized for EU reclaims is included with other reclaims in the Statement of Operations in foreign taxes withheld. These reclaims are recorded when the amount is known and there are no significant uncertainties on collectability.
Class Allocations and Expenses. Investment income, realized and unrealized capital gains and losses, common expenses of a fund, and certain fund-level expense reductions, if any, are allocated daily on a pro-rata basis to each class based on the relative net assets of each class to the total net assets of a fund. Each class differs with respect to transfer agent and distribution and service plan fees incurred, as applicable. Certain expense reductions may also differ by class, if applicable. For the reporting period, the allocated portion of income and expenses to each class as a percent of its average net assets may vary due to the timing of recording these transactions in relation to fluctuating net assets of the classes. Expenses directly attributable to a fund are charged to that fund. Expenses attributable to more than one fund are allocated among the respective funds on the basis of relative net assets or other appropriate methods. Expenses included in the accompanying financial statements reflect the expenses of that fund and do not include any expenses associated with any underlying mutual funds or exchange-traded funds (ETFs). Although not included in a fund's expenses, a fund indirectly bears its proportionate share of these expenses through the net asset value of each underlying mutual fund or exchange-traded fund (ETF). Expense estimates are accrued in the period to which they relate and adjustments are made when actual amounts are known.
Deferred Trustee Compensation. Under a Deferred Compensation Plan (the Plan) for certain Funds, certain independent Trustees have elected to defer receipt of a portion of their annual compensation. Deferred amounts are invested in affiliated mutual funds, are marked-to-market and remain in a fund until distributed in accordance with the Plan. The investment of deferred amounts and the offsetting payable to the Trustees presented below are included in the accompanying Statement of Assets and Liabilities in other receivables and other payables and accrued expenses, as applicable.
| Fidelity Diversified International Fund | $1,352,593 |
Income Tax Information and Distributions to Shareholders. Each year, the Fund intends to qualify as a regulated investment company under Subchapter M of the Internal Revenue Code, including distributing substantially all of its taxable income and realized gains. As a result, no provision for U.S. Federal income taxes is required. As of October 31, 2024, the Fund did not have any unrecognized tax benefits in the financial statements; nor is the Fund aware of any tax positions for which it is reasonably possible that the total amounts of unrecognized tax benefits will significantly change in the next twelve months. The Fund files a U.S. federal tax return, in addition to state and local tax returns as required. The Fund's federal income tax returns are subject to examination by the Internal Revenue Service (IRS) for a period of three fiscal years after they are filed. State and local tax returns may be subject to examination for an additional fiscal year depending on the jurisdiction. Foreign taxes are provided for based on the Fund's understanding of the tax rules and rates that exist in the foreign markets in which it invests. The Fund is subject to a tax imposed on capital gains by certain countries in which it invests. An estimated deferred tax liability for net unrealized appreciation on the applicable securities is included in Other payables and accrued expenses on the Statement of Assets and Liabilities.
Distributions are declared and recorded on the ex-dividend date. Income and capital gain distributions are declared separately for each class. Income and capital gain distributions are determined in accordance with income tax regulations, which may differ from GAAP. In addition, the Fund claimed a portion of the payment made to redeeming shareholders as a distribution for income tax purposes.
Capital accounts within the financial statements are adjusted for permanent book-tax differences. These adjustments have no impact on net assets or the results of operations. Capital accounts are not adjusted for temporary book-tax differences which will reverse in a subsequent period.
Book-tax differences are primarily due to foreign currency transactions, certain foreign taxes, passive foreign investment companies (PFIC), redemptions in kind, deferred trustees compensation and losses deferred due to wash sales.
As of period end, the cost and unrealized appreciation (depreciation) in securities, and derivatives if applicable, for federal income tax purposes were as follows:
| Gross unrealized appreciation | $3,756,634,226 |
| Gross unrealized depreciation | (155,198,967) |
| Net unrealized appreciation (depreciation) | $3,601,435,259 |
| Tax Cost | $7,434,839,503 |
The tax-based components of distributable earnings as of period end were as follows:
| Undistributed ordinary income | $203,578,995 |
| Undistributed long-term capital gain | $197,160,046 |
| Net unrealized appreciation (depreciation) on securities and other investments | $3,600,686,509 |
| | |
The tax character of distributions paid was as follows:
| | October 31, 2024 | October 31, 2023 |
| Ordinary Income | $160,121,285 | $ 36,550,051 |
| Long-term Capital Gains | 239,770,825 | 86,471,525 |
| Total | $399,892,110 | $ 123,021,576 |
Restricted Securities (including Private Placements). Funds may invest in securities that are subject to legal or contractual restrictions on resale. These securities generally may be resold in transactions exempt from registration or to the public if the securities are registered. Disposal of these securities may involve time-consuming negotiations and expense, and prompt sale at an acceptable price may be difficult. Information regarding restricted securities held at period end is included at the end of the Schedule of Investments, if applicable.
New Accounting Pronouncement. In November 2023, the FASB issued Accounting Standards Update (ASU) 2023-07 Segment Reporting (Topic 280): Improvements to Reportable Segment Disclosures. Effective for fiscal years beginning after December 15, 2023 and interim periods within fiscal years beginning after December 15, 2024, the amendments enhance required disclosures of segment information for public entities on an annual and interim basis. The ASU allows for early adoption with updates applied retrospectively. Management is currently evaluating the impact of the ASU but does not expect this guidance to materially impact the financial statements.
4. Purchases and Sales of Investments.
Purchases and sales of securities, other than short-term securities and in-kind transactions, as applicable, are noted in the table below.
| | Purchases ($) | Sales ($) |
| Fidelity Diversified International Fund | 3,935,606,475 | 3,452,258,619 |
Unaffiliated Redemptions In-Kind. Shares that were redeemed in-kind for investments, including accrued interest and cash, if any, are shown in the table below. The net realized gain or loss on investments delivered through in-kind redemptions is included in the "Net realized gain (loss) on: Redemptions in-kind" line in the accompanying Statement of Operations. The amount of the in-kind redemptions is included in share transactions in the accompanying Statement of Changes in Net Assets. There was no gain or loss for federal income tax purposes.| | Shares | Total net realized gain or loss ($) | Total Proceeds ($) |
| Fidelity Diversified International Fund | 2,676,493 | 43,852,349 | 110,362,436 |
Unaffiliated Exchanges In-Kind. Shares that were exchanged for investments, including accrued interest and cash, if any, are shown in the table below. The amount of in-kind exchanges is included in share transactions in the accompanying Statement of Changes in Net Assets.
| | Shares | Total Proceeds ($) |
| Fidelity Diversified International Fund | 1,187,445 | 55,311,198 |
Prior Fiscal Year Unaffiliated Redemptions In-Kind. Shares that were redeemed in-kind for investments, including accrued interest and cash, if any, are shown in the table below; along with realized gain or loss on investments delivered through in-kind redemptions. The amount of the in-kind redemptions is included in share transactions in the accompanying Statement of Changes in Net Assets. There was no gain or loss for federal income tax purposes.
| | Shares | Total net realized gain or loss ($) | Total Proceeds ($) |
| Fidelity Diversified International Fund | 9,154,362 | 127,948,104 | 353,583,024 |
5. Fees and Other Transactions with Affiliates.
Management Fee. Fidelity Management & Research Company LLC (the investment adviser) and its affiliates provide the Fund with investment management related services for which the Fund pays a monthly management fee.
Effective March 1, 2024, the Fund's management contract was amended to incorporate administrative services previously covered under separate services agreements (Transfer Agent and Accounting agreements). The amended contract incorporates a basic fee rate that may vary by class (subject to a performance adjustment). The investment adviser or an affiliate pays certain expenses of managing and operating the Fund out of each class's management fee. Each class of the Fund pays a management fee to the investment adviser. The management fee is calculated and paid to the investment adviser every month. The management fee is determined by calculating a basic fee and then applying a performance adjustment. When determining a class's basic fee, a mandate rate is calculated based on the monthly average net assets of a group of funds advised by FMR within a designated asset class. A discount rate is subtracted from the mandate rate once the Fund's monthly average net assets reach a certain level. The mandate rate and discount rate may vary by class. The annual basic fee rate for a class of shares of the Fund is the lesser of (1) the class's mandate rate reduced by the class's discount rate (if applicable) or (2) the amount set forth in the following table.| | Maximum Management Fee Rate % |
| Diversified International | .79 |
| Class K | .68 |
One-twelfth of the basic fee rate for a class is applied to the average net assets of the class for the month, giving a dollar amount which is the basic fee for the class for that month. A different management fee rate may be applicable to each class of the Fund. The difference between classes is the result of separate arrangements for class-level services and/or waivers of certain expenses. It is not the result of any difference in advisory or custodial fees or other expenses related to the management of the Fund's assets, which do not vary by class. For the portion of the reporting period on or after March 1, 2024, the total annualized management fee rates were as follows:
| | Total Management Fee Rate % |
| Diversified International | .76 |
| Class K | .68 |
Prior to March 1, 2024, the management fee was the sum of an individual fund fee rate that was based on an annual rate of .42% of the Fund's average net assets and an annualized group fee rate that averaged .22% during the period. The group fee rate was based upon the monthly average net assets of a group of registered investment companies with which the investment adviser has management contracts. The group fee rate decreased as assets under management increased and increased as assets under management decreased. For the portion of the reporting period prior to March 1, 2024, the total annualized management fee rate was .65%.
The performance adjustment rate is calculated monthly by comparing over the performance period the Fund's performance to that of the performance adjustment index listed below.
| | Performance Adjustment Index |
| Fidelity Diversified International Fund | MSCI EAFE Index |
For the purposes of calculating the performance adjustment for the Fund, the Fund's investment performance is based on the performance of Diversified International. To the extent that other classes of the Fund have higher expenses, this could result in those classes bearing a larger positive performance adjustment and smaller negative performance adjustment than would be the case if each class's own performance were considered. The performance period is the most recent 36 month period. The maximum annualized performance adjustment rate is ± 0.20% of the Fund's average net assets over the performance period. The performance adjustment rate is divided by twelve and multiplied by the Fund's average net assets over the performance period, and the resulting dollar amount is proportionately added to or subtracted from a class's basic fee. For the entire reporting period, the total annual performance adjustment was (.18)%.
Effective March 1, 2024, the Fund's sub-advisory agreements with FMR Investment Management (UK) Limited, Fidelity Management & Research (Hong Kong) Limited, and Fidelity Management & Research (Japan) Limited were amended to provide that the investment adviser pays each sub-adviser monthly fees equal to 110% of the sub-adviser's costs for providing sub-advisory services.
Effective March 1, 2024, the Fund's sub-advisory agreement with FIL Investment Advisors (FIA) was amended to provide that the investment adviser pays FIA monthly fees at an annual rate of 0.44% with respect to the average daily net assets of the Fund managed by FIA. FIA in turn pays FIA(UK).
Transfer Agent Fees. Fidelity Investments Institutional Operations Company LLC (FIIOC), an affiliate of the investment adviser, is the transfer, dividend disbursing and shareholder servicing agent for each class of the Fund. Effective March 1, 2024, the Fund's management contract was amended to incorporate transfer agent services and associated fees previously covered under a separate services agreement. FIIOC pays for typesetting, printing and mailing of shareholder reports, except proxy statements.
During the period December 1, 2023 through February 29, 2024, the transfer agent fees for each class were a fixed annual rate of class-level average net assets as follows:
| | % of Class-Level Average Net Assets |
| Diversified International | .1519 |
| Class K | .0420 |
Prior to December 1, 2023, FIIOC received account fees and asset-based fees that varied according to the account size and type of account of the shareholders of the respective classes of the Fund, except for Class K. FIIOC received an asset-based fee of Class K's average net assets. For the portion of the reporting period prior to March 1, 2024, the fees were equivalent to the following annualized rates:
| | Amount ($) | % of Class-Level Average Net Assets |
| Diversified International | 4,201,848 | .15 |
| Class K | 156,673 | .04 |
| 4,358,521 | |
Accounting Fees. Fidelity Service Company, Inc. (FSC), an affiliate of the investment adviser, maintains the Fund's accounting records. Effective March 1, 2024, the Fund's management contract was amended to incorporate accounting services and associated fees previously covered under a separate services agreement.
During the period December 1, 2023 through February 29, 2024, the accounting fees were a fixed annual rate of average net assets as follows:
| | % of Average Net Assets |
| Fidelity Diversified International Fund | .0173 |
Prior to December 1, 2023, the accounting fee was based on the level of average net assets for each month. For the portion of the reporting period prior to March 1, 2024, the fees were equivalent to the following annualized rates:
| | % of Average Net Assets |
| Fidelity Diversified International Fund | .02 |
Brokerage Commissions. A portion of portfolio transactions were placed with brokerage firms which are affiliates of the investment adviser. Brokerage commissions are included in net realized gain (loss) and change in net unrealized appreciation (depreciation) in the Statement of Operations. The commissions paid to these affiliated firms were as follows:
| | Amount ($) |
| Fidelity Diversified International Fund | 2,161 |
Interfund Trades. Funds may purchase from or sell securities to other Fidelity Funds under procedures adopted by the Board. The procedures have been designed to ensure these interfund trades are executed in accordance with Rule 17a-7 of the 1940 Act. Any interfund trades are included within the respective purchases and sales amounts shown in the Purchases and Sales of Investments note. Interfund trades during the period are noted in the table below.
| | Purchases ($) | Sales ($) | Realized Gain (Loss)($) |
| Fidelity Diversified International Fund | 66,910,083 | 103,505,184 | 1,031,125 |
6. Committed Line of Credit.
Certain Funds participate with other funds managed by the investment adviser or an affiliate in a $4.25 billion credit facility (the "line of credit") to be utilized for temporary or emergency purposes to fund shareholder redemptions or for other short-term liquidity purposes. The participating funds have agreed to pay commitment fees on their pro-rata portion of the line of credit, which are reflected in Miscellaneous expenses on the Statement of Operations, and are listed below. During the period, there were no borrowings on this line of credit.
| | Amount ($) |
| Fidelity Diversified International Fund | 16,247 |
7. Security Lending.
Funds lend portfolio securities from time to time in order to earn additional income. Lending agents are used, including National Financial Services (NFS), an affiliate of the investment adviser. Pursuant to a securities lending agreement, NFS will receive a fee, which is capped at 9.9% of a fund's daily lending revenue, for its services as lending agent. A fund may lend securities to certain qualified borrowers, including NFS. On the settlement date of the loan, a fund receives collateral (in the form of U.S. Treasury obligations, letters of credit and/or cash) against the loaned securities and maintains collateral in an amount not less than 100% of the market value of the loaned securities during the period of the loan. The market value of the loaned securities is determined at the close of business of a fund and any additional required collateral is delivered to a fund on the next business day. A fund or borrower may terminate the loan at any time, and if the borrower defaults on its obligation to return the securities loaned because of insolvency or other reasons, a fund may apply collateral received from the borrower against the obligation. A fund may experience delays and costs in recovering the securities loaned. Any cash collateral received is invested in the Fidelity Securities Lending Cash Central Fund. Any loaned securities are identified as such in the Schedule of Investments, and the value of loaned securities and cash collateral at period end, as applicable, are presented in the Statement of Assets and Liabilities. Security lending income represents the income earned on investing cash collateral, less rebates paid to borrowers and any lending agent fees associated with the loan, plus any premium payments received for lending certain types of securities. Security lending income is presented in the Statement of Operations as a component of income from Fidelity Central Funds. Affiliated security lending activity, if any, was as follows:| | Total Security Lending Fees Paid to NFS ($) | Security Lending Income From Securities Loaned to NFS ($) | Value of Securities Loaned to NFS at Period End ($) |
| Fidelity Diversified International Fund | 24,144 | - | - |
8. Expense Reductions.
Through arrangements with the Fund's custodian, credits realized as a result of certain uninvested cash balances were used to reduce the Fund's expenses. During the period, custodian credits reduced the Fund's expenses by $5,095.
In addition, during the period the investment adviser or an affiliate reimbursed and/or waived a portion of fund-level operating expenses in the amount of $430,832.
9. Distributions to Shareholders.
Distributions to shareholders of each class were as follows:
| | Year ended October 31, 2024 | Year ended October 31, 2023 |
| Fidelity Diversified International Fund | | |
| Distributions to shareholders | | |
| Diversified International | $350,399,026 | $101,421,493 |
| Class K | 49,493,084 | 21,600,083 |
Total | $399,892,110 | $123,021,576 |
10. Share Transactions.
Share transactions for each class were as follows and may contain in-kind transactions, automatic conversions between classes or exchanges between affiliated funds:
| | Shares | Shares | Dollars | Dollars |
| | Year ended October 31, 2024 | Year ended October 31, 2023 | Year ended October 31, 2024 | Year ended October 31, 2023 |
| Fidelity Diversified International Fund | | | | |
| Diversified International | | | | |
| Shares sold | 34,479,828 | 9,925,175 | $1,495,985,575 | $388,397,522 |
| Reinvestment of distributions | 7,644,991 | 2,350,798 | 300,983,288 | 87,708,207 |
| Shares redeemed | (18,521,934) | (28,189,272) | (803,075,098) | (1,089,796,435) |
| Net increase (decrease) | 23,602,885 | (15,913,299) | $993,893,765 | $(613,690,706) |
| Class K | | | | |
| Shares sold | 4,533,810 | 5,103,356 | $196,601,168 | $201,187,282 |
| Reinvestment of distributions | 1,259,505 | 580,051 | 49,460,747 | 21,589,508 |
| Shares redeemed | (9,489,207) | (18,542,037) | (406,668,004) | (722,962,830) |
| Net increase (decrease) | (3,695,892) | (12,858,630) | $(160,606,089) | $(500,186,040) |
11. Other.
A fund's organizational documents provide former and current trustees and officers with a limited indemnification against liabilities arising in connection with the performance of their duties to the fund. In the normal course of business, a fund may also enter into contracts that provide general indemnifications. A fund's maximum exposure under these arrangements is unknown as this would be dependent on future claims that may be made against a fund. The risk of material loss from such claims is considered remote.
At the end of the period, the following mutual funds managed by the investment adviser or its affiliates were the owners of record of 10% or more of the total outstanding shares.
| | Strategic Advisers Fidelity International Fund |
| Fidelity Diversified International Fund | 28% |
Mutual funds managed by the investment adviser or its affiliates, in aggregate, were the owners of record of more than 20% of the total outstanding shares.
| Fund | % of shares held |
| Fidelity Diversified International Fund | 33% |
12. Risk and Uncertainties.
Many factors affect a fund's performance. Developments that disrupt global economies and financial markets, such as pandemics, epidemics, outbreaks of infectious diseases, war, terrorism, and environmental disasters, may significantly affect a fund's investment performance. The effects of these developments to a fund will be impacted by the types of securities in which a fund invests, the financial condition, industry, economic sector, and geographic location of an issuer, and a fund's level of investment in the securities of that issuer. Significant concentrations in security types, issuers, industries, sectors, and geographic locations may magnify the factors that affect a fund's performance.
Fidelity® International Capital Appreciation Fund
Schedule of Investments October 31, 2024
Showing Percentage of Net Assets
| Common Stocks - 99.6% |
| | | Shares | Value ($) |
| Brazil - 1.5% | | | |
| MercadoLibre, Inc. (a) | | 26,701 | 54,394,743 |
| Canada - 6.4% | | | |
| Brookfield Asset Management Ltd. Class A (b) | | 1,178,384 | 62,501,487 |
| Canadian Pacific Kansas City Ltd. | | 732,545 | 56,510,689 |
| Constellation Software, Inc. | | 20,598 | 62,119,313 |
| Constellation Software, Inc. warrants 3/31/40 (a)(c) | | 38,399 | 3 |
| Thomson Reuters Corp. | | 292,921 | 47,947,445 |
TOTAL CANADA | | | 229,078,937 |
| China - 5.3% | | | |
| Meituan Class B (a)(d) | | 2,478,661 | 58,571,684 |
| Tencent Holdings Ltd. | | 1,708,361 | 89,077,583 |
| Trip.com Group Ltd. ADR (a) | | 687,100 | 44,249,240 |
TOTAL CHINA | | | 191,898,507 |
| Denmark - 4.3% | | | |
| DSV A/S | | 231,249 | 50,260,892 |
| Novo Nordisk A/S Series B | | 925,208 | 103,775,966 |
TOTAL DENMARK | | | 154,036,858 |
| France - 8.8% | | | |
| Air Liquide SA | | 324,744 | 58,227,055 |
| Compagnie de St.-Gobain | | 593,967 | 53,863,866 |
| Hermes International SCA | | 27,427 | 61,875,134 |
| LVMH Moet Hennessy Louis Vuitton SE | | 119,389 | 79,479,711 |
| Safran SA | | 275,044 | 62,260,529 |
TOTAL FRANCE | | | 315,706,295 |
| Germany - 3.9% | | | |
| HeidelbergCement AG | | 474,975 | 52,285,390 |
| SAP SE | | 378,978 | 88,485,716 |
TOTAL GERMANY | | | 140,771,106 |
| India - 7.9% | | | |
| Axis Bank Ltd. | | 3,817,692 | 52,442,847 |
| Bharti Airtel Ltd. | | 3,000,009 | 57,420,101 |
| HDFC Bank Ltd. | | 3,037,251 | 62,428,153 |
| ICICI Bank Ltd. | | 4,038,599 | 61,948,653 |
| Larsen & Toubro Ltd. | | 1,189,335 | 51,088,564 |
TOTAL INDIA | | | 285,328,318 |
| Indonesia - 1.5% | | | |
| PT Bank Central Asia Tbk | | 84,319,503 | 54,571,292 |
| Ireland - 1.3% | | | |
| Kingspan Group PLC (Ireland) | | 533,110 | 46,768,161 |
| Italy - 2.8% | | | |
| Ferrari NV (Italy) | | 113,047 | 54,080,831 |
| Prysmian SpA | | 673,371 | 47,478,012 |
TOTAL ITALY | | | 101,558,843 |
| Japan - 12.6% | | | |
| Disco Corp. | | 215,820 | 61,408,301 |
| Hitachi Ltd. | | 2,699,359 | 67,821,017 |
| Hoya Corp. | | 438,915 | 58,724,214 |
| Keyence Corp. | | 138,753 | 62,635,003 |
| Recruit Holdings Co. Ltd. | | 942,265 | 57,537,084 |
| Shin-Etsu Chemical Co. Ltd. | | 1,558,074 | 57,094,008 |
| Tokio Marine Holdings, Inc. | | 1,731,478 | 62,361,197 |
| Tokyo Electron Ltd. | | 169,708 | 24,973,051 |
TOTAL JAPAN | | | 452,553,875 |
| Netherlands - 5.2% | | | |
| ASM International NV (Netherlands) | | 96,054 | 53,516,059 |
| ASML Holding NV (Netherlands) | | 122,555 | 82,811,676 |
| Wolters Kluwer NV | | 296,857 | 49,953,589 |
TOTAL NETHERLANDS | | | 186,281,324 |
| Sweden - 1.5% | | | |
| Atlas Copco AB (A Shares) | | 3,161,145 | 52,169,695 |
| Switzerland - 1.8% | | | |
| ABB Ltd. (Reg.) | | 1,162,577 | 64,605,728 |
| Taiwan - 4.5% | | | |
| Taiwan Semiconductor Manufacturing Co. Ltd. | | 5,143,389 | 161,819,304 |
| United Kingdom - 10.9% | | | |
| 3i Group PLC | | 1,312,808 | 53,835,260 |
| Ashtead Group PLC | | 749,920 | 55,969,054 |
| BAE Systems PLC | | 3,369,331 | 54,304,550 |
| InterContinental Hotel Group PLC | | 509,921 | 56,243,037 |
| London Stock Exchange Group PLC | | 415,026 | 56,250,920 |
| RELX PLC (London Stock Exchange) | | 1,274,658 | 58,455,439 |
| Rolls-Royce Holdings PLC (a) | | 8,450,099 | 58,309,053 |
TOTAL UNITED KINGDOM | | | 393,367,313 |
| United States of America - 19.4% | | | |
| Arthur J. Gallagher & Co. | | 180,133 | 50,653,400 |
| Broadcom, Inc. | | 335,024 | 56,877,024 |
| CRH PLC | | 504,799 | 48,128,512 |
| Experian PLC | | 1,128,344 | 54,953,203 |
| Holcim AG | | 567,030 | 55,865,801 |
| Linde PLC | | 105,536 | 48,140,246 |
| Marsh & McLennan Companies, Inc. | | 229,537 | 50,094,155 |
| MasterCard, Inc. Class A | | 114,167 | 57,036,692 |
| Moody's Corp. | | 103,393 | 46,944,558 |
| S&P Global, Inc. | | 106,548 | 51,181,397 |
| Schneider Electric SA | | 284,856 | 73,791,593 |
| Visa, Inc. Class A | | 202,731 | 58,761,580 |
| Waste Connections, Inc. (Canada) | | 265,434 | 46,921,586 |
TOTAL UNITED STATES OF AMERICA | | | 699,349,747 |
| TOTAL COMMON STOCKS (Cost $2,644,631,821) | | | 3,584,260,046 |
| | | | |
| Money Market Funds - 1.0% |
| | | Shares | Value ($) |
Fidelity Securities Lending Cash Central Fund 4.87% (e)(f) (Cost $35,530,000) | | 35,526,447 | 35,530,000 |
| | | | |
| TOTAL INVESTMENT IN SECURITIES - 100.6% (Cost $2,680,161,821) | 3,619,790,046 |
NET OTHER ASSETS (LIABILITIES) - (0.6)% | (23,291,145) |
| NET ASSETS - 100.0% | 3,596,498,901 |
| | |
Legend
| (b) | Security or a portion of the security is on loan at period end. |
| (d) | Security exempt from registration under Rule 144A of the Securities Act of 1933. These securities may be resold in transactions exempt from registration, normally to qualified institutional buyers. At the end of the period, the value of these securities amounted to $58,571,684 or 1.6% of net assets. |
| (e) | Affiliated fund that is generally available only to investment companies and other accounts managed by Fidelity Investments. The rate quoted is the annualized seven-day yield of the fund at period end. A complete unaudited listing of the fund's holdings as of its most recent quarter end is available upon request. In addition, each Fidelity Central Fund's financial statements, which are not covered by the Fund's Report of Independent Registered Public Accounting Firm, are available on the SEC's website or upon request. |
| (f) | Investment made with cash collateral received from securities on loan. |
Affiliated Central Funds
Fiscal year to date information regarding the Fund's investments in Fidelity Central Funds, including the ownership percentage, is presented below.
| Affiliate | Value, beginning of period ($) | Purchases ($) | Sales Proceeds ($) | Dividend Income ($) | Realized Gain (loss) ($) | Change in Unrealized appreciation (depreciation) ($) | Value, end of period ($) | % ownership, end of period |
| Fidelity Cash Central Fund 4.87% | 69,951,135 | 1,904,197,054 | 1,974,154,978 | 4,054,963 | 6,789 | - | - | 0.0% |
| Fidelity Securities Lending Cash Central Fund 4.87% | 12,706,225 | 750,950,979 | 728,127,204 | 52,387 | - | - | 35,530,000 | 0.1% |
| Total | 82,657,360 | 2,655,148,033 | 2,702,282,182 | 4,107,350 | 6,789 | - | 35,530,000 | |
| | | | | | | | | |
Amounts in the dividend income column in the above table include any capital gain distributions from underlying funds, which are presented in the corresponding line item in the Statement of Operations, if applicable.
Amounts in the dividend income column for Fidelity Securities Lending Cash Central Fund represents the income earned on investing cash collateral, less rebates paid to borrowers and any lending agent fees associated with the loan, plus any premium payments received for lending certain types of securities.
Amounts included in the purchases and sales proceeds columns may include in-kind transactions, if applicable.
Investment Valuation
The following is a summary of the inputs used, as of October 31, 2024, involving the Fund's assets and liabilities carried at fair value. The inputs or methodology used for valuing securities may not be an indication of the risk associated with investing in those securities. For more information on valuation inputs, and their aggregation into the levels used below, please refer to the Investment Valuation section in the accompanying Notes to Financial Statements.
| Valuation Inputs at Reporting Date: |
| Description | Total ($) | Level 1 ($) | Level 2 ($) | Level 3 ($) |
Investments in Securities: | | | | |
|
| Equities: | | | | |
Communication Services | 146,497,684 | - | 146,497,684 | - |
Consumer Discretionary | 408,894,380 | 214,599,948 | 194,294,432 | - |
Financials | 781,011,591 | 377,173,269 | 403,838,322 | - |
Health Care | 162,500,180 | - | 162,500,180 | - |
Industrials | 1,110,969,749 | 456,762,631 | 654,207,118 | - |
Information Technology | 654,645,450 | 255,324,072 | 399,321,375 | 3 |
Materials | 319,741,012 | 204,419,949 | 115,321,063 | - |
|
| Money Market Funds | 35,530,000 | 35,530,000 | - | - |
| Total Investments in Securities: | 3,619,790,046 | 1,543,809,869 | 2,075,980,174 | 3 |
Fidelity® International Capital Appreciation Fund
Financial Statements
| Statement of Assets and Liabilities |
As of October 31, 2024 |
| Assets | | | | |
| Investment in securities, at value (including securities loaned of $34,263,840) - See accompanying schedule: | | | | |
Unaffiliated issuers (cost $2,644,631,821) | $ | 3,584,260,046 | | |
Fidelity Central Funds (cost $35,530,000) | | 35,530,000 | | |
| | | | | |
| | | | | |
| Total Investment in Securities (cost $2,680,161,821) | | | $ | 3,619,790,046 |
| Foreign currency held at value (cost $6,800) | | | | 6,796 |
| Receivable for investments sold | | | | 32,936,673 |
| Receivable for fund shares sold | | | | 4,597,988 |
| Dividends receivable | | | | 5,497,903 |
| Reclaims receivable | | | | 6,937,564 |
| Distributions receivable from Fidelity Central Funds | | | | 201,370 |
| Prepaid expenses | | | | 6,744 |
| Other receivables | | | | 2,015,404 |
Total assets | | | | 3,671,990,488 |
| Liabilities | | | | |
| Payable to custodian bank | $ | 9,932 | | |
| Payable for investments purchased | | 21,845,325 | | |
| Payable for fund shares redeemed | | 2,387,456 | | |
| Accrued management fee | | 3,052,747 | | |
| Other payables and accrued expenses | | 12,666,127 | | |
| Collateral on securities loaned | | 35,530,000 | | |
| Total liabilities | | | | 75,491,587 |
| Net Assets | | | $ | 3,596,498,901 |
| Net Assets consist of: | | | | |
| Paid in capital | | | $ | 2,545,283,747 |
| Total accumulated earnings (loss) | | | | 1,051,215,154 |
| Net Assets | | | $ | 3,596,498,901 |
Net Asset Value, offering price and redemption price per share ($3,596,498,901 ÷ 123,588,857 shares) | | | $ | 29.10 |
| Statement of Operations |
| Year ended October 31, 2024 |
| Investment Income | | | | |
| Dividends | | | $ | 71,819,091 |
| Interest | | | | 23,014 |
| Income from Fidelity Central Funds (including $52,387 from security lending) | | | | 4,107,350 |
| Income before foreign taxes withheld | | | $ | 75,949,455 |
| Less foreign taxes withheld | | | | (6,861,574) |
| Total income | | | | 69,087,881 |
| Expenses | | | | |
| Management fee | | | | |
| Basic fee | $ | 39,602,777 | | |
| Performance adjustment | | 2,539,746 | | |
| Transfer agent fees | | 2,566,421 | | |
| Accounting fees | | 533,496 | | |
| Custodian fees and expenses | | 505,753 | | |
| Independent trustees' fees and expenses | | 23,594 | | |
| Registration fees | | 81,733 | | |
| Audit fees | | 102,215 | | |
| Legal | | 4,902 | | |
| Interest | | 185,915 | | |
| Miscellaneous | | 96,528 | | |
| Total expenses before reductions | | 46,243,080 | | |
| Expense reductions | | (273,706) | | |
| Total expenses after reductions | | | | 45,969,374 |
| Net Investment income (loss) | | | | 23,118,507 |
| Realized and Unrealized Gain (Loss) | | | | |
| Net realized gain (loss) on: | | | | |
| Investment Securities: | | | | |
| Unaffiliated issuers (net of foreign taxes of $12,814,657) | | 467,345,024 | | |
| Redemptions in-kind | | 681,502,360 | | |
| Fidelity Central Funds | | 6,789 | | |
| Foreign currency transactions | | 1,872,017 | | |
| Total net realized gain (loss) | | | | 1,150,726,190 |
| Change in net unrealized appreciation (depreciation) on: | | | | |
| Investment Securities: | | | | |
| Unaffiliated issuers (net of increase in deferred foreign taxes of $4,826,746) | | 148,742,285 | | |
| Assets and liabilities in foreign currencies | | (51,340) | | |
| Total change in net unrealized appreciation (depreciation) | | | | 148,690,945 |
| Net gain (loss) | | | | 1,299,417,135 |
| Net increase (decrease) in net assets resulting from operations | | | $ | 1,322,535,642 |
| Statement of Changes in Net Assets |
| |
| | Year ended October 31, 2024 | | Year ended October 31, 2023 |
| Increase (Decrease) in Net Assets | | | | |
| Operations | | | | |
| Net investment income (loss) | $ | 23,118,507 | $ | 20,593,650 |
| Net realized gain (loss) | | 1,150,726,190 | | 80,207,386 |
| Change in net unrealized appreciation (depreciation) | | 148,690,945 | | 499,536,098 |
| Net increase (decrease) in net assets resulting from operations | | 1,322,535,642 | | 600,337,134 |
| Distributions to shareholders | | (18,874,608) | | (1,939,358) |
| | | | | |
| Share transactions | | | | |
| Proceeds from sales of shares | | 888,745,860 | | 435,752,549 |
| Reinvestment of distributions | | 15,731,033 | | 1,625,726 |
| Cost of shares redeemed | | (2,763,954,753) | | (706,723,757) |
| | | | | |
Net increase (decrease) in net assets resulting from share transactions | | (1,859,477,860) | | (269,345,482) |
| Total increase (decrease) in net assets | | (555,816,826) | | 329,052,294 |
| | | | | |
| Net Assets | | | | |
| Beginning of period | | 4,152,315,727 | | 3,823,263,433 |
| End of period | $ | 3,596,498,901 | $ | 4,152,315,727 |
| | | | | |
| Other Information | | | | |
| Shares | | | | |
| Sold | | 32,603,910 | | 18,847,487 |
| Issued in reinvestment of distributions | | 621,044 | | 72,968 |
| Redeemed | | (93,351,491) | | (31,187,640) |
| Net increase (decrease) | | (60,126,537) | | (12,267,185) |
| | | | | |
Financial Highlights
Fidelity® International Capital Appreciation Fund |
| |
| Years ended October 31, | | 2024 | | 2023 | | 2022 | | 2021 | | 2020 |
Selected Per-Share Data | | | | | | | | | | |
| Net asset value, beginning of period | $ | 22.60 | $ | 19.51 | $ | 30.93 | $ | 24.57 | $ | 22.41 |
| Income from Investment Operations | | | | | | | | | | |
Net investment income (loss) A,B | | .12 | | .11 | | .02 | | (.02) | | .06 |
| Net realized and unrealized gain (loss) | | 6.48 | | 2.99 | | (8.86) | | 6.74 | | 2.86 |
| Total from investment operations | | 6.60 | | 3.10 | | (8.84) | | 6.72 | | 2.92 |
| Distributions from net investment income | | (.10) | | (.01) | | - | | (.05) | | (.13) |
| Distributions from net realized gain | | - | | - | | (2.58) | | (.31) | | (.62) |
| Total distributions | | (.10) | | (.01) | | (2.58) | | (.36) | | (.76) C |
| Net asset value, end of period | $ | 29.10 | $ | 22.60 | $ | 19.51 | $ | 30.93 | $ | 24.57 |
Total Return D | | | | 15.89% | | (30.97)% | | 27.56% | | 13.35% |
Ratios to Average Net Assets B,E,F | | | | | | | | | | |
| Expenses before reductions | | .86% | | .80% | | .99% | | 1.00% | | 1.03% |
| Expenses net of fee waivers, if any | | | | .79% | | .98% | | 1.00% | | 1.03% |
| Expenses net of all reductions | | .86% | | .79% | | .98% | | 1.00% | | .99% |
| Net investment income (loss) | | .43% | | .48% | | .10% | | (.08)% | | .25% |
| Supplemental Data | | | | | | | | | | |
| Net assets, end of period (000 omitted) | $ | 3,596,499 | $ | 4,152,316 | $ | 3,823,263 | $ | 5,851,757 | $ | 4,514,343 |
Portfolio turnover rate G | | | | 79% | | 112% H | | 141% | | 135% |
ACalculated based on average shares outstanding during the period.
BNet investment income (loss) is affected by the timing of the declaration of dividends by any underlying mutual funds or exchange-traded funds (ETFs). Net investment income (loss) of any mutual funds or ETFs is not included in the Fund's net investment income (loss) ratio.
CTotal distributions per share do not sum due to rounding.
DTotal returns would have been lower if certain expenses had not been reduced during the applicable periods shown.
EFees and expenses of any underlying mutual funds or exchange-traded funds (ETFs) are not included in the Fund's expense ratio. The Fund indirectly bears its proportionate share of these expenses. For additional expense information related to investments in Fidelity Central Funds, please refer to the "Investments in Fidelity Central Funds" note found in the Notes to Financial Statements section of the most recent Annual or Semi-Annual report.
FExpense ratios reflect operating expenses of the class. Expenses before reductions do not reflect amounts reimbursed, waived, or reduced through arrangements with the investment adviser, brokerage services, or other offset arrangements, if applicable, and do not represent the amount paid by the class during periods when reimbursements, waivers or reductions occur.
GAmount does not include the portfolio activity of any underlying mutual funds or exchange-traded funds (ETFs).
HPortfolio turnover rate excludes securities received or delivered in-kind.
Notes to Financial Statements
For the period ended October 31, 2024
1. Organization.
Fidelity International Capital Appreciation Fund (the Fund) is a fund of Fidelity Investment Trust (the Trust) and is authorized to issue an unlimited number of shares. Share transactions on the Statement of Changes in Net Assets may contain exchanges between affiliated funds. The Trust is registered under the Investment Company Act of 1940, as amended (the 1940 Act), as an open-end management investment company organized as a Massachusetts business trust. The Fund's investments in emerging markets can be subject to social, economic, regulatory, and political uncertainties and can be extremely volatile.
2. Investments in Fidelity Central Funds.
Funds may invest in Fidelity Central Funds, which are open-end investment companies generally available only to other investment companies and accounts managed by the investment adviser and its affiliates. The Schedule of Investments lists any Fidelity Central Funds held as an investment as of period end, but does not include the underlying holdings of each Fidelity Central Fund. An investing fund indirectly bears its proportionate share of the expenses of the underlying Fidelity Central Funds.
Based on its investment objective, each Fidelity Central Fund may invest or participate in various investment vehicles or strategies that are similar to those of the investing fund. These strategies are consistent with the investment objectives of the investing fund and may involve certain economic risks which may cause a decline in value of each of the Fidelity Central Funds and thus a decline in the value of the investing fund.
| Fidelity Central Fund | Investment Manager | Investment Objective | Investment Practices | Expense RatioA |
| Fidelity Money Market Central Funds | Fidelity Management & Research Company LLC (FMR) | Each fund seeks to obtain a high level of current income consistent with the preservation of capital and liquidity. | Short-term Investments | Less than .005% |
A Expenses expressed as a percentage of average net assets and are as of each underlying Central Fund's most recent annual or semi-annual shareholder report.
A complete unaudited list of holdings for each Fidelity Central Fund is available upon request or at the Securities and Exchange Commission website at www.sec.gov. In addition, the financial statements of the Fidelity Central Funds which contain the significant accounting policies (including investment valuation policies) of those funds, and are not covered by the Report of Independent Registered Public Accounting Firm, are available on the Securities and Exchange Commission website or upon request.
3. Significant Accounting Policies.
The Fund is an investment company and applies the accounting and reporting guidance of the Financial Accounting Standards Board (FASB) Accounting Standards Codification Topic 946 Financial Services - Investment Companies. The financial statements have been prepared in conformity with accounting principles generally accepted in the United States of America (GAAP), which require management to make certain estimates and assumptions at the date of the financial statements. Actual results could differ from those estimates. Subsequent events, if any, through the date that the financial statements were issued have been evaluated in the preparation of the financial statements. The Fund's Schedule of Investments lists any underlying mutual funds or exchange-traded funds (ETFs) but does not include the underlying holdings of these funds. The following summarizes the significant accounting policies of the Fund:
Investment Valuation. Investments are valued as of 4:00 p.m. Eastern time on the last calendar day of the period. The Board of Trustees (the Board) has designated the Fund's investment adviser as the valuation designee responsible for the fair valuation function and performing fair value determinations as needed. The investment adviser has established a Fair Value Committee (the Committee) to carry out the day-to-day fair valuation responsibilities and has adopted policies and procedures to govern the fair valuation process and the activities of the Committee. In accordance with these fair valuation policies and procedures, which have been approved by the Board, the Fund attempts to obtain prices from one or more third party pricing services or brokers to value its investments. When current market prices, quotations or currency exchange rates are not readily available or reliable, investments will be fair valued in good faith by the Committee, in accordance with the policies and procedures. Factors used in determining fair value vary by investment type and may include market or investment specific events, transaction data, estimated cash flows, and market observations of comparable investments. The frequency that the fair valuation procedures are used cannot be predicted and they may be utilized to a significant extent. The Committee manages the Fund's fair valuation practices and maintains the fair valuation policies and procedures. The Fund's investment adviser reports to the Board information regarding the fair valuation process and related material matters.
The Fund categorizes the inputs to valuation techniques used to value its investments into a disclosure hierarchy consisting of three levels as shown below:
Level 1 - unadjusted quoted prices in active markets for identical investments
Level 2 - other significant observable inputs (including quoted prices for similar investments, interest rates, prepayment speeds, etc.)
Level 3 - unobservable inputs (including the Fund's own assumptions based on the best information available)
Valuation techniques used to value the Fund's investments by major category are as follows:
Equity securities, including restricted securities, for which market quotations are readily available, are valued at the last reported sale price or official closing price as reported by a third party pricing service on the primary market or exchange on which they are traded and are categorized as Level 1 in the hierarchy. In the event there were no sales during the day or closing prices are not available, securities are valued at the last quoted bid price or may be valued using the last available price and are generally categorized as Level 2 in the hierarchy. For foreign equity securities, when market or security specific events arise, comparisons to the valuation of American Depositary Receipts (ADRs), futures contracts, Exchange-Traded Funds (ETFs) and certain indexes as well as quoted prices for similar securities may be used and would be categorized as Level 2 in the hierarchy. For equity securities, including restricted securities, where observable inputs are limited, assumptions about market activity and risk are used and these securities may be categorized as Level 3 in the hierarchy.
Investments in open-end mutual funds, including the Fidelity Central Funds, are valued at their closing net asset value (NAV) each business day and are categorized as Level 1 in the hierarchy.
Changes in valuation techniques may result in transfers in or out of an assigned level within the disclosure hierarchy. The aggregate value of investments by input level as of October 31, 2024 is included at the end of the Fund's Schedule of Investments.
Foreign Currency. Certain Funds may use foreign currency contracts to facilitate transactions in foreign-denominated securities. Gains and losses from these transactions may arise from changes in the value of the foreign currency or if the counterparties do not perform under the contracts' terms.
Foreign-denominated assets, including investment securities, and liabilities are translated into U.S. dollars at the exchange rates at period end. Purchases and sales of investment securities, income and dividends received, and expenses denominated in foreign currencies are translated into U.S. dollars at the exchange rate in effect on the transaction date.
The effects of exchange rate fluctuations on investments are included with the net realized and unrealized gain (loss) on investment securities. Other foreign currency transactions resulting in realized and unrealized gain (loss) are disclosed separately.
Investment Transactions and Income. For financial reporting purposes, the Fund's investment holdings and NAV include trades executed through the end of the last business day of the period. The NAV per share for processing shareholder transactions is calculated as of the close of business of the New York Stock Exchange (NYSE), normally 4:00 p.m. Eastern time and includes trades executed through the end of the prior business day. Gains and losses on securities sold are determined on the basis of identified cost and include proceeds received from litigation. Commissions paid to certain brokers with whom the investment adviser, or its affiliates, places trades on behalf of a fund include an amount in addition to trade execution, which may be rebated back to a fund. Any such rebates are included in net realized gain (loss) on investments in the Statement of Operations. Dividend income is recorded on the ex-dividend date, except for certain dividends from foreign securities where the ex-dividend date may have passed, which are recorded as soon as the Fund is informed of the ex-dividend date. Non-cash dividends included in dividend income, if any, are recorded at the fair market value of the securities received. Income and capital gain distributions from Fidelity Central Funds, if any, are recorded on the ex-dividend date. Certain distributions received by the Fund represent a return of capital or capital gain. The Fund determines the components of these distributions subsequent to the ex-dividend date, based upon receipt of tax filings or other correspondence relating to the underlying investment. These distributions are recorded as a reduction of cost of investments and/or as a realized gain. Interest income is accrued as earned and includes coupon interest and amortization of premium and accretion of discount on debt securities as applicable. Investment income is recorded net of foreign taxes withheld where recovery of such taxes is uncertain. Funds may file withholding tax reclaims in certain jurisdictions to recover a portion of amounts previously withheld. Any withholding tax reclaims income is included in the Statement of Operations in foreign taxes withheld. Any receivables for withholding tax reclaims are included in the Statement of Assets and Liabilities in reclaims receivable. The Fund has filed tax reclaims for previously withheld taxes on dividends earned in certain European Union (EU) countries. These additional filings are subject to various administrative proceedings by the local jurisdictions' tax authorities within the EU, as well as a number of related judicial proceedings. Income recognized for EU reclaims is included with other reclaims in the Statement of Operations in foreign taxes withheld. These reclaims are recorded when the amount is known and there are no significant uncertainties on collectability.
Expenses. Expenses directly attributable to a fund are charged to that fund. Expenses attributable to more than one fund are allocated among the respective funds on the basis of relative net assets or other appropriate methods. Expenses included in the accompanying financial statements reflect the expenses of that fund and do not include any expenses associated with any underlying mutual funds or exchange-traded funds. Although not included in a fund's expenses, a fund indirectly bears its proportionate share of these expenses through the net asset value of each underlying mutual fund or exchange-traded fund. Expense estimates are accrued in the period to which they relate and adjustments are made when actual amounts are known.
Income Tax Information and Distributions to Shareholders. Each year, the Fund intends to qualify as a regulated investment company under Subchapter M of the Internal Revenue Code, including distributing substantially all of its taxable income and realized gains. As a result, no provision for U.S. Federal income taxes is required. As of October 31, 2024, the Fund did not have any unrecognized tax benefits in the financial statements; nor is the Fund aware of any tax positions for which it is reasonably possible that the total amounts of unrecognized tax benefits will significantly change in the next twelve months. The Fund files a U.S. federal tax return, in addition to state and local tax returns as required. The Fund's federal income tax returns are subject to examination by the Internal Revenue Service (IRS) for a period of three fiscal years after they are filed. State and local tax returns may be subject to examination for an additional fiscal year depending on the jurisdiction. Foreign taxes are provided for based on the Fund's understanding of the tax rules and rates that exist in the foreign markets in which it invests. The Fund is subject to a tax imposed on capital gains by certain countries in which it invests. An estimated deferred tax liability for net unrealized appreciation on the applicable securities is included in Other payables and accrued expenses on the Statement of Assets and Liabilities.
Distributions are declared and recorded on the ex-dividend date. Income and capital gain distributions are determined in accordance with income tax regulations, which may differ from GAAP. In addition, the Fund claimed a portion of the payment made to redeeming shareholders as a distribution for income tax purposes.
Capital accounts within the financial statements are adjusted for permanent book-tax differences. These adjustments have no impact on net assets or the results of operations. Capital accounts are not adjusted for temporary book-tax differences which will reverse in a subsequent period.
Book-tax differences are primarily due to foreign currency transactions, certain foreign taxes, passive foreign investment companies (PFIC), redemptions in-kind, capital loss carryforwards and losses deferred due to wash sales.
As of period end, the cost and unrealized appreciation (depreciation) in securities, and derivatives if applicable, for federal income tax purposes were as follows:
| Gross unrealized appreciation | $956,266,008 |
| Gross unrealized depreciation | (33,639,293) |
| Net unrealized appreciation (depreciation) | $922,626,715 |
| Tax Cost | $2,697,163,331 |
The tax-based components of distributable earnings as of period end were as follows:
| Undistributed ordinary income | $26,180,138 |
| Undistributed long-term capital gain | $115,190,413 |
| Net unrealized appreciation (depreciation) on securities and other investments | $922,087,994 |
The tax character of distributions paid was as follows:
| | October 31, 2024 | October 31, 2023 |
| Ordinary Income | $18,874,608 | $ 1,939,358 |
| Total | $18,874,608 | $ 1,939,358 |
Restricted Securities (including Private Placements). Funds may invest in securities that are subject to legal or contractual restrictions on resale. These securities generally may be resold in transactions exempt from registration or to the public if the securities are registered. Disposal of these securities may involve time-consuming negotiations and expense, and prompt sale at an acceptable price may be difficult. Information regarding restricted securities held at period end is included at the end of the Schedule of Investments, if applicable.
New Accounting Pronouncement. In November 2023, the FASB issued Accounting Standards Update (ASU) 2023-07 Segment Reporting (Topic 280): Improvements to Reportable Segment Disclosures. Effective for fiscal years beginning after December 15, 2023 and interim periods within fiscal years beginning after December 15, 2024, the amendments enhance required disclosures of segment information for public entities on an annual and interim basis. The ASU allows for early adoption with updates applied retrospectively. Management is currently evaluating the impact of the ASU but does not expect this guidance to materially impact the financial statements.
4. Purchases and Sales of Investments.
Purchases and sales of securities, other than short-term securities and in-kind transactions, as applicable, are noted in the table below.
| | Purchases ($) | Sales ($) |
| Fidelity International Capital Appreciation Fund | 4,124,024,930 | 4,034,515,289 |
5. Fees and Other Transactions with Affiliates.
Management Fee. Fidelity Management & Research Company LLC (the investment adviser) and its affiliates provide the Fund with investment management related services for which the Fund pays a monthly management fee.
Effective March 1, 2024, the Fund's management contract was amended to incorporate administrative services previously covered under separate services agreements (Transfer Agent and Accounting agreements). Any reference to "class" in this note shall mean "the Fund" as the Fund currently offers only one class of shares. The amended contract incorporates a basic fee rate that may vary by class (subject to a performance adjustment). The investment adviser or an affiliate pays certain expenses of managing and operating the Fund out of each class's management fee. Each class of the Fund pays a management fee to the investment adviser. The management fee is calculated and paid to the investment adviser every month. The management fee is determined by calculating a basic fee and then applying a performance adjustment. When determining a class's basic fee, a mandate rate is calculated based on the monthly average net assets of a group of funds advised by FMR within a designated asset class. A discount rate is subtracted from the mandate rate once the Fund's monthly average net assets reach a certain level. The mandate rate and discount rate may vary by class. The annual basic fee rate for a class of shares of the Fund is the lesser of (1) the class's mandate rate reduced by the class's discount rate (if applicable) or (2) the amount set forth in the following table.
| | Maximum Management Fee Rate % |
| Fidelity International Capital Appreciation Fund | .83 |
One-twelfth of the basic fee rate for a class is applied to the average net assets of the class for the month, giving a dollar amount which is the basic fee for the class for that month. A different management fee rate may be applicable to each class of the Fund. The difference between classes is the result of separate arrangements for class-level services and/or waivers of certain expenses. It is not the result of any difference in advisory or custodial fees or other expenses related to the management of the Fund's assets, which do not vary by class. For the portion of the reporting period on or after March 1, 2024, the total annualized management fee rates were as follows:
| | Total Management Fee Rate % |
| Fidelity International Capital Appreciation Fund | .77 |
Prior to March 1, 2024, the management fee was the sum of an individual fund fee rate that was based on an annual rate of .45% of the Fund's average net assets and an annualized group fee rate that averaged .22% during the period. The group fee rate was based upon the monthly average net assets of a group of registered investment companies with which the investment adviser has management contracts. The group fee rate decreased as assets under management increased and increased as assets under management decreased. For the portion of the reporting period prior to March 1, 2024, the total annualized management fee rate was .65%.
The performance adjustment rate is calculated monthly by comparing over the performance period the Fund's performance to that of the performance adjustment index listed below.
| | Performance Adjustment Index |
| Fidelity International Capital Appreciation Fund | MSCI All Country World ex USA Index |
For the purposes of calculating the performance adjustment for the Fund, the Fund's investment performance is based on the performance of the Fund. To the extent that other classes of the Fund have higher expenses, this could result in those classes bearing a larger positive performance adjustment and smaller negative performance adjustment than would be the case if each class's own performance were considered. The performance period is the most recent 36 month period. The maximum annualized performance adjustment rate is ± 0.20% of the Fund's average net assets over the performance period. The performance adjustment rate is divided by twelve and multiplied by the Fund's average net assets over the performance period, and the resulting dollar amount is proportionately added to or subtracted from a class's basic fee. For the entire reporting period, the total annual performance adjustment was .05%.
Effective March 1, 2024, the Fund's sub-advisory agreements with FMR Investment Management (UK) Limited, Fidelity Management & Research (Hong Kong) Limited, and Fidelity Management & Research (Japan) Limited were amended to provide that the investment adviser pays each sub-adviser monthly fees equal to 110% of the sub-adviser's costs for providing sub-advisory services.
Effective March 1, 2024, the Fund's sub-advisory agreement with FIL Investment Advisors (FIA) was amended to provide that the investment adviser pays FIA monthly fees at an annual rate of 0.44% with respect to the average daily net assets of the Fund managed by FIA. FIA in turn pays FIA(UK).
Transfer Agent Fees. Fidelity Investments Institutional Operations Company LLC (FIIOC), an affiliate of the investment adviser, is the Fund's transfer, dividend disbursing and shareholder servicing agent. Effective March 1, 2024, each Fund's management contract was amended to incorporate transfer agent services and associated fees previously covered under a separate services agreement. FIIOC pays for typesetting, printing and mailing of shareholder reports, except proxy statements.
During the period December 1, 2023 through February 29, 2024, the transfer agent fees were a fixed annual rate of average net assets of .1559%.
Prior to December 1, 2023, FIIOC received account fees and asset-based fees that varied according to account size and type of account.
For the portion of the reporting period prior to March 1, 2024, the fees were equivalent to the annualized rate of .16% of average net assets.
Accounting Fees. Fidelity Service Company, Inc. (FSC), an affiliate of the investment adviser, maintains the Fund's accounting records. Effective March 1, 2024, the Fund's management contract was amended to incorporate accounting services and associated fees previously covered under a separate services agreement.
During the period December 1, 2023 through February 29, 2024, the accounting fees were a fixed annual rate of average net assets as follows:
| | % of Average Net Assets |
| Fidelity International Capital Appreciation Fund | .0322 |
Prior to December 1, 2023, the accounting fee was based on the level of average net assets for each month. For the portion of the reporting period prior to March 1, 2024, the fees were equivalent to the following annualized rates:
| | % of Average Net Assets |
| Fidelity International Capital Appreciation Fund | .03 |
Brokerage Commissions. A portion of portfolio transactions were placed with brokerage firms which are affiliates of the investment adviser. Brokerage commissions are included in net realized gain (loss) and change in net unrealized appreciation (depreciation) in the Statement of Operations. The commissions paid to these affiliated firms were as follows:
| | Amount ($) |
| Fidelity International Capital Appreciation Fund | 3,040 |
Interfund Lending Program. Pursuant to an Exemptive Order issued by the Securities and Exchange Commission (the SEC), the Fund, along with other registered investment companies having management contracts with Fidelity Management & Research Company LLC (FMR), or other affiliated entities of FMR, may participate in an interfund lending program. This program provides an alternative credit facility allowing the Fund to borrow from, or lend money to, other participating affiliated funds at rates that are beneficial to both the borrowing and lending fund. Borrowings under the program are generally for temporary or emergency purposes, including meeting fund shareholder redemptions. The interfund loan rate is determined, as specified in the Exemptive Order, by averaging, (1) the higher of the overnight time deposit rate and the current overnight repurchase agreement rate, and (2) a benchmark rate representing the lowest bank loan rate available to the funds. At period end, there were no interfund loans outstanding. Activity in this program during the period for which loans were outstanding was as follows:
| | Borrower or Lender | Average Loan Balance ($) | Weighted Average Interest Rate | Interest Expense ($) |
Fidelity International Capital Appreciation Fund | Borrower | 41,089,200 | 5.43% | 185,915 |
Interfund Trades. Funds may purchase from or sell securities to other Fidelity Funds under procedures adopted by the Board. The procedures have been designed to ensure these interfund trades are executed in accordance with Rule 17a-7 of the 1940 Act. Any interfund trades are included within the respective purchases and sales amounts shown in the Purchases and Sales of Investments note. Interfund trades during the period are noted in the table below.
| | Purchases ($) | Sales ($) | Realized Gain (Loss)($) |
| Fidelity International Capital Appreciation Fund | 195,196,345 | 281,159,031 | 34,439,567 |
Affiliated Redemptions In-Kind. Shares that were redeemed in-kind for investments, including accrued interest and cash, if any, are shown in the table below. The net realized gain or loss on investments delivered through in-kind redemptions is included in the "Net realized gain (loss) on: Redemptions in-kind" line in the accompanying Statement of Operations. The amount of the in-kind redemptions is included in share transactions in the accompanying Statement of Changes in Net Assets. There was no gain or loss for federal income tax purposes.
| | Shares | Total net realized gain or loss ($) | Total Proceeds ($) |
| Fidelity International Capital Appreciation Fund | 73,272,626 | 681,502,360 | 2,203,307,882 |
6. Committed Line of Credit.
Certain Funds participate with other funds managed by the investment adviser or an affiliate in a $4.25 billion credit facility (the "line of credit") to be utilized for temporary or emergency purposes to fund shareholder redemptions or for other short-term liquidity purposes. The participating funds have agreed to pay commitment fees on their pro-rata portion of the line of credit, which are reflected in Miscellaneous expenses on the Statement of Operations, and are listed below. During the period, there were no borrowings on this line of credit.
| | Amount ($) |
| Fidelity International Capital Appreciation Fund | 8,471 |
7. Security Lending.
Funds lend portfolio securities from time to time in order to earn additional income. Lending agents are used, including National Financial Services (NFS), an affiliate of the investment adviser. Pursuant to a securities lending agreement, NFS will receive a fee, which is capped at 9.9% of a fund's daily lending revenue, for its services as lending agent. A fund may lend securities to certain qualified borrowers, including NFS. On the settlement date of the loan, a fund receives collateral (in the form of U.S. Treasury obligations, letters of credit and/or cash) against the loaned securities and maintains collateral in an amount not less than 100% of the market value of the loaned securities during the period of the loan. The market value of the loaned securities is determined at the close of business of a fund and any additional required collateral is delivered to a fund on the next business day. A fund or borrower may terminate the loan at any time, and if the borrower defaults on its obligation to return the securities loaned because of insolvency or other reasons, a fund may apply collateral received from the borrower against the obligation. A fund may experience delays and costs in recovering the securities loaned. Any cash collateral received is invested in the Fidelity Securities Lending Cash Central Fund. Any loaned securities are identified as such in the Schedule of Investments, and the value of loaned securities and cash collateral at period end, as applicable, are presented in the Statement of Assets and Liabilities. Security lending income represents the income earned on investing cash collateral, less rebates paid to borrowers and any lending agent fees associated with the loan, plus any premium payments received for lending certain types of securities. Security lending income is presented in the Statement of Operations as a component of income from Fidelity Central Funds. Affiliated security lending activity, if any, was as follows:
| | Total Security Lending Fees Paid to NFS ($) | Security Lending Income From Securities Loaned to NFS ($) | Value of Securities Loaned to NFS at Period End ($) |
| Fidelity International Capital Appreciation Fund | 5,875 | - | - |
8. Expense Reductions.
Effective October 21, 2024, the investment adviser has voluntarily agreed to waive the Fund's management fee in an amount equal to $113,480 per month until April 30, 2026. During the period, this waiver reduced the Fund's management fee by $44,405.
Some expenses, for example the compensation of the independent Trustees, and certain miscellaneous expenses such as proxy and shareholder meeting expenses, are excluded from this reimbursement. During the period this reimbursement reduced the Fund's expenses by $44,405.
Through arrangements with the Fund's custodian, credits realized as a result of certain uninvested cash balances were used to reduce the Fund's expenses by $1,484.
In addition, during the period the investment adviser or an affiliate reimbursed and/or waived a portion of operating expenses in the amount of $227,817.
9. Other.
A fund's organizational documents provide former and current trustees and officers with a limited indemnification against liabilities arising in connection with the performance of their duties to the fund. In the normal course of business, a fund may also enter into contracts that provide general indemnifications. A fund's maximum exposure under these arrangements is unknown as this would be dependent on future claims that may be made against a fund. The risk of material loss from such claims is considered remote.
10. Risk and Uncertainties.
Many factors affect a fund's performance. Developments that disrupt global economies and financial markets, such as pandemics, epidemics, outbreaks of infectious diseases, war, terrorism, and environmental disasters, may significantly affect a fund's investment performance. The effects of these developments to a fund will be impacted by the types of securities in which a fund invests, the financial condition, industry, economic sector, and geographic location of an issuer, and a fund's level of investment in the securities of that issuer. Significant concentrations in security types, issuers, industries, sectors, and geographic locations may magnify the factors that affect a fund's performance.
Schedule of Investments October 31, 2024
Showing Percentage of Net Assets
| Common Stocks - 97.2% |
| | | Shares | Value ($) |
| Bailiwick of Jersey - 0.4% | | | |
| JTC PLC (a) | | 1,730,500 | 22,938,722 |
| Belgium - 0.8% | | | |
| Azelis Group NV | | 609,300 | 12,082,226 |
| KBC Group NV | | 522,890 | 37,925,823 |
TOTAL BELGIUM | | | 50,008,049 |
| Canada - 1.6% | | | |
| Constellation Software, Inc. | | 30,900 | 93,188,017 |
| Constellation Software, Inc. warrants 3/31/40 (b)(c) | | 62,100 | 4 |
| Lumine Group, Inc. (b) | | 346,922 | 8,077,862 |
TOTAL CANADA | | | 101,265,883 |
| Denmark - 4.4% | | | |
| DSV A/S | | 403,800 | 87,764,048 |
| Novo Nordisk A/S Series B | | 1,692,300 | 189,816,850 |
TOTAL DENMARK | | | 277,580,898 |
| France - 11.3% | | | |
| Accor SA | | 1,384,700 | 62,748,601 |
| Air Liquide SA | | 636,151 | 114,062,767 |
| Alten SA | | 318,856 | 26,949,127 |
| Capgemini SA | | 429,133 | 74,446,357 |
| Dassault Systemes SA | | 1,731,700 | 59,267,744 |
| EssilorLuxottica SA | | 349,413 | 81,867,938 |
| LVMH Moet Hennessy Louis Vuitton SE | | 159,502 | 106,183,759 |
| Safran SA | | 586,600 | 132,786,122 |
| Thales SA | | 306,370 | 49,371,575 |
TOTAL FRANCE | | | 707,683,990 |
| Germany - 9.0% | | | |
| Allianz SE | | 319,301 | 100,517,668 |
| Deutsche Borse AG | | 416,191 | 96,672,138 |
| Hannover Reuck SE | | 366,500 | 96,276,481 |
| Merck KGaA | | 346,100 | 57,223,482 |
| SAP SE | | 800,800 | 186,974,867 |
| Siemens Healthineers AG (a) | | 555,800 | 29,001,292 |
TOTAL GERMANY | | | 566,665,928 |
| India - 0.8% | | | |
| HDFC Bank Ltd. | | 2,406,600 | 49,465,649 |
| Indonesia - 0.9% | | | |
| PT Bank Central Asia Tbk | | 90,647,300 | 58,666,621 |
| Ireland - 1.0% | | | |
| Kingspan Group PLC (Ireland) | | 726,100 | 63,698,602 |
| Italy - 3.2% | | | |
| FinecoBank SpA | | 2,651,700 | 42,357,218 |
| GVS SpA (a)(b) | | 299,900 | 2,009,492 |
| Industrie de Nora SpA (d) | | 206,100 | 1,938,082 |
| Interpump Group SpA | | 78,800 | 3,500,588 |
| Recordati SpA | | 964,430 | 54,655,960 |
| UniCredit SpA | | 2,115,700 | 93,596,905 |
TOTAL ITALY | | | 198,058,245 |
| Japan - 16.0% | | | |
| Ajinomoto Co., Inc. | | 1,940,300 | 74,538,082 |
| BayCurrent Consulting, Inc. | | 623,000 | 20,246,918 |
| Capcom Co. Ltd. | | 1,664,600 | 32,939,877 |
| DENSO Corp. | | 1,944,700 | 27,621,537 |
| Disco Corp. | | 25,000 | 7,113,370 |
| Ebara Corp. | | 21,100 | 317,099 |
| Fuji Electric Co. Ltd. | | 215,500 | 10,974,964 |
| FUJIFILM Holdings Corp. | | 2,810,000 | 66,845,182 |
| Hitachi Ltd. | | 5,581,600 | 140,236,919 |
| Hoya Corp. | | 636,800 | 85,200,049 |
| Mitsubishi Heavy Industries Ltd. | | 7,848,700 | 110,799,720 |
| NOF Corp. | | 1,604,000 | 26,059,385 |
| Renesas Electronics Corp. | | 3,386,600 | 45,374,753 |
| Rohto Pharmaceutical Co. Ltd. | | 880,800 | 19,806,871 |
| Shin-Etsu Chemical Co. Ltd. | | 3,036,500 | 111,269,398 |
| Suzuki Motor Corp. | | 3,392,400 | 33,663,924 |
| TIS, Inc. | | 673,500 | 16,794,709 |
| Tokio Marine Holdings, Inc. | | 3,388,600 | 122,044,377 |
| Tokyo Electron Ltd. | | 354,000 | 52,092,182 |
TOTAL JAPAN | | | 1,003,939,316 |
| Netherlands - 5.9% | | | |
| ASML Holding NV (Netherlands) | | 275,400 | 186,090,617 |
| IMCD NV | | 353,524 | 56,162,904 |
| Topicus.Com, Inc. | | 69,488 | 5,948,414 |
| Wolters Kluwer NV | | 746,275 | 125,579,370 |
TOTAL NETHERLANDS | | | 373,781,305 |
| Spain - 1.2% | | | |
| CaixaBank SA (d) | | 12,672,990 | 77,226,203 |
| Sweden - 2.5% | | | |
| Addlife AB B Shares | | 1,577,972 | 20,053,161 |
| Atlas Copco AB (A Shares) | | 4,013,644 | 66,238,841 |
| Indutrade AB | | 2,616,016 | 70,860,076 |
| Kry International AB (b)(c)(e) | | 129,627 | 2,717,104 |
TOTAL SWEDEN | | | 159,869,182 |
| Switzerland - 3.4% | | | |
| ABB Ltd. (Reg.) | | 244,710 | 13,598,813 |
| Galderma Group AG (b) | | 267,769 | 25,057,510 |
| Partners Group Holding AG | | 63,980 | 88,388,790 |
| Sika AG | | 306,074 | 85,242,079 |
TOTAL SWITZERLAND | | | 212,287,192 |
| Taiwan - 1.4% | | | |
| Taiwan Semiconductor Manufacturing Co. Ltd. | | 2,846,000 | 89,539,744 |
| United Kingdom - 17.8% | | | |
| 3i Group PLC | | 2,267,400 | 92,980,900 |
| AstraZeneca PLC (United Kingdom) | | 974,500 | 138,665,117 |
| BAE Systems PLC | | 4,897,600 | 78,936,134 |
| Compass Group PLC | | 3,970,998 | 128,963,817 |
| Diploma PLC | | 914,295 | 50,199,167 |
| Halma PLC | | 1,495,782 | 47,736,218 |
| InterContinental Hotel Group PLC | | 762,700 | 84,123,942 |
| Lloyds Banking Group PLC | | 93,505,100 | 64,181,933 |
| London Stock Exchange Group PLC | | 900,600 | 122,063,626 |
| RELX PLC (London Stock Exchange) | | 3,027,700 | 138,849,427 |
| Rolls-Royce Holdings PLC (b) | | 11,698,500 | 80,724,315 |
| Sage Group PLC | | 3,813,400 | 47,667,226 |
| Tesco PLC | | 10,803,400 | 47,704,269 |
TOTAL UNITED KINGDOM | | | 1,122,796,091 |
| United States of America - 15.6% | | | |
| Alcon, Inc. (Switzerland) | | 913,010 | 84,137,961 |
| CDW Corp. | | 25,600 | 4,818,688 |
| CRH PLC | | 712,100 | 67,955,703 |
| Experian PLC | | 1,806,200 | 87,966,503 |
| Ferguson Enterprises, Inc. | | 417,900 | 82,553,529 |
| Holcim AG | | 788,800 | 77,715,366 |
| ICON PLC (b) | | 151,800 | 33,716,298 |
| Linde PLC | | 228,400 | 104,184,660 |
| Marsh & McLennan Companies, Inc. | | 493,200 | 107,635,968 |
| S&P Global, Inc. | | 197,905 | 95,065,646 |
| Schneider Electric SA | | 455,100 | 117,893,089 |
| Thermo Fisher Scientific, Inc. | | 90,400 | 49,387,328 |
| Visa, Inc. Class A | | 243,900 | 70,694,415 |
TOTAL UNITED STATES OF AMERICA | | | 983,725,154 |
| TOTAL COMMON STOCKS (Cost $4,820,595,220) | | | 6,119,196,774 |
| | | | |
| Money Market Funds - 2.6% |
| | | Shares | Value ($) |
| Fidelity Cash Central Fund 4.87% (f) | | 149,984,627 | 150,014,624 |
| Fidelity Securities Lending Cash Central Fund 4.87% (f)(g) | | 13,617,721 | 13,619,083 |
| TOTAL MONEY MARKET FUNDS (Cost $163,633,707) | | | 163,633,707 |
| | | | |
| TOTAL INVESTMENT IN SECURITIES - 99.8% (Cost $4,984,228,927) | 6,282,830,481 |
NET OTHER ASSETS (LIABILITIES) - 0.2% | 11,001,993 |
| NET ASSETS - 100.0% | 6,293,832,474 |
| | |
Legend
| (a) | Security exempt from registration under Rule 144A of the Securities Act of 1933. These securities may be resold in transactions exempt from registration, normally to qualified institutional buyers. At the end of the period, the value of these securities amounted to $53,949,506 or 0.9% of net assets. |
| (d) | Security or a portion of the security is on loan at period end. |
| (e) | Restricted securities (including private placements) - Investment in securities not registered under the Securities Act of 1933 (excluding 144A issues). At the end of the period, the value of restricted securities (excluding 144A issues) amounted to $2,717,104 or 0.0% of net assets. |
| (f) | Affiliated fund that is generally available only to investment companies and other accounts managed by Fidelity Investments. The rate quoted is the annualized seven-day yield of the fund at period end. A complete unaudited listing of the fund's holdings as of its most recent quarter end is available upon request. In addition, each Fidelity Central Fund's financial statements, which are not covered by the Fund's Report of Independent Registered Public Accounting Firm, are available on the SEC's website or upon request. |
| (g) | Investment made with cash collateral received from securities on loan. |
| Additional information on each restricted holding is as follows: |
| Security | Acquisition Date | Acquisition Cost ($) |
| Kry International AB | 5/14/21 - 10/30/24 | 8,571,872 |
| | | |
Affiliated Central Funds
Fiscal year to date information regarding the Fund's investments in Fidelity Central Funds, including the ownership percentage, is presented below.
| Affiliate | Value, beginning of period ($) | Purchases ($) | Sales Proceeds ($) | Dividend Income ($) | Realized Gain (loss) ($) | Change in Unrealized appreciation (depreciation) ($) | Value, end of period ($) | % ownership, end of period |
| Fidelity Cash Central Fund 4.87% | 150,881,981 | 2,490,476,112 | 2,491,345,379 | 7,389,853 | 1,910 | - | 150,014,624 | 0.3% |
| Fidelity Securities Lending Cash Central Fund 4.87% | - | 95,499,364 | 81,880,281 | 145,737 | - | - | 13,619,083 | 0.1% |
| Total | 150,881,981 | 2,585,975,476 | 2,573,225,660 | 7,535,590 | 1,910 | - | 163,633,707 | |
| | | | | | | | | |
Amounts in the dividend income column in the above table include any capital gain distributions from underlying funds, which are presented in the corresponding line item in the Statement of Operations, if applicable.
Amounts in the dividend income column for Fidelity Securities Lending Cash Central Fund represents the income earned on investing cash collateral, less rebates paid to borrowers and any lending agent fees associated with the loan, plus any premium payments received for lending certain types of securities.
Amounts included in the purchases and sales proceeds columns may include in-kind transactions, if applicable.
Investment Valuation
The following is a summary of the inputs used, as of October 31, 2024, involving the Fund's assets and liabilities carried at fair value. The inputs or methodology used for valuing securities may not be an indication of the risk associated with investing in those securities. For more information on valuation inputs, and their aggregation into the levels used below, please refer to the Investment Valuation section in the accompanying Notes to Financial Statements.
| Valuation Inputs at Reporting Date: |
| Description | Total ($) | Level 1 ($) | Level 2 ($) | Level 3 ($) |
Investments in Securities: | | | | |
|
| Equities: | | | | |
Communication Services | 32,939,877 | - | 32,939,877 | - |
Consumer Discretionary | 443,305,580 | 62,748,601 | 380,556,979 | - |
Consumer Staples | 142,049,222 | - | 142,049,222 | - |
Financials | 1,438,699,083 | 561,283,063 | 877,416,020 | - |
Health Care | 848,782,946 | 435,100,930 | 413,682,016 | - |
Industrials | 1,605,288,523 | 693,686,162 | 911,602,361 | - |
Information Technology | 1,021,642,185 | 420,476,169 | 598,448,908 | 2,717,108 |
Materials | 586,489,358 | 335,097,808 | 251,391,550 | - |
|
| Money Market Funds | 163,633,707 | 163,633,707 | - | - |
| Total Investments in Securities: | 6,282,830,481 | 2,672,026,440 | 3,608,086,933 | 2,717,108 |
Fidelity® Overseas Fund
Financial Statements
| Statement of Assets and Liabilities |
As of October 31, 2024 |
| Assets | | | | |
| Investment in securities, at value (including securities loaned of $13,110,012) - See accompanying schedule: | | | | |
Unaffiliated issuers (cost $4,820,595,221) | $ | 6,119,196,775 | | |
Fidelity Central Funds (cost $163,633,706) | | 163,633,706 | | |
| | | | | |
| | | | | |
| Total Investment in Securities (cost $4,984,228,927) | | | $ | 6,282,830,481 |
| Foreign currency held at value (cost $2,812,373) | | | | 2,812,373 |
| Receivable for investments sold | | | | 49,199,990 |
| Receivable for fund shares sold | | | | 18,242,062 |
| Dividends receivable | | | | 6,870,475 |
| Reclaims receivable | | | | 35,042,282 |
| Distributions receivable from Fidelity Central Funds | | | | 377,170 |
| Prepaid expenses | | | | 11,297 |
| Other receivables | | | | 527,315 |
Total assets | | | | 6,395,913,445 |
| Liabilities | | | | |
| Payable for investments purchased | $ | 55,912,286 | | |
| Payable for fund shares redeemed | | 28,684,100 | | |
| Accrued management fee | | 2,746,612 | | |
| Other payables and accrued expenses | | 1,118,890 | | |
| Collateral on securities loaned | | 13,619,083 | | |
| Total liabilities | | | | 102,080,971 |
| Net Assets | | | $ | 6,293,832,474 |
| Net Assets consist of: | | | | |
| Paid in capital | | | $ | 4,953,110,375 |
| Total accumulated earnings (loss) | | | | 1,340,722,099 |
| Net Assets | | | $ | 6,293,832,474 |
| | | | | |
| Net Asset Value and Maximum Offering Price | | | | |
| Overseas : | | | | |
Net Asset Value, offering price and redemption price per share ($4,962,648,670 ÷ 76,316,206 shares) | | | $ | 65.03 |
| Class K : | | | | |
Net Asset Value, offering price and redemption price per share ($1,331,183,804 ÷ 20,507,647 shares)(a) | | | $ | 64.91 |
(a)Corresponding Net Asset Value does not calculate due to rounding of fractional net assets and/or shares. |
| Statement of Operations |
| Year ended October 31, 2024 |
| Investment Income | | | | |
| Dividends | | | $ | 183,393,665 |
| Foreign Tax Reclaims | | | | 9,705,750 |
| Interest | | | | 131,642 |
| Income from Fidelity Central Funds (including $145,737 from security lending) | | | | 7,535,590 |
| Income before foreign taxes withheld | | | $ | 200,766,647 |
| Less foreign taxes withheld | | | | (24,967,618) |
| Total income | | | | 175,799,029 |
| Expenses | | | | |
| Management fee | | | | |
| Basic fee | $ | 62,425,511 | | |
| Performance adjustment | | (8,476,279) | | |
| Transfer agent fees | | 3,966,226 | | |
| Accounting fees | | 583,299 | | |
| Custodian fees and expenses | | 356,449 | | |
| Independent trustees' fees and expenses | | 40,437 | | |
| Registration fees | | 89,340 | | |
| Audit fees | | 107,914 | | |
| Legal | | 7,326 | | |
| Miscellaneous | | 145,746 | | |
| Total expenses before reductions | | 59,245,969 | | |
| Expense reductions | | (406,231) | | |
| Total expenses after reductions | | | | 58,839,738 |
| Net Investment income (loss) | | | | 116,959,291 |
| Realized and Unrealized Gain (Loss) | | | | |
| Net realized gain (loss) on: | | | | |
| Investment Securities: | | | | |
| Unaffiliated issuers (net of foreign taxes of $3,038,642) | | 175,259,832 | | |
| Redemptions in-kind | | 1,994,718,961 | | |
| Fidelity Central Funds | | 1,910 | | |
| Foreign currency transactions | | (838,042) | | |
| Total net realized gain (loss) | | | | 2,169,142,661 |
| Change in net unrealized appreciation (depreciation) on: | | | | |
| Investment Securities: | | | | |
| Unaffiliated issuers (net of decrease in deferred foreign taxes of $1,526,352) | | (71,347,675) | | |
| Assets and liabilities in foreign currencies | | 679,126 | | |
| Total change in net unrealized appreciation (depreciation) | | | | (70,668,549) |
| Net gain (loss) | | | | 2,098,474,112 |
| Net increase (decrease) in net assets resulting from operations | | | $ | 2,215,433,403 |
| Statement of Changes in Net Assets |
| |
| | Year ended October 31, 2024 | | Year ended October 31, 2023 |
| Increase (Decrease) in Net Assets | | | | |
| Operations | | | | |
| Net investment income (loss) | $ | 116,959,291 | $ | 95,895,080 |
| Net realized gain (loss) | | 2,169,142,661 | | 178,850,522 |
| Change in net unrealized appreciation (depreciation) | | (70,668,549) | | 588,410,844 |
| Net increase (decrease) in net assets resulting from operations | | 2,215,433,403 | | 863,156,446 |
| Distributions to shareholders | | (91,103,428) | | (57,098,273) |
| | | | | |
| Share transactions - net increase (decrease) | | (3,207,644,234) | | (224,690,399) |
| | | | | |
| Total increase (decrease) in net assets | | (1,083,314,259) | | 581,367,774 |
| | | | | |
| Net Assets | | | | |
| Beginning of period | | 7,377,146,733 | | 6,795,778,959 |
| End of period | $ | 6,293,832,474 | $ | 7,377,146,733 |
| | | | | |
| | | | | |
Financial Highlights
| Years ended October 31, | | 2024 | | 2023 | | 2022 | | 2021 | | 2020 |
Selected Per-Share Data | | | | | | | | | | |
| Net asset value, beginning of period | $ | 52.19 | $ | 46.55 | $ | 69.79 | $ | 50.91 | $ | 49.51 |
| Income from Investment Operations | | | | | | | | | | |
Net investment income (loss) A,B | | .85 | | .67 | | .47 | | .21 | | .13 |
| Net realized and unrealized gain (loss) | | 12.61 | | 5.36 | | (20.64) | | 18.98 | | 1.97 |
| Total from investment operations | | 13.46 | | 6.03 | | (20.17) | | 19.19 | | 2.10 |
| Distributions from net investment income | | (.62) | | (.39) | | (.20) | | (.11) | | (.70) |
| Distributions from net realized gain | | - | | - | | (2.87) | | (.21) | | - |
| Total distributions | | (.62) | | (.39) | | (3.07) | | (.31) C | | (.70) |
| Net asset value, end of period | $ | 65.03 | $ | 52.19 | $ | 46.55 | $ | 69.79 | $ | 50.91 |
Total Return D | | | | 12.95% | | (30.12)% | | 37.83% | | 4.25% |
Ratios to Average Net Assets B,E,F | | | | | | | | | | |
| Expenses before reductions | | .69% | | .73% | | .95% | | .99% | | 1.04% |
| Expenses net of fee waivers, if any | | | | .72% | | .95% | | .98% | | 1.04% |
| Expenses net of all reductions | | .69% | | .72% | | .94% | | .98% | | 1.03% |
| Net investment income (loss) | | 1.34% | | 1.23% | | .84% | | .33% | | .27% |
| Supplemental Data | | | | | | | | | | |
| Net assets, end of period (000 omitted) | $ | 4,962,649 | $ | 6,684,862 | $ | 6,175,776 | $ | 8,981,609 | $ | 6,160,617 |
Portfolio turnover rate G | | | | 34% | | 25% | | 30% H | | 41% |
ACalculated based on average shares outstanding during the period.
BNet investment income (loss) is affected by the timing of the declaration of dividends by any underlying mutual funds or exchange-traded funds (ETFs). Net investment income (loss) of any mutual funds or ETFs is not included in the Fund's net investment income (loss) ratio.
CTotal distributions per share do not sum due to rounding.
DTotal returns would have been lower if certain expenses had not been reduced during the applicable periods shown.
EFees and expenses of any underlying mutual funds or exchange-traded funds (ETFs) are not included in the Fund's expense ratio. The Fund indirectly bears its proportionate share of these expenses. For additional expense information related to investments in Fidelity Central Funds, please refer to the "Investments in Fidelity Central Funds" note found in the Notes to Financial Statements section of the most recent Annual or Semi-Annual report.
FExpense ratios reflect operating expenses of the class. Expenses before reductions do not reflect amounts reimbursed, waived, or reduced through arrangements with the investment adviser, brokerage services, or other offset arrangements, if applicable, and do not represent the amount paid by the class during periods when reimbursements, waivers or reductions occur.
GAmount does not include the portfolio activity of any underlying mutual funds or exchange-traded funds (ETFs).
HPortfolio turnover rate excludes securities received or delivered in-kind.
Fidelity® Overseas Fund Class K |
| |
| Years ended October 31, | | 2024 | | 2023 | | 2022 | | 2021 | | 2020 |
Selected Per-Share Data | | | | | | | | | | |
| Net asset value, beginning of period | $ | 52.11 | $ | 46.48 | $ | 69.68 | $ | 50.83 | $ | 49.43 |
| Income from Investment Operations | | | | | | | | | | |
Net investment income (loss) A,B | | .89 | | .73 | | .54 | | .27 | | .19 |
| Net realized and unrealized gain (loss) | | 12.59 | | 5.34 | | (20.60) | | 18.95 | | 1.96 |
| Total from investment operations | | 13.48 | | 6.07 | | (20.06) | | 19.22 | | 2.15 |
| Distributions from net investment income | | (.68) | | (.44) | | (.26) | | (.16) | | (.75) |
| Distributions from net realized gain | | - | | - | | (2.87) | | (.21) | | - |
| Total distributions | | (.68) | | (.44) | | (3.14) C | | (.37) | | (.75) |
| Net asset value, end of period | $ | 64.91 | $ | 52.11 | $ | 46.48 | $ | 69.68 | $ | 50.83 |
Total Return D | | | | 13.06% | | (30.04)% | | 37.97% | | 4.36% |
Ratios to Average Net Assets B,E,F | | | | | | | | | | |
| Expenses before reductions | | .64% | | .62% | | .84% | | .89% | | .94% |
| Expenses net of fee waivers, if any | | | | .61% | | .84% | | .88% | | .93% |
| Expenses net of all reductions | | .63% | | .61% | | .84% | | .88% | | .93% |
| Net investment income (loss) | | 1.40% | | 1.34% | | .94% | | .43% | | .38% |
| Supplemental Data | | | | | | | | | | |
| Net assets, end of period (000 omitted) | $ | 1,331,184 | $ | 692,284 | $ | 620,003 | $ | 1,591,397 | $ | 1,022,402 |
Portfolio turnover rate G | | | | 34% | | 25% | | 30% H | | 41% |
ACalculated based on average shares outstanding during the period.
BNet investment income (loss) is affected by the timing of the declaration of dividends by any underlying mutual funds or exchange-traded funds (ETFs). Net investment income (loss) of any mutual funds or ETFs is not included in the Fund's net investment income (loss) ratio.
CTotal distributions per share do not sum due to rounding.
DTotal returns would have been lower if certain expenses had not been reduced during the applicable periods shown.
EFees and expenses of any underlying mutual funds or exchange-traded funds (ETFs) are not included in the Fund's expense ratio. The Fund indirectly bears its proportionate share of these expenses. For additional expense information related to investments in Fidelity Central Funds, please refer to the "Investments in Fidelity Central Funds" note found in the Notes to Financial Statements section of the most recent Annual or Semi-Annual report.
FExpense ratios reflect operating expenses of the class. Expenses before reductions do not reflect amounts reimbursed, waived, or reduced through arrangements with the investment adviser, brokerage services, or other offset arrangements, if applicable, and do not represent the amount paid by the class during periods when reimbursements, waivers or reductions occur.
GAmount does not include the portfolio activity of any underlying mutual funds or exchange-traded funds (ETFs).
HPortfolio turnover rate excludes securities received or delivered in-kind.
Notes to Financial Statements
For the period ended October 31, 2024
1. Organization.
Fidelity Overseas Fund (the Fund) is a fund of Fidelity Investment Trust (the Trust) and is authorized to issue an unlimited number of shares. The Trust is registered under the Investment Company Act of 1940, as amended (the 1940 Act), as an open-end management investment company organized as a Massachusetts business trust. The Fund offers Overseas and Class K shares, each of which has equal rights as to assets and voting privileges.
2. Investments in Fidelity Central Funds.
Funds may invest in Fidelity Central Funds, which are open-end investment companies generally available only to other investment companies and accounts managed by the investment adviser and its affiliates. The Schedule of Investments lists any Fidelity Central Funds held as an investment as of period end, but does not include the underlying holdings of each Fidelity Central Fund. An investing fund indirectly bears its proportionate share of the expenses of the underlying Fidelity Central Funds.
Based on its investment objective, each Fidelity Central Fund may invest or participate in various investment vehicles or strategies that are similar to those of the investing fund. These strategies are consistent with the investment objectives of the investing fund and may involve certain economic risks which may cause a decline in value of each of the Fidelity Central Funds and thus a decline in the value of the investing fund.
| Fidelity Central Fund | Investment Manager | Investment Objective | Investment Practices | Expense RatioA |
| Fidelity Money Market Central Funds | Fidelity Management & Research Company LLC (FMR) | Each fund seeks to obtain a high level of current income consistent with the preservation of capital and liquidity. | Short-term Investments | Less than .005% |
A Expenses expressed as a percentage of average net assets and are as of each underlying Central Fund's most recent annual or semi-annual shareholder report.
A complete unaudited list of holdings for each Fidelity Central Fund is available upon request or at the Securities and Exchange Commission website at www.sec.gov. In addition, the financial statements of the Fidelity Central Funds which contain the significant accounting policies (including investment valuation policies) of those funds, and are not covered by the Report of Independent Registered Public Accounting Firm, are available on the Securities and Exchange Commission website or upon request.
3. Significant Accounting Policies.
The Fund is an investment company and applies the accounting and reporting guidance of the Financial Accounting Standards Board (FASB) Accounting Standards Codification Topic 946 Financial Services - Investment Companies. The financial statements have been prepared in conformity with accounting principles generally accepted in the United States of America (GAAP), which require management to make certain estimates and assumptions at the date of the financial statements. Actual results could differ from those estimates. Subsequent events, if any, through the date that the financial statements were issued have been evaluated in the preparation of the financial statements. The Fund's Schedule of Investments lists any underlying mutual funds or exchange-traded funds (ETFs) but does not include the underlying holdings of these funds. The following summarizes the significant accounting policies of the Fund:
Investment Valuation. Investments are valued as of 4:00 p.m. Eastern time on the last calendar day of the period. The Board of Trustees (the Board) has designated the Fund's investment adviser as the valuation designee responsible for the fair valuation function and performing fair value determinations as needed. The investment adviser has established a Fair Value Committee (the Committee) to carry out the day-to-day fair valuation responsibilities and has adopted policies and procedures to govern the fair valuation process and the activities of the Committee. In accordance with these fair valuation policies and procedures, which have been approved by the Board, the Fund attempts to obtain prices from one or more third party pricing services or brokers to value its investments. When current market prices, quotations or currency exchange rates are not readily available or reliable, investments will be fair valued in good faith by the Committee, in accordance with the policies and procedures. Factors used in determining fair value vary by investment type and may include market or investment specific events, transaction data, estimated cash flows, and market observations of comparable investments. The frequency that the fair valuation procedures are used cannot be predicted and they may be utilized to a significant extent. The Committee manages the Fund's fair valuation practices and maintains the fair valuation policies and procedures. The Fund's investment adviser reports to the Board information regarding the fair valuation process and related material matters.
The Fund categorizes the inputs to valuation techniques used to value its investments into a disclosure hierarchy consisting of three levels as shown below:
Level 1 - unadjusted quoted prices in active markets for identical investments
Level 2 - other significant observable inputs (including quoted prices for similar investments, interest rates, prepayment speeds, etc.)
Level 3 - unobservable inputs (including the Fund's own assumptions based on the best information available)
Valuation techniques used to value the Fund's investments by major category are as follows:
Equity securities, including restricted securities, for which market quotations are readily available, are valued at the last reported sale price or official closing price as reported by a third party pricing service on the primary market or exchange on which they are traded and are categorized as Level 1 in the hierarchy. In the event there were no sales during the day or closing prices are not available, securities are valued at the last quoted bid price or may be valued using the last available price and are generally categorized as Level 2 in the hierarchy. For foreign equity securities, when market or security specific events arise, comparisons to the valuation of American Depositary Receipts (ADRs), futures contracts, Exchange-Traded Funds (ETFs) and certain indexes as well as quoted prices for similar securities may be used and would be categorized as Level 2 in the hierarchy. For equity securities, including restricted securities, where observable inputs are limited, assumptions about market activity and risk are used and these securities may be categorized as Level 3 in the hierarchy.
Investments in open-end mutual funds, including the Fidelity Central Funds, are valued at their closing net asset value (NAV) each business day and are categorized as Level 1 in the hierarchy.
Changes in valuation techniques may result in transfers in or out of an assigned level within the disclosure hierarchy. The aggregate value of investments by input level as of October 31, 2024 is included at the end of the Fund's Schedule of Investments.
Foreign Currency. Certain Funds may use foreign currency contracts to facilitate transactions in foreign-denominated securities. Gains and losses from these transactions may arise from changes in the value of the foreign currency or if the counterparties do not perform under the contracts' terms.
Foreign-denominated assets, including investment securities, and liabilities are translated into U.S. dollars at the exchange rates at period end. Purchases and sales of investment securities, income and dividends received, and expenses denominated in foreign currencies are translated into U.S. dollars at the exchange rate in effect on the transaction date.
The effects of exchange rate fluctuations on investments are included with the net realized and unrealized gain (loss) on investment securities. Other foreign currency transactions resulting in realized and unrealized gain (loss) are disclosed separately.
Investment Transactions and Income. For financial reporting purposes, the Fund's investment holdings and NAV include trades executed through the end of the last business day of the period. The NAV per share for processing shareholder transactions is calculated as of the close of business of the New York Stock Exchange (NYSE), normally 4:00 p.m. Eastern time and includes trades executed through the end of the prior business day. Gains and losses on securities sold are determined on the basis of identified cost and include proceeds received from litigation. Commissions paid to certain brokers with whom the investment adviser, or its affiliates, places trades on behalf of a fund include an amount in addition to trade execution, which may be rebated back to a fund. Any such rebates are included in net realized gain (loss) on investments in the Statement of Operations. Dividend income is recorded on the ex-dividend date, except for certain dividends from foreign securities where the ex-dividend date may have passed, which are recorded as soon as the Fund is informed of the ex-dividend date. Non-cash dividends included in dividend income, if any, are recorded at the fair market value of the securities received. Income and capital gain distributions from Fidelity Central Funds, if any, are recorded on the ex-dividend date. Interest income is accrued as earned and includes coupon interest and amortization of premium and accretion of discount on debt securities as applicable. Investment income is recorded net of foreign taxes withheld where recovery of such taxes is uncertain. Funds may file withholding tax reclaims in certain jurisdictions to recover a portion of amounts previously withheld. Any withholding tax reclaims income is included in the Statement of Operations in foreign taxes withheld. Any receivables for withholding tax reclaims are included in the Statement of Assets and Liabilities in reclaims receivable. The Fund has filed tax reclaims for previously withheld taxes on dividends earned in certain European Union (EU) countries. These additional filings are subject to various administrative proceedings by the local jurisdictions' tax authorities within the EU, as well as a number of related judicial proceedings. Income recognized for EU reclaims is included with other reclaims in the Statement of Operations in foreign taxes withheld. These reclaims are recorded when the amount is known and there are no significant uncertainties on collectability.
Class Allocations and Expenses. Investment income, realized and unrealized capital gains and losses, common expenses of a fund, and certain fund-level expense reductions, if any, are allocated daily on a pro-rata basis to each class based on the relative net assets of each class to the total net assets of a fund. Each class differs with respect to transfer agent and distribution and service plan fees incurred, as applicable. Certain expense reductions may also differ by class, if applicable. For the reporting period, the allocated portion of income and expenses to each class as a percent of its average net assets may vary due to the timing of recording these transactions in relation to fluctuating net assets of the classes. Expenses directly attributable to a fund are charged to that fund. Expenses attributable to more than one fund are allocated among the respective funds on the basis of relative net assets or other appropriate methods. Expenses included in the accompanying financial statements reflect the expenses of that fund and do not include any expenses associated with any underlying mutual funds or exchange-traded funds (ETFs). Although not included in a fund's expenses, a fund indirectly bears its proportionate share of these expenses through the net asset value of each underlying mutual fund or exchange-traded fund (ETF). Expense estimates are accrued in the period to which they relate and adjustments are made when actual amounts are known.
Deferred Trustee Compensation. Under a Deferred Compensation Plan (the Plan) for certain Funds, certain independent Trustees have elected to defer receipt of a portion of their annual compensation. Deferred amounts are invested in affiliated mutual funds, are marked-to-market and remain in a fund until distributed in accordance with the Plan. The investment of deferred amounts and the offsetting payable to the Trustees presented below are included in the accompanying Statement of Assets and Liabilities in other receivables and other payables and accrued expenses, as applicable.
| Fidelity Overseas Fund | $303,225 |
Income Tax Information and Distributions to Shareholders. Each year, the Fund intends to qualify as a regulated investment company under Subchapter M of the Internal Revenue Code, including distributing substantially all of its taxable income and realized gains. As a result, no provision for U.S. Federal income taxes is required. As of October 31, 2024, the Fund did not have any unrecognized tax benefits in the financial statements; nor is the Fund aware of any tax positions for which it is reasonably possible that the total amounts of unrecognized tax benefits will significantly change in the next twelve months. The Fund files a U.S. federal tax return, in addition to state and local tax returns as required. The Fund's federal income tax returns are subject to examination by the Internal Revenue Service (IRS) for a period of three fiscal years after they are filed. State and local tax returns may be subject to examination for an additional fiscal year depending on the jurisdiction. Foreign taxes are provided for based on the Fund's understanding of the tax rules and rates that exist in the foreign markets in which it invests. The Fund is subject to a tax imposed on capital gains by certain countries in which it invests. An estimated deferred tax liability for net unrealized appreciation on the applicable securities is included in Other payables and accrued expenses on the Statement of Assets and Liabilities.
Distributions are declared and recorded on the ex-dividend date. Income and capital gain distributions are declared separately for each class. Income and capital gain distributions are determined in accordance with income tax regulations, which may differ from GAAP. In addition, the Fund claimed a portion of the payment made to redeeming shareholders as a distribution for income tax purposes.
Capital accounts within the financial statements are adjusted for permanent book-tax differences. These adjustments have no impact on net assets or the results of operations. Capital accounts are not adjusted for temporary book-tax differences which will reverse in a subsequent period.
Book-tax differences are primarily due to foreign currency transactions, certain foreign taxes, passive foreign investment companies (PFIC), redemptions in-kind, deferred Trustee compensation, capital loss carryforwards and losses deferred due to wash sales.
As of period end, the cost and unrealized appreciation (depreciation) in securities, and derivatives if applicable, for federal income tax purposes were as follows:
| Gross unrealized appreciation | $1,408,658,438 |
| Gross unrealized depreciation | (151,113,002) |
| Net unrealized appreciation (depreciation) | $1,257,545,436 |
| Tax Cost | $5,025,285,045 |
The tax-based components of distributable earnings as of period end were as follows:
| Undistributed ordinary income | $83,993,548 |
| Net unrealized appreciation (depreciation) on securities and other investments | $1,257,433,939 |
| | |
The tax character of distributions paid was as follows:
| | October 31, 2024 | October 31, 2023 |
| Ordinary Income | $91,103,428 | $ 57,098,273 |
| Total | $91,103,428 | $ 57,098,273 |
Restricted Securities (including Private Placements). Funds may invest in securities that are subject to legal or contractual restrictions on resale. These securities generally may be resold in transactions exempt from registration or to the public if the securities are registered. Disposal of these securities may involve time-consuming negotiations and expense, and prompt sale at an acceptable price may be difficult. Information regarding restricted securities held at period end is included at the end of the Schedule of Investments, if applicable.
New Accounting Pronouncement. In November 2023, the FASB issued Accounting Standards Update (ASU) 2023-07 Segment Reporting (Topic 280): Improvements to Reportable Segment Disclosures. Effective for fiscal years beginning after December 15, 2023 and interim periods within fiscal years beginning after December 15, 2024, the amendments enhance required disclosures of segment information for public entities on an annual and interim basis. The ASU allows for early adoption with updates applied retrospectively. Management is currently evaluating the impact of the ASU but does not expect this guidance to materially impact the financial statements.
4. Purchases and Sales of Investments.
Purchases and sales of securities, other than short-term securities and in-kind transactions, as applicable, are noted in the table below.
| | Purchases ($) | Sales ($) |
| Fidelity Overseas Fund | 4,647,776,118 | 2,933,840,536 |
5. Fees and Other Transactions with Affiliates.
Management Fee. Fidelity Management & Research Company LLC (the investment adviser) and its affiliates provide the Fund with investment management related services for which the Fund pays a monthly management fee.
Effective March 1, 2024, the Fund's management contract was amended to incorporate administrative services previously covered under separate services agreements (Transfer Agent and Accounting agreements). The amended contract incorporates a basic fee rate that may vary by class (subject to a performance adjustment). The investment adviser or an affiliate pays certain expenses of managing and operating the Fund out of each class's management fee. Each class of the Fund pays a management fee to the investment adviser. The management fee is calculated and paid to the investment adviser every month. The management fee is determined by calculating a basic fee and then applying a performance adjustment. When determining a class's basic fee, a mandate rate is calculated based on the monthly average net assets of a group of funds advised by FMR within a designated asset class. A discount rate is subtracted from the mandate rate once the Fund's monthly average net assets reach a certain level. The mandate rate and discount rate may vary by class. The annual basic fee rate for a class of shares of the Fund is the lesser of (1) the class's mandate rate reduced by the class's discount rate (if applicable) or (2) the amount set forth in the following table.
| | Maximum Management Fee Rate % |
| Overseas | .78 |
| Class K | .68 |
One-twelfth of the basic fee rate for a class is applied to the average net assets of the class for the month, giving a dollar amount which is the basic fee for the class for that month. A different management fee rate may be applicable to each class of the Fund. The difference between classes is the result of separate arrangements for class-level services and/or waivers of certain expenses. It is not the result of any difference in advisory or custodial fees or other expenses related to the management of the Fund's assets, which do not vary by class. For the portion of the reporting period on or after March 1, 2024, the total annualized management fee rates were as follows:
| | Total Management Fee Rate % |
| Overseas | .77 |
| Class K | .68 |
Prior to March 1, 2024, the management fee was the sum of an individual fund fee rate that was based on an annual rate of .42% of the Fund's average net assets and an annualized group fee rate that averaged .22% during the period. The group fee rate was based upon the monthly average net assets of a group of registered investment companies with which the investment adviser has management contracts. The group fee rate decreased as assets under management increased and increased as assets under management decreased. For the portion of the reporting period prior to March 1, 2024, the total annualized management fee rate was .65%.
The performance adjustment rate is calculated monthly by comparing over the performance period the Fund's performance to that of the performance adjustment index listed below.
| | Performance Adjustment Index |
| Fidelity Overseas Fund | MSCI EAFE Index |
For the purposes of calculating the performance adjustment for the Fund, the Fund's investment performance is based on the performance of Overseas. To the extent that other classes of the Fund have higher expenses, this could result in those classes bearing a larger positive performance adjustment and smaller negative performance adjustment than would be the case if each class's own performance were considered. The performance period is the most recent 36 month period. The maximum annualized performance adjustment rate is ±0.20% of the Fund's average net assets over the performance period. The performance adjustment rate is divided by twelve and multiplied by the Fund's average net assets over the performance period, and the resulting dollar amount is proportionately added to or subtracted from a class's basic fee. For the entire reporting period, the total annual performance adjustment was (.10)%.
Effective March 1, 2024, the Fund's sub-advisory agreements with FMR Investment Management (UK) Limited, Fidelity Management & Research (Hong Kong) Limited, and Fidelity Management & Research (Japan) Limited were amended to provide that the investment adviser pays each sub-adviser monthly fees equal to 110% of the sub-adviser's costs for providing sub-advisory services.
Effective March 1, 2024, the Fund's sub-advisory agreement with FIL Investment Advisors (FIA) was amended to provide that the investment adviser pays FIA monthly fees at an annual rate of 0.44% with respect to the average daily net assets of the Fund managed by FIA. FIA in turn pays FIA(UK).
Transfer Agent Fees. Fidelity Investments Institutional Operations Company LLC (FIIOC), an affiliate of the investment adviser, is the transfer, dividend disbursing and shareholder servicing agent for each class of the Fund. Effective March 1, 2024, the Fund's management contract was amended to incorporate transfer agent services and associated fees previously covered under a separate services agreement. FIIOC pays for typesetting, printing and mailing of shareholder reports, except proxy statements.
During the period December 1, 2023 through February 29, 2024, the transfer agent fees for each class were a fixed annual rate of class-level average net assets as follows:
| | % of Class-Level Average Net Assets |
| Overseas | .1476 |
| Class K | .0420 |
Prior to December 1, 2023, FIIOC received account fees and asset-based fees that varied according to the account size and type of account of the shareholders of the respective classes of the Fund, except for Class K. FIIOC received an asset-based fee of Class K's average net assets. For the portion of the reporting period prior to March 1, 2024, the fees were equivalent to the following annualized rates:
| | Amount ($) | % of Class-Level Average Net Assets |
| Overseas | 3,839,729 | .15 |
| Class K | 126,497 | .04 |
| 3,966,226 | |
Accounting Fees. Fidelity Service Company, Inc. (FSC), an affiliate of the investment adviser, maintains the Fund's accounting records. Effective March 1, 2024, the Fund's management contract was amended to incorporate accounting services and associated fees previously covered under a separate services agreement.
During the period December 1, 2023 through February 29, 2024, the accounting fees were a fixed annual rate of average net assets as follows:
| | % of Average Net Assets |
| Fidelity Overseas Fund | .0199 |
Prior to December 1, 2023, the accounting fee was based on the level of average net assets for each month. For the portion of the reporting period prior to March 1, 2024, the fees were equivalent to the following annualized rates:
| | % of Average Net Assets |
| Fidelity Overseas Fund | .02 |
| | |
Brokerage Commissions. A portion of portfolio transactions were placed with brokerage firms which are affiliates of the investment adviser. Brokerage commissions are included in net realized gain (loss) and change in net unrealized appreciation (depreciation) in the Statement of Operations. The commissions paid to these affiliated firms were as follows:
| | Amount ($) |
| Fidelity Overseas Fund | 1,689 |
Interfund Trades. Funds may purchase from or sell securities to other Fidelity Funds under procedures adopted by the Board. The procedures have been designed to ensure these interfund trades are executed in accordance with Rule 17a-7 of the 1940 Act. Any interfund trades are included within the respective purchases and sales amounts shown in the Purchases and Sales of Investments note. Interfund trades during the period are noted in the table below.
| | Purchases ($) | Sales ($) | Realized Gain (Loss)($) |
| Fidelity Overseas Fund | 165,490,169 | 66,299,271 | 7,177,517 |
Affiliated Redemptions In-Kind. Shares that were redeemed in-kind for investments, including accrued interest and cash, if any, are shown in the table below. The net realized gain or loss on investments delivered through in-kind redemptions is included in the "Net realized gain (loss) on: Redemptions in-kind" line in the accompanying Statement of Operations. The amount of the in-kind redemptions is included in share transactions in the accompanying Statement of Changes in Net Assets. There was no gain or loss for federal income tax purposes.
| | Shares | Total net realized gain or loss ($) | Total Proceeds ($) |
| Fidelity Overseas Fund | 73,699,426 | 1,994,718,961 | 5,011,560,962 |
6. Committed Line of Credit.
Certain Funds participate with other funds managed by the investment adviser or an affiliate in a $4.25 billion credit facility (the "line of credit") to be utilized for temporary or emergency purposes to fund shareholder redemptions or for other short-term liquidity purposes. The participating funds have agreed to pay commitment fees on their pro-rata portion of the line of credit, which are reflected in Miscellaneous expenses on the Statement of Operations, and are listed below. During the period, there were no borrowings on this line of credit.
| | Amount ($) |
| Fidelity Overseas Fund | 14,280 |
7. Security Lending.
Funds lend portfolio securities from time to time in order to earn additional income. Lending agents are used, including National Financial Services (NFS), an affiliate of the investment adviser. Pursuant to a securities lending agreement, NFS will receive a fee, which is capped at 9.9% of a fund's daily lending revenue, for its services as lending agent. A fund may lend securities to certain qualified borrowers, including NFS. On the settlement date of the loan, a fund receives collateral (in the form of U.S. Treasury obligations, letters of credit and/or cash) against the loaned securities and maintains collateral in an amount not less than 100% of the market value of the loaned securities during the period of the loan. The market value of the loaned securities is determined at the close of business of a fund and any additional required collateral is delivered to a fund on the next business day. A fund or borrower may terminate the loan at any time, and if the borrower defaults on its obligation to return the securities loaned because of insolvency or other reasons, a fund may apply collateral received from the borrower against the obligation. A fund may experience delays and costs in recovering the securities loaned. Any cash collateral received is invested in the Fidelity Securities Lending Cash Central Fund. Any loaned securities are identified as such in the Schedule of Investments, and the value of loaned securities and cash collateral at period end, as applicable, are presented in the Statement of Assets and Liabilities. Security lending income represents the income earned on investing cash collateral, less rebates paid to borrowers and any lending agent fees associated with the loan, plus any premium payments received for lending certain types of securities. Security lending income is presented in the Statement of Operations as a component of income from Fidelity Central Funds. Affiliated security lending activity, if any, was as follows:
| | Total Security Lending Fees Paid to NFS ($) | Security Lending Income From Securities Loaned to NFS ($) | Value of Securities Loaned to NFS at Period End ($) |
| Fidelity Overseas Fund | 15,514 | - | - |
8. Expense Reductions.
Through arrangements with the Fund's custodian, credits realized as a result of certain uninvested cash balances were used to reduce the Fund's expenses. During the period, custodian credits reduced the Fund's expenses by $2,451.
In addition, during the period the investment adviser or an affiliate reimbursed and/or waived a portion of fund-level operating expenses in the amount of $403,780.
9. Distributions to Shareholders.
Distributions to shareholders of each class were as follows:
| | Year ended October 31, 2024 | Year ended October 31, 2023 |
| Fidelity Overseas Fund | | |
| Distributions to shareholders | | |
| Overseas | $80,812,559 | $51,233,808 |
| Class K | 10,290,869 | 5,864,465 |
Total | $91,103,428 | $57,098,273 |
10. Share Transactions.
Share transactions for each class were as follows and may contain in-kind transactions, automatic conversions between classes or exchanges between affiliated funds:
| | Shares | Shares | Dollars | Dollars |
| | Year ended October 31, 2024 | Year ended October 31, 2023 | Year ended October 31, 2024 | Year ended October 31, 2023 |
| Fidelity Overseas Fund | | | | |
| Overseas | | | | |
| Shares sold | 33,392,063 | 10,936,067 | $2,093,817,387 | $596,408,589 |
| Reinvestment of distributions | 1,223,215 | 849,241 | 70,139,126 | 44,738,039 |
| Shares redeemed | (86,383,538) | (16,363,021) | (5,822,142,918) | (880,663,957) |
| Net increase (decrease) | (51,768,260) | (4,577,713) | $(3,658,186,405) | $(239,517,329) |
| Class K | | | | |
| Shares sold | 10,389,470 | 5,973,191 | $652,824,553 | $340,532,508 |
| Reinvestment of distributions | 179,942 | 111,598 | 10,290,869 | 5,864,465 |
| Shares redeemed | (3,346,586) | (6,139,595) | (212,573,251) | (331,570,043) |
| Net increase (decrease) | 7,222,826 | (54,806) | $450,542,171 | $14,826,930 |
11. Other.
A fund's organizational documents provide former and current trustees and officers with a limited indemnification against liabilities arising in connection with the performance of their duties to the fund. In the normal course of business, a fund may also enter into contracts that provide general indemnifications. A fund's maximum exposure under these arrangements is unknown as this would be dependent on future claims that may be made against a fund. The risk of material loss from such claims is considered remote.
12. Risk and Uncertainties.
Many factors affect a fund's performance. Developments that disrupt global economies and financial markets, such as pandemics, epidemics, outbreaks of infectious diseases, war, terrorism, and environmental disasters, may significantly affect a fund's investment performance. The effects of these developments to a fund will be impacted by the types of securities in which a fund invests, the financial condition, industry, economic sector, and geographic location of an issuer, and a fund's level of investment in the securities of that issuer. Significant concentrations in security types, issuers, industries, sectors, and geographic locations may magnify the factors that affect a fund's performance.
Schedule of Investments October 31, 2024
Showing Percentage of Net Assets
| Common Stocks - 99.1% |
| | | Shares | Value ($) |
| Australia - 1.6% | | | |
| CAR Group Ltd. | | 709,556 | 17,477,098 |
| Deterra Royalties Ltd. | | 2,088,759 | 5,053,352 |
| Lovisa Holdings Ltd. | | 439,390 | 8,537,812 |
| National Storage REIT unit | | 4,853,097 | 7,984,304 |
| Suncorp Group Ltd. | | 943,977 | 11,073,095 |
TOTAL AUSTRALIA | | | 50,125,661 |
| Austria - 0.3% | | | |
| Wienerberger AG | | 277,300 | 8,355,236 |
| Belgium - 1.3% | | | |
| Azelis Group NV | | 232,768 | 4,615,716 |
| UCB SA | | 185,000 | 35,578,127 |
TOTAL BELGIUM | | | 40,193,843 |
| Canada - 4.0% | | | |
| Celestica, Inc. (a) | | 101,000 | 6,908,400 |
| Constellation Software, Inc. | | 3,700 | 11,158,436 |
| Constellation Software, Inc. warrants 3/31/40 (a)(b) | | 3,700 | 0 |
| Franco-Nevada Corp. | | 55,500 | 7,367,049 |
| Lumine Group, Inc. (a) | | 290,750 | 6,769,932 |
| PrairieSky Royalty Ltd. | | 3,144,700 | 62,923,361 |
| Royal Bank of Canada (c) | | 96,000 | 11,610,184 |
| South Bow Corp. | | 795,000 | 19,852,875 |
TOTAL CANADA | | | 126,590,237 |
| China - 1.1% | | | |
| BYD Co. Ltd. (H Shares) | | 168,500 | 6,085,987 |
| Kweichow Moutai Co. Ltd. (A Shares) | | 27,700 | 5,947,316 |
| Tencent Holdings Ltd. | | 235,400 | 12,274,258 |
| ZTO Express, Inc. sponsored ADR Class A | | 464,000 | 10,723,040 |
TOTAL CHINA | | | 35,030,601 |
| Denmark - 1.5% | | | |
| DSV A/S | | 61,646 | 13,398,471 |
| GN Store Nord A/S (a) | | 447,475 | 8,701,220 |
| Novo Nordisk A/S Series B | | 225,300 | 25,270,777 |
TOTAL DENMARK | | | 47,370,468 |
| Finland - 0.2% | | | |
| Fortum Corp. | | 349,400 | 5,142,210 |
| Nanoform Finland PLC (a) | | 206,414 | 301,764 |
TOTAL FINLAND | | | 5,443,974 |
| France - 1.1% | | | |
| Capgemini SA | | 49,000 | 8,500,562 |
| Danone SA | | 166,600 | 11,901,662 |
| Thales SA | | 78,500 | 12,650,288 |
TOTAL FRANCE | | | 33,052,512 |
| Germany - 1.0% | | | |
| Deutsche Post AG ADR | | 365,511 | 14,682,405 |
| Infineon Technologies AG | | 310,800 | 9,828,937 |
| Stabilus Se | | 144,286 | 5,705,027 |
TOTAL GERMANY | | | 30,216,369 |
| Hong Kong - 0.6% | | | |
| Prudential PLC | | 2,394,386 | 19,932,904 |
| Hungary - 0.1% | | | |
| Richter Gedeon PLC | | 152,187 | 4,396,053 |
| India - 0.0% | | | |
| Pine Labs Private Ltd. (a)(b)(d) | | 792 | 294,806 |
| Indonesia - 0.7% | | | |
| PT Bank Central Asia Tbk | | 33,363,700 | 21,592,872 |
| Ireland - 0.8% | | | |
| AIB Group PLC | | 2,486,200 | 13,235,158 |
| Circle Internet Financial Ltd. Class F (b) | | 23,730 | 617,217 |
| Kingspan Group PLC (Ireland) | | 112,700 | 9,886,837 |
TOTAL IRELAND | | | 23,739,212 |
| Italy - 1.8% | | | |
| BFF Bank SpA (e) | | 1,389,790 | 13,567,903 |
| Interpump Group SpA | | 95,909 | 4,260,634 |
| Prada SpA | | 1,042,400 | 8,003,038 |
| Prysmian SpA | | 206,200 | 14,538,740 |
| Recordati SpA | | 147,500 | 8,359,087 |
| Ryanair Holdings PLC sponsored ADR | | 183,250 | 8,110,645 |
TOTAL ITALY | | | 56,840,047 |
| Japan - 3.3% | | | |
| Capcom Co. Ltd. | | 462,100 | 9,144,249 |
| Fuji Electric Co. Ltd. | | 94,100 | 4,792,316 |
| Hitachi Ltd. | | 598,500 | 15,037,229 |
| Itochu Corp. | | 217,100 | 10,739,466 |
| Katitas Co. Ltd. | | 695,700 | 8,820,812 |
| Mitsubishi Electric Corp. | | 477,400 | 8,398,674 |
| NOF Corp. | | 632,885 | 10,282,166 |
| Renesas Electronics Corp. | | 962,931 | 12,901,659 |
| Shin-Etsu Chemical Co. Ltd. | | 411,015 | 15,061,219 |
| USS Co. Ltd. | | 982,300 | 8,226,539 |
TOTAL JAPAN | | | 103,404,329 |
| Luxembourg - 0.1% | | | |
| CVC Capital Partners PLC (e) | | 142,255 | 2,984,894 |
| Novem Group SA (a)(c) | | 244,151 | 1,758,108 |
TOTAL LUXEMBOURG | | | 4,743,002 |
| Netherlands - 1.3% | | | |
| ASML Holding NV (Netherlands) | | 29,900 | 20,203,738 |
| BE Semiconductor Industries NV | | 45,000 | 4,794,041 |
| IMCD NV | | 37,651 | 5,981,460 |
| Wolters Kluwer NV | | 52,100 | 8,767,124 |
TOTAL NETHERLANDS | | | 39,746,363 |
| Norway - 0.3% | | | |
| TGS ASA | | 1,137,149 | 10,327,193 |
| Spain - 1.1% | | | |
| Aedas Homes SAU (e) | | 377,700 | 10,764,091 |
| CaixaBank SA (c) | | 2,237,300 | 13,633,577 |
| Neinor Homes SLU (e) | | 553,500 | 9,079,210 |
TOTAL SPAIN | | | 33,476,878 |
| Sweden - 3.3% | | | |
| Addlife AB B Shares | | 1,134,424 | 14,416,471 |
| Autoliv, Inc. (depository receipt) | | 145,077 | 13,510,228 |
| Dustin Group AB (a)(e) | | 8,145,810 | 5,776,086 |
| Evolution AB (e) | | 101,100 | 9,558,685 |
| Haypp Group AB (a) | | 607,852 | 4,073,436 |
| Hemnet Group AB | | 845,830 | 26,546,926 |
| HEXPOL AB (B Shares) | | 850,359 | 8,053,012 |
| JM AB | | 452,900 | 7,621,624 |
| Kry International AB (a)(b)(d) | | 22,735 | 476,547 |
| Munters Group AB (e) | | 892 | 14,408 |
| Swedbank AB (A Shares) | | 727,850 | 14,769,387 |
TOTAL SWEDEN | | | 104,816,810 |
| Taiwan - 0.5% | | | |
| E Ink Holdings, Inc. | | 1,806,000 | 16,957,778 |
| United Kingdom - 4.6% | | | |
| Baltic Classifieds Group PLC | | 3,304,800 | 13,444,636 |
| Beazley PLC | | 824,700 | 8,034,058 |
| Berkeley Group Holdings PLC | | 143,191 | 8,171,171 |
| Diageo PLC | | 334,973 | 10,344,562 |
| Flutter Entertainment PLC (a) | | 56,600 | 13,239,093 |
| Games Workshop Group PLC | | 112,318 | 17,321,482 |
| Harbour Energy PLC | | 1,922,571 | 6,852,120 |
| Hiscox Ltd. | | 1,449,247 | 20,219,675 |
| London Stock Exchange Group PLC | | 114,028 | 15,454,887 |
| RS GROUP PLC | | 1,071,095 | 9,598,808 |
| Sabre Insurance Group PLC (e) | | 6,755,301 | 11,916,132 |
| Softcat PLC | | 325,792 | 7,120,568 |
| WH Smith PLC | | 235,315 | 4,005,235 |
TOTAL UNITED KINGDOM | | | 145,722,427 |
| United States of America - 68.5% | | | |
| 3M Co. | | 11,000 | 1,413,170 |
| Abbott Laboratories | | 95,000 | 10,770,150 |
| Alaska Air Group, Inc. (a) | | 39,000 | 1,868,490 |
| Alphabet, Inc. Class A | | 439,000 | 75,117,290 |
| Amazon.com, Inc. (a) | | 451,000 | 84,066,400 |
| Ameriprise Financial, Inc. | | 5,000 | 2,551,500 |
| Apollo Global Management, Inc. | | 15,000 | 2,148,900 |
| Apple, Inc. | | 529,000 | 119,506,390 |
| AppLovin Corp. Class A, (a) | | 110,000 | 18,632,900 |
| Bank of New York Mellon Corp. | | 770,000 | 58,027,200 |
| Blue Bird Corp. (a) | | 20,000 | 842,200 |
| Boston Scientific Corp. (a) | | 421,000 | 35,372,420 |
| Broadcom, Inc. | | 306,000 | 51,949,620 |
| CarGurus, Inc. Class A (a) | | 16,000 | 496,320 |
| Carvana Co. Class A (a) | | 169,000 | 41,795,390 |
| CBRE Group, Inc. (a) | | 171,000 | 22,395,870 |
| Coherent Corp. (a) | | 17,000 | 1,571,480 |
| Coinbase Global, Inc. Class A (a) | | 28,000 | 5,019,000 |
| Constellation Energy Corp. | | 219,000 | 57,588,240 |
| Corpay, Inc. (a) | | 24,200 | 7,979,224 |
| Costco Wholesale Corp. | | 500 | 437,090 |
| Deckers Outdoor Corp. (a) | | 462,330 | 74,384,274 |
| Delta Air Lines, Inc. | | 31,000 | 1,773,820 |
| Dover Corp. | | 12,000 | 2,271,960 |
| Eaton Corp. PLC | | 207,700 | 68,869,166 |
| Eli Lilly & Co. | | 113,000 | 93,760,620 |
| Entergy Corp. | | 23,000 | 3,559,940 |
| Fidelity National Information Services, Inc. | | 68,000 | 6,101,640 |
| Fiserv, Inc. (a) | | 397,201 | 78,606,078 |
| Garmin Ltd. | | 7,000 | 1,388,450 |
| GE Vernova LLC | | 16,000 | 4,826,560 |
| Gilead Sciences, Inc. | | 39,000 | 3,463,980 |
| Herc Holdings, Inc. | | 103,000 | 21,541,420 |
| International Paper Co. | | 138,026 | 7,665,964 |
| Jones Lang LaSalle, Inc. (a) | | 77,000 | 20,863,920 |
| KBR, Inc. | | 496,000 | 33,236,960 |
| KKR & Co., Inc. Class A | | 18,000 | 2,488,320 |
| Leidos Holdings, Inc. | | 322,000 | 58,977,520 |
| Lithia Motors, Inc. Class A (sub. vtg.) | | 7,000 | 2,326,590 |
| Lowe's Companies, Inc. | | 35,000 | 9,164,050 |
| M&T Bank Corp. | | 343,000 | 66,775,240 |
| Marvell Technology, Inc. | | 196,276 | 15,723,670 |
| Masimo Corp. (a) | | 36,000 | 5,184,360 |
| Meta Platforms, Inc. Class A | | 260,000 | 147,570,800 |
| Micron Technology, Inc. | | 207,000 | 20,627,550 |
| Microsoft Corp. | | 319,000 | 129,625,650 |
| Modine Manufacturing Co. (a) | | 808,000 | 95,158,160 |
| Mueller Industries, Inc. | | 30,000 | 2,459,100 |
| NiSource, Inc. | | 15,000 | 527,400 |
| Norfolk Southern Corp. | | 21,000 | 5,259,030 |
| Northern Trust Corp. | | 145,636 | 14,639,331 |
| NVIDIA Corp. | | 1,326,000 | 176,039,759 |
| Oracle Corp. | | 79,000 | 13,259,360 |
| PACCAR, Inc. | | 21,000 | 2,189,880 |
| Parker Hannifin Corp. | | 30,000 | 19,022,100 |
| Patrick Industries, Inc. | | 211,160 | 26,601,937 |
| PayPal Holdings, Inc. (a) | | 65,000 | 5,154,500 |
| Philip Morris International, Inc. | | 31,000 | 4,113,700 |
| Powell Industries, Inc. | | 3,000 | 764,940 |
| PPL Corp. | | 74,000 | 2,409,440 |
| PROCEPT BioRobotics Corp. (a) | | 2,707 | 243,630 |
| Pure Storage, Inc. Class A (a) | | 254,200 | 12,722,710 |
| Raymond James Financial, Inc. | | 63,000 | 9,337,860 |
| Reddit, Inc. Class A | | 49,000 | 5,845,700 |
| Rivian Automotive, Inc. Class A (a) | | 100 | 1,010 |
| Robinhood Markets, Inc. (a) | | 284,000 | 6,671,160 |
| Roblox Corp. Class A (a) | | 5,000 | 258,600 |
| Service Corp. International | | 36,906 | 3,013,375 |
| Skechers U.S.A., Inc. Class A (sub. vtg.) (a) | | 10,600 | 651,476 |
| Stripe, Inc. Class B (a)(b)(d) | | 10,000 | 275,100 |
| T-Mobile U.S., Inc. | | 72,000 | 16,067,520 |
| Tesla, Inc. (a) | | 108,100 | 27,008,785 |
| The Home Depot, Inc. | | 63,000 | 24,806,250 |
| Thermo Fisher Scientific, Inc. | | 29,000 | 15,843,280 |
| Toast, Inc. (a) | | 15,000 | 450,450 |
| TPG, Inc. Class A | | 23,000 | 1,556,640 |
| Trane Technologies PLC | | 14,000 | 5,182,240 |
| TransUnion | | 496,000 | 50,244,800 |
| Twilio, Inc. Class A (a) | | 20,000 | 1,613,000 |
| United Airlines Holdings, Inc. (a) | | 91,000 | 7,121,660 |
| United Rentals, Inc. | | 73,000 | 59,334,400 |
| UnitedHealth Group, Inc. | | 17,000 | 9,596,500 |
| Vertiv Holdings Co. | | 51,000 | 5,573,790 |
| Vistra Corp. | | 44,000 | 5,498,240 |
| Walmart, Inc. | | 371,000 | 30,403,450 |
| West Pharmaceutical Services, Inc. | | 3,000 | 923,790 |
| Western Digital Corp. (a) | | 30,000 | 1,959,300 |
| Zebra Technologies Corp. Class A (a) | | 8,000 | 3,055,760 |
TOTAL UNITED STATES OF AMERICA | | | 2,153,186,859 |
| TOTAL COMMON STOCKS (Cost $2,188,941,239) | | | 3,115,556,434 |
| | | | |
| Convertible Preferred Stocks - 0.2% |
| | | Shares | Value ($) |
| China - 0.1% | | | |
| ByteDance Ltd. Series E1 (a)(b)(d) | | 14,425 | 3,594,277 |
| dMed Biopharmaceutical Co. Ltd. Series C (a)(b)(d) | | 138,905 | 752,865 |
TOTAL CHINA | | | 4,347,142 |
| India - 0.1% | | | |
| Pine Labs Private Ltd.: | | | |
| Series 1 (a)(b)(d) | | 1,892 | 704,259 |
| Series A (a)(b)(d) | | 473 | 176,065 |
| Series B (a)(b)(d) | | 514 | 191,326 |
| Series B2 (a)(b)(d) | | 416 | 154,848 |
| Series C (a)(b)(d) | | 774 | 288,106 |
| Series C1 (a)(b)(d) | | 163 | 60,673 |
| Series D (a)(b)(d) | | 174 | 64,768 |
TOTAL INDIA | | | 1,640,045 |
| United States of America - 0.0% | | | |
| Stripe, Inc. Series H (a)(b)(d) | | 29,122 | 801,146 |
| TOTAL CONVERTIBLE PREFERRED STOCKS (Cost $6,364,838) | | | 6,788,333 |
| | | | |
| Money Market Funds - 0.6% |
| | | Shares | Value ($) |
| Fidelity Cash Central Fund 4.87% (f) | | 11,618,833 | 11,621,157 |
| Fidelity Securities Lending Cash Central Fund 4.87% (f)(g) | | 5,135,813 | 5,136,327 |
| TOTAL MONEY MARKET FUNDS (Cost $16,756,966) | | | 16,757,484 |
| | | | |
| TOTAL INVESTMENT IN SECURITIES - 99.9% (Cost $2,212,063,043) | 3,139,102,251 |
NET OTHER ASSETS (LIABILITIES) - 0.1% | 4,567,812 |
| NET ASSETS - 100.0% | 3,143,670,063 |
| | |
Legend
| (c) | Security or a portion of the security is on loan at period end. |
| (d) | Restricted securities (including private placements) - Investment in securities not registered under the Securities Act of 1933 (excluding 144A issues). At the end of the period, the value of restricted securities (excluding 144A issues) amounted to $7,834,786 or 0.2% of net assets. |
| (e) | Security exempt from registration under Rule 144A of the Securities Act of 1933. These securities may be resold in transactions exempt from registration, normally to qualified institutional buyers. At the end of the period, the value of these securities amounted to $63,661,409 or 2.0% of net assets. |
| (f) | Affiliated fund that is generally available only to investment companies and other accounts managed by Fidelity Investments. The rate quoted is the annualized seven-day yield of the fund at period end. A complete unaudited listing of the fund's holdings as of its most recent quarter end is available upon request. In addition, each Fidelity Central Fund's financial statements, which are not covered by the Fund's Report of Independent Registered Public Accounting Firm, are available on the SEC's website or upon request. |
| (g) | Investment made with cash collateral received from securities on loan. |
| Additional information on each restricted holding is as follows: |
| Security | Acquisition Date | Acquisition Cost ($) |
| ByteDance Ltd. Series E1 | 11/18/20 | 1,580,608 |
| | | |
| dMed Biopharmaceutical Co. Ltd. Series C | 12/01/20 | 1,972,888 |
| | | |
| Kry International AB | 5/14/21 - 10/30/24 | 1,503,524 |
| | | |
| Pine Labs Private Ltd. | 6/30/21 | 295,305 |
| | | |
| Pine Labs Private Ltd. Series 1 | 6/30/21 | 705,451 |
| | | |
| Pine Labs Private Ltd. Series A | 6/30/21 | 176,363 |
| | | |
| Pine Labs Private Ltd. Series B | 6/30/21 | 191,650 |
| | | |
| Pine Labs Private Ltd. Series B2 | 6/30/21 | 155,110 |
| | | |
| Pine Labs Private Ltd. Series C | 6/30/21 | 288,594 |
| | | |
| Pine Labs Private Ltd. Series C1 | 6/30/21 | 60,776 |
| | | |
| Pine Labs Private Ltd. Series D | 6/30/21 | 64,878 |
| | | |
| Stripe, Inc. Class B | 5/18/21 | 401,284 |
| | | |
| Stripe, Inc. Series H | 3/15/21 - 5/25/23 | 1,168,520 |
| | | |
Affiliated Central Funds
Fiscal year to date information regarding the Fund's investments in Fidelity Central Funds, including the ownership percentage, is presented below.
| Affiliate | Value, beginning of period ($) | Purchases ($) | Sales Proceeds ($) | Dividend Income ($) | Realized Gain (loss) ($) | Change in Unrealized appreciation (depreciation) ($) | Value, end of period ($) | % ownership, end of period |
| Fidelity Cash Central Fund 4.87% | 19,652,388 | 1,496,934,698 | 1,504,965,819 | 1,858,316 | 2,836 | (2,946) | 11,621,157 | 0.0% |
| Fidelity Securities Lending Cash Central Fund 4.87% | 3,365,800 | 147,232,655 | 145,462,128 | 164,041 | - | - | 5,136,327 | 0.0% |
| Total | 23,018,188 | 1,644,167,353 | 1,650,427,947 | 2,022,357 | 2,836 | (2,946) | 16,757,484 | |
| | | | | | | | | |
Amounts in the dividend income column in the above table include any capital gain distributions from underlying funds, which are presented in the corresponding line item in the Statement of Operations, if applicable.
Amounts in the dividend income column for Fidelity Securities Lending Cash Central Fund represents the income earned on investing cash collateral, less rebates paid to borrowers and any lending agent fees associated with the loan, plus any premium payments received for lending certain types of securities.
Amounts included in the purchases and sales proceeds columns may include in-kind transactions, if applicable.
Investment Valuation
The following is a summary of the inputs used, as of October 31, 2024, involving the Fund's assets and liabilities carried at fair value. The inputs or methodology used for valuing securities may not be an indication of the risk associated with investing in those securities. For more information on valuation inputs, and their aggregation into the levels used below, please refer to the Investment Valuation section in the accompanying Notes to Financial Statements.
| Valuation Inputs at Reporting Date: |
| Description | Total ($) | Level 1 ($) | Level 2 ($) | Level 3 ($) |
Investments in Securities: | | | | |
|
| Equities: | | | | |
Communication Services | 327,837,674 | 285,347,792 | 38,895,605 | 3,594,277 |
Consumer Discretionary | 518,259,015 | 469,675,783 | 48,583,232 | - |
Consumer Staples | 63,147,780 | 34,954,240 | 28,193,540 | - |
Energy | 99,955,549 | 99,955,549 | - | - |
Financials | 446,148,986 | 363,844,434 | 81,687,335 | 617,217 |
Health Care | 264,233,874 | 238,210,232 | 25,270,777 | 752,865 |
Industrials | 514,674,494 | 461,024,404 | 53,650,090 | - |
Information Technology | 680,694,930 | 629,018,350 | 48,188,936 | 3,487,644 |
Materials | 61,837,998 | 31,441,261 | 30,396,737 | - |
Real Estate | 70,828,997 | 54,023,881 | 16,805,116 | - |
Utilities | 74,725,470 | 74,725,470 | - | - |
|
| Money Market Funds | 16,757,484 | 16,757,484 | - | - |
| Total Investments in Securities: | 3,139,102,251 | 2,758,978,880 | 371,671,368 | 8,452,003 |
Fidelity® Worldwide Fund
Financial Statements
| Statement of Assets and Liabilities |
As of October 31, 2024 |
| Assets | | | | |
| Investment in securities, at value (including securities loaned of $4,866,328) - See accompanying schedule: | | | | |
Unaffiliated issuers (cost $2,195,306,077) | $ | 3,122,344,767 | | |
Fidelity Central Funds (cost $16,756,966) | | 16,757,484 | | |
| | | | | |
| | | | | |
| Total Investment in Securities (cost $2,212,063,043) | | | $ | 3,139,102,251 |
| Foreign currency held at value (cost $665,707) | | | | 665,537 |
| Receivable for investments sold | | | | 30,205,716 |
| Receivable for fund shares sold | | | | 1,899,908 |
| Dividends receivable | | | | 1,431,355 |
| Reclaims receivable | | | | 2,873,771 |
| Distributions receivable from Fidelity Central Funds | | | | 182,435 |
| Prepaid expenses | | | | 4,083 |
| Other receivables | | | | 49,368 |
Total assets | | | | 3,176,414,424 |
| Liabilities | | | | |
| Payable to custodian bank | $ | 580,408 | | |
| Payable for investments purchased | | 23,296,189 | | |
| Payable for fund shares redeemed | | 1,650,027 | | |
| Accrued management fee | | 1,913,492 | | |
| Distribution and service plan fees payable | | 43,069 | | |
| Other payables and accrued expenses | | 124,849 | | |
| Collateral on securities loaned | | 5,136,327 | | |
| Total liabilities | | | | 32,744,361 |
| Net Assets | | | $ | 3,143,670,063 |
| Net Assets consist of: | | | | |
| Paid in capital | | | $ | 1,828,156,870 |
| Total accumulated earnings (loss) | | | | 1,315,513,193 |
| Net Assets | | | $ | 3,143,670,063 |
| | | | | |
| Net Asset Value and Maximum Offering Price | | | | |
| Class A : | | | | |
Net Asset Value and redemption price per share ($112,958,854 ÷ 2,954,752 shares)(a) | | | $ | 38.23 |
| Maximum offering price per share (100/94.25 of $38.23) | | | $ | 40.56 |
| Class M : | | | | |
Net Asset Value and redemption price per share ($23,274,926 ÷ 615,835 shares)(a) | | | $ | 37.79 |
| Maximum offering price per share (100/96.50 of $37.79) | | | $ | 39.16 |
| Class C : | | | | |
Net Asset Value and offering price per share ($10,681,238 ÷ 297,928 shares)(a) | | | $ | 35.85 |
| Worldwide : | | | | |
Net Asset Value, offering price and redemption price per share ($2,836,497,962 ÷ 72,734,906 shares) | | | $ | 39.00 |
| Class I : | | | | |
Net Asset Value, offering price and redemption price per share ($65,286,119 ÷ 1,687,475 shares) | | | $ | 38.69 |
| Class Z : | | | | |
Net Asset Value, offering price and redemption price per share ($94,970,964 ÷ 2,458,279 shares) | | | $ | 38.63 |
(a)Redemption price per share is equal to net asset value less any applicable contingent deferred sales charge. |
| Statement of Operations |
| Year ended October 31, 2024 |
| Investment Income | | | | |
| Dividends | | | $ | 38,704,477 |
| Interest | | | | 8,564 |
| Income from Fidelity Central Funds (including $164,041 from security lending) | | | | 2,022,357 |
| Income before foreign taxes withheld | | | $ | 40,735,398 |
| Less foreign taxes withheld | | | | (2,210,542) |
| Total income | | | | 38,524,856 |
| Expenses | | | | |
| Management fee | | | | |
| Basic fee | $ | 22,866,198 | | |
| Performance adjustment | | (3,135,276) | | |
| Transfer agent fees | | 1,293,423 | | |
| Distribution and service plan fees | | 443,969 | | |
| Accounting fees | | 234,448 | | |
| Custodian fees and expenses | | 90,395 | | |
| Independent trustees' fees and expenses | | 13,385 | | |
| Registration fees | | 142,695 | | |
| Audit fees | | 77,816 | | |
| Legal | | 13,341 | | |
| Interest | | 17,495 | | |
| Miscellaneous | | 66,737 | | |
| Total expenses before reductions | | 22,124,626 | | |
| Expense reductions | | (122,837) | | |
| Total expenses after reductions | | | | 22,001,789 |
| Net Investment income (loss) | | | | 16,523,067 |
| Realized and Unrealized Gain (Loss) | | | | |
| Net realized gain (loss) on: | | | | |
| Investment Securities: | | | | |
| Unaffiliated issuers (net of foreign taxes of $11,199) | | 447,325,199 | | |
| Fidelity Central Funds | | 2,836 | | |
| Foreign currency transactions | | (322,154) | | |
| Total net realized gain (loss) | | | | 447,005,881 |
| Change in net unrealized appreciation (depreciation) on: | | | | |
| Investment Securities: | | | | |
| Unaffiliated issuers | | 562,786,720 | | |
| Fidelity Central Funds | | (2,946) | | |
| Assets and liabilities in foreign currencies | | 49,595 | | |
| Total change in net unrealized appreciation (depreciation) | | | | 562,833,369 |
| Net gain (loss) | | | | 1,009,839,250 |
| Net increase (decrease) in net assets resulting from operations | | | $ | 1,026,362,317 |
| Statement of Changes in Net Assets |
| |
| | Year ended October 31, 2024 | | Year ended October 31, 2023 |
| Increase (Decrease) in Net Assets | | | | |
| Operations | | | | |
| Net investment income (loss) | $ | 16,523,067 | $ | 15,465,709 |
| Net realized gain (loss) | | 447,005,881 | | 2,655,472 |
| Change in net unrealized appreciation (depreciation) | | 562,833,369 | | 205,529,918 |
| Net increase (decrease) in net assets resulting from operations | | 1,026,362,317 | | 223,651,099 |
| Distributions to shareholders | | (24,710,933) | | (124,836,814) |
| | | | | |
| Share transactions - net increase (decrease) | | (96,724,546) | | 37,686,493 |
| | | | | |
| Total increase (decrease) in net assets | | 904,926,838 | | 136,500,778 |
| | | | | |
| Net Assets | | | | |
| Beginning of period | | 2,238,743,225 | | 2,102,242,447 |
| End of period | $ | 3,143,670,063 | $ | 2,238,743,225 |
| | | | | |
| | | | | |
Financial Highlights
Fidelity Advisor® Worldwide Fund Class A |
| |
| Years ended October 31, | | 2024 | | 2023 | | 2022 | | 2021 | | 2020 |
Selected Per-Share Data | | | | | | | | | | |
| Net asset value, beginning of period | $ | 26.90 | $ | 25.75 | $ | 40.06 | $ | 31.49 | $ | 27.36 |
| Income from Investment Operations | | | | | | | | | | |
Net investment income (loss) A,B | | .09 | | .11 | | .09 | | (.13) | | (.05) |
| Net realized and unrealized gain (loss) | | 11.44 | | 2.52 | | (9.90) | | 11.40 | | 5.50 |
| Total from investment operations | | 11.53 | | 2.63 | | (9.81) | | 11.27 | | 5.45 |
| Distributions from net investment income | | (.20) | | (.11) | | (.07) | | - | | (.12) |
| Distributions from net realized gain | | - | | (1.37) | | (4.43) | | (2.70) | | (1.20) |
| Total distributions | | (.20) | | (1.48) | | (4.50) | | (2.70) | | (1.32) |
| Net asset value, end of period | $ | 38.23 | $ | 26.90 | $ | 25.75 | $ | 40.06 | $ | 31.49 |
Total Return C,D | | | | 10.62% | | (27.31)% | | 37.72% | | 20.72% |
Ratios to Average Net Assets B,E,F | | | | | | | | | | |
| Expenses before reductions | | .99% | | .96% | | 1.21% | | 1.29% | | 1.34% |
| Expenses net of fee waivers, if any | | | | .95% | | 1.21% | | 1.28% | | 1.34% |
| Expenses net of all reductions | | .99% | | .95% | | 1.21% | | 1.28% | | 1.33% |
| Net investment income (loss) | | .25% | | .41% | | .28% | | (.34)% | | (.18)% |
| Supplemental Data | | | | | | | | | | |
| Net assets, end of period (000 omitted) | $ | 112,959 | $ | 73,935 | $ | 68,608 | $ | 99,731 | $ | 63,690 |
Portfolio turnover rate G | | | | 114% | | 137% | | 96% | | 112% |
ACalculated based on average shares outstanding during the period.
BNet investment income (loss) is affected by the timing of the declaration of dividends by any underlying mutual funds or exchange-traded funds (ETFs). Net investment income (loss) of any mutual funds or ETFs is not included in the Fund's net investment income (loss) ratio.
CTotal returns would have been lower if certain expenses had not been reduced during the applicable periods shown.
DTotal returns do not include the effect of the sales charges.
EFees and expenses of any underlying mutual funds or exchange-traded funds (ETFs) are not included in the Fund's expense ratio. The Fund indirectly bears its proportionate share of these expenses. For additional expense information related to investments in Fidelity Central Funds, please refer to the "Investments in Fidelity Central Funds" note found in the Notes to Financial Statements section of the most recent Annual or Semi-Annual report.
FExpense ratios reflect operating expenses of the class. Expenses before reductions do not reflect amounts reimbursed, waived, or reduced through arrangements with the investment adviser, brokerage services, or other offset arrangements, if applicable, and do not represent the amount paid by the class during periods when reimbursements, waivers or reductions occur.
GAmount does not include the portfolio activity of any underlying mutual funds or exchange-traded funds (ETFs).
Fidelity Advisor® Worldwide Fund Class M |
| |
| Years ended October 31, | | 2024 | | 2023 | | 2022 | | 2021 | | 2020 |
Selected Per-Share Data | | | | | | | | | | |
| Net asset value, beginning of period | $ | 26.60 | $ | 25.44 | $ | 39.62 | $ | 31.19 | $ | 27.10 |
| Income from Investment Operations | | | | | | | | | | |
Net investment income (loss) A,B | | - C | | .04 | | .01 | | (.22) | | (.13) |
| Net realized and unrealized gain (loss) | | 11.32 | | 2.51 | | (9.81) | | 11.29 | | 5.46 |
| Total from investment operations | | 11.32 | | 2.55 | | (9.80) | | 11.07 | | 5.33 |
| Distributions from net investment income | | (.13) | | (.02) | | - | | - | | (.04) |
| Distributions from net realized gain | | - | | (1.37) | | (4.38) | | (2.64) | | (1.20) |
| Total distributions | | (.13) | | (1.39) | | (4.38) | | (2.64) | | (1.24) |
| Net asset value, end of period | $ | 37.79 | $ | 26.60 | $ | 25.44 | $ | 39.62 | $ | 31.19 |
Total Return D,E | | | | 10.39% | | (27.53)% | | 37.37% | | 20.40% |
Ratios to Average Net Assets B,F,G | | | | | | | | | | |
| Expenses before reductions | | 1.24% | | 1.21% | | 1.47% | | 1.55% | | 1.61% |
| Expenses net of fee waivers, if any | | | | 1.21% | | 1.47% | | 1.55% | | 1.61% |
| Expenses net of all reductions | | 1.24% | | 1.20% | | 1.47% | | 1.55% | | 1.61% |
| Net investment income (loss) | | -% | | .15% | | .02% | | (.61)% | | (.45)% |
| Supplemental Data | | | | | | | | | | |
| Net assets, end of period (000 omitted) | $ | 23,275 | $ | 16,051 | $ | 15,275 | $ | 22,771 | $ | 17,387 |
Portfolio turnover rate H | | | | 114% | | 137% | | 96% | | 112% |
ACalculated based on average shares outstanding during the period.
BNet investment income (loss) is affected by the timing of the declaration of dividends by any underlying mutual funds or exchange-traded funds (ETFs). Net investment income (loss) of any mutual funds or ETFs is not included in the Fund's net investment income (loss) ratio.
CAmount represents less than $.005 per share.
DTotal returns would have been lower if certain expenses had not been reduced during the applicable periods shown.
ETotal returns do not include the effect of the sales charges.
FFees and expenses of any underlying mutual funds or exchange-traded funds (ETFs) are not included in the Fund's expense ratio. The Fund indirectly bears its proportionate share of these expenses. For additional expense information related to investments in Fidelity Central Funds, please refer to the "Investments in Fidelity Central Funds" note found in the Notes to Financial Statements section of the most recent Annual or Semi-Annual report.
GExpense ratios reflect operating expenses of the class. Expenses before reductions do not reflect amounts reimbursed, waived, or reduced through arrangements with the investment adviser, brokerage services, or other offset arrangements, if applicable, and do not represent the amount paid by the class during periods when reimbursements, waivers or reductions occur.
HAmount does not include the portfolio activity of any underlying mutual funds or exchange-traded funds (ETFs).
Fidelity Advisor® Worldwide Fund Class C |
| |
| Years ended October 31, | | 2024 | | 2023 | | 2022 | | 2021 | | 2020 |
Selected Per-Share Data | | | | | | | | | | |
| Net asset value, beginning of period | $ | 25.25 | $ | 24.33 | $ | 38.05 | $ | 30.14 | $ | 26.33 |
| Income from Investment Operations | | | | | | | | | | |
Net investment income (loss) A,B | | (.17) | | (.10) | | (.15) | | (.39) | | (.27) |
| Net realized and unrealized gain (loss) | | 10.77 | | 2.39 | | (9.39) | | 10.88 | | 5.28 |
| Total from investment operations | | 10.60 | | 2.29 | | (9.54) | | 10.49 | | 5.01 |
| Distributions from net realized gain | | - | | (1.37) | | (4.18) | | (2.58) | | (1.20) |
| Total distributions | | - | | (1.37) | | (4.18) | | (2.58) | | (1.20) |
| Net asset value, end of period | $ | 35.85 | $ | 25.25 | $ | 24.33 | $ | 38.05 | $ | 30.14 |
Total Return C,D | | | | 9.76% | | (27.89)% | | 36.63% | | 19.76% |
Ratios to Average Net Assets B,E,F | | | | | | | | | | |
| Expenses before reductions | | 1.74% | | 1.76% | | 2.00% | | 2.08% | | 2.14% |
| Expenses net of fee waivers, if any | | | | 1.75% | | 2.00% | | 2.08% | | 2.14% |
| Expenses net of all reductions | | 1.74% | | 1.75% | | 2.00% | | 2.08% | | 2.13% |
| Net investment income (loss) | | (.51)% | | (.39)% | | (.51)% | | (1.14)% | | (.98)% |
| Supplemental Data | | | | | | | | | | |
| Net assets, end of period (000 omitted) | $ | 10,681 | $ | 7,292 | $ | 8,517 | $ | 13,602 | $ | 11,677 |
Portfolio turnover rate G | | | | 114% | | 137% | | 96% | | 112% |
ACalculated based on average shares outstanding during the period.
BNet investment income (loss) is affected by the timing of the declaration of dividends by any underlying mutual funds or exchange-traded funds (ETFs). Net investment income (loss) of any mutual funds or ETFs is not included in the Fund's net investment income (loss) ratio.
CTotal returns would have been lower if certain expenses had not been reduced during the applicable periods shown.
DTotal returns do not include the effect of the contingent deferred sales charge.
EFees and expenses of any underlying mutual funds or exchange-traded funds (ETFs) are not included in the Fund's expense ratio. The Fund indirectly bears its proportionate share of these expenses. For additional expense information related to investments in Fidelity Central Funds, please refer to the "Investments in Fidelity Central Funds" note found in the Notes to Financial Statements section of the most recent Annual or Semi-Annual report.
FExpense ratios reflect operating expenses of the class. Expenses before reductions do not reflect amounts reimbursed, waived, or reduced through arrangements with the investment adviser, brokerage services, or other offset arrangements, if applicable, and do not represent the amount paid by the class during periods when reimbursements, waivers or reductions occur.
GAmount does not include the portfolio activity of any underlying mutual funds or exchange-traded funds (ETFs).
| Years ended October 31, | | 2024 | | 2023 | | 2022 | | 2021 | | 2020 |
Selected Per-Share Data | | | | | | | | | | |
| Net asset value, beginning of period | $ | 27.44 | $ | 26.26 | $ | 40.76 | $ | 31.97 | $ | 27.74 |
| Income from Investment Operations | | | | | | | | | | |
Net investment income (loss) A,B | | .19 | | .19 | | .18 | | (.02) | | .03 |
| Net realized and unrealized gain (loss) | | 11.66 | | 2.57 | | (10.09) | | 11.58 | | 5.58 |
| Total from investment operations | | 11.85 | | 2.76 | | (9.91) | | 11.56 | | 5.61 |
| Distributions from net investment income | | (.29) | | (.21) | | (.16) | | (.02) | | (.18) |
| Distributions from net realized gain | | - | | (1.37) | | (4.43) | | (2.75) | | (1.20) |
| Total distributions | | (.29) | | (1.58) | | (4.59) | | (2.77) | | (1.38) |
| Net asset value, end of period | $ | 39.00 | $ | 27.44 | $ | 26.26 | $ | 40.76 | $ | 31.97 |
Total Return C | | | | 10.95% | | (27.12)% | | 38.11% | | 21.07% |
Ratios to Average Net Assets B,D,E | | | | | | | | | | |
| Expenses before reductions | | .70% | | .67% | | .92% | | 1.00% | | 1.05% |
| Expenses net of fee waivers, if any | | | | .66% | | .92% | | 1.00% | | 1.05% |
| Expenses net of all reductions | | .70% | | .66% | | .92% | | 1.00% | | 1.05% |
| Net investment income (loss) | | .54% | | .70% | | .57% | | (.06)% | | .11% |
| Supplemental Data | | | | | | | | | | |
| Net assets, end of period (000 omitted) | $ | 2,836,498 | $ | 1,982,943 | $ | 1,899,788 | $ | 2,896,684 | $ | 2,217,129 |
Portfolio turnover rate F | | | | 114% | | 137% | | 96% | | 112% |
ACalculated based on average shares outstanding during the period.
BNet investment income (loss) is affected by the timing of the declaration of dividends by any underlying mutual funds or exchange-traded funds (ETFs). Net investment income (loss) of any mutual funds or ETFs is not included in the Fund's net investment income (loss) ratio.
CTotal returns would have been lower if certain expenses had not been reduced during the applicable periods shown.
DFees and expenses of any underlying mutual funds or exchange-traded funds (ETFs) are not included in the Fund's expense ratio. The Fund indirectly bears its proportionate share of these expenses. For additional expense information related to investments in Fidelity Central Funds, please refer to the "Investments in Fidelity Central Funds" note found in the Notes to Financial Statements section of the most recent Annual or Semi-Annual report.
EExpense ratios reflect operating expenses of the class. Expenses before reductions do not reflect amounts reimbursed, waived, or reduced through arrangements with the investment adviser, brokerage services, or other offset arrangements, if applicable, and do not represent the amount paid by the class during periods when reimbursements, waivers or reductions occur.
FAmount does not include the portfolio activity of any underlying mutual funds or exchange-traded funds (ETFs).
Fidelity Advisor® Worldwide Fund Class I |
| |
| Years ended October 31, | | 2024 | | 2023 | | 2022 | | 2021 | | 2020 |
Selected Per-Share Data | | | | | | | | | | |
| Net asset value, beginning of period | $ | 27.23 | $ | 26.04 | $ | 40.46 | $ | 31.77 | $ | 27.58 |
| Income from Investment Operations | | | | | | | | | | |
Net investment income (loss) A,B | | .18 | | .19 | | .17 | | (.03) | | .03 |
| Net realized and unrealized gain (loss) | | 11.57 | | 2.56 | | (10.01) | | 11.49 | | 5.55 |
| Total from investment operations | | 11.75 | | 2.75 | | (9.84) | | 11.46 | | 5.58 |
| Distributions from net investment income | | (.29) | | (.19) | | (.16) | | (.02) | | (.19) |
| Distributions from net realized gain | | - | | (1.37) | | (4.43) | | (2.75) | | (1.20) |
| Total distributions | | (.29) | | (1.56) | | (4.58) C | | (2.77) | | (1.39) |
| Net asset value, end of period | $ | 38.69 | $ | 27.23 | $ | 26.04 | $ | 40.46 | $ | 31.77 |
Total Return D | | | | 10.97% | | (27.13)% | | 38.06% | | 21.08% |
Ratios to Average Net Assets B,E,F | | | | | | | | | | |
| Expenses before reductions | | .73% | | .67% | | .94% | | 1.02% | | 1.06% |
| Expenses net of fee waivers, if any | | | | .67% | | .93% | | 1.02% | | 1.06% |
| Expenses net of all reductions | | .72% | | .67% | | .93% | | 1.02% | | 1.05% |
| Net investment income (loss) | | .51% | | .69% | | .56% | | (.08)% | | .10% |
| Supplemental Data | | | | | | | | | | |
| Net assets, end of period (000 omitted) | $ | 65,286 | $ | 41,289 | $ | 33,226 | $ | 86,852 | $ | 64,615 |
Portfolio turnover rate G | | | | 114% | | 137% | | 96% | | 112% |
ACalculated based on average shares outstanding during the period.
BNet investment income (loss) is affected by the timing of the declaration of dividends by any underlying mutual funds or exchange-traded funds (ETFs). Net investment income (loss) of any mutual funds or ETFs is not included in the Fund's net investment income (loss) ratio.
CTotal distributions per share do not sum due to rounding.
DTotal returns would have been lower if certain expenses had not been reduced during the applicable periods shown.
EFees and expenses of any underlying mutual funds or exchange-traded funds (ETFs) are not included in the Fund's expense ratio. The Fund indirectly bears its proportionate share of these expenses. For additional expense information related to investments in Fidelity Central Funds, please refer to the "Investments in Fidelity Central Funds" note found in the Notes to Financial Statements section of the most recent Annual or Semi-Annual report.
FExpense ratios reflect operating expenses of the class. Expenses before reductions do not reflect amounts reimbursed, waived, or reduced through arrangements with the investment adviser, brokerage services, or other offset arrangements, if applicable, and do not represent the amount paid by the class during periods when reimbursements, waivers or reductions occur.
GAmount does not include the portfolio activity of any underlying mutual funds or exchange-traded funds (ETFs).
Fidelity Advisor® Worldwide Fund Class Z |
| |
| Years ended October 31, | | 2024 | | 2023 | | 2022 | | 2021 | | 2020 |
Selected Per-Share Data | | | | | | | | | | |
| Net asset value, beginning of period | $ | 27.20 | $ | 26.05 | $ | 40.48 | $ | 31.76 | $ | 27.59 |
| Income from Investment Operations | | | | | | | | | | |
Net investment income (loss) A,B | | .22 | | .22 | | .21 | | .02 | | .07 |
| Net realized and unrealized gain (loss) | | 11.55 | | 2.55 | | (10.01) | | 11.50 | | 5.53 |
| Total from investment operations | | 11.77 | | 2.77 | | (9.80) | | 11.52 | | 5.60 |
| Distributions from net investment income | | (.34) | | (.25) | | (.20) | | (.05) | | (.23) |
| Distributions from net realized gain | | - | | (1.37) | | (4.43) | | (2.75) | | (1.20) |
| Total distributions | | (.34) | | (1.62) | | (4.63) | | (2.80) | | (1.43) |
| Net asset value, end of period | $ | 38.63 | $ | 27.20 | $ | 26.05 | $ | 40.48 | $ | 31.76 |
Total Return C | | | | 11.10% | | (27.05)% | | 38.27% | | 21.19% |
Ratios to Average Net Assets B,D,E | | | | | | | | | | |
| Expenses before reductions | | .62% | | .55% | | .81% | | .90% | | .93% |
| Expenses net of fee waivers, if any | | | | .55% | | .81% | | .90% | | .93% |
| Expenses net of all reductions | | .61% | | .55% | | .81% | | .90% | | .93% |
| Net investment income (loss) | | .62% | | .81% | | .68% | | .04% | | .23% |
| Supplemental Data | | | | | | | | | | |
| Net assets, end of period (000 omitted) | $ | 94,971 | $ | 117,232 | $ | 76,829 | $ | 115,963 | $ | 71,278 |
Portfolio turnover rate F | | | | 114% | | 137% | | 96% | | 112% |
ACalculated based on average shares outstanding during the period.
BNet investment income (loss) is affected by the timing of the declaration of dividends by any underlying mutual funds or exchange-traded funds (ETFs). Net investment income (loss) of any mutual funds or ETFs is not included in the Fund's net investment income (loss) ratio.
CTotal returns would have been lower if certain expenses had not been reduced during the applicable periods shown.
DFees and expenses of any underlying mutual funds or exchange-traded funds (ETFs) are not included in the Fund's expense ratio. The Fund indirectly bears its proportionate share of these expenses. For additional expense information related to investments in Fidelity Central Funds, please refer to the "Investments in Fidelity Central Funds" note found in the Notes to Financial Statements section of the most recent Annual or Semi-Annual report.
EExpense ratios reflect operating expenses of the class. Expenses before reductions do not reflect amounts reimbursed, waived, or reduced through arrangements with the investment adviser, brokerage services, or other offset arrangements, if applicable, and do not represent the amount paid by the class during periods when reimbursements, waivers or reductions occur.
FAmount does not include the portfolio activity of any underlying mutual funds or exchange-traded funds (ETFs).
Notes to Financial Statements
For the period ended October 31, 2024
1. Organization.
Fidelity Worldwide Fund (the Fund) is a fund of Fidelity Investment Trust (the Trust) and is authorized to issue an unlimited number of shares. The Trust is registered under the Investment Company Act of 1940, as amended (the 1940 Act), as an open-end management investment company organized as a Massachusetts business trust. The Fund offers Class A, Class M, Class C, Worldwide, Class I and Class Z shares, each of which has equal rights as to assets and voting privileges. Class A, Class M, Class C, Class I and Class Z are Fidelity Advisor classes. Each class has exclusive voting rights with respect to matters that affect that class. Class C shares will automatically convert to Class A shares after a holding period of eight years from the initial date of purchase, with certain exceptions.
2. Investments in Fidelity Central Funds.
Funds may invest in Fidelity Central Funds, which are open-end investment companies generally available only to other investment companies and accounts managed by the investment adviser and its affiliates. The Schedule of Investments lists any Fidelity Central Funds held as an investment as of period end, but does not include the underlying holdings of each Fidelity Central Fund. An investing fund indirectly bears its proportionate share of the expenses of the underlying Fidelity Central Funds.
Based on its investment objective, each Fidelity Central Fund may invest or participate in various investment vehicles or strategies that are similar to those of the investing fund. These strategies are consistent with the investment objectives of the investing fund and may involve certain economic risks which may cause a decline in value of each of the Fidelity Central Funds and thus a decline in the value of the investing fund.
| Fidelity Central Fund | Investment Manager | Investment Objective | Investment Practices | Expense RatioA |
| Fidelity Money Market Central Funds | Fidelity Management & Research Company LLC (FMR) | Each fund seeks to obtain a high level of current income consistent with the preservation of capital and liquidity. | Short-term Investments | Less than .005% |
A Expenses expressed as a percentage of average net assets and are as of each underlying Central Fund's most recent annual or semi-annual shareholder report.
A complete unaudited list of holdings for each Fidelity Central Fund is available upon request or at the Securities and Exchange Commission website at www.sec.gov. In addition, the financial statements of the Fidelity Central Funds which contain the significant accounting policies (including investment valuation policies) of those funds, and are not covered by the Report of Independent Registered Public Accounting Firm, are available on the Securities and Exchange Commission website or upon request.
3. Significant Accounting Policies.
The Fund is an investment company and applies the accounting and reporting guidance of the Financial Accounting Standards Board (FASB) Accounting Standards Codification Topic 946 Financial Services - Investment Companies. The financial statements have been prepared in conformity with accounting principles generally accepted in the United States of America (GAAP), which require management to make certain estimates and assumptions at the date of the financial statements. Actual results could differ from those estimates. Subsequent events, if any, through the date that the financial statements were issued have been evaluated in the preparation of the financial statements. The Fund's Schedule of Investments lists any underlying mutual funds or exchange-traded funds (ETFs) but does not include the underlying holdings of these funds. The following summarizes the significant accounting policies of the Fund:
Investment Valuation. Investments are valued as of 4:00 p.m. Eastern time on the last calendar day of the period. The Board of Trustees (the Board) has designated the Fund's investment adviser as the valuation designee responsible for the fair valuation function and performing fair value determinations as needed. The investment adviser has established a Fair Value Committee (the Committee) to carry out the day-to-day fair valuation responsibilities and has adopted policies and procedures to govern the fair valuation process and the activities of the Committee. In accordance with these fair valuation policies and procedures, which have been approved by the Board, the Fund attempts to obtain prices from one or more third party pricing services or brokers to value its investments. When current market prices, quotations or currency exchange rates are not readily available or reliable, investments will be fair valued in good faith by the Committee, in accordance with the policies and procedures. Factors used in determining fair value vary by investment type and may include market or investment specific events, transaction data, estimated cash flows, and market observations of comparable investments. The frequency that the fair valuation procedures are used cannot be predicted and they may be utilized to a significant extent. The Committee manages the Fund's fair valuation practices and maintains the fair valuation policies and procedures. The Fund's investment adviser reports to the Board information regarding the fair valuation process and related material matters.
The Fund categorizes the inputs to valuation techniques used to value its investments into a disclosure hierarchy consisting of three levels as shown below:
Level 1 - unadjusted quoted prices in active markets for identical investments
Level 2 - other significant observable inputs (including quoted prices for similar investments, interest rates, prepayment speeds, etc.)
Level 3 - unobservable inputs (including the Fund's own assumptions based on the best information available)
Valuation techniques used to value the Fund's investments by major category are as follows:
Equity securities, including restricted securities, for which market quotations are readily available, are valued at the last reported sale price or official closing price as reported by a third party pricing service on the primary market or exchange on which they are traded and are categorized as Level 1 in the hierarchy. In the event there were no sales during the day or closing prices are not available, securities are valued at the last quoted bid price or may be valued using the last available price and are generally categorized as Level 2 in the hierarchy. For foreign equity securities, when market or security specific events arise, comparisons to the valuation of American Depositary Receipts (ADRs), futures contracts, Exchange-Traded Funds (ETFs) and certain indexes as well as quoted prices for similar securities may be used and would be categorized as Level 2 in the hierarchy. For equity securities, including restricted securities, where observable inputs are limited, assumptions about market activity and risk are used and these securities may be categorized as Level 3 in the hierarchy.
Investments in open-end mutual funds, including the Fidelity Central Funds, are valued at their closing net asset value (NAV) each business day and are categorized as Level 1 in the hierarchy
Changes in valuation techniques may result in transfers in or out of an assigned level within the disclosure hierarchy. The aggregate value of investments by input level as of October 31, 2024 is included at the end of the Fund's Schedule of Investments.
Foreign Currency. Certain Funds may use foreign currency contracts to facilitate transactions in foreign-denominated securities. Gains and losses from these transactions may arise from changes in the value of the foreign currency or if the counterparties do not perform under the contracts' terms.
Foreign-denominated assets, including investment securities, and liabilities are translated into U.S. dollars at the exchange rates at period end. Purchases and sales of investment securities, income and dividends received, and expenses denominated in foreign currencies are translated into U.S. dollars at the exchange rate in effect on the transaction date.
The effects of exchange rate fluctuations on investments are included with the net realized and unrealized gain (loss) on investment securities. Other foreign currency transactions resulting in realized and unrealized gain (loss) are disclosed separately.
Investment Transactions and Income. For financial reporting purposes, the Fund's investment holdings and NAV include trades executed through the end of the last business day of the period. The NAV per share for processing shareholder transactions is calculated as of the close of business of the New York Stock Exchange (NYSE), normally 4:00 p.m. Eastern time and includes trades executed through the end of the prior business day. Gains and losses on securities sold are determined on the basis of identified cost and include proceeds received from litigation. Commissions paid to certain brokers with whom the investment adviser, or its affiliates, places trades on behalf of a fund include an amount in addition to trade execution, which may be rebated back to a fund. Any such rebates are included in net realized gain (loss) on investments in the Statement of Operations. Dividend income is recorded on the ex-dividend date, except for certain dividends from foreign securities where the ex-dividend date may have passed, which are recorded as soon as the Fund is informed of the ex-dividend date. Non-cash dividends included in dividend income, if any, are recorded at the fair market value of the securities received. Income and capital gain distributions from Fidelity Central Funds, if any, are recorded on the ex-dividend date. Certain distributions received by the Fund represent a return of capital or capital gain. The Fund determines the components of these distributions subsequent to the ex-dividend date, based upon receipt of tax filings or other correspondence relating to the underlying investment. These distributions are recorded as a reduction of cost of investments and/or as a realized gain. Interest income is accrued as earned and includes coupon interest and amortization of premium and accretion of discount on debt securities as applicable. Investment income is recorded net of foreign taxes withheld where recovery of such taxes is uncertain. Funds may file withholding tax reclaims in certain jurisdictions to recover a portion of amounts previously withheld. Any withholding tax reclaims income is included in the Statement of Operations in foreign taxes withheld. Any receivables for withholding tax reclaims are included in the Statement of Assets and Liabilities in reclaims receivable. The Fund has filed tax reclaims for previously withheld taxes on dividends earned in certain European Union (EU) countries. These additional filings are subject to various administrative proceedings by the local jurisdictions' tax authorities within the EU, as well as a number of related judicial proceedings. Income recognized for EU reclaims is included with other reclaims in the Statement of Operations in foreign taxes withheld. These reclaims are recorded when the amount is known and there are no significant uncertainties on collectability.
Class Allocations and Expenses. Investment income, realized and unrealized capital gains and losses, common expenses of a fund, and certain fund-level expense reductions, if any, are allocated daily on a pro-rata basis to each class based on the relative net assets of each class to the total net assets of a fund. Each class differs with respect to transfer agent and distribution and service plan fees incurred, as applicable. Certain expense reductions may also differ by class, if applicable. For the reporting period, the allocated portion of income and expenses to each class as a percent of its average net assets may vary due to the timing of recording these transactions in relation to fluctuating net assets of the classes. Expenses directly attributable to a fund are charged to that fund. Expenses attributable to more than one fund are allocated among the respective funds on the basis of relative net assets or other appropriate methods. Expenses included in the accompanying financial statements reflect the expenses of that fund and do not include any expenses associated with any underlying mutual funds or exchange-traded funds (ETFs). Although not included in a fund's expenses, a fund indirectly bears its proportionate share of these expenses through the net asset value of each underlying mutual fund or exchange-traded fund (ETF). Expense estimates are accrued in the period to which they relate and adjustments are made when actual amounts are known.
Income Tax Information and Distributions to Shareholders. Each year, the Fund intends to qualify as a regulated investment company under Subchapter M of the Internal Revenue Code, including distributing substantially all of its taxable income and realized gains. As a result, no provision for U.S. Federal income taxes is required. As of October 31, 2024, the Fund did not have any unrecognized tax benefits in the financial statements; nor is the Fund aware of any tax positions for which it is reasonably possible that the total amounts of unrecognized tax benefits will significantly change in the next twelve months. The Fund files a U.S. federal tax return, in addition to state and local tax returns as required. The Fund's federal income tax returns are subject to examination by the Internal Revenue Service (IRS) for a period of three fiscal years after they are filed. State and local tax returns may be subject to examination for an additional fiscal year depending on the jurisdiction. Foreign taxes are provided for based on the Fund's understanding of the tax rules and rates that exist in the foreign markets in which it invests. The Fund is subject to a tax imposed on capital gains by certain countries in which it invests.
Distributions are declared and recorded on the ex-dividend date. Income and capital gain distributions are declared separately for each class. Income and capital gain distributions are determined in accordance with income tax regulations, which may differ from GAAP. In addition, the Fund claimed a portion of the payment made to redeeming shareholders as a distribution for income tax purposes.
Capital accounts within the financial statements are adjusted for permanent book-tax differences. These adjustments have no impact on net assets or the results of operations. Capital accounts are not adjusted for temporary book-tax differences which will reverse in a subsequent period.
Book-tax differences are primarily due to foreign currency transactions, certain foreign taxes, passive foreign investment companies (PFIC) and losses deferred due to wash sales.
As of period end, the cost and unrealized appreciation (depreciation) in securities, and derivatives if applicable, for federal income tax purposes were as follows:
| Gross unrealized appreciation | $988,753,559 |
| Gross unrealized depreciation | (79,895,130) |
| Net unrealized appreciation (depreciation) | $908,858,429 |
| Tax Cost | $2,230,243,822 |
The tax-based components of distributable earnings as of period end were as follows:
| Undistributed ordinary income | $90,885,766 |
| Undistributed long-term capital gain | $315,895,698 |
| Net unrealized appreciation (depreciation) on securities and other investments | $908,731,732 |
| | |
The tax character of distributions paid was as follows:
| | October 31, 2024 | October 31, 2023 |
| Ordinary Income | $24,710,933 | $ 16,412,086 |
| Long-term Capital Gains | - | 108,424,728 |
| Total | $24,710,933 | $ 124,836,814 |
Restricted Securities (including Private Placements). Funds may invest in securities that are subject to legal or contractual restrictions on resale. These securities generally may be resold in transactions exempt from registration or to the public if the securities are registered. Disposal of these securities may involve time-consuming negotiations and expense, and prompt sale at an acceptable price may be difficult. Information regarding restricted securities held at period end is included at the end of the Schedule of Investments, if applicable.
New Accounting Pronouncement. In November 2023, the FASB issued Accounting Standards Update (ASU) 2023-07 Segment Reporting (Topic 280): Improvements to Reportable Segment Disclosures. Effective for fiscal years beginning after December 15, 2023 and interim periods within fiscal years beginning after December 15, 2024, the amendments enhance required disclosures of segment information for public entities on an annual and interim basis. The ASU allows for early adoption with updates applied retrospectively. Management is currently evaluating the impact of the ASU but does not expect this guidance to materially impact the financial statements.
4. Purchases and Sales of Investments.
Purchases and sales of securities, other than short-term securities and in-kind transactions, as applicable, are noted in the table below.
| | Purchases ($) | Sales ($) |
| Fidelity Worldwide Fund | 3,288,927,944 | 3,383,817,069 |
5. Fees and Other Transactions with Affiliates.
Management Fee. Fidelity Management & Research Company LLC (the investment adviser) and its affiliates provide the Fund with investment management related services for which the Fund pays a monthly management fee.
Effective March 1, 2024, the Fund's management contract was amended to incorporate administrative services previously covered under separate services agreements (Transfer Agent and Accounting agreements). The amended contract incorporates a basic fee rate that may vary by class (subject to a performance adjustment). The investment adviser or an affiliate pays certain expenses of managing and operating the Fund out of each class's management fee. Each class of the Fund pays a management fee to the investment adviser. The management fee is calculated and paid to the investment adviser every month. The management fee is determined by calculating a basic fee and then applying a performance adjustment. When determining a class's basic fee, a mandate rate is calculated based on the monthly average net assets of a group of funds advised by FMR within a designated asset class. A discount rate is subtracted from the mandate rate once the Fund's monthly average net assets reach a certain level. The mandate rate and discount rate may vary by class. The annual basic fee rate for a class of shares of the Fund is the lesser of (1) the class's mandate rate reduced by the class's discount rate (if applicable) or (2) the amount set forth in the following table.
| | Maximum Management Fee Rate % |
| Class A | .83 |
| Class M | .84 |
| Class C | .84 |
| Worldwide | .79 |
| Class I | .81 |
| Class Z | .69 |
One-twelfth of the basic fee rate for a class is applied to the average net assets of the class for the month, giving a dollar amount which is the basic fee for the class for that month. A different management fee rate may be applicable to each class of the Fund. The difference between classes is the result of separate arrangements for class-level services and/or waivers of certain expenses. It is not the result of any difference in advisory or custodial fees or other expenses related to the management of the Fund's assets, which do not vary by class. For the portion of the reporting period on or after March 1, 2024, the total annualized management fee rates were as follows:
| | Total Management Fee Rate % |
| Class A | .82 |
| Class M | .82 |
| Class C | .82 |
| Worldwide | .78 |
| Class I | .81 |
| Class Z | .69 |
Prior to March 1, 2024, the management fee was the sum of an individual fund fee rate that was based on an annual rate of .42% of the Fund's average net assets and an annualized group fee rate that averaged .22% during the period. The group fee rate was based upon the monthly average net assets of a group of registered investment companies with which the investment adviser has management contracts. The group fee rate decreased as assets under management increased and increased as assets under management decreased. For the portion of the reporting period prior to March 1, 2024, the total annualized management fee rate was .65%.
The performance adjustment rate is calculated monthly by comparing over the performance period the Fund's performance to that of the performance adjustment index listed below.
| | Performance Adjustment Index |
| Fidelity Worldwide Fund | MSCI World Index |
For the purposes of calculating the performance adjustment for the Fund, the Fund's investment performance is based on the performance of Worldwide. To the extent that other classes of the Fund have higher expenses, this could result in those classes bearing a larger positive performance adjustment and smaller negative performance adjustment than would be the case if each class's own performance were considered. The performance period is the most recent 36 month period. The maximum annualized performance adjustment rate is ±0.20% of the Fund's average net assets over the performance period. The performance adjustment rate is divided by twelve and multiplied by the Fund's average net assets over the performance period, and the resulting dollar amount is proportionately added to or subtracted from a class's basic fee. For the entire reporting period, the total annual performance adjustment was (.10)%.
Effective March 1, 2024, the Fund's sub-advisory agreements with FMR Investment Management (UK) Limited, Fidelity Management & Research (Hong Kong) Limited, and Fidelity Management & Research (Japan) Limited were amended to provide that the investment adviser pays each sub-adviser monthly fees equal to 110% of the sub-adviser's costs for providing sub-advisory services.
Effective March 1, 2024, the Fund's sub-advisory agreement with FIL Investment Advisors (FIA) was amended to provide that the investment adviser pays FIA monthly fees at an annual rate of 0.38% with respect to the average daily net assets of the Fund managed by FIA. FIA in turn pays FIA(UK).
Distribution and Service Plan Fees. In accordance with Rule 12b-1 of the 1940 Act, the Fund has adopted separate Distribution and Service Plans for each class of shares. Certain classes pay Fidelity Distributors Company LLC (FDC), an affiliate of the investment adviser, separate Distribution and Service Fees, each of which is based on an annual percentage of each class' average net assets. In addition, FDC may pay financial intermediaries for selling shares of the Fund and providing shareholder support services. For the period, the Distribution and Service Fee rates, total fees and amounts retained by FDC were as follows:
| | Distribution Fee | Service Fee | Total Fees ($) | Retained by FDC ($) |
| Class A | - % | .25% | 246,533 | 4,542 |
| Class M | .25% | .25% | 101,504 | - |
| Class C | .75% | .25% | 95,932 | 16,186 |
| | | | 443,969 | 20,728 |
Sales Load. FDC may receive a front-end sales charge of up to 5.75% for selling Class A shares and 3.50% for selling Class M shares, some of which is paid to financial intermediaries for selling shares of the Fund. Depending on the holding period, FDC may receive contingent deferred sales charges levied on Class A, Class M and Class C redemptions. The deferred sales charges are 1.00% for Class C shares, 1.00% for certain purchases of Class A shares and .25% for certain purchases of Class M shares.
For the period, sales charge amounts retained by FDC were as follows:
| | Retained by FDC ($) |
| Class A | 55,079 |
| Class M | 2,281 |
Class CA | 131 |
| | 57,491 |
A When Class C shares are initially sold, FDC pays commissions from its own resources to financial intermediaries through which the sales are made.
Transfer Agent Fees. Fidelity Investments Institutional Operations Company LLC (FIIOC), an affiliate of the investment adviser, is the transfer, dividend disbursing and shareholder servicing agent for each class of the Fund. Effective March 1, 2024, the Fund's management contract was amended to incorporate transfer agent services and associated fees previously covered under a separate services agreement. FIIOC pays for typesetting, printing and mailing of shareholder reports, except proxy statements.
During the period December 1, 2023 through February 29, 2024, the transfer agent fees for each class were a fixed annual rate of class-level average net assets as follows:
| | % of Class-Level Average Net Assets |
| Class A | .1905 |
| Class M | .1969 |
| Class C | .2000 |
| Worldwide | .1475 |
| Class I | .1651 |
| Class Z | .0420 |
Prior to December 1, 2023, FIIOC received account fees and asset-based fees that varied according to the account size and type of account of the shareholders of the respective classes of the Fund, except for Class Z. FIIOC received an asset-based fee of Class Z's average net assets. For the portion of the reporting period prior to March 1, 2024, the fees were equivalent to the following annualized rates:
| | Amount ($) | % of Class-Level Average Net Assets |
| Class A | 53,765 | .19 |
| Class M | 11,658 | .20 |
| Class C | 5,732 | .21 |
| Worldwide | 1,163,784 | .15 |
| Class I | 26,422 | .17 |
| Class Z | 32,062 | .04 |
| 1,293,423 | |
Accounting Fees. Fidelity Service Company, Inc. (FSC), an affiliate of the investment adviser, maintains the Fund's accounting records. Effective March 1, 2024, the Fund's management contract was amended to incorporate accounting services and associated fees previously covered under a separate services agreement.
During the period December 1, 2023 through February 29, 2024, the accounting fees were a fixed annual rate of average net assets as follows:
| | % of Average Net Assets |
| Fidelity Worldwide Fund | .0263 |
Prior to December 1, 2023, the accounting fee was based on the level of average net assets for each month. For the portion of the reporting period prior to March 1, 2024, the fees were equivalent to the following annualized rates:
| | % of Average Net Assets |
| Fidelity Worldwide Fund | .03 |
Brokerage Commissions. A portion of portfolio transactions were placed with brokerage firms which are affiliates of the investment adviser. Brokerage commissions are included in net realized gain (loss) and change in net unrealized appreciation (depreciation) in the Statement of Operations. The commissions paid to these affiliated firms were as follows:
| | Amount ($) |
| Fidelity Worldwide Fund | 43,272 |
Interfund Lending Program. Pursuant to an Exemptive Order issued by the Securities and Exchange Commission (the SEC), the Fund, along with other registered investment companies having management contracts with Fidelity Management & Research Company LLC (FMR), or other affiliated entities of FMR, may participate in an interfund lending program. This program provides an alternative credit facility allowing the Fund to borrow from, or lend money to, other participating affiliated funds at rates that are beneficial to both the borrowing and lending fund. Borrowings under the program are generally for temporary or emergency purposes, including meeting fund shareholder redemptions. The interfund loan rate is determined, as specified in the Exemptive Order, by averaging, (1) the higher of the overnight time deposit rate and the current overnight repurchase agreement rate, and (2) a benchmark rate representing the lowest bank loan rate available to the funds. At period end, there were no interfund loans outstanding. Activity in this program during the period for which loans were outstanding was as follows:
| | Borrower or Lender | Average Loan Balance ($) | Weighted Average Interest Rate | Interest Expense ($) |
| Fidelity Worldwide Fund | Borrower | 31,057,000 | 5.07% | 17,495 |
Interfund Trades. Funds may purchase from or sell securities to other Fidelity Funds under procedures adopted by the Board. The procedures have been designed to ensure these interfund trades are executed in accordance with Rule 17a-7 of the 1940 Act. Any interfund trades are included within the respective purchases and sales amounts shown in the Purchases and Sales of Investments note. Interfund trades during the period are noted in the table below.
| | Purchases ($) | Sales ($) | Realized Gain (Loss)($) |
| Fidelity Worldwide Fund | 179,872,045 | 268,053,943 | 29,773,381 |
6. Committed Line of Credit.
Certain Funds participate with other funds managed by the investment adviser or an affiliate in a $4.25 billion credit facility (the "line of credit") to be utilized for temporary or emergency purposes to fund shareholder redemptions or for other short-term liquidity purposes. The participating funds have agreed to pay commitment fees on their pro-rata portion of the line of credit, which are reflected in Miscellaneous expenses on the Statement of Operations, and are listed below. During the period, there were no borrowings on this line of credit.
| | Amount ($) |
| Fidelity Worldwide Fund | 4,806 |
7. Security Lending.
Funds lend portfolio securities from time to time in order to earn additional income. Lending agents are used, including National Financial Services (NFS), an affiliate of the investment adviser. Pursuant to a securities lending agreement, NFS will receive a fee, which is capped at 9.9% of a fund's daily lending revenue, for its services as lending agent. A fund may lend securities to certain qualified borrowers, including NFS. On the settlement date of the loan, a fund receives collateral (in the form of U.S. Treasury obligations, letters of credit and/or cash) against the loaned securities and maintains collateral in an amount not less than 100% of the market value of the loaned securities during the period of the loan. The market value of the loaned securities is determined at the close of business of a fund and any additional required collateral is delivered to a fund on the next business day. A fund or borrower may terminate the loan at any time, and if the borrower defaults on its obligation to return the securities loaned because of insolvency or other reasons, a fund may apply collateral received from the borrower against the obligation. A fund may experience delays and costs in recovering the securities loaned. Any cash collateral received is invested in the Fidelity Securities Lending Cash Central Fund. Any loaned securities are identified as such in the Schedule of Investments, and the value of loaned securities and cash collateral at period end, as applicable, are presented in the Statement of Assets and Liabilities. Security lending income represents the income earned on investing cash collateral, less rebates paid to borrowers and any lending agent fees associated with the loan, plus any premium payments received for lending certain types of securities. Security lending income is presented in the Statement of Operations as a component of income from Fidelity Central Funds. Affiliated security lending activity, if any, was as follows:
| | Total Security Lending Fees Paid to NFS ($) | Security Lending Income From Securities Loaned to NFS ($) | Value of Securities Loaned to NFS at Period End ($) |
| Fidelity Worldwide Fund | 17,366 | - | - |
8. Expense Reductions.
Through arrangements with the Fund's custodian, credits realized as a result of certain uninvested cash balances were used to reduce the Fund's expenses. During the period, transfer agent credits reduced each class' expenses as noted in the table below.
| | Expense reduction ($) |
| Class M | 40 |
| | 40 |
In addition, during the period the investment adviser or an affiliate reimbursed and/or waived a portion of fund-level operating expenses in the amount of $122,797.
9. Distributions to Shareholders.
Distributions to shareholders of each class were as follows:
| | Year ended October 31, 2024 | Year ended October 31, 2023 |
| Fidelity Worldwide Fund | | |
| Distributions to shareholders | | |
| Class A | $552,793 | $3,905,043 |
| Class M | 75,550 | 825,955 |
| Class C | - | 473,638 |
| Worldwide | 21,114,973 | 112,981,740 |
| Class I | 439,298 | 1,950,914 |
| Class Z | 2,528,319 | 4,699,524 |
Total | $24,710,933 | $124,836,814 |
10. Share Transactions.
Share transactions for each class were as follows and may contain in-kind transactions, automatic conversions between classes or exchanges between affiliated funds:
| | Shares | Shares | Dollars | Dollars |
| | Year ended October 31, 2024 | Year ended October 31, 2023 | Year ended October 31, 2024 | Year ended October 31, 2023 |
| Fidelity Worldwide Fund | | | | |
| Class A | | | | |
| Shares sold | 581,446 | 398,646 | $20,483,863 | $10,809,786 |
| Reinvestment of distributions | 18,512 | 153,659 | 547,575 | 3,866,062 |
| Shares redeemed | (393,376) | (469,022) | (13,545,664) | (12,647,071) |
| Net increase (decrease) | 206,582 | 83,283 | $7,485,774 | $2,028,777 |
| Class M | | | | |
| Shares sold | 123,303 | 50,411 | $4,403,391 | $1,331,408 |
| Reinvestment of distributions | 2,570 | 32,920 | 75,321 | 820,689 |
| Shares redeemed | (113,480) | (80,267) | (3,886,219) | (2,112,561) |
| Net increase (decrease) | 12,393 | 3,064 | $592,493 | $39,536 |
| Class C | | | | |
| Shares sold | 74,442 | 30,402 | $2,408,430 | $765,161 |
| Reinvestment of distributions | - | 19,902 | - | 473,280 |
| Shares redeemed | (65,335) | (111,594) | (2,097,615) | (2,847,983) |
| Net increase (decrease) | 9,107 | (61,290) | $310,815 | $(1,609,542) |
| Worldwide | | | | |
| Shares sold | 13,320,525 | 6,385,600 | $469,690,538 | $176,715,594 |
| Reinvestment of distributions | 660,086 | 4,190,088 | 19,906,749 | 107,266,234 |
| Shares redeemed | (13,501,211) | (10,673,714) | (478,120,242) | (292,505,585) |
| Net increase (decrease) | 479,400 | (98,026) | $11,477,045 | $(8,523,757) |
| Class I | | | | |
| Shares sold | 625,867 | 817,991 | $22,688,518 | $22,120,908 |
| Reinvestment of distributions | 14,127 | 75,801 | 422,756 | 1,925,343 |
| Shares redeemed | (468,852) | (653,340) | (16,856,657) | (17,772,257) |
| Net increase (decrease) | 171,142 | 240,452 | $6,254,617 | $6,273,994 |
| Class Z | | | | |
| Shares sold | 9,206,355 | 1,882,153 | $308,697,406 | $54,181,206 |
| Reinvestment of distributions | 83,334 | 176,768 | 2,489,237 | 4,481,057 |
| Shares redeemed | (11,140,674) | (699,310) | (434,031,933) | (19,184,778) |
| Net increase (decrease) | (1,850,985) | 1,359,611 | $(122,845,290) | $39,477,485 |
11. Other.
A fund's organizational documents provide former and current trustees and officers with a limited indemnification against liabilities arising in connection with the performance of their duties to the fund. In the normal course of business, a fund may also enter into contracts that provide general indemnifications. A fund's maximum exposure under these arrangements is unknown as this would be dependent on future claims that may be made against a fund. The risk of material loss from such claims is considered remote.
12. Risk and Uncertainties.
Many factors affect a fund's performance. Developments that disrupt global economies and financial markets, such as pandemics, epidemics, outbreaks of infectious diseases, war, terrorism, and environmental disasters, may significantly affect a fund's investment performance. The effects of these developments to a fund will be impacted by the types of securities in which a fund invests, the financial condition, industry, economic sector, and geographic location of an issuer, and a fund's level of investment in the securities of that issuer. Significant concentrations in security types, issuers, industries, sectors, and geographic locations may magnify the factors that affect a fund's performance.
Report of Independent Registered Public Accounting Firm
To the Board of Trustees of Fidelity Investment Trust and the Shareholders of Fidelity Diversified International Fund, Fidelity International Capital Appreciation Fund, and Fidelity Worldwide Fund:
Opinion on the Financial Statements and Financial Highlights
We have audited the accompanying statements of assets and liabilities of Fidelity Diversified International Fund, Fidelity International Capital Appreciation Fund, and Fidelity Worldwide Fund (the "Funds"), each a fund of Fidelity Investment Trust, including the schedules of investments, as of October 31, 2024, the related statements of operations for the year then ended, the statements of changes in net assets for each of the two years in the period then ended, the financial highlights for each of the five years in the period then ended, and the related notes. In our opinion, the financial statements and financial highlights present fairly, in all material respects, the financial position of each of the Funds as of October 31, 2024, and the results of their operations for the year then ended, the changes in their net assets for each of the two years in the period then ended, and the financial highlights for each of the five years in the period then ended in conformity with accounting principles generally accepted in the United States of America.
Basis for Opinion
These financial statements and financial highlights are the responsibility of the Funds' management. Our responsibility is to express an opinion on the Funds' financial statements and financial highlights based on our audits. We are a public accounting firm registered with the Public Company Accounting Oversight Board (United States) (PCAOB) and are required to be independent with respect to the Funds in accordance with the U.S. federal securities laws and the applicable rules and regulations of the Securities and Exchange Commission and the PCAOB.
We conducted our audits in accordance with the standards of the PCAOB. Those standards require that we plan and perform the audit to obtain reasonable assurance about whether the financial statements and financial highlights are free of material misstatement, whether due to error or fraud. The Funds are not required to have, nor were we engaged to perform, an audit of their internal control over financial reporting. As part of our audits, we are required to obtain an understanding of internal control over financial reporting but not for the purpose of expressing an opinion on the effectiveness of the Funds' internal control over financial reporting. Accordingly, we express no such opinion.
Our audits included performing procedures to assess the risks of material misstatement of the financial statements and financial highlights, whether due to error or fraud, and performing procedures that respond to those risks. Such procedures included examining, on a test basis, evidence regarding the amounts and disclosures in the financial statements and financial highlights. Our audits also included evaluating the accounting principles used and significant estimates made by management, as well as evaluating the overall presentation of the financial statements and financial highlights. Our procedures included confirmation of securities owned as of October 31, 2024, by correspondence with the custodian and brokers; when replies were not received from brokers, we performed other auditing procedures. We believe that our audits provide a reasonable basis for our opinion.
/s/ Deloitte & Touche LLP
Boston, Massachusetts
December 13, 2024
We have served as the auditor of one or more of the Fidelity investment companies since 1999.
Report of Independent Registered Public Accounting Firm
To the Board of Trustees of Fidelity Investment Trust and Shareholders of Fidelity Overseas Fund
Opinion on the Financial Statements
We have audited the accompanying statement of assets and liabilities, including the schedule of investments, of Fidelity Overseas Fund (one of the funds constituting Fidelity Investment Trust, referred to hereafter as the "Fund") as of October 31, 2024, the related statement of operations for the year ended October 31, 2024, the statement of changes in net assets for each of the two years in the period ended October 31, 2024, including the related notes, and the financial highlights for each of the five years in the period ended October 31, 2024 (collectively referred to as the "financial statements"). In our opinion, the financial statements present fairly, in all material respects, the financial position of the Fund as of October 31, 2024, the results of its operations for the year then ended, the changes in its net assets for each of the two years in the period ended October 31, 2024 and the financial highlights for each of the five years in the period ended October 31, 2024 in conformity with accounting principles generally accepted in the United States of America.
Basis for Opinion
These financial statements are the responsibility of the Fund's management. Our responsibility is to express an opinion on the Fund's financial statements based on our audits. We are a public accounting firm registered with the Public Company Accounting Oversight Board (United States) (PCAOB) and are required to be independent with respect to the Fund in accordance with the U.S. federal securities laws and the applicable rules and regulations of the Securities and Exchange Commission and the PCAOB.
We conducted our audits of these financial statements in accordance with the standards of the PCAOB. Those standards require that we plan and perform the audit to obtain reasonable assurance about whether the financial statements are free of material misstatement, whether due to error or fraud.
Our audits included performing procedures to assess the risks of material misstatement of the financial statements, whether due to error or fraud, and performing procedures that respond to those risks. Such procedures included examining, on a test basis, evidence regarding the amounts and disclosures in the financial statements. Our audits also included evaluating the accounting principles used and significant estimates made by management, as well as evaluating the overall presentation of the financial statements. Our procedures included confirmation of securities owned as of October 31, 2024 by correspondence with the custodian, issuers of privately offered securities and brokers; when replies were not received from brokers, we performed other auditing procedures. We believe that our audits provide a reasonable basis for our opinion.
/s/ PricewaterhouseCoopers LLP
Boston, Massachusetts
December 13, 2024
We have served as the auditor of one or more investment companies in the Fidelity group of funds since 1932.
Distributions
(Unaudited)The dividend and capital gains distributions for the fund(s) are available on Fidelity.com or Institutional.Fidelity.com.
The funds hereby designate as capital gain dividend the amounts noted below for the taxable year ended October 31, 2024, or, if subsequently determined to be different, the net capital gain of such year.
| Fidelity Diversified International Fund | $214,307,898 |
| Fidelity International Capital Appreciation Fund | $137,481,510 |
| Fidelity Overseas Fund | $95,600,566 |
| Fidelity Worldwide Fund | $315,895,698 |
The funds hereby designate the amounts noted below as distributions paid during the fiscal year ended 2024 as qualifying to be taxed as section 163(j) interest dividends:
| Fidelity Diversified International Fund | $9,340,947 |
| Fidelity International Capital Appreciation Fund | $271,220 |
| Fidelity Overseas Fund | $2,189,233 |
| Fidelity Worldwide Fund | $554,385 |
A percentage of the dividends distributed during the fiscal year for the following funds qualify for the dividends-received deduction for corporate shareholders:
| | Class A | Class M | Class C | Retail Class | Class I | Class Z | Class K | |
| Fidelity Diversified International Fund | | | | | | | | |
| December 8, 2023 | - | - | - | 2% | - | - | 2% | |
| Fidelity International Capital Appreciation Fund | | | | | | | | |
| December 1, 2023 | - | - | - | 13% | - | - | - | |
| Fidelity Overseas Fund | | | | | | | | |
| December 1, 2023 | - | - | - | 3% | - | - | 3% | |
| Fidelity Worldwide Fund | | | | | | | | |
| December 8, 2023 | 68% | 100% | - | 49% | 50% | 43% | - | |
| December 27, 2023 | - | - | - | 77% | 84% | 53% | - | |
A percentage of the dividends distributed during the fiscal year for the following funds may be taken into account as a dividend for purposes of the maximum rate under section 1(h)(11) of the Internal Revenue Code.
| | Class A | Class M | Class C | Retail Class | Class I | Class Z | Class K |
| Fidelity Diversified International Fund | | | | | | | |
| December 8, 2023 | - | - | - | 91.70% | - | - | 86.96% |
| Fidelity International Capital Appreciation Fund | | | | | | | |
| December 1, 2023 | - | - | - | 100% | - | - | - |
| Fidelity Overseas Fund | | | | | | | |
| December 1, 2023 | - | - | - | 100% | - | - | 100% |
| Fidelity Worldwide Fund | | | | | | | |
| December 8, 2023 | 100% | 100% | - | 100% | 100% | 100% | - |
| December 27, 2023 | - | - | - | 100% | 100% | 100% | - |
The amounts per share which represent income derived from sources within, and taxes paid to, foreign countries or possessions of the United States are as follows:
| | Pay Date | Income | Taxes |
| Fidelity Diversified International Fund | | | |
| Diversified International | 12/11/2023 | $0.7260 | $0.0859 |
| Class K | 12/11/2023 | $0.7656 | $0.0859 |
| Fidelity International Capital Appreciation Fund | | | |
| | 12/04/2023 | $0.1137 | $0.0258 |
| Fidelity Overseas Fund | | | |
| Overseas | 12/04/2023 | $0.6520 | $0.0757 |
| Class K | 12/04/2023 | $0.7113 | $0.0757 |
The funds will notify shareholders in January 2025 of amounts for use in preparing 2024 income tax returns.
Item 8: Changes in and Disagreements with Accountants for Open-End Management Investment Companies
(Unaudited)
Note: This is not applicable for any fund included in this document.
Item 9: Proxy Disclosures for Open-End Management Investment Companies
(Unaudited)
| A special meeting of shareholders was held on July 16, 2024. The results of votes taken among shareholders on the proposal before them are reported below. Each vote reported represents one dollar of net asset value held on the record date for the meeting. |
| Proposal 1 |
| To elect a Board of Trustees. |
| | # of Votes | % of Votes |
| Bettina Doulton |
| Affirmative | 128,529,177,643.56 | 98.18 |
| Withheld | 2,378,037,364.30 | 1.82 |
| TOTAL | 130,907,215,007.85 | 100.00 |
| Robert A. Lawrence |
| Affirmative | 128,253,389,899.05 | 97.97 |
| Withheld | 2,653,825,108.81 | 2.03 |
| TOTAL | 130,907,215,007.85 | 100.00 |
| Vijay C. Advani |
| Affirmative | 128,531,418,228.19 | 98.19 |
| Withheld | 2,375,796,779.66 | 1.81 |
| TOTAL | 130,907,215,007.85 | 100.00 |
| Thomas P. Bostick |
| Affirmative | 128,495,261,591.41 | 98.16 |
| Withheld | 2,411,953,416.44 | 1.84 |
| TOTAL | 130,907,215,007.85 | 100.00 |
| Donald F. Donahue |
| Affirmative | 128,407,878,996.00 | 98.09 |
| Withheld | 2,499,336,011.85 | 1.91 |
| TOTAL | 130,907,215,007.85 | 100.00 |
| Vicki L. Fuller |
| Affirmative | 128,625,540,095.19 | 98.26 |
| Withheld | 2,281,674,912.66 | 1.74 |
| TOTAL | 130,907,215,007.85 | 100.00 |
| Patricia L. Kampling |
| Affirmative | 128,668,729,281.34 | 98.29 |
| Withheld | 2,238,485,726.51 | 1.71 |
| TOTAL | 130,907,215,007.85 | 100.00 |
| Thomas A. Kennedy |
| Affirmative | 128,499,824,239.79 | 98.16 |
| Withheld | 2,407,390,768.06 | 1.84 |
| TOTAL | 130,907,215,007.85 | 100.00 |
| Oscar Munoz |
| Affirmative | 128,386,109,391.05 | 98.07 |
| Withheld | 2,521,105,616.80 | 1.93 |
| TOTAL | 130,907,215,007.85 | 100.00 |
| Karen B. Peetz |
| Affirmative | 128,603,731,113.82 | 98.24 |
| Withheld | 2,303,483,894.03 | 1.76 |
| TOTAL | 130,907,215,007.85 | 100.00 |
| David M. Thomas |
| Affirmative | 128,384,899,342.98 | 98.07 |
| Withheld | 2,522,315,664.88 | 1.93 |
| TOTAL | 130,907,215,007.85 | 100.00 |
| Susan Tomasky |
| Affirmative | 128,556,148,461.60 | 98.20 |
| Withheld | 2,351,066,546.25 | 1.80 |
| TOTAL | 130,907,215,007.85 | 100.00 |
| Michael E. Wiley |
| Affirmative | 128,264,934,978.34 | 97.98 |
| Withheld | 2,642,280,029.51 | 2.02 |
| TOTAL | 130,907,215,007.85 | 100.00 |
| | | |
| Proposal 1 reflects trust-wide proposal and voting results. |
Item 10: Remuneration Paid to Directors, Officers, and others of Open-End Management Investment Companies
(Unaudited)
Note: This information is disclosed as part of the financial statements for each Fund as part of Item 7: Financial Statements and Financial Highlights for Open-End Management Investment companies.
Item 11: Statement Regarding Basis for Approval of Investment Advisory Contract
(Unaudited)
Board Approval of Investment Advisory Contracts and Management Fees
Fidelity Diversified International Fund
Fidelity International Capital Appreciation Fund
Fidelity Overseas Fund
Fidelity Worldwide Fund
Each year, the Board of Trustees, including the Independent Trustees (together, the Board), considers the renewal of each fund's management contract with Fidelity Management & Research Company LLC (FMR) and certain affiliates and the sub-advisory agreements (together, the Advisory Contracts) for each fund. FMR and the sub-advisers are referred to herein as the Investment Advisers. The Board, assisted by the advice of fund counsel and Independent Trustees' counsel, requests and considers a broad range of information relevant to the renewal of the Advisory Contracts throughout the year.
The Board meets regularly and, at each of its meetings, covers an extensive agenda of topics and materials and considers factors that are relevant to its annual consideration of the renewal of each fund's Advisory Contracts, including the services and support provided to each fund and its shareholders. The Board, acting directly and through its Committees (each of which is composed of and chaired by Independent Trustees), requests and receives information concerning the annual consideration of the renewal of each fund's Advisory Contracts. The Board also meets as needed to review matters specifically related to the Board's annual consideration of the renewal of the Advisory Contracts. Members of the Board may also meet with trustees of other Fidelity funds through joint ad hoc committees to discuss certain matters relevant to all of the Fidelity funds.
At its May 2024 meeting, the Board unanimously determined to renew each fund's Advisory Contracts. In reaching its determination, the Board considered all factors it believed relevant, including (i) the nature, extent, and quality of the services provided to each fund and its shareholders (including the investment performance of each fund); (ii) the competitiveness relative to peer funds of each fund's management fee and total expense ratio of the fund or, for Fidelity Diversified International Fund, Fidelity Overseas Fund and the Fidelity Worldwide Fund, a representative class (the retail class, which was selected because it was the largest class without 12b-1 fees); (iii) the total costs of the services provided by and the profits realized by FMR and its affiliates (Fidelity) from its relationships with each fund; and (iv) the extent to which, if any, economies of scale exist and are realized as each fund grows, and whether any economies of scale are appropriately shared with fund shareholders. The Board also considered the broad range of investment choices available to shareholders from FMR's competitors and that each fund's shareholders have chosen to invest in that fund, which is part of the Fidelity family of funds. The Board's decision to renew the Advisory Contracts was not based on any single factor.
The Board reached a determination, with the assistance of fund counsel and Independent Trustees' counsel and through the exercise of its business judgment, that the renewal of the Advisory Contracts was in the best interests of each fund and its shareholders and that the compensation payable under the Advisory Contracts was fair and reasonable in light of all of the surrounding circumstances.
Nature, Extent, and Quality of Services Provided. The Board considered staffing as it relates to the funds, including the backgrounds and experience of investment personnel of the Investment Advisers, and also considered the Investment Advisers' implementation of each fund's investment program. The Independent Trustees also had discussions with senior management of Fidelity's investment operations and investment groups. The Board considered the structure of the investment personnel compensation program and whether this structure provides appropriate incentives to act in the best interests of each fund. Additionally, the Board considered the portfolio managers' investments, if any, in the funds that they manage.
Resources Dedicated to Investment Management and Support Services. The Board and the Fund Oversight and Research Committees reviewed the general qualifications and capabilities of Fidelity's investment staff, including its size, education, experience, and resources, as well as Fidelity's approach to recruiting, training, managing, and compensating investment personnel. The Board noted the resources devoted to expansion of Fidelity's global investment organization, and that Fidelity's analysts have extensive resources, tools and capabilities that allow them to conduct sophisticated quantitative and fundamental analysis, as well as credit analysis of issuers, counterparties, and guarantors. Further, the Board considered that Fidelity's investment professionals have sufficient access to global information and data so as to provide competitive investment results over time, and that those professionals also have access to sophisticated tools that permit them to assess portfolio construction and risk and performance attribution characteristics continuously, as well as to transmit new information and research conclusions rapidly around the world. Additionally, in its deliberations, the Board considered Fidelity's trading, risk management, compliance, and technology and operations capabilities and resources, which are integral parts of the investment management process.
Shareholder and Administrative Services. The Board considered (i) the nature, extent, quality, and cost of advisory, administrative, shareholder, transfer agency, and pricing and bookkeeping services performed by the Investment Advisers and their affiliates under the Advisory Contracts; (ii) the nature and extent of Fidelity's supervision of third party service providers, principally custodians, subcustodians, and pricing vendors; and (iii) the resources devoted by Fidelity to, and the record of compliance with, each fund's compliance policies and procedures. The Board also reviewed the allocation of fund brokerage, including allocations to brokers affiliated with the Investment Advisers, the use of brokerage commissions to pay fund expenses, and the use of "soft" commission dollars to pay for research services. The Board also considered each fund's securities lending activities and any payments made to Fidelity relating to securities lending under separate agreements.
The Board noted that the growth of fund assets over time across the complex allows Fidelity to reinvest in the development of services designed to enhance the value and convenience of the Fidelity funds as investment vehicles. These services include 24-hour access to account information and market information over the Internet and through telephone representatives, investor education materials, and asset allocation tools. The Board also considered that it reviews customer service metrics such as telephone response times, continuity of services on the website and metrics addressing services at Fidelity Investor Centers.
Investment in a Large Fund Family. The Board considered the benefits to shareholders of investing in a fund that is part of a large family of funds offering a variety of investment disciplines and providing a large variety of fund investor services. The Board noted that Fidelity had taken, or had made recommendations that resulted in the Fidelity funds taking, a number of actions over the previous year that benefited particular funds and/or the Fidelity funds in general.
Investment Performance. The Board took into account discussions that occur with representatives of the Investment Advisers, and reports that it receives, at Board meetings throughout the year, relating to fund investment performance. In this regard the Board noted that as part of regularly scheduled fund reviews and other reports to the Board on fund performance, the Board considered annualized return information for each fund for different time periods, measured against an appropriate securities market index (benchmark index) and an appropriate peer group of funds with similar objectives (peer group). The Board also considered information about performance attribution. In its ongoing evaluation of fund investment performance, the Board gives particular attention to information indicating changes in performance of the funds over different time periods and discussed with the Investment Advisers the reasons for any overperformance or underperformance.
In addition to reviewing absolute and relative fund performance, the Independent Trustees periodically consider the appropriateness of fund performance metrics in evaluating the results achieved. The Independent Trustees generally give greater weight to fund performance over longer time periods than over shorter time periods. Depending on the circumstances, the Independent Trustees may be satisfied with a fund's performance notwithstanding that it lags its benchmark index or peer group for certain periods.
Based on its review, the Board concluded that the nature, extent, and quality of services provided to each fund under the Advisory Contracts should continue to benefit the shareholders of each fund.
Competitiveness of Management Fee and Total Expense Ratio. The Board was provided with information regarding industry trends in management fees and expenses. The Board considered that, effective March 1, 2024, an amended Advisory Contract with FMR went into effect for each fund with each fund's management fee based on tiered schedules and subject to a maximum class-level rate (the management fee). The Board also considered that, in exchange for the variable management fee, each class of each fund receives investment advisory, management, administrative, transfer agent, and pricing and bookkeeping services. In its review of each fund's management fee and total expense ratio (for the retail class for Fidelity Diversified International Fund, Fidelity Overseas Fund and the Fidelity Worldwide Fund), the Board considered each fund's (or each retail class's for Fidelity Diversified International Fund, Fidelity Overseas Fund and the Fidelity Worldwide Fund) pro rata management fee rate as if it had been in effect for the 12-month period ended September 30, 2023, as well as other third-party fund expenses, as applicable, such as custodial, legal, and audit fees and fund paid 12b-1 fees (for Fidelity Worldwide Fund). The Board also noted that Fidelity may agree to waive fees or reimburse expenses from time to time, and the extent to which, if any, it has done so for each fund. The Board also considered information about the impact of each fund's performance adjustment.
Comparisons of Management Fees and Total Expense Ratios. Among other things, the Board reviewed data for selected groups of competitive funds and classes (referred to as "mapped groups") that were compiled by Fidelity based on combining similar investment objective categories (as classified by Lipper) that have comparable investment mandates. The data reviewed by the Board included (i) gross management fee comparisons (before taking into account expense reimbursements or caps and without taking into account each fund's performance adjustment) relative to the total universe of funds within the mapped group; (ii) gross management fee comparisons relative to a subset of non-Fidelity funds in the mapped group that are similar in size and management fee structure to each fund (referred to as the "asset size peer group"); (iii) total expense comparisons of the fund or the retail class (for Fidelity Diversified International Fund, Fidelity Overseas Fund and Fidelity Worldwide Fund), relative to funds and classes in the mapped group that have a similar sales load structure to the fund or representative class, as applicable (referred to as the "similar sales load structure group"); and (iv) total expense comparisons of the fund or the retail class (for Fidelity Diversified International Fund, Fidelity Overseas Fund and Fidelity Worldwide Fund) relative to funds and classes in the similar sales load structure group that are similar in size and management fee structure to the fund or class, as applicable (referred to as the "total expense asset size peer group"). The total expense asset size peer group comparison excludes performance adjustments and fund-paid 12b-1 fees to eliminate variability in fee structures.
The information provided to the Board indicated that each fund's management fee rate ranked below the competitive median of the mapped group for the 12-month period ended September 30, 2023 and above the competitive median of the asset size peer group for the 12-month period ended September 30, 2023. The information provided to the Board indicated that the total expense ratio of Fidelity International Capital Appreciation Fund and of the retail class of each of Fidelity Diversified International Fund, Fidelity Overseas Fund, and Fidelity Worldwide Fund ranked below the competitive median of the similar sales load structure group for the 12-month period ended September 30, 2023 and below the competitive median of the asset size peer group for the 12-month period ended September 30, 2023.
For Fidelity Diversified International Fund, Fidelity Overseas Fund, and Fidelity Worldwide Fund, the Board noted that a different variable management fee rate is applicable to each class of the fund. The Board considered that the difference in management fee rates between classes is the result of separate arrangements for class-level services and/or waivers of certain expenses and not the result of any difference in advisory or custodial fees or other expenses related to the management of the fund's assets, which do not vary by class.
The Board also considered that each fund's management fee is subject to upward or downward adjustment depending upon whether, and to what extent, each fund's investment performance for the performance period (a rolling 36-month period) exceeds, or is exceeded by, a securities index, thus leading to a performance adjustment for the same period. The Board noted that the performance adjustment provides FMR with a strong economic incentive to seek to achieve superior long-term performance for each fund's shareholders and helps to more closely align the interests of FMR and the shareholders of each fund.
For Fidelity Diversified International Fund, Fidelity Overseas Fund and Fidelity Worldwide Fund, in connection with its consideration of each fund's performance adjustment, the Board noted that the performance of the retail class is used for purposes of determining the performance adjustment. The Board noted that to the extent the performance adjustment was based on the performance of a share class with higher total annual operating expenses, the fund would be subject to a smaller positive and larger negative performance adjustment. The Board considered the appropriateness of the use of the retail class as the basis for the performance adjustment. The Board noted that the retail class is typically the largest class (reflecting the actual investment experience for the plurality of shareholders), employs a standard expense structure, and does not include fund-paid 12b-1 fees, which Fidelity believes makes it a more appropriate measurement of Fidelity's investment skill.
Fees Charged to Other Fidelity Clients. The Board also considered Fidelity fee structures and other information with respect to clients of Fidelity, such as other funds advised or subadvised by Fidelity, pension plan clients, and other institutional clients with similar mandates. The Board noted that a joint ad hoc committee created by it and the boards of other Fidelity funds periodically reviews and compares Fidelity's institutional investment advisory business with its business of providing services to the Fidelity funds and also noted the most recent findings of the committee. The Board noted that the committee's review included a consideration of the differences in services provided, fees charged, and costs incurred, as well as competition in the markets serving the different categories of clients.
Based on its review, the Board concluded that each fund's management fee, including the use of the retail class as the basis for the performance adjustment (for Fidelity Diversified International Fund, Fidelity Overseas Fund and Fidelity Worldwide Fund), is fair and reasonable in light of the services that each fund receives and the other factors considered. Further, based on its review of total expense ratios and fees charged to other Fidelity clients, the Board concluded that the total expense ratio of Fidelity International Capital Appreciation Fund and the total expense ratio of each class of Fidelity Diversified International Fund, Fidelity Overseas Fund, and Fidelity Worldwide Fund were reasonable in light of the services that each fund and its shareholders receive and the other factors considered.
Costs of the Services and Profitability. The Board considered the revenues earned and the expenses incurred by Fidelity in conducting the business of developing, marketing, distributing, managing, administering and servicing each fund and servicing each fund's shareholders. The Board also considered the level of Fidelity's profits in respect of all the Fidelity funds.
On an annual basis, Fidelity presents to the Board information about the profitability of its relationships with each fund. Fidelity calculates profitability information for each fund, as well as aggregate profitability information for groups of Fidelity funds and all Fidelity funds, using a series of detailed revenue and cost allocation methodologies which originate with the books and records of Fidelity on which Fidelity's audited financial statements are based. The Audit Committee of the Board reviews any significant changes from the prior year's methodologies.
A public accounting firm has been engaged annually by the Board as part of the Board's assessment of Fidelity's profitability analysis. The engagement includes the review and assessment of the methodologies used by Fidelity in determining the revenues and expenses attributable to Fidelity's fund business, and completion of agreed-upon procedures in respect of the mathematical accuracy of certain fund profitability information and its conformity to established allocation methodologies. After considering the reports issued under the engagement and information provided by Fidelity, the Board concluded that while other allocation methods may also be reasonable, Fidelity's profitability methodologies are reasonable in all material respects.
The Board also reviewed Fidelity's non-fund businesses and potential indirect benefits such businesses may have received as a result of their association with Fidelity's fund business (i.e., fall-out benefits) as well as cases where Fidelity's affiliates may benefit from the funds' business. The Board considered areas where potential indirect benefits to the Fidelity funds from their relationships with Fidelity may exist. The Board's consideration of these matters was informed by the findings of a joint ad hoc committee created by it and the boards of other Fidelity funds to evaluate potential fall-out benefits.
The Board considered the costs of the services provided by and the profits realized by Fidelity in connection with the operation of each fund and was satisfied that the profitability was not excessive.
Economies of Scale. The Board considered whether there have been economies of scale in respect of the management of the Fidelity funds, whether the Fidelity funds (including each fund) have appropriately benefited from any such economies of scale, and whether there is potential for realization of any further economies of scale. The Board considered the extent to which each fund will benefit from economies of scale as assets grow through increased services to the fund, through waivers or reimbursements, or through fee or expense ratio reductions. The Board also noted that a committee created by it and the boards of other Fidelity funds periodically analyzes whether Fidelity attains economies of scale in respect of the management and servicing of the Fidelity funds, whether the Fidelity funds have appropriately benefited from such economies of scale, and whether there is potential for realization of any further economies of scale.
The Board recognized that each fund's management contract incorporates a variable management fee structure, which provides for breakpoints as a way to share, in part, any potential economies of scale that may exist at the asset class level and through a discount that considers both fund size and total assets of the four applicable asset classes. The Board considered that the variable management fee is designed to deliver the benefits of economies of scale to fund shareholders even if assets of any particular fund are unchanged or have declined, because some portion of Fidelity's costs are attributable to services provided to all Fidelity funds subject to the variable management fee, and all such funds benefit if those costs can be allocated among more assets. The Board concluded that, given the variable management fee structure, fund shareholders will benefit from lower management fees due to the application of the breakpoints and discount factor, regardless of whether Fidelity achieves any such economies of scale.
The Board concluded, taking into account the analysis of the committee, that economies of scale, if any, are being appropriately shared between fund shareholders and Fidelity.
Additional Information Requested by the Board. In order to develop fully the factual basis for consideration of the Fidelity funds' advisory contracts, the Board requested and received additional information on certain topics, including, but not limited to: (i) fund flow and performance trends, in particular the underperformance of certain funds and strategies, and Fidelity's long-term strategies for certain funds; (ii) the operation of performance fees and the rationale for implementing performance fees on certain categories of funds but not others; (iii) Fidelity's pricing philosophy compared to competitors; (iv) fund profitability methodology and data; (v) evaluation of competitive fund data and peer group classifications and fee and expense comparisons; (vi) the management fee and expense structures for different funds and classes and information about the differences between various fee and expense structures; (vii) the variable management fee implemented for certain funds effective March 1, 2024; and (viii) information regarding other accounts managed by Fidelity and the funds' sub-advisory arrangements.
Conclusion. Based on its evaluation of all of the conclusions noted above, and after considering all factors it believed relevant, the Board, including the Independent Trustees, concluded that the advisory and sub-advisory fee arrangements are fair and reasonable in light of all of the surrounding circumstances and that each fund's Advisory Contracts should be renewed through May 31, 2025.
1.754543.124
IBD-ANN-1224
Fidelity® Global Equity Income Fund
Annual Report
October 31, 2024
Includes Fidelity and Fidelity Advisor share classes
Contents
To view a fund's proxy voting guidelines and proxy voting record for the 12-month period ended June 30, visit http://www.fidelity.com/proxyvotingresults or visit the Securities and Exchange Commission's (SEC) web site at http://www.sec.gov.
You may also call 1-800-544-8544 if you're an individual investing directly with Fidelity, call 1-800-835-5092 if you're a plan sponsor or participant with Fidelity as your recordkeeper or call 1-877-208-0098 on institutional accounts or if you're an advisor or invest through one to request a free copy of the proxy voting guidelines.
Standard & Poor's, S&P and S&P 500 are registered service marks of The McGraw-Hill Companies, Inc. and have been licensed for use by Fidelity Distributors Corporation.
Other third-party marks appearing herein are the property of their respective owners.
All other marks appearing herein are registered or unregistered trademarks or service marks of FMR LLC or an affiliated company. © 2024 FMR LLC. All rights reserved.
This report and the financial statements contained herein are submitted for the general information of the shareholders of the Fund. This report is not authorized for distribution to prospective investors in the Fund unless preceded or accompanied by an effective prospectus.
A fund files its complete schedule of portfolio holdings with the SEC for the first and third quarters of each fiscal year on Form N-PORT. Forms N-PORT are available on the SEC's web site at http://www.sec.gov. A fund's Forms N-PORT may be reviewed and copied at the SEC's Public Reference Room in Washington, DC. Information regarding the operation of the SEC's Public Reference Room may be obtained by calling 1-800-SEC-0330.
For a complete list of a fund's portfolio holdings, view the most recent holdings listing, semiannual report, or annual report on Fidelity's web site at http://www.fidelity.com, http://www.institutional.fidelity.com, or http://www.401k.com, as applicable.
NOT FDIC INSURED •MAY LOSE VALUE •NO BANK GUARANTEE
Neither the Fund nor Fidelity Distributors Corporation is a bank.
Item 7: Financial Statements and Financial Highlights for Open-End Management Investment Companies (Annual Report)
Fidelity® Global Equity Income Fund
Schedule of Investments October 31, 2024
Showing Percentage of Net Assets
| Common Stocks - 97.1% |
| | | Shares | Value ($) |
| Belgium - 0.9% | | | |
| KBC Group NV | | 17,383 | 1,260,809 |
| UCB SA | | 5,332 | 1,025,419 |
TOTAL BELGIUM | | | 2,286,228 |
| Brazil - 0.6% | | | |
| Equatorial Energia SA | | 261,574 | 1,453,365 |
| Canada - 5.2% | | | |
| Alimentation Couche-Tard, Inc. (multi-vtg.) | | 45,683 | 2,382,334 |
| Canadian Natural Resources Ltd. | | 47,442 | 1,613,372 |
| Cenovus Energy, Inc. (Canada) | | 19,100 | 307,142 |
| Constellation Software, Inc. | | 581 | 1,752,176 |
| Constellation Software, Inc. warrants 3/31/40 (a)(b) | | 581 | 0 |
| Imperial Oil Ltd. | | 21,480 | 1,602,881 |
| Metro, Inc. | | 32,869 | 1,952,051 |
| PrairieSky Royalty Ltd. | | 92,106 | 1,842,980 |
| Quebecor, Inc. Class B (sub. vtg.) | | 39,400 | 981,074 |
| Restaurant Brands International, Inc. | | 13,500 | 938,945 |
TOTAL CANADA | | | 13,372,955 |
| China - 2.0% | | | |
| NXP Semiconductors NV | | 21,945 | 5,146,103 |
| Denmark - 0.2% | | | |
| Tryg A/S | | 24,000 | 565,200 |
| Finland - 0.4% | | | |
| Elisa Corp. (A Shares) | | 19,148 | 911,444 |
| Neste OYJ | | 12,378 | 198,741 |
TOTAL FINLAND | | | 1,110,185 |
| France - 2.6% | | | |
| Airbus Group NV | | 7,918 | 1,207,821 |
| Amundi SA (c) | | 5,200 | 376,144 |
| Capgemini SA | | 7,109 | 1,233,275 |
| Danone SA | | 7,800 | 557,221 |
| LVMH Moet Hennessy Louis Vuitton SE | | 3,387 | 2,254,796 |
| Thales SA | | 5,700 | 918,556 |
| Vallourec SA (a) | | 16,100 | 263,567 |
TOTAL FRANCE | | | 6,811,380 |
| Germany - 3.8% | | | |
| Deutsche Telekom AG | | 82,666 | 2,499,284 |
| Rheinmetall AG | | 10,947 | 5,634,676 |
| Siemens AG | | 8,321 | 1,618,849 |
TOTAL GERMANY | | | 9,752,809 |
| Hong Kong - 0.4% | | | |
| AIA Group Ltd. | | 145,886 | 1,151,379 |
| Hungary - 0.5% | | | |
| Richter Gedeon PLC | | 49,080 | 1,417,718 |
| India - 0.3% | | | |
| HDFC Bank Ltd. sponsored ADR | | 7,779 | 490,310 |
| Redington (India) Ltd. | | 71,339 | 164,485 |
TOTAL INDIA | | | 654,795 |
| Ireland - 0.4% | | | |
| AIB Group PLC | | 91,700 | 488,160 |
| Kerry Group PLC Class A | | 5,500 | 547,410 |
TOTAL IRELAND | | | 1,035,570 |
| Italy - 1.2% | | | |
| Prysmian SpA | | 24,900 | 1,755,648 |
| Recordati SpA | | 22,200 | 1,258,113 |
TOTAL ITALY | | | 3,013,761 |
| Japan - 5.5% | | | |
| Capcom Co. Ltd. | | 44,236 | 875,363 |
| Ebara Corp. | | 18,900 | 284,037 |
| Fuji Electric Co. Ltd. | | 5,300 | 269,918 |
| Hitachi Ltd. | | 105,825 | 2,658,838 |
| Hoya Corp. | | 6,132 | 820,425 |
| Inaba Denki Sangyo Co. Ltd. | | 53,346 | 1,338,018 |
| Mitsubishi Electric Corp. | | 33,000 | 580,554 |
| Renesas Electronics Corp. | | 75,479 | 1,011,292 |
| Roland Corp. | | 36,235 | 926,914 |
| Shin-Etsu Chemical Co. Ltd. | | 55,126 | 2,020,035 |
| Sony Group Corp. | | 125,040 | 2,200,394 |
| Toyota Motor Corp. | | 62,870 | 1,083,275 |
TOTAL JAPAN | | | 14,069,063 |
| Kenya - 0.1% | | | |
| Safaricom Ltd. | | 1,360,546 | 176,660 |
| Korea (South) - 0.7% | | | |
| Samsung Electronics Co. Ltd. | | 44,422 | 1,892,380 |
| South Africa - 0.2% | | | |
| Naspers Ltd. Class N | | 1,900 | 449,060 |
| Switzerland - 1.0% | | | |
| Compagnie Financiere Richemont SA Series A | | 5,540 | 806,627 |
| Galderma Group AG (a) | | 7,380 | 690,612 |
| Sika AG | | 4,091 | 1,139,350 |
TOTAL SWITZERLAND | | | 2,636,589 |
| Taiwan - 2.7% | | | |
| Taiwan Semiconductor Manufacturing Co. Ltd. | | 222,298 | 6,993,853 |
| United Kingdom - 7.4% | | | |
| AstraZeneca PLC sponsored ADR | | 40,959 | 2,914,233 |
| B&M European Value Retail SA | | 102,696 | 513,265 |
| BAE Systems PLC | | 100,174 | 1,614,535 |
| Compass Group PLC | | 74,759 | 2,427,905 |
| Diageo PLC | | 23,820 | 735,604 |
| Games Workshop Group PLC | | 2,700 | 416,389 |
| Halma PLC | | 9,000 | 287,225 |
| Hiscox Ltd. | | 30,673 | 427,945 |
| JD Sports Fashion PLC | | 682,287 | 1,090,921 |
| Lloyds Banking Group PLC | | 713,800 | 489,953 |
| London Stock Exchange Group PLC | | 13,400 | 1,816,181 |
| Premier Foods PLC | | 273,400 | 664,177 |
| RELX PLC (London Stock Exchange) | | 42,995 | 1,971,738 |
| Rolls-Royce Holdings PLC (a) | | 147,800 | 1,019,879 |
| RS GROUP PLC | | 95,777 | 858,323 |
| Starling Bank Ltd. Series D (a)(b)(d) | | 83,600 | 341,720 |
| Unilever PLC | | 24,801 | 1,512,911 |
| WH Smith PLC | | 35 | 596 |
TOTAL UNITED KINGDOM | | | 19,103,500 |
| United States of America - 60.7% | | | |
| AbbVie, Inc. | | 17,200 | 3,506,564 |
| Accenture PLC Class A | | 9,487 | 3,271,307 |
| Albertsons Companies, Inc. | | 13,500 | 244,350 |
| Alphabet, Inc. Class A | | 8,800 | 1,505,768 |
| Amdocs Ltd. | | 23,526 | 2,064,289 |
| Ameren Corp. | | 14,543 | 1,266,841 |
| American Tower Corp. | | 5,119 | 1,093,111 |
| Apollo Global Management, Inc. | | 6,300 | 902,538 |
| Apple, Inc. | | 60,651 | 13,701,667 |
| AT&T, Inc. | | 40,394 | 910,481 |
| Ball Corp. | | 10,798 | 639,782 |
| Bank of America Corp. | | 72,251 | 3,021,537 |
| BJ's Wholesale Club Holdings, Inc. (a) | | 9,831 | 832,981 |
| BlackRock, Inc. | | 1,100 | 1,079,133 |
| Broadcom, Inc. | | 3,000 | 509,310 |
| Capital One Financial Corp. | | 10,548 | 1,717,109 |
| Chubb Ltd. | | 6,827 | 1,928,218 |
| Cisco Systems, Inc. | | 44,675 | 2,446,850 |
| Comcast Corp. Class A | | 38,021 | 1,660,377 |
| Costco Wholesale Corp. | | 1,724 | 1,507,086 |
| Crane Co. | | 5,414 | 851,514 |
| Crane NXT Co. | | 5,914 | 320,953 |
| Crown Holdings, Inc. | | 13,682 | 1,279,951 |
| Danaher Corp. | | 10,771 | 2,646,004 |
| Dollar Tree, Inc. (a) | | 8,910 | 575,942 |
| Eli Lilly & Co. | | 4,338 | 3,599,412 |
| Exxon Mobil Corp. | | 27,704 | 3,235,273 |
| Freeport-McMoRan, Inc. | | 32,034 | 1,442,171 |
| GE Aerospace | | 17,113 | 2,939,671 |
| GE Vernova LLC | | 4,278 | 1,290,501 |
| General Dynamics Corp. | | 2,900 | 845,669 |
| Gilead Sciences, Inc. | | 20,405 | 1,812,372 |
| GSK PLC | | 56,100 | 1,013,086 |
| H&R Block, Inc. | | 39,839 | 2,379,583 |
| Hartford Financial Services Group, Inc. | | 25,181 | 2,780,990 |
| Hess Corp. | | 8,598 | 1,156,259 |
| Johnson Controls International PLC | | 14,548 | 1,099,101 |
| JPMorgan Chase & Co. | | 19,622 | 4,354,514 |
| Keurig Dr. Pepper, Inc. | | 32,628 | 1,075,093 |
| Lamar Advertising Co. Class A | | 15,363 | 2,027,916 |
| Linde PLC | | 8,468 | 3,862,678 |
| Lowe's Companies, Inc. | | 8,507 | 2,227,388 |
| M&T Bank Corp. | | 12,122 | 2,359,911 |
| McDonald's Corp. | | 6,393 | 1,867,459 |
| Merck & Co., Inc. | | 24,683 | 2,525,565 |
| Microsoft Corp. | | 29,350 | 11,926,373 |
| Mondelez International, Inc. | | 9,931 | 680,075 |
| MSCI, Inc. | | 1,289 | 736,277 |
| Nestle SA (Reg. S) | | 12,462 | 1,177,567 |
| NextEra Energy, Inc. | | 28,237 | 2,237,782 |
| Norfolk Southern Corp. | | 4,300 | 1,076,849 |
| PG&E Corp. | | 34,085 | 689,199 |
| Phillips 66 Co. | | 4,378 | 533,328 |
| PNC Financial Services Group, Inc. | | 14,347 | 2,701,110 |
| Procter & Gamble Co. | | 17,790 | 2,938,552 |
| Roche Holding AG (participation certificate) | | 5,780 | 1,791,242 |
| Samsonite International SA (c) | | 202,500 | 475,856 |
| Sanofi SA | | 15,612 | 1,649,873 |
| Shell PLC (London) | | 38,199 | 1,275,362 |
| Southern Co. | | 17,868 | 1,626,524 |
| Southwest Gas Holdings, Inc. | | 6,800 | 498,100 |
| Spirit AeroSystems Holdings, Inc. Class A (a) | | 7,600 | 246,012 |
| Starbucks Corp. | | 5,600 | 547,120 |
| T-Mobile U.S., Inc. | | 15,377 | 3,431,531 |
| Tapestry, Inc. | | 19,450 | 922,903 |
| Target Corp. | | 5,745 | 861,980 |
| The Coca-Cola Co. | | 33,732 | 2,203,037 |
| The Travelers Companies, Inc. | | 9,056 | 2,227,233 |
| The Walt Disney Co. | | 20,800 | 2,000,960 |
| TJX Companies, Inc. | | 25,426 | 2,873,901 |
| U.S. Bancorp | | 32,900 | 1,589,399 |
| UnitedHealth Group, Inc. | | 6,330 | 3,573,285 |
| Valero Energy Corp. | | 3,391 | 440,016 |
| Veralto Corp. | | 6,671 | 681,709 |
| Verizon Communications, Inc. | | 22,082 | 930,315 |
| Vistra Corp. | | 26,856 | 3,355,926 |
| Walmart, Inc. | | 27,840 | 2,281,488 |
| WEC Energy Group, Inc. | | 7,715 | 737,014 |
| Wells Fargo & Co. | | 34,681 | 2,251,491 |
TOTAL UNITED STATES OF AMERICA | | | 156,547,664 |
| Zambia - 0.3% | | | |
| First Quantum Minerals Ltd. (a) | | 52,657 | 680,360 |
| TOTAL COMMON STOCKS (Cost $171,752,962) | | | 250,320,577 |
| | | | |
| Money Market Funds - 2.9% |
| | | Shares | Value ($) |
Fidelity Cash Central Fund 4.87% (e) (Cost $7,369,184) | | 7,367,711 | 7,369,184 |
| | | | |
| TOTAL INVESTMENT IN SECURITIES - 100.0% (Cost $179,122,146) | 257,689,761 |
NET OTHER ASSETS (LIABILITIES) - 0.0% | 7,692 |
| NET ASSETS - 100.0% | 257,697,453 |
| | |
Legend
| (c) | Security exempt from registration under Rule 144A of the Securities Act of 1933. These securities may be resold in transactions exempt from registration, normally to qualified institutional buyers. At the end of the period, the value of these securities amounted to $852,000 or 0.3% of net assets. |
| (d) | Restricted securities (including private placements) - Investment in securities not registered under the Securities Act of 1933 (excluding 144A issues). At the end of the period, the value of restricted securities (excluding 144A issues) amounted to $341,720 or 0.1% of net assets. |
| (e) | Affiliated fund that is generally available only to investment companies and other accounts managed by Fidelity Investments. The rate quoted is the annualized seven-day yield of the fund at period end. A complete unaudited listing of the fund's holdings as of its most recent quarter end is available upon request. In addition, each Fidelity Central Fund's financial statements, which are not covered by the Fund's Report of Independent Registered Public Accounting Firm, are available on the SEC's website or upon request. |
| Additional information on each restricted holding is as follows: |
| Security | Acquisition Date | Acquisition Cost ($) |
| Starling Bank Ltd. Series D | 6/18/21 - 4/05/22 | 170,980 |
| | | |
Affiliated Central Funds
Fiscal year to date information regarding the Fund's investments in Fidelity Central Funds, including the ownership percentage, is presented below.
| Affiliate | Value, beginning of period ($) | Purchases ($) | Sales Proceeds ($) | Dividend Income ($) | Realized Gain (loss) ($) | Change in Unrealized appreciation (depreciation) ($) | Value, end of period ($) | % ownership, end of period |
| Fidelity Cash Central Fund 4.87% | 2,909,895 | 46,291,888 | 44,291,104 | 202,623 | (110) | - | 7,369,184 | 0.0% |
| Fidelity Securities Lending Cash Central Fund 4.87% | - | 5,359,107 | 5,359,107 | 901 | - | - | - | 0.0% |
| Total | 2,909,895 | 51,650,995 | 49,650,211 | 203,524 | (110) | - | 7,369,184 | |
| | | | | | | | | |
Amounts in the dividend income column in the above table include any capital gain distributions from underlying funds, which are presented in the corresponding line item in the Statement of Operations, if applicable.
Amounts in the dividend income column for Fidelity Securities Lending Cash Central Fund represents the income earned on investing cash collateral, less rebates paid to borrowers and any lending agent fees associated with the loan, plus any premium payments received for lending certain types of securities.
Amounts included in the purchases and sales proceeds columns may include in-kind transactions, if applicable.
Investment Valuation
The following is a summary of the inputs used, as of October 31, 2024, involving the Fund's assets and liabilities carried at fair value. The inputs or methodology used for valuing securities may not be an indication of the risk associated with investing in those securities. For more information on valuation inputs, and their aggregation into the levels used below, please refer to the Investment Valuation section in the accompanying Notes to Financial Statements.
| Valuation Inputs at Reporting Date: |
| Description | Total ($) | Level 1 ($) | Level 2 ($) | Level 3 ($) |
Investments in Securities: | | | | |
|
| Equities: | | | | |
Communication Services | 15,883,257 | 12,508,610 | 3,374,647 | - |
Consumer Discretionary | 24,403,297 | 13,778,470 | 10,624,827 | - |
Consumer Staples | 22,729,859 | 18,746,556 | 3,983,303 | - |
Energy | 12,468,921 | 10,994,818 | 1,474,103 | - |
Financials | 35,057,261 | 31,258,028 | 3,457,513 | 341,720 |
Health Care | 30,243,923 | 24,969,297 | 5,274,626 | - |
Industrials | 30,762,416 | 18,198,229 | 12,564,187 | - |
Information Technology | 52,721,538 | 41,426,253 | 11,295,285 | - |
Materials | 11,064,327 | 9,044,292 | 2,020,035 | - |
Real Estate | 3,121,027 | 3,121,027 | - | - |
Utilities | 11,864,751 | 11,864,751 | - | - |
|
| Money Market Funds | 7,369,184 | 7,369,184 | - | - |
| Total Investments in Securities: | 257,689,761 | 203,279,515 | 54,068,526 | 341,720 |
Financial Statements
| Statement of Assets and Liabilities |
As of October 31, 2024 |
| Assets | | | | |
| Investment in securities, at value - See accompanying schedule: | | | | |
Unaffiliated issuers (cost $171,752,962) | $ | 250,320,577 | | |
Fidelity Central Funds (cost $7,369,184) | | 7,369,184 | | |
| | | | | |
| | | | | |
| Total Investment in Securities (cost $179,122,146) | | | $ | 257,689,761 |
| Foreign currency held at value (cost $14,961) | | | | 14,853 |
| Receivable for investments sold | | | | 16,081 |
| Receivable for fund shares sold | | | | 45,474 |
| Dividends receivable | | | | 259,961 |
| Reclaims receivable | | | | 281,876 |
| Distributions receivable from Fidelity Central Funds | | | | 27,809 |
| Prepaid expenses | | | | 188 |
| Other receivables | | | | 12,201 |
Total assets | | | | 258,348,204 |
| Liabilities | | | | |
| Payable for fund shares redeemed | $ | 308,596 | | |
| Accrued management fee | | 187,427 | | |
| Distribution and service plan fees payable | | 16,389 | | |
| Audit fee payable | | 88,902 | | |
| Other payables and accrued expenses | | 49,437 | | |
| Total liabilities | | | | 650,751 |
| Net Assets | | | $ | 257,697,453 |
| Net Assets consist of: | | | | |
| Paid in capital | | | $ | 185,533,231 |
| Total accumulated earnings (loss) | | | | 72,164,222 |
| Net Assets | | | $ | 257,697,453 |
| | | | | |
| Net Asset Value and Maximum Offering Price | | | | |
| Class A : | | | | |
Net Asset Value and redemption price per share ($24,403,338 ÷ 1,198,524 shares)(a) | | | $ | 20.36 |
| Maximum offering price per share (100/94.25 of $20.36) | | | $ | 21.60 |
| Class M : | | | | |
Net Asset Value and redemption price per share ($16,567,669 ÷ 813,716 shares)(a) | | | $ | 20.36 |
| Maximum offering price per share (100/96.50 of $20.36) | | | $ | 21.10 |
| Class C : | | | | |
Net Asset Value and offering price per share ($4,952,591 ÷ 243,383 shares)(a) | | | $ | 20.35 |
| Fidelity Global Equity Income Fund : | | | | |
Net Asset Value, offering price and redemption price per share ($166,803,098 ÷ 8,191,888 shares) | | | $ | 20.36 |
| Class I : | | | | |
Net Asset Value, offering price and redemption price per share ($14,026,269 ÷ 688,852 shares) | | | $ | 20.36 |
| Class Z : | | | | |
Net Asset Value, offering price and redemption price per share ($30,944,488 ÷ 1,519,689 shares) | | | $ | 20.36 |
(a)Redemption price per share is equal to net asset value less any applicable contingent deferred sales charge. |
| Statement of Operations |
| Year ended October 31, 2024 |
| Investment Income | | | | |
| Dividends | | | $ | 3,258,921 |
| Income from Fidelity Central Funds (including $901 from security lending) | | | | 203,524 |
| Income before foreign taxes withheld | | | $ | 3,462,445 |
| Less foreign taxes withheld | | | | (149,136) |
| Total income | | | | 3,313,309 |
| Expenses | | | | |
| Management fee | $ | 1,247,170 | | |
| Transfer agent fees | | 88,871 | | |
| Distribution and service plan fees | | 2,874 | | |
| Accounting fees | | 25,744 | | |
| Custodian fees and expenses | | 12,758 | | |
| Independent trustees' fees and expenses | | 741 | | |
| Registration fees | | 30,855 | | |
| Audit fees | | 76,912 | | |
| Legal | | 1,038 | | |
| Interest | | 1,017 | | |
| Miscellaneous | | 3,999 | | |
| Total expenses before reductions | | 1,491,979 | | |
| Expense reductions | | (7,215) | | |
| Total expenses after reductions | | | | 1,484,764 |
| Net Investment income (loss) | | | | 1,828,545 |
| Realized and Unrealized Gain (Loss) | | | | |
| Net realized gain (loss) on: | | | | |
| Investment Securities: | | | | |
| Unaffiliated issuers (net of foreign taxes of $9,244) | | 4,343,803 | | |
| Fidelity Central Funds | | (110) | | |
| Foreign currency transactions | | (20,017) | | |
| Total net realized gain (loss) | | | | 4,323,676 |
| Change in net unrealized appreciation (depreciation) on: | | | | |
| Investment Securities: | | | | |
| Unaffiliated issuers (net of increase in deferred foreign taxes of $9,599) | | 29,439,535 | | |
| Assets and liabilities in foreign currencies | | 15,871 | | |
| Total change in net unrealized appreciation (depreciation) | | | | 29,455,406 |
| Net gain (loss) | | | | 33,779,082 |
| Net increase (decrease) in net assets resulting from operations | | | $ | 35,607,627 |
| Statement of Changes in Net Assets |
| |
| | Year ended October 31, 2024 | | Year ended October 31, 2023 |
| Increase (Decrease) in Net Assets | | | | |
| Operations | | | | |
| Net investment income (loss) | $ | 1,828,545 | $ | 2,123,940 |
| Net realized gain (loss) | | 4,323,676 | | (502,645) |
| Change in net unrealized appreciation (depreciation) | | 29,455,406 | | 6,189,227 |
| Net increase (decrease) in net assets resulting from operations | | 35,607,627 | | 7,810,522 |
| Distributions to shareholders | | (1,803,376) | | (2,201,013) |
| | | | | |
| Share transactions - net increase (decrease) | | 75,952,778 | | 2,975,883 |
| Total increase (decrease) in net assets | | 109,757,029 | | 8,585,392 |
| | | | | |
| Net Assets | | | | |
| Beginning of period | | 147,940,424 | | 139,355,032 |
| End of period | $ | 257,697,453 | $ | 147,940,424 |
| | | | | |
| | | | | |
Financial Highlights
Fidelity Advisor® Global Equity Income Fund Class A |
| |
| Years ended October 31, | | 2024 A |
Selected Per-Share Data | | |
| Net asset value, beginning of period | $ | 21.10 |
| Income from Investment Operations | | |
Net investment income (loss) B,C | | (.01) |
| Net realized and unrealized gain (loss) | | (.73) D |
| Total from investment operations | | (.74) |
| Net asset value, end of period | $ | 20.36 |
Total Return E,F,G | | |
Ratios to Average Net Assets B,H,I | | |
| Expenses before reductions | | 1.06% J,K |
| Expenses net of fee waivers, if any | | |
| Expenses net of all reductions | | 1.05% J,K |
| Net investment income (loss) | | (.82)% J,K |
| Supplemental Data | | |
| Net assets, end of period (000 omitted) | $ | 24,403 |
Portfolio turnover rate L | | |
AFor the period October 18, 2024 (commencement of sale of shares) through October 31, 2024.
BNet investment income (loss) is affected by the timing of the declaration of dividends by any underlying mutual funds or exchange-traded funds (ETFs). Net investment income (loss) of any mutual funds or ETFs is not included in the Fund's net investment income (loss) ratio.
CCalculated based on average shares outstanding during the period.
DThe amount shown for a share outstanding does not correspond with the aggregate net gain (loss) on investments for the period due to the timing of sales and repurchases of shares in relation to fluctuating market values of the investments of the Fund.
ETotal returns for periods of less than one year are not annualized.
FTotal returns would have been lower if certain expenses had not been reduced during the applicable periods shown.
GTotal returns do not include the effect of the sales charges.
HExpense ratios reflect operating expenses of the class. Expenses before reductions do not reflect amounts reimbursed, waived, or reduced through arrangements with the investment adviser, brokerage services, or other offset arrangements, if applicable, and do not represent the amount paid by the class during periods when reimbursements, waivers or reductions occur.
IFees and expenses of any underlying mutual funds or exchange-traded funds (ETFs) are not included in the Fund's expense ratio. The Fund indirectly bears its proportionate share of these expenses. For additional expense information related to investments in Fidelity Central Funds, please refer to the "Investments in Fidelity Central Funds" note found in the Notes to Financial Statements section of the most recent Annual or Semi-Annual report.
JAnnualized.
KAudit fees are not annualized.
LAmount does not include the portfolio activity of any underlying mutual funds or exchange-traded funds (ETFs).
MThe portfolio turnover rate does not include the assets acquired in the reorganization.
Fidelity Advisor® Global Equity Income Fund Class M |
| |
| Years ended October 31, | | 2024 A |
Selected Per-Share Data | | |
| Net asset value, beginning of period | $ | 21.10 |
| Income from Investment Operations | | |
Net investment income (loss) B,C | | (.01) |
| Net realized and unrealized gain (loss) | | (.73) D |
| Total from investment operations | | (.74) |
| Net asset value, end of period | $ | 20.36 |
Total Return E,F,G | | |
Ratios to Average Net Assets C,H,I | | |
| Expenses before reductions | | 1.31% J,K |
| Expenses net of fee waivers, if any | | |
| Expenses net of all reductions | | 1.31% J,K |
| Net investment income (loss) | | (1.07)% J,K |
| Supplemental Data | | |
| Net assets, end of period (000 omitted) | $ | 16,568 |
Portfolio turnover rate L | | |
AFor the period October 18, 2024 (commencement of sale of shares) through October 31, 2024.
BCalculated based on average shares outstanding during the period.
CNet investment income (loss) is affected by the timing of the declaration of dividends by any underlying mutual funds or exchange-traded funds (ETFs). Net investment income (loss) of any mutual funds or ETFs is not included in the Fund's net investment income (loss) ratio.
DThe amount shown for a share outstanding does not correspond with the aggregate net gain (loss) on investments for the period due to the timing of sales and repurchases of shares in relation to fluctuating market values of the investments of the Fund.
ETotal returns for periods of less than one year are not annualized.
FTotal returns would have been lower if certain expenses had not been reduced during the applicable periods shown.
GTotal returns do not include the effect of the sales charges.
HFees and expenses of any underlying mutual funds or exchange-traded funds (ETFs) are not included in the Fund's expense ratio. The Fund indirectly bears its proportionate share of these expenses. For additional expense information related to investments in Fidelity Central Funds, please refer to the "Investments in Fidelity Central Funds" note found in the Notes to Financial Statements section of the most recent Annual or Semi-Annual report.
IExpense ratios reflect operating expenses of the class. Expenses before reductions do not reflect amounts reimbursed, waived, or reduced through arrangements with the investment adviser, brokerage services, or other offset arrangements, if applicable, and do not represent the amount paid by the class during periods when reimbursements, waivers or reductions occur.
JAnnualized.
KAudit fees are not annualized.
LAmount does not include the portfolio activity of any underlying mutual funds or exchange-traded funds (ETFs).
MThe portfolio turnover rate does not include the assets acquired in the reorganization.
Fidelity Advisor® Global Equity Income Fund Class C |
| |
| Years ended October 31, | | 2024 A |
Selected Per-Share Data | | |
| Net asset value, beginning of period | $ | 21.10 |
| Income from Investment Operations | | |
Net investment income (loss) B,C | | (.01) |
| Net realized and unrealized gain (loss) | | (.74) D |
| Total from investment operations | | (.75) |
| Net asset value, end of period | $ | 20.35 |
Total Return E,F,G | | |
Ratios to Average Net Assets C,H,I | | |
| Expenses before reductions | | 1.81% J,K |
| Expenses net of fee waivers, if any | | |
| Expenses net of all reductions | | 1.80% J,K |
| Net investment income (loss) | | (1.57)% J,K |
| Supplemental Data | | |
| Net assets, end of period (000 omitted) | $ | 4,953 |
Portfolio turnover rate L | | |
AFor the period October 18, 2024 (commencement of sale of shares) through October 31, 2024.
BCalculated based on average shares outstanding during the period.
CNet investment income (loss) is affected by the timing of the declaration of dividends by any underlying mutual funds or exchange-traded funds (ETFs). Net investment income (loss) of any mutual funds or ETFs is not included in the Fund's net investment income (loss) ratio.
DThe amount shown for a share outstanding does not correspond with the aggregate net gain (loss) on investments for the period due to the timing of sales and repurchases of shares in relation to fluctuating market values of the investments of the Fund.
ETotal returns for periods of less than one year are not annualized.
FTotal returns would have been lower if certain expenses had not been reduced during the applicable periods shown.
GTotal returns do not include the effect of the contingent deferred sales charge.
HFees and expenses of any underlying mutual funds or exchange-traded funds (ETFs) are not included in the Fund's expense ratio. The Fund indirectly bears its proportionate share of these expenses. For additional expense information related to investments in Fidelity Central Funds, please refer to the "Investments in Fidelity Central Funds" note found in the Notes to Financial Statements section of the most recent Annual or Semi-Annual report.
IExpense ratios reflect operating expenses of the class. Expenses before reductions do not reflect amounts reimbursed, waived, or reduced through arrangements with the investment adviser, brokerage services, or other offset arrangements, if applicable, and do not represent the amount paid by the class during periods when reimbursements, waivers or reductions occur.
JAnnualized.
KAudit fees are not annualized.
LAmount does not include the portfolio activity of any underlying mutual funds or exchange-traded funds (ETFs).
MThe portfolio turnover rate does not include the assets acquired in the reorganization.
Fidelity® Global Equity Income Fund |
| |
| Years ended October 31, | | 2024 | | 2023 | | 2022 | | 2021 | | 2020 |
Selected Per-Share Data | | | | | | | | | | |
| Net asset value, beginning of period | $ | 16.19 | $ | 15.58 | $ | 19.80 | $ | 15.12 | $ | 14.64 |
| Income from Investment Operations | | | | | | | | | | |
Net investment income (loss) A,B | | .22 | | .22 | | .20 | | .15 | | .16 |
| Net realized and unrealized gain (loss) | | 4.17 | | .62 | | (2.21) | | 5.07 | | .48 |
| Total from investment operations | | 4.39 | | .84 | | (2.01) | | 5.22 | | .64 |
| Distributions from net investment income | | (.22) | | (.23) | | (.17) | | (.16) | | (.15) |
| Distributions from net realized gain | | - | | - | | (2.04) | | (.38) | | (.01) |
| Total distributions | | (.22) | | (.23) | | (2.21) | | (.54) | | (.16) |
| Net asset value, end of period | $ | 20.36 | $ | 16.19 | $ | 15.58 | $ | 19.80 | $ | 15.12 |
Total Return C | | | | 5.36% | | (11.45)% | | 35.09% | | 4.44% |
Ratios to Average Net Assets B,D,E | | | | | | | | | | |
| Expenses before reductions | | .93% | | 1.00% | | .98% | | 1.02% | | 1.09% |
| Expenses net of fee waivers, if any | | | | 1.00% | | .98% | | 1.02% | | 1.09% |
| Expenses net of all reductions | | .92% | | 1.00% | | .98% | | 1.02% | | 1.09% |
| Net investment income (loss) | | 1.15% | | 1.33% | | 1.22% | | .84% | | 1.08% |
| Supplemental Data | | | | | | | | | | |
| Net assets, end of period (000 omitted) | $ | 166,803 | $ | 147,940 | $ | 139,355 | $ | 92,918 | $ | 66,715 |
Portfolio turnover rate F | | | | 30% | | 61% | | 43% | | 48% |
ACalculated based on average shares outstanding during the period.
BNet investment income (loss) is affected by the timing of the declaration of dividends by any underlying mutual funds or exchange-traded funds (ETFs). Net investment income (loss) of any mutual funds or ETFs is not included in the Fund's net investment income (loss) ratio.
CTotal returns would have been lower if certain expenses had not been reduced during the applicable periods shown.
DFees and expenses of any underlying mutual funds or exchange-traded funds (ETFs) are not included in the Fund's expense ratio. The Fund indirectly bears its proportionate share of these expenses. For additional expense information related to investments in Fidelity Central Funds, please refer to the "Investments in Fidelity Central Funds" note found in the Notes to Financial Statements section of the most recent Annual or Semi-Annual report.
EExpense ratios reflect operating expenses of the class. Expenses before reductions do not reflect amounts reimbursed, waived, or reduced through arrangements with the investment adviser, brokerage services, or other offset arrangements, if applicable, and do not represent the amount paid by the class during periods when reimbursements, waivers or reductions occur.
FAmount does not include the portfolio activity of any underlying mutual funds or exchange-traded funds (ETFs).
GThe portfolio turnover rate does not include the assets acquired in the reorganization.
Fidelity Advisor® Global Equity Income Fund Class I |
| |
| Years ended October 31, | | 2024 A |
Selected Per-Share Data | | |
| Net asset value, beginning of period | $ | 21.10 |
| Income from Investment Operations | | |
Net investment income (loss) B,C | | - D |
| Net realized and unrealized gain (loss) | | (.74) E |
| Total from investment operations | | (.74) |
| Net asset value, end of period | $ | 20.36 |
Total Return F,G | | |
Ratios to Average Net Assets C,H,I | | |
| Expenses before reductions | | .80% J,K |
| Expenses net of fee waivers, if any | | |
| Expenses net of all reductions | | .80% J,K |
| Net investment income (loss) | | (.57)% J,K |
| Supplemental Data | | |
| Net assets, end of period (000 omitted) | $ | 14,026 |
Portfolio turnover rate L | | |
AFor the period October 18, 2024 (commencement of sale of shares) through October 31, 2024.
BCalculated based on average shares outstanding during the period.
CNet investment income (loss) is affected by the timing of the declaration of dividends by any underlying mutual funds or exchange-traded funds (ETFs). Net investment income (loss) of any mutual funds or ETFs is not included in the Fund's net investment income (loss) ratio.
DAmount represents less than $.005 per share.
EThe amount shown for a share outstanding does not correspond with the aggregate net gain (loss) on investments for the period due to the timing of sales and repurchases of shares in relation to fluctuating market values of the investments of the Fund.
FTotal returns for periods of less than one year are not annualized.
GTotal returns would have been lower if certain expenses had not been reduced during the applicable periods shown.
HFees and expenses of any underlying mutual funds or exchange-traded funds (ETFs) are not included in the Fund's expense ratio. The Fund indirectly bears its proportionate share of these expenses. For additional expense information related to investments in Fidelity Central Funds, please refer to the "Investments in Fidelity Central Funds" note found in the Notes to Financial Statements section of the most recent Annual or Semi-Annual report.
IExpense ratios reflect operating expenses of the class. Expenses before reductions do not reflect amounts reimbursed, waived, or reduced through arrangements with the investment adviser, brokerage services, or other offset arrangements, if applicable, and do not represent the amount paid by the class during periods when reimbursements, waivers or reductions occur.
JAnnualized.
KAudit fees are not annualized.
LAmount does not include the portfolio activity of any underlying mutual funds or exchange-traded funds (ETFs).
MThe portfolio turnover rate does not include the assets acquired in the reorganization.
Fidelity Advisor® Global Equity Income Fund Class Z |
| |
| Years ended October 31, | | 2024 A |
Selected Per-Share Data | | |
| Net asset value, beginning of period | $ | 21.10 |
| Income from Investment Operations | | |
Net investment income (loss) B,C | | - D |
| Net realized and unrealized gain (loss) | | (.74) E |
| Total from investment operations | | (.74) |
| Net asset value, end of period | $ | 20.36 |
Total Return F,G | | |
Ratios to Average Net Assets C,H | | |
| Expenses before reductions | | .64% I,J |
| Expenses net of fee waivers, if any | | |
| Expenses net of all reductions | | .64% I,J |
| Net investment income (loss) | | (.41)% I,J |
| Supplemental Data | | |
| Net assets, end of period (000 omitted) | $ | 30,944 |
Portfolio turnover rate K | | |
AFor the period October 18, 2024 (commencement of sale of shares) through October 31, 2024.
BCalculated based on average shares outstanding during the period.
CNet investment income (loss) is affected by the timing of the declaration of dividends by any underlying mutual funds or exchange-traded funds (ETFs). Net investment income (loss) of any mutual funds or ETFs is not included in the Fund's net investment income (loss) ratio.
DAmount represents less than $.005 per share.
EThe amount shown for a share outstanding does not correspond with the aggregate net gain (loss) on investments for the period due to the timing of sales and repurchases of shares in relation to fluctuating market values of the investments of the Fund.
FTotal returns for periods of less than one year are not annualized.
GTotal returns would have been lower if certain expenses had not been reduced during the applicable periods shown.
HExpense ratios reflect operating expenses of the class. Expenses before reductions do not reflect amounts reimbursed, waived, or reduced through arrangements with the investment adviser, brokerage services, or other offset arrangements, if applicable, and do not represent the amount paid by the class during periods when reimbursements, waivers or reductions occur.
IAnnualized.
JAudit fees are not annualized.
KAmount does not include the portfolio activity of any underlying mutual funds or exchange-traded funds (ETFs).
LThe portfolio turnover rate does not include the assets acquired in the reorganization.
Notes to Financial Statements
For the period ended October 31, 2024
1. Organization.
Fidelity Global Equity Income Fund (the Fund) is a fund of Fidelity Investment Trust (the Trust) and is authorized to issue an unlimited number of shares. The Trust is registered under the Investment Company Act of 1940, as amended (the 1940 Act), as an open-end management investment company organized as a Massachusetts business trust. The Fund commenced sale of Class A, Class M, Class C, Class I and Class Z shares on October 18, 2024. The Fund offers Class A, Class M, Class C, Global Equity Income, Class I and Class Z shares, each of which has equal rights as to assets and voting privileges. Class A, Class M, Class C, Class I and Class Z are Fidelity Advisor classes. Each class has exclusive voting rights with respect to matters that affect that class. Class C shares will automatically convert to Class A shares after a holding period of eight years from the initial date of purchase, with certain exceptions.
2. Investments in Fidelity Central Funds.
Funds may invest in Fidelity Central Funds, which are open-end investment companies generally available only to other investment companies and accounts managed by the investment adviser and its affiliates. The Schedule of Investments lists any Fidelity Central Funds held as an investment as of period end, but does not include the underlying holdings of each Fidelity Central Fund. An investing fund indirectly bears its proportionate share of the expenses of the underlying Fidelity Central Funds.
Based on its investment objective, each Fidelity Central Fund may invest or participate in various investment vehicles or strategies that are similar to those of the investing fund. These strategies are consistent with the investment objectives of the investing fund and may involve certain economic risks which may cause a decline in value of each of the Fidelity Central Funds and thus a decline in the value of the investing fund.
| Fidelity Central Fund | Investment Manager | Investment Objective | Investment Practices | Expense RatioA |
| Fidelity Money Market Central Funds | Fidelity Management & Research Company LLC (FMR) | Each fund seeks to obtain a high level of current income consistent with the preservation of capital and liquidity. | Short-term Investments | Less than .005% |
A Expenses expressed as a percentage of average net assets and are as of each underlying Central Fund's most recent annual or semi-annual shareholder report.
A complete unaudited list of holdings for each Fidelity Central Fund is available upon request or at the Securities and Exchange Commission website at www.sec.gov. In addition, the financial statements of the Fidelity Central Funds which contain the significant accounting policies (including investment valuation policies) of those funds, and are not covered by the Report of Independent Registered Public Accounting Firm, are available on the Securities and Exchange Commission website or upon request.
3. Significant Accounting Policies.
The Fund is an investment company and applies the accounting and reporting guidance of the Financial Accounting Standards Board (FASB) Accounting Standards Codification Topic 946 Financial Services - Investment Companies. The financial statements have been prepared in conformity with accounting principles generally accepted in the United States of America (GAAP), which require management to make certain estimates and assumptions at the date of the financial statements. Actual results could differ from those estimates. Subsequent events, if any, through the date that the financial statements were issued have been evaluated in the preparation of the financial statements. The Fund's Schedule of Investments lists any underlying mutual funds or exchange-traded funds (ETFs) but does not include the underlying holdings of these funds. The following summarizes the significant accounting policies of the Fund:
Investment Valuation. Investments are valued as of 4:00 p.m. Eastern time on the last calendar day of the period. The Board of Trustees (the Board) has designated the Fund's investment adviser as the valuation designee responsible for the fair valuation function and performing fair value determinations as needed. The investment adviser has established a Fair Value Committee (the Committee) to carry out the day-to-day fair valuation responsibilities and has adopted policies and procedures to govern the fair valuation process and the activities of the Committee. In accordance with these fair valuation policies and procedures, which have been approved by the Board, the Fund attempts to obtain prices from one or more third party pricing services or brokers to value its investments. When current market prices, quotations or currency exchange rates are not readily available or reliable, investments will be fair valued in good faith by the Committee, in accordance with the policies and procedures. Factors used in determining fair value vary by investment type and may include market or investment specific events, transaction data, estimated cash flows, and market observations of comparable investments. The frequency that the fair valuation procedures are used cannot be predicted and they may be utilized to a significant extent. The Committee manages the Fund's fair valuation practices and maintains the fair valuation policies and procedures. The Fund's investment adviser reports to the Board information regarding the fair valuation process and related material matters.
The Fund categorizes the inputs to valuation techniques used to value its investments into a disclosure hierarchy consisting of three levels as shown below:
Level 1 - unadjusted quoted prices in active markets for identical investments
Level 2 - other significant observable inputs (including quoted prices for similar investments, interest rates, prepayment speeds, etc.)
Level 3 - unobservable inputs (including the Fund's own assumptions based on the best information available)
Valuation techniques used to value the Fund's investments by major category are as follows:
Equity securities, including restricted securities, for which market quotations are readily available, are valued at the last reported sale price or official closing price as reported by a third party pricing service on the primary market or exchange on which they are traded and are categorized as Level 1 in the hierarchy. In the event there were no sales during the day or closing prices are not available, securities are valued at the last quoted bid price or may be valued using the last available price and are generally categorized as Level 2 in the hierarchy. For foreign equity securities, when market or security specific events arise, comparisons to the valuation of American Depositary Receipts (ADRs), futures contracts, Exchange-Traded Funds (ETFs) and certain indexes as well as quoted prices for similar securities may be used and would be categorized as Level 2 in the hierarchy. For equity securities, including restricted securities, where observable inputs are limited, assumptions about market activity and risk are used and these securities may be categorized as Level 3 in the hierarchy.
Investments in open-end mutual funds, including the Fidelity Central Funds, are valued at their closing net asset value (NAV) each business day and are categorized as Level 1 in the hierarchy.
Changes in valuation techniques may result in transfers in or out of an assigned level within the disclosure hierarchy. The aggregate value of investments by input level as of October 31, 2024 is included at the end of the Fund's Schedule of Investments.
Foreign Currency. Certain Funds may use foreign currency contracts to facilitate transactions in foreign-denominated securities. Gains and losses from these transactions may arise from changes in the value of the foreign currency or if the counterparties do not perform under the contracts' terms.
Foreign-denominated assets, including investment securities, and liabilities are translated into U.S. dollars at the exchange rates at period end. Purchases and sales of investment securities, income and dividends received, and expenses denominated in foreign currencies are translated into U.S. dollars at the exchange rate in effect on the transaction date.
The effects of exchange rate fluctuations on investments are included with the net realized and unrealized gain (loss) on investment securities. Other foreign currency transactions resulting in realized and unrealized gain (loss) are disclosed separately.
Investment Transactions and Income. For financial reporting purposes, the Fund's investment holdings and NAV include trades executed through the end of the last business day of the period. The NAV per share for processing shareholder transactions is calculated as of the close of business of the New York Stock Exchange (NYSE), normally 4:00 p.m. Eastern time and includes trades executed through the end of the prior business day. Gains and losses on securities sold are determined on the basis of identified cost and include proceeds received from litigation. Commissions paid to certain brokers with whom the investment adviser, or its affiliates, places trades on behalf of a fund include an amount in addition to trade execution, which may be rebated back to a fund. Any such rebates are included in net realized gain (loss) on investments in the Statement of Operations. Dividend income is recorded on the ex-dividend date, except for certain dividends from foreign securities where the ex-dividend date may have passed, which are recorded as soon as the Fund is informed of the ex-dividend date. Non-cash dividends included in dividend income, if any, are recorded at the fair market value of the securities received. Income and capital gain distributions from Fidelity Central Funds, if any, are recorded on the ex-dividend date. Certain distributions received by the Fund represent a return of capital or capital gain. The Fund determines the components of these distributions subsequent to the ex-dividend date, based upon receipt of tax filings or other correspondence relating to the underlying investment. These distributions are recorded as a reduction of cost of investments and/or as a realized gain. Investment income is recorded net of foreign taxes withheld where recovery of such taxes is uncertain. Funds may file withholding tax reclaims in certain jurisdictions to recover a portion of amounts previously withheld. Any withholding tax reclaims income is included in the Statement of Operations in foreign taxes withheld. Any receivables for withholding tax reclaims are included in the Statement of Assets and Liabilities in reclaims receivable.
Class Allocations and Expenses. Investment income, realized and unrealized capital gains and losses, common expenses of a fund, and certain fund-level expense reductions, if any, are allocated daily on a pro-rata basis to each class based on the relative net assets of each class to the total net assets of a fund. Each class differs with respect to transfer agent and distribution and service plan fees incurred, as applicable. Certain expense reductions may also differ by class, if applicable. For the reporting period, the allocated portion of income and expenses to each class as a percent of its average net assets may vary due to the timing of recording these transactions in relation to fluctuating net assets of the classes. Expenses directly attributable to a fund are charged to that fund. Expenses attributable to more than one fund are allocated among the respective funds on the basis of relative net assets or other appropriate methods. Expenses included in the accompanying financial statements reflect the expenses of that fund and do not include any expenses associated with any underlying mutual funds or exchange-traded funds (ETFs). Although not included in a fund's expenses, a fund indirectly bears its proportionate share of these expenses through the net asset value of each underlying mutual fund or exchange-traded fund (ETF). Expense estimates are accrued in the period to which they relate and adjustments are made when actual amounts are known.
Income Tax Information and Distributions to Shareholders. Each year, the Fund intends to qualify as a regulated investment company under Subchapter M of the Internal Revenue Code, including distributing substantially all of its taxable income and realized gains. As a result, no provision for U.S. Federal income taxes is required. As of October 31, 2024, the Fund did not have any unrecognized tax benefits in the financial statements; nor is the Fund aware of any tax positions for which it is reasonably possible that the total amounts of unrecognized tax benefits will significantly change in the next twelve months. The Fund files a U.S. federal tax return, in addition to state and local tax returns as required. The Fund's federal income tax returns are subject to examination by the Internal Revenue Service (IRS) for a period of three fiscal years after they are filed. State and local tax returns may be subject to examination for an additional fiscal year depending on the jurisdiction. Foreign taxes are provided for based on the Fund's understanding of the tax rules and rates that exist in the foreign markets in which it invests. The Fund is subject to a tax imposed on capital gains by certain countries in which it invests. An estimated deferred tax liability for net unrealized appreciation on the applicable securities is included in Other payables and accrued expenses on the Statement of Assets and Liabilities.
Distributions are declared and recorded on the ex-dividend date. Income and capital gain distributions are declared separately for each class. Income and capital gain distributions are determined in accordance with income tax regulations, which may differ from GAAP.
Capital accounts within the financial statements are adjusted for permanent book-tax differences. These adjustments have no impact on net assets or the results of operations. Capital accounts are not adjusted for temporary book-tax differences which will reverse in a subsequent period.
Book-tax differences are primarily due to foreign currency transactions, certain foreign taxes, passive foreign investment companies (PFIC), capital loss carryforwards and losses deferred due to wash sales.
As of period end, the cost and unrealized appreciation (depreciation) in securities, and derivatives if applicable, for federal income tax purposes were as follows:
| Gross unrealized appreciation | $83,340,116 |
| Gross unrealized depreciation | (5,730,751) |
| Net unrealized appreciation (depreciation) | $77,609,365 |
| Tax Cost | $180,080,396 |
The tax-based components of distributable earnings as of period end were as follows:
| Undistributed ordinary income | $341,099 |
| Undistributed long-term capital gain | $80,281 |
| Net unrealized appreciation (depreciation) on securities and other investments | $77,621,450 |
Capital loss carryforwards are only available to offset future capital gains of the Fund to the extent provided by regulations and may be limited. The capital loss carryforward information presented below, including any applicable limitation, is estimated as of fiscal period end and is subject to adjustment.
| Short-term | $(5,856,214) |
| Long-term | - |
| Total capital loss carryforward | $(5,856,214) |
The tax character of distributions paid was as follows:
| | October 31, 2024 | October 31, 2023 |
| Ordinary Income | $1,803,376 | $2,201,013 |
Restricted Securities (including Private Placements). Funds may invest in securities that are subject to legal or contractual restrictions on resale. These securities generally may be resold in transactions exempt from registration or to the public if the securities are registered. Disposal of these securities may involve time-consuming negotiations and expense, and prompt sale at an acceptable price may be difficult. Information regarding restricted securities held at period end is included at the end of the Schedule of Investments, if applicable.
New Accounting Pronouncement. In November 2023, the FASB issued Accounting Standards Update (ASU) 2023-07 Segment Reporting (Topic 280): Improvements to Reportable Segment Disclosures. Effective for fiscal years beginning after December 15, 2023 and interim periods within fiscal years beginning after December 15, 2024, the amendments enhance required disclosures of segment information for public entities on an annual and interim basis. The ASU allows for early adoption with updates applied retrospectively. Management is currently evaluating the impact of the ASU but does not expect this guidance to materially impact the financial statements.
4. Purchases and Sales of Investments.
Purchases and sales of securities, other than short-term securities, securities acquired in the reorganization and in-kind transactions, as applicable, are noted in the table below.
| | Purchases ($) | Sales ($) |
| Fidelity Global Equity Income Fund | 46,332,886 | 63,615,747 |
5. Fees and Other Transactions with Affiliates.
Management Fee. Fidelity Management & Research Company LLC (the investment adviser) and its affiliates provide the Fund with investment management related services for which the Fund pays a monthly management fee.
Effective March 1, 2024, the Fund's management contract was amended to incorporate administrative services previously covered under separate services agreements (Transfer Agent and Accounting agreements). The amended contract incorporates a management fee rate that may vary by class. The investment adviser or an affiliate pays certain expenses of managing and operating the Fund out of each class's management fee. Each class of the Fund pays a management fee to the investment adviser. The management fee is calculated and paid to the investment adviser every month. When determining a class's management fee, a mandate rate is calculated based on the monthly average net assets of a group of funds advised by FMR within a designated asset class. A discount rate is subtracted from the mandate rate once the Fund's monthly average net assets reach a certain level. The mandate rate and discount rate may vary by class. The annual management fee rate for a class of shares of the Fund is the lesser of (1) the class's mandate rate reduced by the class's discount rate (if applicable) or (2) the amount set forth in the following table.
| | Maximum Management Fee Rate % |
| Class A | .88 |
| Class M | .86 |
| Class C | .88 |
| Fidelity Global Equity Income Fund | .86 |
| Class I | .85 |
| Class Z | .72 |
One-twelfth of the management fee rate for a class is applied to the average net assets of the class for the month, giving a dollar amount which is the management fee for the class for that month. A different management fee rate may be applicable to each class of the Fund. The difference between classes is the result of separate arrangements for class-level services and/or waivers of certain expenses. It is not the result of any difference in advisory or custodial fees or other expenses related to the management of the Fund's assets, which do not vary by class. For the portion of the reporting period on or after March 1, 2024, the total annualized management fee rates were as follows:
| | Total Management Fee Rate % |
| Class A | .86 |
| Class M | .86 |
| Class C | .86 |
| Fidelity Global Equity Income Fund | .83 |
| Class I | .85 |
| Class Z | .69 |
Prior to March 1, 2024, the management fee was the sum of an individual fund fee rate that was based on an annual rate of .45% of the Fund's average net assets and an annualized group fee rate that averaged .22% during the period. The group fee rate was based upon the monthly average net assets of a group of registered investment companies with which the investment adviser has management contracts. The group fee rate decreased as assets under management increased and increased as assets under management decreased. For the portion of the reporting period prior to March 1, 2024, the total annualized management fee rate was .67%.
Effective March 1, 2024, the Fund's sub-advisory agreements with FMR Investment Management (UK) Limited, Fidelity Management & Research (Hong Kong) Limited, and Fidelity Management & Research (Japan) Limited were amended to provide that the investment adviser pays each sub-adviser monthly fees equal to 110% of the sub-adviser's costs for providing sub-advisory services.
Effective March 1, 2024, the Fund's sub-advisory agreement with FIL Investment Advisors (FIA) was amended to provide that the investment adviser pays FIA monthly fees at an annual rate of 0.38% with respect to the average daily net assets of the Fund managed by FIA. FIA in turn pays FIA(UK).
Distribution and Service Plan Fees. In accordance with Rule 12b-1 of the 1940 Act, the Fund has adopted separate Distribution and Service Plans for each class of shares. Certain classes pay Fidelity Distributors Company LLC (FDC), an affiliate of the investment adviser, separate Distribution and Service Fees, each of which is based on an annual percentage of each class' average net assets. In addition, FDC may pay financial intermediaries for selling shares of the Fund and providing shareholder support services. For the period, the Distribution and Service Fee rates, total fees and amounts retained by FDC were as follows:
| | Distribution Fee | Service Fee | Total Fees ($) | Retained by FDC ($) |
| Class A | - % | .25% | 900 | - |
| Class M | .25% | .25% | 1,226 | 160 |
| Class C | .75% | .25% | 748 | 121 |
| | | | 2,874 | 281 |
Sales Load. FDC may receive a front-end sales charge of up to 5.75% for selling Class A shares and 3.50% for selling Class M shares, some of which is paid to financial intermediaries for selling shares of the Fund. Depending on the holding period, FDC may receive contingent deferred sales charges levied on Class A, Class M and Class C redemptions. The deferred sales charges are 1.00% for Class C shares, 1.00% for certain purchases of Class A shares and .25% for certain purchases of Class M shares.
For the period, sales charge amounts retained by FDC were as follows:
| | Retained by FDC ($) |
| Class A | 4,635 |
| Class M | 1,355 |
Class C A | 76 |
| | 6,066 |
A When Class C shares are initially sold, FDC pays commissions from its own resources to financial intermediaries through which the sales are made.
Transfer Agent Fees. Fidelity Investments Institutional Operations Company LLC (FIIOC), an affiliate of the investment adviser, is the transfer, dividend disbursing and shareholder servicing agent for each class of the Fund. Effective March 1, 2024, the Fund's management contract was amended to incorporate transfer agent services and associated fees previously covered under a separate services agreement. FIIOC pays for typesetting, printing and mailing of shareholder reports, except proxy statements.
During the period December 1, 2023 through February 29, 2024, the transfer agent fees for each class were a fixed annual rate of average net assets of .1729%.
Prior to December 1, 2023, FIIOC received account fees and asset-based fees that varied according to the account size and type of account.
For the portion of the reporting period prior to March 1, 2024, the fees were equivalent to the following annualized rates:
| | Amount ($) | % of Class-Level Average Net Assets |
| Fidelity Global Equity Income Fund | 88,871 | .17 |
Accounting Fees. Fidelity Service Company, Inc. (FSC), an affiliate of the investment adviser, maintains the Fund's accounting records. Effective March 1, 2024, the Fund's management contract was amended to incorporate accounting services and associated fees previously covered under a separate services agreement.
During the period December 1, 2023 through February 29, 2024, the accounting fees were a fixed annual rate of average net assets as follows:
| | % of Average Net Assets |
| Fidelity Global Equity Income Fund | 0.0498 |
Prior to December 1, 2023, the accounting fee was based on the level of average net assets for each month. For the portion of the reporting period prior to March 1, 2024, the fees were equivalent to the following annualized rates:
| | % of Average Net Assets |
| Fidelity Global Equity Income Fund | .05 |
Brokerage Commissions. A portion of portfolio transactions were placed with brokerage firms which are affiliates of the investment adviser. Brokerage commissions are included in net realized gain (loss) and change in net unrealized appreciation (depreciation) in the Statement of Operations. The commissions paid to these affiliated firms were as follows:
| | Amount ($) |
| Fidelity Global Equity Income Fund | 312 |
Interfund Lending Program. Pursuant to an Exemptive Order issued by the Securities and Exchange Commission (the SEC), the Fund, along with other registered investment companies having management contracts with Fidelity Management & Research Company LLC (FMR), or other affiliated entities of FMR, may participate in an interfund lending program. This program provides an alternative credit facility allowing the Fund to borrow from, or lend money to, other participating affiliated funds at rates that are beneficial to both the borrowing and lending fund. Borrowings under the program are generally for temporary or emergency purposes, including meeting fund shareholder redemptions. The interfund loan rate is determined, as specified in the Exemptive Order, by averaging, (1) the higher of the overnight time deposit rate and the current overnight repurchase agreement rate, and (2) a benchmark rate representing the lowest bank loan rate available to the funds. At period end, there were no interfund loans outstanding. Activity in this program during the period for which loans were outstanding was as follows:
| | Borrower or Lender | Average Loan Balance ($) | Weighted Average Interest Rate | Interest Expense ($) |
| Fidelity Global Equity Income Fund | Borrower | 6,573,000 | 5.57% | 1,017 |
Interfund Trades. Funds may purchase from or sell securities to other Fidelity Funds under procedures adopted by the Board. The procedures have been designed to ensure these interfund trades are executed in accordance with Rule 17a-7 of the 1940 Act. Any interfund trades are included within the respective purchases and sales amounts shown in the Purchases and Sales of Investments note. Interfund trades during the period are noted in the table below.
| | Purchases ($) | Sales ($) | Realized Gain (Loss)($) |
| Fidelity Global Equity Income Fund | 5,154,042 | 7,548,291 | 784,262 |
6. Committed Line of Credit.
Certain Funds participate with other funds managed by the investment adviser or an affiliate in a $4.25 billion credit facility (the "line of credit") to be utilized for temporary or emergency purposes to fund shareholder redemptions or for other short-term liquidity purposes. The participating funds have agreed to pay commitment fees on their pro-rata portion of the line of credit, which are reflected in Miscellaneous expenses on the Statement of Operations, and are listed below. During the period, there were no borrowings on this line of credit.
| | Amount ($) |
| Fidelity Global Equity Income Fund | 254 |
7. Security Lending.
Funds lend portfolio securities from time to time in order to earn additional income. Lending agents are used, including National Financial Services (NFS), an affiliate of the investment adviser. Pursuant to a securities lending agreement, NFS will receive a fee, which is capped at 9.9% of a fund's daily lending revenue, for its services as lending agent. A fund may lend securities to certain qualified borrowers, including NFS. On the settlement date of the loan, a fund receives collateral (in the form of U.S. Treasury obligations, letters of credit and/or cash) against the loaned securities and maintains collateral in an amount not less than 100% of the market value of the loaned securities during the period of the loan. The market value of the loaned securities is determined at the close of business of a fund and any additional required collateral is delivered to a fund on the next business day. A fund or borrower may terminate the loan at any time, and if the borrower defaults on its obligation to return the securities loaned because of insolvency or other reasons, a fund may apply collateral received from the borrower against the obligation. A fund may experience delays and costs in recovering the securities loaned. Any cash collateral received is invested in the Fidelity Securities Lending Cash Central Fund. Any loaned securities are identified as such in the Schedule of Investments, and the value of loaned securities and cash collateral at period end, as applicable, are presented in the Statement of Assets and Liabilities. Security lending income represents the income earned on investing cash collateral, less rebates paid to borrowers and any lending agent fees associated with the loan, plus any premium payments received for lending certain types of securities. Security lending income is presented in the Statement of Operations as a component of income from Fidelity Central Funds. Affiliated security lending activity, if any, was as follows:
| | Total Security Lending Fees Paid to NFS ($) | Security Lending Income From Securities Loaned to NFS ($) | Value of Securities Loaned to NFS at Period End ($) |
| Fidelity Global Equity Income Fund | 95 | - | - |
8. Expense Reductions.
Through arrangements with the Fund's custodian, credits realized as a result of certain uninvested cash balances were used to reduce the Fund's expenses. During the period, custodian credits reduced the Fund's expenses by $227.
In addition, during the period the investment adviser or an affiliate reimbursed and/or waived a portion of fund-level operating expenses in the amount of $6,988.
9. Distributions to Shareholders.
Distributions to shareholders of each class were as follows:
| | Year ended October 31, 2024A | Year ended October 31, 2023 |
| Fidelity Global Equity Income Fund | | |
| Distributions to shareholders | | |
| Class A | $- | $- |
| Class M | - | - |
| Class C | - | - |
| Fidelity Global Equity Income Fund | 1,803,376 | 2,201,013 |
| Class I | - | - |
| Class Z | - | - |
Total | $1,803,376 | $2,201,013 |
A Distributions for Class A, Class M, Class C, Class I and Class Z are for the period October 18, 2024 (commencement of sale of shares) through October 31, 2024.
10. Share Transactions.
Share transactions for each class were as follows and may contain in-kind transactions, automatic conversions between classes or exchanges between affiliated funds:
| | Shares | Shares | Dollars | Dollars |
| | Year ended October 31, 2024 | Year ended October 31, 2023 | Year ended October 31, 2024 | Year ended October 31, 2023 |
| Fidelity Global Equity Income Fund | | | | |
| Class A | | | | |
| Shares sold | 13,802 | - | $287,423 | $ - |
| Issued in exchange for the shares of the Acquired Fund(s) | 1,194,022 | - | 24,716,232 | - |
| Shares redeemed | (9,300) | - | (192,220) | - |
| Net increase (decrease) | 1,198,524 | - | $24,811,435 | $ - |
| Class M | | | | |
| Shares sold | 21,406 | - | $444,749 | $ - |
| Issued in exchange for the shares of the Acquired Fund(s) | 810,080 | - | 16,768,677 | - |
| Shares redeemed | (17,770) | - | (367,978) | - |
| Net increase (decrease) | 813,716 | - | $16,845,448 | $ - |
| Class C | | | | |
| Shares sold | 4,787 | - | $100,926 | $ - |
| Issued in exchange for the shares of the Acquired Fund(s) | 238,738 | - | 4,939,487 | - |
| Shares redeemed | (142) | - | (2,945) | - |
| Net increase (decrease) | 243,383 | - | $5,037,468 | $ - |
| Fidelity Global Equity Income Fund | | | | |
| Shares sold | 1,679,995 | 3,849,023 | $32,230,191 | $64,120,579 |
| Reinvestment of distributions | 82,061 | 117,757 | 1,584,378 | 1,975,864 |
| Shares redeemed | (2,706,097) | (3,775,132) | (50,277,215) | (63,120,560) |
| Net increase (decrease) | (944,041) | 191,648 | $(16,462,646) | $2,975,883 |
| Class I | | | | |
| Shares sold | 4,818 | - | $101,465 | $ - |
| Issued in exchange for the shares of the Acquired Fund(s) | 685,565 | - | 14,191,192 | - |
| Shares redeemed | (1,531) | - | (31,412) | - |
| Net increase (decrease) | 688,852 | - | $14,261,245 | $ - |
| Class Z | | | | |
| Shares sold | 11,434 | - | $238,032 | $ - |
| Issued in exchange for the shares of the Acquired Fund(s) | 1,515,595 | - | 31,372,832 | - |
| Shares redeemed | (7,340) | - | (151,036) | - |
| Net increase (decrease) | 1,519,689 | - | $31,459,828 | $ - |
A Share transactions for Class A, Class M, Class C, Class I and Class Z are for the period October 18, 2024 (commencement of sale of shares) through October 31, 2024.
11. Other.
A fund's organizational documents provide former and current trustees and officers with a limited indemnification against liabilities arising in connection with the performance of their duties to the fund. In the normal course of business, a fund may also enter into contracts that provide general indemnifications. A fund's maximum exposure under these arrangements is unknown as this would be dependent on future claims that may be made against a fund. The risk of material loss from such claims is considered remote.
12. Risk and Uncertainties.
Many factors affect a fund's performance. Developments that disrupt global economies and financial markets, such as pandemics, epidemics, outbreaks of infectious diseases, war, terrorism, and environmental disasters, may significantly affect a fund's investment performance. The effects of these developments to a fund will be impacted by the types of securities in which a fund invests, the financial condition, industry, economic sector, and geographic location of an issuer, and a fund's level of investment in the securities of that issuer. Significant concentrations in security types, issuers, industries, sectors, and geographic locations may magnify the factors that affect a fund's performance.
13. Reorganization Information.
On October 25, 2024, the Fund acquired all of the assets and assumed all of the liabilities of Fidelity Advisor Global Equity Income Fund ("Acquired Fund") pursuant to an Agreement and Plan of Reorganization (Agreements) approved by the Board of Trustees ("The Board"). The securities held by the Acquired Fund were the primary assets acquired by the Fund. The acquisition was accomplished by an exchange of each class of the Fund for corresponding shares then outstanding of the Acquired Fund at its respective net asset value on the acquisition date. The reorganization provides shareholders of the Acquired Fund access to a larger portfolio with a similar investment objective and lower projected expenses. For financial reporting purposes, the assets and liabilities of the Acquired Fund and shares issued by the Fund were recorded at fair value; however, the cost basis of the investments received from the Acquired Fund were carried forward and will be utilized for purposes of the Fund's ongoing reporting of realized and unrealized gains and losses to more closely align subsequent reporting of realized gains with amounts distributable to shareholders for tax purposes. The reorganization qualified as a tax-free reorganization for federal income tax purposes with no gain or loss recognized to the funds or their shareholders.
| Acquired Fund and Share Class | Investments $ | Unrealized appreciation (depreciation) $ | Net Assets $ | Shares Exchanged | Shares Exchanged Ratio |
| Fidelity Advisor Global Equity Income Fund | 91,300,657 | 28,301,146 | | | |
| Class A | | | 24,716,232 | 1,194,022 | 1.0649033816 |
| Class M | | | 16,768,677 | 810,080 | 1.0640193237 |
| Class C | | | 4,939,487 | 238,738 | 1.0519091348 |
| Class I | | | 14,191,192 | 685,565 | 1.0661111111 |
| Class Z | | | 31,372,832 | 1,515,595 | 1.0742801932 |
| Acquiring Fund | Net Assets $ | Total net assets after the acquisition $ |
| Fidelity Global Equity Income Fund | 169,611,375 | 261,599,795 |
Pro forma results of operations of the combined entity for the entire period ended October 31, 2024, as though the acquisition had occurred as of the beginning of the year (rather than on the actual acquisition date), are as follows:
| Net investment income (loss) | $2,998,559 |
| Total net realized gain (loss) | 7,713,721 |
| Total change in net unrealized appreciation (depreciation) | 50,804,014 |
| Net increase (decrease) in net assets resulting from operations | $61,516,294 |
Because the combined investment portfolios have been managed as a single portfolio since the acquisition was completed, it is not practicable to separate the amounts of revenue and earnings of the acquired fund that have been included in the Fidelity Global Equity Income Fund accompanying Statement of Operations since October 25, 2024.
Report of Independent Registered Public Accounting Firm
To the Board of Trustees of Fidelity Investment Trust and the Shareholders of Fidelity Global Equity Income Fund:
Opinion on the Financial Statements and Financial Highlights
We have audited the accompanying statement of assets and liabilities of Fidelity Global Equity Income Fund (the "Fund"), a fund of Fidelity Investment Trust, including the schedule of investments, as of October 31, 2024, the related statement of operations for the year then ended, the statement of changes in net assets for each of the two years in the period then ended, the financial highlights for each of the five years in the period then ended, and the related notes. In our opinion, the financial statements and financial highlights present fairly, in all material respects, the financial position of the Fund as of October 31, 2024, and the results of its operations for the year then ended, the changes in its net assets for each of the two years in the period then ended, and the financial highlights for each of the five years in the period then ended in conformity with accounting principles generally accepted in the United States of America.
Basis for Opinion
These financial statements and financial highlights are the responsibility of the Fund's management. Our responsibility is to express an opinion on the Fund's financial statements and financial highlights based on our audits. We are a public accounting firm registered with the Public Company Accounting Oversight Board (United States) (PCAOB) and are required to be independent with respect to the Fund in accordance with the U.S. federal securities laws and the applicable rules and regulations of the Securities and Exchange Commission and the PCAOB.
We conducted our audits in accordance with the standards of the PCAOB. Those standards require that we plan and perform the audit to obtain reasonable assurance about whether the financial statements and financial highlights are free of material misstatement, whether due to error or fraud. The Fund is not required to have, nor were we engaged to perform, an audit of its internal control over financial reporting. As part of our audits, we are required to obtain an understanding of internal control over financial reporting but not for the purpose of expressing an opinion on the effectiveness of the Fund's internal control over financial reporting. Accordingly, we express no such opinion.
Our audits included performing procedures to assess the risks of material misstatement of the financial statements and financial highlights, whether due to error or fraud, and performing procedures that respond to those risks. Such procedures included examining, on a test basis, evidence regarding the amounts and disclosures in the financial statements and financial highlights. Our audits also included evaluating the accounting principles used and significant estimates made by management, as well as evaluating the overall presentation of the financial statements and financial highlights. Our procedures included confirmation of securities owned as of October 31, 2024, by correspondence with the custodian and brokers; when replies were not received from brokers, we performed other auditing procedures. We believe that our audits provide a reasonable basis for our opinion.
/s/ Deloitte & Touche LLP
Boston, Massachusetts
December 17, 2024
We have served as the auditor of one or more of the Fidelity investment companies since 1999.
Distributions
(Unaudited)The dividend and capital gains distributions for the fund(s) are available on Fidelity.com or Institutional.Fidelity.com.
Fidelity Advisor Global Equity Income Fund (Acquired Fund) hereby designates as a capital gain dividend with respect to the taxable year ended October 25, 2024, $2,116,793, or, if subsequently determined to be different, the net capital gain of such year.
A percentage of the dividends distributed during the fiscal year for the following funds were derived from interest on U.S. Government securities which is generally exempt from state income tax:
Fidelity Global Equity Income Fund | 1.08% |
| Fidelity Advisor Global Equity Income Fund (Acquired Fund) | 0.94% |
Fidelity Global Equity Income Fund designates $52,628 of distributions paid during the fiscal year ended 2024 as qualifying to be taxed as section 163(j) interest dividends.
Fidelity Global Equity Income Fund designates 70%, 93%, 93%, and 93% of the dividends distributed December, April, July and October respectively during the fiscal year as qualifying for the dividends-received deduction for corporate shareholders.
Fidelity Advisor Global Equity Income Fund (Acquired Fund): Class A designates 98%, 95%, 95%, and 95%; Class M designates 100%, 95%, 95%, and 95%; Class C designates 0%, 0%, 95%, and 95%; Class I designates 72%, 95%, 95%, and 95%; and Class Z designates 66%, 95%, 95% and 95% of the dividends distributed in December, April, July and October, respectively during the fiscal year as qualifying for the dividends-received deduction for corporate shareholders.
Fidelity Global Equity Income Fund designates 100% of the dividends distributed during the fiscal year as amounts which may be taken into account as a dividend for purposes of the maximum rate under section 1(h)(11) of the Internal Revenue Code.
Fidelity Advisor Global Equity Income Fund (Acquired Fund): Class A, Class M, Class C, Class I, and Class Z designate 100% of dividends distributed in December and October, respectively during the fiscal year as amounts which may be taken into account as a dividend for purposes of the maximum rate under section 1(h)(11) of the Internal Revenue Code.
The fund will notify shareholders in January 2025 of amounts for use in preparing 2024 income tax returns.
Item 8: Changes in and Disagreements with Accountants for Open-End Management Investment Companies
(Unaudited)
Note: This is not applicable for any fund included in this document.
Item 9: Proxy Disclosures for Open-End Management Investment Companies
(Unaudited)
| A special meeting of shareholders was held on July 16, 2024. The results of votes taken among shareholders on the proposal before them are reported below. Each vote reported represents one dollar of net asset value held on the record date for the meeting. |
| Proposal 1 |
| To elect a Board of Trustees. |
| | # of Votes | % of Votes |
| Bettina Doulton |
| Affirmative | 128,529,177,643.56 | 98.18 |
| Withheld | 2,378,037,364.30 | 1.82 |
| TOTAL | 130,907,215,007.85 | 100.00 |
| Robert A. Lawrence |
| Affirmative | 128,253,389,899.05 | 97.97 |
| Withheld | 2,653,825,108.81 | 2.03 |
| TOTAL | 130,907,215,007.85 | 100.00 |
| Vijay C. Advani |
| Affirmative | 128,531,418,228.19 | 98.19 |
| Withheld | 2,375,796,779.66 | 1.81 |
| TOTAL | 130,907,215,007.85 | 100.00 |
| Thomas P. Bostick |
| Affirmative | 128,495,261,591.41 | 98.16 |
| Withheld | 2,411,953,416.44 | 1.84 |
| TOTAL | 130,907,215,007.85 | 100.00 |
| Donald F. Donahue |
| Affirmative | 128,407,878,996.00 | 98.09 |
| Withheld | 2,499,336,011.85 | 1.91 |
| TOTAL | 130,907,215,007.85 | 100.00 |
| Vicki L. Fuller |
| Affirmative | 128,625,540,095.19 | 98.26 |
| Withheld | 2,281,674,912.66 | 1.74 |
| TOTAL | 130,907,215,007.85 | 100.00 |
| Patricia L. Kampling |
| Affirmative | 128,668,729,281.34 | 98.29 |
| Withheld | 2,238,485,726.51 | 1.71 |
| TOTAL | 130,907,215,007.85 | 100.00 |
| Thomas A. Kennedy |
| Affirmative | 128,499,824,239.79 | 98.16 |
| Withheld | 2,407,390,768.06 | 1.84 |
| TOTAL | 130,907,215,007.85 | 100.00 |
| Oscar Munoz |
| Affirmative | 128,386,109,391.05 | 98.07 |
| Withheld | 2,521,105,616.80 | 1.93 |
| TOTAL | 130,907,215,007.85 | 100.00 |
| Karen B. Peetz |
| Affirmative | 128,603,731,113.82 | 98.24 |
| Withheld | 2,303,483,894.03 | 1.76 |
| TOTAL | 130,907,215,007.85 | 100.00 |
| David M. Thomas |
| Affirmative | 128,384,899,342.98 | 98.07 |
| Withheld | 2,522,315,664.88 | 1.93 |
| TOTAL | 130,907,215,007.85 | 100.00 |
| Susan Tomasky |
| Affirmative | 128,556,148,461.60 | 98.20 |
| Withheld | 2,351,066,546.25 | 1.80 |
| TOTAL | 130,907,215,007.85 | 100.00 |
| Michael E. Wiley |
| Affirmative | 128,264,934,978.34 | 97.98 |
| Withheld | 2,642,280,029.51 | 2.02 |
| TOTAL | 130,907,215,007.85 | 100.00 |
| | | |
| Proposal 1 reflects trust-wide proposal and voting results. |
Item 10: Remuneration Paid to Directors, Officers, and others of Open-End Management Investment Companies
(Unaudited)
Note: This information is disclosed as part of the financial statements for each Fund as part of Item 7: Financial Statements and Financial Highlights for Open-End Management Investment companies.
Item 11: Statement Regarding Basis for Approval of Investment Advisory Contract
(Unaudited)
Board Approval of Investment Advisory Contracts and Management Fees
Fidelity Global Equity Income Fund
Each year, the Board of Trustees, including the Independent Trustees (together, the Board), considers the renewal of the fund's management contract with Fidelity Management & Research Company LLC (FMR) and certain affiliates and the sub-advisory agreements (together, the Advisory Contracts) for the fund. FMR and the sub-advisers are referred to herein as the Investment Advisers. The Board, assisted by the advice of fund counsel and Independent Trustees' counsel, requests and considers a broad range of information relevant to the renewal of the Advisory Contracts throughout the year.
The Board meets regularly and, at each of its meetings, covers an extensive agenda of topics and materials and considers factors that are relevant to its annual consideration of the renewal of the fund's Advisory Contracts, including the services and support provided to the fund and its shareholders. The Board, acting directly and through its Committees (each of which is composed of and chaired by Independent Trustees), requests and receives information concerning the annual consideration of the renewal of the fund's Advisory Contracts. The Board also meets as needed to review matters specifically related to the Board's annual consideration of the renewal of the Advisory Contracts. Members of the Board may also meet with trustees of other Fidelity funds through joint ad hoc committees to discuss certain matters relevant to all of the Fidelity funds.
At its May 2024 meeting, the Board unanimously determined to renew the fund's Advisory Contracts. In reaching its determination, the Board considered all factors it believed relevant, including (i) the nature, extent, and quality of the services provided to the fund and its shareholders (including the investment performance of the fund); (ii) the competitiveness relative to peer funds of the fund's management fee and total expense ratio; (iii) the total costs of the services provided by and the profits realized by FMR and its affiliates (Fidelity) from its relationships with the fund; and (iv) the extent to which, if any, economies of scale exist and are realized as the fund grows, and whether any economies of scale are appropriately shared with fund shareholders. The Board also considered the broad range of investment choices available to shareholders from FMR's competitors and that the fund's shareholders have chosen to invest in the fund, which is part of the Fidelity family of funds. The Board's decision to renew the Advisory Contracts was not based on any single factor.
The Board reached a determination, with the assistance of fund counsel and Independent Trustees' counsel and through the exercise of its business judgment, that the renewal of the Advisory Contracts was in the best interests of the fund and its shareholders and that the compensation payable under the Advisory Contracts was fair and reasonable in light of all of the surrounding circumstances.
Nature, Extent, and Quality of Services Provided. The Board considered staffing as it relates to the fund, including the backgrounds and experience of investment personnel of the Investment Advisers, and also considered the Investment Advisers' implementation of the fund's investment program. The Independent Trustees also had discussions with senior management of Fidelity's investment operations and investment groups. The Board considered the structure of the investment personnel compensation program and whether this structure provides appropriate incentives to act in the best interests of the fund. Additionally, the Board considered the portfolio managers' investments, if any, in the funds that they manage.
Resources Dedicated to Investment Management and Support Services. The Board and the Fund Oversight and Research Committees reviewed the general qualifications and capabilities of Fidelity's investment staff, including its size, education, experience, and resources, as well as Fidelity's approach to recruiting, training, managing, and compensating investment personnel. The Board noted the resources devoted to expansion of Fidelity's global investment organization, and that Fidelity's analysts have extensive resources, tools, and capabilities that allow them to conduct sophisticated quantitative and fundamental analysis, as well as credit analysis of issuers, counterparties, and guarantors. Further, the Board considered that Fidelity's investment professionals have sufficient access to global information and data so as to provide competitive investment results over time, and that those professionals also have access to sophisticated tools that permit them to assess portfolio construction and risk and performance attribution characteristics continuously, as well as to transmit new information and research conclusions rapidly around the world. Additionally, in its deliberations, the Board considered Fidelity's trading, risk management, compliance, and technology and operations capabilities and resources, which are integral parts of the investment management process.
Shareholder and Administrative Services. The Board considered (i) the nature, extent, quality, and cost of advisory, administrative, shareholder, transfer agency, and pricing and bookkeeping services performed by the Investment Advisers and their affiliates under the Advisory Contracts; (ii) the nature and extent of Fidelity's supervision of third party service providers, principally custodians, subcustodians, and pricing vendors; and (iii) the resources devoted by Fidelity to, and the record of compliance with, the fund's compliance policies and procedures. The Board also reviewed the allocation of fund brokerage, including allocations to brokers affiliated with the Investment Advisers, the use of brokerage commissions to pay fund expenses, and the use of "soft" commission dollars to pay for research services. The Board also considered the fund's securities lending activities and any payments made to Fidelity relating to securities lending under a separate agreement.
The Board noted that the growth of fund assets over time across the complex allows Fidelity to reinvest in the development of services designed to enhance the value and convenience of the Fidelity funds as investment vehicles. These services include 24-hour access to account information and market information over the Internet and through telephone representatives, investor education materials, and asset allocation tools. The Board also considered that it reviews customer service metrics such as telephone response times, continuity of services on the website and metrics addressing services at Fidelity Investor Centers.
Investment in a Large Fund Family. The Board considered the benefits to shareholders of investing in a fund that is part of a large family of funds offering a variety of investment disciplines and providing a large variety of fund investor services. The Board noted that Fidelity had taken, or had made recommendations that resulted in the Fidelity funds taking, a number of actions over the previous year that benefited particular funds and/or the Fidelity funds in general.
Investment Performance. The Board took into account discussions that occur with representatives of the Investment Advisers, and reports that it receives, at Board meetings throughout the year, relating to fund investment performance. In this regard the Board noted that as part of regularly scheduled fund reviews and other reports to the Board on fund performance, the Board considered annualized return information for the fund for different time periods, measured against an appropriate securities market index (benchmark index) and an appropriate peer group of funds with similar objectives (peer group). The Board also considered information about performance attribution. In its ongoing evaluation of fund investment performance, the Board gives particular attention to information indicating changes in performance of the funds over different time periods and discussed with the Investment Advisers the reasons for any overperformance or underperformance.
In addition to reviewing absolute and relative fund performance, the Independent Trustees periodically consider the appropriateness of fund performance metrics in evaluating the results achieved. The Independent Trustees generally give greater weight to fund performance over longer time periods than over shorter time periods. Depending on the circumstances, the Independent Trustees may be satisfied with a fund's performance notwithstanding that it lags its benchmark index or peer group for certain periods.
Based on its review, the Board concluded that the nature, extent, and quality of services provided to the fund under the Advisory Contracts should continue to benefit the shareholders of the fund.
Competitiveness of Management Fee and Total Expense Ratio. The Board was provided with information regarding industry trends in management fees and expenses. The Board considered that, effective March 1, 2024, an amended Advisory Contract with FMR went into effect with a fee based on tiered schedules and subject to a maximum class-level rate (the management fee). The Board also considered that in exchange for the management fee, the fund will receive investment advisory, management, administrative, transfer agent, and pricing and bookkeeping services. In its review of the fund's management fee and total expense ratio, the Board considered the fund's pro forma management fee rate as if it had been in effect for the 12-month period ended September 30, 2023, as well as other third-party fund expenses, such as custodial, legal, and audit fees. The Board noted that Fidelity may agree to waive fees or reimburse expenses from time to time, and the extent to which, if any, it has done so for the fund.
Comparisons of Management Fees and Total Expense Ratios. Among other things, the Board reviewed data for selected groups of competitive funds and classes (referred to as "mapped groups") that were compiled by Fidelity based on combining similar investment objective categories (as classified by Morningstar) that have comparable investment mandates. The data reviewed by the Board included (i) gross management fee comparisons (before taking into account expense reimbursements or caps) relative to the total universe of funds within the mapped group; (ii) gross management fee comparisons relative to a subset of non-Fidelity funds in the mapped group that are similar in size and management fee structure to the fund (referred to as the "asset size peer group"); (iii) total expense comparisons of the fund relative to funds and classes in the mapped group that have a similar sales load structure to the fund (referred to as the "similar sales load structure group"); and (iv) total expense comparisons of the fund relative to funds and classes in the similar sales load structure group that are similar in size and management fee structure to the fund (referred to as the "total expense asset size peer group"). The total expense asset size peer group comparison excludes performance adjustments and fund-paid 12b-1 fees to eliminate variability in fee structures.
The information provided to the Board indicated that the fund's management fee rate ranked above the competitive median of the mapped group for the 12-month period ended September 30, 2023 and above the competitive median of the asset size peer group for the 12-month period ended September 30, 2023. Further, the information provided to the Board indicated that the total expense ratio of the fund ranked below the competitive median of the similar sales load structure group for the 12-month period ended September 30, 2023 and below the competitive median of the total expense asset size peer group for the 12-month period ended September 30, 2023. The Board considered that the fund has a variable unified management fee that covers expenses for services beyond portfolio management.
Other Contractual Arrangements. The Board further considered that FMR has contractually agreed to reimburse the fund to the extent that total operating expenses, with certain exceptions, as a percentage of its average net assets, exceed 1.05% through February 28, 2025.
Fees Charged to Other Fidelity Clients. The Board also considered Fidelity fee structures and other information with respect to clients of Fidelity, such as other funds advised or subadvised by Fidelity, pension plan clients, and other institutional clients with similar mandates. The Board noted that a joint ad hoc committee created by it and the boards of other Fidelity funds periodically reviews and compares Fidelity's institutional investment advisory business with its business of providing services to the Fidelity funds and also noted the most recent findings of the committee. The Board noted that the committee's review included a consideration of the differences in services provided, fees charged, and costs incurred, as well as competition in the markets serving the different categories of clients.
Based on its review, the Board concluded that the fund's management fee is fair and reasonable in light of the services that the fund receives and the other factors considered. Further, based on its review of total expense ratios and fees charged to other Fidelity clients, the Board concluded that the fund's total expense ratio was reasonable in light of the services that the fund and its shareholders receive and the other factors considered.
Costs of the Services and Profitability. The Board considered the revenues earned and the expenses incurred by Fidelity in conducting the business of developing, marketing, distributing, managing, administering and servicing the fund and servicing the fund's shareholders. The Board also considered the level of Fidelity's profits in respect of all the Fidelity funds.
On an annual basis, Fidelity presents to the Board information about the profitability of its relationships with the fund. Fidelity calculates profitability information for each fund, as well as aggregate profitability information for groups of Fidelity funds and all Fidelity funds, using a series of detailed revenue and cost allocation methodologies which originate with the books and records of Fidelity on which Fidelity's audited financial statements are based. The Audit Committee of the Board reviews any significant changes from the prior year's methodologies.
A public accounting firm has been engaged annually by the Board as part of the Board's assessment of Fidelity's profitability analysis. The engagement includes the review and assessment of the methodologies used by Fidelity in determining the revenues and expenses attributable to Fidelity's fund business, and completion of agreed-upon procedures in respect of the mathematical accuracy of certain fund profitability information and its conformity to established allocation methodologies. After considering the reports issued under the engagement and information provided by Fidelity, the Board concluded that while other allocation methods may also be reasonable, Fidelity's profitability methodologies are reasonable in all material respects.
The Board also reviewed Fidelity's non-fund businesses and potential indirect benefits such businesses may have received as a result of their association with Fidelity's fund business (i.e., fall-out benefits) as well as cases where Fidelity's affiliates may benefit from the funds' business. The Board considered areas where potential indirect benefits to the Fidelity funds from their relationships with Fidelity may exist. The Board's consideration of these matters was informed by the findings of a joint ad hoc committee created by it and the boards of other Fidelity funds to evaluate potential fall-out benefits.
The Board considered the costs of the services provided by and the profits realized by Fidelity in connection with the operation of the fund and was satisfied that the profitability was not excessive.
Economies of Scale. The Board considered whether there have been economies of scale in respect of the management of the Fidelity funds, whether the Fidelity funds (including the fund) have appropriately benefited from any such economies of scale, and whether there is potential for realization of any further economies of scale. The Board considered the extent to which the fund will benefit from economies of scale as assets grow through increased services to the fund, through waivers or reimbursements, or through fee or expense ratio reductions. The Board also noted that a committee created by it and the boards of other Fidelity funds periodically analyzes whether Fidelity attains economies of scale in respect of the management and servicing of the Fidelity funds, whether the Fidelity funds have appropriately benefited from such economies of scale, and whether there is potential for realization of any further economies of scale.
The Board recognized that the fund's management contract incorporates a variable management fee structure, which provides breakpoints as a way to share, in part, any potential economies of scale that may exist at the asset class level and through a discount that considers both fund size and total assets of the four applicable asset classes. The Board considered that the variable management fee is designed to deliver the benefits of economies of scale to fund shareholders even if assets of any particular fund are unchanged or have declined, because some portion of Fidelity's costs are attributable to services provided to all funds subject to the variable management fee, and all such funds benefit if those costs can be allocated among more assets. The Board concluded that, given the variable management fee structure, fund shareholders will benefit from lower management fees due to the application of the breakpoints and discount factor, regardless of whether Fidelity achieves any such economies of scale.
The Board concluded, taking into account the analysis of the committee, that economies of scale, if any, are being appropriately shared between fund shareholders and Fidelity.
Additional Information Requested by the Board. In order to develop fully the factual basis for consideration of the Fidelity funds' advisory contracts, the Board requested and received additional information on certain topics, including but not limited to: (i) fund flow and performance trends, in particular the underperformance of certain funds and strategies, and Fidelity's long-term strategies for certain funds; (ii) the operation of performance fees and the rationale for implementing performance fees on certain categories of funds but not others; (iii) Fidelity's pricing philosophy compared to competitors; (iv) fund profitability methodology and data; (v) evaluation of competitive fund data and peer group classifications and fee and expense comparisons; (vi) the management fee and expense structures for different funds and classes and information about the differences between various fee and expense structures; (vii) the variable management fee implemented for certain funds effective March 1, 2024; and (viii) information regarding other accounts managed by Fidelity and the funds' sub-advisory arrangements.
Conclusion. Based on its evaluation of all of the conclusions noted above, and after considering all factors it believed relevant, the Board, including the Independent Trustees, concluded that the advisory and sub-advisory fee arrangements are fair and reasonable in light of all of the surrounding circumstances and that the fund's Advisory Contracts should be renewed through May 31, 2025.
Board Approval of Investment Advisory Contract and Management Fees
Fidelity Global Equity Income Fund
At its July 2024 meeting, the Board of Trustees, including the Independent Trustees (together, the Board), voted to approve an amended and restated management contract with Fidelity Management & Research Company LLC (FMR) and certain of its affiliates (the Amended Contract) for the fund to add the management fee schedule and maximum management fee rate for each of the new classes of the fund: Class A, Class M, Class C, Class I and Class Z (each a New Class and together, the New Classes). The Board, assisted by the advice of fund counsel and Independent Trustees' counsel, requested and considered a broad range of information.
Nature, Extent, and Quality of Services Provided. The Board previously received and considered materials relating to the nature, extent and quality of services provided by FMR and certain of its affiliates to the fund, including the resources dedicated to investment management and support services, shareholder and administrative services, the benefits to shareholders of investment in a large fund family, and the investment performance of the fund in connection with the annual renewal of the fund's current management contract. At its May 2024 meeting, the Board concluded that the nature, extent and quality of the services provided to the fund under the existing management contract should continue to benefit the fund's shareholders. In connection with its approval of the Amended Contract at its July 2024 meeting, the Board noted that such approval would not change the fund's portfolio managers, the investment processes, the level or nature of services provided, the resources and personnel allocated or trading and compliance operations. The Board concluded that the nature, extent, and quality of services to be provided to the New Classes of the fund under the Amended Contract will continue to benefit the fund's shareholders.
Competitiveness of Management Fee and Total Expense Ratio. The Board considered the proposed tiered class-level management fee schedule and maximum class-level management fee rate of each New Class of the fund and the projected total expense ratio of each New Class. The Board also considered that, in exchange for the variable management fee, each class of the fund receives investment advisory, management, administrative, transfer agent, and pricing and bookkeeping services. The Board noted that the projected class-level management fee for Class Z of the fund is below the median of its competitor funds. The Board also noted that the projected class-level management fee for Class A, Class M, Class C, and Class I of the fund is above the median of its competitor funds because the majority of such competitor funds do not have a management fee that covers expenses for services beyond portfolio management. The Board also considered that the estimated total net expense ratio of Class Z of the fund is below the median of those funds and classes used by the Board for management fee comparisons that have a similar sales load structure and that the estimated total net expense ratio of Class A, Class M, Class C, and Class I of the fund is above the median of those funds and classes used by the Board for management fee comparisons that have a similar sales load structure. The Board noted that the estimated total net expense ratio of Class A is above the median of its competitor funds primarily due to low fund asset levels. The Board also considered that the estimated total net expense ratio of Class M is above the median of its competitor funds primarily because of higher 12b-1 fees. The Board noted that the estimated total net expense ratio of Class C is above the median of its competitor funds primarily because of its 1.00% 12b-1 fee. The Board also noted that although Class I is categorized by Lipper as an Institutional class, Class I has no investment minimum, unlike other funds and classes categorized as institutional. As a result, FMR believes Class I is generally more comparable to retail funds and classes.
The Board noted that the difference in management fee rates between classes is the result of separate arrangements for class-level services and/or waivers of certain expenses. The Board further noted that such differences are not the result of any difference in advisory or custodial fees or other expenses related to the management of the fund's assets, which do not vary by class.
The Board also noted that FMR has agreed to contractually limit total operating expenses, with certain limited exceptions to, 130 basis points for Class A, 155 basis points for Class M, 205 basis points for Class C, 105 basis points for Class I, and 90 basis points for Class Z, through February 28, 2026.
Based on its review, the Board concluded that the projected management fee and estimated total expense ratio of each New Class of the fund was reasonable in light of the services that the fund and its shareholders will receive and the other factors considered.
Costs of the Services and Profitability. The Board considered that it previously reviewed information regarding the revenues earned and the expenses incurred by FMR in providing services to the fund and the level of FMR's profitability. At its May 2024 meeting, the Board concluded that it was satisfied that the profitability of FMR in connection with the operation of the fund was not excessive.
Economies of Scale. The Board considered that it previously received and reviewed information regarding whether there have been economies of scale in respect of the management of the Fidelity funds, whether the Fidelity funds (including the fund) have appropriately benefited from any such economies of scale, and whether there is a potential realization of any further economies of scale and that it concluded, at its May 2024 meeting, that economies of scale, if any, are being appropriately shared between fund shareholders and Fidelity. The Board recognized that the fund's management contract incorporates a variable management fee structure, which provides breakpoints as a way to share, in part, any potential economies of scale that may exist at the asset class level and through a discount that considers both fund size and total assets of the four applicable asset classes. The Board will continue to review economies of scale in connection with future renewals of the Amended Contract.
Conclusion. Based on its evaluation of all of the conclusions noted above, and after considering all factors it believed relevant, the Board ultimately concluded that the advisory fee structure for the New Classes of the fund was fair and reasonable, and that the fund's Amended Contract should be approved through May 31, 2025.
1.938162.112
GED-ANN-1224
Fidelity® International Discovery K6 Fund
Annual Report
October 31, 2024
Contents
To view a fund's proxy voting guidelines and proxy voting record for the 12-month period ended June 30, visit http://www.fidelity.com/proxyvotingresults or visit the Securities and Exchange Commission's (SEC) web site at http://www.sec.gov.
You may also call 1-800-835-5092 to request a free copy of the proxy voting guidelines.
Standard & Poor's, S&P and S&P 500 are registered service marks of The McGraw-Hill Companies, Inc. and have been licensed for use by Fidelity Distributors Corporation.
Other third-party marks appearing herein are the property of their respective owners.
All other marks appearing herein are registered or unregistered trademarks or service marks of FMR LLC or an affiliated company. © 2024 FMR LLC. All rights reserved.
This report and the financial statements contained herein are submitted for the general information of the shareholders of the Fund. This report is not authorized for distribution to prospective investors in the Fund unless preceded or accompanied by an effective prospectus.
A fund files its complete schedule of portfolio holdings with the SEC for the first and third quarters of each fiscal year on Form N-PORT. Forms N-PORT are available on the SEC's web site at http://www.sec.gov. A fund's Forms N-PORT may be reviewed and copied at the SEC's Public Reference Room in Washington, DC. Information regarding the operation of the SEC's Public Reference Room may be obtained by calling 1-800-SEC-0330.
For a complete list of a fund's portfolio holdings, view the most recent holdings listing, semiannual report, or annual report on Fidelity's web site at http://www.fidelity.com, http://www.institutional.fidelity.com, or http://www.401k.com, as applicable.
NOT FDIC INSURED •MAY LOSE VALUE •NO BANK GUARANTEE
Neither the Fund nor Fidelity Distributors Corporation is a bank.
Item 7: Financial Statements and Financial Highlights for Open-End Management Investment Companies (Annual Report)
Fidelity® International Discovery K6 Fund
Schedule of Investments October 31, 2024
Showing Percentage of Net Assets
| Common Stocks - 97.2% |
| | | Shares | Value ($) |
| Australia - 2.5% | | | |
| Aristocrat Leisure Ltd. | | 90,835 | 3,655,169 |
| Brazilian Rare Earths Ltd. | | 192,741 | 339,284 |
| Canva, Inc. Class A (a)(b) | | 400 | 445,876 |
| CAR Group Ltd. | | 125,196 | 3,083,707 |
| IperionX Ltd. (c) | | 1,342,924 | 2,894,006 |
| National Storage REIT unit | | 2,109,941 | 3,471,270 |
TOTAL AUSTRALIA | | | 13,889,312 |
| Bailiwick of Jersey - 0.5% | | | |
| JTC PLC (d) | | 202,819 | 2,688,477 |
| Belgium - 1.8% | | | |
| UCB SA | | 52,230 | 10,044,571 |
| Brazil - 1.9% | | | |
| Localiza Rent a Car SA | | 145,384 | 1,056,762 |
| MercadoLibre, Inc. (c) | | 3,011 | 6,133,949 |
| Nu Holdings Ltd. Class A (c) | | 209,915 | 3,167,617 |
TOTAL BRAZIL | | | 10,358,328 |
| Canada - 4.5% | | | |
| Alimentation Couche-Tard, Inc. (multi-vtg.) | | 68,481 | 3,571,232 |
| Cameco Corp. | | 56,044 | 2,928,690 |
| Canadian Natural Resources Ltd. | | 191,986 | 6,528,917 |
| Constellation Software, Inc. | | 3,502 | 10,561,309 |
| Constellation Software, Inc. warrants 3/31/40 (b)(c) | | 4,032 | 0 |
| Definity Financial Corp. | | 26,664 | 1,028,949 |
| Lumine Group, Inc. (c) | | 11,603 | 270,169 |
TOTAL CANADA | | | 24,889,266 |
| China - 1.3% | | | |
| Advanced Micro-Fabrication Equipment, Inc., China (A Shares) | | 67,140 | 1,812,866 |
| Chervon Holdings Ltd. | | 172,212 | 453,506 |
| JD.com, Inc. sponsored ADR | | 67,005 | 2,721,743 |
| PDD Holdings, Inc. ADR (c) | | 19,731 | 2,379,361 |
TOTAL CHINA | | | 7,367,476 |
| Denmark - 3.4% | | | |
| DSV A/S | | 11,816 | 2,568,153 |
| Novo Nordisk A/S Series B | | 127,265 | 14,274,680 |
| Tryg A/S | | 85,085 | 2,003,752 |
TOTAL DENMARK | | | 18,846,585 |
| France - 8.8% | | | |
| Air Liquide SA | | 42,375 | 7,597,897 |
| AXA SA | | 222,631 | 8,359,600 |
| BNP Paribas SA | | 35,726 | 2,439,873 |
| Danone SA | | 39,244 | 2,803,534 |
| EssilorLuxottica SA | | 23,842 | 5,586,213 |
| Hermes International SCA | | 3,810 | 8,595,335 |
| L'Oreal SA | | 8,798 | 3,300,750 |
| LVMH Moet Hennessy Louis Vuitton SE | | 4,534 | 3,018,377 |
| Safran SA | | 29,874 | 6,762,449 |
TOTAL FRANCE | | | 48,464,028 |
| Germany - 7.3% | | | |
| adidas AG | | 14,618 | 3,500,884 |
| CTS Eventim AG | | 15,362 | 1,611,681 |
| Merck KGaA | | 23,281 | 3,849,234 |
| Muenchener Rueckversicherungs-Gesellschaft AG in Muenchen | | 10,295 | 5,264,660 |
| Nexus AG | | 30,512 | 1,598,071 |
| Rheinmetall AG | | 19,747 | 10,164,241 |
| SAP SE | | 34,683 | 8,097,964 |
| Siemens AG | | 30,522 | 5,938,051 |
| Talanx AG | | 72 | 5,557 |
TOTAL GERMANY | | | 40,030,343 |
| Hong Kong - 0.6% | | | |
| AIA Group Ltd. | | 431,559 | 3,406,001 |
| Hungary - 0.4% | | | |
| Richter Gedeon PLC | | 67,665 | 1,954,562 |
| India - 2.8% | | | |
| 360 ONE WAM Ltd. | | 117,434 | 1,519,562 |
| Avenue Supermarts Ltd. (c)(d) | | 27,385 | 1,278,090 |
| Computer Age Management Services Private Ltd. | | 55,070 | 2,901,331 |
| HDFC Bank Ltd. | | 268,671 | 5,522,308 |
| Larsen & Toubro Ltd. | | 52,275 | 2,245,502 |
| Lenskart Solutions Pvt Ltd. (a)(b)(c) | | 240,000 | 694,269 |
| Zomato Ltd. (c) | | 500,962 | 1,437,225 |
TOTAL INDIA | | | 15,598,287 |
| Ireland - 1.8% | | | |
| Cairn Homes PLC | | 1,459,655 | 3,380,345 |
| Dalata Hotel Group PLC | | 216,702 | 1,008,871 |
| Kingspan Group PLC (Ireland) | | 59,513 | 5,220,899 |
TOTAL IRELAND | | | 9,610,115 |
| Israel - 0.4% | | | |
| Wix.com Ltd. (c) | | 13,712 | 2,291,549 |
| Italy - 5.1% | | | |
| BFF Bank SpA (d) | | 249,544 | 2,436,187 |
| Ferrari NV | | 8,563 | 4,074,960 |
| FinecoBank SpA | | 125,544 | 2,005,391 |
| Prysmian SpA | | 60,616 | 4,273,910 |
| Recordati SpA | | 11,012 | 624,070 |
| UniCredit SpA | | 327,368 | 14,482,503 |
TOTAL ITALY | | | 27,897,021 |
| Japan - 17.2% | | | |
| Capcom Co. Ltd. | | 153,699 | 3,041,467 |
| Daiichi Sankyo Co. Ltd. | | 106,049 | 3,451,709 |
| Fast Retailing Co. Ltd. | | 20,965 | 6,702,961 |
| Fuji Electric Co. Ltd. | | 60,346 | 3,073,295 |
| Hitachi Ltd. | | 630,586 | 15,843,385 |
| Hoya Corp. | | 38,460 | 5,145,719 |
| Itochu Corp. | | 175,626 | 8,687,837 |
| JEOL Ltd. | | 31,176 | 1,156,490 |
| Mitsubishi Heavy Industries Ltd. | | 316,730 | 4,471,262 |
| Mitsubishi UFJ Financial Group, Inc. | | 472,892 | 4,984,397 |
| ORIX Corp. | | 311,738 | 6,568,283 |
| Pan Pacific International Holdings Ltd. | | 122,855 | 3,047,824 |
| Recruit Holdings Co. Ltd. | | 86,785 | 5,299,312 |
| Renesas Electronics Corp. | | 113,014 | 1,514,198 |
| Shin-Etsu Chemical Co. Ltd. | | 195,649 | 7,169,355 |
| Sony Group Corp. | | 245,895 | 4,327,141 |
| Sumitomo Mitsui Financial Group, Inc. | | 177,135 | 3,757,838 |
| Tokio Marine Holdings, Inc. | | 113,991 | 4,105,519 |
| Tokyo Seimitsu Co. Ltd. | | 21,585 | 1,161,474 |
| Visional, Inc. (c) | | 19,541 | 1,045,621 |
TOTAL JAPAN | | | 94,555,087 |
| Kazakhstan - 0.1% | | | |
| Kaspi.KZ JSC ADR | | 6,875 | 757,213 |
| Korea (South) - 0.3% | | | |
| SK Hynix, Inc. | | 13,920 | 1,828,289 |
| Luxembourg - 0.7% | | | |
| CVC Capital Partners PLC (c)(d) | | 182,049 | 3,819,879 |
| Netherlands - 6.6% | | | |
| ASML Holding NV (Netherlands) | | 18,923 | 12,786,466 |
| BE Semiconductor Industries NV | | 56,348 | 6,002,991 |
| EXOR NV | | 11,352 | 1,200,239 |
| IMCD NV | | 17,652 | 2,804,301 |
| ING Groep NV (Certificaten Van Aandelen) | | 261,343 | 4,435,093 |
| Topicus.Com, Inc. | | 6,089 | 521,240 |
| Wolters Kluwer NV | | 49,453 | 8,321,700 |
TOTAL NETHERLANDS | | | 36,072,030 |
| Puerto Rico - 0.4% | | | |
| Liberty Latin America Ltd.: | | | |
| Class A (c)(e) | | 140,457 | 1,375,074 |
| Class C (c) | | 105,019 | 1,016,584 |
TOTAL PUERTO RICO | | | 2,391,658 |
| Spain - 1.1% | | | |
| CaixaBank SA | | 928,350 | 5,657,145 |
| Puig Brands SA Class B | | 23,807 | 548,997 |
TOTAL SPAIN | | | 6,206,142 |
| Sweden - 3.8% | | | |
| ASSA ABLOY AB (B Shares) | | 78,260 | 2,451,318 |
| Indutrade AB | | 210,624 | 5,705,176 |
| Investor AB (B Shares) | | 282,832 | 8,002,187 |
| Kry International AB (a)(b)(c) | | 3,324 | 69,674 |
| Lagercrantz Group AB (B Shares) | | 232,682 | 4,538,091 |
TOTAL SWEDEN | | | 20,766,446 |
| Switzerland - 1.1% | | | |
| Partners Group Holding AG | | 4,196 | 5,796,802 |
| Taiwan - 2.2% | | | |
| Taiwan Semiconductor Manufacturing Co. Ltd. | | 392,460 | 12,347,424 |
| United Kingdom - 15.3% | | | |
| 3i Group PLC | | 191,814 | 7,865,854 |
| AstraZeneca PLC (United Kingdom) | | 55,396 | 7,882,496 |
| BAE Systems PLC | | 390,041 | 6,286,411 |
| Baltic Classifieds Group PLC | | 252,356 | 1,026,638 |
| Bellway PLC | | 38,123 | 1,394,112 |
| Berkeley Group Holdings PLC | | 25,172 | 1,436,436 |
| Big Yellow Group PLC | | 99,682 | 1,552,702 |
| Compass Group PLC | | 277,471 | 9,011,266 |
| Diploma PLC | | 40,892 | 2,245,166 |
| Flutter Entertainment PLC (c) | | 17,008 | 3,978,277 |
| Games Workshop Group PLC | | 22,995 | 3,546,248 |
| JD Sports Fashion PLC | | 624,063 | 997,826 |
| London Stock Exchange Group PLC | | 61,582 | 8,346,571 |
| RELX PLC (London Stock Exchange) | | 207,578 | 9,519,466 |
| Sage Group PLC | | 95,957 | 1,199,456 |
| Starling Bank Ltd. Series D (a)(b)(c) | | 137,500 | 562,039 |
| Unilever PLC | | 173,477 | 10,582,449 |
| Zegona Communications PLC (c) | | 1,581,560 | 6,770,617 |
TOTAL UNITED KINGDOM | | | 84,204,030 |
| United States of America - 5.3% | | | |
| CRH PLC | | 65,843 | 6,277,599 |
| Linde PLC | | 11,713 | 5,342,885 |
| NVIDIA Corp. | | 22,993 | 3,052,551 |
| Schneider Electric SA | | 28,621 | 7,414,234 |
| Shell PLC (London) | | 210,679 | 7,034,007 |
TOTAL UNITED STATES OF AMERICA | | | 29,121,276 |
| TOTAL COMMON STOCKS (Cost $402,954,830) | | | 535,202,197 |
| | | | |
| Convertible Preferred Stocks - 0.2% |
| | | Shares | Value ($) |
| Australia - 0.0% | | | |
| Canva, Inc.: | | | |
| Series A (a)(b)(c) | | 85 | 94,749 |
| Series A2 (a)(b)(c) | | 15 | 16,720 |
TOTAL AUSTRALIA | | | 111,469 |
| China - 0.1% | | | |
| ByteDance Ltd. Series E1 (a)(b)(c) | | 1,533 | 381,978 |
| dMed Biopharmaceutical Co. Ltd. Series C (a)(b)(c) | | 8,434 | 45,712 |
TOTAL CHINA | | | 427,690 |
| Estonia - 0.1% | | | |
| Bolt Technology OU Series E (a)(b)(c) | | 3,347 | 614,332 |
| TOTAL CONVERTIBLE PREFERRED STOCKS (Cost $1,263,971) | | | 1,153,491 |
| | | | |
| Money Market Funds - 2.3% |
| | | Shares | Value ($) |
| Fidelity Cash Central Fund 4.87% (f) | | 12,598,245 | 12,600,765 |
| Fidelity Securities Lending Cash Central Fund 4.87% (f)(g) | | 100,440 | 100,450 |
| TOTAL MONEY MARKET FUNDS (Cost $12,701,215) | | | 12,701,215 |
| | | | |
| TOTAL INVESTMENT IN SECURITIES - 99.7% (Cost $416,920,016) | 549,056,903 |
NET OTHER ASSETS (LIABILITIES) - 0.3% | 1,594,235 |
| NET ASSETS - 100.0% | 550,651,138 |
| | |
Legend
| (a) | Restricted securities (including private placements) - Investment in securities not registered under the Securities Act of 1933 (excluding 144A issues). At the end of the period, the value of restricted securities (excluding 144A issues) amounted to $2,925,349 or 0.5% of net assets. |
| (d) | Security exempt from registration under Rule 144A of the Securities Act of 1933. These securities may be resold in transactions exempt from registration, normally to qualified institutional buyers. At the end of the period, the value of these securities amounted to $10,222,633 or 1.9% of net assets. |
| (e) | Security or a portion of the security is on loan at period end. |
| (f) | Affiliated fund that is generally available only to investment companies and other accounts managed by Fidelity Investments. The rate quoted is the annualized seven-day yield of the fund at period end. A complete unaudited listing of the fund's holdings as of its most recent quarter end is available upon request. In addition, each Fidelity Central Fund's financial statements, which are not covered by the Fund's Report of Independent Registered Public Accounting Firm, are available on the SEC's website or upon request. |
| (g) | Investment made with cash collateral received from securities on loan. |
| Additional information on each restricted holding is as follows: |
| Security | Acquisition Date | Acquisition Cost ($) |
| Bolt Technology OU Series E | 1/03/22 | 869,539 |
| | | |
| ByteDance Ltd. Series E1 | 11/18/20 | 167,977 |
| | | |
| Canva, Inc. Class A | 3/18/24 | 426,664 |
| | | |
| Canva, Inc. Series A | 9/22/23 | 90,666 |
| | | |
| Canva, Inc. Series A2 | 9/22/23 | 16,000 |
| | | |
| dMed Biopharmaceutical Co. Ltd. Series C | 12/01/20 | 119,789 |
| | | |
| Kry International AB | 5/14/21 - 10/30/24 | 219,661 |
| | | |
| Lenskart Solutions Pvt Ltd. | 4/30/24 | 661,395 |
| | | |
| Starling Bank Ltd. Series D | 6/18/21 - 4/05/22 | 286,270 |
| | | |
Affiliated Central Funds
Fiscal year to date information regarding the Fund's investments in Fidelity Central Funds, including the ownership percentage, is presented below.
| Affiliate | Value, beginning of period ($) | Purchases ($) | Sales Proceeds ($) | Dividend Income ($) | Realized Gain (loss) ($) | Change in Unrealized appreciation (depreciation) ($) | Value, end of period ($) | % ownership, end of period |
| Fidelity Cash Central Fund 4.87% | 20,988,977 | 280,819,832 | 289,207,309 | 791,511 | (735) | - | 12,600,765 | 0.0% |
| Fidelity Securities Lending Cash Central Fund 4.87% | 4,348,895 | 65,424,862 | 69,673,307 | 61,556 | - | - | 100,450 | 0.0% |
| Total | 25,337,872 | 346,244,694 | 358,880,616 | 853,067 | (735) | - | 12,701,215 | |
| | | | | | | | | |
Amounts in the dividend income column in the above table include any capital gain distributions from underlying funds, which are presented in the corresponding line item in the Statement of Operations, if applicable.
Amounts in the dividend income column for Fidelity Securities Lending Cash Central Fund represents the income earned on investing cash collateral, less rebates paid to borrowers and any lending agent fees associated with the loan, plus any premium payments received for lending certain types of securities.
Amounts included in the purchases and sales proceeds columns may include in-kind transactions, if applicable.
Investment Valuation
The following is a summary of the inputs used, as of October 31, 2024, involving the Fund's assets and liabilities carried at fair value. The inputs or methodology used for valuing securities may not be an indication of the risk associated with investing in those securities. For more information on valuation inputs, and their aggregation into the levels used below, please refer to the Investment Valuation section in the accompanying Notes to Financial Statements.
| Valuation Inputs at Reporting Date: |
| Description | Total ($) | Level 1 ($) | Level 2 ($) | Level 3 ($) |
Investments in Securities: | | | | |
|
| Equities: | | | | |
Communication Services | 18,307,746 | 11,800,594 | 6,125,174 | 381,978 |
Consumer Discretionary | 75,496,085 | 38,211,027 | 36,590,789 | 694,269 |
Consumer Staples | 22,085,052 | 4,120,229 | 17,964,823 | - |
Energy | 16,491,614 | 9,457,607 | 7,034,007 | - |
Financials | 120,189,496 | 41,271,850 | 78,355,607 | 562,039 |
Health Care | 54,457,037 | 23,656,721 | 30,754,604 | 45,712 |
Industrials | 124,299,782 | 42,360,308 | 81,939,474 | - |
Information Technology | 70,383,878 | 41,223,822 | 27,918,705 | 1,241,351 |
Materials | 29,621,026 | 11,620,484 | 18,000,542 | - |
Real Estate | 5,023,972 | 1,552,702 | 3,471,270 | - |
|
| Money Market Funds | 12,701,215 | 12,701,215 | - | - |
| Total Investments in Securities: | 549,056,903 | 237,976,559 | 308,154,995 | 2,925,349 |
Financial Statements
| Statement of Assets and Liabilities |
As of October 31, 2024 |
| Assets | | | | |
| Investment in securities, at value (including securities loaned of $95,942) - See accompanying schedule: | | | | |
Unaffiliated issuers (cost $404,218,801) | $ | 536,355,688 | | |
Fidelity Central Funds (cost $12,701,215) | | 12,701,215 | | |
| | | | | |
| | | | | |
| Total Investment in Securities (cost $416,920,016) | | | $ | 549,056,903 |
| Foreign currency held at value (cost $384) | | | | 384 |
| Receivable for investments sold | | | | 867,111 |
| Receivable for fund shares sold | | | | 240,997 |
| Dividends receivable | | | | 940,691 |
| Reclaims receivable | | | | 1,058,688 |
| Distributions receivable from Fidelity Central Funds | | | | 50,259 |
Total assets | | | | 552,215,033 |
| Liabilities | | | | |
| Payable for investments purchased | $ | 319,837 | | |
| Payable for fund shares redeemed | | 383,762 | | |
| Accrued management fee | | 300,201 | | |
| Deferred taxes | | 447,828 | | |
| Other payables and accrued expenses | | 11,817 | | |
| Collateral on securities loaned | | 100,450 | | |
| Total liabilities | | | | 1,563,895 |
| Net Assets | | | $ | 550,651,138 |
| Net Assets consist of: | | | | |
| Paid in capital | | | $ | 514,665,010 |
| Total accumulated earnings (loss) | | | | 35,986,128 |
| Net Assets | | | $ | 550,651,138 |
Net Asset Value, offering price and redemption price per share ($550,651,138 ÷ 39,803,735 shares) | | | $ | 13.83 |
| Statement of Operations |
| Year ended October 31, 2024 |
| Investment Income | | | | |
| Dividends | | | $ | 12,619,189 |
| Interest | | | | 4,211 |
| Income from Fidelity Central Funds (including $61,556 from security lending) | | | | 853,067 |
| Income before foreign taxes withheld | | | $ | 13,476,467 |
| Less foreign taxes withheld | | | | (1,076,845) |
| Total income | | | | 12,399,622 |
| Expenses | | | | |
| Management fee | $ | 3,891,394 | | |
| Independent trustees' fees and expenses | | 2,956 | | |
| Interest | | 4,812 | | |
| Miscellaneous | | 11,491 | | |
| Total expenses before reductions | | 3,910,653 | | |
| Expense reductions | | (620) | | |
| Total expenses after reductions | | | | 3,910,033 |
| Net Investment income (loss) | | | | 8,489,589 |
| Realized and Unrealized Gain (Loss) | | | | |
| Net realized gain (loss) on: | | | | |
| Investment Securities: | | | | |
| Unaffiliated issuers (net of foreign taxes of $143,628) | | 16,246,906 | | |
| Redemptions in-kind | | 21,762,174 | | |
| Fidelity Central Funds | | (735) | | |
| Foreign currency transactions | | 100,461 | | |
| Total net realized gain (loss) | | | | 38,108,806 |
| Change in net unrealized appreciation (depreciation) on: | | | | |
| Investment Securities: | | | | |
| Unaffiliated issuers (net of increase in deferred foreign taxes of $118,508) | | 123,161,911 | | |
| Assets and liabilities in foreign currencies | | 619 | | |
| Total change in net unrealized appreciation (depreciation) | | | | 123,162,530 |
| Net gain (loss) | | | | 161,271,336 |
| Net increase (decrease) in net assets resulting from operations | | | $ | 169,760,925 |
| Statement of Changes in Net Assets |
| |
| | Year ended October 31, 2024 | | Year ended October 31, 2023 |
| Increase (Decrease) in Net Assets | | | | |
| Operations | | | | |
| Net investment income (loss) | $ | 8,489,589 | $ | 9,659,359 |
| Net realized gain (loss) | | 38,108,806 | | (54,707,568) |
| Change in net unrealized appreciation (depreciation) | | 123,162,530 | | 74,783,062 |
| Net increase (decrease) in net assets resulting from operations | | 169,760,925 | | 29,734,853 |
| Distributions to shareholders | | (11,176,994) | | (4,996,303) |
| | | | | |
| Share transactions | | | | |
| Proceeds from sales of shares | | 175,322,558 | | 197,751,242 |
| Reinvestment of distributions | | 11,176,992 | | 4,996,303 |
| Cost of shares redeemed | | (377,815,727) | | (112,155,117) |
| | | | | |
Net increase (decrease) in net assets resulting from share transactions | | (191,316,177) | | 90,592,428 |
| Total increase (decrease) in net assets | | (32,732,246) | | 115,330,978 |
| | | | | |
| Net Assets | | | | |
| Beginning of period | | 583,383,384 | | 468,052,406 |
| End of period | $ | 550,651,138 | $ | 583,383,384 |
| | | | | |
| Other Information | | | | |
| Shares | | | | |
| Sold | | 13,577,941 | | 17,226,620 |
| Issued in reinvestment of distributions | | 955,298 | | 448,904 |
| Redeemed | | (28,467,113) | | (9,674,096) |
| Net increase (decrease) | | (13,933,874) | | 8,001,428 |
| | | | | |
Financial Highlights
Fidelity® International Discovery K6 Fund |
| |
| Years ended October 31, | | 2024 | | 2023 | | 2022 | | 2021 | | 2020 |
Selected Per-Share Data | | | | | | | | | | |
| Net asset value, beginning of period | $ | 10.86 | $ | 10.23 | $ | 14.97 | $ | 11.29 | $ | 10.49 |
| Income from Investment Operations | | | | | | | | | | |
Net investment income (loss) A,B | | .17 | | .19 | | .24 | | .16 | | .12 |
| Net realized and unrealized gain (loss) | | 3.00 | | .55 | | (4.70) | | 3.60 | | .77 |
| Total from investment operations | | 3.17 | | .74 | | (4.46) | | 3.76 | | .89 |
| Distributions from net investment income | | (.20) | | (.11) | | (.28) | | (.08) | | (.04) |
| Distributions from net realized gain | | - | | - | | - | | - | | (.05) |
| Total distributions | | (.20) | | (.11) | | (.28) | | (.08) | | (.09) |
| Net asset value, end of period | $ | 13.83 | $ | 10.86 | $ | 10.23 | $ | 14.97 | $ | 11.29 |
Total Return C | | | | 7.19% | | (30.35)% | | 33.43% | | 8.51% |
Ratios to Average Net Assets B,D,E | | | | | | | | | | |
| Expenses before reductions | | .60% | | .60% | | .60% | | .60% | | .60% |
| Expenses net of fee waivers, if any | | | | .60% | | .60% | | .60% | | .60% |
| Expenses net of all reductions | | .60% | | .60% | | .60% | | .60% | | .60% |
| Net investment income (loss) | | 1.31% | | 1.62% | | 1.98% | | 1.11% | | 1.16% |
| Supplemental Data | | | | | | | | | | |
| Net assets, end of period (000 omitted) | $ | 550,651 | $ | 583,383 | $ | 468,052 | $ | 430,892 | $ | 103,173 |
Portfolio turnover rate F | | | | 55% G | | 50% G | | 58% G | | 42% G |
ACalculated based on average shares outstanding during the period.
BNet investment income (loss) is affected by the timing of the declaration of dividends by any underlying mutual funds or exchange-traded funds (ETFs). Net investment income (loss) of any mutual funds or ETFs is not included in the Fund's net investment income (loss) ratio.
CTotal returns would have been lower if certain expenses had not been reduced during the applicable periods shown.
DFees and expenses of any underlying mutual funds or exchange-traded funds (ETFs) are not included in the Fund's expense ratio. The Fund indirectly bears its proportionate share of these expenses. For additional expense information related to investments in Fidelity Central Funds, please refer to the "Investments in Fidelity Central Funds" note found in the Notes to Financial Statements section of the most recent Annual or Semi-Annual report.
EExpense ratios reflect operating expenses of the class. Expenses before reductions do not reflect amounts reimbursed, waived, or reduced through arrangements with the investment adviser, brokerage services, or other offset arrangements, if applicable, and do not represent the amount paid by the class during periods when reimbursements, waivers or reductions occur.
FAmount does not include the portfolio activity of any underlying mutual funds or exchange-traded funds (ETFs).
GPortfolio turnover rate excludes securities received or delivered in-kind.
Notes to Financial Statements
For the period ended October 31, 2024
1. Organization.
Fidelity International Discovery K6 Fund (the Fund) is a fund of Fidelity Investment Trust (the Trust) and is authorized to issue an unlimited number of shares. Share transactions on the Statement of Changes in Net Assets may contain exchanges between affiliated funds. The Trust is registered under the Investment Company Act of 1940, as amended (the 1940 Act), as an open-end management investment company organized as a Massachusetts business trust. Shares generally are available only to employer-sponsored retirement plans that are recordkept by Fidelity, or to certain employer-sponsored retirement plans that are not recordkept by Fidelity.
2. Investments in Fidelity Central Funds.
Funds may invest in Fidelity Central Funds, which are open-end investment companies generally available only to other investment companies and accounts managed by the investment adviser and its affiliates. The Schedule of Investments lists any Fidelity Central Funds held as an investment as of period end, but does not include the underlying holdings of each Fidelity Central Fund. An investing fund indirectly bears its proportionate share of the expenses of the underlying Fidelity Central Funds.
Based on its investment objective, each Fidelity Central Fund may invest or participate in various investment vehicles or strategies that are similar to those of the investing fund. These strategies are consistent with the investment objectives of the investing fund and may involve certain economic risks which may cause a decline in value of each of the Fidelity Central Funds and thus a decline in the value of the investing fund.
| Fidelity Central Fund | Investment Manager | Investment Objective | Investment Practices | Expense RatioA |
| Fidelity Money Market Central Funds | Fidelity Management & Research Company LLC (FMR) | Each fund seeks to obtain a high level of current income consistent with the preservation of capital and liquidity. | Short-term Investments | Less than .005% |
A Expenses expressed as a percentage of average net assets and are as of each underlying Central Fund's most recent annual or semi-annual shareholder report.
A complete unaudited list of holdings for each Fidelity Central Fund is available upon request or at the Securities and Exchange Commission website at www.sec.gov. In addition, the financial statements of the Fidelity Central Funds which contain the significant accounting policies (including investment valuation policies) of those funds, and are not covered by the Report of Independent Registered Public Accounting Firm, are available on the Securities and Exchange Commission website or upon request.
3. Significant Accounting Policies.
The Fund is an investment company and applies the accounting and reporting guidance of the Financial Accounting Standards Board (FASB) Accounting Standards Codification Topic 946 Financial Services - Investment Companies. The financial statements have been prepared in conformity with accounting principles generally accepted in the United States of America (GAAP), which require management to make certain estimates and assumptions at the date of the financial statements. Actual results could differ from those estimates. Subsequent events, if any, through the date that the financial statements were issued have been evaluated in the preparation of the financial statements. The Fund's Schedule of Investments lists any underlying mutual funds or exchange-traded funds (ETFs) but does not include the underlying holdings of these funds. The following summarizes the significant accounting policies of the Fund:
Investment Valuation. Investments are valued as of 4:00 p.m. Eastern time on the last calendar day of the period. The Board of Trustees (the Board) has designated the Fund's investment adviser as the valuation designee responsible for the fair valuation function and performing fair value determinations as needed. The investment adviser has established a Fair Value Committee (the Committee) to carry out the day-to-day fair valuation responsibilities and has adopted policies and procedures to govern the fair valuation process and the activities of the Committee. In accordance with these fair valuation policies and procedures, which have been approved by the Board, the Fund attempts to obtain prices from one or more third party pricing services or brokers to value its investments. When current market prices, quotations or currency exchange rates are not readily available or reliable, investments will be fair valued in good faith by the Committee, in accordance with the policies and procedures. Factors used in determining fair value vary by investment type and may include market or investment specific events, transaction data, estimated cash flows, and market observations of comparable investments. The frequency that the fair valuation procedures are used cannot be predicted and they may be utilized to a significant extent. The Committee manages the Fund's fair valuation practices and maintains the fair valuation policies and procedures. The Fund's investment adviser reports to the Board information regarding the fair valuation process and related material matters.
The Fund categorizes the inputs to valuation techniques used to value its investments into a disclosure hierarchy consisting of three levels as shown below:
Level 1 - unadjusted quoted prices in active markets for identical investments
Level 2 - other significant observable inputs (including quoted prices for similar investments, interest rates, prepayment speeds, etc.)
Level 3 - unobservable inputs (including the Fund's own assumptions based on the best information available)
Valuation techniques used to value the Fund's investments by major category are as follows:
Equity securities, including restricted securities, for which market quotations are readily available, are valued at the last reported sale price or official closing price as reported by a third party pricing service on the primary market or exchange on which they are traded and are categorized as Level 1 in the hierarchy. In the event there were no sales during the day or closing prices are not available, securities are valued at the last quoted bid price or may be valued using the last available price and are generally categorized as Level 2 in the hierarchy. For foreign equity securities, when market or security specific events arise, comparisons to the valuation of American Depositary Receipts (ADRs), futures contracts, Exchange-Traded Funds (ETFs) and certain indexes as well as quoted prices for similar securities may be used and would be categorized as Level 2 in the hierarchy. For equity securities, including restricted securities, where observable inputs are limited, assumptions about market activity and risk are used and these securities may be categorized as Level 3 in the hierarchy.
Investments in open-end mutual funds, including the Fidelity Central Funds, are valued at their closing net asset value (NAV) each business day and are categorized as Level 1 in the hierarchy.
Changes in valuation techniques may result in transfers in or out of an assigned level within the disclosure hierarchy. The aggregate value of investments by input level as of October 31, 2024 is included at the end of the Fund's Schedule of Investments.
Foreign Currency. Certain Funds may use foreign currency contracts to facilitate transactions in foreign-denominated securities. Gains and losses from these transactions may arise from changes in the value of the foreign currency or if the counterparties do not perform under the contracts' terms.
Foreign-denominated assets, including investment securities, and liabilities are translated into U.S. dollars at the exchange rates at period end. Purchases and sales of investment securities, income and dividends received, and expenses denominated in foreign currencies are translated into U.S. dollars at the exchange rate in effect on the transaction date.
The effects of exchange rate fluctuations on investments are included with the net realized and unrealized gain (loss) on investment securities. Other foreign currency transactions resulting in realized and unrealized gain (loss) are disclosed separately.
Investment Transactions and Income. For financial reporting purposes, the Fund's investment holdings and NAV include trades executed through the end of the last business day of the period. The NAV per share for processing shareholder transactions is calculated as of the close of business of the New York Stock Exchange (NYSE), normally 4:00 p.m. Eastern time and includes trades executed through the end of the prior business day. Gains and losses on securities sold are determined on the basis of identified cost. Commissions paid to certain brokers with whom the investment adviser, or its affiliates, places trades on behalf of a fund include an amount in addition to trade execution, which may be rebated back to a fund. Any such rebates are included in net realized gain (loss) on investments in the Statement of Operations. Dividend income is recorded on the ex-dividend date, except for certain dividends from foreign securities where the ex-dividend date may have passed, which are recorded as soon as the Fund is informed of the ex-dividend date. Non-cash dividends included in dividend income, if any, are recorded at the fair market value of the securities received. Income and capital gain distributions from Fidelity Central Funds, if any, are recorded on the ex-dividend date. Interest income is accrued as earned and includes coupon interest and amortization of premium and accretion of discount on debt securities as applicable. Investment income is recorded net of foreign taxes withheld where recovery of such taxes is uncertain. Funds may file withholding tax reclaims in certain jurisdictions to recover a portion of amounts previously withheld. Any withholding tax reclaims income is included in the Statement of Operations in foreign taxes withheld. Any receivables for withholding tax reclaims are included in the Statement of Assets and Liabilities in reclaims receivable.
Expenses. Expenses directly attributable to a fund are charged to that fund. Expenses attributable to more than one fund are allocated among the respective funds on the basis of relative net assets or other appropriate methods. Expenses included in the accompanying financial statements reflect the expenses of that fund and do not include any expenses associated with any underlying mutual funds or exchange-traded funds. Although not included in a fund's expenses, a fund indirectly bears its proportionate share of these expenses through the net asset value of each underlying mutual fund or exchange-traded fund. Expense estimates are accrued in the period to which they relate and adjustments are made when actual amounts are known.
Income Tax Information and Distributions to Shareholders. Each year, the Fund intends to qualify as a regulated investment company under Subchapter M of the Internal Revenue Code, including distributing substantially all of its taxable income and realized gains. As a result, no provision for U.S. Federal income taxes is required. As of October 31, 2024, the Fund did not have any unrecognized tax benefits in the financial statements; nor is the Fund aware of any tax positions for which it is reasonably possible that the total amounts of unrecognized tax benefits will significantly change in the next twelve months. The Fund files a U.S. federal tax return, in addition to state and local tax returns as required. The Fund's federal income tax returns are subject to examination by the Internal Revenue Service (IRS) for a period of three fiscal years after they are filed. State and local tax returns may be subject to examination for an additional fiscal year depending on the jurisdiction. Foreign taxes are provided for based on the Fund's understanding of the tax rules and rates that exist in the foreign markets in which it invests. The Fund is subject to a tax imposed on capital gains by certain countries in which it invests. An estimated deferred tax liability for net unrealized appreciation on the applicable securities is included in Deferred taxes on the Statement of Assets and Liabilities.
Distributions are declared and recorded on the ex-dividend date. Income and capital gain distributions are determined in accordance with income tax regulations, which may differ from GAAP.
Capital accounts within the financial statements are adjusted for permanent book-tax differences. These adjustments have no impact on net assets or the results of operations. Capital accounts are not adjusted for temporary book-tax differences which will reverse in a subsequent period.
Book-tax differences are primarily due to foreign currency transactions, certain foreign taxes, passive foreign investment companies (PFIC), redemptions in-kind, capital loss carryforwards and losses deferred due to wash sales.
As of period end, the cost and unrealized appreciation (depreciation) in securities, and derivatives if applicable, for federal income tax purposes were as follows:
| Gross unrealized appreciation | $126,907,217 |
| Gross unrealized depreciation | (7,258,618) |
| Net unrealized appreciation (depreciation) | $119,648,599 |
| Tax Cost | $429,408,304 |
The tax-based components of distributable earnings as of period end were as follows:
| Undistributed ordinary income | $20,154,243 |
| Capital loss carryforward | $(103,339,406) |
| Net unrealized appreciation (depreciation) on securities and other investments | $119,619,119 |
Capital loss carryforwards are only available to offset future capital gains of the Fund to the extent provided by regulations and may be limited. The capital loss carryforward information presented below, including any applicable limitation, is estimated as of fiscal period end and is subject to adjustment.
| Short-term | $(90,418,700) |
| Long-term | (12,920,706) |
| Total capital loss carryforward | $(103,339,406) |
Due to large subscriptions in a prior period, approximately $69,101,114 of the Fund's realized capital losses are subject to limitation. Due to this limitation, the Fund will only be permitted to use approximately $11,985,573 of those capital losses per year to offset capital gains. Additionally, the Fund is subject to an annual limit on its use of some of its unrealized capital losses to offset capital gains in future periods. If those losses are realized and the limitation prevents the Fund from using any of those losses in a future period, those capital losses will be available to offset capital gains in subsequent periods.
The tax character of distributions paid was as follows:
| | October 31, 2024 | October 31, 2023 |
| Ordinary Income | $11,176,994 | $4,996,303 |
Restricted Securities (including Private Placements). Funds may invest in securities that are subject to legal or contractual restrictions on resale. These securities generally may be resold in transactions exempt from registration or to the public if the securities are registered. Disposal of these securities may involve time-consuming negotiations and expense, and prompt sale at an acceptable price may be difficult. Information regarding restricted securities held at period end is included at the end of the Schedule of Investments, if applicable.
New Accounting Pronouncement. In November 2023, the FASB issued Accounting Standards Update (ASU) 2023-07 Segment Reporting (Topic 280): Improvements to Reportable Segment Disclosures. Effective for fiscal years beginning after December 15, 2023 and interim periods within fiscal years beginning after December 15, 2024, the amendments enhance required disclosures of segment information for public entities on an annual and interim basis. The ASU allows for early adoption with updates applied retrospectively. Management is currently evaluating the impact of the ASU but does not expect this guidance to materially impact the financial statements.
4. Purchases and Sales of Investments.
Purchases and sales of securities, other than short-term securities and in-kind transactions, as applicable, are noted in the table below.
| | Purchases ($) | Sales ($) |
| Fidelity International Discovery K6 Fund | 295,696,205 | 444,488,888 |
Unaffiliated Redemptions In-Kind. Shares that were redeemed in-kind for investments, including accrued interest and cash, if any, are shown in the table below. The net realized gain or loss on investments delivered through in-kind redemptions is included in the "Net realized gain (loss) on: Redemptions in-kind" line in the accompanying Statement of Operations. The amount of the in-kind redemptions is included in share transactions in the accompanying Statement of Changes in Net Assets. There was no gain or loss for federal income tax purposes.
| | Shares | Total net realized gain or loss ($) | Total Proceeds ($) |
| Fidelity International Discovery K6 Fund | 5,980,844 | 21,762,174 | 73,727,455 |
Unaffiliated Exchanges In-Kind. Shares that were exchanged for investments, including accrued interest and cash, if any, are shown in the table below. The amount of in-kind exchanges is included in share transactions in the accompanying Statement of Changes in Net Assets.
| | Shares | Total Proceeds ($) |
| Fidelity International Discovery K6 Fund | 3,165,883 | 36,396,996 |
Prior Year Unaffiliated Exchanges In-Kind. Shares that were exchanged for investments, including accrued interest and cash, if any, are shown in the table below. The amount of in-kind exchanges is included in share transactions in the accompanying Statement of Changes in Net Assets.
| | Shares | Total Proceeds ($) |
| Fidelity International Discovery K6 Fund | 8,198,739 | 94,487,059 |
5. Fees and Other Transactions with Affiliates.
Management Fee. Fidelity Management & Research Company LLC (the investment adviser) and its affiliates provide the Fund with investment management related services for which the Fund pays a monthly management fee that is based on an annual rate of .60% of average net assets. Under the management contract, the investment adviser or an affiliate pays all other expenses of the Fund, excluding fees and expenses of the independent Trustees, and certain miscellaneous expenses such as proxy and shareholder meeting expenses.
Brokerage Commissions. A portion of portfolio transactions were placed with brokerage firms which are affiliates of the investment adviser. Brokerage commissions are included in net realized gain (loss) and change in net unrealized appreciation (depreciation) in the Statement of Operations. The commissions paid to these affiliated firms were as follows:
| | Amount ($) |
| Fidelity International Discovery K6 Fund | 463 |
Interfund Lending Program. Pursuant to an Exemptive Order issued by the Securities and Exchange Commission (the SEC), the Fund, along with other registered investment companies having management contracts with Fidelity Management & Research Company LLC (FMR), or other affiliated entities of FMR, may participate in an interfund lending program. This program provides an alternative credit facility allowing the Fund to borrow from, or lend money to, other participating affiliated funds at rates that are beneficial to both the borrowing and lending fund. Borrowings under the program are generally for temporary or emergency purposes, including meeting fund shareholder redemptions. The interfund loan rate is determined, as specified in the Exemptive Order, by averaging, (1) the higher of the overnight time deposit rate and the current overnight repurchase agreement rate, and (2) a benchmark rate representing the lowest bank loan rate available to the funds. At period end, there were no interfund loans outstanding. Activity in this program during the period for which loans were outstanding was as follows:
| | Borrower or Lender | Average Loan Balance ($) | Weighted Average Interest Rate | Interest Expense ($) |
Fidelity International Discovery K6 Fund. | Borrower | 17,067,500 | 5.08% | 4,812 |
Interfund Trades. Funds may purchase from or sell securities to other Fidelity Funds under procedures adopted by the Board. The procedures have been designed to ensure these interfund trades are executed in accordance with Rule 17a-7 of the 1940 Act. Any interfund trades are included within the respective purchases and sales amounts shown in the Purchases and Sales of Investments note. Interfund trades during the period are noted in the table below.
| | Purchases ($) | Sales ($) | Realized Gain (Loss)($) |
| Fidelity International Discovery K6 Fund | 4,408,880 | 29,808,850 | 2,670,163 |
Sub-Advisory Arrangements. Effective March 1, 2024, the Fund's sub-advisory agreements with FMR Investment Management (UK) Limited, Fidelity Management & Research (Hong Kong) Limited, and Fidelity Management & Research (Japan) Limited were amended to provide that the investment adviser pays each sub-adviser monthly fees equal to 110% of the sub-adviser's costs for providing sub-advisory services.
6. Committed Line of Credit.
Certain Funds participate with other funds managed by the investment adviser or an affiliate in a $4.25 billion credit facility (the "line of credit") to be utilized for temporary or emergency purposes to fund shareholder redemptions or for other short-term liquidity purposes. The commitment fees on the pro-rata portion of the line of credit are borne by the investment adviser. During the period, there were no borrowings on this line of credit.
7. Security Lending.
Funds lend portfolio securities from time to time in order to earn additional income. Lending agents are used, including National Financial Services (NFS), an affiliate of the investment adviser. Pursuant to a securities lending agreement, NFS will receive a fee, which is capped at 9.9% of a fund's daily lending revenue, for its services as lending agent. A fund may lend securities to certain qualified borrowers, including NFS. On the settlement date of the loan, a fund receives collateral (in the form of U.S. Treasury obligations, letters of credit and/or cash) against the loaned securities and maintains collateral in an amount not less than 100% of the market value of the loaned securities during the period of the loan. The market value of the loaned securities is determined at the close of business of a fund and any additional required collateral is delivered to a fund on the next business day. A fund or borrower may terminate the loan at any time, and if the borrower defaults on its obligation to return the securities loaned because of insolvency or other reasons, a fund may apply collateral received from the borrower against the obligation. A fund may experience delays and costs in recovering the securities loaned. Any cash collateral received is invested in the Fidelity Securities Lending Cash Central Fund. Any loaned securities are identified as such in the Schedule of Investments, and the value of loaned securities and cash collateral at period end, as applicable, are presented in the Statement of Assets and Liabilities. Security lending income represents the income earned on investing cash collateral, less rebates paid to borrowers and any lending agent fees associated with the loan, plus any premium payments received for lending certain types of securities. Security lending income is presented in the Statement of Operations as a component of income from Fidelity Central Funds. Affiliated security lending activity, if any, was as follows:
| | Total Security Lending Fees Paid to NFS ($) | Security Lending Income From Securities Loaned to NFS ($) | Value of Securities Loaned to NFS at Period End ($) |
| Fidelity International Discovery K6 Fund | 6,671 | 3 | 13,706 |
8. Expense Reductions.
Through arrangements with the Fund's custodian, credits realized as a result of certain uninvested cash balances were used to reduce the Fund's expenses by $620.
9. Other.
A fund's organizational documents provide former and current trustees and officers with a limited indemnification against liabilities arising in connection with the performance of their duties to the fund. In the normal course of business, a fund may also enter into contracts that provide general indemnifications. A fund's maximum exposure under these arrangements is unknown as this would be dependent on future claims that may be made against a fund. The risk of material loss from such claims is considered remote.
10. Risk and Uncertainties.
Many factors affect a fund's performance. Developments that disrupt global economies and financial markets, such as pandemics, epidemics, outbreaks of infectious diseases, war, terrorism, and environmental disasters, may significantly affect a fund's investment performance. The effects of these developments to a fund will be impacted by the types of securities in which a fund invests, the financial condition, industry, economic sector, and geographic location of an issuer, and a fund's level of investment in the securities of that issuer. Significant concentrations in security types, issuers, industries, sectors, and geographic locations may magnify the factors that affect a fund's performance.
Report of Independent Registered Public Accounting Firm
To the Board of Trustees of Fidelity Investment Trust and the Shareholders of Fidelity International Discovery K6 Fund:
Opinion on the Financial Statements and Financial Highlights
We have audited the accompanying statement of assets and liabilities of Fidelity International Discovery K6 Fund (the "Fund"), a fund of Fidelity Investment Trust, including the schedule of investments, as of October 31, 2024, the related statement of operations for the year then ended, the statement of changes in net assets for each of the two years in the period then ended, the financial highlights for each of the five years in the period then ended, and the related notes. In our opinion, the financial statements and financial highlights present fairly, in all material respects, the financial position of the Fund as of October 31, 2024, and the results of its operations for the year then ended, the changes in its net assets for each of the two years in the period then ended, and the financial highlights for each of the five years in the period then ended in conformity with accounting principles generally accepted in the United States of America.
Basis for Opinion
These financial statements and financial highlights are the responsibility of the Fund's management. Our responsibility is to express an opinion on the Fund's financial statements and financial highlights based on our audits. We are a public accounting firm registered with the Public Company Accounting Oversight Board (United States) (PCAOB) and are required to be independent with respect to the Fund in accordance with the U.S. federal securities laws and the applicable rules and regulations of the Securities and Exchange Commission and the PCAOB.
We conducted our audits in accordance with the standards of the PCAOB. Those standards require that we plan and perform the audit to obtain reasonable assurance about whether the financial statements and financial highlights are free of material misstatement, whether due to error or fraud. The Fund is not required to have, nor were we engaged to perform, an audit of its internal control over financial reporting. As part of our audits, we are required to obtain an understanding of internal control over financial reporting but not for the purpose of expressing an opinion on the effectiveness of the Fund's internal control over financial reporting. Accordingly, we express no such opinion.
Our audits included performing procedures to assess the risks of material misstatement of the financial statements and financial highlights, whether due to error or fraud, and performing procedures that respond to those risks. Such procedures included examining, on a test basis, evidence regarding the amounts and disclosures in the financial statements and financial highlights. Our audits also included evaluating the accounting principles used and significant estimates made by management, as well as evaluating the overall presentation of the financial statements and financial highlights. Our procedures included confirmation of securities owned as of October 31, 2024, by correspondence with the custodian and brokers; when replies were not received from brokers, we performed other auditing procedures. We believe that our audits provide a reasonable basis for our opinion.
/s/ Deloitte & Touche LLP
Boston, Massachusetts
December 16, 2024
We have served as the auditor of one or more of the Fidelity investment companies since 1999.
Distributions
(Unaudited)
The dividend and capital gains distributions for the fund(s) are available on Fidelity.com or Institutional.Fidelity.com.
The fund designates $649,705 of distributions paid during the fiscal year ended 2024 as qualifying to be taxed as section 163(j) interest dividends.
The fund designates 85.25% of the dividend distributed during the fiscal year as amounts which may be taken into account as a dividend for the purposes of the maximum rate under section 1(h)(11) of the Internal Revenue Code.
The amounts per share which represent income derived from sources within, and taxes paid to, foreign countries or possessions of the United States are $0.2053 and $0.0214 for the dividend paid December 11, 2023.
The fund will notify shareholders in January 2025 of amounts for use in preparing 2024 income tax returns.
Item 8: Changes in and Disagreements with Accountants for Open-End Management Investment Companies
(Unaudited)
Note: This is not applicable for any fund included in this document.
Item 9: Proxy Disclosures for Open-End Management Investment Companies
(Unaudited)
| A special meeting of shareholders was held on July 16, 2024. The results of votes taken among shareholders on the proposal before them are reported below. Each vote reported represents one dollar of net asset value held on the record date for the meeting. |
| Proposal 1 |
| To elect a Board of Trustees. |
| | # of Votes | % of Votes |
| Bettina Doulton |
| Affirmative | 128,529,177,643.56 | 98.18 |
| Withheld | 2,378,037,364.30 | 1.82 |
| TOTAL | 130,907,215,007.85 | 100.00 |
| Robert A. Lawrence |
| Affirmative | 128,253,389,899.05 | 97.97 |
| Withheld | 2,653,825,108.81 | 2.03 |
| TOTAL | 130,907,215,007.85 | 100.00 |
| Vijay C. Advani |
| Affirmative | 128,531,418,228.19 | 98.19 |
| Withheld | 2,375,796,779.66 | 1.81 |
| TOTAL | 130,907,215,007.85 | 100.00 |
| Thomas P. Bostick |
| Affirmative | 128,495,261,591.41 | 98.16 |
| Withheld | 2,411,953,416.44 | 1.84 |
| TOTAL | 130,907,215,007.85 | 100.00 |
| Donald F. Donahue |
| Affirmative | 128,407,878,996.00 | 98.09 |
| Withheld | 2,499,336,011.85 | 1.91 |
| TOTAL | 130,907,215,007.85 | 100.00 |
| Vicki L. Fuller |
| Affirmative | 128,625,540,095.19 | 98.26 |
| Withheld | 2,281,674,912.66 | 1.74 |
| TOTAL | 130,907,215,007.85 | 100.00 |
| Patricia L. Kampling |
| Affirmative | 128,668,729,281.34 | 98.29 |
| Withheld | 2,238,485,726.51 | 1.71 |
| TOTAL | 130,907,215,007.85 | 100.00 |
| Thomas A. Kennedy |
| Affirmative | 128,499,824,239.79 | 98.16 |
| Withheld | 2,407,390,768.06 | 1.84 |
| TOTAL | 130,907,215,007.85 | 100.00 |
| Oscar Munoz |
| Affirmative | 128,386,109,391.05 | 98.07 |
| Withheld | 2,521,105,616.80 | 1.93 |
| TOTAL | 130,907,215,007.85 | 100.00 |
| Karen B. Peetz |
| Affirmative | 128,603,731,113.82 | 98.24 |
| Withheld | 2,303,483,894.03 | 1.76 |
| TOTAL | 130,907,215,007.85 | 100.00 |
| David M. Thomas |
| Affirmative | 128,384,899,342.98 | 98.07 |
| Withheld | 2,522,315,664.88 | 1.93 |
| TOTAL | 130,907,215,007.85 | 100.00 |
| Susan Tomasky |
| Affirmative | 128,556,148,461.60 | 98.20 |
| Withheld | 2,351,066,546.25 | 1.80 |
| TOTAL | 130,907,215,007.85 | 100.00 |
| Michael E. Wiley |
| Affirmative | 128,264,934,978.34 | 97.98 |
| Withheld | 2,642,280,029.51 | 2.02 |
| TOTAL | 130,907,215,007.85 | 100.00 |
| | | |
| Proposal 1 reflects trust-wide proposal and voting results. |
Item 10: Remuneration Paid to Directors, Officers, and others of Open-End Management Investment Companies
(Unaudited)
Note: This information is disclosed as part of the financial statements for each Fund as part of Item 7: Financial Statements and Financial Highlights for Open-End Management Investment companies.
Item 11: Statement Regarding Basis for Approval of Investment Advisory Contract
(Unaudited)
Board Approval of Investment Advisory Contracts and Management Fees
Fidelity International Discovery K6 Fund
Each year, the Board of Trustees, including the Independent Trustees (together, the Board), considers the renewal of the fund's management contract with Fidelity Management & Research Company LLC (FMR) and the sub-advisory agreements (together, the Advisory Contracts) for the fund. FMR and the sub-advisers are referred to herein as the Investment Advisers. The Board, assisted by the advice of fund counsel and Independent Trustees' counsel, requests and considers a broad range of information relevant to the renewal of the Advisory Contracts throughout the year.
The Board meets regularly and, at each of its meetings, covers an extensive agenda of topics and materials and considers factors that are relevant to its annual consideration of the renewal of the fund's Advisory Contracts, including the services and support provided to the fund and its shareholders. The Board, acting directly and through its Committees (each of which is composed of and chaired by Independent Trustees), requests and receives information concerning the annual consideration of the renewal of the fund's Advisory Contracts. The Board also meets as needed to review matters specifically related to the Board's annual consideration of the renewal of the Advisory Contracts. Members of the Board may also meet with trustees of other Fidelity funds through joint ad hoc committees to discuss certain matters relevant to all of the Fidelity funds.
At its May 2024 meeting, the Board unanimously determined to renew the fund's Advisory Contracts. In reaching its determination, the Board considered all factors it believed relevant, including (i) the nature, extent, and quality of the services provided to the fund and its shareholders (including the investment performance of the fund); (ii) the competitiveness relative to peer funds of the fund's management fee and total expense ratio; (iii) the total costs of the services provided by and the profits realized by FMR and its affiliates (Fidelity) from its relationships with the fund; and (iv) the extent to which, if any, economies of scale exist and are realized as the fund grows, and whether any economies of scale are appropriately shared with fund shareholders. The Board also considered the broad range of investment choices available to shareholders from FMR's competitors and that the fund's shareholders have chosen to invest in the fund, which is part of the Fidelity family of funds. The Board's decision to renew the Advisory Contracts was not based on any single factor.
The Board reached a determination, with the assistance of fund counsel and Independent Trustees' counsel and through the exercise of its business judgment, that the renewal of the Advisory Contracts was in the best interests of the fund and its shareholders and that the compensation payable under the Advisory Contracts was fair and reasonable in light of all of the surrounding circumstances.
Nature, Extent, and Quality of Services Provided. The Board considered staffing as it relates to the fund, including the backgrounds and experience of investment personnel of the Investment Advisers, and also considered the Investment Advisers' implementation of the fund's investment program. The Independent Trustees also had discussions with senior management of Fidelity's investment operations and investment groups. The Board considered the structure of the investment personnel compensation program and whether this structure provides appropriate incentives to act in the best interests of the fund. Additionally, the Board considered the portfolio managers' investments, if any, in the funds that they manage.
Resources Dedicated to Investment Management and Support Services. The Board and the Fund Oversight and Research Committees reviewed the general qualifications and capabilities of Fidelity's investment staff, including its size, education, experience, and resources, as well as Fidelity's approach to recruiting, training, managing, and compensating investment personnel. The Board noted the resources devoted to expansion of Fidelity's global investment organization, and that Fidelity's analysts have extensive resources, tools, and capabilities that allow them to conduct sophisticated quantitative and fundamental analysis, as well as credit analysis of issuers, counterparties, and guarantors. Further, the Board considered that Fidelity's investment professionals have sufficient access to global information and data so as to provide competitive investment results over time, and that those professionals also have access to sophisticated tools that permit them to assess portfolio construction and risk and performance attribution characteristics continuously, as well as to transmit new information and research conclusions rapidly around the world. Additionally, in its deliberations, the Board considered Fidelity's trading, risk management, compliance, and technology and operations capabilities and resources, which are integral parts of the investment management process.
Shareholder and Administrative Services. The Board considered (i) the nature, extent, quality, and cost of advisory, administrative, and shareholder services performed by the Investment Advisers and their affiliates under the Advisory Contracts and under separate agreements covering transfer agency and pricing and bookkeeping services for the fund; (ii) the nature and extent of Fidelity's supervision of third party service providers, principally custodians, subcustodians, and pricing vendors; and (iii) the resources devoted by Fidelity to, and the record of compliance with, the fund's compliance policies and procedures. The Board also reviewed the allocation of fund brokerage, including allocations to brokers affiliated with the Investment Advisers, the use of brokerage commissions to pay fund expenses, and the use of "soft" commission dollars to pay for research services. The Board also considered the fund's securities lending activities and any payments made to Fidelity relating to securities lending under a separate agreement.
The Board noted that the growth of fund assets over time across the complex allows Fidelity to reinvest in the development of services designed to enhance the value and convenience of the Fidelity funds as investment vehicles. These services include 24-hour access to account information and market information over the Internet and through telephone representatives, investor education materials, and asset allocation tools. The Board also considered that it reviews customer service metrics such as telephone response times, continuity of services on the website and metrics addressing services at Fidelity Investor Centers.
Investment in a Large Fund Family. The Board considered the benefits to shareholders of investing in a fund that is part of a large family of funds offering a variety of investment disciplines and providing a large variety of fund investor services. The Board noted that Fidelity had taken, or had made recommendations that resulted in the Fidelity funds taking, a number of actions over the previous year that benefited particular funds and/or the Fidelity funds in general.
Investment Performance. The Board took into account discussions that occur with representatives of the Investment Advisers, and reports that it receives, at Board meetings throughout the year, relating to fund investment performance. In this regard the Board noted that as part of regularly scheduled fund reviews and other reports to the Board on fund performance, the Board considered annualized return information for the fund for different time periods, measured against an appropriate securities market index (benchmark index) and an appropriate peer group of funds with similar objectives (peer group). The Board also considered information about performance attribution. In its ongoing evaluation of fund investment performance, the Board gives particular attention to information indicating changes in performance of the funds over different time periods and discussed with the Investment Advisers the reasons for any overperformance or underperformance.
In addition to reviewing absolute and relative fund performance, the Independent Trustees periodically consider the appropriateness of fund performance metrics in evaluating the results achieved. The Independent Trustees generally give greater weight to fund performance over longer time periods than over shorter time periods. Depending on the circumstances, the Independent Trustees may be satisfied with a fund's performance notwithstanding that it lags its benchmark index or peer group for certain periods.
Based on its review, the Board concluded that the nature, extent, and quality of services provided to the fund under the Advisory Contracts should continue to benefit the shareholders of the fund.
Competitiveness of Management Fee and Total Expense Ratio. The Board was provided with information regarding industry trends in management fees and expenses. In its review of the fund's management fee and total expense ratio, the Board considered the fund's unitary fee rate as well as other fund expenses paid by FMR under the fund's management contract, such as transfer agent fees, pricing and bookkeeping fees, and custodial, legal, and audit fees. The Board noted that Fidelity may agree to waive fees or reimburse expenses from time to time, and the extent to which, if any, it has done so for the fund.
Comparisons of Management Fees and Total Expense Ratios. Among other things, the Board reviewed data for selected groups of competitive funds and classes (referred to as "mapped groups") that were compiled by Fidelity based on combining similar investment objective categories (as classified by Morningstar) that have comparable investment mandates. The data reviewed by the Board included (i) gross management fee comparisons (before taking into account expense reimbursements or caps) relative to the total universe of funds within the mapped group; (ii) gross management fee comparisons relative to a subset of non-Fidelity funds in the mapped group that are similar in size and management fee structure to the fund (referred to as the "asset size peer group"); (iii) total expense comparisons of the fund relative to funds and classes in the mapped group that have a similar sales load structure to the fund (referred to as the "similar sales load structure group"); and (iv) total expense comparisons of the fund relative to funds and classes in the similar sales load structure group that are similar in size and management fee structure to the fund (referred to as the "total expense asset size peer group"). The total expense asset size peer group comparison excludes performance adjustments and fund-paid 12b-1 fees to eliminate variability in fee structures.
The information provided to the Board indicated that the fund's management fee rate ranked below the competitive median of the mapped group for the 12-month period ended September 30, 2023 and below the competitive median of the asset size peer group for the 12-month period ended September 30, 2023. Further, the information provided to the Board indicated that the total expense ratio of the fund ranked below the competitive median of the similar sales load structure group for the 12-month period ended September 30, 2023 and below the competitive median of the total expense asset size peer group for the 12-month period ended September 30, 2023.
Fees Charged to Other Fidelity Clients. The Board also considered Fidelity fee structures and other information with respect to clients of Fidelity, such as other funds advised or subadvised by Fidelity, pension plan clients, and other institutional clients with similar mandates. The Board noted that a joint ad hoc committee created by it and the boards of other Fidelity funds periodically reviews and compares Fidelity's institutional investment advisory business with its business of providing services to the Fidelity funds and also noted the most recent findings of the committee. The Board noted that the committee's review included a consideration of the differences in services provided, fees charged, and costs incurred, as well as competition in the markets serving the different categories of clients.
Based on its review, the Board concluded that the fund's management fee is fair and reasonable in light of the services that the fund receives and the other factors considered. Further, based on its review of total expense ratios and fees charged to other Fidelity clients, the Board concluded that the fund's total expense ratio was reasonable in light of the services that the fund and its shareholders receive and the other factors considered.
Costs of the Services and Profitability. The Board considered the revenues earned and the expenses incurred by Fidelity in conducting the business of developing, marketing, distributing, managing, administering and servicing the fund and servicing the fund's shareholders. The Board also considered the level of Fidelity's profits in respect of all the Fidelity funds.
On an annual basis, Fidelity presents to the Board information about the profitability of its relationships with the fund. Fidelity calculates profitability information for each fund, as well as aggregate profitability information for groups of Fidelity funds and all Fidelity funds, using a series of detailed revenue and cost allocation methodologies which originate with the books and records of Fidelity on which Fidelity's audited financial statements are based. The Audit Committee of the Board reviews any significant changes from the prior year's methodologies.
A public accounting firm has been engaged annually by the Board as part of the Board's assessment of Fidelity's profitability analysis. The engagement includes the review and assessment of the methodologies used by Fidelity in determining the revenues and expenses attributable to Fidelity's fund business, and completion of agreed-upon procedures in respect of the mathematical accuracy of certain fund profitability information and its conformity to established allocation methodologies. After considering the reports issued under the engagement and information provided by Fidelity, the Board concluded that while other allocation methods may also be reasonable, Fidelity's profitability methodologies are reasonable in all material respects.
The Board also reviewed Fidelity's non-fund businesses and potential indirect benefits such businesses may have received as a result of their association with Fidelity's fund business (i.e., fall-out benefits) as well as cases where Fidelity's affiliates may benefit from the funds' business. The Board considered areas where potential indirect benefits to the Fidelity funds from their relationships with Fidelity may exist. The Board's consideration of these matters was informed by the findings of a joint ad hoc committee created by it and the boards of other Fidelity funds to evaluate potential fall-out benefits.
The Board considered the costs of the services provided by and the profits realized by Fidelity in connection with the operation of the fund and was satisfied that the profitability was not excessive.
Economies of Scale. The Board considered whether there have been economies of scale in respect of the management of the Fidelity funds, whether the Fidelity funds (including the fund) have appropriately benefited from any such economies of scale, and whether there is potential for realization of any further economies of scale. The Board considered the extent to which the fund will benefit from economies of scale as assets grow through increased services to the fund, through waivers or reimbursements, or through fee or expense ratio reductions. The Board recognized that, due to the fund's current contractual arrangements, its expense ratio will not decline if the fund's operating costs decrease as assets grow, or rise as assets decrease. The Board also noted that a committee created by it and the boards of other Fidelity funds periodically analyzes whether Fidelity attains economies of scale in respect of the management and servicing of the Fidelity funds, whether the Fidelity funds have appropriately benefited from such economies of scale, and whether there is potential for realization of any further economies of scale.
The Board concluded, taking into account the analysis of the committee, that economies of scale, if any, are being appropriately shared between fund shareholders and Fidelity.
Additional Information Requested by the Board. In order to develop fully the factual basis for consideration of the Fidelity funds' advisory contracts, the Board requested and received additional information on certain topics, including but not limited to: (i) fund flow and performance trends, in particular the underperformance of certain funds and strategies, and Fidelity's long-term strategies for certain funds; (ii) the operation of performance fees and the rationale for implementing performance fees on certain categories of funds but not others; (iii) Fidelity's pricing philosophy compared to competitors; (iv) fund profitability methodology and data; (v) evaluation of competitive fund data and peer group classifications and fee and expense comparisons; (vi) the management fee and expense structures for different funds and classes and information about the differences between various fee and expense structures; (vii) the variable management fee implemented for certain funds effective March 1, 2024; and (viii) information regarding other accounts managed by Fidelity and the funds' sub-advisory arrangements.
Conclusion. Based on its evaluation of all of the conclusions noted above, and after considering all factors it believed relevant, the Board, including the Independent Trustees, concluded that the advisory and sub-advisory fee arrangements are fair and reasonable in light of all of the surrounding circumstances and that the fund's Advisory Contracts should be renewed through May 31, 2025.
1.9893917.105
IGI-K6-ANN-1224
Fidelity® Diversified International K6 Fund
Annual Report
October 31, 2024
Contents
To view a fund's proxy voting guidelines and proxy voting record for the 12-month period ended June 30, visit http://www.fidelity.com/proxyvotingresults or visit the Securities and Exchange Commission's (SEC) web site at http://www.sec.gov.
You may also call 1-800-835-5092 to request a free copy of the proxy voting guidelines.
Standard & Poor's, S&P and S&P 500 are registered service marks of The McGraw-Hill Companies, Inc. and have been licensed for use by Fidelity Distributors Corporation.
Other third-party marks appearing herein are the property of their respective owners.
All other marks appearing herein are registered or unregistered trademarks or service marks of FMR LLC or an affiliated company. © 2024 FMR LLC. All rights reserved.
This report and the financial statements contained herein are submitted for the general information of the shareholders of the Fund. This report is not authorized for distribution to prospective investors in the Fund unless preceded or accompanied by an effective prospectus.
A fund files its complete schedule of portfolio holdings with the SEC for the first and third quarters of each fiscal year on Form N-PORT. Forms N-PORT are available on the SEC's web site at http://www.sec.gov. A fund's Forms N-PORT may be reviewed and copied at the SEC's Public Reference Room in Washington, DC. Information regarding the operation of the SEC's Public Reference Room may be obtained by calling 1-800-SEC-0330.
For a complete list of a fund's portfolio holdings, view the most recent holdings listing, semiannual report, or annual report on Fidelity's web site at http://www.fidelity.com, http://www.institutional.fidelity.com, or http://www.401k.com, as applicable.
NOT FDIC INSURED •MAY LOSE VALUE •NO BANK GUARANTEE
Neither the Fund nor Fidelity Distributors Corporation is a bank.
Item 7: Financial Statements and Financial Highlights for Open-End Management Investment Companies (Annual Report)
Fidelity® Diversified International K6 Fund
Schedule of Investments October 31, 2024
Showing Percentage of Net Assets
| Common Stocks - 96.1% |
| | | Shares | Value ($) |
| Australia - 1.0% | | | |
| Aristocrat Leisure Ltd. | | 828,795 | 33,350,423 |
| CAR Group Ltd. | | 310,451 | 7,646,729 |
| Steadfast Group Ltd. | | 1,847,043 | 6,652,049 |
TOTAL AUSTRALIA | | | 47,649,201 |
| Belgium - 0.8% | | | |
| UCB SA | | 198,927 | 38,256,487 |
| Canada - 6.5% | | | |
| Alimentation Couche-Tard, Inc. (multi-vtg.) | | 850,234 | 44,339,060 |
| Cameco Corp. | | 496,002 | 25,919,564 |
| Canadian Natural Resources Ltd. | | 1,413,481 | 48,068,607 |
| Constellation Software, Inc. | | 17,116 | 51,618,321 |
| Constellation Software, Inc. warrants 3/31/40 (a)(b) | | 23,796 | 2 |
| Franco-Nevada Corp. | | 242,615 | 32,204,621 |
| Imperial Oil Ltd. | | 508,851 | 37,971,501 |
| Ivanhoe Mines Ltd. (a) | | 2,513,814 | 33,238,278 |
| Lumine Group, Inc. (a) | | 66,274 | 1,543,149 |
| MEG Energy Corp. | | 649,355 | 11,869,203 |
| South Bow Corp. | | 240,200 | 5,998,315 |
| Thomson Reuters Corp. | | 138,798 | 22,719,469 |
TOTAL CANADA | | | 315,490,090 |
| China - 0.8% | | | |
| Chervon Holdings Ltd. | | 884,317 | 2,328,777 |
| NXP Semiconductors NV | | 151,004 | 35,410,438 |
TOTAL CHINA | | | 37,739,215 |
| Denmark - 3.4% | | | |
| DSV A/S | | 216,800 | 47,120,470 |
| Novo Nordisk A/S Series B | | 1,060,686 | 118,971,858 |
TOTAL DENMARK | | | 166,092,328 |
| France - 8.1% | | | |
| Air Liquide SA | | 331,011 | 59,350,737 |
| Alten SA | | 31,257 | 2,641,785 |
| AXA SA | | 1,017,615 | 38,210,558 |
| Capgemini SA | | 273,242 | 47,402,254 |
| Danone SA | | 145,800 | 10,415,740 |
| EssilorLuxottica SA | | 181,758 | 42,586,145 |
| Legrand SA | | 317,477 | 35,833,135 |
| LVMH Moet Hennessy Louis Vuitton SE | | 109,433 | 72,851,797 |
| Pernod Ricard SA | | 866 | 107,623 |
| Safran SA | | 208,717 | 47,246,371 |
| Thales SA | | 230,086 | 37,078,396 |
TOTAL FRANCE | | | 393,724,541 |
| Germany - 8.7% | | | |
| Allianz SE | | 234,053 | 73,681,140 |
| BioNTech SE ADR (a) | | 109,600 | 12,395,760 |
| Deutsche Borse AG | | 221,510 | 51,451,966 |
| Fresenius SE & Co. KGaA (a) | | 614,000 | 22,387,287 |
| Hannover Reuck SE | | 130,076 | 34,169,876 |
| HeidelbergCement AG | | 86,800 | 9,554,970 |
| Merck KGaA | | 239,476 | 39,594,483 |
| Muenchener Rueckversicherungs-Gesellschaft AG in Muenchen | | 87,131 | 44,557,074 |
| Rheinmetall AG | | 2,368 | 1,218,865 |
| SAP SE | | 495,194 | 115,620,420 |
| Siemens AG | | 78,468 | 15,265,939 |
TOTAL GERMANY | | | 419,897,780 |
| Hong Kong - 0.8% | | | |
| AIA Group Ltd. | | 4,975,015 | 39,264,404 |
| India - 2.3% | | | |
| Axis Bank Ltd. | | 1,256,309 | 17,257,657 |
| Fairfax India Holdings Corp. (a)(c) | | 588,561 | 8,622,419 |
| HDFC Bank Ltd. | | 2,494,351 | 51,269,297 |
| Hindustan Aeronautics Ltd. | | 104,300 | 5,248,436 |
| Reliance Industries Ltd. | | 846,111 | 13,378,328 |
| Reliance Industries Ltd. (a) | | 846,111 | 13,282,656 |
TOTAL INDIA | | | 109,058,793 |
| Indonesia - 0.6% | | | |
| PT Bank Central Asia Tbk | | 42,001,149 | 27,182,999 |
| Ireland - 0.7% | | | |
| Kingspan Group PLC (Ireland) | | 411,815 | 36,127,310 |
| Italy - 2.7% | | | |
| FinecoBank SpA | | 1,515,807 | 24,212,908 |
| Interpump Group SpA | | 102,986 | 4,575,020 |
| Prysmian SpA | | 232,469 | 16,390,914 |
| Ryanair Holdings PLC sponsored ADR | | 292,790 | 12,958,885 |
| UniCredit SpA | | 1,677,947 | 74,231,056 |
TOTAL ITALY | | | 132,368,783 |
| Japan - 17.2% | | | |
| BayCurrent Consulting, Inc. | | 418,461 | 13,599,592 |
| Capcom Co. Ltd. | | 660,789 | 13,075,999 |
| Fast Retailing Co. Ltd. | | 108,722 | 34,760,762 |
| Fuji Electric Co. Ltd. | | 510,401 | 25,993,655 |
| FUJIFILM Holdings Corp. | | 1,476,395 | 35,120,958 |
| Fujitsu Ltd. | | 1,248,065 | 23,995,099 |
| Hitachi Ltd. | | 5,514,770 | 138,557,820 |
| Hoya Corp. | | 462,920 | 61,935,940 |
| IHI Corp. | | 90,500 | 4,818,122 |
| Itochu Corp. | | 1,088,688 | 53,855,033 |
| Kansai Paint Co. Ltd. | | 426,896 | 6,952,705 |
| Keyence Corp. | | 88,270 | 39,846,286 |
| Mitsubishi Electric Corp. | | 1,557,789 | 27,405,452 |
| Mitsubishi Heavy Industries Ltd. | | 4,966,716 | 70,114,890 |
| Mitsui & Co. Ltd. | | 742,373 | 15,135,241 |
| ORIX Corp. | | 1,656,062 | 34,893,030 |
| Renesas Electronics Corp. | | 1,800,776 | 24,127,375 |
| Rohto Pharmaceutical Co. Ltd. | | 221,300 | 4,976,454 |
| Shin-Etsu Chemical Co. Ltd. | | 1,985,642 | 72,761,795 |
| Sumitomo Mitsui Financial Group, Inc. | | 1,447,647 | 30,711,168 |
| Suzuki Motor Corp. | | 748,775 | 7,430,346 |
| Tokio Marine Holdings, Inc. | | 1,717,711 | 61,865,363 |
| Tokyo Electron Ltd. | | 184,018 | 27,078,811 |
TOTAL JAPAN | | | 829,011,896 |
| Luxembourg - 0.4% | | | |
| CVC Capital Partners PLC (c) | | 1,036,864 | 21,756,204 |
| Netherlands - 5.3% | | | |
| ASML Holding NV (depository receipt) (d) | | 198,951 | 133,804,495 |
| BE Semiconductor Industries NV | | 155,713 | 16,588,765 |
| IMCD NV | | 170,907 | 27,151,292 |
| Wolters Kluwer NV | | 460,826 | 77,545,461 |
TOTAL NETHERLANDS | | | 255,090,013 |
| Portugal - 0.2% | | | |
| Galp Energia SGPS SA | | 448,165 | 7,638,991 |
| Spain - 2.4% | | | |
| Banco Santander SA (Spain) | | 8,721,619 | 42,615,339 |
| CaixaBank SA | | 6,484,444 | 39,514,668 |
| Industria de Diseno Textil SA (d) | | 563,207 | 32,040,466 |
TOTAL SPAIN | | | 114,170,473 |
| Sweden - 3.0% | | | |
| Atlas Copco AB (A Shares) | | 2,113,033 | 34,872,265 |
| Indutrade AB | | 1,787,625 | 48,421,433 |
| Investor AB (B Shares) | | 2,093,571 | 59,233,565 |
| Kry International AB (a)(b)(e) | | 30,819 | 645,995 |
TOTAL SWEDEN | | | 143,173,258 |
| Switzerland - 2.2% | | | |
| Compagnie Financiere Richemont SA Series A | | 237,750 | 34,616,518 |
| Galderma Group AG | | 131,189 | 12,276,513 |
| Partners Group Holding AG | | 11,887 | 16,421,969 |
| Sika AG | | 101,104 | 28,157,619 |
| UBS Group AG | | 516,570 | 15,876,056 |
TOTAL SWITZERLAND | | | 107,348,675 |
| Taiwan - 2.5% | | | |
| Taiwan Semiconductor Manufacturing Co. Ltd. sponsored ADR | | 630,837 | 120,199,682 |
| United Kingdom - 14.2% | | | |
| 3i Group PLC | | 916,403 | 37,579,596 |
| Ashtead Group PLC | | 257,086 | 19,187,193 |
| AstraZeneca PLC (United Kingdom) | | 629,179 | 89,528,147 |
| B&M European Value Retail SA | | 903,543 | 4,515,825 |
| BAE Systems PLC | | 3,869,688 | 62,368,959 |
| Big Yellow Group PLC | | 505,970 | 7,881,270 |
| Compass Group PLC | | 1,842,895 | 59,850,640 |
| Diageo PLC | | 765,318 | 23,634,381 |
| Flutter Entertainment PLC (a) | | 85,767 | 20,061,436 |
| Games Workshop Group PLC | | 73,700 | 11,365,883 |
| InterContinental Hotel Group PLC | | 372,735 | 41,111,757 |
| Lloyds Banking Group PLC | | 62,396,800 | 42,829,185 |
| London Stock Exchange Group PLC | | 564,845 | 76,556,772 |
| RELX PLC (Euronext N.V.) | | 1,863,688 | 86,400,399 |
| Rolls-Royce Holdings PLC (a) | | 7,444,379 | 51,369,184 |
| RS GROUP PLC | | 2,089,993 | 18,729,843 |
| Sage Group PLC | | 1,700,114 | 21,251,303 |
| Starling Bank Ltd. Series D (a)(b)(e) | | 2,406,800 | 9,837,931 |
| Unilever PLC | | 76,500 | 4,666,655 |
TOTAL UNITED KINGDOM | | | 688,726,359 |
| United States of America - 12.3% | | | |
| Alcon, Inc. (Switzerland) | | 656,871 | 60,533,605 |
| CRH PLC | | 589,866 | 56,238,965 |
| Experian PLC | | 529,922 | 25,808,540 |
| Ferguson Enterprises, Inc. | | 268,433 | 53,027,259 |
| Holcim AG | | 494,604 | 48,730,135 |
| Linde PLC | | 132,253 | 60,327,206 |
| Marsh & McLennan Companies, Inc. | | 202,726 | 44,242,922 |
| Marvell Technology, Inc. | | 468,195 | 37,507,101 |
| MasterCard, Inc. Class A | | 75,353 | 37,645,605 |
| Nestle SA (Reg. S) | | 47,071 | 4,447,863 |
| S&P Global, Inc. | | 65,889 | 31,650,440 |
| Schneider Electric SA | | 222,078 | 57,529,030 |
| Shell PLC (London) | | 2,262,907 | 75,552,401 |
TOTAL UNITED STATES OF AMERICA | | | 593,241,072 |
| TOTAL COMMON STOCKS (Cost $3,295,529,440) | | | 4,643,208,554 |
| | | | |
| Convertible Preferred Stocks - 0.4% |
| | | Shares | Value ($) |
| Estonia - 0.1% | | | |
| Bolt Technology OU Series E (a)(b)(e) | | 21,668 | 3,977,095 |
| United States of America - 0.3% | | | |
| Wasabi Holdings, Inc.: | | | |
| Series C (a)(b)(e) | | 743,562 | 10,023,216 |
| Series D (a)(b)(e) | | 304,085 | 5,117,751 |
TOTAL UNITED STATES OF AMERICA | | | 15,140,967 |
| TOTAL CONVERTIBLE PREFERRED STOCKS (Cost $18,027,759) | | | 19,118,062 |
| | | | |
| Money Market Funds - 4.3% |
| | | Shares | Value ($) |
| Fidelity Cash Central Fund 4.87% (f) | | 148,168,654 | 148,198,288 |
| Fidelity Securities Lending Cash Central Fund 4.87% (f)(g) | | 61,618,900 | 61,625,062 |
| TOTAL MONEY MARKET FUNDS (Cost $209,822,726) | | | 209,823,350 |
| | | | |
| TOTAL INVESTMENT IN SECURITIES - 100.8% (Cost $3,523,379,925) | 4,872,149,966 |
NET OTHER ASSETS (LIABILITIES) - (0.8)% | (40,206,904) |
| NET ASSETS - 100.0% | 4,831,943,062 |
| | |
Legend
| (c) | Security exempt from registration under Rule 144A of the Securities Act of 1933. These securities may be resold in transactions exempt from registration, normally to qualified institutional buyers. At the end of the period, the value of these securities amounted to $30,378,623 or 0.6% of net assets. |
| (d) | Security or a portion of the security is on loan at period end. |
| (e) | Restricted securities (including private placements) - Investment in securities not registered under the Securities Act of 1933 (excluding 144A issues). At the end of the period, the value of restricted securities (excluding 144A issues) amounted to $29,601,988 or 0.6% of net assets. |
| (f) | Affiliated fund that is generally available only to investment companies and other accounts managed by Fidelity Investments. The rate quoted is the annualized seven-day yield of the fund at period end. A complete unaudited listing of the fund's holdings as of its most recent quarter end is available upon request. In addition, each Fidelity Central Fund's financial statements, which are not covered by the Fund's Report of Independent Registered Public Accounting Firm, are available on the SEC's website or upon request. |
| (g) | Investment made with cash collateral received from securities on loan. |
| Additional information on each restricted holding is as follows: |
| Security | Acquisition Date | Acquisition Cost ($) |
| Bolt Technology OU Series E | 1/03/22 | 5,629,271 |
| | | |
| Kry International AB | 5/14/21 - 10/30/24 | 2,038,126 |
| | | |
| Starling Bank Ltd. Series D | 6/18/21 - 4/05/22 | 4,642,638 |
| | | |
| Wasabi Holdings, Inc. Series C | 3/31/21 | 8,078,504 |
| | | |
| Wasabi Holdings, Inc. Series D | 9/09/22 | 4,319,984 |
| | | |
Affiliated Central Funds
Fiscal year to date information regarding the Fund's investments in Fidelity Central Funds, including the ownership percentage, is presented below.
| Affiliate | Value, beginning of period ($) | Purchases ($) | Sales Proceeds ($) | Dividend Income ($) | Realized Gain (loss) ($) | Change in Unrealized appreciation (depreciation) ($) | Value, end of period ($) | % ownership, end of period |
| Fidelity Cash Central Fund 4.87% | 177,740,739 | 907,541,225 | 937,084,065 | 9,009,993 | 387 | 2 | 148,198,288 | 0.3% |
| Fidelity Securities Lending Cash Central Fund 4.87% | 18,664,424 | 532,935,333 | 489,974,695 | 119,093 | - | - | 61,625,062 | 0.3% |
| Total | 196,405,163 | 1,440,476,558 | 1,427,058,760 | 9,129,086 | 387 | 2 | 209,823,350 | |
| | | | | | | | | |
Amounts in the dividend income column in the above table include any capital gain distributions from underlying funds, which are presented in the corresponding line item in the Statement of Operations, if applicable.
Amounts in the dividend income column for Fidelity Securities Lending Cash Central Fund represents the income earned on investing cash collateral, less rebates paid to borrowers and any lending agent fees associated with the loan, plus any premium payments received for lending certain types of securities.
Amounts included in the purchases and sales proceeds columns may include in-kind transactions, if applicable.
Investment Valuation
The following is a summary of the inputs used, as of October 31, 2024, involving the Fund's assets and liabilities carried at fair value. The inputs or methodology used for valuing securities may not be an indication of the risk associated with investing in those securities. For more information on valuation inputs, and their aggregation into the levels used below, please refer to the Investment Valuation section in the accompanying Notes to Financial Statements.
| Valuation Inputs at Reporting Date: |
| Description | Total ($) | Level 1 ($) | Level 2 ($) | Level 3 ($) |
Investments in Securities: | | | | |
|
| Equities: | | | | |
Communication Services | 20,722,728 | - | 20,722,728 | - |
Consumer Discretionary | 354,284,630 | 67,983,610 | 286,301,020 | - |
Consumer Staples | 92,587,776 | 44,446,683 | 48,141,093 | - |
Energy | 239,679,566 | 137,466,181 | 102,213,385 | - |
Financials | 1,093,993,216 | 374,657,861 | 709,497,424 | 9,837,931 |
Health Care | 498,466,225 | 228,030,280 | 270,435,945 | - |
Industrials | 1,193,673,873 | 534,460,749 | 659,213,124 | - |
Information Technology | 753,520,301 | 420,565,039 | 313,191,203 | 19,764,059 |
Materials | 407,517,031 | 268,451,794 | 139,065,237 | - |
Real Estate | 7,881,270 | 7,881,270 | - | - |
|
| Money Market Funds | 209,823,350 | 209,823,350 | - | - |
| Total Investments in Securities: | 4,872,149,966 | 2,293,766,817 | 2,548,781,159 | 29,601,990 |
Financial Statements
| Statement of Assets and Liabilities |
As of October 31, 2024 |
| Assets | | | | |
| Investment in securities, at value (including securities loaned of $58,473,120) - See accompanying schedule: | | | | |
Unaffiliated issuers (cost $3,313,557,199) | $ | 4,662,326,616 | | |
Fidelity Central Funds (cost $209,822,726) | | 209,823,350 | | |
| | | | | |
| | | | | |
| Total Investment in Securities (cost $3,523,379,925) | | | $ | 4,872,149,966 |
| Foreign currency held at value (cost $2,012) | | | | 2,012 |
| Receivable for investments sold | | | | 22,243,400 |
| Receivable for fund shares sold | | | | 2,344,252 |
| Dividends receivable | | | | 8,371,168 |
| Reclaims receivable | | | | 8,944,538 |
| Distributions receivable from Fidelity Central Funds | | | | 871,681 |
| Other receivables | | | | 121,661 |
Total assets | | | | 4,915,048,678 |
| Liabilities | | | | |
| Payable for investments purchased | $ | 13,659,397 | | |
| Payable for fund shares redeemed | | 2,735,874 | | |
| Accrued management fee | | 2,466,006 | | |
| Deferred taxes | | 2,558,083 | | |
| Other payables and accrued expenses | | 61,195 | | |
| Collateral on securities loaned | | 61,625,061 | | |
| Total liabilities | | | | 83,105,616 |
| Net Assets | | | $ | 4,831,943,062 |
| Net Assets consist of: | | | | |
| Paid in capital | | | $ | 3,756,400,973 |
| Total accumulated earnings (loss) | | | | 1,075,542,089 |
| Net Assets | | | $ | 4,831,943,062 |
Net Asset Value, offering price and redemption price per share ($4,831,943,062 ÷ 325,155,755 shares) | | | $ | 14.86 |
| Statement of Operations |
| Year ended October 31, 2024 |
| Investment Income | | | | |
| Dividends | | | $ | 92,430,255 |
| Income from Fidelity Central Funds (including $119,093 from security lending) | | | | 9,129,086 |
| Income before foreign taxes withheld | | | $ | 101,559,341 |
| Less foreign taxes withheld | | | | (7,840,133) |
| Total income | | | | 93,719,208 |
| Expenses | | | | |
| Management fee | $ | 28,022,546 | | |
| Independent trustees' fees and expenses | | 20,782 | | |
| Miscellaneous | | 73,963 | | |
| Total expenses before reductions | | 28,117,291 | | |
| Expense reductions | | (3,878) | | |
| Total expenses after reductions | | | | 28,113,413 |
| Net Investment income (loss) | | | | 65,605,795 |
| Realized and Unrealized Gain (Loss) | | | | |
| Net realized gain (loss) on: | | | | |
| Investment Securities: | | | | |
| Unaffiliated issuers (net of foreign taxes of $1,566,653) | | 3,901,875 | | |
| Redemptions in-kind | | 57,811,254 | | |
| Fidelity Central Funds | | 387 | | |
| Foreign currency transactions | | (497,261) | | |
| Total net realized gain (loss) | | | | 61,216,255 |
| Change in net unrealized appreciation (depreciation) on: | | | | |
| Investment Securities: | | | | |
| Unaffiliated issuers (net of increase in deferred foreign taxes of $838,197) | | 845,464,016 | | |
| Fidelity Central Funds | | 2 | | |
| Assets and liabilities in foreign currencies | | 102,628 | | |
| Total change in net unrealized appreciation (depreciation) | | | | 845,566,646 |
| Net gain (loss) | | | | 906,782,901 |
| Net increase (decrease) in net assets resulting from operations | | | $ | 972,388,696 |
| Statement of Changes in Net Assets |
| |
| | Year ended October 31, 2024 | | Year ended October 31, 2023 |
| Increase (Decrease) in Net Assets | | | | |
| Operations | | | | |
| Net investment income (loss) | $ | 65,605,795 | $ | 65,516,017 |
| Net realized gain (loss) | | 61,216,255 | | (29,780,194) |
| Change in net unrealized appreciation (depreciation) | | 845,566,646 | | 395,410,511 |
| Net increase (decrease) in net assets resulting from operations | | 972,388,696 | | 431,146,334 |
| Distributions to shareholders | | (69,972,907) | | (31,800,731) |
| | | | | |
| Share transactions | | | | |
| Proceeds from sales of shares | | 1,024,639,725 | | 1,065,259,894 |
| Reinvestment of distributions | | 69,972,898 | | 31,800,731 |
| Cost of shares redeemed | | (1,156,692,903) | | (988,215,923) |
| | | | | |
Net increase (decrease) in net assets resulting from share transactions | | (62,080,280) | | 108,844,702 |
| Total increase (decrease) in net assets | | 840,335,509 | | 508,190,305 |
| | | | | |
| Net Assets | | | | |
| Beginning of period | | 3,991,607,553 | | 3,483,417,248 |
| End of period | $ | 4,831,943,062 | $ | 3,991,607,553 |
| | | | | |
| Other Information | | | | |
| Shares | | | | |
| Sold | | 71,524,447 | | 84,964,159 |
| Issued in reinvestment of distributions | | 5,378,392 | | 2,652,271 |
| Redeemed | | (81,461,022) | | (77,852,831) |
| Net increase (decrease) | | (4,558,183) | | 9,763,599 |
| | | | | |
Financial Highlights
Fidelity® Diversified International K6 Fund |
| |
| Years ended October 31, | | 2024 | | 2023 | | 2022 | | 2021 | | 2020 |
Selected Per-Share Data | | | | | | | | | | |
| Net asset value, beginning of period | $ | 12.11 | $ | 10.89 | $ | 15.45 | $ | 11.96 | $ | 11.08 |
| Income from Investment Operations | | | | | | | | | | |
Net investment income (loss) A,B | | .20 | | .20 | | .15 | | .10 | | .08 |
| Net realized and unrealized gain (loss) | | 2.76 | | 1.12 | | (4.56) | | 3.47 | | .98 |
| Total from investment operations | | 2.96 | | 1.32 | | (4.41) | | 3.57 | | 1.06 |
| Distributions from net investment income | | (.21) | | (.10) | | (.15) | | (.08) | | (.15) |
| Distributions from net realized gain | | - | | - | | - | | - | | (.03) |
| Total distributions | | (.21) | | (.10) | | (.15) | | (.08) | | (.18) |
| Net asset value, end of period | $ | 14.86 | $ | 12.11 | $ | 10.89 | $ | 15.45 | $ | 11.96 |
Total Return C | | | | 12.12% | | (28.81)% | | 30.00% | | 9.70% |
Ratios to Average Net Assets B,D,E | | | | | | | | | | |
| Expenses before reductions | | .60% | | .60% | | .60% | | .60% | | .60% |
| Expenses net of fee waivers, if any | | | | .60% | | .60% | | .60% | | .60% |
| Expenses net of all reductions | | .60% | | .60% | | .60% | | .60% | | .59% |
| Net investment income (loss) | | 1.40% | | 1.57% | | 1.21% | | .73% | | .73% |
| Supplemental Data | | | | | | | | | | |
| Net assets, end of period (000 omitted) | $ | 4,831,943 | $ | 3,991,608 | $ | 3,483,417 | $ | 3,961,936 | $ | 3,102,294 |
Portfolio turnover rate F | | | | 25% G | | 31% G | | 30% G | | 34% |
ACalculated based on average shares outstanding during the period.
BNet investment income (loss) is affected by the timing of the declaration of dividends by any underlying mutual funds or exchange-traded funds (ETFs). Net investment income (loss) of any mutual funds or ETFs is not included in the Fund's net investment income (loss) ratio.
CTotal returns would have been lower if certain expenses had not been reduced during the applicable periods shown.
DFees and expenses of any underlying mutual funds or exchange-traded funds (ETFs) are not included in the Fund's expense ratio. The Fund indirectly bears its proportionate share of these expenses. For additional expense information related to investments in Fidelity Central Funds, please refer to the "Investments in Fidelity Central Funds" note found in the Notes to Financial Statements section of the most recent Annual or Semi-Annual report.
EExpense ratios reflect operating expenses of the class. Expenses before reductions do not reflect amounts reimbursed, waived, or reduced through arrangements with the investment adviser, brokerage services, or other offset arrangements, if applicable, and do not represent the amount paid by the class during periods when reimbursements, waivers or reductions occur.
FAmount does not include the portfolio activity of any underlying mutual funds or exchange-traded funds (ETFs).
GPortfolio turnover rate excludes securities received or delivered in-kind.
Notes to Financial Statements
For the period ended October 31, 2024
1. Organization.
Fidelity Diversified International K6 Fund (the Fund) is a fund of Fidelity Investment Trust (the Trust) and is authorized to issue an unlimited number of shares. Share transactions on the Statement of Changes in Net Assets may contain exchanges between affiliated funds. The Trust is registered under the Investment Company Act of 1940, as amended (the 1940 Act), as an open-end management investment company organized as a Massachusetts business trust. Shares generally are available only to employer-sponsored retirement plans that are recordkept by Fidelity, or to certain employer-sponsored retirement plans that are not recordkept by Fidelity. The Fund's investments in emerging markets can be subject to social, economic, regulatory, and political uncertainties and can be extremely volatile.
2. Investments in Fidelity Central Funds.
Funds may invest in Fidelity Central Funds, which are open-end investment companies generally available only to other investment companies and accounts managed by the investment adviser and its affiliates. The Schedule of Investments lists any Fidelity Central Funds held as an investment as of period end, but does not include the underlying holdings of each Fidelity Central Fund. An investing fund indirectly bears its proportionate share of the expenses of the underlying Fidelity Central Funds.
Based on its investment objective, each Fidelity Central Fund may invest or participate in various investment vehicles or strategies that are similar to those of the investing fund. These strategies are consistent with the investment objectives of the investing fund and may involve certain economic risks which may cause a decline in value of each of the Fidelity Central Funds and thus a decline in the value of the investing fund.
| Fidelity Central Fund | Investment Manager | Investment Objective | Investment Practices | Expense RatioA |
| Fidelity Money Market Central Funds | Fidelity Management & Research Company LLC (FMR) | Each fund seeks to obtain a high level of current income consistent with the preservation of capital and liquidity. | Short-term Investments | Less than .005% |
A Expenses expressed as a percentage of average net assets and are as of each underlying Central Fund's most recent annual or semi-annual shareholder report.
A complete unaudited list of holdings for each Fidelity Central Fund is available upon request or at the Securities and Exchange Commission website at www.sec.gov. In addition, the financial statements of the Fidelity Central Funds which contain the significant accounting policies (including investment valuation policies) of those funds, and are not covered by the Report of Independent Registered Public Accounting Firm, are available on the Securities and Exchange Commission website or upon request.
3. Significant Accounting Policies.
The Fund is an investment company and applies the accounting and reporting guidance of the Financial Accounting Standards Board (FASB) Accounting Standards Codification Topic 946 Financial Services - Investment Companies. The financial statements have been prepared in conformity with accounting principles generally accepted in the United States of America (GAAP), which require management to make certain estimates and assumptions at the date of the financial statements. Actual results could differ from those estimates. Subsequent events, if any, through the date that the financial statements were issued have been evaluated in the preparation of the financial statements. The Fund's Schedule of Investments lists any underlying mutual funds or exchange-traded funds (ETFs) but does not include the underlying holdings of these funds. The following summarizes the significant accounting policies of the Fund:
Investment Valuation. Investments are valued as of 4:00 p.m. Eastern time on the last calendar day of the period. The Board of Trustees (the Board) has designated the Fund's investment adviser as the valuation designee responsible for the fair valuation function and performing fair value determinations as needed. The investment adviser has established a Fair Value Committee (the Committee) to carry out the day-to-day fair valuation responsibilities and has adopted policies and procedures to govern the fair valuation process and the activities of the Committee. In accordance with these fair valuation policies and procedures, which have been approved by the Board, the Fund attempts to obtain prices from one or more third party pricing services or brokers to value its investments. When current market prices, quotations or currency exchange rates are not readily available or reliable, investments will be fair valued in good faith by the Committee, in accordance with the policies and procedures. Factors used in determining fair value vary by investment type and may include market or investment specific events, transaction data, estimated cash flows, and market observations of comparable investments. The frequency that the fair valuation procedures are used cannot be predicted and they may be utilized to a significant extent. The Committee manages the Fund's fair valuation practices and maintains the fair valuation policies and procedures. The Fund's investment adviser reports to the Board information regarding the fair valuation process and related material matters.
The Fund categorizes the inputs to valuation techniques used to value its investments into a disclosure hierarchy consisting of three levels as shown below:
Level 1 - unadjusted quoted prices in active markets for identical investments
Level 2 - other significant observable inputs (including quoted prices for similar investments, interest rates, prepayment speeds, etc.)
Level 3 - unobservable inputs (including the Fund's own assumptions based on the best information available)
Valuation techniques used to value the Fund's investments by major category are as follows:
Equity securities, including restricted securities, for which market quotations are readily available, are valued at the last reported sale price or official closing price as reported by a third party pricing service on the primary market or exchange on which they are traded and are categorized as Level 1 in the hierarchy. In the event there were no sales during the day or closing prices are not available, securities are valued at the last quoted bid price or may be valued using the last available price and are generally categorized as Level 2 in the hierarchy. For foreign equity securities, when market or security specific events arise, comparisons to the valuation of American Depositary Receipts (ADRs), futures contracts, Exchange-Traded Funds (ETFs) and certain indexes as well as quoted prices for similar securities may be used and would be categorized as Level 2 in the hierarchy. For equity securities, including restricted securities, where observable inputs are limited, assumptions about market activity and risk are used and these securities may be categorized as Level 3 in the hierarchy.
Investments in open-end mutual funds, including the Fidelity Central Funds, are valued at their closing net asset value (NAV) each business day and are categorized as Level 1 in the hierarchy.
Changes in valuation techniques may result in transfers in or out of an assigned level within the disclosure hierarchy. The aggregate value of investments by input level as of October 31, 2024 is included at the end of the Fund's Schedule of Investments.
Foreign Currency. Certain Funds may use foreign currency contracts to facilitate transactions in foreign-denominated securities. Gains and losses from these transactions may arise from changes in the value of the foreign currency or if the counterparties do not perform under the contracts' terms.
Foreign-denominated assets, including investment securities, and liabilities are translated into U.S. dollars at the exchange rates at period end. Purchases and sales of investment securities, income and dividends received, and expenses denominated in foreign currencies are translated into U.S. dollars at the exchange rate in effect on the transaction date.
The effects of exchange rate fluctuations on investments are included with the net realized and unrealized gain (loss) on investment securities. Other foreign currency transactions resulting in realized and unrealized gain (loss) are disclosed separately.
Investment Transactions and Income. For financial reporting purposes, the Fund's investment holdings and NAV include trades executed through the end of the last business day of the period. The NAV per share for processing shareholder transactions is calculated as of the close of business of the New York Stock Exchange (NYSE), normally 4:00 p.m. Eastern time and includes trades executed through the end of the prior business day. Gains and losses on securities sold are determined on the basis of identified cost. Commissions paid to certain brokers with whom the investment adviser, or its affiliates, places trades on behalf of a fund include an amount in addition to trade execution, which may be rebated back to a fund. Any such rebates are included in net realized gain (loss) on investments in the Statement of Operations. Dividend income is recorded on the ex-dividend date, except for certain dividends from foreign securities where the ex-dividend date may have passed, which are recorded as soon as the Fund is informed of the ex-dividend date. Non-cash dividends included in dividend income, if any, are recorded at the fair market value of the securities received. Income and capital gain distributions from Fidelity Central Funds, if any, are recorded on the ex-dividend date. Investment income is recorded net of foreign taxes withheld where recovery of such taxes is uncertain. Funds may file withholding tax reclaims in certain jurisdictions to recover a portion of amounts previously withheld. Any withholding tax reclaims income is included in the Statement of Operations in foreign taxes withheld. Any receivables for withholding tax reclaims are included in the Statement of Assets and Liabilities in reclaims receivable. The Fund has filed tax reclaims for previously withheld taxes on dividends earned in certain European Union (EU) countries. These additional filings are subject to various administrative proceedings by the local jurisdictions' tax authorities within the EU, as well as a number of related judicial proceedings. Income recognized for EU reclaims is included with other reclaims in the Statement of Operations in foreign taxes withheld. These reclaims are recorded when the amount is known and there are no significant uncertainties on collectability.
Expenses. Expenses directly attributable to a fund are charged to that fund. Expenses attributable to more than one fund are allocated among the respective funds on the basis of relative net assets or other appropriate methods. Expenses included in the accompanying financial statements reflect the expenses of that fund and do not include any expenses associated with any underlying mutual funds or exchange-traded funds. Although not included in a fund's expenses, a fund indirectly bears its proportionate share of these expenses through the net asset value of each underlying mutual fund or exchange-traded fund. Expense estimates are accrued in the period to which they relate and adjustments are made when actual amounts are known.
Income Tax Information and Distributions to Shareholders. Each year, the Fund intends to qualify as a regulated investment company under Subchapter M of the Internal Revenue Code, including distributing substantially all of its taxable income and realized gains. As a result, no provision for U.S. Federal income taxes is required. As of October 31, 2024, the Fund did not have any unrecognized tax benefits in the financial statements; nor is the Fund aware of any tax positions for which it is reasonably possible that the total amounts of unrecognized tax benefits will significantly change in the next twelve months. The Fund files a U.S. federal tax return, in addition to state and local tax returns as required. The Fund's federal income tax returns are subject to examination by the Internal Revenue Service (IRS) for a period of three fiscal years after they are filed. State and local tax returns may be subject to examination for an additional fiscal year depending on the jurisdiction. Foreign taxes are provided for based on the Fund's understanding of the tax rules and rates that exist in the foreign markets in which it invests. The Fund is subject to a tax imposed on capital gains by certain countries in which it invests. An estimated deferred tax liability for net unrealized appreciation on the applicable securities is included in Deferred taxes on the Statement of Assets and Liabilities.
Distributions are declared and recorded on the ex-dividend date. Income and capital gain distributions are determined in accordance with income tax regulations, which may differ from GAAP.
Capital accounts within the financial statements are adjusted for permanent book-tax differences. These adjustments have no impact on net assets or the results of operations. Capital accounts are not adjusted for temporary book-tax differences which will reverse in a subsequent period.
Book-tax differences are primarily due to foreign currency transactions, certain foreign taxes, passive foreign investment companies (PFIC), redemptions in-kind, capital loss carryforwards, and losses deferred due to wash sales.
As of period end, the cost and unrealized appreciation (depreciation) in securities, and derivatives if applicable, for federal income tax purposes were as follows:
| Gross unrealized appreciation | $1,375,778,844 |
| Gross unrealized depreciation | (69,035,905) |
| Net unrealized appreciation (depreciation) | $1,306,742,939 |
| Tax Cost | $3,565,407,027 |
The tax-based components of distributable earnings as of period end were as follows:
| Undistributed ordinary income | $94,043,294 |
| Capital loss carryforward | $(322,445,081) |
| Net unrealized appreciation (depreciation) on securities and other investments | $1,306,501,960 |
Capital loss carryforwards are only available to offset future capital gains of the Fund to the extent provided by regulations and may be limited. The capital loss carryforward information presented below, including any applicable limitation, is estimated as of fiscal period end and is subject to adjustment.
Short-term | $(322,445,081) |
Long-term | (-) |
| Total capital loss carryforward | $(322,445,081) |
The tax character of distributions paid was as follows:
| | October 31, 2024 | October 31, 2023 |
| Ordinary Income | $69,972,907 | $31,800,731 |
Restricted Securities (including Private Placements). Funds may invest in securities that are subject to legal or contractual restrictions on resale. These securities generally may be resold in transactions exempt from registration or to the public if the securities are registered. Disposal of these securities may involve time-consuming negotiations and expense, and prompt sale at an acceptable price may be difficult. Information regarding restricted securities held at period end is included at the end of the Schedule of Investments, if applicable.
New Accounting Pronouncement. In November 2023, the FASB issued Accounting Standards Update (ASU) 2023-07 Segment Reporting (Topic 280): Improvements to Reportable Segment Disclosures. Effective for fiscal years beginning after December 15, 2023 and interim periods within fiscal years beginning after December 15, 2024, the amendments enhance required disclosures of segment information for public entities on an annual and interim basis. The ASU allows for early adoption with updates applied retrospectively. Management is currently evaluating the impact of the ASU but does not expect this guidance to materially impact the financial statements.
4. Purchases and Sales of Investments.
Purchases and sales of securities, other than short-term securities and in-kind transactions, as applicable, are noted in the table below.
| | Purchases ($) | Sales ($) |
| Fidelity Diversified International K6 Fund | 1,699,537,562 | 1,664,867,453 |
Unaffiliated Redemptions In-Kind. Shares that were redeemed in-kind for investments, including accrued interest and cash, if any, are shown in the table below. The net realized gain or loss on investments delivered through in-kind redemptions is included in the "Net realized gain (loss) on: Redemptions in-kind" line in the accompanying Statement of Operations. The amount of the in-kind redemptions is included in share transactions in the accompanying Statement of Changes in Net Assets. There was no gain or loss for federal income tax purposes.
| | Shares | Total net realized gain or loss ($) | Total Proceeds ($) |
| Fidelity Diversified International K6 Fund | 11,523,901 | 57,811,254 | 155,413,531 |
Unaffiliated Exchanges In-Kind. Shares that were exchanged for investments, including accrued interest and cash, if any, are shown in the table below. The amount of in-kind exchanges is included in share transactions in the accompanying Statement of Changes in Net Assets.
| | Shares | Total Proceeds ($) |
| Fidelity Diversified International K6 Fund | 6,128,438 | 83,046,527 |
Prior Fiscal Year Unaffiliated Redemptions In-Kind. Shares that were redeemed in-kind for investments, including accrued interest and cash, if any, are shown in the table below; along with realized gain or loss on investments delivered through in-kind redemptions. The amount of the in-kind redemptions is included in share transactions in the accompanying Statement of Changes in Net Assets. There was no gain or loss for federal income tax purposes.
| | Shares | Total net realized gain or loss ($) | Total Proceeds ($) |
| Fidelity Diversified International K6 Fund | 4,361,678 | 20,002,624 | 56,570,957 |
Prior Year Unaffiliated Exchanges In-Kind. Shares that were exchanged for investments, including accrued interest and cash, if any, are shown in the table below. The amount of in-kind exchanges is included in share transactions in the accompanying Statement of Changes in Net Assets.
| | Shares | Total Proceeds ($) |
| Fidelity Diversified International K6 Fund | 26,855,137 | 332,235,591 |
5. Fees and Other Transactions with Affiliates.
Management Fee. Fidelity Management & Research Company LLC (the investment adviser) and its affiliates provide the Fund with investment management related services for which the Fund pays a monthly management fee that is based on an annual rate of .60% of average net assets. Under the management contract, the investment adviser or an affiliate pays all other expenses of the Fund, excluding fees and expenses of the independent Trustees, and certain miscellaneous expenses such as proxy and shareholder meeting expenses.
Brokerage Commissions. A portion of portfolio transactions were placed with brokerage firms which are affiliates of the investment adviser. Brokerage commissions are included in net realized gain (loss) and change in net unrealized appreciation (depreciation) in the Statement of Operations. The commissions paid to these affiliated firms were as follows:
| | Amount ($) |
| Fidelity Diversified International K6 Fund | 965 |
Interfund Trades. Funds may purchase from or sell securities to other Fidelity Funds under procedures adopted by the Board. The procedures have been designed to ensure these interfund trades are executed in accordance with Rule 17a-7 of the 1940 Act. Any interfund trades are included within the respective purchases and sales amounts shown in the Purchases and Sales of Investments note. Interfund trades during the period are noted in the table below.
| | Purchases ($) | Sales ($) | Realized Gain (Loss) ($) |
| Fidelity Diversified International K6 Fund | 30,858,109 | 86,177,286 | 1,770,098 |
Sub-Advisory Arrangements. Effective March 1, 2024, the Fund's sub-advisory agreements with FMR Investment Management (UK) Limited, Fidelity Management & Research (Hong Kong) Limited, and Fidelity Management & Research (Japan) Limited were amended to provide that the investment adviser pays each sub-adviser monthly fees equal to 110% of the sub-adviser's costs for providing sub-advisory services.
6. Committed Line of Credit.
Certain Funds participate with other funds managed by the investment adviser or an affiliate in a $4.25 billion credit facility (the "line of credit") to be utilized for temporary or emergency purposes to fund shareholder redemptions or for other short-term liquidity purposes. The commitment fees on the pro-rata portion of the line of credit are borne by the investment adviser. During the period, there were no borrowings on this line of credit.
7. Security Lending.
Funds lend portfolio securities from time to time in order to earn additional income. Lending agents are used, including National Financial Services (NFS), an affiliate of the investment adviser. Pursuant to a securities lending agreement, NFS will receive a fee, which is capped at 9.9% of a fund's daily lending revenue, for its services as lending agent. A fund may lend securities to certain qualified borrowers, including NFS. On the settlement date of the loan, a fund receives collateral (in the form of U.S. Treasury obligations, letters of credit and/or cash) against the loaned securities and maintains collateral in an amount not less than 100% of the market value of the loaned securities during the period of the loan. The market value of the loaned securities is determined at the close of business of a fund and any additional required collateral is delivered to a fund on the next business day. A fund or borrower may terminate the loan at any time, and if the borrower defaults on its obligation to return the securities loaned because of insolvency or other reasons, a fund may apply collateral received from the borrower against the obligation. A fund may experience delays and costs in recovering the securities loaned. Any cash collateral received is invested in the Fidelity Securities Lending Cash Central Fund. Any loaned securities are identified as such in the Schedule of Investments, and the value of loaned securities and cash collateral at period end, as applicable, are presented in the Statement of Assets and Liabilities. Security lending income represents the income earned on investing cash collateral, less rebates paid to borrowers and any lending agent fees associated with the loan, plus any premium payments received for lending certain types of securities. Security lending income is presented in the Statement of Operations as a component of income from Fidelity Central Funds. Affiliated security lending activity, if any, was as follows:
| | Total Security Lending Fees Paid to NFS ($) | Security Lending Income From Securities Loaned to NFS ($) | Value of Securities Loaned to NFS at Period End ($) |
| Fidelity Diversified International K6 Fund | 13,026 | - | - |
8. Expense Reductions.
Through arrangements with the Fund's custodian, credits realized as a result of certain uninvested cash balances were used to reduce the Fund's expenses by $3,878.
9. Other.
A fund's organizational documents provide former and current trustees and officers with a limited indemnification against liabilities arising in connection with the performance of their duties to the fund. In the normal course of business, a fund may also enter into contracts that provide general indemnifications. A fund's maximum exposure under these arrangements is unknown as this would be dependent on future claims that may be made against a fund. The risk of material loss from such claims is considered remote.
10. Risk and Uncertainties.
Many factors affect a fund's performance. Developments that disrupt global economies and financial markets, such as pandemics, epidemics, outbreaks of infectious diseases, war, terrorism, and environmental disasters, may significantly affect a fund's investment performance. The effects of these developments to a fund will be impacted by the types of securities in which a fund invests, the financial condition, industry, economic sector, and geographic location of an issuer, and a fund's level of investment in the securities of that issuer. Significant concentrations in security types, issuers, industries, sectors, and geographic locations may magnify the factors that affect a fund's performance.
Report of Independent Registered Public Accounting Firm
To the Board of Trustees of Fidelity Investment Trust and the Shareholders of Fidelity Diversified International K6 Fund:
Opinion on the Financial Statements and Financial Highlights
We have audited the accompanying statement of assets and liabilities of Fidelity Diversified International K6 Fund (the "Fund"), a fund of Fidelity Investment Trust, including the schedule of investments, as of October 31, 2024, the related statement of operations for the year then ended, the statement of changes in net assets for each of the two years in the period then ended, the financial highlights for each of the five years in the period then ended, and the related notes. In our opinion, the financial statements and financial highlights present fairly, in all material respects, the financial position of the Fund as of October 31, 2024, and the results of its operations for the year then ended, the changes in its net assets for each of the two years in the period then ended, and the financial highlights for each of the five years in the period then ended in conformity with accounting principles generally accepted in the United States of America.
Basis for Opinion
These financial statements and financial highlights are the responsibility of the Fund's management. Our responsibility is to express an opinion on the Fund's financial statements and financial highlights based on our audits. We are a public accounting firm registered with the Public Company Accounting Oversight Board (United States) (PCAOB) and are required to be independent with respect to the Fund in accordance with the U.S. federal securities laws and the applicable rules and regulations of the Securities and Exchange Commission and the PCAOB.
We conducted our audits in accordance with the standards of the PCAOB. Those standards require that we plan and perform the audit to obtain reasonable assurance about whether the financial statements and financial highlights are free of material misstatement, whether due to error or fraud. The Fund is not required to have, nor were we engaged to perform, an audit of its internal control over financial reporting. As part of our audits, we are required to obtain an understanding of internal control over financial reporting but not for the purpose of expressing an opinion on the effectiveness of the Fund's internal control over financial reporting. Accordingly, we express no such opinion.
Our audits included performing procedures to assess the risks of material misstatement of the financial statements and financial highlights, whether due to error or fraud, and performing procedures that respond to those risks. Such procedures included examining, on a test basis, evidence regarding the amounts and disclosures in the financial statements and financial highlights. Our audits also included evaluating the accounting principles used and significant estimates made by management, as well as evaluating the overall presentation of the financial statements and financial highlights. Our procedures included confirmation of securities owned as of October 31, 2024, by correspondence with the custodian and brokers; when replies were not received from brokers, we performed other auditing procedures. We believe that our audits provide a reasonable basis for our opinion.
/s/ Deloitte & Touche LLP
Boston, Massachusetts
December 13, 2024
We have served as the auditor of one or more of the Fidelity investment companies since 1999.
Distributions
(Unaudited)
The dividend and capital gains distributions for the fund(s) are available on Fidelity.com or Institutional.Fidelity.com.
The fund designates $5,475,232 of distributions paid during the fiscal year ended 2024 as qualifying to be taxed as section 163(j) interest dividends.
The fund designates 2% of the dividend distributed during the fiscal year as qualifying for the dividends-received deduction for corporate shareholders.
The fund designates 88.95% of the dividend distributed during the fiscal year as amounts which may be taken into account as a dividend for the purposes of the maximum rate under section 1(h)(11) of the Internal Revenue Code.
The amounts per share which represent income derived from sources within, and taxes paid to, foreign countries or possessions of the United States are $0.2085 and $0.0202 for the dividend paid December 11,2023.
The fund will notify shareholders in January 2025 of amounts for use in preparing 2024 income tax returns.
Item 8: Changes in and Disagreements with Accountants for Open-End Management Investment Companies
(Unaudited)
Note: This is not applicable for any fund included in this document.
Item 9: Proxy Disclosures for Open-End Management Investment Companies
(Unaudited)
| A special meeting of shareholders was held on July 16, 2024. The results of votes taken among shareholders on the proposal before them are reported below. Each vote reported represents one dollar of net asset value held on the record date for the meeting. |
| Proposal 1 |
| To elect a Board of Trustees. |
| | # of Votes | % of Votes |
| Bettina Doulton |
| Affirmative | 128,529,177,643.56 | 98.18 |
| Withheld | 2,378,037,364.30 | 1.82 |
| TOTAL | 130,907,215,007.85 | 100.00 |
| Robert A. Lawrence |
| Affirmative | 128,253,389,899.05 | 97.97 |
| Withheld | 2,653,825,108.81 | 2.03 |
| TOTAL | 130,907,215,007.85 | 100.00 |
| Vijay C. Advani |
| Affirmative | 128,531,418,228.19 | 98.19 |
| Withheld | 2,375,796,779.66 | 1.81 |
| TOTAL | 130,907,215,007.85 | 100.00 |
| Thomas P. Bostick |
| Affirmative | 128,495,261,591.41 | 98.16 |
| Withheld | 2,411,953,416.44 | 1.84 |
| TOTAL | 130,907,215,007.85 | 100.00 |
| Donald F. Donahue |
| Affirmative | 128,407,878,996.00 | 98.09 |
| Withheld | 2,499,336,011.85 | 1.91 |
| TOTAL | 130,907,215,007.85 | 100.00 |
| Vicki L. Fuller |
| Affirmative | 128,625,540,095.19 | 98.26 |
| Withheld | 2,281,674,912.66 | 1.74 |
| TOTAL | 130,907,215,007.85 | 100.00 |
| Patricia L. Kampling |
| Affirmative | 128,668,729,281.34 | 98.29 |
| Withheld | 2,238,485,726.51 | 1.71 |
| TOTAL | 130,907,215,007.85 | 100.00 |
| Thomas A. Kennedy |
| Affirmative | 128,499,824,239.79 | 98.16 |
| Withheld | 2,407,390,768.06 | 1.84 |
| TOTAL | 130,907,215,007.85 | 100.00 |
| Oscar Munoz |
| Affirmative | 128,386,109,391.05 | 98.07 |
| Withheld | 2,521,105,616.80 | 1.93 |
| TOTAL | 130,907,215,007.85 | 100.00 |
| Karen B. Peetz |
| Affirmative | 128,603,731,113.82 | 98.24 |
| Withheld | 2,303,483,894.03 | 1.76 |
| TOTAL | 130,907,215,007.85 | 100.00 |
| David M. Thomas |
| Affirmative | 128,384,899,342.98 | 98.07 |
| Withheld | 2,522,315,664.88 | 1.93 |
| TOTAL | 130,907,215,007.85 | 100.00 |
| Susan Tomasky |
| Affirmative | 128,556,148,461.60 | 98.20 |
| Withheld | 2,351,066,546.25 | 1.80 |
| TOTAL | 130,907,215,007.85 | 100.00 |
| Michael E. Wiley |
| Affirmative | 128,264,934,978.34 | 97.98 |
| Withheld | 2,642,280,029.51 | 2.02 |
| TOTAL | 130,907,215,007.85 | 100.00 |
| | | |
| Proposal 1 reflects trust-wide proposal and voting results. |
Item 10: Remuneration Paid to Directors, Officers, and others of Open-End Management Investment Companies
(Unaudited)
Note: This information is disclosed as part of the financial statements for each Fund as part of Item 7: Financial Statements and Financial Highlights for Open-End Management Investment companies.
Item 11: Statement Regarding Basis for Approval of Investment Advisory Contract
(Unaudited)
Board Approval of Investment Advisory Contracts and Management Fees
Fidelity Diversified International K6 Fund
Each year, the Board of Trustees, including the Independent Trustees (together, the Board), considers the renewal of the fund's management contract with Fidelity Management & Research Company LLC (FMR) and the sub-advisory agreements (together, the Advisory Contracts) for the fund. FMR and the sub-advisers are referred to herein as the Investment Advisers. The Board, assisted by the advice of fund counsel and Independent Trustees' counsel, requests and considers a broad range of information relevant to the renewal of the Advisory Contracts throughout the year.
The Board meets regularly and, at each of its meetings, covers an extensive agenda of topics and materials and considers factors that are relevant to its annual consideration of the renewal of the fund's Advisory Contracts, including the services and support provided to the fund and its shareholders. The Board, acting directly and through its Committees (each of which is composed of and chaired by Independent Trustees), requests and receives information concerning the annual consideration of the renewal of the fund's Advisory Contracts. The Board also meets as needed to review matters specifically related to the Board's annual consideration of the renewal of the Advisory Contracts. Members of the Board may also meet with trustees of other Fidelity funds through joint ad hoc committees to discuss certain matters relevant to all of the Fidelity funds.
At its May 2024 meeting, the Board unanimously determined to renew the fund's Advisory Contracts. In reaching its determination, the Board considered all factors it believed relevant, including (i) the nature, extent, and quality of the services provided to the fund and its shareholders (including the investment performance of the fund); (ii) the competitiveness relative to peer funds of the fund's management fee and total expense ratio; (iii) the total costs of the services provided by and the profits realized by FMR and its affiliates (Fidelity) from its relationships with the fund; and (iv) the extent to which, if any, economies of scale exist and are realized as the fund grows, and whether any economies of scale are appropriately shared with fund shareholders. The Board also considered the broad range of investment choices available to shareholders from FMR's competitors and that the fund's shareholders have chosen to invest in the fund, which is part of the Fidelity family of funds. The Board's decision to renew the Advisory Contracts was not based on any single factor.
The Board reached a determination, with the assistance of fund counsel and Independent Trustees' counsel and through the exercise of its business judgment, that the renewal of the Advisory Contracts was in the best interests of the fund and its shareholders and that the compensation payable under the Advisory Contracts was fair and reasonable in light of all of the surrounding circumstances.
Nature, Extent, and Quality of Services Provided. The Board considered staffing as it relates to the fund, including the backgrounds and experience of investment personnel of the Investment Advisers, and also considered the Investment Advisers' implementation of the fund's investment program. The Independent Trustees also had discussions with senior management of Fidelity's investment operations and investment groups. The Board considered the structure of the investment personnel compensation program and whether this structure provides appropriate incentives to act in the best interests of the fund. Additionally, the Board considered the portfolio managers' investments, if any, in the funds that they manage.
Resources Dedicated to Investment Management and Support Services. The Board and the Fund Oversight and Research Committees reviewed the general qualifications and capabilities of Fidelity's investment staff, including its size, education, experience, and resources, as well as Fidelity's approach to recruiting, training, managing, and compensating investment personnel. The Board noted the resources devoted to expansion of Fidelity's global investment organization, and that Fidelity's analysts have extensive resources, tools, and capabilities that allow them to conduct sophisticated quantitative and fundamental analysis, as well as credit analysis of issuers, counterparties, and guarantors. Further, the Board considered that Fidelity's investment professionals have sufficient access to global information and data so as to provide competitive investment results over time, and that those professionals also have access to sophisticated tools that permit them to assess portfolio construction and risk and performance attribution characteristics continuously, as well as to transmit new information and research conclusions rapidly around the world. Additionally, in its deliberations, the Board considered Fidelity's trading, risk management, compliance, and technology and operations capabilities and resources, which are integral parts of the investment management process.
Shareholder and Administrative Services. The Board considered (i) the nature, extent, quality, and cost of advisory, administrative, and shareholder services performed by the Investment Advisers and their affiliates under the Advisory Contracts and under separate agreements covering transfer agency and pricing and bookkeeping services for the fund; (ii) the nature and extent of Fidelity's supervision of third party service providers, principally custodians, subcustodians, and pricing vendors; and (iii) the resources devoted by Fidelity to, and the record of compliance with, the fund's compliance policies and procedures. The Board also reviewed the allocation of fund brokerage, including allocations to brokers affiliated with the Investment Advisers, the use of brokerage commissions to pay fund expenses, and the use of "soft" commission dollars to pay for research services. The Board also considered the fund's securities lending activities and any payments made to Fidelity relating to securities lending under a separate agreement.
The Board noted that the growth of fund assets over time across the complex allows Fidelity to reinvest in the development of services designed to enhance the value and convenience of the Fidelity funds as investment vehicles. These services include 24-hour access to account information and market information over the Internet and through telephone representatives, investor education materials, and asset allocation tools. The Board also considered that it reviews customer service metrics such as telephone response times, continuity of services on the website and metrics addressing services at Fidelity Investor Centers.
Investment in a Large Fund Family. The Board considered the benefits to shareholders of investing in a fund that is part of a large family of funds offering a variety of investment disciplines and providing a large variety of fund investor services. The Board noted that Fidelity had taken, or had made recommendations that resulted in the Fidelity funds taking, a number of actions over the previous year that benefited particular funds and/or the Fidelity funds in general.
Investment Performance. The Board took into account discussions that occur with representatives of the Investment Advisers, and reports that it receives, at Board meetings throughout the year, relating to fund investment performance. In this regard the Board noted that as part of regularly scheduled fund reviews and other reports to the Board on fund performance, the Board considered annualized return information for the fund for different time periods, measured against an appropriate securities market index (benchmark index) and an appropriate peer group of funds with similar objectives (peer group). The Board also considered information about performance attribution. In its ongoing evaluation of fund investment performance, the Board gives particular attention to information indicating changes in performance of the funds over different time periods and discussed with the Investment Advisers the reasons for any overperformance or underperformance.
In addition to reviewing absolute and relative fund performance, the Independent Trustees periodically consider the appropriateness of fund performance metrics in evaluating the results achieved. The Independent Trustees generally give greater weight to fund performance over longer time periods than over shorter time periods. Depending on the circumstances, the Independent Trustees may be satisfied with a fund's performance notwithstanding that it lags its benchmark index or peer group for certain periods.
Based on its review, the Board concluded that the nature, extent, and quality of services provided to the fund under the Advisory Contracts should continue to benefit the shareholders of the fund.
Competitiveness of Management Fee and Total Expense Ratio. The Board was provided with information regarding industry trends in management fees and expenses. In its review of the fund's management fee and total expense ratio, the Board considered the fund's unitary fee rate as well as other fund expenses paid by FMR under the fund's management contract, such as transfer agent fees, pricing and bookkeeping fees, and custodial, legal, and audit fees. The Board noted that Fidelity may agree to waive fees or reimburse expenses from time to time, and the extent to which, if any, it has done so for the fund.
Comparisons of Management Fees and Total Expense Ratios. Among other things, the Board reviewed data for selected groups of competitive funds and classes (referred to as "mapped groups") that were compiled by Fidelity based on combining similar investment objective categories (as classified by Morningstar) that have comparable investment mandates. The data reviewed by the Board included (i) gross management fee comparisons (before taking into account expense reimbursements or caps) relative to the total universe of funds within the mapped group; (ii) gross management fee comparisons relative to a subset of non-Fidelity funds in the mapped group that are similar in size and management fee structure to the fund (referred to as the "asset size peer group"); (iii) total expense comparisons of the fund relative to funds and classes in the mapped group that have a similar sales load structure to the fund (referred to as the "similar sales load structure group"); and (iv) total expense comparisons of the fund relative to funds and classes in the similar sales load structure group that are similar in size and management fee structure to the fund (referred to as the "total expense asset size peer group"). The total expense asset size peer group comparison excludes performance adjustments and fund-paid 12b-1 fees to eliminate variability in fee structures.
The information provided to the Board indicated that the fund's management fee rate ranked below the competitive median of the mapped group for the 12-month period ended September 30, 2023 and below the competitive median of the asset size peer group for the 12-month period ended September 30, 2023. Further, the information provided to the Board indicated that the total expense ratio of the fund ranked below the competitive median of the similar sales load structure group for the 12-month period ended September 30, 2023 and below the competitive median of the total expense asset size peer group for the 12-month period ended September 30, 2023.
Fees Charged to Other Fidelity Clients. The Board also considered Fidelity fee structures and other information with respect to clients of Fidelity, such as other funds advised or subadvised by Fidelity, pension plan clients, and other institutional clients with similar mandates. The Board noted that a joint ad hoc committee created by it and the boards of other Fidelity funds periodically reviews and compares Fidelity's institutional investment advisory business with its business of providing services to the Fidelity funds and also noted the most recent findings of the committee. The Board noted that the committee's review included a consideration of the differences in services provided, fees charged, and costs incurred, as well as competition in the markets serving the different categories of clients.
Based on its review, the Board concluded that the fund's management fee is fair and reasonable in light of the services that the fund receives and the other factors considered. Further based on its review of total expense ratios and fees charged to other Fidelity clients, the Board concluded that the fund's total expense ratio was reasonable in light of the services that the fund and its shareholders receive and the other factors considered.
Costs of the Services and Profitability. The Board considered the revenues earned and the expenses incurred by Fidelity in conducting the business of developing, marketing, distributing, managing, administering and servicing the fund and servicing the fund's shareholders. The Board also considered the level of Fidelity's profits in respect of all the Fidelity funds.
On an annual basis, Fidelity presents to the Board information about the profitability of its relationships with the fund. Fidelity calculates profitability information for each fund, as well as aggregate profitability information for groups of Fidelity funds and all Fidelity funds, using a series of detailed revenue and cost allocation methodologies which originate with the books and records of Fidelity on which Fidelity's audited financial statements are based. The Audit Committee of the Board reviews any significant changes from the prior year's methodologies.
A public accounting firm has been engaged annually by the Board as part of the Board's assessment of Fidelity's profitability analysis. The engagement includes the review and assessment of the methodologies used by Fidelity in determining the revenues and expenses attributable to Fidelity's fund business, and completion of agreed-upon procedures in respect of the mathematical accuracy of certain fund profitability information and its conformity to established allocation methodologies. After considering the reports issued under the engagement and information provided by Fidelity, the Board concluded that while other allocation methods may also be reasonable, Fidelity's profitability methodologies are reasonable in all material respects.
The Board also reviewed Fidelity's non-fund businesses and potential indirect benefits such businesses may have received as a result of their association with Fidelity's fund business (i.e., fall-out benefits) as well as cases where Fidelity's affiliates may benefit from the funds' business. The Board considered areas where potential indirect benefits to the Fidelity funds from their relationships with Fidelity may exist. The Board's consideration of these matters was informed by the findings of a joint ad hoc committee created by it and the boards of other Fidelity funds to evaluate potential fall-out benefits.
The Board considered the costs of the services provided by and the profits realized by Fidelity in connection with the operation of the fund and was satisfied that the profitability was not excessive.
Economies of Scale. The Board considered whether there have been economies of scale in respect of the management of the Fidelity funds, whether the Fidelity funds (including the fund) have appropriately benefited from any such economies of scale, and whether there is potential for realization of any further economies of scale. The Board considered the extent to which the fund will benefit from economies of scale as assets grow through increased services to the fund, through waivers or reimbursements, or through fee or expense ratio reductions. The Board recognized that, due to the fund's current contractual arrangements, its expense ratio will not decline if the fund's operating costs decrease as assets grow, or rise as assets decrease. The Board also noted that a committee created by it and the boards of other Fidelity funds periodically analyzes whether Fidelity attains economies of scale in respect of the management and servicing of the Fidelity funds, whether the Fidelity funds have appropriately benefited from such economies of scale, and whether there is potential for realization of any further economies of scale.
The Board concluded, taking into account the analysis of the committee, that economies of scale, if any, are being appropriately shared between fund shareholders and Fidelity.
Additional Information Requested by the Board. In order to develop fully the factual basis for consideration of the Fidelity funds' advisory contracts, the Board requested and received additional information on certain topics, including but not limited to: (i) fund flow and performance trends, in particular the underperformance of certain funds and strategies, and Fidelity's long-term strategies for certain funds; (ii) the operation of performance fees and the rationale for implementing performance fees on certain categories of funds but not others; (iii) Fidelity's pricing philosophy compared to competitors; (iv) fund profitability methodology and data; (v) evaluation of competitive fund data and peer group classifications and fee and expense comparisons; (vi) the management fee and expense structures for different funds and classes and information about the differences between various fee and expense structures; (vii) the variable management fee implemented for certain funds effective March 1, 2024; and (viii) information regarding other accounts managed by Fidelity and the funds' sub-advisory arrangements.
Conclusion. Based on its evaluation of all of the conclusions noted above, and after considering all factors it believed relevant, the Board, including the Independent Trustees, concluded that the advisory and sub-advisory fee arrangements are fair and reasonable in light of all of the surrounding circumstances and that the fund's Advisory Contracts should be renewed through May 31, 2025.
1.9883987.107
DIFK6-ANN-1224
Fidelity® International Capital Appreciation K6 Fund
Annual Report
October 31, 2024
Contents
To view a fund's proxy voting guidelines and proxy voting record for the 12-month period ended June 30, visit http://www.fidelity.com/proxyvotingresults or visit the Securities and Exchange Commission's (SEC) web site at http://www.sec.gov.
You may also call 1-800-835-5092 to request a free copy of the proxy voting guidelines.
Standard & Poor's, S&P and S&P 500 are registered service marks of The McGraw-Hill Companies, Inc. and have been licensed for use by Fidelity Distributors Corporation.
Other third-party marks appearing herein are the property of their respective owners.
All other marks appearing herein are registered or unregistered trademarks or service marks of FMR LLC or an affiliated company. © 2024 FMR LLC. All rights reserved.
This report and the financial statements contained herein are submitted for the general information of the shareholders of the Fund. This report is not authorized for distribution to prospective investors in the Fund unless preceded or accompanied by an effective prospectus.
A fund files its complete schedule of portfolio holdings with the SEC for the first and third quarters of each fiscal year on Form N-PORT. Forms N-PORT are available on the SEC's web site at http://www.sec.gov. A fund's Forms N-PORT may be reviewed and copied at the SEC's Public Reference Room in Washington, DC. Information regarding the operation of the SEC's Public Reference Room may be obtained by calling 1-800-SEC-0330.
For a complete list of a fund's portfolio holdings, view the most recent holdings listing, semiannual report, or annual report on Fidelity's web site at http://www.fidelity.com, http://www.institutional.fidelity.com, or http://www.401k.com, as applicable.
NOT FDIC INSURED •MAY LOSE VALUE •NO BANK GUARANTEE
Neither the Fund nor Fidelity Distributors Corporation is a bank.
Item 7: Financial Statements and Financial Highlights for Open-End Management Investment Companies (Annual Report)
Fidelity® International Capital Appreciation K6 Fund
Schedule of Investments October 31, 2024
Showing Percentage of Net Assets
| Common Stocks - 98.6% |
| | | Shares | Value ($) |
| Brazil - 1.5% | | | |
| MercadoLibre, Inc. (a) | | 11,635 | 23,702,589 |
| Canada - 6.2% | | | |
| Brookfield Asset Management Ltd. Class A (b) | | 530,063 | 28,114,542 |
| Canadian Pacific Kansas City Ltd. | | 320,570 | 24,729,719 |
| Constellation Software, Inc. | | 9,036 | 27,250,710 |
| Constellation Software, Inc. warrants 3/31/40 (a)(c) | | 9,222 | 1 |
| Thomson Reuters Corp. | | 127,221 | 20,824,461 |
TOTAL CANADA | | | 100,919,433 |
| China - 5.3% | | | |
| Meituan Class B (a)(d) | | 1,108,100 | 26,184,816 |
| Tencent Holdings Ltd. | | 764,300 | 39,852,231 |
| Trip.com Group Ltd. ADR (a) | | 305,030 | 19,643,932 |
TOTAL CHINA | | | 85,680,979 |
| Denmark - 4.3% | | | |
| DSV A/S | | 104,021 | 22,608,480 |
| Novo Nordisk A/S Series B | | 416,179 | 46,680,723 |
TOTAL DENMARK | | | 69,289,203 |
| France - 8.8% | | | |
| Air Liquide SA | | 145,804 | 26,142,862 |
| Compagnie de St.-Gobain | | 267,179 | 24,229,114 |
| Hermes International SCA | | 12,337 | 27,832,192 |
| LVMH Moet Hennessy Louis Vuitton SE | | 53,613 | 35,691,276 |
| Safran SA | | 123,721 | 28,006,191 |
TOTAL FRANCE | | | 141,901,635 |
| Germany - 3.9% | | | |
| HeidelbergCement AG | | 213,654 | 23,519,096 |
| SAP SE | | 170,472 | 39,802,672 |
TOTAL GERMANY | | | 63,321,768 |
| India - 7.8% | | | |
| Axis Bank Ltd. | | 1,654,293 | 22,724,682 |
| Bharti Airtel Ltd. | | 1,349,470 | 25,828,824 |
| HDFC Bank Ltd. | | 1,323,719 | 27,207,936 |
| ICICI Bank Ltd. | | 1,816,651 | 27,865,872 |
| Larsen & Toubro Ltd. | | 534,989 | 22,980,758 |
TOTAL INDIA | | | 126,608,072 |
| Indonesia - 1.5% | | | |
| PT Bank Central Asia Tbk | | 37,928,793 | 24,547,384 |
| Ireland - 1.3% | | | |
| Kingspan Group PLC (Ireland) | | 239,805 | 21,037,382 |
| Italy - 2.8% | | | |
| Ferrari NV (Italy) | | 50,851 | 24,326,734 |
| Prysmian SpA | | 302,897 | 21,356,648 |
TOTAL ITALY | | | 45,683,382 |
| Japan - 12.6% | | | |
| Disco Corp. | | 97,080 | 27,622,638 |
| Hitachi Ltd. | | 1,214,231 | 30,507,384 |
| Hoya Corp. | | 197,433 | 26,415,360 |
| Keyence Corp. | | 62,414 | 28,174,534 |
| Recruit Holdings Co. Ltd. | | 424,356 | 25,912,251 |
| Shin-Etsu Chemical Co. Ltd. | | 696,664 | 25,528,531 |
| Tokio Marine Holdings, Inc. | | 778,857 | 28,051,442 |
| Tokyo Electron Ltd. | | 76,376 | 11,238,962 |
TOTAL JAPAN | | | 203,451,102 |
| Netherlands - 5.1% | | | |
| ASM International NV (Netherlands) | | 42,830 | 23,862,544 |
| ASML Holding NV (Netherlands) | | 54,427 | 36,776,884 |
| Wolters Kluwer NV | | 133,533 | 22,470,256 |
TOTAL NETHERLANDS | | | 83,109,684 |
| Sweden - 1.4% | | | |
| Atlas Copco AB (A Shares) | | 1,397,187 | 23,058,360 |
| Switzerland - 1.8% | | | |
| ABB Ltd. (Reg.) | | 522,952 | 29,061,038 |
| Taiwan - 4.5% | | | |
| Taiwan Semiconductor Manufacturing Co. Ltd. | | 2,313,610 | 72,789,895 |
| United Kingdom - 11.0% | | | |
| 3i Group PLC | | 590,530 | 24,216,288 |
| Ashtead Group PLC | | 337,330 | 25,176,073 |
| BAE Systems PLC | | 1,480,121 | 23,855,568 |
| InterContinental Hotel Group PLC | | 254,164 | 28,033,667 |
| London Stock Exchange Group PLC | | 186,687 | 25,302,789 |
| RELX PLC (London Stock Exchange) | | 573,369 | 26,294,533 |
| Rolls-Royce Holdings PLC (a) | | 3,801,041 | 26,228,699 |
TOTAL UNITED KINGDOM | | | 179,107,617 |
| United States of America - 18.8% | | | |
| Arthur J. Gallagher & Co. | | 77,647 | 21,834,336 |
| Broadcom, Inc. | | 144,412 | 24,516,825 |
| CRH PLC | | 217,595 | 20,745,928 |
| Experian PLC | | 507,554 | 24,719,162 |
| Holcim AG | | 255,062 | 25,129,610 |
| Linde PLC | | 45,847 | 20,913,109 |
| Marsh & McLennan Companies, Inc. | | 98,942 | 21,593,102 |
| MasterCard, Inc. Class A | | 49,212 | 24,585,823 |
| Moody's Corp. | | 44,568 | 20,235,655 |
| S&P Global, Inc. | | 45,928 | 22,061,974 |
| Schneider Electric SA | | 128,134 | 33,192,953 |
| Visa, Inc. Class A | | 87,387 | 25,329,122 |
| Waste Connections, Inc. (Canada) | | 114,416 | 20,225,669 |
TOTAL UNITED STATES OF AMERICA | | | 305,083,268 |
| TOTAL COMMON STOCKS (Cost $1,191,208,833) | | | 1,598,352,791 |
| | | | |
| Money Market Funds - 1.8% |
| | | Shares | Value ($) |
Fidelity Securities Lending Cash Central Fund 4.87% (e)(f) (Cost $28,492,200) | | 28,489,351 | 28,492,200 |
| | | | |
| TOTAL INVESTMENT IN SECURITIES - 100.4% (Cost $1,219,701,033) | 1,626,844,991 |
NET OTHER ASSETS (LIABILITIES) - (0.4)% | (6,211,558) |
| NET ASSETS - 100.0% | 1,620,633,433 |
| | |
Legend
| (b) | Security or a portion of the security is on loan at period end. |
| (d) | Security exempt from registration under Rule 144A of the Securities Act of 1933. These securities may be resold in transactions exempt from registration, normally to qualified institutional buyers. At the end of the period, the value of these securities amounted to $26,184,816 or 1.6% of net assets. |
| (e) | Affiliated fund that is generally available only to investment companies and other accounts managed by Fidelity Investments. The rate quoted is the annualized seven-day yield of the fund at period end. A complete unaudited listing of the fund's holdings as of its most recent quarter end is available upon request. In addition, each Fidelity Central Fund's financial statements, which are not covered by the Fund's Report of Independent Registered Public Accounting Firm, are available on the SEC's website or upon request. |
| (f) | Investment made with cash collateral received from securities on loan. |
Affiliated Central Funds
Fiscal year to date information regarding the Fund's investments in Fidelity Central Funds, including the ownership percentage, is presented below.
| Affiliate | Value, beginning of period ($) | Purchases ($) | Sales Proceeds ($) | Dividend Income ($) | Realized Gain (loss) ($) | Change in Unrealized appreciation (depreciation) ($) | Value, end of period ($) | % ownership, end of period |
| Fidelity Cash Central Fund 4.87% | 17,211,551 | 895,323,429 | 912,536,691 | 1,465,643 | 1,711 | - | - | 0.0% |
| Fidelity Securities Lending Cash Central Fund 4.87% | 505,800 | 262,918,955 | 234,932,555 | 11,852 | - | - | 28,492,200 | 0.1% |
| Total | 17,717,351 | 1,158,242,384 | 1,147,469,246 | 1,477,495 | 1,711 | - | 28,492,200 | |
| | | | | | | | | |
Amounts in the dividend income column in the above table include any capital gain distributions from underlying funds, which are presented in the corresponding line item in the Statement of Operations, if applicable.
Amounts in the dividend income column for Fidelity Securities Lending Cash Central Fund represents the income earned on investing cash collateral, less rebates paid to borrowers and any lending agent fees associated with the loan, plus any premium payments received for lending certain types of securities.
Amounts included in the purchases and sales proceeds columns may include in-kind transactions, if applicable.
Investment Valuation
The following is a summary of the inputs used, as of October 31, 2024, involving the Fund's assets and liabilities carried at fair value. The inputs or methodology used for valuing securities may not be an indication of the risk associated with investing in those securities. For more information on valuation inputs, and their aggregation into the levels used below, please refer to the Investment Valuation section in the accompanying Notes to Financial Statements.
| Valuation Inputs at Reporting Date: |
| Description | Total ($) | Level 1 ($) | Level 2 ($) | Level 3 ($) |
Investments in Securities: | | | | |
|
| Equities: | | | | |
Communication Services | 65,681,055 | - | 65,681,055 | - |
Consumer Discretionary | 185,415,206 | 95,505,447 | 89,909,759 | - |
Financials | 343,670,947 | 163,754,554 | 179,916,393 | - |
Health Care | 73,096,083 | - | 73,096,083 | - |
Industrials | 496,474,699 | 203,147,850 | 293,326,849 | - |
Information Technology | 292,035,665 | 112,406,963 | 179,628,701 | 1 |
Materials | 141,979,136 | 90,307,743 | 51,671,393 | - |
|
| Money Market Funds | 28,492,200 | 28,492,200 | - | - |
| Total Investments in Securities: | 1,626,844,991 | 693,614,757 | 933,230,233 | 1 |
Financial Statements
| Statement of Assets and Liabilities |
As of October 31, 2024 |
| Assets | | | | |
| Investment in securities, at value (including securities loaned of $27,476,842) - See accompanying schedule: | | | | |
Unaffiliated issuers (cost $1,191,208,833) | $ | 1,598,352,791 | | |
Fidelity Central Funds (cost $28,492,200) | | 28,492,200 | | |
| | | | | |
| | | | | |
| Total Investment in Securities (cost $1,219,701,033) | | | $ | 1,626,844,991 |
| Foreign currency held at value (cost $169,873) | | | | 169,680 |
| Receivable for investments sold | | | | 14,808,408 |
| Receivable for fund shares sold | | | | 20,619,295 |
| Dividends receivable | | | | 1,654,098 |
| Reclaims receivable | | | | 1,897,184 |
| Distributions receivable from Fidelity Central Funds | | | | 77,311 |
| Other receivables | | | | 1,037 |
Total assets | | | | 1,666,072,004 |
| Liabilities | | | | |
| Payable to custodian bank | $ | 1,094,802 | | |
| Payable for investments purchased | | 9,118,626 | | |
| Payable for fund shares redeemed | | 690,558 | | |
| Accrued management fee | | 887,269 | | |
| Deferred taxes | | 5,126,988 | | |
| Other payables and accrued expenses | | 28,128 | | |
| Collateral on securities loaned | | 28,492,200 | | |
| Total liabilities | | | | 45,438,571 |
| Net Assets | | | $ | 1,620,633,433 |
| Net Assets consist of: | | | | |
| Paid in capital | | | $ | 1,183,920,801 |
| Total accumulated earnings (loss) | | | | 436,712,632 |
| Net Assets | | | $ | 1,620,633,433 |
Net Asset Value, offering price and redemption price per share ($1,620,633,433 ÷ 96,303,095 shares) | | | $ | 16.83 |
| Statement of Operations |
| Year ended October 31, 2024 |
| Investment Income | | | | |
| Dividends | | | $ | 21,759,003 |
| Income from Fidelity Central Funds (including $11,852 from security lending) | | | | 1,477,495 |
| Income before foreign taxes withheld | | | $ | 23,236,498 |
| Less foreign taxes withheld | | | | (1,939,108) |
| Total income | | | | 21,297,390 |
| Expenses | | | | |
| Management fee | $ | 10,484,013 | | |
| Independent trustees' fees and expenses | | 6,852 | | |
| Interest | | 69,702 | | |
| Miscellaneous | | 33,185 | | |
| Total expenses before reductions | | 10,593,752 | | |
| Expense reductions | | (321) | | |
| Total expenses after reductions | | | | 10,593,431 |
| Net Investment income (loss) | | | | 10,703,959 |
| Realized and Unrealized Gain (Loss) | | | | |
| Net realized gain (loss) on: | | | | |
| Investment Securities: | | | | |
| Unaffiliated issuers (net of foreign taxes of $2,153,782) | | 89,795,002 | | |
| Fidelity Central Funds | | 1,711 | | |
| Foreign currency transactions | | 69,168 | | |
| Total net realized gain (loss) | | | | 89,865,881 |
| Change in net unrealized appreciation (depreciation) on: | | | | |
| Investment Securities: | | | | |
| Unaffiliated issuers (net of increase in deferred foreign taxes of $3,501,690) | | 261,162,438 | | |
| Assets and liabilities in foreign currencies | | (8,754) | | |
| Total change in net unrealized appreciation (depreciation) | | | | 261,153,684 |
| Net gain (loss) | | | | 351,019,565 |
| Net increase (decrease) in net assets resulting from operations | | | $ | 361,723,524 |
| Statement of Changes in Net Assets |
| |
| | Year ended October 31, 2024 | | Year ended October 31, 2023 |
| Increase (Decrease) in Net Assets | | | | |
| Operations | | | | |
| Net investment income (loss) | $ | 10,703,959 | $ | 5,810,863 |
| Net realized gain (loss) | | 89,865,881 | | 7,929,064 |
| Change in net unrealized appreciation (depreciation) | | 261,153,684 | | 104,172,802 |
| Net increase (decrease) in net assets resulting from operations | | 361,723,524 | | 117,912,729 |
| Distributions to shareholders | | (5,644,723) | | (3,323,601) |
| | | | | |
| Share transactions | | | | |
| Proceeds from sales of shares | | 853,341,623 | | 427,602,334 |
| Reinvestment of distributions | | 5,644,723 | | 3,323,601 |
| Cost of shares redeemed | | (686,774,012) | | (216,290,497) |
| | | | | |
Net increase (decrease) in net assets resulting from share transactions | | 172,212,334 | | 214,635,438 |
| Total increase (decrease) in net assets | | 528,291,135 | | 329,224,566 |
| | | | | |
| Net Assets | | | | |
| Beginning of period | | 1,092,342,298 | | 763,117,732 |
| End of period | $ | 1,620,633,433 | $ | 1,092,342,298 |
| | | | | |
| Other Information | | | | |
| Shares | | | | |
| Sold | | 53,488,845 | | 31,934,138 |
| Issued in reinvestment of distributions | | 386,361 | | 258,445 |
| Redeemed | | (41,290,018) | | (16,055,471) |
| Net increase (decrease) | | 12,585,188 | | 16,137,112 |
| | | | | |
Financial Highlights
Fidelity® International Capital Appreciation K6 Fund |
| |
| Years ended October 31, | | 2024 | | 2023 | | 2022 | | 2021 | | 2020 |
Selected Per-Share Data | | | | | | | | | | |
| Net asset value, beginning of period | $ | 13.05 | $ | 11.29 | $ | 17.82 | $ | 13.99 | $ | 12.40 |
| Income from Investment Operations | | | | | | | | | | |
Net investment income (loss) A,B | | .11 | | .08 | | .06 | | .05 | | .08 |
| Net realized and unrealized gain (loss) | | 3.74 | | 1.73 | | (5.14) | | 3.85 | | 1.62 |
| Total from investment operations | | 3.85 | | 1.81 | | (5.08) | | 3.90 | | 1.70 |
| Distributions from net investment income | | (.07) | | (.05) | | (.04) | | (.07) | | (.11) |
| Distributions from net realized gain | | - | | - | | (1.41) | | - | | - |
| Total distributions | | (.07) | | (.05) | | (1.45) | | (.07) | | (.11) |
| Net asset value, end of period | $ | 16.83 | $ | 13.05 | $ | 11.29 | $ | 17.82 | $ | 13.99 |
Total Return C | | | | 16.02% | | (30.83)% | | 27.93% | | 13.82% |
Ratios to Average Net Assets B,D,E | | | | | | | | | | |
| Expenses before reductions | | .66% | | .65% | | .65% | | .65% | | .65% |
| Expenses net of fee waivers, if any | | | | .65% | | .65% | | .65% | | .65% |
| Expenses net of all reductions | | .66% | | .65% | | .65% | | .65% | | .61% |
| Net investment income (loss) | | .66% | | .59% | | .44% | | .29% | | .62% |
| Supplemental Data | | | | | | | | | | |
| Net assets, end of period (000 omitted) | $ | 1,620,633 | $ | 1,092,342 | $ | 763,118 | $ | 923,233 | $ | 760,960 |
Portfolio turnover rate F | | | | 78% | | 119% G | | 149% | | 138% |
ACalculated based on average shares outstanding during the period.
BNet investment income (loss) is affected by the timing of the declaration of dividends by any underlying mutual funds or exchange-traded funds (ETFs). Net investment income (loss) of any mutual funds or ETFs is not included in the Fund's net investment income (loss) ratio.
CTotal returns would have been lower if certain expenses had not been reduced during the applicable periods shown.
DFees and expenses of any underlying mutual funds or exchange-traded funds (ETFs) are not included in the Fund's expense ratio. The Fund indirectly bears its proportionate share of these expenses. For additional expense information related to investments in Fidelity Central Funds, please refer to the "Investments in Fidelity Central Funds" note found in the Notes to Financial Statements section of the most recent Annual or Semi-Annual report.
EExpense ratios reflect operating expenses of the class. Expenses before reductions do not reflect amounts reimbursed, waived, or reduced through arrangements with the investment adviser, brokerage services, or other offset arrangements, if applicable, and do not represent the amount paid by the class during periods when reimbursements, waivers or reductions occur.
FAmount does not include the portfolio activity of any underlying mutual funds or exchange-traded funds (ETFs).
GPortfolio turnover rate excludes securities received or delivered in-kind.
Notes to Financial Statements
For the period ended October 31, 2024
1. Organization.
Fidelity International Capital Appreciation K6 Fund (the Fund) is a fund of Fidelity Investment Trust (the Trust) and is authorized to issue an unlimited number of shares. Share transactions on the Statement of Changes in Net Assets may contain exchanges between affiliated funds. The Trust is registered under the Investment Company Act of 1940, as amended (the 1940 Act), as an open-end management investment company organized as a Massachusetts business trust. Shares generally are available only to employer-sponsored retirement plans that are recordkept by Fidelity, or to certain employer-sponsored retirement plans that are not recordkept by Fidelity. The Fund's investments in emerging markets can be subject to social, economic, regulatory, and political uncertainties and can be extremely volatile.
2. Investments in Fidelity Central Funds.
Funds may invest in Fidelity Central Funds, which are open-end investment companies generally available only to other investment companies and accounts managed by the investment adviser and its affiliates. The Schedule of Investments lists any Fidelity Central Funds held as an investment as of period end, but does not include the underlying holdings of each Fidelity Central Fund. An investing fund indirectly bears its proportionate share of the expenses of the underlying Fidelity Central Funds.
Based on its investment objective, each Fidelity Central Fund may invest or participate in various investment vehicles or strategies that are similar to those of the investing fund. These strategies are consistent with the investment objectives of the investing fund and may involve certain economic risks which may cause a decline in value of each of the Fidelity Central Funds and thus a decline in the value of the investing fund.
| Fidelity Central Fund | Investment Manager | Investment Objective | Investment Practices | Expense RatioA |
| Fidelity Money Market Central Funds | Fidelity Management & Research Company LLC (FMR) | Each fund seeks to obtain a high level of current income consistent with the preservation of capital and liquidity. | Short-term Investments | Less than .005% |
A Expenses expressed as a percentage of average net assets and are as of each underlying Central Fund's most recent annual or semi-annual shareholder report.
A complete unaudited list of holdings for each Fidelity Central Fund is available upon request or at the Securities and Exchange Commission website at www.sec.gov. In addition, the financial statements of the Fidelity Central Funds which contain the significant accounting policies (including investment valuation policies) of those funds, and are not covered by the Report of Independent Registered Public Accounting Firm, are available on the Securities and Exchange Commission website or upon request.
3. Significant Accounting Policies.
The Fund is an investment company and applies the accounting and reporting guidance of the Financial Accounting Standards Board (FASB) Accounting Standards Codification Topic 946 Financial Services - Investment Companies. The financial statements have been prepared in conformity with accounting principles generally accepted in the United States of America (GAAP), which require management to make certain estimates and assumptions at the date of the financial statements. Actual results could differ from those estimates. Subsequent events, if any, through the date that the financial statements were issued have been evaluated in the preparation of the financial statements. The Fund's Schedule of Investments lists any underlying mutual funds or exchange-traded funds (ETFs) but does not include the underlying holdings of these funds. The following summarizes the significant accounting policies of the Fund:
Investment Valuation. Investments are valued as of 4:00 p.m. Eastern time on the last calendar day of the period. The Board of Trustees (the Board) has designated the Fund's investment adviser as the valuation designee responsible for the fair valuation function and performing fair value determinations as needed. The investment adviser has established a Fair Value Committee (the Committee) to carry out the day-to-day fair valuation responsibilities and has adopted policies and procedures to govern the fair valuation process and the activities of the Committee. In accordance with these fair valuation policies and procedures, which have been approved by the Board, the Fund attempts to obtain prices from one or more third party pricing services or brokers to value its investments. When current market prices, quotations or currency exchange rates are not readily available or reliable, investments will be fair valued in good faith by the Committee, in accordance with the policies and procedures. Factors used in determining fair value vary by investment type and may include market or investment specific events, transaction data, estimated cash flows, and market observations of comparable investments. The frequency that the fair valuation procedures are used cannot be predicted and they may be utilized to a significant extent. The Committee manages the Fund's fair valuation practices and maintains the fair valuation policies and procedures. The Fund's investment adviser reports to the Board information regarding the fair valuation process and related material matters.
The Fund categorizes the inputs to valuation techniques used to value its investments into a disclosure hierarchy consisting of three levels as shown below:
Level 1 - unadjusted quoted prices in active markets for identical investments
Level 2 - other significant observable inputs (including quoted prices for similar investments, interest rates, prepayment speeds, etc.)
Level 3 - unobservable inputs (including the Fund's own assumptions based on the best information available)
Valuation techniques used to value the Fund's investments by major category are as follows:
Equity securities, including restricted securities, for which market quotations are readily available, are valued at the last reported sale price or official closing price as reported by a third party pricing service on the primary market or exchange on which they are traded and are categorized as Level 1 in the hierarchy. In the event there were no sales during the day or closing prices are not available, securities are valued at the last quoted bid price or may be valued using the last available price and are generally categorized as Level 2 in the hierarchy. For foreign equity securities, when market or security specific events arise, comparisons to the valuation of American Depositary Receipts (ADRs), futures contracts, Exchange-Traded Funds (ETFs) and certain indexes as well as quoted prices for similar securities may be used and would be categorized as Level 2 in the hierarchy. For equity securities, including restricted securities, where observable inputs are limited, assumptions about market activity and risk are used and these securities may be categorized as Level 3 in the hierarchy.
Investments in open-end mutual funds, including the Fidelity Central Funds, are valued at their closing net asset value (NAV) each business day and are categorized as Level 1 in the hierarchy.
Changes in valuation techniques may result in transfers in or out of an assigned level within the disclosure hierarchy. The aggregate value of investments by input level as of October 31, 2024 is included at the end of the Fund's Schedule of Investments.
Foreign Currency. Certain Funds may use foreign currency contracts to facilitate transactions in foreign-denominated securities. Gains and losses from these transactions may arise from changes in the value of the foreign currency or if the counterparties do not perform under the contracts' terms.
Foreign-denominated assets, including investment securities, and liabilities are translated into U.S. dollars at the exchange rates at period end. Purchases and sales of investment securities, income and dividends received, and expenses denominated in foreign currencies are translated into U.S. dollars at the exchange rate in effect on the transaction date.
The effects of exchange rate fluctuations on investments are included with the net realized and unrealized gain (loss) on investment securities. Other foreign currency transactions resulting in realized and unrealized gain (loss) are disclosed separately.
Investment Transactions and Income. For financial reporting purposes, the Fund's investment holdings and NAV include trades executed through the end of the last business day of the period. The NAV per share for processing shareholder transactions is calculated as of the close of business of the New York Stock Exchange (NYSE), normally 4:00 p.m. Eastern time and includes trades executed through the end of the prior business day. Gains and losses on securities sold are determined on the basis of identified cost. Commissions paid to certain brokers with whom the investment adviser, or its affiliates, places trades on behalf of a fund include an amount in addition to trade execution, which may be rebated back to a fund. Any such rebates are included in net realized gain (loss) on investments in the Statement of Operations. Dividend income is recorded on the ex-dividend date, except for certain dividends from foreign securities where the ex-dividend date may have passed, which are recorded as soon as the Fund is informed of the ex-dividend date. Non-cash dividends included in dividend income, if any, are recorded at the fair market value of the securities received. Income and capital gain distributions from Fidelity Central Funds, if any, are recorded on the ex-dividend date. Certain distributions received by the Fund represent a return of capital or capital gain. The Fund determines the components of these distributions subsequent to the ex-dividend date, based upon receipt of tax filings or other correspondence relating to the underlying investment. These distributions are recorded as a reduction of cost of investments and/or as a realized gain. Investment income is recorded net of foreign taxes withheld where recovery of such taxes is uncertain. Funds may file withholding tax reclaims in certain jurisdictions to recover a portion of amounts previously withheld. Any withholding tax reclaims income is included in the Statement of Operations in foreign taxes withheld. Any receivables for withholding tax reclaims are included in the Statement of Assets and Liabilities in reclaims receivable.
Expenses. Expenses directly attributable to a fund are charged to that fund. Expenses attributable to more than one fund are allocated among the respective funds on the basis of relative net assets or other appropriate methods. Expenses included in the accompanying financial statements reflect the expenses of that fund and do not include any expenses associated with any underlying mutual funds or exchange-traded funds. Although not included in a fund's expenses, a fund indirectly bears its proportionate share of these expenses through the net asset value of each underlying mutual fund or exchange-traded fund. Expense estimates are accrued in the period to which they relate and adjustments are made when actual amounts are known.
Income Tax Information and Distributions to Shareholders. Each year, the Fund intends to qualify as a regulated investment company under Subchapter M of the Internal Revenue Code, including distributing substantially all of its taxable income and realized gains. As a result, no provision for U.S. Federal income taxes is required. As of October 31, 2024, the Fund did not have any unrecognized tax benefits in the financial statements; nor is the Fund aware of any tax positions for which it is reasonably possible that the total amounts of unrecognized tax benefits will significantly change in the next twelve months. The Fund files a U.S. federal tax return, in addition to state and local tax returns as required. The Fund's federal income tax returns are subject to examination by the Internal Revenue Service (IRS) for a period of three fiscal years after they are filed. State and local tax returns may be subject to examination for an additional fiscal year depending on the jurisdiction. Foreign taxes are provided for based on the Fund's understanding of the tax rules and rates that exist in the foreign markets in which it invests. The Fund is subject to a tax imposed on capital gains by certain countries in which it invests. An estimated deferred tax liability for net unrealized appreciation on the applicable securities is included in Deferred taxes on the Statement of Assets and Liabilities.
Distributions are declared and recorded on the ex-dividend date. Income and capital gain distributions are determined in accordance with income tax regulations, which may differ from GAAP.
Capital accounts within the financial statements are adjusted for permanent book-tax differences. These adjustments have no impact on net assets or the results of operations. Capital accounts are not adjusted for temporary book-tax differences which will reverse in a subsequent period.
Book-tax differences are primarily due to foreign currency transactions, passive foreign investment (PFIC), certain foreign taxes, capital loss carryforwards and losses deferred due to wash sales.
As of period end, the cost and unrealized appreciation (depreciation) in securities, and derivatives if applicable, for federal income tax purposes were as follows:
| Gross unrealized appreciation | $409,796,444 |
| Gross unrealized depreciation | (12,591,339) |
| Net unrealized appreciation (depreciation) | $397,205,105 |
| Tax Cost | $1,229,639,886 |
The tax-based components of distributable earnings as of period end were as follows:
| Undistributed ordinary income | $15,784,219 |
| Undistributed long-term capital gain | $28,889,944 |
| Net unrealized appreciation (depreciation) on securities and other investments | $397,165,459 |
The tax character of distributions paid was as follows:
| | October 31, 2024 | October 31, 2023 |
| Ordinary Income | $5,644,723 | $3,323,601 |
| Long-term Capital Gains | - | - |
| Total | $5,644,723 | $3,323,601 |
Restricted Securities (including Private Placements). Funds may invest in securities that are subject to legal or contractual restrictions on resale. These securities generally may be resold in transactions exempt from registration or to the public if the securities are registered. Disposal of these securities may involve time-consuming negotiations and expense, and prompt sale at an acceptable price may be difficult. Information regarding restricted securities held at period end is included at the end of the Schedule of Investments, if applicable.
New Accounting Pronouncement. In November 2023, the FASB issued Accounting Standards Update (ASU) 2023-07 Segment Reporting (Topic 280): Improvements to Reportable Segment Disclosures. Effective for fiscal years beginning after December 15, 2023 and interim periods within fiscal years beginning after December 15, 2024, the amendments enhance required disclosures of segment information for public entities on an annual and interim basis. The ASU allows for early adoption with updates applied retrospectively. Management is currently evaluating the impact of the ASU but does not expect this guidance to materially impact the financial statements.
4. Purchases and Sales of Investments.
Purchases and sales of securities, other than short-term securities and in-kind transactions, as applicable, are noted in the table below.
| | Purchases ($) | Sales ($) |
| Fidelity International Capital Appreciation K6 Fund | 1,483,909,347 | 1,313,231,133 |
5. Fees and Other Transactions with Affiliates.
Management Fee. Fidelity Management & Research Company LLC (the investment adviser) and its affiliates provide the Fund with investment management related services for which the Fund pays a monthly management fee that is based on an annual rate of .65% of average net assets. Under the management contract, the investment adviser or an affiliate pays all other expenses of the Fund, excluding fees and expenses of the independent Trustees, and certain miscellaneous expenses such as proxy and shareholder meeting expenses.
Brokerage Commissions. A portion of portfolio transactions were placed with brokerage firms which are affiliates of the investment adviser. Brokerage commissions are included in net realized gain (loss) and change in net unrealized appreciation (depreciation) in the Statement of Operations. The commissions paid to these affiliated firms were as follows:
| | Amount ($) |
| Fidelity International Capital Appreciation K6 Fund | 985 |
Interfund Lending Program. Pursuant to an Exemptive Order issued by the Securities and Exchange Commission (the SEC), the Fund, along with other registered investment companies having management contracts with Fidelity Management & Research Company LLC (FMR), or other affiliated entities of FMR, may participate in an interfund lending program. This program provides an alternative credit facility allowing the Fund to borrow from, or lend money to, other participating affiliated funds at rates that are beneficial to both the borrowing and lending fund. Borrowings under the program are generally for temporary or emergency purposes, including meeting fund shareholder redemptions. The interfund loan rate is determined, as specified in the Exemptive Order, by averaging, (1) the higher of the overnight time deposit rate and the current overnight repurchase agreement rate, and (2) a benchmark rate representing the lowest bank loan rate available to the funds. At period end, there were no interfund loans outstanding. Activity in this program during the period for which loans were outstanding was as follows:
| | Borrower or Lender | Average Loan Balance ($) | Weighted Average Interest Rate | Interest Expense ($) |
Fidelity International Capital Appreciation K6 Fund | Borrower | 21,200,364 | 5.38% | 69,702 |
Interfund Trades. Funds may purchase from or sell securities to other Fidelity Funds under procedures adopted by the Board. The procedures have been designed to ensure these interfund trades are executed in accordance with Rule 17a-7 of the 1940 Act. Any interfund trades are included within the respective purchases and sales amounts shown in the Purchases and Sales of Investments note. Interfund trades during the period are noted in the table below.
| | Purchases ($) | Sales ($) | Realized Gain (Loss)($) |
| Fidelity International Capital Appreciation K6 Fund | 105,772,287 | 56,898,392 | 4,565,304 |
Sub-Advisory Arrangements. Effective March 1, 2024, the Fund's sub-advisory agreements with FMR Investment Management (UK) Limited, Fidelity Management & Research (Hong Kong) Limited, and Fidelity Management & Research (Japan) Limited were amended to provide that the investment adviser pays each sub-adviser monthly fees equal to 110% of the sub-adviser's costs for providing sub-advisory services.
6. Committed Line of Credit.
Certain Funds participate with other funds managed by the investment adviser or an affiliate in a $4.25 billion credit facility (the "line of credit") to be utilized for temporary or emergency purposes to fund shareholder redemptions or for other short-term liquidity purposes. The commitment fees on the pro-rata portion of the line of credit are borne by the investment adviser. During the period, there were no borrowings on this line of credit.
7. Security Lending.
Funds lend portfolio securities from time to time in order to earn additional income. Lending agents are used, including National Financial Services (NFS), an affiliate of the investment adviser. Pursuant to a securities lending agreement, NFS will receive a fee, which is capped at 9.9% of a fund's daily lending revenue, for its services as lending agent. A fund may lend securities to certain qualified borrowers, including NFS. On the settlement date of the loan, a fund receives collateral (in the form of U.S. Treasury obligations, letters of credit and/or cash) against the loaned securities and maintains collateral in an amount not less than 100% of the market value of the loaned securities during the period of the loan. The market value of the loaned securities is determined at the close of business of a fund and any additional required collateral is delivered to a fund on the next business day. A fund or borrower may terminate the loan at any time, and if the borrower defaults on its obligation to return the securities loaned because of insolvency or other reasons, a fund may apply collateral received from the borrower against the obligation. A fund may experience delays and costs in recovering the securities loaned. Any cash collateral received is invested in the Fidelity Securities Lending Cash Central Fund. Any loaned securities are identified as such in the Schedule of Investments, and the value of loaned securities and cash collateral at period end, as applicable, are presented in the Statement of Assets and Liabilities. Security lending income represents the income earned on investing cash collateral, less rebates paid to borrowers and any lending agent fees associated with the loan, plus any premium payments received for lending certain types of securities. Security lending income is presented in the Statement of Operations as a component of income from Fidelity Central Funds. Affiliated security lending activity, if any, was as follows:
| | Total Security Lending Fees Paid to NFS ($) | Security Lending Income From Securities Loaned to NFS ($) | Value of Securities Loaned to NFS at Period End ($) |
| Fidelity International Capital Appreciation K6 Fund | 1,307 | - | - |
8. Expense Reductions.
Through arrangements with the Fund's custodian, credits realized as a result of certain uninvested cash balances were used to reduce the Fund's expenses by $321.
9. Other.
A fund's organizational documents provide former and current trustees and officers with a limited indemnification against liabilities arising in connection with the performance of their duties to the fund. In the normal course of business, a fund may also enter into contracts that provide general indemnifications. A fund's maximum exposure under these arrangements is unknown as this would be dependent on future claims that may be made against a fund. The risk of material loss from such claims is considered remote.
10. Risk and Uncertainties.
Many factors affect a fund's performance. Developments that disrupt global economies and financial markets, such as pandemics, epidemics, outbreaks of infectious diseases, war, terrorism, and environmental disasters, may significantly affect a fund's investment performance. The effects of these developments to a fund will be impacted by the types of securities in which a fund invests, the financial condition, industry, economic sector, and geographic location of an issuer, and a fund's level of investment in the securities of that issuer. Significant concentrations in security types, issuers, industries, sectors, and geographic locations may magnify the factors that affect a fund's performance.
Report of Independent Registered Public Accounting Firm
To the Board of Trustees of Fidelity Investment Trust and the Shareholders of Fidelity International Capital Appreciation K6 Fund:
Opinion on the Financial Statements and Financial Highlights
We have audited the accompanying statement of assets and liabilities of Fidelity International Capital Appreciation K6 Fund (the "Fund"), a fund of Fidelity Investment Trust, including the schedule of investments, as of October 31, 2024, the related statement of operations for the year then ended, the statement of changes in net assets for each of the two years in the period then ended, the financial highlights for each of the five years in the period then ended, and the related notes. In our opinion, the financial statements and financial highlights present fairly, in all material respects, the financial position of the Fund as of October 31, 2024, and the results of its operations for the year then ended, the changes in its net assets for each of the two years in the period then ended, and the financial highlights for each of the five years in the period then ended in conformity with accounting principles generally accepted in the United States of America.
Basis for Opinion
These financial statements and financial highlights are the responsibility of the Fund's management. Our responsibility is to express an opinion on the Fund's financial statements and financial highlights based on our audits. We are a public accounting firm registered with the Public Company Accounting Oversight Board (United States) (PCAOB) and are required to be independent with respect to the Fund in accordance with the U.S. federal securities laws and the applicable rules and regulations of the Securities and Exchange Commission and the PCAOB.
We conducted our audits in accordance with the standards of the PCAOB. Those standards require that we plan and perform the audit to obtain reasonable assurance about whether the financial statements and financial highlights are free of material misstatement, whether due to error or fraud. The Fund is not required to have, nor were we engaged to perform, an audit of its internal control over financial reporting. As part of our audits, we are required to obtain an understanding of internal control over financial reporting but not for the purpose of expressing an opinion on the effectiveness of the Fund's internal control over financial reporting. Accordingly, we express no such opinion.
Our audits included performing procedures to assess the risks of material misstatement of the financial statements and financial highlights, whether due to error or fraud, and performing procedures that respond to those risks. Such procedures included examining, on a test basis, evidence regarding the amounts and disclosures in the financial statements and financial highlights. Our audits also included evaluating the accounting principles used and significant estimates made by management, as well as evaluating the overall presentation of the financial statements and financial highlights. Our procedures included confirmation of securities owned as of October 31, 2024, by correspondence with the custodian and brokers; when replies were not received from brokers, we performed other auditing procedures. We believe that our audits provide a reasonable basis for our opinion.
/s/ Deloitte & Touche LLP
Boston, Massachusetts
December 16, 2024
We have served as the auditor of one or more of the Fidelity investment companies since 1999.
Distributions
(Unaudited)
The dividend and capital gains distributions for the fund(s) are available on Fidelity.com or Institutional.Fidelity.com.
The fund hereby designates as a capital gain dividend with respect to the taxable year ended October 31, 2024, $28,889,944, or, if subsequently determined to be different, the net capital gain of such year.
The fund designates 12% of the dividends distributed during the fiscal year as qualifying for the dividends-received deduction for corporate shareholders.
The fund designates 100% of the dividends distributed during the fiscal year as amounts which may be taken into account as a dividend for the purposes of the maximum rate under section 1(h)(11) of the Internal Revenue Code.
The amounts per share which represent income derived from sources within, and taxes paid to, foreign countries or possessions of the United States are $.0714 and $.0152 for the dividend paid December 4, 2023.
The fund will notify shareholders in January 2025 of amounts for use in preparing 2024 income tax returns.
Item 8: Changes in and Disagreements with Accountants for Open-End Management Investment Companies
(Unaudited)
Note: This is not applicable for any fund included in this document.
Item 9: Proxy Disclosures for Open-End Management Investment Companies
(Unaudited)
| A special meeting of shareholders was held on July 16, 2024. The results of votes taken among shareholders on the proposal before them are reported below. Each vote reported represents one dollar of net asset value held on the record date for the meeting. |
| Proposal 1 |
| To elect a Board of Trustees. |
| | # of Votes | % of Votes |
| Bettina Doulton |
| Affirmative | 128,529,177,643.56 | 98.18 |
| Withheld | 2,378,037,364.30 | 1.82 |
| TOTAL | 130,907,215,007.85 | 100.00 |
| Robert A. Lawrence |
| Affirmative | 128,253,389,899.05 | 97.97 |
| Withheld | 2,653,825,108.81 | 2.03 |
| TOTAL | 130,907,215,007.85 | 100.00 |
| Vijay C. Advani |
| Affirmative | 128,531,418,228.19 | 98.19 |
| Withheld | 2,375,796,779.66 | 1.81 |
| TOTAL | 130,907,215,007.85 | 100.00 |
| Thomas P. Bostick |
| Affirmative | 128,495,261,591.41 | 98.16 |
| Withheld | 2,411,953,416.44 | 1.84 |
| TOTAL | 130,907,215,007.85 | 100.00 |
| Donald F. Donahue |
| Affirmative | 128,407,878,996.00 | 98.09 |
| Withheld | 2,499,336,011.85 | 1.91 |
| TOTAL | 130,907,215,007.85 | 100.00 |
| Vicki L. Fuller |
| Affirmative | 128,625,540,095.19 | 98.26 |
| Withheld | 2,281,674,912.66 | 1.74 |
| TOTAL | 130,907,215,007.85 | 100.00 |
| Patricia L. Kampling |
| Affirmative | 128,668,729,281.34 | 98.29 |
| Withheld | 2,238,485,726.51 | 1.71 |
| TOTAL | 130,907,215,007.85 | 100.00 |
| Thomas A. Kennedy |
| Affirmative | 128,499,824,239.79 | 98.16 |
| Withheld | 2,407,390,768.06 | 1.84 |
| TOTAL | 130,907,215,007.85 | 100.00 |
| Oscar Munoz |
| Affirmative | 128,386,109,391.05 | 98.07 |
| Withheld | 2,521,105,616.80 | 1.93 |
| TOTAL | 130,907,215,007.85 | 100.00 |
| Karen B. Peetz |
| Affirmative | 128,603,731,113.82 | 98.24 |
| Withheld | 2,303,483,894.03 | 1.76 |
| TOTAL | 130,907,215,007.85 | 100.00 |
| David M. Thomas |
| Affirmative | 128,384,899,342.98 | 98.07 |
| Withheld | 2,522,315,664.88 | 1.93 |
| TOTAL | 130,907,215,007.85 | 100.00 |
| Susan Tomasky |
| Affirmative | 128,556,148,461.60 | 98.20 |
| Withheld | 2,351,066,546.25 | 1.80 |
| TOTAL | 130,907,215,007.85 | 100.00 |
| Michael E. Wiley |
| Affirmative | 128,264,934,978.34 | 97.98 |
| Withheld | 2,642,280,029.51 | 2.02 |
| TOTAL | 130,907,215,007.85 | 100.00 |
| | | |
| Proposal 1 reflects trust-wide proposal and voting results. |
Item 10: Remuneration Paid to Directors, Officers, and others of Open-End Management Investment Companies
(Unaudited)
Note: This information is disclosed as part of the financial statements for each Fund as part of Item 7: Financial Statements and Financial Highlights for Open-End Management Investment companies.
Item 11: Statement Regarding Basis for Approval of Investment Advisory Contract
(Unaudited)
Board Approval of Investment Advisory Contracts and Management Fees
Fidelity International Capital Appreciation K6 Fund
Each year, the Board of Trustees, including the Independent Trustees (together, the Board), considers the renewal of the fund's management contract with Fidelity Management & Research Company LLC (FMR) and the sub-advisory agreements (together, the Advisory Contracts) for the fund. FMR and the sub-advisers are referred to herein as the Investment Advisers. The Board, assisted by the advice of fund counsel and Independent Trustees' counsel, requests and considers a broad range of information relevant to the renewal of the Advisory Contracts throughout the year.
The Board meets regularly and, at each of its meetings, covers an extensive agenda of topics and materials and considers factors that are relevant to its annual consideration of the renewal of the fund's Advisory Contracts, including the services and support provided to the fund and its shareholders. The Board, acting directly and through its Committees (each of which is composed of and chaired by Independent Trustees), requests and receives information concerning the annual consideration of the renewal of the fund's Advisory Contracts. The Board also meets as needed to review matters specifically related to the Board's annual consideration of the renewal of the Advisory Contracts. Members of the Board may also meet with trustees of other Fidelity funds through joint ad hoc committees to discuss certain matters relevant to all of the Fidelity funds.
At its May 2024 meeting, the Board unanimously determined to renew the fund's Advisory Contracts. In reaching its determination, the Board considered all factors it believed relevant, including (i) the nature, extent, and quality of the services provided to the fund and its shareholders (including the investment performance of the fund); (ii) the competitiveness relative to peer funds of the fund's management fee and total expense ratio; (iii) the total costs of the services provided by and the profits realized by FMR and its affiliates (Fidelity) from its relationships with the fund; and (iv) the extent to which, if any, economies of scale exist and are realized as the fund grows, and whether any economies of scale are appropriately shared with fund shareholders. The Board also considered the broad range of investment choices available to shareholders from FMR's competitors and that the fund's shareholders have chosen to invest in the fund, which is part of the Fidelity family of funds. The Board's decision to renew the Advisory Contracts was not based on any single factor.
The Board reached a determination, with the assistance of fund counsel and Independent Trustees' counsel and through the exercise of its business judgment, that the renewal of the Advisory Contracts was in the best interests of the fund and its shareholders and that the compensation payable under the Advisory Contracts was fair and reasonable in light of all of the surrounding circumstances.
Nature, Extent, and Quality of Services Provided. The Board considered staffing as it relates to the fund, including the backgrounds and experience of investment personnel of the Investment Advisers, and also considered the Investment Advisers' implementation of the fund's investment program. The Independent Trustees also had discussions with senior management of Fidelity's investment operations and investment groups. The Board considered the structure of the investment personnel compensation program and whether this structure provides appropriate incentives to act in the best interests of the fund. Additionally, the Board considered the portfolio managers' investments, if any, in the funds that they manage.
Resources Dedicated to Investment Management and Support Services. The Board and the Fund Oversight and Research Committees reviewed the general qualifications and capabilities of Fidelity's investment staff, including its size, education, experience, and resources, as well as Fidelity's approach to recruiting, training, managing, and compensating investment personnel. The Board noted the resources devoted to expansion of Fidelity's global investment organization, and that Fidelity's analysts have extensive resources, tools, and capabilities that allow them to conduct sophisticated quantitative and fundamental analysis, as well as credit analysis of issuers, counterparties, and guarantors. Further, the Board considered that Fidelity's investment professionals have sufficient access to global information and data so as to provide competitive investment results over time, and that those professionals also have access to sophisticated tools that permit them to assess portfolio construction and risk and performance attribution characteristics continuously, as well as to transmit new information and research conclusions rapidly around the world. Additionally, in its deliberations, the Board considered Fidelity's trading, risk management, compliance, and technology and operations capabilities and resources, which are integral parts of the investment management process.
Shareholder and Administrative Services. The Board considered (i) the nature, extent, quality, and cost of advisory, administrative, and shareholder services performed by the Investment Advisers and their affiliates under the Advisory Contracts and under separate agreements covering transfer agency and pricing and bookkeeping services for the fund; (ii) the nature and extent of Fidelity's supervision of third party service providers, principally custodians, subcustodians, and pricing vendors; and (iii) the resources devoted by Fidelity to, and the record of compliance with, the fund's compliance policies and procedures. The Board also reviewed the allocation of fund brokerage, including allocations to brokers affiliated with the Investment Advisers, the use of brokerage commissions to pay fund expenses, and the use of "soft" commission dollars to pay for research services. The Board also considered the fund's securities lending activities and any payments made to Fidelity relating to securities lending under a separate agreement.
The Board noted that the growth of fund assets over time across the complex allows Fidelity to reinvest in the development of services designed to enhance the value and convenience of the Fidelity funds as investment vehicles. These services include 24-hour access to account information and market information over the Internet and through telephone representatives, investor education materials, and asset allocation tools. The Board also considered that it reviews customer service metrics such as telephone response times, continuity of services on the website and metrics addressing services at Fidelity Investor Centers.
Investment in a Large Fund Family. The Board considered the benefits to shareholders of investing in a fund that is part of a large family of funds offering a variety of investment disciplines and providing a large variety of fund investor services. The Board noted that Fidelity had taken, or had made recommendations that resulted in the Fidelity funds taking, a number of actions over the previous year that benefited particular funds and/or the Fidelity funds in general.
Investment Performance. The Board took into account discussions that occur with representatives of the Investment Advisers, and reports that it receives, at Board meetings throughout the year, relating to fund investment performance. In this regard the Board noted that as part of regularly scheduled fund reviews and other reports to the Board on fund performance, the Board considered annualized return information for the fund for different time periods, measured against an appropriate securities market index (benchmark index) and an appropriate peer group of funds with similar objectives (peer group). The Board also considered information about performance attribution. In its ongoing evaluation of fund investment performance, the Board gives particular attention to information indicating changes in performance of the funds over different time periods and discussed with the Investment Advisers the reasons for any overperformance or underperformance.
In addition to reviewing absolute and relative fund performance, the Independent Trustees periodically consider the appropriateness of fund performance metrics in evaluating the results achieved. The Independent Trustees generally give greater weight to fund performance over longer time periods than over shorter time periods. Depending on the circumstances, the Independent Trustees may be satisfied with a fund's performance notwithstanding that it lags its benchmark index or peer group for certain periods.
Based on its review, the Board concluded that the nature, extent, and quality of services provided to the fund under the Advisory Contracts should continue to benefit the shareholders of the fund.
Competitiveness of Management Fee and Total Expense Ratio. The Board was provided with information regarding industry trends in management fees and expenses. In its review of the fund's management fee and total expense ratio, the Board considered the fund's unitary fee rate as well as other fund expenses paid by FMR under the fund's management contract, such as transfer agent fees, pricing and bookkeeping fees, and custodial, legal, and audit fees. The Board noted that Fidelity may agree to waive fees or reimburse expenses from time to time, and the extent to which, if any, it has done so for the fund.
Comparisons of Management Fees and Total Expense Ratios. Among other things, the Board reviewed data for selected groups of competitive funds and classes (referred to as "mapped groups") that were compiled by Fidelity based on combining similar investment objective categories (as classified by Morningstar) that have comparable investment mandates. The data reviewed by the Board included (i) gross management fee comparisons (before taking into account expense reimbursements or caps) relative to the total universe of funds within the mapped group; (ii) gross management fee comparisons relative to a subset of non-Fidelity funds in the mapped group that are similar in size and management fee structure to the fund (referred to as the "asset size peer group"); (iii) total expense comparisons of the fund relative to funds and classes in the mapped group that have a similar sales load structure to the fund (referred to as the "similar sales load structure group"); and (iv) total expense comparisons of the fund relative to funds and classes in the similar sales load structure group that are similar in size and management fee structure to the fund (referred to as the "total expense asset size peer group"). The total expense asset size peer group comparison excludes performance adjustments and fund-paid 12b-1 fees to eliminate variability in fee structures.
The information provided to the Board indicated that the fund's management fee rate ranked below the competitive median of the mapped group for the 12-month period ended September 30, 2023 and below the competitive median of the asset size peer group for the 12-month period ended September 30, 2023. Further, the information provided to the Board indicated that the total expense ratio of the fund ranked below the competitive median of the similar sales load structure group for the 12-month period ended September 30, 2023 and below the competitive median of the total expense asset size peer group for the 12-month period ended September 30, 2023.
Fees Charged to Other Fidelity Clients. The Board also considered Fidelity fee structures and other information with respect to clients of Fidelity, such as other funds advised or subadvised by Fidelity, pension plan clients, and other institutional clients with similar mandates. The Board noted that a joint ad hoc committee created by it and the boards of other Fidelity funds periodically reviews and compares Fidelity's institutional investment advisory business with its business of providing services to the Fidelity funds and also noted the most recent findings of the committee. The Board noted that the committee's review included a consideration of the differences in services provided, fees charged, and costs incurred, as well as competition in the markets serving the different categories of clients.
Based on its review, the Board concluded that the fund's management fee is fair and reasonable in light of the services that the fund receives and the other factors considered. Further, based on its review of total expense ratios and fees charged to other Fidelity clients, the Board concluded that the fund's total expense ratio was reasonable in light of the services that the fund and its shareholders receive and the other factors considered.
Costs of the Services and Profitability. The Board considered the revenues earned and the expenses incurred by Fidelity in conducting the business of developing, marketing, distributing, managing, administering and servicing the fund and servicing the fund's shareholders. The Board also considered the level of Fidelity's profits in respect of all the Fidelity funds.
On an annual basis, Fidelity presents to the Board information about the profitability of its relationships with the fund. Fidelity calculates profitability information for each fund, as well as aggregate profitability information for groups of Fidelity funds and all Fidelity funds, using a series of detailed revenue and cost allocation methodologies which originate with the books and records of Fidelity on which Fidelity's audited financial statements are based. The Audit Committee of the Board reviews any significant changes from the prior year's methodologies.
A public accounting firm has been engaged annually by the Board as part of the Board's assessment of Fidelity's profitability analysis. The engagement includes the review and assessment of the methodologies used by Fidelity in determining the revenues and expenses attributable to Fidelity's fund business, and completion of agreed-upon procedures in respect of the mathematical accuracy of certain fund profitability information and its conformity to established allocation methodologies. After considering the reports issued under the engagement and information provided by Fidelity, the Board concluded that while other allocation methods may also be reasonable, Fidelity's profitability methodologies are reasonable in all material respects.
The Board also reviewed Fidelity's non-fund businesses and potential indirect benefits such businesses may have received as a result of their association with Fidelity's fund business (i.e., fall-out benefits) as well as cases where Fidelity's affiliates may benefit from the funds' business. The Board considered areas where potential indirect benefits to the Fidelity funds from their relationships with Fidelity may exist. The Board's consideration of these matters was informed by the findings of a joint ad hoc committee created by it and the boards of other Fidelity funds to evaluate potential fall-out benefits.
The Board considered the costs of the services provided by and the profits realized by Fidelity in connection with the operation of the fund and was satisfied that the profitability was not excessive.
Economies of Scale. The Board considered whether there have been economies of scale in respect of the management of the Fidelity funds, whether the Fidelity funds (including the fund) have appropriately benefited from any such economies of scale, and whether there is potential for realization of any further economies of scale. The Board considered the extent to which the fund will benefit from economies of scale as assets grow through increased services to the fund, through waivers or reimbursements, or through fee or expense ratio reductions. The Board recognized that, due to the fund's current contractual arrangements, its expense ratio will not decline if the fund's operating costs decrease as assets grow, or rise as assets decrease. The Board also noted that a committee created by it and the boards of other Fidelity funds periodically analyzes whether Fidelity attains economies of scale in respect of the management and servicing of the Fidelity funds, whether the Fidelity funds have appropriately benefited from such economies of scale, and whether there is potential for realization of any further economies of scale.
The Board concluded, taking into account the analysis of the committee, that economies of scale, if any, are being appropriately shared between fund shareholders and Fidelity.
Additional Information Requested by the Board. In order to develop fully the factual basis for consideration of the Fidelity funds' advisory contracts, the Board requested and received additional information on certain topics, including but not limited to: (i) fund flow and performance trends, in particular the underperformance of certain funds and strategies, and Fidelity's long-term strategies for certain funds; (ii) the operation of performance fees and the rationale for implementing performance fees on certain categories of funds but not others; (iii) Fidelity's pricing philosophy compared to competitors; (iv) fund profitability methodology and data; (v) evaluation of competitive fund data and peer group classifications and fee and expense comparisons; (vi) the management fee and expense structures for different funds and classes and information about the differences between various fee and expense structures; (vii) the variable management fee implemented for certain funds effective March 1, 2024; and (viii) information regarding other accounts managed by Fidelity and the funds' sub-advisory arrangements.
Conclusion. Based on its evaluation of all of the conclusions noted above, and after considering all factors it believed relevant, the Board, including the Independent Trustees, concluded that the advisory and sub-advisory fee arrangements are fair and reasonable in light of all of the surrounding circumstances and that the fund's Advisory Contracts should be renewed through May 31, 2025.
1.9883991.107
IVFK6-ANN-1224
Item 8.
Changes in and Disagreements with Accountants for Open-End Management Investment Companies
See Item 7.
Item 9.
Proxy Disclosures for Open-End Management Investment Companies
See Item 7.
Item 10.
Remuneration Paid to Directors, Officers, and Others of Open-End Management Investment Companies
See Item 7.
Item 11.
Statement Regarding Basis for Approval of Investment Advisory Contract
See Item 7.
Item 12.
Disclosure of Proxy Voting Policies and Procedures for Closed-End Management Investment Companies
Not applicable.
Item 13.
Portfolio Managers of Closed-End Management Investment Companies
Not applicable.
Item 14.
Purchase of Equity Securities by Closed-End Management Investment Company and Affiliated Purchasers
Not applicable.
Item 15.
Submission of Matters to a Vote of Security Holders
There were no material changes to the procedures by which shareholders may recommend nominees to the trust’s Board of Trustees.
Item 16.
Controls and Procedures
(a)(i) The President and Treasurer and the Chief Financial Officer have concluded that the trust’s disclosure controls and procedures (as defined in Rule 30a-3(c) under the Investment Company Act) provide reasonable assurances that material information relating to the trust is made known to them by the appropriate persons, based on their evaluation of these controls and procedures as of a date within 90 days of the filing date of this report.
(a)(ii) There was no change in the trust’s internal control over financial reporting (as defined in Rule 30a-3(d) under the Investment Company Act) that occurred during the period covered by this report that has materially affected, or is reasonably likely to materially affect, the trust’s internal control over financial reporting.
Item 17.
Disclosure of Securities Lending Activities for Closed-End Management Investment Companies
Not applicable.
Item 18.
Recovery of Erroneously Awarded Compensation
(a)
Not applicable.
(b)
Not applicable.
Item 19.
Exhibits
SIGNATURES
Pursuant to the requirements of the Securities Exchange Act of 1934 and the Investment Company Act of 1940, the registrant has duly caused this report to be signed on its behalf by the undersigned, thereunto duly authorized.
Fidelity Investment Trust
|
By: | /s/Stacie M. Smith |
| Stacie M. Smith |
| President and Treasurer (Principal Executive Officer) |
|
|
Date: | December 20, 2024 |
Pursuant to the requirements of the Securities Exchange Act of 1934 and the Investment Company Act of 1940, this report has been signed below by the following persons on behalf of the registrant and in the capacities and on the dates indicated.
|
By: | /s/Stacie M. Smith |
| Stacie M. Smith |
| President and Treasurer (Principal Executive Officer) |
|
|
Date: | December 20, 2024 |
|
By: | /s/Stephanie Caron |
| Stephanie Caron |
| Chief Financial Officer (Principal Financial Officer) |
|
|
Date: | December 20, 2024 |