UNITED STATES
SECURITIES AND EXCHANGE COMMISSION
Washington, D.C. 20549
FORM N-CSR
CERTIFIED SHAREHOLDER REPORT OF REGISTERED
MANAGEMENT INVESTMENT COMPANIES
Investment Company Act file number 811-4008
Fidelity Investment Trust
(Exact name of registrant as specified in charter)
245 Summer St., Boston, Massachusetts 02210
(Address of principal executive offices) (Zip code)
Marc Bryant, Secretary
245 Summer St.
Boston, Massachusetts 02210
(Name and address of agent for service)
Registrant's telephone number, including area code: 617-563-7000
Date of fiscal year end: | October 31 |
| |
Date of reporting period: | October 31, 2015 |
This report on Form N-CSR relates solely to the Registrant's Fidelity Emerging Europe, Middle East, Africa (EMEA) Fund, Fidelity Emerging Markets Discovery Fund, Fidelity Global Commodity Stock Fund, Fidelity Global Equity Income Fund, Fidelity International Discovery Fund, Fidelity International Growth Fund, Fidelity International Small Cap Fund, Fidelity International Small Cap Opportunities Fund, Fidelity International Value Fund, Fidelity Series Emerging Markets Fund, Fidelity Series International Growth Fund, Fidelity Series International Small Cap Fund, Fidelity Series International Value Fund, Fidelity Total Emerging Markets Fund, and Fidelity Total International Equity Fund (each, a "Fund" and collectively, the "Funds").
Item 1. Reports to Stockholders
ContentsPerformance: The Bottom LineManagement's Discussion of Fund PerformanceShareholder Expense ExampleInvestment Changes (Unaudited)Investments October 31, 2015Financial StatementsNotes to Financial StatementsReport of Independent Registered Public Accounting FirmTrustees and OfficersDistributions (Unaudited)Board Approval of Investment Advisory Contracts and Management Fees
(Fidelity Investment logo)(registered trademark)
Fidelity Advisor®
International Small Cap Opportunities
Fund - Class A, Class T, Class B
and Class C
Annual Report
October 31, 2015
(Fidelity Cover Art)
Class A, Class T, Class B
and Class C are classes of
Fidelity® International
Small Cap Opportunities Fund
Contents
Performance | (Click Here) | How the fund has done over time. |
Management's Discussion of Fund Performance | (Click Here) | The Portfolio Manager's review of fund performance and strategy. |
Shareholder Expense Example | (Click Here) | An example of shareholder expenses. |
Investment Changes | (Click Here) | A summary of major shifts in the fund's investments over the past six months. |
Investments | (Click Here) | A complete list of the fund's investments with their market values. |
Financial Statements | (Click Here) | Statements of assets and liabilities, operations, and changes in net assets, as well as financial highlights. |
Notes | (Click Here) | Notes to the financial statements. |
Report of Independent Registered Public Accounting Firm | (Click Here) | |
Trustees and Officers | (Click Here) | |
Distributions | (Click Here) | |
Board Approval of Investment Advisory Contracts and Management Fees | (Click Here) | |
To view a fund's proxy voting guidelines and proxy voting record for the 12-month period ended June 30, visit http://www.fidelity.com/proxyvotingresults or visit the Securities and Exchange Commission's (SEC) web site at http://www.sec.gov. You may also call 1-877-208-0098 to request a free copy of the proxy voting guidelines.
Standard & Poor's, S&P and S&P 500 are registered service marks of The McGraw-Hill Companies, Inc. and have been licensed for use by Fidelity Distributors Corporation.
Other third-party marks appearing herein are the property of their respective owners.
All other marks appearing herein are registered or unregistered trademarks or service marks of FMR LLC or an affiliated company. © 2015 FMR LLC. All rights reserved.
Annual Report
This report and the financial statements contained herein are submitted for the general information of the shareholders of the fund. This report is not authorized for distribution to prospective investors in the fund unless preceded or accompanied by an effective prospectus.
A fund files its complete schedule of portfolio holdings with the SEC for the first and third quarters of each fiscal year on Form N-Q. Forms N-Q are available on the SEC's web site at http://www.sec.gov. A fund's Forms N-Q may be reviewed and copied at the SEC's Public Reference Room in Washington, DC. Information regarding the operation of the SEC's Public Reference Room may be obtained by calling 1-800-SEC-0330. For a complete list of a fund's portfolio holdings, view the most recent holdings listing, semiannual report, or annual report on Fidelity's web site at http://www.fidelity.com, http://www.advisor.fidelity.com, or http://www.401k.com, as applicable.
NOT FDIC INSURED • MAY LOSE VALUE • NO BANK GUARANTEE
Neither the fund nor Fidelity Distributors Corporation is a bank.
Annual Report
Average annual total return reflects the change in the value of an investment, assuming reinvestment of the class' distributions from dividend income and capital gains (the profits earned upon the sale of securities that have grown in value, if any) and assuming a constant rate of performance each year. The $10,000 table and the fund's returns do not reflect the deduction of taxes that a shareholder would pay on fund distributions or the redemption of fund shares. During periods of reimbursement by Fidelity, a fund's total return will be greater than it would be had the reimbursement not occurred. How a fund did yesterday is no guarantee of how it will do tomorrow. Returns reflect the conversion of Class B shares to Class A shares after a maximum of seven years.
Average Annual Total Returns
Periods ended October 31, 2015 | Past 1
year | Past 5
years | Past 10
years |
Class A (incl. 5.75% sales charge) | 2.38% | 8.29% | 4.89% |
Class T (incl. 3.50% sales charge) | 4.48% | 8.53% | 4.88% |
Class B (incl. contingent deferred sales charge) A | 2.81% | 8.48% | 4.98% |
Class C (incl. contingent deferred sales charge) B | 6.79% | 8.76% | 4.73% |
A Class B shares' contingent deferred sales charges included in the past one year, past five years, and life of fund total return figures are 5%, 2%, and 0%, respectively.
B Class C shares' contingent deferred sales charges included in the past one year, past five years, and life of fund total return figures are 1%, 0%, and 0%, respectively.
Annual Report
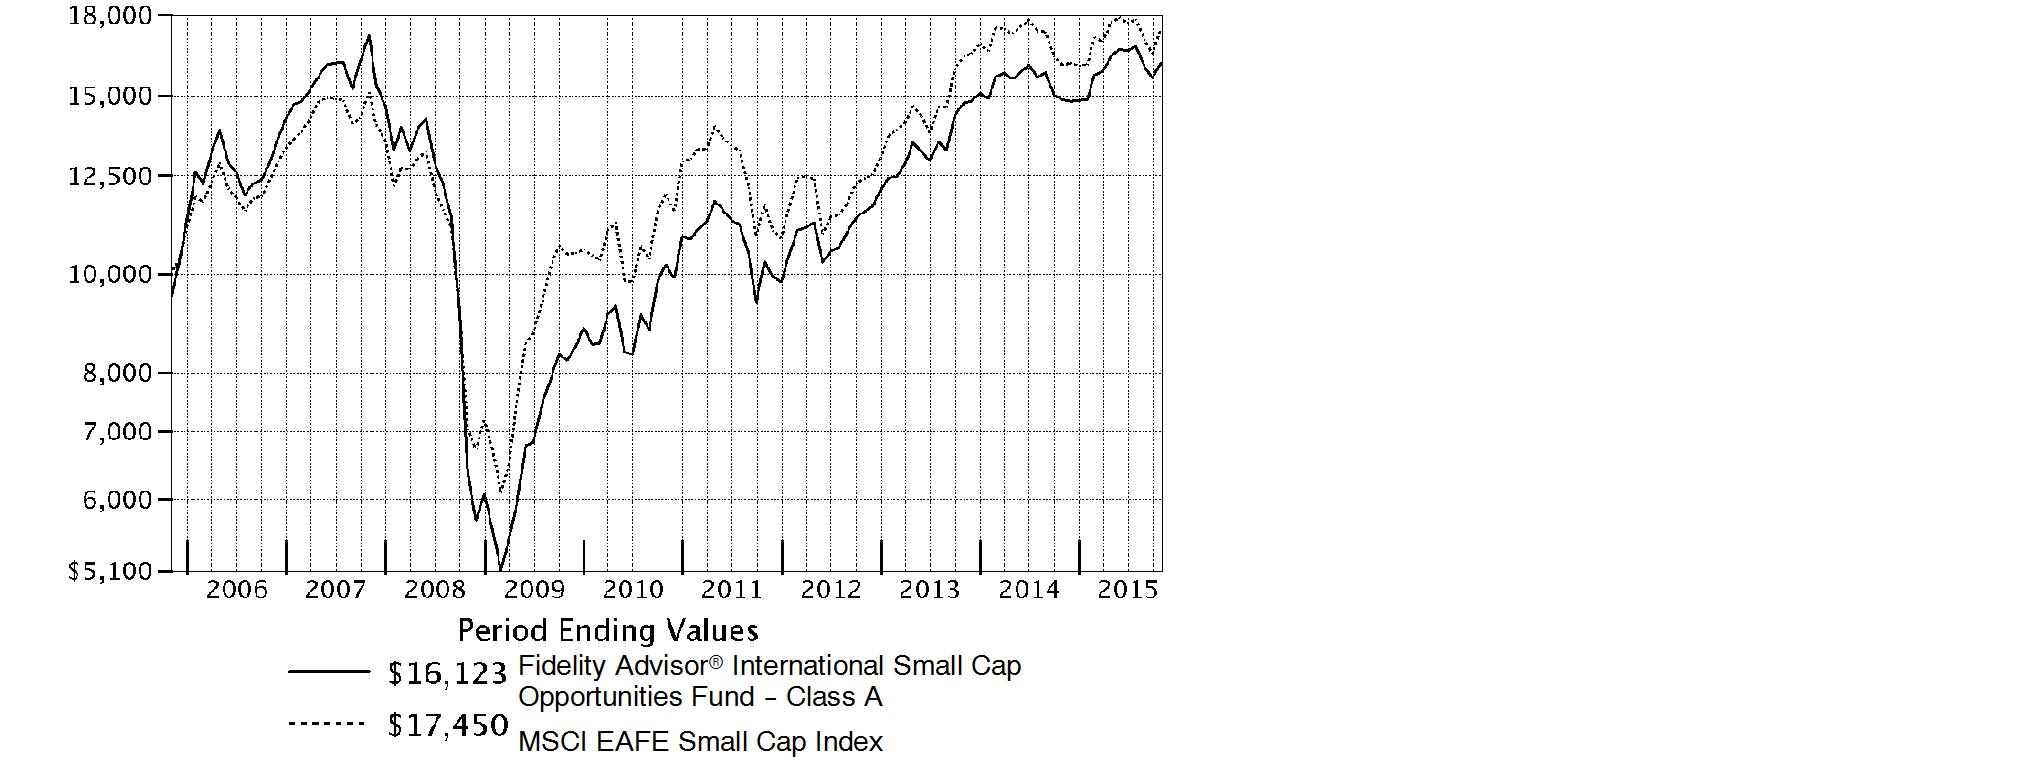
$10,000 Over 10 Years
Let's say hypothetically that $10,000 was invested in Fidelity Advisor® International Small Cap Opportunities Fund - Class A on October 31, 2005 and the current 5.75% sales charge was paid. The chart shows how the value of your investment would have changed, and also shows how the MSCI EAFE Small Cap Index performed over the same period.
Annual Report
Market Recap: International equities suffered a moderate setback for the 12 months ending October 31, 2015, held back by a collapse in commodities prices that hurt resources-related sectors and geographies. The MSCI ACWI (All Country World Index) ex USA Index returned -4.55% for the period, affected also by concerns about global economic growth. Commodity producers remained under pressure for much of the past year, largely related to economic deceleration in China (-1%), the world's second-largest economy and a leading consumer of raw materials. This effect was exacerbated by U.S. dollar strength relative to global currencies, which weighed on commodities priced in dollars and acutely impacted equity returns within regions most exposed to resources prices. The emerging-markets group, for example, returned about -15% this period. Canada, a significant energy producer, returned roughly -17%. Net energy consumer Japan (+9%) was the best-performing region by far. Only about a quarter of the nearly 50 index countries managed a gain this period: Ireland (+19%) - the EU's fastest-growing economy - and Israel (+17%) proved top performers; Greece (-56%) and Brazil (-46%), among the worst. As for sectors, energy (-25%) and materials (-16%) declined sharply, whereas the two consumer sectors each gained about 6%.
Comments from Portfolio Manager Jed Weiss: For the year, the fund's share classes (excluding sales charges, if applicable) produced solid gains that were roughly in line with the 8.55% gain of the benchmark MSCI EAFE Small Cap Index. Relative to the benchmark, stock picking in the consumer discretionary, information technology and health care sectors was strong, whereas security selection in materials and, to a lesser extent, consumer staples hurt. In country terms, underweightings in Australia, Hong Kong and Singapore helped, as did stock picks in Germany and South Korea. Conversely, positioning in Canada detracted, along with security selection in Japan and several European markets. Another negative was the fund's fair-value pricing adjustment. Our biggest individual contributor was BGF Retail, a South Korean convenience-store retailer that wasn't part of our benchmark. Also contributing was SS&C Technologies Holdings, a provider of back-office software for asset managers. In contrast, non-index energy companies Pason Systems and ShawCor were particularly big detractors this period. Another detractor was Turkey-based Coca-Cola Icecek Sanayi. I sold the fund's stake in this owner of the Coca-Cola bottling franchise in various emerging markets and reinvested the proceeds in other stocks I thought offered a better risk/reward balance.
The views expressed above reflect those of the portfolio manager(s) only through the end of the period as stated on the cover of this report and do not necessarily represent the views of Fidelity or any other person in the Fidelity organization. Any such views are subject to change at any time based upon market or other conditions and Fidelity disclaims any responsibility to update such views. These views may not be relied on as investment advice and, because investment decisions for a Fidelity fund are based on numerous factors, may not be relied on as an indication of trading intent on behalf of any Fidelity fund.
Annual Report
Shareholder Expense Example
As a shareholder of the Fund, you incur two types of costs: (1) transaction costs, including sales charges (loads) on purchase payments or redemption proceeds, redemption fees and (2) ongoing costs, including management fees, distribution and/or service (12b-1) fees and other Fund expenses. This Example is intended to help you understand your ongoing costs (in dollars) of investing in the Fund and to compare these costs with the ongoing costs of investing in other mutual funds.
The Example is based on an investment of $1,000 invested at the beginning of the period and held for the entire period (May 1, 2015 to October 31, 2015).
Actual Expenses
The first line of the accompanying table for each class of the Fund provides information about actual account values and actual expenses. You may use the information in this line, together with the amount you invested, to estimate the expenses that you paid over the period. Simply divide your account value by $1,000.00 (for example, an $8,600 account value divided by $1,000.00 = 8.6), then multiply the result by the number in the first line for a class of the Fund under the heading entitled "Expenses Paid During Period" to estimate the expenses you paid on your account during this period. A small balance maintenance fee of $12.00 that is charged once a year may apply for certain accounts with a value of less than $2,000. This fee is not included in the table below. If it was, the estimate of expenses you paid during the period would be higher, and your ending account value lower, by this amount. In addition, the Fund, as a shareholder in the underlying Fidelity Central Funds, will indirectly bear its pro-rata share of the fees and expenses incurred by the underlying Fidelity Central Funds. These fees and expenses are not included in the Fund's annualized expense ratio used to calculate the expense estimate in the table below.
Hypothetical Example for Comparison Purposes
The second line of the accompanying table for each class of the Fund provides information about hypothetical account values and hypothetical expenses based on a Class' actual expense ratio and an assumed rate of return of 5% per year before expenses, which is not the Class' actual return. The hypothetical account values and expenses may not be used to estimate the actual ending account balance or expenses you paid for the period. You may use this information to compare the ongoing costs of investing in the Fund and other funds. To do so, compare this 5% hypothetical example with the 5% hypothetical examples that appear in the shareholder reports of the other funds. A small balance maintenance fee of $12.00 that is charged once a year may apply for certain accounts with a value of less than $2,000. This fee is not included in the table below. If it was, the estimate of expenses you paid during the period would be higher, and your ending account value lower, by this amount. In addition, the Fund, as a shareholder in the underlying Fidelity Central Funds, will indirectly bear its pro-rata share of the fees and expenses incurred by the underlying Fidelity Central Funds. These fees and expenses are not included in the Fund's annualized expense ratio used to calculate the expense estimate in the table below.
Please note that the expenses shown in the table are meant to highlight your ongoing costs only and do not reflect any transaction costs. Therefore, the second line of the table is useful in comparing ongoing costs only, and will not help you determine the relative total costs of owning different funds. In addition, if these transactional costs were included, your costs would have been higher.
Annual Report
| Annualized
Expense Ratio B | Beginning
Account Value
May 1, 2015 | Ending
Account Value
October 31, 2015 | Expenses Paid
During PeriodC
May 1, 2015
to October 31, 2015 |
Class A | 1.49% | | | |
Actual | | $ 1,000.00 | $ 985.30 | $ 7.46 |
HypotheticalA | | $ 1,000.00 | $ 1,017.69 | $ 7.58 |
Class T | 1.78% | | | |
Actual | | $ 1,000.00 | $ 983.80 | $ 8.90 |
HypotheticalA | | $ 1,000.00 | $ 1,016.23 | $ 9.05 |
Class B | 2.26% | | | |
Actual | | $ 1,000.00 | $ 982.20 | $ 11.29 |
HypotheticalA | | $ 1,000.00 | $ 1,013.81 | $ 11.47 |
Class C | 2.25% | | | |
Actual | | $ 1,000.00 | $ 982.10 | $ 11.24 |
HypotheticalA | | $ 1,000.00 | $ 1,013.86 | $ 11.42 |
International Small Cap Opportunities | 1.20% | | | |
Actual | | $ 1,000.00 | $ 987.40 | $ 6.01 |
HypotheticalA | | $ 1,000.00 | $ 1,019.16 | $ 6.11 |
Class I | 1.18% | | | |
Actual | | $ 1,000.00 | $ 987.40 | $ 5.91 |
HypotheticalA | | $ 1,000.00 | $ 1,019.26 | $ 6.01 |
A 5% return per year before expenses
B Annualized expense ratio reflects expenses net of applicable fee waivers.
C Expenses are equal to each Class' annualized expense ratio, multiplied by the average account value over the period, multiplied by 184/365 (to reflect the one-half year period).
Annual Report
Investment Changes (Unaudited)

Annual Report
Asset Allocation as of October 31, 2015 |
| % of fund's
net assets | % of fund's net assets
6 months ago |
Stocks | 91.8 | 96.7 |
Short-Term Investments and Net Other Assets (Liabilities) | 8.2 | 3.3 |
Top Ten Stocks as of October 31, 2015 |
| % of fund's
net assets | % of fund's net assets
6 months ago |
USS Co. Ltd. (Japan, Specialty Retail) | 2.0 | 2.2 |
CTS Eventim AG (Germany, Media) | 2.0 | 1.7 |
Unite Group PLC (United Kingdom, Real Estate Management & Development) | 1.9 | 1.8 |
OBIC Co. Ltd. (Japan, IT Services) | 1.8 | 1.1 |
Berendsen PLC (United Kingdom, Commercial Services & Supplies) | 1.7 | 1.4 |
Intrum Justitia AB (Sweden, Commercial Services & Supplies) | 1.7 | 1.3 |
Spirax-Sarco Engineering PLC (United Kingdom, Machinery) | 1.6 | 1.7 |
Sartorius AG (non-vtg.) (Germany, Health Care Equipment & Supplies) | 1.6 | 1.2 |
Bellway PLC (United Kingdom, Household Durables) | 1.5 | 1.2 |
SS&C Technologies Holdings, Inc. (United States of America, Software) | 1.5 | 1.6 |
| 17.3 | |
Market Sectors as of October 31, 2015 |
| % of fund's
net assets | % of fund's net assets
6 months ago |
Consumer Discretionary | 20.5 | 19.3 |
Financials | 18.7 | 19.7 |
Industrials | 18.3 | 20.6 |
Information Technology | 9.2 | 9.9 |
Health Care | 8.5 | 7.1 |
Consumer Staples | 8.5 | 9.3 |
Materials | 6.7 | 8.4 |
Energy | 1.4 | 2.4 |
Annual Report
Investments October 31, 2015
Showing Percentage of Net Assets
Common Stocks - 90.2% |
| Shares | | Value |
Australia - 2.0% |
DuluxGroup Ltd. | 1,324,143 | | $ 5,536,022 |
Imdex Ltd. (a) | 2,238,840 | | 357,061 |
RCG Corp. Ltd. | 5,554,148 | | 5,661,712 |
Sydney Airport unit | 684,757 | | 3,129,413 |
TFS Corp. Ltd. (d) | 3,227,274 | | 4,028,552 |
TOTAL AUSTRALIA | | 18,712,760 |
Austria - 1.2% |
Andritz AG | 139,900 | | 7,045,919 |
Zumtobel AG | 179,381 | | 4,083,206 |
TOTAL AUSTRIA | | 11,129,125 |
Bailiwick of Jersey - 0.4% |
Integrated Diagnostics Holdings PLC (a) | 746,300 | | 4,112,113 |
Belgium - 1.3% |
Gimv NV | 56,688 | | 2,663,658 |
KBC Ancora | 254,438 | | 10,106,114 |
TOTAL BELGIUM | | 12,769,772 |
Bermuda - 0.5% |
Petra Diamonds Ltd. | 1,163,909 | | 1,339,432 |
Vostok New Ventures Ltd. SDR (a) | 527,689 | | 3,366,171 |
TOTAL BERMUDA | | 4,705,603 |
British Virgin Islands - 0.1% |
Gem Diamonds Ltd. | 719,096 | | 1,097,473 |
Canada - 1.9% |
Cara Operations Ltd. | 210,400 | | 5,705,708 |
McCoy Global, Inc. | 629,100 | | 1,424,087 |
New Look Vision Group, Inc. | 172,200 | | 3,950,749 |
Pason Systems, Inc. | 334,600 | | 4,923,298 |
ShawCor Ltd. Class A | 114,500 | | 2,429,929 |
TOTAL CANADA | | 18,433,771 |
Cayman Islands - 0.5% |
58.com, Inc. ADR (a)(d) | 37,900 | | 1,989,371 |
Value Partners Group Ltd. | 2,462,000 | | 2,607,054 |
TOTAL CAYMAN ISLANDS | | 4,596,425 |
Common Stocks - continued |
| Shares | | Value |
Denmark - 1.6% |
Jyske Bank A/S (Reg.) (a) | 169,127 | | $ 8,256,423 |
Spar Nord Bank A/S | 746,369 | | 7,152,976 |
TOTAL DENMARK | | 15,409,399 |
Finland - 0.5% |
Tikkurila Oyj | 267,746 | | 4,913,985 |
France - 1.5% |
Laurent-Perrier Group SA | 39,793 | | 3,447,722 |
Vetoquinol SA | 69,184 | | 2,902,383 |
Virbac SA | 41,252 | | 8,226,537 |
TOTAL FRANCE | | 14,576,642 |
Germany - 4.1% |
alstria office REIT-AG (d) | 281,000 | | 3,922,776 |
CompuGroup Medical AG | 328,478 | | 9,680,450 |
CTS Eventim AG | 488,280 | | 19,117,645 |
Fielmann AG | 96,874 | | 6,791,128 |
TOTAL GERMANY | | 39,511,999 |
Greece - 0.4% |
Titan Cement Co. SA (Reg.) | 180,680 | | 3,963,761 |
India - 0.6% |
Jyothy Laboratories Ltd. | 1,124,354 | | 5,273,764 |
Ireland - 1.2% |
Dalata Hotel Group PLC (a) | 32,402 | | 161,051 |
FBD Holdings PLC | 240,328 | | 1,836,723 |
James Hardie Industries PLC: | | | |
CDI | 165,775 | | 2,145,974 |
sponsored ADR (d) | 564,575 | | 7,424,161 |
TOTAL IRELAND | | 11,567,909 |
Isle of Man - 0.2% |
Playtech Ltd. | 135,589 | | 1,789,245 |
Israel - 1.4% |
Azrieli Group | 104,005 | | 4,075,096 |
Ituran Location & Control Ltd. | 106,586 | | 2,174,354 |
Sarine Technologies Ltd. | 1,497,700 | | 1,664,729 |
Strauss Group Ltd. (a) | 366,044 | | 5,243,999 |
TOTAL ISRAEL | | 13,158,178 |
Italy - 4.3% |
Azimut Holding SpA | 526,997 | | 12,685,523 |
Common Stocks - continued |
| Shares | | Value |
Italy - continued |
Banco di Desio e della Brianza SpA (d) | 940,000 | | $ 3,216,784 |
Beni Stabili SpA SIIQ | 13,645,675 | | 11,239,094 |
Interpump Group SpA | 947,943 | | 13,968,234 |
TOTAL ITALY | | 41,109,635 |
Japan - 26.0% |
Aoki Super Co. Ltd. | 203,000 | | 2,147,019 |
Artnature, Inc. | 628,500 | | 6,043,267 |
Asahi Co. Ltd. | 463,200 | | 4,549,641 |
Asia Securities Printing Co. Ltd. | 644,800 | | 4,752,487 |
Autobacs Seven Co. Ltd. | 307,000 | | 5,383,421 |
Azbil Corp. | 436,300 | | 11,007,498 |
Broadleaf Co. Ltd. | 77,800 | | 891,167 |
Coca-Cola Central Japan Co. Ltd. | 383,300 | | 5,387,042 |
Daiichikosho Co. Ltd. | 194,600 | | 6,490,308 |
Daikokutenbussan Co. Ltd. | 168,700 | | 5,795,204 |
GCA Savvian Group Corp. | 372,900 | | 4,378,352 |
Glory Ltd. | 288,100 | | 7,288,736 |
Goldcrest Co. Ltd. | 422,130 | | 7,898,257 |
Iwatsuka Confectionary Co. Ltd. | 50,400 | | 2,605,131 |
Japan Digital Laboratory Co. | 334,800 | | 4,280,994 |
Kobayashi Pharmaceutical Co. Ltd. | 115,000 | | 8,915,752 |
Koshidaka Holdings Co. Ltd. | 166,900 | | 3,021,378 |
Lasertec Corp. | 330,236 | | 3,603,891 |
Medikit Co. Ltd. | 105,000 | | 3,130,875 |
Meiko Network Japan Co. Ltd. | 112,600 | | 1,336,814 |
Miraial Co. Ltd. | 73,200 | | 710,087 |
Nagaileben Co. Ltd. | 472,600 | | 8,055,401 |
ND Software Co. Ltd. | 71,982 | | 830,895 |
Nihon Parkerizing Co. Ltd. | 1,048,000 | | 9,322,239 |
Nippon Seiki Co. Ltd. | 177,000 | | 3,709,206 |
NS Tool Co. Ltd. (d) | 35,600 | | 618,104 |
OBIC Co. Ltd. | 319,500 | | 16,862,249 |
OSG Corp. | 663,600 | | 12,482,431 |
Paramount Bed Holdings Co. Ltd. | 198,500 | | 6,366,919 |
San-Ai Oil Co. Ltd. | 620,000 | | 4,735,609 |
Seven Bank Ltd. | 2,768,800 | | 12,616,191 |
SHO-BOND Holdings Co. Ltd. | 263,700 | | 10,472,846 |
Shoei Co. Ltd. (d) | 280,100 | | 4,837,564 |
SK Kaken Co. Ltd. | 54,000 | | 5,259,333 |
Software Service, Inc. | 62,900 | | 2,370,885 |
Techno Medica Co. Ltd. | 79,400 | | 1,812,945 |
Common Stocks - continued |
| Shares | | Value |
Japan - continued |
The Monogatari Corp. | 61,200 | | $ 2,601,764 |
The Nippon Synthetic Chemical Industry Co. Ltd. | 471,000 | | 3,488,572 |
TKC Corp. | 214,900 | | 5,065,518 |
Tocalo Co. Ltd. | 117,000 | | 2,348,578 |
Tsutsumi Jewelry Co. Ltd. | 121,100 | | 2,406,897 |
USS Co. Ltd. | 1,110,800 | | 19,609,931 |
Workman Co. Ltd. | 90,300 | | 5,564,943 |
Yamada Consulting Group Co. Ltd. | 103,700 | | 3,035,223 |
Yamato Kogyo Co. Ltd. | 181,500 | | 4,834,639 |
TOTAL JAPAN | | 248,926,203 |
Korea (South) - 1.6% |
BGFretail Co. Ltd. | 65,707 | | 9,783,223 |
Coway Co. Ltd. | 44,576 | | 3,326,305 |
Leeno Industrial, Inc. | 57,500 | | 2,203,268 |
TOTAL KOREA (SOUTH) | | 15,312,796 |
Mexico - 0.6% |
Consorcio ARA S.A.B. de CV (a) | 14,924,378 | | 5,592,870 |
Netherlands - 2.8% |
Aalberts Industries NV | 319,501 | | 10,387,346 |
Heijmans NV (Certificaten Van Aandelen) (a)(d) | 356,792 | | 3,001,449 |
VastNed Retail NV | 271,729 | | 13,222,201 |
TOTAL NETHERLANDS | | 26,610,996 |
Norway - 0.4% |
Kongsberg Gruppen ASA | 240,900 | | 3,770,818 |
Philippines - 0.4% |
Jollibee Food Corp. | 866,090 | | 3,806,557 |
South Africa - 0.8% |
Alexander Forbes Group Holding | 4,368,721 | | 2,752,746 |
Clicks Group Ltd. | 723,287 | | 5,283,931 |
TOTAL SOUTH AFRICA | | 8,036,677 |
Spain - 1.8% |
Hispania Activos Inmobiliarios SA (a) | 210,543 | | 3,171,873 |
Merlin Properties Socimi SA | 518,100 | | 6,643,036 |
Prosegur Compania de Seguridad SA (Reg.) | 1,687,590 | | 7,515,821 |
TOTAL SPAIN | | 17,330,730 |
Common Stocks - continued |
| Shares | | Value |
Sweden - 3.0% |
Fagerhult AB | 728,290 | | $ 12,445,686 |
Intrum Justitia AB | 446,534 | | 16,045,548 |
TOTAL SWEDEN | | 28,491,234 |
Switzerland - 0.2% |
Tecan Group AG | 11,481 | | 1,565,723 |
Taiwan - 0.4% |
Addcn Technology Co. Ltd. | 426,900 | | 4,148,682 |
United Kingdom - 21.7% |
AA PLC | 1,236,400 | | 5,277,809 |
Babcock International Group PLC | 164,700 | | 2,447,611 |
Bellway PLC | 359,872 | | 14,402,054 |
Berendsen PLC | 1,033,163 | | 16,325,422 |
Britvic PLC | 761,971 | | 8,210,835 |
Dechra Pharmaceuticals PLC | 532,950 | | 7,965,371 |
Derwent London PLC | 83,710 | | 5,007,037 |
DP Poland PLC (a)(e) | 7,188,000 | | 2,507,081 |
Elementis PLC | 2,052,810 | | 7,424,180 |
Great Portland Estates PLC | 741,189 | | 10,163,578 |
H&T Group PLC | 264,353 | | 798,752 |
Hilton Food Group PLC | 220,288 | | 1,579,121 |
Howden Joinery Group PLC | 1,287,000 | | 9,198,006 |
Informa PLC | 1,001,781 | | 8,771,883 |
InterContinental Hotel Group PLC ADR | 116,931 | | 4,663,208 |
ITE Group PLC | 1,752,534 | | 3,789,143 |
JUST EAT Ltd. (a) | 777,370 | | 5,105,157 |
Meggitt PLC | 537,590 | | 2,930,456 |
Rightmove PLC | 116,414 | | 6,889,616 |
Shaftesbury PLC | 837,673 | | 12,145,210 |
Spectris PLC | 415,478 | | 10,677,150 |
Spirax-Sarco Engineering PLC | 335,791 | | 15,741,901 |
Taylor Wimpey PLC | 1,486,800 | | 4,538,261 |
Ted Baker PLC | 198,700 | | 9,272,183 |
Topps Tiles PLC | 1,983,300 | | 4,448,597 |
Ultra Electronics Holdings PLC | 340,558 | | 8,835,821 |
Unite Group PLC | 1,774,823 | | 18,194,846 |
TOTAL UNITED KINGDOM | | 207,310,289 |
United States of America - 6.8% |
ANSYS, Inc. (a) | 21,085 | | 2,009,611 |
Autoliv, Inc. (d) | 38,200 | | 4,631,368 |
Broadridge Financial Solutions, Inc. | 48,905 | | 2,913,760 |
Common Stocks - continued |
| Shares | | Value |
United States of America - continued |
China Biologic Products, Inc. (a) | 77,180 | | $ 8,793,889 |
Kennedy-Wilson Holdings, Inc. | 436,429 | | 10,701,239 |
Martin Marietta Materials, Inc. | 19,720 | | 3,059,558 |
Mohawk Industries, Inc. (a) | 32,600 | | 6,373,300 |
PriceSmart, Inc. | 120,899 | | 10,394,896 |
ResMed, Inc. | 43,300 | | 2,494,513 |
SS&C Technologies Holdings, Inc. | 189,258 | | 14,033,481 |
TOTAL UNITED STATES OF AMERICA | | 65,405,615 |
TOTAL COMMON STOCKS (Cost $739,886,661) |
863,140,749
|
Nonconvertible Preferred Stocks - 1.6% |
| | | |
Germany - 1.6% |
Sartorius AG (non-vtg.)
(Cost $9,373,614) | 69,179 | |
15,655,759
|
Money Market Funds - 8.9% |
| | | |
Fidelity Cash Central Fund, 0.18% (b) | 78,298,533 | | 78,298,533 |
Fidelity Securities Lending Cash Central Fund, 0.19% (b)(c) | 6,756,054 | | 6,756,054 |
TOTAL MONEY MARKET FUNDS (Cost $85,054,587) |
85,054,587
|
TOTAL INVESTMENT PORTFOLIO - 100.7% (Cost $834,314,862) | | 963,851,095 |
NET OTHER ASSETS (LIABILITIES) - (0.7)% | | (7,006,746) |
NET ASSETS - 100% | $ 956,844,349 |
Legend |
(a) Non-income producing |
(b) Affiliated fund that is generally available only to investment companies and other accounts managed by Fidelity Investments. The rate quoted is the annualized seven-day yield of the fund at period end. A complete unaudited listing of the fund's holdings as of its most recent quarter end is available upon request. In addition, each Fidelity Central Fund's financial statements, which are not covered by the Fund's Report of Independent Registered Public Accounting Firm, are available on the SEC's website or upon request. |
(c) Investment made with cash collateral received from securities on loan. |
(d) Security or a portion of the security is on loan at period end. |
(e) Affiliated company |
Affiliated Central Funds |
Information regarding fiscal year to date income earned by the Fund from investments in Fidelity Central Funds is as follows: |
Fund | Income earned |
Fidelity Cash Central Fund | $ 69,465 |
Fidelity Securities Lending Cash Central Fund | 43,254 |
Total | $ 112,719 |
Other Affiliated Issuers |
An affiliated company is a company in which the Fund has ownership of at least 5% of the voting securities. Fiscal year to date transactions with companies which are or were affiliates are as follows: |
Affiliate | Value, beginning of period | Purchases | Sales Proceeds | Dividend Income | Value,
end of
period |
DP Poland PLC | $ - | $ 1,799,096 | $ - | $ - | $ 2,507,081 |
Other Information |
Categorizations in the Schedule of Investments are based on country or territory of incorporation. |
The following is a summary of the inputs used, as of October 31, 2015, involving the Fund's assets and liabilities carried at fair value. The inputs or methodology used for valuing securities may not be an indication of the risk associated with investing in those securities. For more information on valuation inputs, and their aggregation into the levels used in the table below, please refer to the Investment Valuation section in the accompanying Notes to Financial Statements. |
Valuation Inputs at Reporting Date: |
Description | Total | Level 1 | Level 2 | Level 3 |
Investments in Securities: | | | | |
Equities: | | | | |
Consumer Discretionary | $ 193,110,292 | $ 124,130,156 | $ 68,980,136 | $ - |
Consumer Staples | 80,110,906 | 43,943,727 | 36,167,179 | - |
Energy | 13,512,923 | 8,777,314 | 4,735,609 | - |
Financials | 178,821,710 | 151,321,856 | 27,499,854 | - |
Health Care | 83,964,658 | 61,396,738 | 22,567,920 | - |
Industrials | 175,615,594 | 129,823,047 | 45,792,547 | - |
Information Technology | 89,465,483 | 47,044,079 | 42,421,404 | - |
Materials | 64,194,942 | 29,222,550 | 34,972,392 | - |
Money Market Funds | 85,054,587 | 85,054,587 | - | - |
Total Investments in Securities: | $ 963,851,095 | $ 680,714,054 | $ 283,137,041 | $ - |
See accompanying notes which are an integral part of the financial statements.
Annual Report
Statement of Assets and Liabilities
| | October 31, 2015 |
| | |
Assets | | |
Investment in securities, at value (including securities loaned of $6,608,284) - See accompanying schedule: Unaffiliated issuers (cost $747,461,179) | $ 876,289,427 | |
Fidelity Central Funds (cost $85,054,587) | 85,054,587 | |
Other affiliated issuers (cost $1,799,096) | 2,507,081 | |
Total Investments (cost $834,314,862) | | $ 963,851,095 |
Cash | | 35,705 |
Receivable for fund shares sold | | 1,959,910 |
Dividends receivable | | 2,626,567 |
Distributions receivable from Fidelity Central Funds | | 20,131 |
Prepaid expenses | | 2,218 |
Other receivables | | 8,171 |
Total assets | | 968,503,797 |
| | |
Liabilities | | |
Payable to custodian | $ 4,255 | |
Payable for investments purchased | 2,996,514 | |
Payable for fund shares redeemed | 922,123 | |
Accrued management fee | 669,820 | |
Distribution and service plan fees payable | 27,606 | |
Other affiliated payables | 204,936 | |
Other payables and accrued expenses | 78,140 | |
Collateral on securities loaned, at value | 6,756,054 | |
Total liabilities | | 11,659,448 |
| | |
Net Assets | | $ 956,844,349 |
Net Assets consist of: | | |
Paid in capital | | $ 1,079,462,131 |
Undistributed net investment income | | 4,878,283 |
Accumulated undistributed net realized gain (loss) on investments and foreign currency transactions | | (256,995,467) |
Net unrealized appreciation (depreciation) on investments and assets and liabilities in foreign currencies | | 129,499,402 |
Net Assets | | $ 956,844,349 |
See accompanying notes which are an integral part of the financial statements.
Annual Report
Financial Statements - continued
Statement of Assets and Liabilities - continued
| | October 31, 2015 |
Calculation of Maximum Offering Price | | |
Class A:
Net Asset Value and redemption price per share ($42,288,833 ÷ 2,866,188 shares) | | $ 14.75 |
| | |
Maximum offering price per share (100/94.25 of $14.75) | | $ 15.65 |
Class T:
Net Asset Value and redemption price per share ($13,295,749 ÷ 909,157 shares) | | $ 14.62 |
| | |
Maximum offering price per share (100/96.50 of $14.62) | | $ 15.15 |
Class B:
Net Asset Value and offering price per share ($604,112 ÷ 42,095 shares)A | | $ 14.35 |
| | |
Class C:
Net Asset Value and offering price per share ($17,369,639 ÷ 1,217,958 shares)A | | $ 14.26 |
| | |
International Small Cap Opportunities:
Net Asset Value, offering price and redemption price per share ($762,562,645 ÷ 51,136,318 shares) | | $ 14.91 |
| | |
Class I:
Net Asset Value, offering price and redemption price per share ($120,723,371 ÷ 8,096,650 shares) | | $ 14.91 |
A Redemption price per share is equal to net asset value less any applicable contingent deferred sales charge.
See accompanying notes which are an integral part of the financial statements.
Annual Report
Statement of Operations
| Year ended October 31, 2015 |
| | |
Investment Income | | |
Dividends | | $ 15,396,244 |
Interest | | 1,191 |
Income from Fidelity Central Funds | | 112,719 |
Income before foreign taxes withheld | | 15,510,154 |
Less foreign taxes withheld | | (1,188,664) |
Total income | | 14,321,490 |
| | |
Expenses | | |
Management fee | | |
Basic fee | $ 6,379,946 | |
Performance adjustment | 411,545 | |
Transfer agent fees | 1,704,191 | |
Distribution and service plan fees | 248,267 | |
Accounting and security lending fees | 364,305 | |
Custodian fees and expenses | 171,042 | |
Independent trustees' compensation | 3,095 | |
Registration fees | 122,475 | |
Audit | 74,244 | |
Legal | 1,956 | |
Miscellaneous | 6,233 | |
Total expenses before reductions | 9,487,299 | |
Expense reductions | (46,082) | 9,441,217 |
Net investment income (loss) | | 4,880,273 |
Realized and Unrealized Gain (Loss) | | |
Net realized gain (loss) on: | | |
Investment securities: | | |
Unaffiliated issuers | 32,176,139 | |
Foreign currency transactions | (20,188) | |
Total net realized gain (loss) | | 32,155,951 |
Change in net unrealized appreciation (depreciation) on: Investment securities | 15,699,549 | |
Assets and liabilities in foreign currencies | 9,159 | |
Total change in net unrealized appreciation (depreciation) | | 15,708,708 |
Net gain (loss) | | 47,864,659 |
Net increase (decrease) in net assets resulting from operations | | $ 52,744,932 |
See accompanying notes which are an integral part of the financial statements.
Annual Report
Financial Statements - continued
Statement of Changes in Net Assets
| Year ended
October 31,
2015 | Year ended
October 31,
2014 |
Increase (Decrease) in Net Assets | | |
Operations | | |
Net investment income (loss) | $ 4,880,273 | $ 3,975,650 |
Net realized gain (loss) | 32,155,951 | 27,466,423 |
Change in net unrealized appreciation (depreciation) | 15,708,708 | (28,661,157) |
Net increase (decrease) in net assets resulting from operations | 52,744,932 | 2,780,916 |
Distributions to shareholders from net investment income | (3,982,311) | (3,580,601) |
Distributions to shareholders from net realized gain | (949,656) | (3,233,620) |
Total distributions | (4,931,967) | (6,814,221) |
Share transactions - net increase (decrease) | 250,623,581 | 97,201,705 |
Redemption fees | 196,651 | 84,800 |
Total increase (decrease) in net assets | 298,633,197 | 93,253,200 |
| | |
Net Assets | | |
Beginning of period | 658,211,152 | 564,957,952 |
End of period (including undistributed net investment income of $4,878,283 and undistributed net investment income of $3,990,517, respectively) | $ 956,844,349 | $ 658,211,152 |
See accompanying notes which are an integral part of the financial statements.
Annual Report
Financial Highlights - Fidelity International Small Cap Opportunities Fund Class A
Years ended October 31, | 2015 | 2014 | 2013 | 2012 | 2011 |
Selected Per-Share Data | | | | | |
Net asset value, beginning of period | $ 13.65 | $ 13.68 | $ 10.78 | $ 9.75 | $ 9.82 |
Income from Investment Operations | | | | | |
Net investment income (loss) C | .06 | .05 | .07 | .08 | .15F |
Net realized and unrealized gain (loss) | 1.11 | .05 | 2.91 | 1.07 | (.07) |
Total from investment operations | 1.17 | .10 | 2.98 | 1.15 | .08 |
Distributions from net investment income | (.05) | (.06) | (.08) | (.11) | (.11) |
Distributions from net realized gain | (.02) | (.08) | (.01) | (.01) | (.04) |
Total distributions | (.07) | (.13) J | (.08) I | (.12) | (.15) |
Redemption fees added to paid in capitalC, H | - | - | - | - | - |
Net asset value, end of period | $ 14.75 | $ 13.65 | $ 13.68 | $ 10.78 | $ 9.75 |
Total ReturnA, B | 8.62% | .78% | 27.85% | 12.00% | .81% |
Ratios to Average Net AssetsD, G | | | | | |
Expenses before reductions | 1.52% | 1.63% | 1.70% | 1.75% | 1.34% |
Expenses net of fee waivers, if any | 1.52% | 1.63% | 1.65% | 1.65% | 1.33% |
Expenses net of all reductions | 1.51% | 1.63% | 1.64% | 1.64% | 1.32% |
Net investment income (loss) | .38% | .33% | .59% | .85% | 1.44%F |
Supplemental Data | | | | | |
Net assets, end of period (000 omitted) | $ 42,289 | $ 25,041 | $ 22,052 | $ 18,194 | $ 18,686 |
Portfolio turnover rateE | 21% | 18% | 31% | 28% | 24% |
A Total returns would have been lower if certain expenses had not been reduced during the applicable periods shown.
B Total returns do not include the effect of the sales charges.
C Calculated based on average shares outstanding during the period.
D Fees and expenses of any underlying Fidelity Central Funds are not included in the Fund's expense ratio. The Fund indirectly bears its proportionate share of the expenses of any underlying Fidelity Central Funds.
E Amount does not include the portfolio activity of any underlying Fidelity Central Funds.
F Investment income per share reflects a large, non-recurring dividend which amounted to $.06 per share. Excluding this non-recurring dividend, the ratio of net investment income (loss) to average net assets would have been .80%.
G Expense ratios reflect operating expenses of the class. Expenses before reductions do not reflect amounts reimbursed by the investment adviser or reductions from brokerage service arrangements or reductions from other expense offset arrangements and do not represent the amount paid by the class during periods when reimbursements or reductions occur. Expenses net of fee waivers reflect expenses after reimbursement by the investment adviser but prior to reductions from brokerage service arrangements or other expense offset arrangements. Expenses net of all reductions represent the net expenses paid by the class.
H Amount represents less than $.005 per share.
I Total distributions of $.08 per share is comprised of distributions from net investment income of $.077 and distributions from net realized gain of $.005 per share.
J Total distributions of $.13 per share is comprised of distributions from net investment income of $.055 and distributions from net realized gain of $.079 per share.
See accompanying notes which are an integral part of the financial statements.
Annual Report
Financial Highlights - Fidelity International Small Cap Opportunities Fund Class T
Years ended October 31, | 2015 | 2014 | 2013 | 2012 | 2011 |
Selected Per-Share Data | | | | | |
Net asset value, beginning of period | $ 13.53 | $ 13.56 | $ 10.69 | $ 9.66 | $ 9.72 |
Income from Investment Operations | | | | | |
Net investment income (loss) C | .01 | .01 | .04 | .06 | .12F |
Net realized and unrealized gain (loss) | 1.11 | .06 | 2.89 | 1.06 | (.06) |
Total from investment operations | 1.12 | .07 | 2.93 | 1.12 | .06 |
Distributions from net investment income | (.01) | (.02) | (.05) | (.08) | (.08) |
Distributions from net realized gain | (.02) | (.08) | (.01) | (.01) | (.04) |
Total distributions | (.03) | (.10) | (.06) | (.09) | (.12) |
Redemption fees added to paid in capitalC, H | - | - | - | - | - |
Net asset value, end of period | $ 14.62 | $ 13.53 | $ 13.56 | $ 10.69 | $ 9.66 |
Total ReturnA, B | 8.27% | .55% | 27.53% | 11.72% | .60% |
Ratios to Average Net AssetsD, G | | | | | |
Expenses before reductions | 1.80% | 1.89% | 1.96% | 2.02% | 1.60% |
Expenses net of fee waivers, if any | 1.80% | 1.89% | 1.90% | 1.90% | 1.60% |
Expenses net of all reductions | 1.80% | 1.89% | 1.89% | 1.89% | 1.59% |
Net investment income (loss) | .10% | .07% | .34% | .60% | 1.17%F |
Supplemental Data | | | | | |
Net assets, end of period (000 omitted) | $ 13,296 | $ 9,913 | $ 9,634 | $ 8,169 | $ 8,701 |
Portfolio turnover rateE | 21% | 18% | 31% | 28% | 24% |
A Total returns would have been lower if certain expenses had not been reduced during the applicable periods shown.
B Total returns do not include the effect of the sales charges.
C Calculated based on average shares outstanding during the period.
D Fees and expenses of any underlying Fidelity Central Funds are not included in the Fund's expense ratio. The Fund indirectly bears its proportionate share of the expenses of any underlying Fidelity Central Funds.
E Amount does not include the portfolio activity of any underlying Fidelity Central Funds.
F Investment income per share reflects a large, non-recurring dividend which amounted to $.06 per share. Excluding this non-recurring dividend, the ratio of net investment income (loss) to average net assets would have been .54%.
G Expense ratios reflect operating expenses of the class. Expenses before reductions do not reflect amounts reimbursed by the investment adviser or reductions from brokerage service arrangements or reductions from other expense offset arrangements and do not represent the amount paid by the class during periods when reimbursements or reductions occur. Expenses net of fee waivers reflect expenses after reimbursement by the investment adviser but prior to reductions from brokerage service arrangements or other expense offset arrangements. Expenses net of all reductions represent the net expenses paid by the class.
H Amount represents less than $.005 per share.
See accompanying notes which are an integral part of the financial statements.
Annual Report
Financial Highlights - Fidelity International Small Cap Opportunities Fund Class B
Years ended October 31, | 2015 | 2014 | 2013 | 2012 | 2011 |
Selected Per-Share Data | | | | | |
Net asset value, beginning of period | $ 13.31 | $ 13.31 | $ 10.50 | $ 9.48 | $ 9.54 |
Income from Investment Operations | | | | | |
Net investment income (loss) C | (.06) | (.06) | (.02) | .01 | .07F |
Net realized and unrealized gain (loss) | 1.10 | .06 | 2.84 | 1.05 | (.06) |
Total from investment operations | 1.04 | - | 2.82 | 1.06 | .01 |
Distributions from net investment income | - | - | - H | (.03) | (.06) |
Distributions from net realized gain | - | - | (.01) | (.01) | (.02) |
Total distributions | - | - | (.01) | (.04) | (.07) I |
Redemption fees added to paid in capitalC, H | - | - | - | - | - |
Net asset value, end of period | $ 14.35 | $ 13.31 | $ 13.31 | $ 10.50 | $ 9.48 |
Total ReturnA, B | 7.81% | -% | 26.86% | 11.21% | .10% |
Ratios to Average Net AssetsD, G | | | | | |
Expenses before reductions | 2.30% | 2.38% | 2.46% | 2.50% | 2.09% |
Expenses net of fee waivers, if any | 2.30% | 2.38% | 2.40% | 2.40% | 2.09% |
Expenses net of all reductions | 2.29% | 2.38% | 2.39% | 2.39% | 2.07% |
Net investment income (loss) | (.39)% | (.43)% | (.16)% | .10% | .68%F |
Supplemental Data | | | | | |
Net assets, end of period (000 omitted) | $ 604 | $ 744 | $ 1,410 | $ 1,966 | $ 2,293 |
Portfolio turnover rateE | 21% | 18% | 31% | 28% | 24% |
A Total returns would have been lower if certain expenses had not been reduced during the applicable periods shown.
B Total returns do not include the effect of the contingent deferred sales charge.
C Calculated based on average shares outstanding during the period.
D Fees and expenses of any underlying Fidelity Central Funds are not included in the Fund's expense ratio. The Fund indirectly bears its proportionate share of the expenses of any underlying Fidelity Central Funds.
E Amount does not include the portfolio activity of any underlying Fidelity Central Funds.
F Investment income per share reflects a large, non-recurring dividend which amounted to $.06 per share. Excluding this non-recurring dividend, the ratio of net investment income (loss) to average net assets would have been .05%.
G Expense ratios reflect operating expenses of the class. Expenses before reductions do not reflect amounts reimbursed by the investment adviser or reductions from brokerage service arrangements or reductions from other expense offset arrangements and do not represent the amount paid by the class during periods when reimbursements or reductions occur. Expenses net of fee waivers reflect expenses after reimbursement by the investment adviser but prior to reductions from brokerage service arrangements or other expense offset arrangements. Expenses net of all reductions represent the net expenses paid by the class.
H Amount represents less than $.005 per share.
I Total distributions of $.07 per share is comprised of distributions from net investment income of $.058 and distributions from net realized gain of $.015 per share.
See accompanying notes which are an integral part of the financial statements.
Annual Report
Financial Highlights - Fidelity International Small Cap Opportunities Fund Class C
Years ended October 31, | 2015 | 2014 | 2013 | 2012 | 2011 |
Selected Per-Share Data | | | | | |
Net asset value, beginning of period | $ 13.23 | $ 13.28 | $ 10.48 | $ 9.47 | $ 9.53 |
Income from Investment Operations | | | | | |
Net investment income (loss) C | (.05) | (.06) | (.02) | .01 | .07F |
Net realized and unrealized gain (loss) | 1.08 | .06 | 2.84 | 1.04 | (.06) |
Total from investment operations | 1.03 | - | 2.82 | 1.05 | .01 |
Distributions from net investment income | - | - | (.01) | (.03) | (.06) |
Distributions from net realized gain | - | (.05) | (.01) | (.01) | (.02) |
Total distributions | - | (.05) | (.02) | (.04) | (.07) I |
Redemption fees added to paid in capitalC, H | - | - | - | - | - |
Net asset value, end of period | $ 14.26 | $ 13.23 | $ 13.28 | $ 10.48 | $ 9.47 |
Total ReturnA, B | 7.79% | .03% | 26.91% | 11.13% | .10% |
Ratios to Average Net AssetsD, G | | | | | |
Expenses before reductions | 2.27% | 2.38% | 2.45% | 2.50% | 2.09% |
Expenses net of fee waivers, if any | 2.27% | 2.38% | 2.40% | 2.40% | 2.09% |
Expenses net of all reductions | 2.26% | 2.38% | 2.39% | 2.39% | 2.07% |
Net investment income (loss) | (.36)% | (.42)% | (.16)% | .10% | .68%F |
Supplemental Data | | | | | |
Net assets, end of period (000 omitted) | $ 17,370 | $ 8,438 | $ 8,070 | $ 6,608 | $ 6,900 |
Portfolio turnover rateE | 21% | 18% | 31% | 28% | 24% |
A Total returns would have been lower if certain expenses had not been reduced during the applicable periods shown.
B Total returns do not include the effect of the contingent deferred sales charge.
C Calculated based on average shares outstanding during the period.
D Fees and expenses of any underlying Fidelity Central Funds are not included in the Fund's expense ratio. The Fund indirectly bears its proportionate share of the expenses of any underlying Fidelity Central Funds.
E Amount does not include the portfolio activity of any underlying Fidelity Central Funds.
F Investment income per share reflects a large, non-recurring dividend which amounted to $.06 per share. Excluding this non-recurring dividend, the ratio of net investment income (loss) to average net assets would have been .05%.
G Expense ratios reflect operating expenses of the class. Expenses before reductions do not reflect amounts reimbursed by the investment adviser or reductions from brokerage service arrangements or reductions from other expense offset arrangements and do not represent the amount paid by the class during periods when reimbursements or reductions occur. Expenses net of fee waivers reflect expenses after reimbursement by the investment adviser but prior to reductions from brokerage service arrangements or other expense offset arrangements. Expenses net of all reductions represent the net expenses paid by the class.
H Amount represents less than $.005 per share.
I Total distributions of $.07 per share is comprised of distributions from net investment income of $.058 and distributions from net realized gain of $.015 per share.
See accompanying notes which are an integral part of the financial statements.
Annual Report
Financial Highlights - Fidelity International Small Cap Opportunities Fund
Years ended October 31, | 2015 | 2014 | 2013 | 2012 | 2011 |
Selected Per-Share Data | | | | | |
Net asset value, beginning of period | $ 13.80 | $ 13.82 | $ 10.88 | $ 9.85 | $ 9.92 |
Income from Investment Operations | | | | | |
Net investment income (loss) B | .10 | .09 | .10 | .11 | .17E |
Net realized and unrealized gain (loss) | 1.12 | .06 | 2.95 | 1.07 | (.06) |
Total from investment operations | 1.22 | .15 | 3.05 | 1.18 | .11 |
Distributions from net investment income | (.09) | (.09) | (.10) | (.14) | (.14) |
Distributions from net realized gain | (.02) | (.08) | (.01) | (.01) | (.04) |
Total distributions | (.11) | (.17) | (.11) | (.15) | (.18) |
Redemption fees added to paid in capitalB, G | - | - | - | - | - |
Net asset value, end of period | $ 14.91 | $ 13.80 | $ 13.82 | $ 10.88 | $ 9.85 |
Total ReturnA | 8.92% | 1.11% | 28.24% | 12.21% | 1.10% |
Ratios to Average Net AssetsC, F | | | | | |
Expenses before reductions | 1.23% | 1.30% | 1.39% | 1.47% | 1.08% |
Expenses net of fee waivers, if any | 1.22% | 1.30% | 1.39% | 1.40% | 1.08% |
Expenses net of all reductions | 1.22% | 1.30% | 1.38% | 1.39% | 1.06% |
Net investment income (loss) | .68% | .65% | .85% | 1.10% | 1.69%E |
Supplemental Data | | | | | |
Net assets, end of period (000 omitted) | $ 762,563 | $ 584,253 | $ 518,121 | $ 334,918 | $ 328,262 |
Portfolio turnover rateD | 21% | 18% | 31% | 28% | 24% |
A Total returns would have been lower if certain expenses had not been reduced during the applicable periods shown.
B Calculated based on average shares outstanding during the period.
C Fees and expenses of any underlying Fidelity Central Funds are not included in the Fund's expense ratio. The Fund indirectly bears its proportionate share of the expenses of any underlying Fidelity Central Funds.
D Amount does not include the portfolio activity of any underlying Fidelity Central Funds.
E Investment income per share reflects a large, non-recurring dividend which amounted to $.07 per share. Excluding this non-recurring dividend, the ratio of net investment income (loss) to average net assets would have been 1.06%.
F Expense ratios reflect operating expenses of the class. Expenses before reductions do not reflect amounts reimbursed by the investment adviser or reductions from brokerage service arrangements or reductions from other expense offset arrangements and do not represent the amount paid by the class during periods when reimbursements or reductions occur. Expenses net of fee waivers reflect expenses after reimbursement by the investment adviser but prior to reductions from brokerage service arrangements or other expense offset arrangements. Expenses net of all reductions represent the net expenses paid by the class.
G Amount represents less than $.005 per share.
See accompanying notes which are an integral part of the financial statements.
Annual Report
Financial Highlights - Fidelity International Small Cap Opportunities Fund Class I
Years ended October 31, | 2015 | 2014 | 2013 | 2012 | 2011 |
Selected Per-Share Data | | | | | |
Net asset value, beginning of period | $ 13.81 | $ 13.83 | $ 10.90 | $ 9.86 | $ 9.93 |
Income from Investment Operations | | | | | |
Net investment income (loss) B | .10 | .08 | .11 | .11 | .18E |
Net realized and unrealized gain (loss) | 1.13 | .07 | 2.93 | 1.08 | (.06) |
Total from investment operations | 1.23 | .15 | 3.04 | 1.19 | .12 |
Distributions from net investment income | (.11) | (.09) | (.10) | (.14) | (.15) |
Distributions from net realized gain | (.02) | (.08) | (.01) | (.01) | (.04) |
Total distributions | (.13) | (.17) | (.11) | (.15) | (.19) |
Redemption fees added to paid in capitalB, G | - | - | - | - | - |
Net asset value, end of period | $ 14.91 | $ 13.81 | $ 13.83 | $ 10.90 | $ 9.86 |
Total Return A | 8.98% | 1.11% | 28.11% | 12.32% | 1.13% |
Ratios to Average Net AssetsC, F | | | | | |
Expenses before reductions | 1.19% | 1.36% | 1.38% | 1.44% | 1.03% |
Expenses net of fee waivers, if any | 1.19% | 1.36% | 1.37% | 1.40% | 1.03% |
Expenses net of all reductions | 1.18% | 1.36% | 1.37% | 1.39% | 1.02% |
Net investment income (loss) | .71% | .60% | .87% | 1.10% | 1.74%E |
Supplemental Data | | | | | |
Net assets, end of period (000 omitted) | $ 120,723 | $ 29,822 | $ 5,670 | $ 4,591 | $ 1,395 |
Portfolio turnover rateD | 21% | 18% | 31% | 28% | 24% |
A Total returns would have been lower if certain expenses had not been reduced during the applicable periods shown.
B Calculated based on average shares outstanding during the period.
C Fees and expenses of any underlying Fidelity Central Funds are not included in the Fund's expense ratio. The Fund indirectly bears its proportionate share of the expenses of any underlying Fidelity Central Funds.
D Amount does not include the portfolio activity of any underlying Fidelity Central Funds.
E Investment income per share reflects a large, non-recurring dividend which amounted to $.07 per share. Excluding this non-recurring dividend, the ratio of net investment income (loss) to average net assets would have been 1.11%.
F Expense ratios reflect operating expenses of the class. Expenses before reductions do not reflect amounts reimbursed by the investment adviser or reductions from brokerage service arrangements or reductions from other expense offset arrangements and do not represent the amount paid by the class during periods when reimbursements or reductions occur. Expenses net of fee waivers reflect expenses after reimbursement by the investment adviser but prior to reductions from brokerage service arrangements or other expense offset arrangements. Expenses net of all reductions represent the net expenses paid by the class.
G Amount represents less than $.005 per share.
See accompanying notes which are an integral part of the financial statements.
Annual Report
For the period ended October 31, 2015
1. Organization.
Fidelity International Small Cap Opportunities Fund (the Fund) is a fund of Fidelity Investment Trust (the Trust) and is authorized to issue an unlimited number of shares. The Trust is registered under the Investment Company Act of 1940, as amended (the 1940 Act), as an open-end management investment company organized as a Massachusetts business trust. The Fund offers Class A, Class T, Class C, International Small Cap Opportunities and Class I (formerly Institutional Class) shares, each of which, along with Class B shares, has equal rights as to assets and voting privileges. Class B shares are closed to new accounts and additional purchases, except for exchanges and reinvestments. Each class has exclusive voting rights with respect to matters that affect that class. Class B shares will automatically convert to Class A shares after a holding period of seven years from the initial date of purchase.
2. Investments in Fidelity Central Funds.
The Fund invests in Fidelity Central Funds, which are open-end investment companies generally available only to other investment companies and accounts managed by the investment adviser and its affiliates. The Fund's Schedule of Investments lists each of the Fidelity Central Funds held as of period end, if any, as an investment of the Fund, but does not include the underlying holdings of each Fidelity Central Fund. As an Investing Fund, the Fund indirectly bears its proportionate share of the expenses of the underlying Fidelity Central Funds.
The Money Market Central Funds seek preservation of capital and current income and are managed by Fidelity Investments Money Management, Inc. (FIMM), an affiliate of the investment adviser. Annualized expenses of the Money Market Central Funds as of their most recent shareholder report date are less than .005%.
A complete unaudited list of holdings for each Fidelity Central Fund is available upon request or at the Securities and Exchange Commission (the SEC) website at www.sec.gov. In addition, the financial statements of the Fidelity Central Funds, which are not covered by the Fund's Report of Independent Registered Public Accounting Firm, are available on the SEC website or upon request.
3. Significant Accounting Policies.
The financial statements have been prepared in conformity with accounting principles generally accepted in the United States of America (GAAP), which require management to make certain estimates and assumptions at the date of the financial statements. Actual results could differ from those estimates. Subsequent events, if any, through the date that the financial statements were issued have been evaluated in the preparation of
Annual Report
Notes to Financial Statements - continued
3. Significant Accounting Policies - continued
the financial statements. The following summarizes the significant accounting policies of the Fund:
Investment Valuation. Investments are valued as of 4:00 p.m. Eastern time on the last calendar day of the period. The Board of Trustees (the Board) has delegated the day to day responsibility for the valuation of the Fund's investments to the Fidelity Management & Research Company (FMR) Fair Value Committee (the Committee). In accordance with valuation policies and procedures approved by the Board, the Fund attempts to obtain prices from one or more third party pricing vendors or brokers to value its investments. When current market prices, quotations or currency exchange rates are not readily available or reliable, investments will be fair valued in good faith by the Committee, in accordance with procedures adopted by the Board. Factors used in determining fair value vary by investment type and may include market or investment specific events. The frequency with which these procedures are used cannot be predicted and they may be utilized to a significant extent. The Committee oversees the Fund's valuation policies and procedures and reports to the Board on the Committee's activities and fair value determinations. The Board monitors the appropriateness of the procedures used in valuing the Fund's investments and ratifies the fair value determinations of the Committee.
The Fund categorizes the inputs to valuation techniques used to value its investments into a disclosure hierarchy consisting of three levels as shown below:
Level 1 - quoted prices in active markets for identical investments
Level 2 - other significant observable inputs (including quoted prices for similar investments, interest rates, prepayment speeds, etc.)
Level 3 - unobservable inputs (including the Fund's own assumptions based on the best information available)
Valuation techniques used to value the Fund's investments by major category are as follows:
Equity securities, including restricted securities, for which market quotations are readily available, are valued at the last reported sale price or official closing price as reported by a third party pricing vendor on the primary market or exchange on which they are traded and are categorized as Level 1 in the hierarchy. In the event there were no sales during the day or closing prices are not available, securities are valued at the last quoted bid price or may be valued using the last available price and are generally categorized as Level 2 in the hierarchy. For foreign equity securities, when market or security specific events arise, comparisons to the valuation of American Depositary Receipts (ADRs),
Annual Report
3. Significant Accounting Policies - continued
Investment Valuation - continued
futures contracts, Exchange-Traded Funds (ETFs) and certain indexes as well as quoted prices for similar securities may be used and would be categorized as Level 2 in the hierarchy. Utilizing these techniques may result in transfers between Level 1 and Level 2. For equity securities, including restricted securities, where observable inputs are limited, assumptions about market activity and risk are used and these securities may be categorized as Level 3 in the hierarchy.
Investments in open-end mutual funds, including the Fidelity Central Funds, are valued at their closing net asset value (NAV) each business day and are categorized as Level 1 in the hierarchy.
Changes in valuation techniques may result in transfers in or out of an assigned level within the disclosure hierarchy. The aggregate value of investments by input level as of October 31, 2015 is included at the end of the Fund's Schedule of Investments.
Foreign Currency. The Fund may use foreign currency contracts to facilitate transactions in foreign-denominated securities. Gains and losses from these transactions may arise from changes in the value of the foreign currency or if the counterparties do not perform under the contracts' terms.
Foreign-denominated assets, including investment securities, and liabilities are translated into U.S. dollars at the exchange rates at period end. Purchases and sales of investment securities, income and dividends received and expenses denominated in foreign currencies are translated into U.S. dollars at the exchange rate in effect on the transaction date.
The effects of exchange rate fluctuations on investments are included with the net realized and unrealized gain (loss) on investment securities. Other foreign currency transactions resulting in realized and unrealized gain (loss) are disclosed separately.
Investment Transactions and Income. For financial reporting purposes, the Fund's investment holdings and NAV include trades executed through the end of the last business day of the period. The NAV per share for processing shareholder transactions is calculated as of the close of business of the New York Stock Exchange (NYSE), normally 4:00 p.m. Eastern time and includes trades executed through the end of the prior business day. Gains and losses on securities sold are determined on the basis of identified cost. Dividend income is recorded on the ex-dividend date, except for certain dividends from foreign securities where the ex-dividend date may have passed, which are recorded as soon as the Fund is informed of the ex-dividend date. Non-cash dividends included in dividend income, if any, are recorded at the fair market value of the securities received.
Annual Report
Notes to Financial Statements - continued
3. Significant Accounting Policies - continued
Investment Transactions and Income - continued
Income and capital gain distributions from Fidelity Central Funds, if any, are recorded on the ex-dividend date. Distributions received on securities that represent a return of capital or capital gain are recorded as a reduction of cost of investments and/or as a realized gain. Subsequent to ex-dividend date the Fund determines the components of these distributions, based upon receipt of tax filings or other correspondence relating to the underlying investment. Interest income is accrued as earned and includes coupon interest and amortization of premium and accretion of discount on debt securities as applicable. Investment income is recorded net of foreign taxes withheld where recovery of such taxes is uncertain.
Class Allocations and Expenses. Investment income, realized and unrealized capital gains and losses, common expenses of the Fund, and certain fund-level expense reductions, if any, are allocated daily on a pro-rata basis to each class based on the relative net assets of each class to the total net assets of the Fund. Each class differs with respect to transfer agent and distribution and service plan fees incurred. Certain expense reductions may also differ by class. For the reporting period, the allocated portion of income and expenses to each class as a percent of its average net assets may vary due to the timing of recording these transactions in relation to fluctuating net assets of the classes. Expenses directly attributable to a fund are charged to that fund. Expenses attributable to more than one fund are allocated among the respective funds on the basis of relative net assets or other appropriate methods. Expense estimates are accrued in the period to which they relate and adjustments are made when actual amounts are known.
Income Tax Information and Distributions to Shareholders. Each year, the Fund intends to qualify as a regulated investment company under Subchapter M of the Internal Revenue Code, including distributing substantially all of its taxable income and realized gains. As a result, no provision for U.S. Federal income taxes is required. As of October 31, 2015, the Fund did not have any unrecognized tax benefits in the financial statements; nor is the Fund aware of any tax positions for which it is reasonably possible that the total amounts of unrecognized tax benefits will significantly change in the next twelve months. The Fund files a U.S. federal tax return, in addition to state and local tax returns as required. The Fund's federal income tax returns are subject to examination by the Internal Revenue Service (IRS) for a period of three fiscal years after they are filed. State and local tax returns may be subject to examination for an additional fiscal year depending on the jurisdiction. Foreign taxes are provided for based on the Fund's understanding of the tax rules and rates that exist in the foreign markets in which it invests.
Distributions are declared and recorded on the ex-dividend date. Income dividends and capital gain distributions are declared separately for each class. Income and capital gain
Annual Report
3. Significant Accounting Policies - continued
Income Tax Information and Distributions to Shareholders - continued
distributions are determined in accordance with income tax regulations, which may differ from GAAP.
Capital accounts within the financial statements are adjusted for permanent book-tax differences. These adjustments have no impact on net assets or the results of operations. Capital accounts are not adjusted for temporary book-tax differences which will reverse in a subsequent period.
Book-tax differences are primarily due to foreign currency transactions, partnerships, passive foreign investment companies (PFIC), capital loss carryforwards and losses deferred due to wash sales.
The federal tax cost of investment securities and unrealized appreciation (depreciation) as of period end were as follows:
Gross unrealized appreciation | $ 170,087,781 |
Gross unrealized depreciation | (49,282,874) |
Net unrealized appreciation (depreciation) on securities | $ 120,804,907 |
Tax Cost | $ 843,046,188 |
The tax-based components of distributable earnings as of period end were as follows:
Undistributed ordinary income | $ 9,403,138 |
Capital loss carryforward | $ (252,792,060) |
Net unrealized appreciation (depreciation) on securities and other investments | $ 120,771,140 |
Capital loss carryforwards are only available to offset future capital gains of the Fund to the extent provided by regulations and may be limited. Under the Regulated Investment Company Modernization Act of 2010 (the Act), the Fund is permitted to carry forward capital losses incurred in taxable years beginning after December 22, 2010 for an unlimited period and such capital losses are required to be used prior to any losses that expire. The capital loss carryforward information presented below, including any applicable limitation, is estimated as of fiscal period end and is subject to adjustment.
Fiscal year of expiration | |
2017 | $ (252,792,060) |
The tax character of distributions paid was as follows:
| October 31, 2015 | October 31, 2014 |
Ordinary Income | $ 4,931,967 | $ 6,814,221 |
Annual Report
Notes to Financial Statements - continued
3. Significant Accounting Policies - continued
Short-Term Trading (Redemption) Fees. Shares held by investors in the Fund less than 90 days may have been subject to a redemption fee equal to 2.00% of the NAV of shares redeemed. All redemption fees, which reduce the proceeds of the shareholder redemption, are retained by the Fund and accounted for as an addition to paid in capital.
4. Purchases and Sales of Investments.
Purchases and sales of securities, other than short-term securities, aggregated $339,740,366 and $147,999,305, respectively.
5. Fees and Other Transactions with Affiliates.
Management Fee. Fidelity Management & Research Company (the investment adviser) and its affiliates provide the Fund with investment management related services for which the Fund pays a monthly management fee. The management fee is the sum of an individual fund fee rate that is based on an annual rate of .60% of the Fund's average net assets and an annualized group fee rate that averaged .25% during the period. The group fee rate is based upon the average net assets of all the mutual funds advised by the investment adviser, including any mutual funds previously advised by the investment adviser that are currently advised by Fidelity SelectCo, LLC, an affiliate of the investment adviser. The group fee rate decreases as assets under management increase and increases as assets under management decrease. In addition, the management fee is subject to a performance adjustment (up to a maximum of ± .20% of the Fund's average net assets over a 36 month performance period). The upward or downward adjustment to the management fee is based on the relative investment performance of International Small Cap Opportunities as compared to its benchmark index, the MSCI EAFE Small Cap Index, over the same 36 month performance period. For the reporting period, the total annual management fee rate, including the performance adjustment, was .90% of the Fund's average net assets. The performance adjustment included in the management fee rate may be higher or lower than the maximum performance adjustment rate due to the difference between the average net assets for the reporting and performance periods.
Distribution and Service Plan Fees. In accordance with Rule 12b-1 of the 1940 Act, the Fund has adopted separate Distribution and Service Plans for each class of shares. Certain classes pay Fidelity Distributors Corporation (FDC), an affiliate of the investment adviser, separate Distribution and Service Fees, each of which is based on an annual percentage of each class' average net assets. In addition, FDC may pay financial intermediaries for selling shares of the Fund and providing shareholder support services.
Annual Report
5. Fees and Other Transactions with Affiliates - continued
Distribution and Service Plan Fees - continued
For the period, the Distribution and Service Fee rates, total fees and amounts retained by FDC were as follows:
| Distribution
Fee | Service
Fee | Total Fees | Retained
by FDC |
Class A | -% | .25% | $ 72,286 | $ 920 |
Class T | .25% | .25% | 53,206 | - |
Class B | .75% | .25% | 6,808 | 5,112 |
Class C | .75% | .25% | 115,967 | 20,094 |
| | | $ 248,267 | $ 26,126 |
Sales Load. FDC may receive a front-end sales charge of up to 5.75% for selling Class A shares and 3.50% for selling Class T shares, some of which is paid to financial intermediaries for selling shares of the Fund. Depending on the holding period, FDC may receive contingent deferred sales charges levied on Class A, Class T, Class B, and Class C redemptions. The deferred sales charges range from 5.00% to 1.00% for Class B shares, 1.00% for Class C shares, 1.00% for certain purchases of Class A shares and .25% for certain purchases of Class T shares.
For the period, sales charge amounts retained by FDC were as follows:
| Retained
by FDC |
Class A | $ 24,104 |
Class T | 3,744 |
Class BA | 149 |
Class CA | 3,738 |
| $ 31,735 |
A When Class B and Class C shares are initially sold, FDC pays commissions from its own resources to financial intermediaries through which the sales are made.
Transfer Agent Fees. Fidelity Investments Institutional Operations Company, Inc., (FIIOC), an affiliate of the investment adviser, is the transfer, dividend disbursing and shareholder servicing agent for each class of the Fund. FIIOC receives account fees and asset-based fees that vary according to the account size and type of account of the shareholders of the respective classes of the Fund. FIIOC pays for typesetting, printing and mailing of shareholder reports, except proxy statements.
Annual Report
Notes to Financial Statements - continued
5. Fees and Other Transactions with Affiliates - continued
Transfer Agent Fees - continued
For the period, transfer agent fees for each class were as follows:
| Amount | % of
Class-Level Average
Net Assets |
Class A | $ 78,679 | .27 |
Class T | 32,323 | .30 |
Class B | 2,026 | .30 |
Class C | 32,269 | .28 |
International Small Cap Opportunities | 1,405,016 | .23 |
Class I | 153,878 | .19 |
| $ 1,704,191 | |
Accounting and Security Lending Fees. Fidelity Service Company, Inc. (FSC), an affiliate of the investment adviser, maintains the Fund's accounting records. The accounting fee is based on the level of average net assets for each month. Under a separate contract, FSC administers the security lending program. The security lending fee is based on the number and duration of lending transactions.
Brokerage Commissions. The Fund placed a portion of its portfolio transactions with brokerage firms which are affiliates of the investment adviser. Brokerage commissions are included in net realized gain (loss) and change in net unrealized appreciation (depreciation) in the Statement of Operations. The commissions paid to these affiliated firms were $318 for the period.
Other. During the period, the investment adviser reimbursed the Fund for certain losses in the amount of $8,890.
6. Committed Line of Credit.
The Fund participates with other funds managed by the investment adviser or an affiliate in a $4.25 billion credit facility (the "line of credit") to be utilized for temporary or emergency purposes to fund shareholder redemptions or for other short-term liquidity purposes. The Fund has agreed to pay commitment fees on its pro-rata portion of the line of credit, which amounted to $1,034 and is reflected in Miscellaneous expenses on the Statement of Operations. During the period, the Fund did not borrow on this line of credit.
7. Security Lending.
The Fund lends portfolio securities through a lending agent from time to time in order to earn additional income. For equity securities, a lending agent is used and may loan securities to certain qualified borrowers, including Fidelity Capital Markets (FCM), a
Annual Report
7. Security Lending - continued
broker-dealer affiliated with the Fund. On the settlement date of the loan, the Fund receives collateral (in the form of U.S. Treasury obligations, letters of credit and/or cash) against the loaned securities and maintains collateral in an amount not less than 100% of the market value of the loaned securities during the period of the loan. The market value of the loaned securities is determined at the close of business of the Fund and any additional required collateral is delivered to the Fund on the next business day. The Fund or borrower may terminate the loan at any time, and if the borrower defaults on its obligation to return the securities loaned because of insolvency or other reasons, the Fund may apply collateral received from the borrower against the obligation. The Fund may experience delays and costs in recovering the securities loaned. Any cash collateral received is invested in the Fidelity Securities Lending Cash Central Fund. The value of loaned securities and cash collateral at period end are disclosed on the Fund's Statement of Assets and Liabilities. Security lending income represents the income earned on investing cash collateral, less rebates paid to borrowers and any lending agent fees associated with the loan, plus any premium payments received for lending certain types of securities. Security lending income is presented in the Statement of Operations as a component of income from Fidelity Central Funds. Total security lending income during the period amounted to $43,254. During the period, there were no securities loaned to FCM.
8. Expense Reductions.
Commissions paid to certain brokers with whom the investment adviser, or its affiliates, places trades on behalf of the Fund include an amount in addition to trade execution, which may be rebated back to the Fund to offset certain expenses. This amount totaled $29,791 for the period.
In addition, during the period the investment adviser reimbursed and/or waived a portion of fund-level operating expenses in the amount of $3,109 and a portion of class-level operating expenses as follows:
| Amount |
Class A | $ 113 |
Class T | 25 |
Class B | 1 |
Class C | 24 |
International Small Cap Opportunities | 12,565 |
Class I | 454 |
| $ 13,182 |
Annual Report
Notes to Financial Statements - continued
9. Distributions to Shareholders.
Distributions to shareholders of each class were as follows:
Years ended October 31, | 2015 | 2014 |
From net investment income | | |
Class A | $ 91,925 | $ 88,584 |
Class T | 4,261 | 17,038 |
International Small Cap Opportunities | 3,599,410 | 3,435,414 |
Class I | 286,715 | 39,565 |
Total | $ 3,982,311 | $ 3,580,601 |
From net realized gain | | |
Class A | $ 38,609 | $ 127,238 |
Class T | 14,913 | 56,084 |
Class C | - | 33,933 |
International Small Cap Opportunities | 839,863 | 2,982,391 |
Class I | 56,271 | 33,974 |
Total | $ 949,656 | $ 3,233,620 |
10. Share Transactions.
Share transactions for each class were as follows and may contain automatic conversions between classes or exchanges between funds:
| Shares | Dollars |
Years ended October 31, | 2015 | 2014 | 2015 | 2014 |
Class A | | | | |
Shares sold | 1,605,762 | 589,478 | $ 23,674,805 | $ 8,266,636 |
Reinvestment of distributions | 9,185 | 14,226 | 124,545 | 191,200 |
Shares redeemed | (582,997) | (381,134) | (8,244,833) | (5,353,937) |
Net increase (decrease) | 1,031,950 | 222,570 | $ 15,554,517 | $ 3,103,899 |
Class T | | | | |
Shares sold | 309,765 | 159,216 | $ 4,543,322 | $ 2,266,530 |
Reinvestment of distributions | 1,404 | 5,309 | 18,926 | 70,882 |
Shares redeemed | (134,926) | (142,062) | (1,907,198) | (1,989,964) |
Net increase (decrease) | 176,243 | 22,463 | $ 2,655,050 | $ 347,448 |
Class B | | | | |
Shares sold | 9,791 | 1,461 | $ 136,845 | $ 20,212 |
Shares redeemed | (23,615) | (51,497) | (329,326) | (706,187) |
Net increase (decrease) | (13,824) | (50,036) | $ (192,481) | $ (685,975) |
Class C | | | | |
Shares sold | 838,785 | 200,445 | $ 12,019,463 | $ 2,745,030 |
Reinvestment of distributions | - | 2,336 | - | 30,621 |
Shares redeemed | (258,762) | (172,604) | (3,578,649) | (2,374,401) |
Net increase (decrease) | 580,023 | 30,177 | $ 8,440,814 | $ 401,250 |
Annual Report
10. Share Transactions - continued
| Shares | Dollars |
Years ended October 31, | 2015 | 2014 | 2015 | 2014 |
International Small Cap Opportunities | | | | |
Shares sold | 18,903,102 | 13,421,171 | $ 282,906,392 | $ 191,269,160 |
Reinvestment of distributions | 239,997 | 360,554 | 3,280,752 | 4,881,895 |
Shares redeemed | (10,354,861) | (8,930,544) | (146,998,081) | (127,222,877) |
Net increase (decrease) | 8,788,238 | 4,851,181 | $ 139,189,063 | $ 68,928,178 |
Class I | | | | |
Shares sold | 7,108,830 | 2,469,158 | $ 102,023,907 | $ 34,766,175 |
Reinvestment of distributions | 23,468 | 4,980 | 320,812 | 67,530 |
Shares redeemed | (1,195,608) | (724,026) | (17,368,101) | (9,726,800) |
Net increase (decrease) | 5,936,690 | 1,750,112 | $ 84,976,618 | $ 25,106,905 |
11. Other.
The Fund's organizational documents provide former and current trustees and officers with a limited indemnification against liabilities arising in connection with the performance of their duties to the Fund. In the normal course of business, the Fund may also enter into contracts that provide general indemnifications. The Fund's maximum exposure under these arrangements is unknown as this would be dependent on future claims that may be made against the Fund. The risk of material loss from such claims is considered remote.
Annual Report
To the Trustees of Fidelity Investment Trust and Shareholders of Fidelity International Small Cap Opportunities Fund:
We have audited the accompanying statement of assets and liabilities of Fidelity International Small Cap Opportunities Fund (the Fund), a fund of Fidelity Investment Trust, including the schedule of investments, as of October 31, 2015, and the related statement of operations for the year then ended, the statement of changes in net assets for each of the two years in the period then ended, and the financial highlights for each of the five years in the period then ended. These financial statements and financial highlights are the responsibility of the Fund's management. Our responsibility is to express an opinion on these financial statements and financial highlights based on our audits.
We conducted our audits in accordance with the standards of the Public Company Accounting Oversight Board (United States). Those standards require that we plan and perform the audit to obtain reasonable assurance about whether the financial statements and financial highlights are free of material misstatement. The Fund is not required to have, nor were we engaged to perform, an audit of its internal control over financial reporting. Our audits included consideration of internal control over financial reporting as a basis for designing audit procedures that are appropriate in the circumstances, but not for the purpose of expressing an opinion on the effectiveness of the Fund's internal control over financial reporting. Accordingly, we express no such opinion. An audit also includes examining, on a test basis, evidence supporting the amounts and disclosures in the financial statements, assessing the accounting principles used and significant estimates made by management, as well as evaluating the overall financial statement presentation. Our procedures included confirmation of securities owned as of October 31, 2015, by correspondence with the custodians and brokers; when replies were not received from brokers, we performed other auditing procedures. We believe that our audits provide a reasonable basis for our opinion.
In our opinion, such financial statements and financial highlights referred to above present fairly, in all material respects, the financial position of Fidelity International Small Cap Opportunities Fund as of October 31, 2015, the results of its operations for the year then ended, the changes in its net assets for each of the two years in the period then ended, and the financial highlights for each of the five years in the period then ended, in conformity with accounting principles generally accepted in the United States of America.
DELOITTE & TOUCHE LLP
Boston, Massachusetts
December 16, 2015
Annual Report
The Trustees, Member of the Advisory Board, and officers of the trust and fund, as applicable, are listed below. The Board of Trustees governs the fund and is responsible for protecting the interests of shareholders. The Trustees are experienced executives who meet periodically throughout the year to oversee the fund's activities, review contractual arrangements with companies that provide services to the fund, oversee management of the risks associated with such activities and contractual arrangements, and review the fund's performance. Each of the Trustees oversees 170 funds.
The Trustees hold office without limit in time except that (a) any Trustee may resign; (b) any Trustee may be removed by written instrument, signed by at least two-thirds of the number of Trustees prior to such removal; (c) any Trustee who requests to be retired or who has become incapacitated by illness or injury may be retired by written instrument signed by a majority of the other Trustees; and (d) any Trustee may be removed at any special meeting of shareholders by a two-thirds vote of the outstanding voting securities of the trust. Each Trustee who is not an interested person (as defined in the 1940 Act) of the trust and the fund (Independent Trustee), shall retire not later than the last day of the calendar year in which his or her 75th birthday occurs. The Independent Trustees may waive this mandatory retirement age policy with respect to individual Trustees. The officers and Advisory Board Member hold office without limit in time, except that any officer and Advisory Board Member may resign or may be removed by a vote of a majority of the Trustees at any regular meeting or any special meeting of the Trustees. Except as indicated, each individual has held the office shown or other offices in the same company for the past five years.
Experience, Skills, Attributes, and Qualifications of the Fund's Trustees. The Governance and Nominating Committee has adopted a statement of policy that describes the experience, qualifications, attributes, and skills that are necessary and desirable for potential Independent Trustee candidates (Statement of Policy). The Board believes that each Trustee satisfied at the time he or she was initially elected or appointed a Trustee, and continues to satisfy, the standards contemplated by the Statement of Policy. The Governance and Nominating Committee also engages professional search firms to help identify potential Independent Trustee candidates who have the experience, qualifications, attributes, and skills consistent with the Statement of Policy. From time to time, additional criteria based on the composition and skills of the current Independent Trustees, as well as experience or skills that may be appropriate in light of future changes to board composition, business conditions, and regulatory or other developments, have also been considered by the professional search firms and the Governance and Nominating Committee. In addition, the Board takes into account the Trustees' commitment and participation in Board and committee meetings, as well as their leadership of standing and ad hoc committees throughout their tenure.
In determining that a particular Trustee was and continues to be qualified to serve as a Trustee, the Board has considered a variety of criteria, none of which, in isolation, was controlling. The Board believes that, collectively, the Trustees have balanced and diverse experience, qualifications, attributes, and skills, which allow the Board to operate effectively in governing the fund and protecting the interests of shareholders. Information about the specific experience, skills, attributes, and qualifications of each Trustee, which in each case led to the Board's conclusion that the Trustee should serve (or continue to serve) as a trustee of the fund, is provided below.
Annual Report
Board Structure and Oversight Function. James C. Curvey is an interested person (as defined in the 1940 Act) and currently serves as Chairman. The Trustees have determined that an interested Chairman is appropriate and benefits shareholders because an interested Chairman has a personal and professional stake in the quality and continuity of services provided to the fund. Independent Trustees exercise their informed business judgment to appoint an individual of their choosing to serve as Chairman, regardless of whether the Trustee happens to be independent or a member of management. The Independent Trustees have determined that they can act independently and effectively without having an Independent Trustee serve as Chairman and that a key structural component for assuring that they are in a position to do so is for the Independent Trustees to constitute a substantial majority for the Board. The Independent Trustees also regularly meet in executive session. Ned C. Lautenbach serves as Chairman of the Independent Trustees and as such (i) acts as a liaison between the Independent Trustees and management with respect to matters important to the Independent Trustees and (ii) with management prepares agendas for Board meetings.
Fidelity funds are overseen by different Boards of Trustees. The fund's Board oversees Fidelity's high income and certain equity funds, and other Boards oversee Fidelity's investment-grade bond, money market, asset allocation, and sector funds. The asset allocation funds may invest in Fidelity funds overseen by the fund's Board. The use of separate Boards, each with its own committee structure, allows the Trustees of each group of Fidelity funds to focus on the unique issues of the funds they oversee, including common research, investment, and operational issues. On occasion, the separate Boards establish joint committees to address issues of overlapping consequences for the Fidelity funds overseen by each Board.
The Trustees operate using a system of committees to facilitate the timely and efficient consideration of all matters of importance to the Trustees, the fund, and fund shareholders and to facilitate compliance with legal and regulatory requirements and oversight of the fund's activities and associated risks. The Board, acting through its committees, has charged FMR and its affiliates with (i) identifying events or circumstances the occurrence of which could have demonstrably adverse effects on the fund's business and/or reputation; (ii) implementing processes and controls to lessen the possibility that such events or circumstances occur or to mitigate the effects of such events or circumstances if they do occur; and (iii) creating and maintaining a system designed to evaluate continuously business and market conditions in order to facilitate the identification and implementation processes described in (i) and (ii) above. Because the day-to-day operations and activities of the fund are carried out by or through FMR, its affiliates and other service providers, the fund's exposure to risks is mitigated but not eliminated by the processes overseen by the Trustees. While each of the Board's committees has responsibility for overseeing different aspects of the fund's activities, oversight is exercised primarily through the Operations, Audit, and Compliance Committees. In addition, the Independent Trustees have worked with FMR to enhance the Board's oversight of investment and financial risks, legal and regulatory risks, technology risks, and operational risks, including the development of additional risk reporting to the Board. For example, a working group comprised of Independent Trustees and FMR has worked and continues to work to review the Fidelity funds' valuation-related activities, reporting and risk management. Appropriate personnel, including but not limited to the fund's Chief Compliance Officer (CCO), FMR's internal auditor, the independent accountants, the fund's Treasurer and portfolio management personnel, make periodic reports to the Board's committees, as appropriate, including an annual review of Fidelity's risk management program for the Fidelity funds. The responsibilities of each standing committee, including their oversight responsibilities, are described further under "Standing Committees of the Fund's Trustees."
Annual Report
Trustees and Officers - continued
The fund's Statement of Additional Information (SAI) includes more information about the Trustees. To request a free copy, call Fidelity at 1-877-208-0098.
Interested Trustees*:
Correspondence intended for each Trustee who is an interested person may be sent to Fidelity Investments, 245 Summer Street, Boston, Massachusetts 02210.
Name, Year of Birth; Principal Occupations and Other Relevant Experience+ |
James C. Curvey (1935) |
Year of Election or Appointment: 2007 Trustee Chairman of the Board of Trustees |
| Mr. Curvey also serves as Trustee of other Fidelity funds. Mr. Curvey is a Director of Fidelity Research & Analysis Co. (investment adviser firm, 2009-present), and Vice Chairman (2007-present) and Director of FMR LLC (diversified financial services company). In addition, Mr. Curvey serves as an Overseer for the Boston Symphony Orchestra and a member of the board of Artis-Naples, Naples, Florida, and as a Trustee for Brewster Academy, Wolfeboro, New Hampshire. Previously, Mr. Curvey served as a Director of Fidelity Investments Money Management, Inc. (investment adviser firm, 2009-2014) and a Director of FMR and FMR Co., Inc. (investment adviser firms, 2007-2014). |
Charles S. Morrison (1960) |
Year of Election or Appointment: 2014 Trustee |
| Mr. Morrison also serves as Trustee of other funds. He serves as a Director of Fidelity Investments Money Management, Inc. (FIMM) (investment adviser firm, 2014-present), Director of Fidelity SelectCo, LLC (investment adviser firm, 2014-present), President, Asset Management (2014-present), and is an employee of Fidelity Investments. Previously, Mr. Morrison served as Vice President of Fidelity's Fixed Income and Asset Allocation Funds (2012-2014), President, Fixed Income (2011-2014), Vice President of Fidelity's Money Market Funds (2005-2009), President, Money Market Group Leader of FMR (investment adviser firm, 2009), and Senior Vice President, Money Market Group of FMR (2004-2009). Mr. Morrison also served as Vice President of Fidelity's Bond Funds (2002-2005), certain Balanced Funds (2002-2005), and certain Asset Allocation Funds (2002-2007), and as Senior Vice President (2002-2005) of Fidelity's Bond Division. |
* Trustees have been determined to be "Interested Trustees" by virtue of, among other things, their affiliation with the trust or various entities under common control with FMR.
+ The information above includes each Trustee's principal occupation during the last five years and other information relating to the experience, attributes, and skills relevant to each Trustee's qualifications to serve as a Trustee, which led to the conclusion that each Trustee should serve as a Trustee for the fund.
Annual Report
Trustees and Officers - continued
Independent Trustees:
Correspondence intended for each Independent Trustee (that is, the Trustees other than the Interested Trustees) may be sent to Fidelity Investments, P.O. Box 55235, Boston, Massachusetts 02205-5235.
Name, Year of Birth; Principal Occupations and Other Relevant Experience+ |
Dennis J. Dirks (1948) |
Year of Election or Appointment: 2005 Trustee |
| Mr. Dirks also serves as Trustee of other Fidelity funds. Prior to his retirement in May 2003, Mr. Dirks was Chief Operating Officer and a member of the Board of The Depository Trust & Clearing Corporation (DTCC). He also served as President, Chief Operating Officer, and Board member of The Depository Trust Company (DTC) and President and Board member of the National Securities Clearing Corporation (NSCC). In addition, Mr. Dirks served as Chief Executive Officer and Board member of the Government Securities Clearing Corporation, Chief Executive Officer and Board member of the Mortgage-Backed Securities Clearing Corporation, as a Trustee and a member of the Finance Committee of Manhattan College (2005-2008), as a Trustee and a member of the Finance Committee of AHRC of Nassau County (2006-2008), and as a member of the Independent Directors Council (IDC) Governing Council (2010-2015). Mr. Dirks is a member of the Board of Directors for The Brookville Center for Children's Services, Inc. (2009-present). |
Alan J. Lacy (1953) |
Year of Election or Appointment: 2008 Trustee |
| Mr. Lacy also serves as Trustee of other Fidelity funds. Mr. Lacy serves as a member of the Board of Directors of Dave & Buster's Entertainment, Inc. (restaurant and entertainment complexes, 2010-present) and Bristol-Myers Squibb Company (global pharmaceuticals, 2008-present). In addition, Mr. Lacy served as Senior Adviser (2007-2014) of Oak Hill Capital Partners, L.P. (private equity) and also served as Chief Executive Officer (2000-2005) and Vice Chairman (2005-2006) of Sears Holdings Corporation and Sears, Roebuck and Co. (retail). Mr. Lacy is a member of the Board of Trustees of The National Parks Conservation Association (2006-present). Previously, Mr. Lacy served as Chairman of the Board of Trustees of the National Parks Conservation Association (2008-2011) and as a member of the Board of Directors for The Western Union Company (global money transfer, 2006-2011), The Hillman Companies, Inc. (hardware wholesalers, 2010-2014), and Earth Fare, Inc. (retail grocery, 2010-2014). |
Ned C. Lautenbach (1944) |
Year of Election or Appointment: 2000 Trustee Chairman of the Independent Trustees |
| Mr. Lautenbach also serves as Trustee of other Fidelity funds. Mr. Lautenbach currently serves as the Lead Director of the Eaton Corporation Board of Directors (diversified industrial, 1997-present). Mr. Lautenbach is Chairman of the Board of Directors of Artis-Naples in Naples, Florida (2012-present), a member of the Council on Foreign Relations (1994-present), and a member of the Board of Governors, State University System of Florida (2013-present). Previously, Mr. Lautenbach was a Partner/Advisory Partner at Clayton, Dubilier & Rice, LLC (private equity investment, 1998-2010), as well as a Director of Sony Corporation (2006-2007). |
Joseph Mauriello (1944) |
Year of Election or Appointment: 2008 Trustee |
| Mr. Mauriello also serves as Trustee of other Fidelity funds. Prior to his retirement in January 2006, Mr. Mauriello served in numerous senior management positions including Deputy Chairman and Chief Operating Officer (2004-2005), and Vice Chairman of Financial Services (2002-2004) of KPMG LLP US (professional services, 1965-2005). Mr. Mauriello currently serves as a member of the Board of Directors of XL Group plc. (global insurance and re-insurance, 2006-present) and the Independent Directors Council (IDC) Governing Council (2015-present). Previously, Mr. Mauriello served as a Director of the Hamilton Funds of the Bank of New York (2006-2007) and of Arcadia Resources Inc. (health care services and products, 2007-2012). |
Robert W. Selander (1950) |
Year of Election or Appointment: 2011 Trustee |
| Mr. Selander also serves as Trustee of other Fidelity funds. Mr. Selander serves as a Director of The Western Union Company (global money transfer, 2014-present). Previously, Mr. Selander served as a Member of the Advisory Board of other Fidelity funds (2011), and Executive Vice Chairman (2010), Chief Executive Officer (2009-2010), and President and Chief Executive Officer (1997-2009) of Mastercard, Inc. |
Cornelia M. Small (1944) |
Year of Election or Appointment: 2005 Trustee |
| Ms. Small also serves as Trustee of other Fidelity funds. Ms. Small is a member of the Board of Directors (2009-present) and Chair of the Investment Committee (2010-present) of the Teagle Foundation. Ms. Small also serves on the Investment Committee of the Berkshire Taconic Community Foundation (2008-present). Previously, Ms. Small served as Chairperson (2002-2008) and a member of the Investment Committee and Chairperson (2008-2012) and a member of the Board of Trustees of Smith College. In addition, Ms. Small served as Chief Investment Officer, Director of Global Equity Investments, and a member of the Board of Directors of Scudder, Stevens & Clark and Scudder Kemper Investments. |
William S. Stavropoulos (1939) |
Year of Election or Appointment: 2001 Trustee Vice Chairman of the Independent Trustees |
| Mr. Stavropoulos also serves as Trustee of other Fidelity funds. Mr. Stavropoulos serves as President and Founder of the Michigan Baseball Foundation, the Great Lakes Loons (2007-present). Mr. Stavropoulos is Chairman Emeritus of the Board of Directors of The Dow Chemical Company, where he previously served in numerous senior management positions, including President, CEO (1995-2000; 2002-2004), Chairman of the Executive Committee (2000-2006), and as a member of the Board of Directors (1990-2006). Currently, Mr. Stavropoulos is Chairman of the Board of Directors of Univar Inc. (global distributor of commodity and specialty chemicals), a Director of Teradata Corporation (data warehousing and technology solutions), and Maersk Inc. (industrial conglomerate), and a member of the Advisory Board for Metalmark Capital LLC (private equity investment, 2005-present). Mr. Stavropoulos is an operating advisor to Clayton, Dubilier & Rice, LLC (private equity investment). In addition, Mr. Stavropoulos is a member of the University of Notre Dame Advisory Council for the College of Science, a Trustee of the Rollin L. Gerstacker Foundation, and a Director of the Naples Philharmonic Center for the Arts. Previously, Mr. Stavropoulos served as a Director of Chemical Financial Corporation (bank holding company, 1993-2012) and Tyco International, Ltd. (multinational manufacturing and services, 2007-2012). |
David M. Thomas (1949) |
Year of Election or Appointment: 2008 Trustee |
| Mr. Thomas also serves as Trustee of other Fidelity funds. Mr. Thomas serves as Non-Executive Chairman of the Board of Directors of Fortune Brands Home and Security (home and security products, 2011-present), as a member of the Board of Directors (2004-present) and Presiding Director (2013-present) of Interpublic Group of Companies, Inc. (marketing communication), and as a member of the Board of Trustees of the University of Florida (2013-present). Previously, Mr. Thomas served as Executive Chairman (2005-2006) and Chairman and Chief Executive Officer (2000-2005) of IMS Health, Inc. (pharmaceutical and healthcare information solutions), and a Director of Fortune Brands, Inc. (consumer products, 2000-2011). |
+ The information above includes each Trustee's principal occupation during the last five years and other information relating to the experience, attributes, and skills relevant to each Trustee's qualifications to serve as a Trustee, which led to the conclusion that each Trustee should serve as a Trustee for the fund.
Advisory Board Member and Officers:
Correspondence intended for each officer and Peter S. Lynch may be sent to Fidelity Investments, 245 Summer Street, Boston, Massachusetts 02210. Officers appear below in alphabetical order.
Name, Year of Birth; Principal Occupation |
Peter S. Lynch (1944) |
Year of Election or Appointment: 2003 Member of the Advisory Board |
| Mr. Lynch also serves as Member of the Advisory Board of other Fidelity funds. Mr. Lynch is Vice Chairman and a Director of FMR (investment adviser firm) and FMR Co., Inc. (investment adviser firm). In addition, Mr. Lynch serves as a Trustee of Boston College and as the Chairman of the Inner-City Scholarship Fund. Previously, Mr. Lynch served on the Special Olympics International Board of Directors (1997-2006). |
Elizabeth Paige Baumann (1968) |
Year of Election or Appointment: 2012 Anti-Money Laundering (AML) Officer |
| Ms. Baumann also serves as AML Officer of other funds. She is Chief AML Officer of FMR LLC (diversified financial services company, 2012-present) and is an employee of Fidelity Investments. Previously, Ms. Baumann served as Vice President and Deputy Anti-Money Laundering Officer (2007-2012). |
Marc R. Bryant (1966) |
Year of Election or Appointment: 2015 Secretary and Chief Legal Officer (CLO) |
| Mr. Bryant also serves as Secretary and CLO of other funds. Mr. Bryant serves as CLO, Secretary, and Senior Vice President of Fidelity Management & Research Company (investment adviser firm, 2015-present) and FMR Co., Inc. (investment adviser firm, 2015-present); Secretary of Fidelity SelectCo, LLC (investment adviser firm, 2015-present) and Fidelity Investments Money Management, Inc. (investment adviser firm, 2015-present); and CLO of Fidelity Management & Research (Hong Kong) Limited (investment adviser firm, 2015-present). He is Senior Vice President and Deputy General Counsel of FMR LLC (diversified financial services company). Previously, Mr. Bryant served as Secretary and Chief Legal Officer of Fidelity Rutland Square Trust II (2010-2014) and Assistant Secretary of Fidelity's Fixed Income and Asset Allocation Funds (2013-2015). Prior to joining Fidelity Investments, Mr. Bryant served as a Senior Vice President and the Head of Global Retail Legal for AllianceBernstein L.P. (2006-2010), and as the General Counsel for ProFund Advisors LLC (2001-2006). |
William C. Coffey (1969) |
Year of Election or Appointment: 2009 Assistant Secretary |
| Mr. Coffey also serves as Assistant Secretary of other funds. He is Senior Vice President and Deputy General Counsel of FMR LLC (diversified financial services company, 2010-present), and is an employee of Fidelity Investments. Previously, Mr. Coffey served as Vice President and Associate General Counsel of FMR LLC (2005-2009). |
Timothy M. Cohen (1969) |
Year of Election or Appointment: 2014 Vice President of certain Equity Funds |
| Mr. Cohen also serves as Vice President of other funds. Mr. Cohen serves as Chief Compliance Officer of FMR Investment Management (U.K.) Limited (investment adviser firm, 2013-present) and is an employee of Fidelity Investments. Previously, Mr. Cohen served as a Director of FMR Investment Management (U.K.) Limited (2013-2015). |
Jonathan Davis (1968) |
Year of Election or Appointment: 2010 Assistant Treasurer |
| Mr. Davis also serves as Assistant Treasurer of other funds, and is an employee of Fidelity Investments. Previously, Mr. Davis served as Vice President and Associate General Counsel of FMR LLC (diversified financial services company, 2003-2010). |
Adrien E. Deberghes (1967) |
Year of Election or Appointment: 2008 Deputy Treasurer |
| Mr. Deberghes also serves as an officer of other funds. He is an employee of Fidelity Investments (2008-present). Prior to joining Fidelity Investments, Mr. Deberghes was Senior Vice President of Mutual Fund Administration at State Street Corporation (2007-2008), Senior Director of Mutual Fund Administration at Investors Bank & Trust (2005-2007), and Director of Finance for Dunkin' Brands (2000-2005). |
Stephanie J. Dorsey (1969) |
Year of Election or Appointment: 2010 Assistant Treasurer |
| Ms. Dorsey also serves as an officer of other funds. She is an employee of Fidelity Investments (2008-present) and has served in other fund officer roles. Prior to joining Fidelity Investments, Ms. Dorsey served as Treasurer (2004-2008) of the JPMorgan Mutual Funds and Vice President (2004-2008) of JPMorgan Chase Bank. |
Howard J. Galligan III (1966) |
Year of Election or Appointment: 2014 Chief Financial Officer |
| Mr. Galligan also serves as Chief Financial Officer of other funds. Mr. Galligan serves as President of Fidelity Pricing and Cash Management Services (FPCMS) (2014-present) and as a Director of Strategic Advisers, Inc. (investment adviser firm, 2008-present). Previously, Mr. Galligan served as Chief Administrative Officer of Asset Management (2011-2014) and Chief Operating Officer and Senior Vice President of Investment Support for Strategic Advisers, Inc. (2003-2011). |
Scott C. Goebel (1968) |
Year of Election or Appointment: 2015 Vice President |
| Mr. Goebel serves as Vice President of other funds and is an employee of Fidelity Investments (2001-present). Previously, Mr. Goebel served as Secretary of Fidelity SelectCo, LLC (investment adviser firm, 2013-2015), Fidelity Investments Money Management, Inc. (FIMM) (investment adviser firm, 2010-2015), and Fidelity Research and Analysis Company (FRAC) (investment adviser firm, 2010-2015); General Counsel, Secretary, and Senior Vice President of Fidelity Management & Research Company (investment adviser firm, 2008-2015) and FMR Co., Inc. (investment adviser firm, 2008-2015); Assistant Secretary of Fidelity Management & Research (Japan) Limited (investment adviser firm, 2008-2015) and FMR Investment Management (U.K.) Limited (investment adviser firm, 2008-2015); Chief Legal Officer (CLO) of Fidelity Management & Research (Hong Kong) Limited (investment adviser firm, 2008-2015); Secretary and CLO of certain Fidelity funds (2008-2015); Assistant Secretary of FIMM (2008-2010), FRAC (2008-2010), and certain funds (2007-2008); and as Vice President and Secretary of Fidelity Distributors Corporation (FDC) (2005-2007). |
Brian B. Hogan (1964) |
Year of Election or Appointment: 2009 Vice President |
| Mr. Hogan also serves as Trustee or Vice President of other funds. Mr. Hogan serves as a Director of Fidelity SelectCo, LLC (investment adviser firm, 2014-present) and President of the Equity Division of FMR (investment adviser firm, 2009-present). Previously, Mr. Hogan served as Senior Vice President, Equity Research of FMR (2006-2009) and as a portfolio manager. |
Chris Maher (1972) |
Year of Election or Appointment: 2013 Assistant Treasurer |
| Mr. Maher serves as Assistant Treasurer of other funds. Mr. Maher is Vice President of Valuation Oversight and is an employee of Fidelity Investments. Previously, Mr. Maher served as Vice President of Asset Management Compliance (2013), Vice President of the Program Management Group of FMR (investment adviser firm, 2010-2013), and Vice President of Valuation Oversight (2008-2010). |
Kenneth B. Robins (1969) |
Year of Election or Appointment: 2008 President and Treasurer |
| Mr. Robins also serves as an officer of other funds. Mr. Robins serves as Executive Vice President of Fidelity Investments Money Management, Inc. (FIMM) (investment adviser firm, 2013-present) and is an employee of Fidelity Investments (2004-present). Previously, Mr. Robins served in other fund officer roles. |
Stacie M. Smith (1974) |
Year of Election or Appointment: 2013 Deputy Treasurer |
| Ms. Smith also serves as an officer of other funds. She is an employee of Fidelity Investments (2009-present) and has served in other fund officer roles. Prior to joining Fidelity Investments, Ms. Smith served as Senior Audit Manager of Ernst & Young LLP (1996-2009). |
Renee Stagnone (1975) |
Year of Election or Appointment: 2013 Deputy Treasurer |
| Ms. Stagnone also serves as Deputy Treasurer of other funds. Ms. Stagnone is an employee of Fidelity Investments (1997-present). |
Linda J. Wondrack (1964) |
Year of Election or Appointment: 2014 Chief Compliance Officer |
| Ms. Wondrack also serves as Chief Compliance Officer of other funds. Ms. Wondrack is Executive Vice President and head of the Ethics Office and Asset Management Compliance for Fidelity Investments (2012-present). Ms. Wondrack also serves as Chief Compliance Officer of Fidelity SelectCo, LLC (investment adviser firm, 2014-present); Chief Compliance Officer of Impresa Management LLC (2013-present); and Chief Compliance Officer of FMR Co., Inc. (investment adviser firm), Fidelity Investments Money Management, Inc. (investment adviser firm), Fidelity Management & Research (Japan) Limited (investment adviser firm), FMR Investment Management (U.K.) Limited (investment adviser firm), Fidelity Management & Research (Hong Kong) (investment adviser firm), Fidelity Management & Research Company (investment adviser firm), FIAM LLC (investment adviser firm), and Strategic Advisers, Inc. (investment adviser firm), Ballyrock Investment Advisors LLC, and Northern Neck Investors LLC (2012-present). Previously, Ms. Wondrack served as Senior Vice President and Chief Compliance Officer for Columbia Management Investment Advisers, LLC (2005-2012); Chief Compliance Officer for certain funds within the Columbia Family of Funds (2007-2012); and Senior Vice President of Compliance Risk Management at Bank of America (2005-2010). |
Joseph F. Zambello (1957) |
Year of Election or Appointment: 2011 Deputy Treasurer |
| Mr. Zambello also serves as Deputy Treasurer of other funds. Mr. Zambello is an employee of Fidelity Investments (1991-present). Previously, Mr. Zambello served as Vice President of the Program Management Group of FMR (investment adviser firm, 2009-2011) and Vice President of the Transfer Agent Oversight Group (2005-2009). |
Annual Report
The Board of Trustees of Advisor International Small Cap Opportunities Fund voted to pay to shareholders of record at the opening of business on record date, the following distributions per share derived from capital gains realized from sales of portfolio securities, and dividends derived from net investment income:
| Pay Date | Record Date | Dividends | Capital Gains |
Class A | 12/07/15 | 12/04/15 | $0.052 | $0.070 |
Class T | 12/07/15 | 12/04/15 | $0.010 | $0.070 |
Class B | 12/07/15 | 12/04/15 | $0.000 | $0.000 |
Class C | 12/07/15 | 12/04/15 | $0.000 | $0.053 |
Class A designates 14% and Class T designates 26% of the dividends distributed in December 2014 during the fiscal year as qualifying for the dividends-received deduction for corporate shareholders.
Class A and Class T designates 100% of the dividends distributed in December 2014 during the fiscal year as amounts which may be taken into account as a dividend for purposes of the maximum rate under section 1(h) (11) of the Internal Revenue Code.
The amounts per share which represent income derived from sources within, and taxes paid to, foreign countries or possessions of the United States are as follows:
| Pay Date | Income | Taxes |
Class A | 12/08/2014 | $0.0929 | $0.0219 |
Class T | 12/08/2014 | $0.0489 | $0.0219 |
The fund will notify shareholders in January 2016 of amounts for use in preparing 2015 income tax returns.
Annual Report
Fidelity International Small Cap Opportunities Fund
Each year, the Board of Trustees, including the Independent Trustees (together, the Board), votes on the renewal of the management contract with Fidelity Management & Research Company (FMR) and the sub-advisory agreements (together, the Advisory Contracts) for the fund. The Board, assisted by the advice of fund counsel and Independent Trustees' counsel, requests and considers a broad range of information relevant to the renewal of the Advisory Contracts throughout the year.
The Board meets regularly and, at each of its meetings, covers an extensive agenda of topics and materials and considers factors that are relevant to its annual consideration of the renewal of the fund's Advisory Contracts, including the services and support provided to the fund and its shareholders. The Board has established various standing committees (Committees), each composed of and chaired by Independent Trustees with varying backgrounds, to which the Board has assigned specific subject matter responsibilities in order to enhance effective decision-making by the Board. The Board, acting directly and through its Committees, requests and receives information concerning the annual consideration of the renewal of the fund's Advisory Contracts. The Board also meets as needed to consider matters specifically related to the Board's annual consideration of the renewal of the Advisory Contracts. Members of the Board may also meet with trustees of other Fidelity funds through ad hoc joint committees to discuss certain matters relevant to all of the Fidelity funds.
At its July 2015 meeting, the Board unanimously determined to renew the fund's Advisory Contracts. In reaching its determination, the Board considered all factors it believed relevant, including (i) the nature, extent, and quality of the services to be provided to the fund and its shareholders (including the investment performance of the fund); (ii) the competitiveness of the fund's management fee and total expense ratio relative to peer funds; (iii) the total costs of the services to be provided by and the profits to be realized by Fidelity from its relationship with the fund; and (iv) the extent to which (if any) economies of scale exist and would be realized as the fund grows, and whether any economies of scale are appropriately shared with fund shareholders.
In considering whether to renew the Advisory Contracts for the fund, the Board reached a determination, with the assistance of fund counsel and Independent Trustees' counsel and through the exercise of its business judgment, that the renewal of the Advisory Contracts was in the best interests of the fund and its shareholders and that the compensation payable under the Advisory Contracts was fair and reasonable. The Board's decision to renew the Advisory Contracts was not based on any single factor, but rather was based on a comprehensive consideration of all the information provided to the Board at its meetings throughout the year. The Board, in reaching its determination to renew the Advisory Contracts, was aware that shareholders of the fund have a broad range of investment choices available to them, including a wide choice among funds offered by Fidelity's competitors, and that the fund's shareholders, who have the opportunity to review and weigh the disclosure provided by the fund in its prospectus and other public disclosures, have chosen to invest in this fund, which is part of the Fidelity family of funds.
Annual Report
Nature, Extent, and Quality of Services Provided. The Board considered Fidelity's staffing as it relates to the fund, including the backgrounds of investment personnel of Fidelity, and also considered the fund's investment objective, strategies, and related investment philosophy. The Independent Trustees also had discussions with senior management of Fidelity's investment operations and investment groups. The Board considered the structure of the portfolio manager compensation program and whether this structure provides appropriate incentives to act in the best interests of the fund. Additionally, the Board considered the portfolio managers' investments, if any, in the funds that they manage.
Resources Dedicated to Investment Management and Support Services. The Board and the Fund Oversight and Research Committees reviewed the general qualifications and capabilities of Fidelity's investment staff, including its size, education, experience, and resources, as well as Fidelity's approach to recruiting, training, managing, and compensating investment personnel. The Board noted that Fidelity has continued to increase the resources devoted to non-U.S. offices, including expansion of Fidelity's global investment organization. The Board also noted that Fidelity's analysts have extensive resources, tools and capabilities that allow them to conduct sophisticated quantitative and fundamental analysis, as well as credit analysis of issuers, counterparties and guarantors. Further, the Board considered that Fidelity's investment professionals have sufficient access to global information and data so as to provide competitive investment results over time, and that those professionals also have access to sophisticated tools that permit them to assess portfolio construction and risk and performance attribution characteristics continuously, as well as to transmit new information and research conclusions rapidly around the world. Additionally, in its deliberations, the Board considered Fidelity's trading, risk management, and compliance capabilities and resources, which are integral parts of the investment management process.
Shareholder and Administrative Services. The Board considered (i) the nature, extent, quality, and cost of advisory, administrative, and shareholder services performed by FMR, the sub-advisers (together with FMR, the Investment Advisers), and their affiliates under the Advisory Contracts and under separate agreements covering transfer agency, pricing and bookkeeping, and securities lending services for the fund; (ii) the nature and extent of the supervision of third party service providers, principally custodians and subcustodians; and (iii) the resources devoted to, and the record of compliance with, the fund's compliance policies and procedures. The Board also reviewed the allocation of fund brokerage, including allocations to brokers affiliated with the Investment Advisers, the use of brokerage commissions to pay fund expenses, and the use of "soft" commission dollars to pay for research services.
Annual Report
Board Approval of Investment Advisory Contracts and
Management Fees - continued
The Board noted that the growth of fund assets over time across the complex allows Fidelity to reinvest in the development of services designed to enhance the value or convenience of the Fidelity funds as investment vehicles. These services include 24-hour access to account information and market information through telephone representatives and over the Internet, investor education materials and asset allocation tools, and the expanded availability of Fidelity Investor Centers.
In 2014, the Board formed an ad hoc Committee on Transfer Agency Fees to review the variety of transfer agency fee structures throughout the industry and Fidelity's competitive positioning with respect to industry participants.
Investment in a Large Fund Family. The Board considered the benefits to shareholders of investing in a Fidelity fund, including the benefits of investing in a fund that is part of a large family of funds offering a variety of investment disciplines and providing a large variety of mutual fund investor services. The Board noted that Fidelity had taken, or had made recommendations that resulted in the Fidelity funds taking, a number of actions over the previous year that benefited particular funds, including (i) continuing to dedicate additional resources to investment research and to the support of the senior management team that oversees asset management; (ii) continuing efforts to enhance Fidelity's global research capabilities; (iii) launching new funds and making other enhancements to meet client needs; (iv) reducing management fees and total expenses for certain index funds and diversified international funds; (v) continuing to launch dedicated lower cost underlying funds to meet portfolio construction needs related to expanding underlying fund options for Fidelity funds of funds, specifically for the Freedom Fund product lines; (vi) rationalizing product lines and gaining increased efficiencies through fund mergers; (vii) launching active fixed-income exchange-traded funds; (viii) continuing to develop, acquire and implement systems and technology to improve services to the funds and information security and to increase efficiency; (ix) implementing investment enhancements to further strengthen Fidelity's target date product line to increase investors' probability of success in achieving their goals; (x) modifying the eligibility criteria for certain share classes to accommodate roll-over assets from employer-sponsored retirement plans; (xi) launching a new Class W of the Freedom Index Funds to attract and retain Fidelity record-kept retirement plan assets; and (xii) implementing changes to Fidelity's money market product line in response to recent money market regulatory reforms.
Investment Performance. The Board considered whether the fund has operated in accordance with its investment objective, as well as its record of compliance with its investment restrictions and its performance history.
Annual Report
The Board took into account discussions with representatives of the Investment Advisers about fund investment performance that occur at Board meetings throughout the year. In this regard the Board noted that as part of regularly scheduled fund reviews and other reports to the Board on fund performance, the Board considers annualized return information for the fund, for different time periods, measured against a securities market index ("benchmark index") and a peer group of funds with similar objectives ("peer group"), if any. In its evaluation of fund investment performance, the Board gave particular attention to information indicating changes in performance of certain Fidelity funds for specific time periods and discussed with the Investment Advisers the reasons for any overperformance or underperformance.
In addition to reviewing absolute and relative fund performance, the Independent Trustees periodically consider the appropriateness of fund performance metrics in evaluating the results achieved. In general, the Independent Trustees believe that fund performance should be evaluated based on net performance (after fees and expenses) of both the highest performing and lowest performing fund share classes, where applicable, compared to appropriate benchmark indices, over appropriate time periods that may include full market cycles, and compared to peer groups, as applicable, over the same periods, taking into account relevant factors including the following: general market conditions; issuer-specific information; and fund cash flows and other factors.
The Independent Trustees recognize that shareholders evaluate performance on a net basis over their own holding periods, for which one-, three-, and five-year periods are often used as a proxy. For this reason, the performance information reviewed by the Board also included net cumulative calendar year total return information for the fund and an appropriate benchmark index and peer group for the most recent one-, three-, and five-year periods, as shown below. Returns are shown compared to the 25th percentile (top of box, 75% beaten) and 75th percentile (bottom of box, 25% beaten) of the peer universe. Returns of the benchmark index are "net MA," i.e., adjusted for tax withholding rates applicable to U.S.-based funds organized as Massachusetts business trusts.
Annual Report
Board Approval of Investment Advisory Contracts and
Management Fees - continued
Fidelity International Small Cap Opportunities Fund

The Board also considered that the fund's management fee is subject to upward or downward adjustment depending upon whether, and to what extent, the fund's investment performance for the performance period exceeds, or is exceeded by, a securities index, thus leading to a performance adjustment for the same period. The Board noted that the performance adjustment provides FMR with a strong economic incentive to seek to achieve superior performance for the fund's shareholders and helps to more closely align the interests of FMR and the shareholders of the fund.
Based on its review, the Board concluded that the nature, extent, and quality of services provided to the fund under the Advisory Contracts should benefit the shareholders of the fund.
Competitiveness of Management Fee and Total Expense Ratio. The Board considered the fund's management fee and total expense ratio compared to "mapped groups" of competitive funds and classes created for the purpose of facilitating the Trustees' competitive analysis of management fees and total expenses. Fidelity creates "mapped groups" by combining similar Lipper investment objective categories that have comparable investment mandates. Combining Lipper investment objective categories aids the Board's management fee and total expense ratio comparisons by broadening the competitive group used for comparison.
Management Fee. The Board considered two proprietary management fee comparisons for the 12-month periods shown in basis points (BP) in the chart below. The group of Lipper funds used by the Board for management fee comparisons is referred to below as the "Total Mapped Group." The Total Mapped Group is broader than the Lipper peer group used by the Board for performance comparisons because the Total Mapped Group combines several Lipper investment objective categories while the Lipper peer group does not. The Total Mapped Group comparison focuses on a fund's standing in terms of gross management fees before expense reimbursements or caps, and without giving effect to the fund's performance adjustment, relative to the total universe of funds with comparable investment mandates, regardless of whether their management fee structures also are comparable. Funds with comparable investment mandates offer exposure to similar types of securities. Funds with comparable management fee structures have similar management fee contractual arrangements (e.g., flat rate charged for advisory services, all-inclusive fee rate, etc.). "TMG %" represents the percentage of funds in the Total Mapped Group that had management fees that were lower than the fund's. For example, a hypothetical TMG % of 20% would mean that 80% of the funds in the Total Mapped Group had higher, and 20% had lower, management fees than the fund. The fund's actual TMG %s and the number of funds in the Total Mapped Group are in the chart below. The "Asset-Size Peer Group" (ASPG) comparison focuses on a fund's standing relative to a subset of non-Fidelity funds within the Total Mapped Group that are similar in size and management fee structure without taking into account performance adjustments, if any. For example, if a fund is in the first quartile of the ASPG, the fund's management fee ranks in the least expensive or lowest 25% of funds in the ASPG. The ASPG represents at least 15% of the funds in the Total Mapped Group with comparable asset size and management fee structures, subject to a minimum of 50 funds (or all funds in the Total Mapped Group if fewer than 50). Additional information, such as the ASPG quartile in which the fund's management fee rate ranked and the impact of the fund's performance adjustment, is also included in the chart and considered by the Board.
Annual Report
Fidelity International Small Cap Opportunities Fund
Annual Report

The Board noted that the fund's management fee rate ranked below the median of its Total Mapped Group and below the median of its ASPG for 2014. The Board also noted the effect of the fund's performance adjustment, if any, on the fund's management fee ranking.
The Board noted that, in 2014, the ad hoc Committee on Group Fee was formed by it and other Fidelity fund boards to conduct an in-depth review of the "group fee" component of the management fee of funds with such management fee structures. Committee focus included the mechanics of the group fee, the competitive landscape of group fee structures, Fidelity funds with no group fee component and investment products not included in group fee assets. The Board also considered that, for funds subject to the group fee, FMR agreed to voluntarily waive fees over a specified period of time in amounts designed to account for assets converted from certain funds to certain collective investment trusts.
The Board also noted that, in 2013, the ad hoc Committee on Management Fees was formed to conduct an in-depth review of the management fee rates of Fidelity's active equity mutual funds. The Committee focused on the following areas: (i) standard fee structures; (ii) research consumption and trading evolution; (iii) management fee competitiveness/profitability by category; and (iv) factors that drive institutional pricing.
Board Approval of Investment Advisory Contracts and
Management Fees - continued
Based on its review, the Board concluded that the fund's management fee is fair and reasonable in light of the services that the fund receives and the other factors considered.
Annual Report
Total Expense Ratio. In its review of each class's total expense ratio, the Board considered the fund's management fee as well as other fund or class expenses, as applicable, such as transfer agent fees, pricing and bookkeeping fees, fund-paid 12b-1 fees, and custodial, legal, and audit fees. The Board noted the impact of the fund's performance adjustment. The Board also noted that Fidelity may agree to waive fees and expenses from time to time, and the extent to which, if any, it has done so for the fund. As part of its review, the Board also considered the current and historical total expense ratios of each class of the fund compared to competitive fund median expenses. Each class of the fund is compared to those funds and classes in the Total Mapped Group (used by the Board for management fee comparisons) that have a similar sales load structure.
The Board noted that the total expense ratio of each of Class A and the retail class ranked below its competitive median for 2014 and the total expense ratio of each of Class T, Class B, Class C, and Class I ranked above its competitive median for 2014. The Board considered that, in general, various factors can affect total expense ratios. The Board noted that the total expense ratio of Class T was above the competitive median primarily because of higher 12b-1 fees on Class T as compared to most competitor funds. Class T has a higher 12b-1 fee, but a lower front-end sales charge, than traditionally priced front-end sales charge classes. The Board considered that Class T is primarily sold load-waived in the retirement plan market where its 0.50% 12b-1 fee is comparable to competing no-load, higher 12b-1 fee classes designed specifically for retirement plans. The Board noted that the fund offers multiple classes, each of which has a different sales load and 12b-1 fee structure, and that the multiple structures are intended to offer a range of pricing options for the intermediary market. The Board also noted that the total expense ratios of the classes vary primarily by the level of their 12b-1 fees, although differences in transfer agent fees may also cause expenses to vary from class to class.
Fees Charged to Other Fidelity Clients. The Board also considered Fidelity fee structures and other information with respect to clients of Fidelity, such as other funds advised or subadvised by Fidelity, pension plan clients, and other institutional clients with similar mandates. The Board noted the findings of the 2013 ad hoc joint committee (created with the board of other Fidelity funds), which reviewed and compared Fidelity's institutional investment advisory business with its business of providing services to the Fidelity funds, including the differences in services provided, fees charged, and costs incurred, as well as competition in their respective marketplaces.
Based on its review of total expense ratios and fees charged to other Fidelity clients, the Board concluded that, although in some cases above the median of the universe presented for comparison, the total expense ratio of each class of the fund was reasonable in light of the services that the fund and its shareholders receive and the other factors considered.
Annual Report
Board Approval of Investment Advisory Contracts and
Management Fees - continued
Costs of the Services and Profitability. The Board considered the revenues earned and the expenses incurred by Fidelity in conducting the business of developing, marketing, distributing, managing, administering and servicing the fund and servicing the fund's shareholders. The Board also considered the level of Fidelity's profits in respect of all the Fidelity funds.
On an annual basis, Fidelity presents to the Board information about the profitability of its relationship with the fund. Fidelity calculates profitability information for each fund, as well as aggregate profitability information for groups of Fidelity funds and all Fidelity funds, using a series of detailed revenue and cost allocation methodologies which originate with the books and records of Fidelity on which Fidelity's audited financial statements are based. The Audit Committee of the Board reviews any significant changes from the prior year's methodologies.
PricewaterhouseCoopers LLP (PwC), independent registered public accounting firm and auditor to Fidelity and certain Fidelity funds, has been engaged annually by the Board as part of the Board's assessment of Fidelity's profitability analysis. PwC's engagement includes the review and assessment of the methodologies used by Fidelity in determining the revenues and expenses attributable to Fidelity's mutual fund business, and completion of agreed-upon procedures in respect of the mathematical accuracy of fund profitability and its conformity to established allocation methodologies. After considering PwC's reports issued under the engagement and information provided by Fidelity, the Board concluded that while other allocation methods may also be reasonable, Fidelity's profitability methodologies are reasonable in all material respects.
The Board also reviewed Fidelity's non-fund businesses and fall-out benefits related to the mutual fund business as well as cases where Fidelity's affiliates may benefit from or be related to the fund's business.
The Board considered the costs of the services provided by and the profits realized by Fidelity in connection with the operation of the fund and was satisfied that the profitability was not excessive.
Economies of Scale. The Board considered whether there have been economies of scale in respect of the management of the Fidelity funds, whether the Fidelity funds (including the fund) have appropriately benefited from any such economies of scale, and whether there is potential for realization of any further economies of scale. The Board considered the extent to which the fund will benefit from economies of scale as assets grow through increased services to the fund, through waivers or reimbursements, or through fee or expense ratio reductions. The Board also noted that in 2013, it and the boards of other Fidelity funds created an ad hoc committee (the Economies of Scale Committee) to analyze whether Fidelity attains economies of scale in respect of the management and servicing of the Fidelity funds, whether the Fidelity funds have appropriately benefited from such economies of scale, and whether there is potential for realization of any further economies of scale.
Annual Report
The Board recognized that the fund's management contract incorporates a "group fee" structure, which provides for lower group fee rates as total group assets increase, and for higher group fee rates as total group assets decrease (with "group assets" defined to include fund assets under FMR's management plus sector fund assets previously under FMR's management and currently managed by Fidelity SelectCo, LLC). FMR calculates the group fee rates based on a tiered asset "breakpoint" schedule that varies based on asset class. The Board considered that the group fee is designed to deliver the benefits of economies of scale to fund shareholders when total Fidelity fund assets increase, even if assets of any particular fund are unchanged or have declined, because some portion of Fidelity's costs are attributable to services provided to all Fidelity funds, and all funds benefit if those costs can be allocated among more assets. The Board concluded that, given the group fee structure, fund shareholders will benefit from lower management fees as group assets increase at the fund complex level, regardless of whether Fidelity achieves any such economies of scale.
The Board concluded, taking into account the analysis of the Economies of Scale Committee, that economies of scale, if any, are being appropriately shared between fund shareholders and Fidelity.
Additional Information Requested by the Board. In order to develop fully the factual basis for consideration of the Fidelity funds' Advisory Contracts, the Board requested and received additional information on certain topics, including: (i) fund performance trends and Fidelity's long-term strategies for certain funds; (ii) the various share classes employed by Fidelity and the attributes of each class, together with similar information on the distribution and servicing payments made by Fidelity or the funds to third-party participants in the distribution channels; (iii) fund profitability, and fund performance in relation to fund profitability; (iv) the methodology with respect to evaluating competitive fund data and peer group classifications and fee comparisons; (v) annual fund profitability margins, with particular focus on certain funds with negative margins; (vi) the realization of fall-out benefits in certain Fidelity business units; (vii) economies of scale and the way in which they are shared with fund shareholders; (viii) Fidelity's group fee structures, including the group fee schedule of breakpoints; (ix) the impact of cost containment measures on the funds; and (x) the transfer agent fee structure.
Based on its evaluation of all of the conclusions noted above, and after considering all factors it believed relevant, the Board concluded that the advisory fee structures are fair and reasonable, and that the fund's Advisory Contracts should be renewed.
Annual Report
Investment Adviser
Fidelity Management & Research Company
Boston, MA
Investment Sub-Advisers
FMR Co., Inc.
Fidelity Management & Research
(Hong Kong) Limited
Fidelity Management & Research
(Japan) Limited
FMR Investment Management
(U.K.) Limited
FIL Investment Advisors
FIL Investments (Japan) Limited
FIL Investment Advisors (UK) Limited
General Distributor
Fidelity Distributors Corporation
Smithfield, RI
Transfer and Service Agents
Fidelity Investments Institutional
Operations Company, Inc.
Boston, MA
Fidelity Service Company, Inc.
Boston, MA
Custodian
The Northern Trust Company
Chicago, IL
(Fidelity Investment logo)(registered trademark)
AILS-UANN-1215
1.815089.110
ContentsPerformance: The Bottom LineManagement's Discussion of Fund PerformanceShareholder Expense ExampleInvestment Changes (Unaudited)Investments October 31, 2015Financial StatementsNotes to Financial StatementsReport of Independent Registered Public Accounting FirmTrustees and OfficersDistributions (Unaudited)Board Approval of Investment Advisory Contracts and Management Fees
(Fidelity Investment logo)(registered trademark)
Fidelity Advisor®
International Discovery
Fund - Class Z
Annual Report
October 31, 2015
(Fidelity Cover Art)
Class Z is
a class of Fidelity®
International Discovery Fund
Contents
Performance | (Click Here) | How the fund has done over time. |
Management's Discussion of Fund Performance | (Click Here) | The Portfolio Manager's review of fund performance and strategy. |
Shareholder Expense Example | (Click Here) | An example of shareholder expenses. |
Investment Changes | (Click Here) | A summary of major shifts in the fund's investments over the past six months. |
Investments | (Click Here) | A complete list of the fund's investments with their market values. |
Financial Statements | (Click Here) | Statements of assets and liabilities, operations, and changes in net assets, as well as financial highlights. |
Notes | (Click Here) | Notes to financial statements. |
Report of Independent Registered Public Accounting Firm | (Click Here) | |
Trustees and Officers | (Click Here) | |
Distributions | (Click Here) | |
Board Approval of Investment Advisory Contracts and Management Fees | (Click Here) | |
To view a fund's proxy voting guidelines and proxy voting record for the 12-month period ended June 30, visit http://www.fidelity.com/proxyvotingresults or visit the Securities and Exchange Commission's (SEC) web site at http://www.sec.gov. You may also call 1-877-208-0098 to request a free copy of the proxy voting guidelines.
Standard & Poor's, S&P and S&P 500 are registered service marks of The McGraw-Hill Companies, Inc. and have been licensed for use by Fidelity Distributors Corporation.
Other third-party marks appearing herein are the property of their respective owners.
All other marks appearing herein are registered or unregistered trademarks or service marks of FMR LLC or an affiliated company. © 2015 FMR LLC. All rights reserved.
Annual Report
This report and the financial statements contained herein are submitted for the general information of the shareholders of the fund. This report is not authorized for distribution to prospective investors in the fund unless preceded or accompanied by an effective prospectus.
A fund files its complete schedule of portfolio holdings with the SEC for the first and third quarters of each fiscal year on Form N-Q. Forms N-Q are available on the SEC's web site at http://www.sec.gov. A fund's Forms N-Q may be reviewed and copied at the SEC's Public Reference Room in Washington, DC. Information regarding the operation of the SEC's Public Reference Room may be obtained by calling 1-800-SEC-0330. For a complete list of a fund's portfolio holdings, view the most recent holdings listing, semiannual report, or annual report on Fidelity's web site at http://www.fidelity.com, http://www.advisor.fidelity.com, or http://www.401k.com, as applicable.
NOT FDIC INSURED • MAY LOSE VALUE • NO BANK GUARANTEE
Neither the fund nor Fidelity Distributors Corporation is a bank.
Annual Report
Average annual total return reflects the change in the value of an investment, assuming reinvestment of the class' distributions from dividend income and capital gains (the profits earned upon the sale of securities that have grown in value, if any) and assuming a constant rate of performance each year. The $10,000 table and the fund's returns do not reflect the deduction of taxes that a shareholder would pay on fund distributions or the redemption of fund shares. During periods of reimbursement by Fidelity, a fund's total return will be greater than it would be had the reimbursement not occurred. How a fund did yesterday is no guarantee of how it will do tomorrow.
Average Annual Total Returns
Periods ended October 31, 2015 | Past 1
year | Past 5
years | Past 10
years |
Class Z A | 3.58% | 6.11% | 5.33% |
A The initial offering of Class Z shares took place on August 13, 2013. Returns between October 31, 2005 and August 13, 2013, are those of Class I.
$10,000 Over 10 Years
Let's say hypothetically that $10,000 was invested in Fidelity Advisor® International Discovery Fund - Class Z on October 31, 2005. The chart shows how the value of your investment would have changed, and also shows how the MSCI EAFE Index performed over the same period. See footnote A above for additional information regarding the performance of Class Z.

Annual Report
Market Recap: International equities suffered a moderate setback for the 12 months ending October 31, 2015, held back by a collapse in commodities prices that hurt resources-related sectors and geographies. The MSCI ACWI (All Country World Index) ex USA Index returned -4.55% for the period, affected also by concerns about global economic growth. Commodity producers remained under pressure for much of the past year, largely related to economic deceleration in China (-1%), the world's second-largest economy and a leading consumer of raw materials. This effect was exacerbated by U.S. dollar strength relative to global currencies, which weighed on commodities priced in dollars and acutely impacted equity returns within regions most exposed to resources prices. The emerging-markets group, for example, returned about -15% this period. Canada, a significant energy producer, returned roughly -17%. Net energy consumer Japan (+9%) was the best-performing region by far. Only about a quarter of the nearly 50 index countries managed a gain this period: Ireland (+19%) - the EU's fastest-growing economy - and Israel (+17%) proved top performers; Greece (-56%) and Brazil (-46%), among the worst. As for sectors, energy (-25%) and materials (-16%) declined sharply, whereas the two consumer sectors each gained about 6%.
Comments from Portfolio Manager William Kennedy: For the year, the fund's share classes (excluding sales charges, if applicable) outpaced the 0.08% return of the benchmark MSCI EAFE Index. Most of the fund's outperformance came from security selection in the financials and consumer discretionary sectors, favorable positioning in continental Europe and Asia Pacific ex Japan and stock picks in the United Kingdom. Sector allocations gave an added boost. In terms of top individual contributors, an average underweighting in U.K.-listed oil and gas company Royal Dutch Shell helped, as plunging oil prices caused the stock to decline. An out-of-index stake in Constellation Software returned roughly 55%, as the Canadian company's track record of smart acquisitions drove better-than-expected earnings growth. Another winner was Luxembourg-based media company Altice, which saw its entrepreneurial management team and appetite for acquisitions drive a huge gain. By contrast, the fund's underweighting in Japan modestly hindered relative performance. In terms of individual detractors, an overweighting in France-based exploration and production company Total hurt as oil prices slid. A tiny out-of-index stake in Australia-based online fashion retailer MySale Group detracted when a profit warning sank the stock. Altice and MySale were not in the portfolio at period end.
The views expressed above reflect those of the portfolio manager(s) only through the end of the period as stated on the cover of this report and do not necessarily represent the views of Fidelity or any other person in the Fidelity organization. Any such views are subject to change at any time based upon market or other conditions and Fidelity disclaims any responsibility to update such views. These views may not be relied on as investment advice and, because investment decisions for a Fidelity fund are based on numerous factors, may not be relied on as an indication of trading intent on behalf of any Fidelity fund.
Annual Report
Shareholder Expense Example
As a shareholder of the Fund, you incur two types of costs: (1) transaction costs, including sales charges (loads) on purchase payments or redemption proceeds, redemption fees and (2) ongoing costs, including management fees, distribution and/or service (12b-1) fees and other Fund expenses. This Example is intended to help you understand your ongoing costs (in dollars) of investing in the Fund and to compare these costs with the ongoing costs of investing in other mutual funds.
The Example is based on an investment of $1,000 invested at the beginning of the period and held for the entire period (May 1, 2015 to October 31, 2015).
Actual Expenses
The first line of the accompanying table for each class of the Fund provides information about actual account values and actual expenses. You may use the information in this line, together with the amount you invested, to estimate the expenses that you paid over the period. Simply divide your account value by $1,000.00 (for example, an $8,600 account value divided by $1,000.00 = 8.6), then multiply the result by the number in the first line for a class of the Fund under the heading entitled "Expenses Paid During Period" to estimate the expenses you paid on your account during this period. A small balance maintenance fee of $12.00 that is charged once a year may apply for certain accounts with a value of less than $2,000. This fee is not included in the table below. If it was, the estimate of expenses you paid during the period would be higher, and your ending account value lower, by this amount. In addition, the Fund, as a shareholder in the underlying Fidelity Central Funds, will indirectly bear its pro-rata share of the fees and expenses incurred by the underlying Fidelity Central Funds. These fees and expenses are not included in the Fund's annualized expense ratio used to calculate the expense estimate in the table below.
Hypothetical Example for Comparison Purposes
The second line of the accompanying table for each class of the Fund provides information about hypothetical account values and hypothetical expenses based on a Class' actual expense ratio and an assumed rate of return of 5% per year before expenses, which is not the Class' actual return. The hypothetical account values and expenses may not be used to estimate the actual ending account balance or expenses you paid for the period. You may use this information to compare the ongoing costs of investing in the Fund and other funds. To do so, compare this 5% hypothetical example with the 5% hypothetical examples that appear in the shareholder reports of the other funds. A small balance maintenance fee of $12.00 that is charged once a year may apply for certain accounts with a value of less than $2,000. This fee is not included in the table below. If it was, the estimate of expenses you paid during the period would be higher, and your ending account value lower, by this amount. In addition, the Fund, as a shareholder in the underlying Fidelity Central Funds, will indirectly bear its pro-rata share of the fees and expenses incurred by the underlying Fidelity Central Funds. These fees and expenses are not included in the Fund's annualized expense ratio used to calculate the expense estimate in the table below.
Please note that the expenses shown in the table are meant to highlight your ongoing costs only and do not reflect any transaction costs. Therefore, the second line of the table is useful in comparing ongoing costs only, and will not help you determine the relative total costs of owning different funds. In addition, if these transactional costs were included, your costs would have been higher.
Annual Report
| Annualized
Expense RatioB | Beginning
Account Value
May 1, 2015 | Ending
Account Value
October 31, 2015 | Expenses Paid
During PeriodC
May 1, 2015 to
October 31, 2015 |
Class A | 1.33% | | | |
Actual | | $ 1,000.00 | $ 965.80 | $ 6.59 |
HypotheticalA | | $ 1,000.00 | $ 1,018.50 | $ 6.77 |
Class T | 1.57% | | | |
Actual | | $ 1,000.00 | $ 964.80 | $ 7.78 |
HypotheticalA | | $ 1,000.00 | $ 1,017.29 | $ 7.98 |
Class B | 2.11% | | | |
Actual | | $ 1,000.00 | $ 962.00 | $ 10.43 |
HypotheticalA | | $ 1,000.00 | $ 1,014.57 | $ 10.71 |
Class C | 2.09% | | | |
Actual | | $ 1,000.00 | $ 962.10 | $ 10.34 |
HypotheticalA | | $ 1,000.00 | $ 1,014.67 | $ 10.61 |
International Discovery | .99% | | | |
Actual | | $ 1,000.00 | $ 967.70 | $ 4.91 |
HypotheticalA | | $ 1,000.00 | $ 1,020.21 | $ 5.04 |
Class K | .86% | | | |
Actual | | $ 1,000.00 | $ 968.10 | $ 4.27 |
HypotheticalA | | $ 1,000.00 | $ 1,020.87 | $ 4.38 |
Class I | 1.00% | | | |
Actual | | $ 1,000.00 | $ 967.40 | $ 4.96 |
HypotheticalA | | $ 1,000.00 | $ 1,020.16 | $ 5.09 |
Class Z | .87% | | | |
Actual | | $ 1,000.00 | $ 968.10 | $ 4.32 |
HypotheticalA | | $ 1,000.00 | $ 1,020.82 | $ 4.43 |
A 5% return per year before expenses
B Annualized expense ratio reflects expenses net of applicable fee waivers.
C Expenses are equal to each Class' annualized expense ratio, multiplied by the average account value over the period, multiplied by 184/365 (to reflect the one-half year period).
Annual Report
Investment Changes (Unaudited)
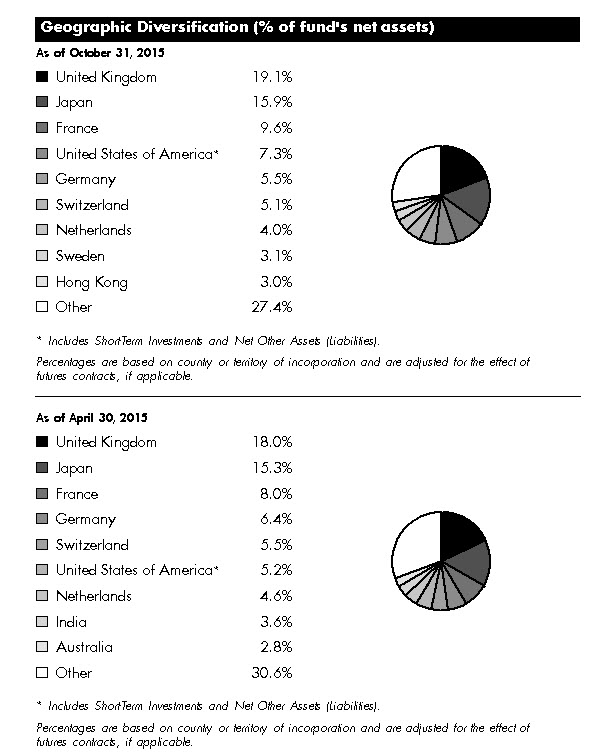
Annual Report
Asset Allocation as of October 31, 2015 |
| % of fund's
net assets | % of fund's net assets
6 months ago |
Stocks and Equity Futures | 97.5 | 99.1 |
Other Investments | 0.1 | 0.1 |
Short-Term Investments and Net Other Assets (Liabilities) | 2.4 | 0.8 |
Top Ten Stocks as of October 31, 2015 |
| % of fund's
net assets | % of fund's net assets
6 months ago |
Total SA (France, Oil, Gas & Consumable Fuels) | 2.0 | 1.8 |
Novartis AG (Switzerland, Pharmaceuticals) | 1.8 | 1.7 |
Unilever NV (Certificaten Van Aandelen) (Bearer) (Netherlands, Personal Products) | 1.6 | 1.5 |
Anheuser-Busch InBev SA NV (Belgium, Beverages) | 1.4 | 1.6 |
AIA Group Ltd. (Hong Kong, Insurance) | 1.3 | 1.3 |
Techtronic Industries Co. Ltd. (Hong Kong, Household Durables) | 1.3 | 1.2 |
Housing Development Finance Corp. Ltd. (India, Thrifts & Mortgage Finance) | 1.3 | 1.2 |
Mitsubishi UFJ Financial Group, Inc. (Japan, Banks) | 1.3 | 1.2 |
Novo Nordisk A/S Series B (Denmark, Pharmaceuticals) | 1.2 | 1.1 |
KDDI Corp. (Japan, Wireless Telecommunication Services) | 1.1 | 1.1 |
| 14.3 | |
Market Sectors as of October 31, 2015 |
| % of fund's
net assets | % of fund's net assets
6 months ago |
Financials | 24.2 | 24.6 |
Consumer Discretionary | 17.4 | 16.9 |
Health Care | 12.8 | 13.2 |
Consumer Staples | 11.9 | 9.5 |
Industrials | 10.5 | 10.9 |
Information Technology | 7.5 | 9.7 |
Telecommunication Services | 4.9 | 4.7 |
Energy | 4.3 | 5.0 |
Materials | 2.3 | 3.0 |
Annual Report
Investments October 31, 2015
Showing Percentage of Net Assets
Common Stocks - 95.5% |
| Shares | | Value (000s) |
Australia - 1.7% |
1-Page Ltd. (a) | 2,546,348 | | $ 8,566 |
Ansell Ltd. | 1,597,592 | | 22,734 |
Australia & New Zealand Banking Group Ltd. | 3,558,240 | | 68,817 |
Flight Centre Travel Group Ltd. (d) | 485,418 | | 13,059 |
Mantra Group Ltd. | 7,839,732 | | 22,935 |
Ramsay Health Care Ltd. | 1,171,082 | | 51,478 |
TOTAL AUSTRALIA | | 187,589 |
Austria - 0.3% |
Andritz AG | 447,100 | | 22,518 |
Erste Group Bank AG (a) | 456,800 | | 13,397 |
TOTAL AUSTRIA | | 35,915 |
Bailiwick of Jersey - 1.7% |
Integrated Diagnostics Holdings PLC (a) | 4,961,400 | | 27,337 |
Regus PLC | 11,120,488 | | 57,362 |
Shire PLC | 588,700 | | 44,583 |
Wolseley PLC | 1,048,393 | | 61,553 |
TOTAL BAILIWICK OF JERSEY | | 190,835 |
Belgium - 1.9% |
Anheuser-Busch InBev SA NV | 1,256,127 | | 149,887 |
KBC Groep NV | 955,745 | | 58,225 |
TOTAL BELGIUM | | 208,112 |
Bermuda - 0.5% |
PAX Global Technology Ltd. | 43,428,000 | | 56,789 |
Canada - 2.2% |
Alimentation Couche-Tard, Inc. Class B (sub. vtg.) | 786,100 | | 33,816 |
Constellation Software, Inc. | 230,700 | | 99,683 |
Entertainment One Ltd. | 3,283,077 | | 11,119 |
Imperial Oil Ltd. | 1,249,100 | | 41,563 |
PrairieSky Royalty Ltd. (d) | 1,502,800 | | 29,571 |
Suncor Energy, Inc. | 680,200 | | 20,241 |
TOTAL CANADA | | 235,993 |
Cayman Islands - 1.3% |
Alibaba Group Holding Ltd. sponsored ADR (a) | 385,500 | | 32,316 |
CK Hutchison Holdings Ltd. | 1,264,716 | | 17,318 |
Ctrip.com International Ltd. sponsored ADR (a) | 148,100 | | 13,769 |
Lee's Pharmaceutical Holdings Ltd. | 6,774,164 | | 8,746 |
Qunar Cayman Islands Ltd. sponsored ADR (a) | 515,900 | | 25,042 |
Common Stocks - continued |
| Shares | | Value (000s) |
Cayman Islands - continued |
Regina Miracle International Holdings Ltd. | 15,269,891 | | $ 13,845 |
WuXi PharmaTech Cayman, Inc. sponsored ADR (a) | 826,200 | | 36,931 |
TOTAL CAYMAN ISLANDS | | 147,967 |
China - 0.5% |
Jiangsu Hengrui Medicine Co. Ltd. | 4,183,623 | | 34,711 |
Kweichow Moutai Co. Ltd. | 663,582 | | 22,405 |
Yantai Changyu Pioneer Wine Co. Ltd. (B Shares) | 697,195 | | 2,215 |
TOTAL CHINA | | 59,331 |
Cyprus - 0.0% |
SPDI Secure Property Development & Investment PLC (a) | 520,230 | | 229 |
Denmark - 1.2% |
Novo Nordisk A/S Series B | 2,385,545 | | 126,681 |
Finland - 0.7% |
Sampo Oyj (A Shares) | 1,663,200 | | 81,351 |
France - 9.6% |
Accor SA | 1,694,818 | | 84,314 |
Air Liquide SA | 429,100 | | 55,632 |
ALTEN | 88,659 | | 4,602 |
Atos Origin SA | 441,674 | | 35,237 |
AXA SA | 3,834,100 | | 102,325 |
Capgemini SA | 860,800 | | 76,701 |
Cegedim SA (a) | 539,590 | | 19,136 |
Havas SA | 4,843,944 | | 42,027 |
Numericable Group SA (a) | 340,324 | | 15,419 |
Rexel SA | 1,265,582 | | 17,299 |
Safran SA | 614,700 | | 46,689 |
Sanofi SA | 992,072 | | 100,076 |
Sodexo SA | 433,700 | | 38,616 |
SR Teleperformance SA | 291,800 | | 22,936 |
Total SA (d) | 4,569,799 | | 220,991 |
Unibail-Rodamco | 157,400 | | 43,981 |
VINCI SA | 1,425,100 | | 96,189 |
Vivendi SA | 1,148,200 | | 27,622 |
TOTAL FRANCE | | 1,049,792 |
Germany - 5.5% |
Aareal Bank AG | 1,026,009 | | 39,094 |
Axel Springer Verlag AG | 526,702 | | 29,620 |
Beiersdorf AG | 244,300 | | 23,219 |
Continental AG | 299,300 | | 71,980 |
Common Stocks - continued |
| Shares | | Value (000s) |
Germany - continued |
Deutsche Boerse AG | 529,594 | | $ 48,773 |
Deutsche Telekom AG | 3,260,600 | | 61,076 |
Fresenius SE & Co. KGaA | 471,500 | | 34,647 |
GEA Group AG | 884,110 | | 35,452 |
KION Group AG | 1,377,249 | | 62,109 |
LEG Immobilien AG | 254,661 | | 20,317 |
OSRAM Licht AG | 1,016,232 | | 59,797 |
ProSiebenSat.1 Media AG | 1,176,900 | | 63,661 |
Rational AG | 84,000 | | 33,350 |
United Internet AG | 433,247 | | 22,513 |
TOTAL GERMANY | | 605,608 |
Hong Kong - 3.0% |
AIA Group Ltd. | 24,849,200 | | 145,699 |
China Resources Beer Holdings Co. Ltd. | 21,482,000 | | 40,562 |
Techtronic Industries Co. Ltd. | 38,670,000 | | 141,365 |
TOTAL HONG KONG | | 327,626 |
India - 3.0% |
Bharti Infratel Ltd. (a) | 12,647,734 | | 75,119 |
HDFC Bank Ltd. sponsored ADR | 1,298,584 | | 79,395 |
Housing Development Finance Corp. Ltd. | 7,355,732 | | 140,900 |
Lupin Ltd. | 452,781 | | 13,331 |
Sun Pharmaceutical Industries Ltd. | 347,397 | | 4,721 |
Titan Co. Ltd. (a) | 2,186,522 | | 11,862 |
TOTAL INDIA | | 325,328 |
Ireland - 1.4% |
Bank of Ireland (a) | 62,440,800 | | 23,002 |
Dalata Hotel Group PLC (a) | 388,200 | | 1,930 |
Glanbia PLC | 2,527,500 | | 49,028 |
Kerry Group PLC Class A | 989,500 | | 80,465 |
TOTAL IRELAND | | 154,425 |
Isle of Man - 0.7% |
Optimal Payments PLC (a) | 11,615,044 | | 54,433 |
Playtech Ltd. | 1,395,092 | | 18,410 |
TOTAL ISLE OF MAN | | 72,843 |
Israel - 1.3% |
Frutarom Industries Ltd. | 1,038,100 | | 44,860 |
Common Stocks - continued |
| Shares | | Value (000s) |
Israel - continued |
Partner Communications Co. Ltd. (a) | 1,755,983 | | $ 7,969 |
Teva Pharmaceutical Industries Ltd. sponsored ADR | 1,558,300 | | 92,236 |
TOTAL ISRAEL | | 145,065 |
Italy - 2.9% |
De Longhi SpA | 2,630,100 | | 64,438 |
Intesa Sanpaolo SpA | 25,324,300 | | 88,222 |
Mediaset SpA | 17,602,100 | | 89,425 |
Telecom Italia SpA (a) | 50,788,000 | | 70,853 |
TOTAL ITALY | | 312,938 |
Japan - 15.9% |
ACOM Co. Ltd. (a)(d) | 5,223,800 | | 28,599 |
Aozora Bank Ltd. | 11,048,000 | | 40,381 |
Asahi Group Holdings | 1,240,200 | | 38,255 |
Astellas Pharma, Inc. | 6,994,600 | | 101,523 |
Coca-Cola Central Japan Co. Ltd. | 536,400 | | 7,539 |
Dentsu, Inc. | 1,281,800 | | 72,060 |
Don Quijote Holdings Co. Ltd. | 1,346,000 | | 49,444 |
Hitachi Ltd. | 10,000 | | 58 |
Hoya Corp. | 2,994,400 | | 123,569 |
Japan Exchange Group, Inc. | 1,932,000 | | 31,088 |
Japan Tobacco, Inc. | 1,302,700 | | 45,089 |
KDDI Corp. | 5,167,900 | | 125,055 |
Keyence Corp. | 147,360 | | 76,717 |
Misumi Group, Inc. | 3,200,000 | | 41,671 |
Mitsubishi UFJ Financial Group, Inc. | 21,656,100 | | 140,062 |
Monex Group, Inc. | 12,212,749 | | 34,330 |
NEC Corp. | 25,011,000 | | 77,159 |
Nidec Corp. | 701,900 | | 52,892 |
Olympus Corp. | 1,784,400 | | 60,190 |
ORIX Corp. | 6,891,200 | | 100,638 |
Sanken Electric Co. Ltd. | 1,393,000 | | 4,841 |
Seven & i Holdings Co. Ltd. | 931,900 | | 42,331 |
Seven Bank Ltd. | 12,110,400 | | 55,182 |
Shinsei Bank Ltd. | 32,483,000 | | 68,109 |
SoftBank Corp. | 724,300 | | 40,581 |
Sony Corp. | 2,320,500 | | 65,961 |
Sundrug Co. Ltd. | 626,200 | | 32,988 |
Tsuruha Holdings, Inc. | 1,040,400 | | 82,425 |
United Arrows Ltd. | 847,000 | | 36,490 |
Common Stocks - continued |
| Shares | | Value (000s) |
Japan - continued |
VT Holdings Co. Ltd. | 3,895,300 | | $ 24,089 |
Welcia Holdings Co. Ltd. | 964,000 | | 47,511 |
TOTAL JAPAN | | 1,746,827 |
Luxembourg - 0.8% |
Eurofins Scientific SA | 83,911 | | 30,381 |
Grand City Properties SA | 3,000,560 | | 59,920 |
TOTAL LUXEMBOURG | | 90,301 |
Marshall Islands - 0.1% |
Hoegh LNG Partners LP (e) | 715,655 | | 11,465 |
Netherlands - 4.0% |
AerCap Holdings NV (a) | 2,303,100 | | 95,579 |
Arcadis NV | 1,205,000 | | 30,411 |
IMCD Group BV | 1,938,100 | | 72,505 |
ING Groep NV (Certificaten Van Aandelen) | 4,566,600 | | 66,462 |
Unilever NV (Certificaten Van Aandelen) (Bearer) | 3,836,500 | | 173,477 |
TOTAL NETHERLANDS | | 438,434 |
New Zealand - 0.6% |
EBOS Group Ltd. | 3,173,554 | | 29,333 |
Ryman Healthcare Group Ltd. | 7,179,412 | | 38,358 |
TOTAL NEW ZEALAND | | 67,691 |
Philippines - 0.3% |
SM Investments Corp. | 1,651,390 | | 30,830 |
Portugal - 0.3% |
NOS SGPS SA | 3,466,500 | | 28,814 |
South Africa - 1.1% |
EOH Holdings Ltd. | 2,871,867 | | 31,751 |
Naspers Ltd. Class N | 593,000 | | 86,857 |
TOTAL SOUTH AFRICA | | 118,608 |
Spain - 2.5% |
Amadeus IT Holding SA Class A | 1,727,200 | | 73,617 |
Atresmedia Corporacion de Medios de Comunicacion SA | 2,218,100 | | 28,465 |
Hispania Activos Inmobiliarios SA (a) | 1,091,600 | | 16,445 |
Inditex SA | 2,302,339 | | 86,346 |
Mediaset Espana Comunicacion SA | 3,431,200 | | 41,712 |
Merlin Properties Socimi SA | 2,497,700 | | 32,025 |
TOTAL SPAIN | | 278,610 |
Common Stocks - continued |
| Shares | | Value (000s) |
Sweden - 3.1% |
ASSA ABLOY AB (B Shares) | 2,977,200 | | $ 59,226 |
Getinge AB (B Shares) | 2,702,600 | | 67,663 |
HEXPOL AB (B Shares) | 2,985,000 | | 29,069 |
Nordea Bank AB | 5,783,000 | | 63,966 |
Sandvik AB | 3,361,100 | | 31,433 |
Svenska Cellulosa AB (SCA) (B Shares) | 1,545,100 | | 45,509 |
Svenska Handelsbanken AB (A Shares) | 2,990,700 | | 40,618 |
TOTAL SWEDEN | | 337,484 |
Switzerland - 5.1% |
Credit Suisse Group AG (h)(k) | 3,643,900 | | 83,867 |
EFG International | 1,747,368 | | 17,554 |
GAM Holding Ltd. | 1,413,451 | | 25,882 |
Julius Baer Group Ltd. | 955,230 | | 47,363 |
Novartis AG | 2,126,476 | | 192,635 |
Partners Group Holding AG | 225,896 | | 81,816 |
Schindler Holding AG (participation certificate) | 182,339 | | 29,626 |
Syngenta AG (Switzerland) | 101,678 | | 34,161 |
UBS Group AG | 2,453,481 | | 49,097 |
TOTAL SWITZERLAND | | 562,001 |
Taiwan - 0.1% |
JHL Biotech, Inc. (a) | 4,995,560 | | 11,141 |
Turkey - 0.0% |
Logo Yazilim Sanayi Ve Ticar | 2 | | 0 |
United Kingdom - 19.1% |
AA PLC | 3,853,399 | | 16,449 |
Aberdeen Asset Management PLC | 4,206,932 | | 22,485 |
Al Noor Hospitals Group PLC | 2,335,318 | | 42,337 |
Associated British Foods PLC | 776,700 | | 41,369 |
Aviva PLC | 6,618,100 | | 49,461 |
B&M European Value Retail S.A. | 8,573,709 | | 44,066 |
Barclays PLC | 16,052,760 | | 57,192 |
BCA Marketplace PLC | 7,808,000 | | 21,275 |
BG Group PLC | 2,346,020 | | 37,064 |
BT Group PLC | 6,169,700 | | 44,061 |
BTG PLC (a) | 1,727,000 | | 14,696 |
Bunzl PLC | 2,087,500 | | 59,824 |
Compass Group PLC | 2,024,800 | | 34,808 |
Diploma PLC | 2,326,200 | | 23,005 |
Essentra PLC | 2,145,000 | | 27,843 |
Hikma Pharmaceuticals PLC | 2,598,333 | | 86,681 |
Common Stocks - continued |
| Shares | | Value (000s) |
United Kingdom - continued |
Howden Joinery Group PLC | 10,977,300 | | $ 78,453 |
HSBC Holdings PLC (United Kingdom) | 10,446,000 | | 81,614 |
Imperial Tobacco Group PLC | 2,092,292 | | 112,859 |
ITV PLC | 21,873,900 | | 85,111 |
JUST EAT Ltd. (a) | 595,900 | | 3,913 |
Liberty Global PLC Class A (a) | 665,500 | | 29,628 |
Lloyds Banking Group PLC | 69,588,800 | | 78,984 |
London Stock Exchange Group PLC | 2,190,936 | | 85,959 |
Melrose PLC | 10,942,678 | | 44,906 |
Micro Focus International PLC | 3,266,700 | | 63,251 |
Next PLC | 760,844 | | 93,833 |
Persimmon PLC | 1,478,400 | | 45,445 |
Poundland Group PLC | 6,866,990 | | 29,112 |
Reckitt Benckiser Group PLC | 759,700 | | 74,140 |
Rex Bionics PLC (a)(e) | 1,304,916 | | 976 |
Rio Tinto PLC | 1,353,600 | | 49,332 |
Royal Dutch Shell PLC Class A (United Kingdom) | 1,108,500 | | 28,940 |
SABMiller PLC | 723,500 | | 44,558 |
Schroders PLC | 598,200 | | 27,509 |
Shawbrook Group Ltd. | 9,004,300 | | 47,098 |
Spirax-Sarco Engineering PLC | 542,700 | | 25,442 |
St. James's Place Capital PLC | 5,426,000 | | 80,678 |
Taylor Wimpey PLC | 11,785,800 | | 35,975 |
The Restaurant Group PLC | 1,956,100 | | 21,621 |
Virgin Money Holdings Uk PLC | 5,909,100 | | 35,327 |
Vodafone Group PLC | 31,387,896 | | 103,296 |
Whitbread PLC | 700,994 | | 53,665 |
Workspace Group PLC | 652,800 | | 9,636 |
TOTAL UNITED KINGDOM | | 2,093,877 |
United States of America - 3.1% |
Chevron Corp. | 854,400 | | 77,648 |
Constellation Brands, Inc. Class A (sub. vtg.) | 626,700 | | 84,479 |
McGraw Hill Financial, Inc. | 686,300 | | 63,579 |
Monster Beverage Corp. (a) | 168,900 | | 23,024 |
Visa, Inc. Class A | 1,154,500 | | 89,566 |
TOTAL UNITED STATES OF AMERICA | | 338,296 |
TOTAL COMMON STOCKS (Cost $9,171,863) |
10,478,796
|
Nonconvertible Preferred Stocks - 0.2% |
| Shares | | Value (000s) |
Cayman Islands - 0.2% |
China Internet Plus Holdings Ltd. (k) | 5,958,244 | | $ 22,999 |
Germany - 0.0% |
Henkel AG & Co. KGaA | 476 | | 52 |
TOTAL NONCONVERTIBLE PREFERRED STOCKS (Cost $18,888) |
23,051
|
Government Obligations - 0.0% |
| Principal
Amount (000s) (j) | | |
United States of America - 0.0% |
U.S. Treasury Bills, yield at date of purchase 0.03% to 0.06% 12/3/15 to 12/17/15 (i)
(Cost $1,930) | | $ 1,930 | |
1,930
|
Preferred Securities - 0.1% |
|
Ireland - 0.1% |
Baggot Securities Ltd. 10.24% (f)(g)
(Cost $13,883) | EUR | 9,040 | |
10,747
|
Money Market Funds - 5.3% |
| Shares | | |
Fidelity Cash Central Fund, 0.18% (b) | 529,294,097 | | 529,294 |
Fidelity Securities Lending Cash Central Fund, 0.19% (b)(c) | 46,206,017 | | 46,206 |
TOTAL MONEY MARKET FUNDS (Cost $575,500) |
575,500
|
TOTAL INVESTMENT PORTFOLIO - 101.1% (Cost $9,782,064) | | 11,090,024 |
NET OTHER ASSETS (LIABILITIES) - (1.1)% | | (122,851) |
NET ASSETS - 100% | $ 10,967,173 |
Futures Contracts |
| Expiration Date | | Underlying Face Amount at Value (000s) | | Unrealized Appreciation/
(Depreciation)
(000s) |
Purchased |
Equity Index Contracts |
2,033 CME Nikkei 225 Index Contracts (United States) | Dec. 2015 | | $ 192,271 | | $ 9,203 |
The face value of futures purchased as a percentage of net assets is 1.8% |
For the period, the average monthly underlying face amount at value for futures contracts in the aggregate was $226,950,000. |
Currency Abbreviations |
EUR | - | European Monetary Unit |
Legend |
(a) Non-income producing |
(b) Affiliated fund that is generally available only to investment companies and other accounts managed by Fidelity Investments. The rate quoted is the annualized seven-day yield of the fund at period end. A complete unaudited listing of the fund's holdings as of its most recent quarter end is available upon request. In addition, each Fidelity Central Fund's financial statements, which are not covered by the Fund's Report of Independent Registered Public Accounting Firm, are available on the SEC's website or upon request. |
(c) Investment made with cash collateral received from securities on loan. |
(d) Security or a portion of the security is on loan at period end. |
(e) Affiliated company |
(f) Security exempt from registration under Rule 144A of the Securities Act of 1933. These securities may be resold in transactions exempt from registration, normally to qualified institutional buyers. At the end of the period, the value of these securities amounted to $10,747,000 or 0.1% of net assets. |
(g) Security is perpetual in nature with no stated maturity date. |
(h) Security or a portion of the security purchased on a delayed delivery or when-issued basis. |
(i) Security or a portion of the security was pledged to cover margin requirements for futures contracts. At period end, the value of securities pledged amounted to $1,930,000. |
(j) Amount is stated in United States dollars unless otherwise noted. |
(k) Restricted securities - Investment in securities not registered under the Securities Act of 1933 (excluding 144A issues). At the end of the period, the value of restricted securities (excluding 144A issues) amounted to $106,866,000 or 1.0% of net assets. |
Additional information on each restricted holding is as follows: |
Security | Acquisition Date | Acquisition Cost (000s) |
China Internet Plus Holdings Ltd. | 1/26/15 | $ 18,833 |
Credit Suisse Group AG | 10/21/15 | $ 86,402 |
Affiliated Central Funds |
Information regarding fiscal year to date income earned by the Fund from investments in Fidelity Central Funds is as follows: |
Fund | Income earned
(Amounts in thousands) |
Fidelity Cash Central Fund | $ 655 |
Fidelity Securities Lending Cash Central Fund | 3,281 |
Total | $ 3,936 |
Other Affiliated Issuers |
An affiliated company is a company in which the Fund has ownership of at least 5% of the voting securities. Fiscal year to date transactions with companies which are or were affiliates are as follows: |
Affiliate
(Amounts in thousands) | Value, beginning of period | Purchases | Sales Proceeds* | Dividend Income | Value,
end of
period |
Hoegh LNG Partners LP | $ 12,426 | $ 2,837 | $ 275 | $ 729 | $ 11,465 |
MySale Group PLC | 26,053 | - | 5,920 | - | - |
PAX Global Technology Ltd. | 71,203 | 795 | 36,965 | 112 | - |
Rex Bionics PLC | 3,518 | - | 24 | - | 976 |
Total | $ 113,200 | $ 3,632 | $ 43,184 | $ 841 | $ 12,441 |
* Includes the value of securities delivered through in-kind transactions, if applicable.
See accompanying notes which are an integral part of the financial statements.
Annual Report
Other Information |
Categorizations in the Schedule of Investments are based on country or territory of incorporation. |
The following is a summary of the inputs used, as of October 31, 2015, involving the Fund's assets and liabilities carried at fair value. The inputs or methodology used for valuing securities may not be an indication of the risk associated with investing in those securities. For more information on valuation inputs, and their aggregation into the levels used in the tables below, please refer to the Investment Valuation section in the accompanying Notes to Financial Statements. |
Valuation Inputs at Reporting Date: |
Description
(Amounts in thousands) | Total | Level 1 | Level 2 | Level 3 |
Investments in Securities: | | | | |
Equities: | | | | |
Consumer Discretionary | $ 1,898,277 | $ 1,361,738 | $ 513,540 | $ 22,999 |
Consumer Staples | 1,297,202 | 666,346 | 630,856 | - |
Energy | 467,483 | 180,488 | 286,995 | - |
Financials | 2,676,653 | 1,281,424 | 1,395,229 | - |
Health Care | 1,416,831 | 497,206 | 919,625 | - |
Industrials | 1,146,371 | 836,192 | 310,179 | - |
Information Technology | 830,123 | 605,993 | 224,130 | - |
Materials | 240,897 | 157,404 | 83,493 | - |
Telecommunication Services | 528,010 | 7,969 | 520,041 | - |
Government Obligations | 1,930 | - | 1,930 | - |
Preferred Securities | 10,747 | - | 10,747 | - |
Money Market Funds | 575,500 | 575,500 | - | - |
Total Investments in Securities: | $ 11,090,024 | $ 6,170,260 | $ 4,896,765 | $ 22,999 |
Derivative Instruments: | | | | |
Assets | | | | |
Futures Contracts | $ 9,203 | $ 9,203 | $ - | $ - |
The following is a summary of transfers between Level 1 and Level 2 for the period ended October 31, 2015. Transfers are assumed to have occurred at the beginning of the period, and are primarily attributable to the valuation techniques used for foreign equity securities, as discussed in the accompanying Notes to Financial Statements: |
Transfers | Total (000s) |
Level 1 to Level 2 | $ 381,182 |
Level 2 to Level 1 | $ 79,997 |
Value of Derivative Instruments |
The following table is a summary of the Fund's value of derivative instruments by primary risk exposure as of October 31, 2015. For additional information on derivative instruments, please refer to the Derivative Instruments section in the accompanying Notes to Financial Statements. |
Primary Risk Exposure /
Derivative Type | Value (000s) |
| Asset | Liability |
Equity Risk | | |
Futures Contracts (a) | $ 9,203 | $ - |
Total Value of Derivatives | $ 9,203 | $ - |
(a) Reflects gross cumulative appreciation (depreciation) on futures contracts as presented in the Schedule of Investments. Only the period end receivable or payable for daily variation margin and net unrealized appreciation (depreciation) are presented in the Statement of Assets and Liabilities. |
See accompanying notes which are an integral part of the financial statements.
Annual Report
Statement of Assets and Liabilities
Amounts in thousands (except per-share amounts) | | October 31, 2015 |
| | |
Assets | | |
Investment in securities, at value (including securities loaned of $44,670) - See accompanying schedule: Unaffiliated issuers (cost $9,188,061) | $ 10,502,083 | |
Fidelity Central Funds (cost $575,500) | 575,500 | |
Other affiliated issuers (cost $18,503) | 12,441 | |
Total Investments (cost $9,782,064) | | $ 11,090,024 |
Segregated cash with brokers for derivative instruments | | 9,348 |
Cash | | 172 |
Foreign currency held at value (cost $21,001) | | 21,001 |
Receivable for investments sold | | 28,370 |
Receivable for fund shares sold | | 12,338 |
Dividends receivable | | 24,068 |
Distributions receivable from Fidelity Central Funds | | 111 |
Prepaid expenses | | 30 |
Other receivables | | 3,575 |
Total assets | | 11,189,037 |
| | |
Liabilities | | |
Payable for investments purchased | | |
Regular delivery | $ 75,392 | |
Delayed delivery | 83,867 | |
Payable for fund shares redeemed | 5,982 | |
Accrued management fee | 7,145 | |
Distribution and service plan fees payable | 104 | |
Payable for daily variation margin for derivative instruments | 1,067 | |
Other affiliated payables | 1,508 | |
Other payables and accrued expenses | 593 | |
Collateral on securities loaned, at value | 46,206 | |
Total liabilities | | 221,864 |
| | |
Net Assets | | $ 10,967,173 |
Net Assets consist of: | | |
Paid in capital | | $ 9,614,122 |
Undistributed net investment income | | 108,769 |
Accumulated undistributed net realized gain (loss) on investments and foreign currency transactions | | (73,154) |
Net unrealized appreciation (depreciation) on investments and assets and liabilities in foreign currencies | | 1,317,436 |
Net Assets | | $ 10,967,173 |
See accompanying notes which are an integral part of the financial statements.
Annual Report
Statement of Assets and Liabilities - continued
Amounts in thousands (except per-share amounts) | | October 31, 2015 |
| | |
Calculation of Maximum Offering Price | | |
Class A:
Net Asset Value and redemption price per share ($282,714 ÷ 7,106.131 shares) | | $ 39.78 |
| | |
Maximum offering price per share (100/94.25 of $39.78) | | $ 42.21 |
Class T:
Net Asset Value and redemption price per share ($42,965 ÷ 1,087.491 shares) | | $ 39.51 |
| | |
Maximum offering price per share (100/96.50 of $39.51) | | $ 40.94 |
Class B:
Net Asset Value and offering price per share ($2,249 ÷ 57.378 shares)A | | $ 39.20 |
| | |
Class C:
Net Asset Value and offering price per share ($31,737 ÷ 810.917 shares)A | | $ 39.14 |
| | |
International Discovery:
Net Asset Value, offering price and redemption price per share ($7,208,744 ÷ 179,698.201 shares) | | $ 40.12 |
| | |
Class K:
Net Asset Value, offering price and redemption price per share ($2,307,850 ÷ 57,614.604 shares) | | $ 40.06 |
| | |
Class I:
Net Asset Value, offering price and redemption price per share ($1,060,821 ÷ 26,500.627 shares) | | $ 40.03 |
| | |
Class Z:
Net Asset Value, offering price and redemption price per share ($30,093 ÷ 751.671 shares) | | $ 40.03 |
A Redemption price per share is equal to net asset value less any applicable contingent deferred sales charge.
See accompanying notes which are an integral part of the financial statements.
Annual Report
Financial Statements - continued
Statement of Operations
Amounts in thousands | Year ended October 31, 2015 |
| | |
Investment Income | | |
Dividends (including $841 earned from other affiliated issuers) | | $ 237,713 |
Special dividends | | 34,094 |
Interest | | 101 |
Income from Fidelity Central Funds | | 3,936 |
Income before foreign taxes withheld | | 275,844 |
Less foreign taxes withheld | | (19,005) |
Total income | | 256,839 |
| | |
Expenses | | |
Management fee | | |
Basic fee | $ 74,535 | |
Performance adjustment | 11,730 | |
Transfer agent fees | 16,773 | |
Distribution and service plan fees | 1,337 | |
Accounting and security lending fees | 1,839 | |
Custodian fees and expenses | 1,612 | |
Independent trustees' compensation | 47 | |
Registration fees | 226 | |
Audit | 124 | |
Legal | 30 | |
Miscellaneous | 101 | |
Total expenses before reductions | 108,354 | |
Expense reductions | (1,353) | 107,001 |
Net investment income (loss) | | 149,838 |
Realized and Unrealized Gain (Loss) | | |
Net realized gain (loss) on: | | |
Investment securities: | | |
Unaffiliated issuers (net of foreign taxes of $606) | 220,061 | |
Other affiliated issuers | (3,654) | |
Foreign currency transactions | (3,878) | |
Futures contracts | 33,241 | |
Total net realized gain (loss) | | 245,770 |
Change in net unrealized appreciation (depreciation) on: Investment securities (net of decrease in deferred foreign taxes of $7,503) | 13,737 | |
Assets and liabilities in foreign currencies | 2,313 | |
Futures contracts | (15,395) | |
Total change in net unrealized appreciation (depreciation) | | 655 |
Net gain (loss) | | 246,425 |
Net increase (decrease) in net assets resulting from operations | | $ 396,263 |
See accompanying notes which are an integral part of the financial statements.
Annual Report
Statement of Changes in Net Assets
Amounts in thousands | Year ended
October 31,
2015 | Year ended
October 31,
2014 |
Increase (Decrease) in Net Assets | | |
Operations | | |
Net investment income (loss) | $ 149,838 | $ 199,098 |
Net realized gain (loss) | 245,770 | 758,004 |
Change in net unrealized appreciation (depreciation) | 655 | (958,756) |
Net increase (decrease) in net assets resulting from operations | 396,263 | (1,654) |
Distributions to shareholders from net investment income | (74,589) | (136,326) |
Distributions to shareholders from net realized gain | - | (88,586) |
Total distributions | (74,589) | (224,912) |
Share transactions - net increase (decrease) | (353,147) | (69,908) |
Redemption fees | 95 | 139 |
Total increase (decrease) in net assets | (31,378) | (296,335) |
| | |
Net Assets | | |
Beginning of period | 10,998,551 | 11,294,886 |
End of period (including undistributed net investment income of $108,769 and undistributed net investment income of $68,609, respectively) | $ 10,967,173 | $ 10,998,551 |
See accompanying notes which are an integral part of the financial statements.
Annual Report
Financial Highlights - Fidelity International Discovery Fund Class A
Years ended October 31, | 2015 | 2014 | 2013 | 2012 | 2011 |
Selected Per-Share Data | | | | | |
Net asset value, beginning of period | $ 38.70 | $ 39.49 | $ 31.66 | $ 29.43 | $ 32.07 |
Income from Investment Operations | | | | | |
Net investment income (loss) C | .40F | .53G | .34 | .41 | .42 |
Net realized and unrealized gain (loss) | .79 | (.67) | 7.97 | 2.11 | (2.52) |
Total from investment operations | 1.19 | (.14) | 8.31 | 2.52 | (2.10) |
Distributions from net investment income | (.11) | (.33) | (.45) | (.29) | (.38) |
Distributions from net realized gain | - | (.31) | (.03) | - | (.16) |
Total distributions | (.11) | (.65) K | (.48) | (.29) | (.54) |
Redemption fees added to paid in capitalC, I | - | - | - | - | - |
Net asset value, end of period | $ 39.78 | $ 38.70 | $ 39.49 | $ 31.66 | $ 29.43 |
Total ReturnA, B | 3.09% | (.36)% | 26.59% | 8.70% | (6.71)% |
Ratios to Average Net AssetsD, H | | | | |
Expenses before reductions | 1.33% | 1.28% | 1.35% | 1.34% | 1.30% |
Expenses net of fee waivers, if any | 1.33% | 1.28% | 1.35% | 1.34% | 1.29% |
Expenses net of all reductions | 1.32% | 1.28% | 1.33% | 1.31% | 1.25% |
Net investment income (loss) | 1.00%F | 1.35%G | .97% | 1.41% | 1.31% |
Supplemental Data | | | | | |
Net assets, end of period (in millions) | $ 283 | $ 297 | $ 347 | $ 299 | $ 320 |
Portfolio turnover rateE | 60%J | 57% | 65% | 68% | 75% |
A Total returns would have been lower if certain expenses had not been reduced during the applicable periods shown.
B Total returns do not include the effect of the sales charges.
C Calculated based on average shares outstanding during the period.
D Fees and expenses of any underlying Fidelity Central Funds are not included in the Fund's expense ratio. The Fund indirectly bears its proportionate share of the expenses of any underlying Fidelity Central Funds.
E Amount does not include the portfolio activity of any underlying Fidelity Central Funds.
F Investment income per share reflects a large, non-recurring dividend which amounted to $.12 per share. Excluding this non-recurring dividend, the ratio of net investment income (loss) to average net assets would have been .69%.
G Investment income per share reflects a large, non-recurring dividend which amounted to $.22 per share. Excluding this non-recurring dividend, the ratio of net investment income (loss) to average net assets would have been .80%.
H Expense ratios reflect operating expenses of the class. Expenses before reductions do not reflect amounts reimbursed by the investment adviser or reductions from brokerage service arrangements or reductions from other expense offset arrangements and do not represent the amount paid by the class during periods when reimbursements or reductions occur. Expenses net of fee waivers reflect expenses after reimbursement by the investment adviser but prior to reductions from brokerage service arrangements or other expense offset arrangements. Expenses net of all reductions represent the net expenses paid by the class.
I Amount represents less than $.005 per share.
J Portfolio turnover rate excludes securities received or delivered in-kind.
K Total distributions of $.65 per share is comprised of distributions from net investment income of $.334 and distributions from net realized gain of $.311 per share.
See accompanying notes which are an integral part of the financial statements.
Annual Report
Financial Highlights - Fidelity International Discovery Fund Class T
Years ended October 31, | 2015 | 2014 | 2013 | 2012 | 2011 |
Selected Per-Share Data | | | | | |
Net asset value, beginning of period | $ 38.43 | $ 39.23 | $ 31.42 | $ 29.18 | $ 31.81 |
Income from Investment Operations | | | | | |
Net investment income (loss) C | .30F | .44G | .26 | .34 | .34 |
Net realized and unrealized gain (loss) | .80 | (.68) | 7.92 | 2.09 | (2.51) |
Total from investment operations | 1.10 | (.24) | 8.18 | 2.43 | (2.17) |
Distributions from net investment income | (.02) | (.25) | (.34) | (.19) | (.30) |
Distributions from net realized gain | - | (.31) | (.03) | - | (.16) |
Total distributions | (.02) | (.56) | (.37) | (.19) | (.46) |
Redemption fees added to paid in capitalC, I | - | - | - | - | - |
Net asset value, end of period | $ 39.51 | $ 38.43 | $ 39.23 | $ 31.42 | $ 29.18 |
Total ReturnA, B | 2.86% | (.60)% | 26.31% | 8.41% | (6.96)% |
Ratios to Average Net AssetsD, H | | | | | |
Expenses before reductions | 1.57% | 1.51% | 1.59% | 1.59% | 1.56% |
Expenses net of fee waivers, if any | 1.57% | 1.51% | 1.59% | 1.59% | 1.55% |
Expenses net of all reductions | 1.56% | 1.51% | 1.57% | 1.56% | 1.51% |
Net investment income (loss) | .76%F | 1.11%G | .73% | 1.16% | 1.05% |
Supplemental Data | | | | | |
Net assets, end of period (in millions) | $ 43 | $ 49 | $ 53 | $ 46 | $ 61 |
Portfolio turnover rateE | 60%J | 57% | 65% | 68% | 75% |
A Total returns would have been lower if certain expenses had not been reduced during the applicable periods shown.
B Total returns do not include the effect of the sales charges.
C Calculated based on average shares outstanding during the period.
D Fees and expenses of any underlying Fidelity Central Funds are not included in the Fund's expense ratio. The Fund indirectly bears its proportionate share of the expenses of any underlying Fidelity Central Funds.
E Amount does not include the portfolio activity of any underlying Fidelity Central Funds.
F Investment income per share reflects a large, non-recurring dividend which amounted to $.12 per share. Excluding this non-recurring dividend, the ratio of net investment income (loss) to average net assets would have been .45%.
G Investment income per share reflects a large, non-recurring dividend which amounted to $.21 per share. Excluding this non-recurring dividend, the ratio of net investment income (loss) to average net assets would have been .56%.
H Expense ratios reflect operating expenses of the class. Expenses before reductions do not reflect amounts reimbursed by the investment adviser or reductions from brokerage service arrangements or reductions from other expense offset arrangements and do not represent the amount paid by the class during periods when reimbursements or reductions occur. Expenses net of fee waivers reflect expenses after reimbursement by the investment adviser but prior to reductions from brokerage service arrangements or other expense offset arrangements. Expenses net of all reductions represent the net expenses paid by the class.
I Amount represents less than $.005 per share.
J Portfolio turnover rate excludes securities received or delivered in-kind.
See accompanying notes which are an integral part of the financial statements.
Annual Report
Financial Highlights - Fidelity International Discovery Fund Class B
Years ended October 31, | 2015 | 2014 | 2013 | 2012 | 2011 |
Selected Per-Share Data | | | | | |
Net asset value, beginning of period | $ 38.32 | $ 39.08 | $ 31.28 | $ 29.02 | $ 31.60 |
Income from Investment Operations | | | | | |
Net investment income (loss) C | .08F | .22G | .08 | .19 | .17 |
Net realized and unrealized gain (loss) | .80 | (.66) | 7.90 | 2.09 | (2.48) |
Total from investment operations | .88 | (.44) | 7.98 | 2.28 | (2.31) |
Distributions from net investment income | - | (.01) | (.15) | (.02) | (.12) |
Distributions from net realized gain | - | (.31) | (.03) | - | (.16) |
Total distributions | - | (.32) | (.18) | (.02) | (.27) K |
Redemption fees added to paid in capitalC, I | - | - | - | - | - |
Net asset value, end of period | $ 39.20 | $ 38.32 | $ 39.08 | $ 31.28 | $ 29.02 |
Total ReturnA, B | 2.30% | (1.12)% | 25.64% | 7.85% | (7.39)% |
Ratios to Average Net AssetsD, H | | | | |
Expenses before reductions | 2.12% | 2.06% | 2.10% | 2.09% | 2.06% |
Expenses net of fee waivers, if any | 2.12% | 2.06% | 2.10% | 2.09% | 2.06% |
Expenses net of all reductions | 2.11% | 2.05% | 2.08% | 2.06% | 2.02% |
Net investment income (loss) | .21%F | .57%G | .22% | .66% | .54% |
Supplemental Data | | | | | |
Net assets, end of period (in millions) | $ 2 | $ 5 | $ 7 | $ 8 | $ 10 |
Portfolio turnover rateE | 60%J | 57% | 65% | 68% | 75% |
A Total returns would have been lower if certain expenses had not been reduced during the applicable periods shown.
B Total returns do not include the effect of the contingent deferred sales charge.
C Calculated based on average shares outstanding during the period.
D Fees and expenses of any underlying Fidelity Central Funds are not included in the Fund's expense ratio. The Fund indirectly bears its proportionate share of the expenses of any underlying Fidelity Central Funds.
E Amount does not include the portfolio activity of any underlying Fidelity Central Funds.
F Investment income per share reflects a large, non-recurring dividend which amounted to $.12 per share. Excluding this non-recurring dividend, the ratio of net investment income (loss) to average net assets would have been (.10)%.
G Investment income per share reflects a large, non-recurring dividend which amounted to $.21 per share. Excluding this non-recurring dividend, the ratio of net investment income (loss) to average net assets would have been .02%.
H Expense ratios reflect operating expenses of the class. Expenses before reductions do not reflect amounts reimbursed by the investment adviser or reductions from brokerage service arrangements or reductions from other expense offset arrangements and do not represent the amount paid by the class during periods when reimbursements or reductions occur. Expenses net of fee waivers reflect expenses after reimbursement by the investment adviser but prior to reductions from brokerage service arrangements or other expense offset arrangements. Expenses net of all reductions represent the net expenses paid by the class.
I Amount represents less than $.005 per share.
J Portfolio turnover rate excludes securities received or delivered in-kind.
K Total distributions of $.27 per share is comprised of distributions from net investment income of $.115 and distributions from net realized gain of $.155 per share.
See accompanying notes which are an integral part of the financial statements.
Annual Report
Financial Highlights - Fidelity International Discovery Fund Class C
Years ended October 31, | 2015 | 2014 | 2013 | 2012 | 2011 |
Selected Per-Share Data | | | | | |
Net asset value, beginning of period | $ 38.25 | $ 39.07 | $ 31.32 | $ 29.08 | $ 31.68 |
Income from Investment Operations | | | | | |
Net investment income (loss) C | .10F | .23G | .08 | .19 | .18 |
Net realized and unrealized gain (loss) | .79 | (.66) | 7.90 | 2.09 | (2.49) |
Total from investment operations | .89 | (.43) | 7.98 | 2.28 | (2.31) |
Distributions from net investment income | - | (.08) | (.20) | (.04) | (.14) |
Distributions from net realized gain | - | (.31) | (.03) | - | (.16) |
Total distributions | - | (.39) | (.23) | (.04) | (.29) K |
Redemption fees added to paid in capitalC, I | - | - | - | - | - |
Net asset value, end of period | $ 39.14 | $ 38.25 | $ 39.07 | $ 31.32 | $ 29.08 |
Total ReturnA, B | 2.33% | (1.10)% | 25.65% | 7.86% | (7.37)% |
Ratios to Average Net AssetsD, H | | | | | |
Expenses before reductions | 2.09% | 2.03% | 2.10% | 2.09% | 2.05% |
Expenses net of fee waivers, if any | 2.09% | 2.03% | 2.09% | 2.09% | 2.04% |
Expenses net of all reductions | 2.08% | 2.02% | 2.07% | 2.06% | 2.00% |
Net investment income (loss) | .24%F | .60%G | .23% | .66% | .56% |
Supplemental Data | | | | | |
Net assets, end of period (in millions) | $ 32 | $ 35 | $ 36 | $ 30 | $ 33 |
Portfolio turnover rateE | 60%J | 57% | 65% | 68% | 75% |
A Total returns would have been lower if certain expenses had not been reduced during the applicable periods shown.
B Total returns do not include the effect of the contingent deferred sales charge.
C Calculated based on average shares outstanding during the period.
D Fees and expenses of any underlying Fidelity Central Funds are not included in the Fund's expense ratio. The Fund indirectly bears its proportionate share of the expenses of any underlying Fidelity Central Funds.
E Amount does not include the portfolio activity of any underlying Fidelity Central Funds.
F Investment income per share reflects a large, non-recurring dividend which amounted to $.12 per share. Excluding this non-recurring dividend, the ratio of net investment income (loss) to average net assets would have been (.06)%.
G Investment income per share reflects a large, non-recurring dividend which amounted to $.21 per share. Excluding this non-recurring dividend, the ratio of net investment income (loss) to average net assets would have been .05%.
H Expense ratios reflect operating expenses of the class. Expenses before reductions do not reflect amounts reimbursed by the investment adviser or reductions from brokerage service arrangements or reductions from other expense offset arrangements and do not represent the amount paid by the class during periods when reimbursements or reductions occur. Expenses net of fee waivers reflect expenses after reimbursement by the investment adviser but prior to reductions from brokerage service arrangements or other expense offset arrangements. Expenses net of all reductions represent the net expenses paid by the class.
I Amount represents less than $.005 per share.
J Portfolio turnover rate excludes securities received or delivered in-kind.
K Total distributions of $.29 per share is comprised of distributions from net investment income of $.137 and distributions from net realized gain of $.155 per share.
See accompanying notes which are an integral part of the financial statements.
Annual Report
Financial Highlights - Fidelity International Discovery Fund
Years ended October 31, | 2015 | 2014 | 2013 | 2012 | 2011 |
Selected Per-Share Data | | | | | |
Net asset value, beginning of period | $ 39.03 | $ 39.82 | $ 31.91 | $ 29.69 | $ 32.34 |
Income from Investment Operations | | | | | |
Net investment income (loss) B | .54E | .67F | .47 | .51 | .53 |
Net realized and unrealized gain (loss) | .81 | (.68) | 8.02 | 2.12 | (2.54) |
Total from investment operations | 1.35 | (.01) | 8.49 | 2.63 | (2.01) |
Distributions from net investment income | (.26) | (.47) | (.55) | (.41) | (.48) |
Distributions from net realized gain | - | (.31) | (.03) | - | (.16) |
Total distributions | (.26) | (.78) | (.58) | (.41) | (.64) |
Redemption fees added to paid in capitalB, H | - | - | - | - | - |
Net asset value, end of period | $ 40.12 | $ 39.03 | $ 39.82 | $ 31.91 | $ 29.69 |
Total ReturnA | 3.47% | (.01)% | 27.03% | 9.03% | (6.39)% |
Ratios to Average Net AssetsC, G | | | | | |
Expenses before reductions | .99% | .93% | 1.00% | 1.01% | .97% |
Expenses net of fee waivers, if any | .99% | .93% | 1.00% | 1.01% | .96% |
Expenses net of all reductions | .98% | .93% | .98% | .98% | .92% |
Net investment income (loss) | 1.34%E | 1.69%F | 1.32% | 1.73% | 1.64% |
Supplemental Data | | | | | |
Net assets, end of period (in millions) | $ 7,209 | $ 7,464 | $ 7,800 | $ 5,965 | $ 6,806 |
Portfolio turnover rateD | 60%I | 57% | 65% | 68% | 75% |
A Total returns would have been lower if certain expenses had not been reduced during the applicable periods shown.
B Calculated based on average shares outstanding during the period.
C Fees and expenses of any underlying Fidelity Central Funds are not included in the Fund's expense ratio. The Fund indirectly bears its proportionate share of the expenses of any underlying Fidelity Central Funds.
D Amount does not include the portfolio activity of any underlying Fidelity Central Funds.
E Investment income per share reflects a large, non-recurring dividend which amounted to $.12 per share. Excluding this non-recurring dividend, the ratio of net investment income (loss) to average net assets would have been 1.03%.
F Investment income per share reflects a large, non-recurring dividend which amounted to $.22 per share. Excluding this non-recurring dividend, the ratio of net investment income (loss) to average net assets would have been 1.15%.
G Expense ratios reflect operating expenses of the class. Expenses before reductions do not reflect amounts reimbursed by the investment adviser or reductions from brokerage service arrangements or reductions from other expense offset arrangements and do not represent the amount paid by the class during periods when reimbursements or reductions occur. Expenses net of fee waivers reflect expenses after reimbursement by the investment adviser but prior to reductions from brokerage service arrangements or other expense offset arrangements. Expenses net of all reductions represent the net expenses paid by the class.
H Amount represents less than $.005 per share.
I Portfolio turnover rate excludes securities received or delivered in-kind.
See accompanying notes which are an integral part of the financial statements.
Annual Report
Financial Highlights - Fidelity International Discovery Fund Class K
Years ended October 31, | 2015 | 2014 | 2013 | 2012 | 2011 |
Selected Per-Share Data | | | | | |
Net asset value, beginning of period | $ 38.97 | $ 39.76 | $ 31.87 | $ 29.66 | $ 32.32 |
Income from Investment Operations | | | | | |
Net investment income (loss) B | .59E | .72F | .52 | .57 | .58 |
Net realized and unrealized gain (loss) | .81 | (.67) | 8.01 | 2.11 | (2.54) |
Total from investment operations | 1.40 | .05 | 8.53 | 2.68 | (1.96) |
Distributions from net investment income | (.31) | (.53) | (.61) | (.47) | (.55) |
Distributions from net realized gain | - | (.31) | (.03) | - | (.16) |
Total distributions | (.31) | (.84) | (.64) | (.47) | (.70) J |
Redemption fees added to paid in capitalB, H | - | - | - | - | - |
Net asset value, end of period | $ 40.06 | $ 38.97 | $ 39.76 | $ 31.87 | $ 29.66 |
Total ReturnA | 3.61% | .13% | 27.23% | 9.24% | (6.24)% |
Ratios to Average Net AssetsC, G | | | | |
Expenses before reductions | .86% | .80% | .85% | .83% | .80% |
Expenses net of fee waivers, if any | .86% | .80% | .85% | .83% | .79% |
Expenses net of all reductions | .85% | .79% | .83% | .80% | .75% |
Net investment income (loss) | 1.47%E | 1.83%F | 1.47% | 1.91% | 1.81% |
Supplemental Data | | | | | |
Net assets, end of period (in millions) | $ 2,308 | $ 2,464 | $ 2,576 | $ 1,776 | $ 1,245 |
Portfolio turnover rateD | 60%I | 57% | 65% | 68% | 75% |
A Total returns would have been lower if certain expenses had not been reduced during the applicable periods shown.
B Calculated based on average shares outstanding during the period.
C Fees and expenses of any underlying Fidelity Central Funds are not included in the Fund's expense ratio. The Fund indirectly bears its proportionate share of the expenses of any underlying Fidelity Central Funds.
D Amount does not include the portfolio activity of any underlying Fidelity Central Funds.
E Investment income per share reflects a large, non-recurring dividend which amounted to $.12 per share. Excluding this non-recurring dividend, the ratio of net investment income (loss) to average net assets would have been 1.16%.
F Investment income per share reflects a large, non-recurring dividend which amounted to $.22 per share. Excluding this non-recurring dividend, the ratio of net investment income (loss) to average net assets would have been 1.28%.
G Expense ratios reflect operating expenses of the class. Expenses before reductions do not reflect amounts reimbursed by the investment adviser or reductions from brokerage service arrangements or reductions from other expense offset arrangements and do not represent the amount paid by the class during periods when reimbursements or reductions occur. Expenses net of fee waivers reflect expenses after reimbursement by the investment adviser but prior to reductions from brokerage service arrangements or other expense offset arrangements. Expenses net of all reductions represent the net expenses paid by the class.
H Amount represents less than $.005 per share.
I Portfolio turnover rate excludes securities received or delivered in-kind.
J Total distributions of $.70 per share is comprised of distributions from net investment income of $.548 and distributions from net realized gain of $.155 per share.
See accompanying notes which are an integral part of the financial statements.
Annual Report
Financial Highlights - Fidelity International Discovery Fund Class I
Years ended October 31, | 2015 | 2014 | 2013 | 2012 | 2011 |
Selected Per-Share Data | | | | | |
Net asset value, beginning of period | $ 38.96 | $ 39.76 | $ 31.87 | $ 29.65 | $ 32.31 |
Income from Investment Operations | | | | | |
Net investment income (loss) B | .53E | .67F | .47 | .52 | .54 |
Net realized and unrealized gain (loss) | .80 | (.68) | 8.01 | 2.11 | (2.55) |
Total from investment operations | 1.33 | (.01) | 8.48 | 2.63 | (2.01) |
Distributions from net investment income | (.26) | (.48) | (.56) | (.41) | (.50) |
Distributions from net realized gain | - | (.31) | (.03) | - | (.16) |
Total distributions | (.26) | (.79) | (.59) | (.41) | (.65) J |
Redemption fees added to paid in capitalB, H | - | - | - | - | - |
Net asset value, end of period | $ 40.03 | $ 38.96 | $ 39.76 | $ 31.87 | $ 29.65 |
Total ReturnA | 3.44% | (.01)% | 27.03% | 9.07% | (6.39)% |
Ratios to Average Net AssetsC, G | | | | | |
Expenses before reductions | 1.00% | .93% | 1.00% | 1.00% | .95% |
Expenses net of fee waivers, if any | .99% | .93% | 1.00% | 1.00% | .94% |
Expenses net of all reductions | .98% | .93% | .97% | .97% | .90% |
Net investment income (loss) | 1.33%E | 1.69%F | 1.33% | 1.75% | 1.66% |
Supplemental Data | | | | | |
Net assets, end of period (in millions) | $ 1,061 | $ 650 | $ 476 | $ 294 | $ 278 |
Portfolio turnover rateD | 60%I | 57% | 65% | 68% | 75% |
A Total returns would have been lower if certain expenses had not been reduced during the applicable periods shown.
B Calculated based on average shares outstanding during the period.
C Fees and expenses of any underlying Fidelity Central Funds are not included in the Fund's expense ratio. The Fund indirectly bears its proportionate share of the expenses of any underlying Fidelity Central Funds.
D Amount does not include the portfolio activity of any underlying Fidelity Central Funds.
E Investment income per share reflects a large, non-recurring dividend which amounted to $.12 per share. Excluding this non-recurring dividend, the ratio of net investment income (loss) to average net assets would have been 1.03%.
F Investment income per share reflects a large, non-recurring dividend which amounted to $.22 per share. Excluding this non-recurring dividend, the ratio of net investment income (loss) to average net assets would have been 1.14%.
G Expense ratios reflect operating expenses of the class. Expenses before reductions do not reflect amounts reimbursed by the investment adviser or reductions from brokerage service arrangements or reductions from other expense offset arrangements and do not represent the amount paid by the class during periods when reimbursements or reductions occur. Expenses net of fee waivers reflect expenses after reimbursement by the investment adviser but prior to reductions from brokerage service arrangements or other expense offset arrangements. Expenses net of all reductions represent the net expenses paid by the class.
H Amount represents less than $.005 per share.
I Portfolio turnover rate excludes securities received or delivered in-kind.
J Total distributions of $.65 per share is comprised of distributions from net investment income of $.497 and distributions from net realized gain of $.155 per share.
See accompanying notes which are an integral part of the financial statements.
Annual Report
Financial Highlights - Fidelity International Discovery Fund Class Z
Years ended October 31, | 2015 | 2014 | 2013 I |
Selected Per-Share Data | | | |
Net asset value, beginning of period | $ 38.96 | $ 39.77 | $ 37.22 |
Income from Investment Operations | | | |
Net investment income (loss)D | .59G | .72H | .07 |
Net realized and unrealized gain (loss) | .80 | (.68) | 2.48 |
Total from investment operations | 1.39 | .04 | 2.55 |
Distributions from net investment income | (.32) | (.54) | - |
Distributions from net realized gain | - | (.31) | - |
Total distributions | (.32) | (.85) | - |
Redemption fees added to paid in capitalD, K | - | - | - |
Net asset value, end of period | $ 40.03 | $ 38.96 | $ 39.77 |
Total ReturnB, C | 3.58% | .12% | 6.85% |
Ratios to Average Net AssetsE, J | | | |
Expenses before reductions | .86% | .80% | .85%A |
Expenses net of fee waivers, if any | .86% | .80% | .85%A |
Expenses net of all reductions | .85% | .79% | .83%A |
Net investment income (loss) | 1.47%G | 1.83%H | .76%A |
Supplemental Data | | | |
Net assets, end of period (000 omitted) | $ 30,093 | $ 35,125 | $ 107 |
Portfolio turnover rateF | 60%L | 57% | 65% |
A Annualized
B Total returns for periods of less than one year are not annualized.
C Total returns would have been lower if certain expenses had not been reduced during the applicable periods shown.
D Calculated based on average shares outstanding during the period.
E Fees and expenses of any underlying Fidelity Central Funds are not included in the Fund's expense ratio. The Fund indirectly bears its proportionate share of the expenses of any underlying Fidelity Central Funds.
F Amount does not include the portfolio activity of any underlying Fidelity Central Funds.
G Investment income per share reflects a large, non-recurring dividend which amounted to $.12 per share. Excluding this non-recurring dividend, the ratio of net investment income (loss) to average net assets would have been 1.16%.
H Investment income per share reflects a large, non-recurring dividend which amounted to $.21 per share. Excluding this non-recurring dividend, the ratio of net investment income (loss) to average net assets would have been 1.28%.
I For the period August 13, 2013 (commencement of sale of shares) to October 31, 2013.
J Expense ratios reflect operating expenses of the class. Expenses before reductions do not reflect amounts reimbursed by the investment adviser or reductions from brokerage service arrangements or reductions from other expense offset arrangements and do not represent the amount paid by the class during periods when reimbursements or reductions occur. Expense ratios before reductions for start-up periods may not be representative of larger-term operating periods. Expenses net of fee waivers reflect expenses after reimbursement by the investment adviser but prior to reductions from brokerage service arrangements or other expense offset arrangements. Expenses net of all reductions represent the net expenses paid by the class.
K Amount represents less than $.005 per share.
L Portfolio turnover rate excludes securities received or delivered in-kind.
See accompanying notes which are an integral part of the financial statements.
Annual Report
For the period ended October 31, 2015
(Amounts in thousands except percentages)
1. Organization.
Fidelity International Discovery Fund (the Fund) is a fund of Fidelity Investment Trust (the Trust) and is authorized to issue an unlimited number of shares. The Trust is registered under the Investment Company Act of 1940, as amended (the 1940 Act), as an open-end management investment company organized as a Massachusetts business trust. The Fund offers Class A, Class T, Class C, International Discovery, Class K, Class I (formerly Institutional Class) and Class Z shares, each of which, along with Class B shares, has equal rights as to assets and voting privileges. Class B shares are closed to new accounts and additional purchases, except for exchanges and reinvestments. Each class has exclusive voting rights with respect to matters that affect that class. Class B shares will automatically convert to Class A shares after a holding period of seven years from the initial date of purchase.
2. Investments in Fidelity Central Funds.
The Fund invests in Fidelity Central Funds, which are open-end investment companies generally available only to other investment companies and accounts managed by the investment adviser and its affiliates. The Fund's Schedule of Investments lists each of the Fidelity Central Funds held as of period end, if any, as an investment of the Fund, but does not include the underlying holdings of each Fidelity Central Fund. As an Investing Fund, the Fund indirectly bears its proportionate share of the expenses of the underlying Fidelity Central Funds.
The Money Market Central Funds seek preservation of capital and current income and are managed by Fidelity Investments Money Management, Inc. (FIMM), an affiliate of the investment adviser. Annualized expenses of the Money Market Central Funds as of their most recent shareholder report date are less than .005%.
A complete unaudited list of holdings for each Fidelity Central Fund is available upon request or at the Securities and Exchange Commission (the SEC) website at www.sec.gov. In addition, the financial statements of the Fidelity Central Funds, which are not covered by the Fund's Report of Independent Registered Public Accounting Firm, are available on the SEC website or upon request.
3. Significant Accounting Policies.
The financial statements have been prepared in conformity with accounting principles generally accepted in the United States of America (GAAP), which require management to make certain estimates and assumptions at the date of the financial statements. Actual results could differ from those estimates. Subsequent events, if any, through the date that the financial statements were issued have been evaluated in the preparation of
Annual Report
Notes to Financial Statements - continued
(Amounts in thousands except percentages)
3. Significant Accounting Policies - continued
the financial statements. The following summarizes the significant accounting policies of the Fund:
Investment Valuation. Investments are valued as of 4:00 p.m. Eastern time on the last calendar day of the period. The Board of Trustees (the Board) has delegated the day to day responsibility for the valuation of the Fund's investments to the Fidelity Management & Research Company (FMR) Fair Value Committee (the Committee). In accordance with valuation policies and procedures approved by the Board, the Fund attempts to obtain prices from one or more third party pricing vendors or brokers to value its investments. When current market prices, quotations or currency exchange rates are not readily available or reliable, investments will be fair valued in good faith by the Committee, in accordance with procedures adopted by the Board. Factors used in determining fair value vary by investment type and may include market or investment specific events, changes in interest rates and credit quality. The frequency with which these procedures are used cannot be predicted and they may be utilized to a significant extent. The Committee oversees the Fund's valuation policies and procedures and reports to the Board on the Committee's activities and fair value determinations. The Board monitors the appropriateness of the procedures used in valuing the Fund's investments and ratifies the fair value determinations of the Committee.
The Fund categorizes the inputs to valuation techniques used to value its investments into a disclosure hierarchy consisting of three levels as shown below:
Level 1 - quoted prices in active markets for identical investments
Level 2 - other significant observable inputs (including quoted prices for similar investments, interest rates, prepayment speeds, etc.)
Level 3 - unobservable inputs (including the Fund's own assumptions based on the best information available)
Valuation techniques used to value the Fund's investments by major category are as follows:
Equity securities, including restricted securities, for which market quotations are readily available, are valued at the last reported sale price or official closing price as reported by a third party pricing vendor on the primary market or exchange on which they are traded and are categorized as Level 1 in the hierarchy. In the event there were no sales during the day or closing prices are not available, securities are valued at the last quoted bid price or may be valued using the last available price and are generally categorized as Level 2 in the hierarchy. For foreign equity securities, when market or security specific events arise, comparisons to the valuation of American Depositary Receipts (ADRs), futures contracts, Exchange-Traded Funds (ETFs) and certain indexes as well as quoted
Annual Report
3. Significant Accounting Policies - continued
Investment Valuation - continued
prices for similar securities may be used and would be categorized as Level 2 in the hierarchy. Utilizing these techniques may result in transfers between Level 1 and Level 2. For equity securities, including restricted securities, where observable inputs are limited, assumptions about market activity and risk are used and these securities may be categorized as Level 3 in the hierarchy.
Debt securities, including restricted securities, are valued based on evaluated prices received from third party pricing vendors or from brokers who make markets in such securities. Preferred securities and U.S. government and government agency obligations are valued by pricing vendors who utilize matrix pricing which considers yield or price of bonds of comparable quality, coupon, maturity and type or by broker-supplied prices. When independent prices are unavailable or unreliable, debt securities may be valued utilizing pricing methodologies which consider similar factors that would be used by third party pricing vendors. Debt securities are generally categorized as Level 2 in the hierarchy but may be Level 3 depending on the circumstances.
Futures contracts are valued at the settlement price established each day by the board of trade or exchange on which they are traded and are categorized as Level 1 in the hierarchy. Investments in open-end mutual funds, including the Fidelity Central Funds, are valued at their closing net asset value (NAV) each business day and are categorized as Level 1 in the hierarchy.
Changes in valuation techniques may result in transfers in or out of an assigned level within the disclosure hierarchy. The aggregate value of investments by input level as of October 31, 2015, including information on transfers between Levels 1 and 2 is included at the end of the Fund's Schedule of Investments.
Foreign Currency. The Fund may use foreign currency contracts to facilitate transactions in foreign-denominated securities. Gains and losses from these transactions may arise from changes in the value of the foreign currency or if the counterparties do not perform under the contracts' terms.
Foreign-denominated assets, including investment securities, and liabilities are translated into U.S. dollars at the exchange rates at period end. Purchases and sales of investment securities, income and dividends received and expenses denominated in foreign currencies are translated into U.S. dollars at the exchange rate in effect on the transaction date.
The effects of exchange rate fluctuations on investments are included with the net realized and unrealized gain (loss) on investment securities. Other foreign currency transactions resulting in realized and unrealized gain (loss) are disclosed separately.
Annual Report
Notes to Financial Statements - continued
(Amounts in thousands except percentages)
3. Significant Accounting Policies - continued
Investment Transactions and Income. For financial reporting purposes, the Fund's investment holdings and NAV include trades executed through the end of the last business day of the period. The NAV per share for processing shareholder transactions is calculated as of the close of business of the New York Stock Exchange (NYSE), normally 4:00 p.m. Eastern time and includes trades executed through the end of the prior business day. Gains and losses on securities sold are determined on the basis of identified cost and may include proceeds received from litigation. Dividend income is recorded on the ex-dividend date, except for certain dividends from foreign securities where the ex-dividend date may have passed, which are recorded as soon as the Fund is informed of the ex-dividend date. Non-cash dividends included in dividend income, if any, are recorded at the fair market value of the securities received. Income and capital gain distributions from Fidelity Central Funds, if any, are recorded on the ex-dividend date. Distributions received on securities that represent a return of capital or capital gain are recorded as a reduction of cost of investments and/or as a realized gain. Subsequent to ex-dividend date the Fund determines the components of these distributions, based upon receipt of tax filings or other correspondence relating to the underlying investment. Large, non-recurring dividends recognized by the Fund are presented separately on the Statement of Operations as "Special Dividends" and the impact of these dividends is presented in the Financial Highlights. Interest income is accrued as earned and includes coupon interest and amortization of premium and accretion of discount on debt securities as applicable. Investment income is recorded net of foreign taxes withheld where recovery of such taxes is uncertain.
Class Allocations and Expenses. Investment income, realized and unrealized capital gains and losses, common expenses of the Fund, and certain fund-level expense reductions, if any, are allocated daily on a pro-rata basis to each class based on the relative net assets of each class to the total net assets of the Fund. Each class differs with respect to transfer agent and distribution and service plan fees incurred. Certain expense reductions may also differ by class. For the reporting period, the allocated portion of income and expenses to each class as a percent of its average net assets may vary due to the timing of recording these transactions in relation to fluctuating net assets of the classes. Expenses directly attributable to a fund are charged to that fund. Expenses attributable to more than one fund are allocated among the respective funds on the basis of relative net assets or other appropriate methods. Expense estimates are accrued in the period to which they relate and adjustments are made when actual amounts are known.
Deferred Trustee Compensation. Under a Deferred Compensation Plan (the Plan), independent Trustees may elect to defer receipt of a portion of their annual compensation. Deferred amounts are invested in a cross-section of Fidelity funds, are marked-to-market and remain in the Fund until distributed in accordance with the Plan. The
Annual Report
3. Significant Accounting Policies - continued
Deferred Trustee Compensation - continued
investment of deferred amounts and the offsetting payable to the Trustees are included in the accompanying Statement of Assets and Liabilities.
Income Tax Information and Distributions to Shareholders. Each year, the Fund intends to qualify as a regulated investment company under Subchapter M of the Internal Revenue Code, including distributing substantially all of its taxable income and realized gains. As a result, no provision for U.S. Federal income taxes is required. As of October 31, 2015, the Fund did not have any unrecognized tax benefits in the financial statements; nor is the Fund aware of any tax positions for which it is reasonably possible that the total amounts of unrecognized tax benefits will significantly change in the next twelve months. The Fund files a U.S. federal tax return, in addition to state and local tax returns as required. The Fund's federal income tax returns are subject to examination by the Internal Revenue Service (IRS) for a period of three fiscal years after they are filed. State and local tax returns may be subject to examination for an additional fiscal year depending on the jurisdiction. Foreign taxes are provided for based on the Fund's understanding of the tax rules and rates that exist in the foreign markets in which it invests. The Fund is subject to a tax imposed on capital gains by certain countries in which it invests.
Distributions are declared and recorded on the ex-dividend date. Income dividends and capital gain distributions are declared separately for each class. Income and capital gain distributions are determined in accordance with income tax regulations, which may differ from GAAP. In addition, the Fund claimed a portion of the payment made to redeeming shareholders as a distribution for income tax purposes.
Capital accounts within the financial statements are adjusted for permanent book-tax differences. These adjustments have no impact on net assets or the results of operations. Capital accounts are not adjusted for temporary book-tax differences which will reverse in a subsequent period.
Book-tax differences are primarily due to futures contracts, foreign currency transactions, passive foreign investment companies (PFIC), market discount, certain foreign taxes, redemptions in-kind, deferred trustees compensation, capital loss carryforwards and losses deferred due to wash sales.
The federal tax cost of investment securities and unrealized appreciation (depreciation) as of period end were as follows:
Gross unrealized appreciation | $ 1,751,994 |
Gross unrealized depreciation | (459,470) |
Net unrealized appreciation (depreciation) on securities | $ 1,292,524 |
Tax Cost | $ 9,797,500 |
Annual Report
Notes to Financial Statements - continued
(Amounts in thousands except percentages)
3. Significant Accounting Policies - continued
Income Tax Information and Distributions to Shareholders - continued
The tax-based components of distributable earnings as of period end were as follows:
Undistributed ordinary income | $ 109,669 |
Capital loss carryforward | $ (49,248) |
Net unrealized appreciation (depreciation) on securities and other investments | $ 1,292,925 |
Capital loss carryforwards are only available to offset future capital gains of the Fund to the extent provided by regulations and may be limited. Under the Regulated Investment Company Modernization Act of 2010 (the Act), the Fund is permitted to carry forward capital losses incurred in taxable years beginning after December 22, 2010 for an unlimited period and such capital losses are required to be used prior to any losses that expire. The capital loss carryforward information presented below, including any applicable limitation, is estimated as of fiscal period end and is subject to adjustment.
Fiscal year of expiration | |
2017 | $ (49,248) |
The tax character of distributions paid was as follows:
| October 31, 2015 | October 31, 2014 |
Ordinary Income | $ 74,589 | $ 224,912 |
Short-Term Trading (Redemption) Fees. Shares held by investors in the Fund less than 30 days may have been subject to a redemption fee equal to 1.00% of the NAV of shares redeemed. All redemption fees, which reduce the proceeds of the shareholder redemption, are retained by the Fund and accounted for as an addition to paid in capital.
Delayed Delivery Transactions and When-Issued Securities. During the period, the Fund transacted in securities on a delayed delivery or when-issued basis. Payment and delivery may take place after the customary settlement period for that security. The price of the underlying securities and the date when the securities will be delivered and paid for are fixed at the time the transaction is negotiated. The securities purchased on a delayed delivery or when-issued basis are identified as such in the Fund's Schedule of Investments. The Fund may receive compensation for interest forgone in the purchase of a delayed delivery or when-issued security. With respect to purchase commitments, the Fund identifies securities as segregated in its records with a value at least equal to the amount of the commitment. Losses may arise due to changes in the value of the underlying securities or if the counterparty does not perform under the contract's terms, or if the issuer does not issue the securities due to political, economic, or other factors.
Annual Report
3. Significant Accounting Policies - continued
Restricted Securities. The Fund may invest in securities that are subject to legal or contractual restrictions on resale. These securities generally may be resold in transactions exempt from registration or to the public if the securities are registered. Disposal of these securities may involve time-consuming negotiations and expense, and prompt sale at an acceptable price may be difficult. Information regarding restricted securities is included at the end of the Fund's Schedule of Investments.
4. Derivative Instruments.
Risk Exposures and the Use of Derivative Instruments. The Fund's investment objective allows the Fund to enter into various types of derivative contracts, including futures contracts. Derivatives are investments whose value is primarily derived from underlying assets, indices or reference rates and may be transacted on an exchange or over-the-counter (OTC). Derivatives may involve a future commitment to buy or sell a specified asset based on specified terms, to exchange future cash flows at periodic intervals based on a notional principal amount, or for one party to make one or more payments upon the occurrence of specified events in exchange for periodic payments from the other party.
The Fund used derivatives to increase returns and to manage exposure to certain risks as defined below. The success of any strategy involving derivatives depends on analysis of numerous economic factors, and if the strategies for investment do not work as intended, the Fund may not achieve its objectives.
The Fund's use of derivatives increased or decreased its exposure to the following risk:
Equity Risk | Equity risk relates to the fluctuations in the value of financial instruments as a result of changes in market prices (other than those arising from interest rate risk or foreign exchange risk), whether caused by factors specific to an individual investment, its issuer, or all factors affecting all instruments traded in a market or market segment. |
The Fund is also exposed to additional risks from investing in derivatives, such as liquidity risk and counterparty credit risk. Liquidity risk is the risk that the Fund will be unable to close out the derivative in the open market in a timely manner. Counterparty credit risk is the risk that the counterparty will not be able to fulfill its obligation to the Fund. Counterparty credit risk related to exchange-traded futures contracts may be mitigated by the protection provided by the exchange on which they trade.
Investing in derivatives may involve greater risks than investing in the underlying assets directly and, to varying degrees, may involve risk of loss in excess of any initial investment and collateral received and amounts recognized in the Statement of Assets and Liabilities. In addition, there may be the risk that the change in value of the derivative contract does not correspond to the change in value of the underlying instrument.
Annual Report
Notes to Financial Statements - continued
(Amounts in thousands except percentages)
4. Derivative Instruments - continued
Futures Contracts. A futures contract is an agreement between two parties to buy or sell a specified underlying instrument for a fixed price at a specified future date. The Fund used futures contracts to manage its exposure to the stock market.
Upon entering into a futures contract, a fund is required to deposit either cash or securities (initial margin) with a clearing broker in an amount equal to a certain percentage of the face value of the contract. Futures contracts are marked-to-market daily and subsequent daily payments (variation margin) are made or received by a fund depending on the daily fluctuations in the value of the futures contracts and are recorded as unrealized appreciation or (depreciation). This receivable and/or payable, if any, is included in daily variation margin for derivative instruments in the Statement of Assets and Liabilities. Realized gain or (loss) is recorded upon the expiration or closing of a futures contract.
Any open futures contracts at period end are presented in the Schedule of Investments under the caption "Futures Contracts." The underlying face amount at value reflects each contract's exposure to the underlying instrument or index at period end. Securities deposited to meet initial margin requirements are identified in the Schedule of Investments. Cash deposited to meet initial margin requirements is presented as segregated cash with brokers for derivative instruments in the Statement of Assets and Liabilities.
During the period the Fund recognized net realized gain (loss) of $33,241 and a change in net unrealized appreciation (depreciation) of $(15,395) related to its investment in futures contracts. These amounts are included in the Statement of Operations.
5. Purchases and Sales of Investments.
Purchases and sales of securities, other than short-term securities and in-kind transactions, aggregated $6,392,387 and $6,317,742, respectively.
Redemptions In-Kind. During the period, 4,932 shares of the Fund held by unaffiliated entities were redeemed for cash and investments, including accrued interest with a value of $197,848. The net realized gain of $41,387 on investments delivered through in-kind redemptions is included in the accompanying Statement of Operations. The amount of in-kind redemptions is included in share transactions in the accompanying Statement of Changes in Net Assets as well as Note 11: Share Transactions. The Fund recognized no gain or loss for federal income tax purposes.
6. Fees and Other Transactions with Affiliates.
Management Fee. Fidelity Management & Research Company (the investment adviser) and its affiliates provide the Fund with investment management related services for which the Fund pays a monthly management fee. The management fee is the
Annual Report
6. Fees and Other Transactions with Affiliates - continued
Management Fee - continued
sum of an individual fund fee rate that is based on an annual rate of .424% of the Fund's average net assets and an annualized group fee rate that averaged .25% during the period. The group fee rate is based upon the average net assets of all the mutual funds advised by the investment adviser, including any mutual funds previously advised by the investment adviser that are currently advised by Fidelity SelectCo, LLC, an affiliate of the investment adviser. The group fee rate decreases as assets under management increase and increases as assets under management decrease. In addition, the management fee is subject to a performance adjustment (up to a maximum of ± .20% of the Fund's average net assets over a 36 month performance period). The upward or downward adjustment to the management fee is based on the relative investment performance of International Discovery as compared to its benchmark index, the MSCI EAFE Index, over the same 36 month performance period. For the reporting period, the total annual management fee rate, including the performance adjustment, was .78% of the Fund's average net assets. The performance adjustment included in the management fee rate may be higher or lower than the maximum performance adjustment rate due to the difference between the average net assets for the reporting and performance periods.
Distribution and Service Plan Fees. In accordance with Rule 12b-1 of the 1940 Act, the Fund has adopted separate Distribution and Service Plans for each class of shares. Certain classes pay Fidelity Distributors Corporation (FDC), an affiliate of the investment adviser, separate Distribution and Service Fees, each of which is based on an annual percentage of each class' average net assets. In addition, FDC may pay financial intermediaries for selling shares of the Fund and providing shareholder support services.
For the period, the Distribution and Service Fee rates, total fees and amounts retained by FDC were as follows:
| Distribution
Fee | Service
Fee | Total Fees | Retained
by FDC |
Class A | -% | .25% | $ 731 | $ 4 |
Class T | .25% | .25% | 229 | 1 |
Class B | .75% | .25% | 34 | 25 |
Class C | .75% | .25% | 343 | 37 |
| | | $ 1,337 | $ 67 |
Sales Load. FDC may receive a front-end sales charge of up to 5.75% for selling Class A shares and 3.50% for selling Class T shares, some of which is paid to financial intermediaries for selling shares of the Fund. Depending on the holding period, FDC may receive contingent deferred sales charges levied on Class A, Class T, Class B, and Class C redemptions. The deferred sales charges range from 5.00% to 1.00% for Class B shares, 1.00% for Class C shares, 1.00% for certain purchases of Class A shares and .25% for certain purchases of Class T shares.
Annual Report
Notes to Financial Statements - continued
(Amounts in thousands except percentages)
6. Fees and Other Transactions with Affiliates - continued
Sales Load - continued
For the period, sales charge amounts retained by FDC were as follows:
| Retained
by FDC |
Class A | $ 62 |
Class T | 7 |
Class B A | 1 |
Class C A | 3 |
| $ 73 |
A When Class B and Class C shares are initially sold, FDC pays commissions from its own resources to financial intermediaries through which the sales are made.
Transfer Agent Fees. Fidelity Investments Institutional Operations Company, Inc., (FIIOC), an affiliate of the investment adviser, is the transfer, dividend disbursing and shareholder servicing agent for each class of the Fund. FIIOC receives account fees and asset-based fees that vary according to the account size and type of account of the shareholders of the respective classes of the Fund, except for Class K and Class Z. FIIOC receives an asset-based fee of Class K's and Class Z's average net assets. FIIOC pays for typesetting, printing and mailing of shareholder reports, except proxy statements.
For the period, transfer agent fees for each class were as follows:
| Amount | % of
Class-Level Average
Net Assets |
Class A | $ 788 | .27 |
Class T | 117 | .26 |
Class B | 10 | .30 |
Class C | 93 | .27 |
International Discovery | 13,037 | .18 |
Class K | 1,135 | .05 |
Class I | 1,576 | .18 |
Class Z | 17 | .05 |
| $ 16,773 | |
Accounting and Security Lending Fees. Fidelity Service Company, Inc. (FSC), an affiliate of the investment adviser, maintains the Fund's accounting records. The accounting fee is based on the level of average net assets for each month. Under a separate contract, FSC administers the security lending program. The security lending fee is based on the number and duration of lending transactions.
Annual Report
6. Fees and Other Transactions with Affiliates - continued
Brokerage Commissions. The Fund placed a portion of its portfolio transactions with brokerage firms which are affiliates of the investment adviser. Brokerage commissions are included in net realized gain (loss) and change in net unrealized appreciation (depreciation) in the Statement of Operations. The commissions paid to these affiliated firms were $6 for the period.
Other. During the period, the investment adviser reimbursed the Fund for certain losses in the amount of $46
7. Committed Line of Credit.
The Fund participates with other funds managed by the investment adviser or an affiliate in a $4.25 billion credit facility (the "line of credit") to be utilized for temporary or emergency purposes to fund shareholder redemptions or for other short-term liquidity purposes. The Fund has agreed to pay commitment fees on its pro-rata portion of the line of credit, which amounted to $16 and is reflected in Miscellaneous expenses on the Statement of Operations. During the period, the Fund did not borrow on this line of credit.
8. Security Lending.
The Fund lends portfolio securities through a lending agent from time to time in order to earn additional income. For equity securities, a lending agent is used and may loan securities to certain qualified borrowers, including Fidelity Capital Markets (FCM), a broker-dealer affiliated with the Fund. On the settlement date of the loan, the Fund receives collateral (in the form of U.S. Treasury obligations, letters of credit and/or cash) against the loaned securities and maintains collateral in an amount not less than 100% of the market value of the loaned securities during the period of the loan. The market value of the loaned securities is determined at the close of business of the Fund and any additional required collateral is delivered to the Fund on the next business day. The Fund or borrower may terminate the loan at any time, and if the borrower defaults on its obligation to return the securities loaned because of insolvency or other reasons, the Fund may apply collateral received from the borrower against the obligation. The Fund may experience delays and costs in recovering the securities loaned. Any cash collateral received is invested in the Fidelity Securities Lending Cash Central Fund. The value of loaned securities and cash collateral at period end are disclosed on the Fund's Statement of Assets and Liabilities. Security lending income represents the income earned on investing cash collateral, less rebates paid to borrowers and any lending agent fees associated with the loan, plus any premium payments received for lending certain types of securities. Security lending income is presented in the Statement of Operations as a component of income from Fidelity Central Funds. Total security lending income during the period amounted to $3,281. During the period, there were no securities loaned to FCM.
Annual Report
Notes to Financial Statements - continued
(Amounts in thousands except percentages)
9. Expense Reductions.
Commissions paid to certain brokers with whom the investment adviser, or its affiliates, places trades on behalf of the Fund include an amount in addition to trade execution, which may be rebated back to the Fund to offset certain expenses. This amount totaled $1,110 for the period.
In addition, during the period the investment adviser reimbursed and/or waived a portion of fund-level operating expenses in the amount of $45 and a portion of class-level operating expenses as follows:
| Amount |
Class A | $ 6 |
Class T | 1 |
Class B | -* |
Class C | 1 |
International Discovery | 177 |
Class I | 13 |
| $ 198 |
* In the amount of less than five hundred dollars.
10. Distributions to Shareholders.
Distributions to shareholders of each class were as follows:
Years ended October 31, | 2015 | 2014 |
From net investment income | | |
Class A | $ 864 | $ 2,857 |
Class T | 23 | 344 |
Class B | - | 2 |
Class C | - | 79 |
International Discovery | 49,040 | 93,065 |
Class K | 19,835 | 33,983 |
Class I | 4,544 | 5,936 |
Class Z | 283 | 60 |
Total | $ 74,589 | $ 136,326 |
From net realized gain | | |
Class A | $ - | $ 2,660 |
Class T | - | 423 |
Class B | - | 52 |
Class C | - | 295 |
International Discovery | - | 61,190 |
Class K | - | 20,093 |
Class I | - | 3,838 |
Class Z | - | 35 |
Total | $ - | $ 88,586 |
Annual Report
11. Share Transactions.
Share transactions for each class were as follows and may contain automatic conversions between classes or exchanges between funds:
| Shares | Dollars |
Years ended October 31, | 2015 | 2014 | 2015 | 2014 |
Class A | | | | |
Shares sold | 1,331 | 1,382 | $ 53,289 | $ 54,489 |
Reinvestment of distributions | 22 | 137 | 843 | 5,280 |
Shares redeemed | (1,915) | (2,632) | (76,178) | (104,067) |
Net increase (decrease) | (562) | (1,113) | $ (22,046) | $ (44,298) |
Class T | | | | |
Shares sold | 178 | 200 | $ 7,105 | $ 7,804 |
Reinvestment of distributions | 1 | 19 | 23 | 736 |
Shares redeemed | (355) | (311) | (13,954) | (12,118) |
Net increase (decrease) | (176) | (92) | $ (6,826) | $ (3,578) |
Class B | | | | |
Shares sold | 1 | 6 | $ 53 | $ 233 |
Reinvestment of distributions | - | 1 | - | 51 |
Shares redeemed | (64) | (58) | (2,536) | (2,266) |
Net increase (decrease) | (63) | (51) | $ (2,483) | $ (1,982) |
Class C | | | | |
Shares sold | 201 | 232 | $ 7,918 | $ 9,059 |
Reinvestment of distributions | - | 9 | - | 337 |
Shares redeemed | (314) | (250) | (12,486) | (9,726) |
Net increase (decrease) | (113) | (9) | $ (4,568) | $ (330) |
International Discovery | | | | |
Shares sold | 20,827 | 28,809 | $ 832,233 | $ 1,144,588 |
Reinvestment of distributions | 1,199 | 3,813 | 46,913 | 148,138 |
Shares redeemed | (33,573) | (37,231) | (1,345,593) | (1,476,965) |
Net increase (decrease) | (11,547) | (4,609) | $ (466,447) | $ (184,239) |
Class K | | | | |
Shares sold | 15,372 | 15,775 | $ 613,737 | $ 628,261 |
Reinvestment of distributions | 508 | 1,396 | 19,835 | 54,076 |
Shares redeemed | (21,494) A | (18,729) | (860,632) A | (741,205) |
Net increase (decrease) | (5,614) | (1,558) | $ (227,060) | $ (58,868) |
Class I | | | | |
Shares sold | 15,392 | 10,468 | $ 602,134 | $ 410,346 |
Reinvestment of distributions | 33 | 91 | 1,286 | 3,529 |
Shares redeemed | (5,606) | (5,852) | (221,504) | (225,868) |
Net increase (decrease) | 9,819 | 4,707 | $ 381,916 | $ 188,007 |
Class Z | | | | |
Shares sold | 402 | 993 | $ 16,312 | $ 39,070 |
Reinvestment of distributions | 7 | 2 | 283 | 95 |
Shares redeemed | (559) | (96) | (22,228) | (3,785) |
Net increase (decrease) | (150) | 899 | $ (5,633) | $ 35,380 |
A Amount includes in-kind redemptions (see Note 5: Redemptions In-Kind).
Annual Report
Notes to Financial Statements - continued
(Amounts in thousands except percentages)
12. Other.
The Fund's organizational documents provide former and current trustees and officers with a limited indemnification against liabilities arising in connection with the performance of their duties to the Fund. In the normal course of business, the Fund may also enter into contracts that provide general indemnifications. The Fund's maximum exposure under these arrangements is unknown as this would be dependent on future claims that may be made against the Fund. The risk of material loss from such claims is considered remote.
At the end of the period, Strategic Advisers International Fund was the owner of record of approximately 13% of the total outstanding shares of the Fund.
Annual Report
To the Trustees of Fidelity Investment Trust and the Shareholders of Fidelity International Discovery Fund:
In our opinion, the accompanying statement of assets and liabilities, including the schedule of investments, and the related statements of operations and of changes in net assets and the financial highlights present fairly, in all material respects, the financial position of Fidelity International Discovery Fund (a fund of Fidelity Investment Trust) at October 31, 2015, the results of its operations for the year then ended, the changes in its net assets for each of the two years in the period then ended and the financial highlights for each of the five years in the period then ended, in conformity with accounting principles generally accepted in the United States of America. These financial statements and financial highlights (hereafter referred to as "financial statements") are the responsibility of the Fidelity International Discovery Fund's management. Our responsibility is to express an opinion on these financial statements based on our audits. We conducted our audits of these financial statements in accordance with the standards of the Public Company Accounting Oversight Board (United States). Those standards require that we plan and perform the audit to obtain reasonable assurance about whether the financial statements are free of material misstatement. An audit includes examining, on a test basis, evidence supporting the amounts and disclosures in the financial statements, assessing the accounting principles used and significant estimates made by management, and evaluating the overall financial statement presentation. We believe that our audits, which included confirmation of securities at October 31, 2015 by correspondence with the custodian and brokers, provide a reasonable basis for our opinion.
PricewaterhouseCoopers LLP
Boston, Massachusetts
December 16, 2015
Annual Report
The Trustees, Member of the Advisory Board, and officers of the trust and fund, as applicable, are listed below. The Board of Trustees governs the fund and is responsible for protecting the interests of shareholders. The Trustees are experienced executives who meet periodically throughout the year to oversee the fund's activities, review contractual arrangements with companies that provide services to the fund, oversee management of the risks associated with such activities and contractual arrangements, and review the fund's performance. Each of the Trustees oversees 170 funds.
The Trustees hold office without limit in time except that (a) any Trustee may resign; (b) any Trustee may be removed by written instrument, signed by at least two-thirds of the number of Trustees prior to such removal; (c) any Trustee who requests to be retired or who has become incapacitated by illness or injury may be retired by written instrument signed by a majority of the other Trustees; and (d) any Trustee may be removed at any special meeting of shareholders by a two-thirds vote of the outstanding voting securities of the trust. Each Trustee who is not an interested person (as defined in the 1940 Act) of the trust and the fund (Independent Trustee), shall retire not later than the last day of the calendar year in which his or her 75th birthday occurs. The Independent Trustees may waive this mandatory retirement age policy with respect to individual Trustees. The officers and Advisory Board Member hold office without limit in time, except that any officer and Advisory Board Member may resign or may be removed by a vote of a majority of the Trustees at any regular meeting or any special meeting of the Trustees. Except as indicated, each individual has held the office shown or other offices in the same company for the past five years.
Experience, Skills, Attributes, and Qualifications of the Fund's Trustees. The Governance and Nominating Committee has adopted a statement of policy that describes the experience, qualifications, attributes, and skills that are necessary and desirable for potential Independent Trustee candidates (Statement of Policy). The Board believes that each Trustee satisfied at the time he or she was initially elected or appointed a Trustee, and continues to satisfy, the standards contemplated by the Statement of Policy. The Governance and Nominating Committee also engages professional search firms to help identify potential Independent Trustee candidates who have the experience, qualifications, attributes, and skills consistent with the Statement of Policy. From time to time, additional criteria based on the composition and skills of the current Independent Trustees, as well as experience or skills that may be appropriate in light of future changes to board composition, business conditions, and regulatory or other developments, have also been considered by the professional search firms and the Governance and Nominating Committee. In addition, the Board takes into account the Trustees' commitment and participation in Board and committee meetings, as well as their leadership of standing and ad hoc committees throughout their tenure.
In determining that a particular Trustee was and continues to be qualified to serve as a Trustee, the Board has considered a variety of criteria, none of which, in isolation, was controlling. The Board believes that, collectively, the Trustees have balanced and diverse experience, qualifications, attributes, and skills, which allow the Board to operate effectively in governing the fund and protecting the interests of shareholders. Information about the specific experience, skills, attributes, and qualifications of each Trustee, which in each case led to the Board's conclusion that the Trustee should serve (or continue to serve) as a trustee of the fund, is provided below.
Annual Report
Board Structure and Oversight Function. James C. Curvey is an interested person (as defined in the 1940 Act) and currently serves as Chairman. The Trustees have determined that an interested Chairman is appropriate and benefits shareholders because an interested Chairman has a personal and professional stake in the quality and continuity of services provided to the fund. Independent Trustees exercise their informed business judgment to appoint an individual of their choosing to serve as Chairman, regardless of whether the Trustee happens to be independent or a member of management. The Independent Trustees have determined that they can act independently and effectively without having an Independent Trustee serve as Chairman and that a key structural component for assuring that they are in a position to do so is for the Independent Trustees to constitute a substantial majority for the Board. The Independent Trustees also regularly meet in executive session. Ned C. Lautenbach serves as Chairman of the Independent Trustees and as such (i) acts as a liaison between the Independent Trustees and management with respect to matters important to the Independent Trustees and (ii) with management prepares agendas for Board meetings.
Fidelity funds are overseen by different Boards of Trustees. The fund's Board oversees Fidelity's high income and certain equity funds, and other Boards oversee Fidelity's investment-grade bond, money market, asset allocation, and sector funds. The asset allocation funds may invest in Fidelity funds overseen by the fund's Board. The use of separate Boards, each with its own committee structure, allows the Trustees of each group of Fidelity funds to focus on the unique issues of the funds they oversee, including common research, investment, and operational issues. On occasion, the separate Boards establish joint committees to address issues of overlapping consequences for the Fidelity funds overseen by each Board.
The Trustees operate using a system of committees to facilitate the timely and efficient consideration of all matters of importance to the Trustees, the fund, and fund shareholders and to facilitate compliance with legal and regulatory requirements and oversight of the fund's activities and associated risks. The Board, acting through its committees, has charged FMR and its affiliates with (i) identifying events or circumstances the occurrence of which could have demonstrably adverse effects on the fund's business and/or reputation; (ii) implementing processes and controls to lessen the possibility that such events or circumstances occur or to mitigate the effects of such events or circumstances if they do occur; and (iii) creating and maintaining a system designed to evaluate continuously business and market conditions in order to facilitate the identification and implementation processes described in (i) and (ii) above. Because the day-to-day operations and activities of the fund are carried out by or through FMR, its affiliates and other service providers, the fund's exposure to risks is mitigated but not eliminated by the processes overseen by the Trustees. While each of the Board's committees has responsibility for overseeing different aspects of the fund's activities, oversight is exercised primarily through the Operations, Audit, and Compliance Committees. In addition, the Independent Trustees have worked with FMR to enhance the Board's oversight of investment and financial risks, legal and regulatory risks, technology risks, and operational risks, including the development of additional risk reporting to the Board. For example, a working group comprised of Independent Trustees and FMR has worked and continues to work to review the Fidelity funds' valuation-related activities, reporting and risk management. Appropriate personnel, including but not limited to the fund's Chief Compliance Officer (CCO), FMR's internal auditor, the independent accountants, the fund's Treasurer and portfolio management personnel, make periodic reports to the Board's committees, as appropriate, including an annual review of Fidelity's risk management program for the Fidelity funds. The responsibilities of each standing committee, including their oversight responsibilities, are described further under "Standing Committees of the Fund's Trustees."
Annual Report
Trustees and Officers - continued
The fund's Statement of Additional Information (SAI) includes more information about the Trustees. To request a free copy, call Fidelity at 1-877-208-0098.
Interested Trustees*:
Correspondence intended for each Trustee who is an interested person may be sent to Fidelity Investments, 245 Summer Street, Boston, Massachusetts 02210.
Name, Year of Birth; Principal Occupations and Other Relevant Experience+ |
James C. Curvey (1935) |
Year of Election or Appointment: 2007 Trustee Chairman of the Board of Trustees |
| Mr. Curvey also serves as Trustee of other Fidelity funds. Mr. Curvey is a Director of Fidelity Research & Analysis Co. (investment adviser firm, 2009-present), and Vice Chairman (2007-present) and Director of FMR LLC (diversified financial services company). In addition, Mr. Curvey serves as an Overseer for the Boston Symphony Orchestra and a member of the board of Artis-Naples, Naples, Florida, and as a Trustee for Brewster Academy, Wolfeboro, New Hampshire. Previously, Mr. Curvey served as a Director of Fidelity Investments Money Management, Inc. (investment adviser firm, 2009-2014) and a Director of FMR and FMR Co., Inc. (investment adviser firms, 2007-2014). |
Charles S. Morrison (1960) |
Year of Election or Appointment: 2014 Trustee |
| Mr. Morrison also serves as Trustee of other funds. He serves as a Director of Fidelity Investments Money Management, Inc. (FIMM) (investment adviser firm, 2014-present), Director of Fidelity SelectCo, LLC (investment adviser firm, 2014-present), President, Asset Management (2014-present), and is an employee of Fidelity Investments. Previously, Mr. Morrison served as Vice President of Fidelity's Fixed Income and Asset Allocation Funds (2012-2014), President, Fixed Income (2011-2014), Vice President of Fidelity's Money Market Funds (2005-2009), President, Money Market Group Leader of FMR (investment adviser firm, 2009), and Senior Vice President, Money Market Group of FMR (2004-2009). Mr. Morrison also served as Vice President of Fidelity's Bond Funds (2002-2005), certain Balanced Funds (2002-2005), and certain Asset Allocation Funds (2002-2007), and as Senior Vice President (2002-2005) of Fidelity's Bond Division. |
* Trustees have been determined to be "Interested Trustees" by virtue of, among other things, their affiliation with the trust or various entities under common control with FMR.
+ The information above includes each Trustee's principal occupation during the last five years and other information relating to the experience, attributes, and skills relevant to each Trustee's qualifications to serve as a Trustee, which led to the conclusion that each Trustee should serve as a Trustee for the fund.
Annual Report
Trustees and Officers - continued
Independent Trustees:
Correspondence intended for each Independent Trustee (that is, the Trustees other than the Interested Trustees) may be sent to Fidelity Investments, P.O. Box 55235, Boston, Massachusetts 02205-5235.
Name, Year of Birth; Principal Occupations and Other Relevant Experience+ |
Dennis J. Dirks (1948) |
Year of Election or Appointment: 2005 Trustee |
| Mr. Dirks also serves as Trustee of other Fidelity funds. Prior to his retirement in May 2003, Mr. Dirks was Chief Operating Officer and a member of the Board of The Depository Trust & Clearing Corporation (DTCC). He also served as President, Chief Operating Officer, and Board member of The Depository Trust Company (DTC) and President and Board member of the National Securities Clearing Corporation (NSCC). In addition, Mr. Dirks served as Chief Executive Officer and Board member of the Government Securities Clearing Corporation, Chief Executive Officer and Board member of the Mortgage-Backed Securities Clearing Corporation, as a Trustee and a member of the Finance Committee of Manhattan College (2005-2008), as a Trustee and a member of the Finance Committee of AHRC of Nassau County (2006-2008), and as a member of the Independent Directors Council (IDC) Governing Council (2010-2015). Mr. Dirks is a member of the Board of Directors for The Brookville Center for Children's Services, Inc. (2009-present). |
Alan J. Lacy (1953) |
Year of Election or Appointment: 2008 Trustee |
| Mr. Lacy also serves as Trustee of other Fidelity funds. Mr. Lacy serves as a member of the Board of Directors of Dave & Buster's Entertainment, Inc. (restaurant and entertainment complexes, 2010-present) and Bristol-Myers Squibb Company (global pharmaceuticals, 2008-present). In addition, Mr. Lacy served as Senior Adviser (2007-2014) of Oak Hill Capital Partners, L.P. (private equity) and also served as Chief Executive Officer (2000-2005) and Vice Chairman (2005-2006) of Sears Holdings Corporation and Sears, Roebuck and Co. (retail). Mr. Lacy is a member of the Board of Trustees of The National Parks Conservation Association (2006-present). Previously, Mr. Lacy served as Chairman of the Board of Trustees of the National Parks Conservation Association (2008-2011) and as a member of the Board of Directors for The Western Union Company (global money transfer, 2006-2011), The Hillman Companies, Inc. (hardware wholesalers, 2010-2014), and Earth Fare, Inc. (retail grocery, 2010-2014). |
Ned C. Lautenbach (1944) |
Year of Election or Appointment: 2000 Trustee Chairman of the Independent Trustees |
| Mr. Lautenbach also serves as Trustee of other Fidelity funds. Mr. Lautenbach currently serves as the Lead Director of the Eaton Corporation Board of Directors (diversified industrial, 1997-present). Mr. Lautenbach is Chairman of the Board of Directors of Artis-Naples in Naples, Florida (2012-present), a member of the Council on Foreign Relations (1994-present), and a member of the Board of Governors, State University System of Florida (2013-present). Previously, Mr. Lautenbach was a Partner/Advisory Partner at Clayton, Dubilier & Rice, LLC (private equity investment, 1998-2010), as well as a Director of Sony Corporation (2006-2007). |
Joseph Mauriello (1944) |
Year of Election or Appointment: 2008 Trustee |
| Mr. Mauriello also serves as Trustee of other Fidelity funds. Prior to his retirement in January 2006, Mr. Mauriello served in numerous senior management positions including Deputy Chairman and Chief Operating Officer (2004-2005), and Vice Chairman of Financial Services (2002-2004) of KPMG LLP US (professional services, 1965-2005). Mr. Mauriello currently serves as a member of the Board of Directors of XL Group plc. (global insurance and re-insurance, 2006-present) and the Independent Directors Council (IDC) Governing Council (2015-present). Previously, Mr. Mauriello served as a Director of the Hamilton Funds of the Bank of New York (2006-2007) and of Arcadia Resources Inc. (health care services and products, 2007-2012). |
Robert W. Selander (1950) |
Year of Election or Appointment: 2011 Trustee |
| Mr. Selander also serves as Trustee of other Fidelity funds. Mr. Selander serves as a Director of The Western Union Company (global money transfer, 2014-present). Previously, Mr. Selander served as a Member of the Advisory Board of other Fidelity funds (2011), and Executive Vice Chairman (2010), Chief Executive Officer (2009-2010), and President and Chief Executive Officer (1997-2009) of Mastercard, Inc. |
Cornelia M. Small (1944) |
Year of Election or Appointment: 2005 Trustee |
| Ms. Small also serves as Trustee of other Fidelity funds. Ms. Small is a member of the Board of Directors (2009-present) and Chair of the Investment Committee (2010-present) of the Teagle Foundation. Ms. Small also serves on the Investment Committee of the Berkshire Taconic Community Foundation (2008-present). Previously, Ms. Small served as Chairperson (2002-2008) and a member of the Investment Committee and Chairperson (2008-2012) and a member of the Board of Trustees of Smith College. In addition, Ms. Small served as Chief Investment Officer, Director of Global Equity Investments, and a member of the Board of Directors of Scudder, Stevens & Clark and Scudder Kemper Investments. |
William S. Stavropoulos (1939) |
Year of Election or Appointment: 2001 Trustee Vice Chairman of the Independent Trustees |
| Mr. Stavropoulos also serves as Trustee of other Fidelity funds. Mr. Stavropoulos serves as President and Founder of the Michigan Baseball Foundation, the Great Lakes Loons (2007-present). Mr. Stavropoulos is Chairman Emeritus of the Board of Directors of The Dow Chemical Company, where he previously served in numerous senior management positions, including President, CEO (1995-2000; 2002-2004), Chairman of the Executive Committee (2000-2006), and as a member of the Board of Directors (1990-2006). Currently, Mr. Stavropoulos is Chairman of the Board of Directors of Univar Inc. (global distributor of commodity and specialty chemicals), a Director of Teradata Corporation (data warehousing and technology solutions), and Maersk Inc. (industrial conglomerate), and a member of the Advisory Board for Metalmark Capital LLC (private equity investment, 2005-present). Mr. Stavropoulos is an operating advisor to Clayton, Dubilier & Rice, LLC (private equity investment). In addition, Mr. Stavropoulos is a member of the University of Notre Dame Advisory Council for the College of Science, a Trustee of the Rollin L. Gerstacker Foundation, and a Director of the Naples Philharmonic Center for the Arts. Previously, Mr. Stavropoulos served as a Director of Chemical Financial Corporation (bank holding company, 1993-2012) and Tyco International, Ltd. (multinational manufacturing and services, 2007-2012). |
David M. Thomas (1949) |
Year of Election or Appointment: 2008 Trustee |
| Mr. Thomas also serves as Trustee of other Fidelity funds. Mr. Thomas serves as Non-Executive Chairman of the Board of Directors of Fortune Brands Home and Security (home and security products, 2011-present), as a member of the Board of Directors (2004-present) and Presiding Director (2013-present) of Interpublic Group of Companies, Inc. (marketing communication), and as a member of the Board of Trustees of the University of Florida (2013-present). Previously, Mr. Thomas served as Executive Chairman (2005-2006) and Chairman and Chief Executive Officer (2000-2005) of IMS Health, Inc. (pharmaceutical and healthcare information solutions), and a Director of Fortune Brands, Inc. (consumer products, 2000-2011). |
+ The information above includes each Trustee's principal occupation during the last five years and other information relating to the experience, attributes, and skills relevant to each Trustee's qualifications to serve as a Trustee, which led to the conclusion that each Trustee should serve as a Trustee for the fund.
Advisory Board Member and Officers:
Correspondence intended for each officer and Peter S. Lynch may be sent to Fidelity Investments, 245 Summer Street, Boston, Massachusetts 02210. Officers appear below in alphabetical order.
Name, Year of Birth; Principal Occupation |
Peter S. Lynch (1944) |
Year of Election or Appointment: 2003 Member of the Advisory Board |
| Mr. Lynch also serves as Member of the Advisory Board of other Fidelity funds. Mr. Lynch is Vice Chairman and a Director of FMR (investment adviser firm) and FMR Co., Inc. (investment adviser firm). In addition, Mr. Lynch serves as a Trustee of Boston College and as the Chairman of the Inner-City Scholarship Fund. Previously, Mr. Lynch served on the Special Olympics International Board of Directors (1997-2006). |
Elizabeth Paige Baumann (1968) |
Year of Election or Appointment: 2012 Anti-Money Laundering (AML) Officer |
| Ms. Baumann also serves as AML Officer of other funds. She is Chief AML Officer of FMR LLC (diversified financial services company, 2012-present) and is an employee of Fidelity Investments. Previously, Ms. Baumann served as Vice President and Deputy Anti-Money Laundering Officer (2007-2012). |
Marc R. Bryant (1966) |
Year of Election or Appointment: 2015 Secretary and Chief Legal Officer (CLO) |
| Mr. Bryant also serves as Secretary and CLO of other funds. Mr. Bryant serves as CLO, Secretary, and Senior Vice President of Fidelity Management & Research Company (investment adviser firm, 2015-present) and FMR Co., Inc. (investment adviser firm, 2015-present); Secretary of Fidelity SelectCo, LLC (investment adviser firm, 2015-present) and Fidelity Investments Money Management, Inc. (investment adviser firm, 2015-present); and CLO of Fidelity Management & Research (Hong Kong) Limited (investment adviser firm, 2015-present). He is Senior Vice President and Deputy General Counsel of FMR LLC (diversified financial services company). Previously, Mr. Bryant served as Secretary and Chief Legal Officer of Fidelity Rutland Square Trust II (2010-2014) and Assistant Secretary of Fidelity's Fixed Income and Asset Allocation Funds (2013-2015). Prior to joining Fidelity Investments, Mr. Bryant served as a Senior Vice President and the Head of Global Retail Legal for AllianceBernstein L.P. (2006-2010), and as the General Counsel for ProFund Advisors LLC (2001-2006). |
William C. Coffey (1969) |
Year of Election or Appointment: 2009 Assistant Secretary |
| Mr. Coffey also serves as Assistant Secretary of other funds. He is Senior Vice President and Deputy General Counsel of FMR LLC (diversified financial services company, 2010-present), and is an employee of Fidelity Investments. Previously, Mr. Coffey served as Vice President and Associate General Counsel of FMR LLC (2005-2009). |
Timothy M. Cohen (1969) |
Year of Election or Appointment: 2014 Vice President of certain Equity Funds |
| Mr. Cohen also serves as Vice President of other funds. Mr. Cohen serves as Chief Compliance Officer of FMR Investment Management (U.K.) Limited (investment adviser firm, 2013-present) and is an employee of Fidelity Investments. Previously, Mr. Cohen served as a Director of FMR Investment Management (U.K.) Limited (2013-2015). |
Jonathan Davis (1968) |
Year of Election or Appointment: 2010 Assistant Treasurer |
| Mr. Davis also serves as Assistant Treasurer of other funds, and is an employee of Fidelity Investments. Previously, Mr. Davis served as Vice President and Associate General Counsel of FMR LLC (diversified financial services company, 2003-2010). |
Adrien E. Deberghes (1967) |
Year of Election or Appointment: 2008 Deputy Treasurer |
| Mr. Deberghes also serves as an officer of other funds. He is an employee of Fidelity Investments (2008-present). Prior to joining Fidelity Investments, Mr. Deberghes was Senior Vice President of Mutual Fund Administration at State Street Corporation (2007-2008), Senior Director of Mutual Fund Administration at Investors Bank & Trust (2005-2007), and Director of Finance for Dunkin' Brands (2000-2005). |
Stephanie J. Dorsey (1969) |
Year of Election or Appointment: 2010 Assistant Treasurer |
| Ms. Dorsey also serves as an officer of other funds. She is an employee of Fidelity Investments (2008-present) and has served in other fund officer roles. Prior to joining Fidelity Investments, Ms. Dorsey served as Treasurer (2004-2008) of the JPMorgan Mutual Funds and Vice President (2004-2008) of JPMorgan Chase Bank. |
Howard J. Galligan III (1966) |
Year of Election or Appointment: 2014 Chief Financial Officer |
| Mr. Galligan also serves as Chief Financial Officer of other funds. Mr. Galligan serves as President of Fidelity Pricing and Cash Management Services (FPCMS) (2014-present) and as a Director of Strategic Advisers, Inc. (investment adviser firm, 2008-present). Previously, Mr. Galligan served as Chief Administrative Officer of Asset Management (2011-2014) and Chief Operating Officer and Senior Vice President of Investment Support for Strategic Advisers, Inc. (2003-2011). |
Scott C. Goebel (1968) |
Year of Election or Appointment: 2015 Vice President |
| Mr. Goebel serves as Vice President of other funds and is an employee of Fidelity Investments (2001-present). Previously, Mr. Goebel served as Secretary of Fidelity SelectCo, LLC (investment adviser firm, 2013-2015), Fidelity Investments Money Management, Inc. (FIMM) (investment adviser firm, 2010-2015), and Fidelity Research and Analysis Company (FRAC) (investment adviser firm, 2010-2015); General Counsel, Secretary, and Senior Vice President of Fidelity Management & Research Company (investment adviser firm, 2008-2015) and FMR Co., Inc. (investment adviser firm, 2008-2015); Assistant Secretary of Fidelity Management & Research (Japan) Limited (investment adviser firm, 2008-2015) and FMR Investment Management (U.K.) Limited (investment adviser firm, 2008-2015); Chief Legal Officer (CLO) of Fidelity Management & Research (Hong Kong) Limited (investment adviser firm, 2008-2015); Secretary and CLO of certain Fidelity funds (2008-2015); Assistant Secretary of FIMM (2008-2010), FRAC (2008-2010), and certain funds (2007-2008); and as Vice President and Secretary of Fidelity Distributors Corporation (FDC) (2005-2007). |
Brian B. Hogan (1964) |
Year of Election or Appointment: 2009 Vice President |
| Mr. Hogan also serves as Trustee or Vice President of other funds. Mr. Hogan serves as a Director of Fidelity SelectCo, LLC (investment adviser firm, 2014-present) and President of the Equity Division of FMR (investment adviser firm, 2009-present). Previously, Mr. Hogan served as Senior Vice President, Equity Research of FMR (2006-2009) and as a portfolio manager. |
Chris Maher (1972) |
Year of Election or Appointment: 2013 Assistant Treasurer |
| Mr. Maher serves as Assistant Treasurer of other funds. Mr. Maher is Vice President of Valuation Oversight and is an employee of Fidelity Investments. Previously, Mr. Maher served as Vice President of Asset Management Compliance (2013), Vice President of the Program Management Group of FMR (investment adviser firm, 2010-2013), and Vice President of Valuation Oversight (2008-2010). |
Kenneth B. Robins (1969) |
Year of Election or Appointment: 2008 President and Treasurer |
| Mr. Robins also serves as an officer of other funds. Mr. Robins serves as Executive Vice President of Fidelity Investments Money Management, Inc. (FIMM) (investment adviser firm, 2013-present) and is an employee of Fidelity Investments (2004-present). Previously, Mr. Robins served in other fund officer roles. |
Stacie M. Smith (1974) |
Year of Election or Appointment: 2013 Deputy Treasurer |
| Ms. Smith also serves as an officer of other funds. She is an employee of Fidelity Investments (2009-present) and has served in other fund officer roles. Prior to joining Fidelity Investments, Ms. Smith served as Senior Audit Manager of Ernst & Young LLP (1996-2009). |
Renee Stagnone (1975) |
Year of Election or Appointment: 2013 Deputy Treasurer |
| Ms. Stagnone also serves as Deputy Treasurer of other funds. Ms. Stagnone is an employee of Fidelity Investments (1997-present). |
Linda J. Wondrack (1964) |
Year of Election or Appointment: 2014 Chief Compliance Officer |
| Ms. Wondrack also serves as Chief Compliance Officer of other funds. Ms. Wondrack is Executive Vice President and head of the Ethics Office and Asset Management Compliance for Fidelity Investments (2012-present). Ms. Wondrack also serves as Chief Compliance Officer of Fidelity SelectCo, LLC (investment adviser firm, 2014-present); Chief Compliance Officer of Impresa Management LLC (2013-present); and Chief Compliance Officer of FMR Co., Inc. (investment adviser firm), Fidelity Investments Money Management, Inc. (investment adviser firm), Fidelity Management & Research (Japan) Limited (investment adviser firm), FMR Investment Management (U.K.) Limited (investment adviser firm), Fidelity Management & Research (Hong Kong) (investment adviser firm), Fidelity Management & Research Company (investment adviser firm), FIAM LLC (investment adviser firm), and Strategic Advisers, Inc. (investment adviser firm), Ballyrock Investment Advisors LLC, and Northern Neck Investors LLC (2012-present). Previously, Ms. Wondrack served as Senior Vice President and Chief Compliance Officer for Columbia Management Investment Advisers, LLC (2005-2012); Chief Compliance Officer for certain funds within the Columbia Family of Funds (2007-2012); and Senior Vice President of Compliance Risk Management at Bank of America (2005-2010). |
Joseph F. Zambello (1957) |
Year of Election or Appointment: 2011 Deputy Treasurer |
| Mr. Zambello also serves as Deputy Treasurer of other funds. Mr. Zambello is an employee of Fidelity Investments (1991-present). Previously, Mr. Zambello served as Vice President of the Program Management Group of FMR (investment adviser firm, 2009-2011) and Vice President of the Transfer Agent Oversight Group (2005-2009). |
Annual Report
The Board of Trustees of Advisor International Discovery Fund voted to pay to shareholders of record at the opening of business on record date, the following distributions per share derived from capital gains realized from sales of portfolio securities, and dividends derived from net investment income:
| Pay Date | Record Date | Dividends | Capital Gains |
Class Z | 12/07/15 | 12/04/15 | $0.461 | $0.005 |
Class Z designates 5% of the dividend distributed during the fiscal year as qualifying for the dividends-received deduction for corporate shareholders.
Class Z designates 100% of the dividend during the fiscal year as amounts which may be taken into account as a dividend for the purposes of the maximum rate under section 1(h)(11) of the Internal Revenue Code.
The amounts per share which represent income derived from sources within, and taxes paid to, foreign countries or possessions of the United States are as follows:
| Pay Date | Income | Taxes |
Class Z | 12/08/14 | $0.3656 | $0.0486 |
The fund will notify shareholders in January 2016 of amounts for use in preparing 2015 income tax returns.
Annual Report
Fidelity International Discovery Fund
Each year, the Board of Trustees, including the Independent Trustees (together, the Board), votes on the renewal of the management contract with Fidelity Management & Research Company (FMR) and the sub-advisory agreements (together, the Advisory Contracts) for the fund. The Board, assisted by the advice of fund counsel and Independent Trustees' counsel, requests and considers a broad range of information relevant to the renewal of the Advisory Contracts throughout the year.
The Board meets regularly and, at each of its meetings, covers an extensive agenda of topics and materials and considers factors that are relevant to its annual consideration of the renewal of the fund's Advisory Contracts, including the services and support provided to the fund and its shareholders. The Board has established various standing committees (Committees), each composed of and chaired by Independent Trustees with varying backgrounds, to which the Board has assigned specific subject matter responsibilities in order to enhance effective decision-making by the Board. The Board, acting directly and through its Committees, requests and receives information concerning the annual consideration of the renewal of the fund's Advisory Contracts. The Board also meets as needed to consider matters specifically related to the Board's annual consideration of the renewal of the Advisory Contracts. Members of the Board may also meet with trustees of other Fidelity funds through ad hoc joint committees to discuss certain matters relevant to all of the Fidelity funds.
At its July 2015 meeting, the Board unanimously determined to renew the fund's Advisory Contracts. In reaching its determination, the Board considered all factors it believed relevant, including (i) the nature, extent, and quality of the services to be provided to the fund and its shareholders (including the investment performance of the fund); (ii) the competitiveness of the fund's management fee and total expense ratio relative to peer funds; (iii) the total costs of the services to be provided by and the profits to be realized by Fidelity from its relationship with the fund; and (iv) the extent to which (if any) economies of scale exist and would be realized as the fund grows, and whether any economies of scale are appropriately shared with fund shareholders.
In considering whether to renew the Advisory Contracts for the fund, the Board reached a determination, with the assistance of fund counsel and Independent Trustees' counsel and through the exercise of its business judgment, that the renewal of the Advisory Contracts was in the best interests of the fund and its shareholders and that the compensation payable under the Advisory Contracts was fair and reasonable. The Board's decision to renew the Advisory Contracts was not based on any single factor, but rather was based on a comprehensive consideration of all the information provided to the Board at its meetings throughout the year. The Board, in reaching its determination to renew the Advisory Contracts, was aware that shareholders of the fund have a broad range of investment choices available to them, including a wide choice among funds offered by Fidelity's competitors, and that the fund's shareholders, who have the opportunity to review and weigh the disclosure provided by the fund in its prospectus and other public disclosures, have chosen to invest in this fund, which is part of the Fidelity family of funds.
Annual Report
Nature, Extent, and Quality of Services Provided. The Board considered Fidelity's staffing as it relates to the fund, including the backgrounds of investment personnel of Fidelity, and also considered the fund's investment objective, strategies, and related investment philosophy. The Independent Trustees also had discussions with senior management of Fidelity's investment operations and investment groups. The Board considered the structure of the portfolio manager compensation program and whether this structure provides appropriate incentives to act in the best interests of the fund. Additionally, the Board considered the portfolio managers' investments, if any, in the funds that they manage.
Resources Dedicated to Investment Management and Support Services. The Board and the Fund Oversight and Research Committees reviewed the general qualifications and capabilities of Fidelity's investment staff, including its size, education, experience, and resources, as well as Fidelity's approach to recruiting, training, managing, and compensating investment personnel. The Board noted that Fidelity has continued to increase the resources devoted to non-U.S. offices, including expansion of Fidelity's global investment organization. The Board also noted that Fidelity's analysts have extensive resources, tools and capabilities that allow them to conduct sophisticated quantitative and fundamental analysis, as well as credit analysis of issuers, counterparties and guarantors. Further, the Board considered that Fidelity's investment professionals have sufficient access to global information and data so as to provide competitive investment results over time, and that those professionals also have access to sophisticated tools that permit them to assess portfolio construction and risk and performance attribution characteristics continuously, as well as to transmit new information and research conclusions rapidly around the world. Additionally, in its deliberations, the Board considered Fidelity's trading, risk management, and compliance capabilities and resources, which are integral parts of the investment management process.
Shareholder and Administrative Services. The Board considered (i) the nature, extent, quality, and cost of advisory, administrative, and shareholder services performed by FMR, the sub-advisers (together with FMR, the Investment Advisers), and their affiliates under the Advisory Contracts and under separate agreements covering transfer agency, pricing and bookkeeping, and securities lending services for the fund; (ii) the nature and extent of the supervision of third party service providers, principally custodians and subcustodians; and (iii) the resources devoted to, and the record of compliance with, the fund's compliance policies and procedures. The Board also reviewed the allocation of fund brokerage, including allocations to brokers affiliated with the Investment Advisers, the use of brokerage commissions to pay fund expenses, and the use of "soft" commission dollars to pay for research services.
Annual Report
Board Approval of Investment Advisory Contracts and
Management Fees - continued
The Board noted that the growth of fund assets over time across the complex allows Fidelity to reinvest in the development of services designed to enhance the value or convenience of the Fidelity funds as investment vehicles. These services include 24-hour access to account information and market information through telephone representatives and over the Internet, investor education materials and asset allocation tools, and the expanded availability of Fidelity Investor Centers.
In 2014, the Board formed an ad hoc Committee on Transfer Agency Fees to review the variety of transfer agency fee structures throughout the industry and Fidelity's competitive positioning with respect to industry participants.
Investment in a Large Fund Family. The Board considered the benefits to shareholders of investing in a Fidelity fund, including the benefits of investing in a fund that is part of a large family of funds offering a variety of investment disciplines and providing a large variety of mutual fund investor services. The Board noted that Fidelity had taken, or had made recommendations that resulted in the Fidelity funds taking, a number of actions over the previous year that benefited particular funds, including (i) continuing to dedicate additional resources to investment research and to the support of the senior management team that oversees asset management; (ii) continuing efforts to enhance Fidelity's global research capabilities; (iii) launching new funds and making other enhancements to meet client needs; (iv) reducing management fees and total expenses for certain index funds and diversified international funds; (v) continuing to launch dedicated lower cost underlying funds to meet portfolio construction needs related to expanding underlying fund options for Fidelity funds of funds, specifically for the Freedom Fund product lines; (vi) rationalizing product lines and gaining increased efficiencies through fund mergers; (vii) launching active fixed-income exchange-traded funds; (viii) continuing to develop, acquire and implement systems and technology to improve services to the funds and information security and to increase efficiency; (ix) implementing investment enhancements to further strengthen Fidelity's target date product line to increase investors' probability of success in achieving their goals; (x) modifying the eligibility criteria for certain share classes to accommodate roll-over assets from employer-sponsored retirement plans; (xi) launching a new Class W of the Freedom Index Funds to attract and retain Fidelity record-kept retirement plan assets; and (xii) implementing changes to Fidelity's money market product line in response to recent money market regulatory reforms.
Investment Performance. The Board considered whether the fund has operated in accordance with its investment objective, as well as its record of compliance with its investment restrictions and its performance history.
Annual Report
The Board took into account discussions with representatives of the Investment Advisers about fund investment performance that occur at Board meetings throughout the year. In this regard the Board noted that as part of regularly scheduled fund reviews and other reports to the Board on fund performance, the Board considers annualized return information for the fund, for different time periods, measured against a securities market index ("benchmark index") and a peer group of funds with similar objectives ("peer group"), if any. In its evaluation of fund investment performance, the Board gave particular attention to information indicating changes in performance of certain Fidelity funds for specific time periods and discussed with the Investment Advisers the reasons for any overperformance or underperformance.
In addition to reviewing absolute and relative fund performance, the Independent Trustees periodically consider the appropriateness of fund performance metrics in evaluating the results achieved. In general, the Independent Trustees believe that fund performance should be evaluated based on net performance (after fees and expenses) of both the highest performing and lowest performing fund share classes, where applicable, compared to appropriate benchmark indices, over appropriate time periods that may include full market cycles, and compared to peer groups, as applicable, over the same periods, taking into account relevant factors including the following: general market conditions; issuer-specific information; and fund cash flows and other factors.
The Independent Trustees recognize that shareholders evaluate performance on a net basis over their own holding periods, for which one-, three-, and five-year periods are often used as a proxy. For this reason, the performance information reviewed by the Board also included net cumulative calendar year total return information for the fund and an appropriate benchmark index and peer group for the most recent one-, three-, and five-year periods, as shown below. Returns are shown compared to the 25th percentile (top of box, 75% beaten) and 75th percentile (bottom of box, 25% beaten) of the peer universe. Returns of the benchmark index are "net MA," i.e., adjusted for tax withholding rates applicable to U.S.-based funds organized as Massachusetts business trusts.
Annual Report
Board Approval of Investment Advisory Contracts and
Management Fees - continued
Fidelity International Discovery Fund

The Board also considered that the fund's management fee is subject to upward or downward adjustment depending upon whether, and to what extent, the fund's investment performance for the performance period exceeds, or is exceeded by, a securities index, thus leading to a performance adjustment for the same period. The Board noted that the performance adjustment provides FMR with a strong economic incentive to seek to achieve superior performance for the fund's shareholders and helps to more closely align the interests of FMR and the shareholders of the fund.
Based on its review, the Board concluded that the nature, extent, and quality of services provided to the fund under the Advisory Contracts should benefit the shareholders of the fund.
Competitiveness of Management Fee and Total Expense Ratio. The Board considered the fund's management fee and total expense ratio compared to "mapped groups" of competitive funds and classes created for the purpose of facilitating the Trustees' competitive analysis of management fees and total expenses. Fidelity creates "mapped groups" by combining similar Lipper investment objective categories that have comparable investment mandates. Combining Lipper investment objective categories aids the Board's management fee and total expense ratio comparisons by broadening the competitive group used for comparison.
Management Fee. The Board considered two proprietary management fee comparisons for the 12-month periods shown in basis points (BP) in the chart below. The group of Lipper funds used by the Board for management fee comparisons is referred to below as the "Total Mapped Group." The Total Mapped Group comparison focuses on a fund's standing in terms of gross management fees before expense reimbursements or caps, and without giving effect to the fund's performance adjustment, relative to the total universe of funds with comparable investment mandates, regardless of whether their management fee structures also are comparable. Funds with comparable investment mandates offer exposure to similar types of securities. Funds with comparable management fee structures have similar management fee contractual arrangements (e.g., flat rate charged for advisory services, all-inclusive fee rate, etc.). "TMG %" represents the percentage of funds in the Total Mapped Group that had management fees that were lower than the fund's. For example, a hypothetical TMG % of 20% would mean that 80% of the funds in the Total Mapped Group had higher, and 20% had lower, management fees than the fund. The fund's actual TMG %s and the number of funds in the Total Mapped Group are in the chart below. The "Asset-Size Peer Group" (ASPG) comparison focuses on a fund's standing relative to a subset of non-Fidelity funds within the Total Mapped Group that are similar in size and management fee structure without taking into account performance adjustments, if any. For example, if a fund is in the first quartile of the ASPG, the fund's management fee ranks in the least expensive or lowest 25% of funds in the ASPG. The ASPG represents at least 15% of the funds in the Total Mapped Group with comparable asset size and management fee structures, subject to a minimum of 50 funds (or all funds in the Total Mapped Group if fewer than 50). Additional information, such as the ASPG quartile in which the fund's management fee rate ranked and the impact of the fund's performance adjustment, is also included in the chart and considered by the Board.
Annual Report
Fidelity International Discovery Fund
Annual Report
Board Approval of Investment Advisory Contracts and
Management Fees - continued
The Board noted that the fund's management fee rate ranked below the median of its Total Mapped Group and below the median of its ASPG for 2014. The Board also noted the effect of the fund's performance adjustment, if any, on the fund's management fee ranking.
Furthermore, the Board considered that it had approved a reduction (effective August 1, 2014) in the individual fund fee rate component of the management fee rate for the fund from 0.450% to 0.424%. The Board considered that the chart reflects the fund's lower management fee for 2014, as if the lower fee were in effect for the entire year.
The Board noted that, in 2014, the ad hoc Committee on Group Fee was formed by it and other Fidelity fund boards to conduct an in-depth review of the "group fee" component of the management fee of funds with such management fee structures. Committee focus included the mechanics of the group fee, the competitive landscape of group fee structures, Fidelity funds with no group fee component and investment products not included in group fee assets. The Board also considered that, for funds subject to the group fee, FMR agreed to voluntarily waive fees over a specified period of time in amounts designed to account for assets converted from certain funds to certain collective investment trusts.
The Board also noted that, in 2013, the ad hoc Committee on Management Fees was formed to conduct an in-depth review of the management fee rates of Fidelity's active equity mutual funds. The Committee focused on the following areas: (i) standard fee structures; (ii) research consumption and trading evolution; (iii) management fee competitiveness/profitability by category; and (iv) factors that drive institutional pricing.
Based on its review, the Board concluded that the fund's management fee is fair and reasonable in light of the services that the fund receives and the other factors considered.
Total Expense Ratio. In its review of each class's total expense ratio, the Board considered the fund's management fee as well as other fund or class expenses, as applicable, such as transfer agent fees, pricing and bookkeeping fees, fund-paid 12b-1 fees, and custodial, legal, and audit fees. The Board noted the impact of the fund's performance adjustment. The Board also noted that Fidelity may agree to waive fees and expenses from time to time, and the extent to which, if any, it has done so for the fund. As part of its review, the Board also considered the current and historical total expense ratios of each class of the fund compared to competitive fund median expenses. Each class of the fund is compared to those funds and classes in the Total Mapped Group (used by the Board for management fee comparisons) that have a similar sales load structure.
The Board noted that the total expense ratio of each of Class A, Class B, Class C, Class I, Class Z, the retail class, and Class K ranked below its competitive median for 2014 and the total expense ratio of Class T ranked above its competitive median for 2014. The Board considered that, in general, various factors can affect total expense ratios. The Board noted that the total expense ratio of Class T was above the competitive median primarily because of higher 12b-1 fees on Class T as compared to most competitor funds. Class T has a higher 12b-1 fee, but a lower front-end sales charge, than traditionally priced front-end sales charge classes. The Board considered that Class T is primarily sold load-waived in the retirement plan market where its 0.50% 12b-1 fee is comparable to competing no-load, higher 12b-1 fee classes designed specifically for retirement plans. The Board noted that the fund offers multiple classes, each of which has a different sales load and 12b-1 fee structure, and that the multiple structures are intended to offer a range of pricing options for the intermediary market. The Board also noted that the total expense ratios of the classes vary primarily by the level of their 12b-1 fees, although differences in transfer agent fees may also cause expenses to vary from class to class.
Annual Report
Fees Charged to Other Fidelity Clients. The Board also considered Fidelity fee structures and other information with respect to clients of Fidelity, such as other funds advised or subadvised by Fidelity, pension plan clients, and other institutional clients with similar mandates. The Board noted the findings of the 2013 ad hoc joint committee (created with the board of other Fidelity funds), which reviewed and compared Fidelity's institutional investment advisory business with its business of providing services to the Fidelity funds, including the differences in services provided, fees charged, and costs incurred, as well as competition in their respective marketplaces.
Based on its review of total expense ratios and fees charged to other Fidelity clients, the Board concluded that, although Class T was above the median of the universe presented for comparison, the total expense ratio of each class of the fund was reasonable in light of the services that the fund and its shareholders receive and the other factors considered.
Costs of the Services and Profitability. The Board considered the revenues earned and the expenses incurred by Fidelity in conducting the business of developing, marketing, distributing, managing, administering and servicing the fund and servicing the fund's shareholders. The Board also considered the level of Fidelity's profits in respect of all the Fidelity funds.
On an annual basis, Fidelity presents to the Board information about the profitability of its relationship with the fund. Fidelity calculates profitability information for each fund, as well as aggregate profitability information for groups of Fidelity funds and all Fidelity funds, using a series of detailed revenue and cost allocation methodologies which originate with the books and records of Fidelity on which Fidelity's audited financial statements are based. The Audit Committee of the Board reviews any significant changes from the prior year's methodologies.
PricewaterhouseCoopers LLP (PwC), independent registered public accounting firm and auditor to Fidelity and certain Fidelity funds, has been engaged annually by the Board as part of the Board's assessment of Fidelity's profitability analysis. PwC's engagement includes the review and assessment of the methodologies used by Fidelity in determining the revenues and expenses attributable to Fidelity's mutual fund business, and completion of agreed-upon procedures in respect of the mathematical accuracy of fund profitability and its conformity to established allocation methodologies. After considering PwC's reports issued under the engagement and information provided by Fidelity, the Board concluded that while other allocation methods may also be reasonable, Fidelity's profitability methodologies are reasonable in all material respects.
Annual Report
Board Approval of Investment Advisory Contracts and
Management Fees - continued
The Board also reviewed Fidelity's non-fund businesses and fall-out benefits related to the mutual fund business as well as cases where Fidelity's affiliates may benefit from or be related to the fund's business.
The Board considered the costs of the services provided by and the profits realized by Fidelity in connection with the operation of the fund and was satisfied that the profitability was not excessive.
Economies of Scale. The Board considered whether there have been economies of scale in respect of the management of the Fidelity funds, whether the Fidelity funds (including the fund) have appropriately benefited from any such economies of scale, and whether there is potential for realization of any further economies of scale. The Board considered the extent to which the fund will benefit from economies of scale as assets grow through increased services to the fund, through waivers or reimbursements, or through fee or expense ratio reductions. The Board also noted that in 2013, it and the boards of other Fidelity funds created an ad hoc committee (the Economies of Scale Committee) to analyze whether Fidelity attains economies of scale in respect of the management and servicing of the Fidelity funds, whether the Fidelity funds have appropriately benefited from such economies of scale, and whether there is potential for realization of any further economies of scale.
The Board recognized that the fund's management contract incorporates a "group fee" structure, which provides for lower group fee rates as total group assets increase, and for higher group fee rates as total group assets decrease (with "group assets" defined to include fund assets under FMR's management plus sector fund assets previously under FMR's management and currently managed by Fidelity SelectCo, LLC). FMR calculates the group fee rates based on a tiered asset "breakpoint" schedule that varies based on asset class. The Board considered that the group fee is designed to deliver the benefits of economies of scale to fund shareholders when total Fidelity fund assets increase, even if assets of any particular fund are unchanged or have declined, because some portion of Fidelity's costs are attributable to services provided to all Fidelity funds, and all funds benefit if those costs can be allocated among more assets. The Board concluded that, given the group fee structure, fund shareholders will benefit from lower management fees as group assets increase at the fund complex level, regardless of whether Fidelity achieves any such economies of scale.
Annual Report
The Board concluded, taking into account the analysis of the Economies of Scale Committee, that economies of scale, if any, are being appropriately shared between fund shareholders and Fidelity.
Additional Information Requested by the Board. In order to develop fully the factual basis for consideration of the Fidelity funds' Advisory Contracts, the Board requested and received additional information on certain topics, including: (i) fund performance trends and Fidelity's long-term strategies for certain funds; (ii) the various share classes employed by Fidelity and the attributes of each class, together with similar information on the distribution and servicing payments made by Fidelity or the funds to third-party participants in the distribution channels; (iii) fund profitability, and fund performance in relation to fund profitability; (iv) the methodology with respect to evaluating competitive fund data and peer group classifications and fee comparisons; (v) annual fund profitability margins, with particular focus on certain funds with negative margins; (vi) the realization of fall-out benefits in certain Fidelity business units; (vii) economies of scale and the way in which they are shared with fund shareholders; (viii) Fidelity's group fee structures, including the group fee schedule of breakpoints; (ix) the impact of cost containment measures on the funds; and (x) the transfer agent fee structure.
Based on its evaluation of all of the conclusions noted above, and after considering all factors it believed relevant, the Board concluded that the advisory fee structures are fair and reasonable, and that the fund's Advisory Contracts should be renewed.
Annual Report
Investment Adviser
Fidelity Management & Research Company
Boston, MA
Investment Sub-Advisers
FMR Co., Inc.
FMR Investment Management
(U.K.) Limited
FIL Investment Advisors
FIL Investments (Japan) Limited
FIL Investment Advisors (UK) Limited
Fidelity Management & Research
(Hong Kong) Limited
Fidelity Management & Research
(Japan) Limited
General Distributor
Fidelity Distributors Corporation
Smithfield, RI
Transfer and Service Agents
Fidelity Investments Institutional Operations Company, Inc.
Boston, MA
Fidelity Service Company, Inc.
Boston, MA
Custodian
The Northern Trust Company
Chicago, IL
(Fidelity Investment logo)(registered trademark)
AIDZ-UANN-1215
1.9585031.102
ContentsPerformance: The Bottom LineManagement's Discussion of Fund PerformanceShareholder Expense ExampleInvestment Changes (Unaudited)Investments October 31, 2015Financial StatementsNotes to Financial StatementsReport of Independent Registered Public Accounting FirmTrustees and OfficersDistributions (Unaudited)Board Approval of Investment Advisory Contracts and Management Fees
(Fidelity Investment logo)(registered trademark)
Fidelity Advisor®
International Small Cap Opportunities
Fund - Class I
(formerly Institutional Class)
Annual Report
October 31, 2015
(Fidelity Cover Art)
Class I
is a class of Fidelity®
International Small Cap
Opportunities Fund
Contents
Performance | (Click Here) | How the fund has done over time. |
Management's Discussion of Fund Performance | (Click Here) | The Portfolio Manager's review of fund performance and strategy. |
Shareholder Expense Example | (Click Here) | An example of shareholder expenses. |
Investment Changes | (Click Here) | A summary of major shifts in the fund's investments over the past six months. |
Investments | (Click Here) | A complete list of the fund's investments with their market values. |
Financial Statements | (Click Here) | Statements of assets and liabilities, operations, and changes in net assets, as well as financial highlights. |
Notes | (Click Here) | Notes to the financial statements. |
Report of Independent Registered Public Accounting Firm | (Click Here) | |
Trustees and Officers | (Click Here) | |
Distributions | (Click Here) | |
Board Approval of Investment Advisory Contracts and Management Fees | (Click Here) | |
To view a fund's proxy voting guidelines and proxy voting record for the 12-month period ended June 30, visit http://www.fidelity.com/proxyvotingresults or visit the Securities and Exchange Commission's (SEC) web site at http://www.sec.gov. You may also call 1-877-208-0098 to request a free copy of the proxy voting guidelines.
Standard & Poor's, S&P and S&P 500 are registered service marks of The McGraw-Hill Companies, Inc. and have been licensed for use by Fidelity Distributors Corporation.
Other third-party marks appearing herein are the property of their respective owners.
All other marks appearing herein are registered or unregistered trademarks or service marks of FMR LLC or an affiliated company. © 2015 FMR LLC. All rights reserved.
Annual Report
This report and the financial statements contained herein are submitted for the general information of the shareholders of the fund. This report is not authorized for distribution to prospective investors in the fund unless preceded or accompanied by an effective prospectus.
A fund files its complete schedule of portfolio holdings with the SEC for the first and third quarters of each fiscal year on Form N-Q. Forms N-Q are available on the SEC's web site at http://www.sec.gov. A fund's Forms N-Q may be reviewed and copied at the SEC's Public Reference Room in Washington, DC. Information regarding the operation of the SEC's Public Reference Room may be obtained by calling 1-800-SEC-0330. For a complete list of a fund's portfolio holdings, view the most recent holdings listing, semiannual report, or annual report on Fidelity's web site at http://www.fidelity.com, http://www.advisor.fidelity.com, or http://www.401k.com, as applicable.
NOT FDIC INSURED • MAY LOSE VALUE • NO BANK GUARANTEE
Neither the fund nor Fidelity Distributors Corporation is a bank.
Annual Report
Average annual total return reflects the change in the value of an investment, assuming reinvestment of the class' distributions from dividend income and capital gains (the profits earned upon the sale of securities that have grown in value, if any) and assuming a constant rate of performance each year. The $10,000 table and the fund's returns do not reflect the deduction of taxes that a shareholder would pay on fund distributions or the redemption of fund shares. During periods of reimbursement by Fidelity, a fund's total return will be greater than it would be had the reimbursement not occurred. How a fund did yesterday is no guarantee of how it will do tomorrow.
Average Annual Total Returns
Periods ended October 31, 2015 | Past 1
year | Past 5
years | Past 10
years |
Class I | 8.98% | 9.90% | 5.82% |
$10,000 Over 10 Years
Let's say hypothetically that $10,000 was invested in Fidelity Advisor® International Small Cap Opportunities Fund - Class I on October 31, 2005, when the fund started. The chart shows how the value of your investment would have changed, and also shows how the MSCI EAFE Small Cap Index performed over the same period.
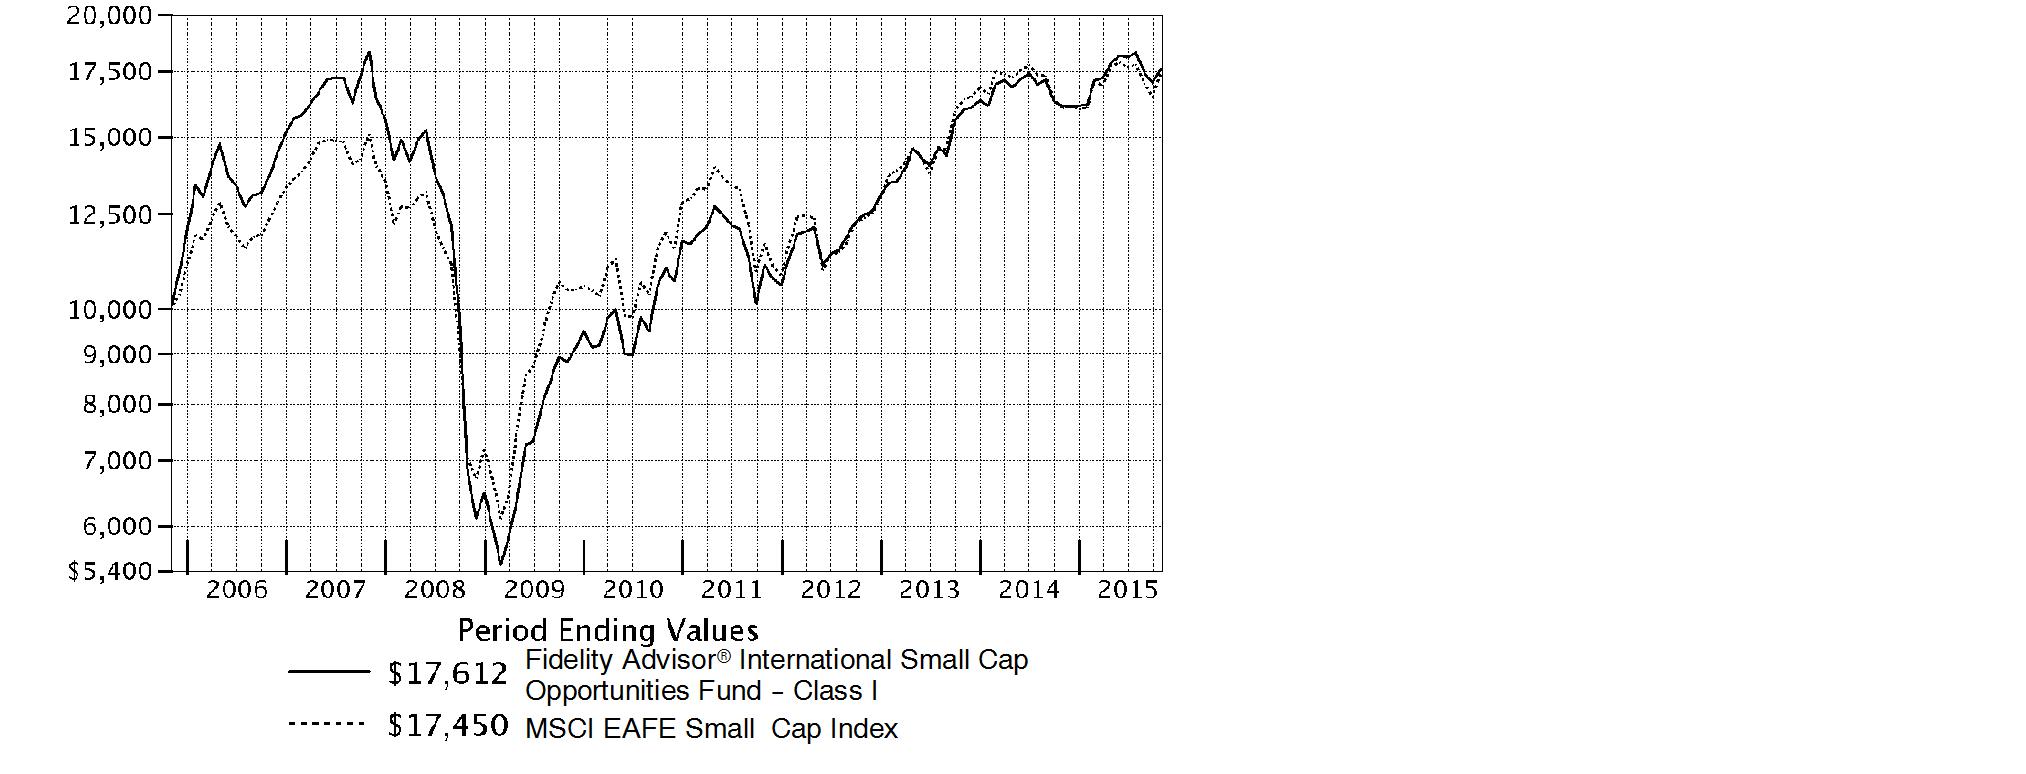
Annual Report
Market Recap: International equities suffered a moderate setback for the 12 months ending October 31, 2015, held back by a collapse in commodities prices that hurt resources-related sectors and geographies. The MSCI ACWI (All Country World Index) ex USA Index returned -4.55% for the period, affected also by concerns about global economic growth. Commodity producers remained under pressure for much of the past year, largely related to economic deceleration in China (-1%), the world's second-largest economy and a leading consumer of raw materials. This effect was exacerbated by U.S. dollar strength relative to global currencies, which weighed on commodities priced in dollars and acutely impacted equity returns within regions most exposed to resources prices. The emerging-markets group, for example, returned about -15% this period. Canada, a significant energy producer, returned roughly -17%. Net energy consumer Japan (+9%) was the best-performing region by far. Only about a quarter of the nearly 50 index countries managed a gain this period: Ireland (+19%) - the EU's fastest-growing economy - and Israel (+17%) proved top performers; Greece (-56%) and Brazil (-46%), among the worst. As for sectors, energy (-25%) and materials (-16%) declined sharply, whereas the two consumer sectors each gained about 6%.
Comments from Portfolio Manager Jed Weiss: For the year, the fund's share classes (excluding sales charges, if applicable) produced solid gains that were roughly in line with the 8.55% gain of the benchmark MSCI EAFE Small Cap Index. Relative to the benchmark, stock picking in the consumer discretionary, information technology and health care sectors was strong, whereas security selection in materials and, to a lesser extent, consumer staples hurt. In country terms, underweightings in Australia, Hong Kong and Singapore helped, as did stock picks in Germany and South Korea. Conversely, positioning in Canada detracted, along with security selection in Japan and several European markets. Another negative was the fund's fair-value pricing adjustment. Our biggest individual contributor was BGF Retail, a South Korean convenience-store retailer that wasn't part of our benchmark. Also contributing was SS&C Technologies Holdings, a provider of back-office software for asset managers. In contrast, non-index energy companies Pason Systems and ShawCor were particularly big detractors this period. Another detractor was Turkey-based Coca-Cola Icecek Sanayi. I sold the fund's stake in this owner of the Coca-Cola bottling franchise in various emerging markets and reinvested the proceeds in other stocks I thought offered a better risk/reward balance.
The views expressed above reflect those of the portfolio manager(s) only through the end of the period as stated on the cover of this report and do not necessarily represent the views of Fidelity or any other person in the Fidelity organization. Any such views are subject to change at any time based upon market or other conditions and Fidelity disclaims any responsibility to update such views. These views may not be relied on as investment advice and, because investment decisions for a Fidelity fund are based on numerous factors, may not be relied on as an indication of trading intent on behalf of any Fidelity fund.
Annual Report
Shareholder Expense Example
As a shareholder of the Fund, you incur two types of costs: (1) transaction costs, including sales charges (loads) on purchase payments or redemption proceeds, redemption fees and (2) ongoing costs, including management fees, distribution and/or service (12b-1) fees and other Fund expenses. This Example is intended to help you understand your ongoing costs (in dollars) of investing in the Fund and to compare these costs with the ongoing costs of investing in other mutual funds.
The Example is based on an investment of $1,000 invested at the beginning of the period and held for the entire period (May 1, 2015 to October 31, 2015).
Actual Expenses
The first line of the accompanying table for each class of the Fund provides information about actual account values and actual expenses. You may use the information in this line, together with the amount you invested, to estimate the expenses that you paid over the period. Simply divide your account value by $1,000.00 (for example, an $8,600 account value divided by $1,000.00 = 8.6), then multiply the result by the number in the first line for a class of the Fund under the heading entitled "Expenses Paid During Period" to estimate the expenses you paid on your account during this period. A small balance maintenance fee of $12.00 that is charged once a year may apply for certain accounts with a value of less than $2,000. This fee is not included in the table below. If it was, the estimate of expenses you paid during the period would be higher, and your ending account value lower, by this amount. In addition, the Fund, as a shareholder in the underlying Fidelity Central Funds, will indirectly bear its pro-rata share of the fees and expenses incurred by the underlying Fidelity Central Funds. These fees and expenses are not included in the Fund's annualized expense ratio used to calculate the expense estimate in the table below.
Hypothetical Example for Comparison Purposes
The second line of the accompanying table for each class of the Fund provides information about hypothetical account values and hypothetical expenses based on a Class' actual expense ratio and an assumed rate of return of 5% per year before expenses, which is not the Class' actual return. The hypothetical account values and expenses may not be used to estimate the actual ending account balance or expenses you paid for the period. You may use this information to compare the ongoing costs of investing in the Fund and other funds. To do so, compare this 5% hypothetical example with the 5% hypothetical examples that appear in the shareholder reports of the other funds. A small balance maintenance fee of $12.00 that is charged once a year may apply for certain accounts with a value of less than $2,000. This fee is not included in the table below. If it was, the estimate of expenses you paid during the period would be higher, and your ending account value lower, by this amount. In addition, the Fund, as a shareholder in the underlying Fidelity Central Funds, will indirectly bear its pro-rata share of the fees and expenses incurred by the underlying Fidelity Central Funds. These fees and expenses are not included in the Fund's annualized expense ratio used to calculate the expense estimate in the table below.
Please note that the expenses shown in the table are meant to highlight your ongoing costs only and do not reflect any transaction costs. Therefore, the second line of the table is useful in comparing ongoing costs only, and will not help you determine the relative total costs of owning different funds. In addition, if these transactional costs were included, your costs would have been higher.
Annual Report
| Annualized
Expense Ratio B | Beginning
Account Value
May 1, 2015 | Ending
Account Value
October 31, 2015 | Expenses Paid
During PeriodC
May 1, 2015
to October 31, 2015 |
Class A | 1.49% | | | |
Actual | | $ 1,000.00 | $ 985.30 | $ 7.46 |
HypotheticalA | | $ 1,000.00 | $ 1,017.69 | $ 7.58 |
Class T | 1.78% | | | |
Actual | | $ 1,000.00 | $ 983.80 | $ 8.90 |
HypotheticalA | | $ 1,000.00 | $ 1,016.23 | $ 9.05 |
Class B | 2.26% | | | |
Actual | | $ 1,000.00 | $ 982.20 | $ 11.29 |
HypotheticalA | | $ 1,000.00 | $ 1,013.81 | $ 11.47 |
Class C | 2.25% | | | |
Actual | | $ 1,000.00 | $ 982.10 | $ 11.24 |
HypotheticalA | | $ 1,000.00 | $ 1,013.86 | $ 11.42 |
International Small Cap Opportunities | 1.20% | | | |
Actual | | $ 1,000.00 | $ 987.40 | $ 6.01 |
HypotheticalA | | $ 1,000.00 | $ 1,019.16 | $ 6.11 |
Class I | 1.18% | | | |
Actual | | $ 1,000.00 | $ 987.40 | $ 5.91 |
HypotheticalA | | $ 1,000.00 | $ 1,019.26 | $ 6.01 |
A 5% return per year before expenses
B Annualized expense ratio reflects expenses net of applicable fee waivers.
C Expenses are equal to each Class' annualized expense ratio, multiplied by the average account value over the period, multiplied by 184/365 (to reflect the one-half year period).
Annual Report
Investment Changes (Unaudited)
Annual Report
Asset Allocation as of October 31, 2015 |
| % of fund's
net assets | % of fund's net assets
6 months ago |
Stocks | 91.8 | 96.7 |
Short-Term Investments and Net Other Assets (Liabilities) | 8.2 | 3.3 |
Top Ten Stocks as of October 31, 2015 |
| % of fund's
net assets | % of fund's net assets
6 months ago |
USS Co. Ltd. (Japan, Specialty Retail) | 2.0 | 2.2 |
CTS Eventim AG (Germany, Media) | 2.0 | 1.7 |
Unite Group PLC (United Kingdom, Real Estate Management & Development) | 1.9 | 1.8 |
OBIC Co. Ltd. (Japan, IT Services) | 1.8 | 1.1 |
Berendsen PLC (United Kingdom, Commercial Services & Supplies) | 1.7 | 1.4 |
Intrum Justitia AB (Sweden, Commercial Services & Supplies) | 1.7 | 1.3 |
Spirax-Sarco Engineering PLC (United Kingdom, Machinery) | 1.6 | 1.7 |
Sartorius AG (non-vtg.) (Germany, Health Care Equipment & Supplies) | 1.6 | 1.2 |
Bellway PLC (United Kingdom, Household Durables) | 1.5 | 1.2 |
SS&C Technologies Holdings, Inc. (United States of America, Software) | 1.5 | 1.6 |
| 17.3 | |
Market Sectors as of October 31, 2015 |
| % of fund's
net assets | % of fund's net assets
6 months ago |
Consumer Discretionary | 20.5 | 19.3 |
Financials | 18.7 | 19.7 |
Industrials | 18.3 | 20.6 |
Information Technology | 9.2 | 9.9 |
Health Care | 8.5 | 7.1 |
Consumer Staples | 8.5 | 9.3 |
Materials | 6.7 | 8.4 |
Energy | 1.4 | 2.4 |
Annual Report
Investments October 31, 2015
Showing Percentage of Net Assets
Common Stocks - 90.2% |
| Shares | | Value |
Australia - 2.0% |
DuluxGroup Ltd. | 1,324,143 | | $ 5,536,022 |
Imdex Ltd. (a) | 2,238,840 | | 357,061 |
RCG Corp. Ltd. | 5,554,148 | | 5,661,712 |
Sydney Airport unit | 684,757 | | 3,129,413 |
TFS Corp. Ltd. (d) | 3,227,274 | | 4,028,552 |
TOTAL AUSTRALIA | | 18,712,760 |
Austria - 1.2% |
Andritz AG | 139,900 | | 7,045,919 |
Zumtobel AG | 179,381 | | 4,083,206 |
TOTAL AUSTRIA | | 11,129,125 |
Bailiwick of Jersey - 0.4% |
Integrated Diagnostics Holdings PLC (a) | 746,300 | | 4,112,113 |
Belgium - 1.3% |
Gimv NV | 56,688 | | 2,663,658 |
KBC Ancora | 254,438 | | 10,106,114 |
TOTAL BELGIUM | | 12,769,772 |
Bermuda - 0.5% |
Petra Diamonds Ltd. | 1,163,909 | | 1,339,432 |
Vostok New Ventures Ltd. SDR (a) | 527,689 | | 3,366,171 |
TOTAL BERMUDA | | 4,705,603 |
British Virgin Islands - 0.1% |
Gem Diamonds Ltd. | 719,096 | | 1,097,473 |
Canada - 1.9% |
Cara Operations Ltd. | 210,400 | | 5,705,708 |
McCoy Global, Inc. | 629,100 | | 1,424,087 |
New Look Vision Group, Inc. | 172,200 | | 3,950,749 |
Pason Systems, Inc. | 334,600 | | 4,923,298 |
ShawCor Ltd. Class A | 114,500 | | 2,429,929 |
TOTAL CANADA | | 18,433,771 |
Cayman Islands - 0.5% |
58.com, Inc. ADR (a)(d) | 37,900 | | 1,989,371 |
Value Partners Group Ltd. | 2,462,000 | | 2,607,054 |
TOTAL CAYMAN ISLANDS | | 4,596,425 |
Common Stocks - continued |
| Shares | | Value |
Denmark - 1.6% |
Jyske Bank A/S (Reg.) (a) | 169,127 | | $ 8,256,423 |
Spar Nord Bank A/S | 746,369 | | 7,152,976 |
TOTAL DENMARK | | 15,409,399 |
Finland - 0.5% |
Tikkurila Oyj | 267,746 | | 4,913,985 |
France - 1.5% |
Laurent-Perrier Group SA | 39,793 | | 3,447,722 |
Vetoquinol SA | 69,184 | | 2,902,383 |
Virbac SA | 41,252 | | 8,226,537 |
TOTAL FRANCE | | 14,576,642 |
Germany - 4.1% |
alstria office REIT-AG (d) | 281,000 | | 3,922,776 |
CompuGroup Medical AG | 328,478 | | 9,680,450 |
CTS Eventim AG | 488,280 | | 19,117,645 |
Fielmann AG | 96,874 | | 6,791,128 |
TOTAL GERMANY | | 39,511,999 |
Greece - 0.4% |
Titan Cement Co. SA (Reg.) | 180,680 | | 3,963,761 |
India - 0.6% |
Jyothy Laboratories Ltd. | 1,124,354 | | 5,273,764 |
Ireland - 1.2% |
Dalata Hotel Group PLC (a) | 32,402 | | 161,051 |
FBD Holdings PLC | 240,328 | | 1,836,723 |
James Hardie Industries PLC: | | | |
CDI | 165,775 | | 2,145,974 |
sponsored ADR (d) | 564,575 | | 7,424,161 |
TOTAL IRELAND | | 11,567,909 |
Isle of Man - 0.2% |
Playtech Ltd. | 135,589 | | 1,789,245 |
Israel - 1.4% |
Azrieli Group | 104,005 | | 4,075,096 |
Ituran Location & Control Ltd. | 106,586 | | 2,174,354 |
Sarine Technologies Ltd. | 1,497,700 | | 1,664,729 |
Strauss Group Ltd. (a) | 366,044 | | 5,243,999 |
TOTAL ISRAEL | | 13,158,178 |
Italy - 4.3% |
Azimut Holding SpA | 526,997 | | 12,685,523 |
Common Stocks - continued |
| Shares | | Value |
Italy - continued |
Banco di Desio e della Brianza SpA (d) | 940,000 | | $ 3,216,784 |
Beni Stabili SpA SIIQ | 13,645,675 | | 11,239,094 |
Interpump Group SpA | 947,943 | | 13,968,234 |
TOTAL ITALY | | 41,109,635 |
Japan - 26.0% |
Aoki Super Co. Ltd. | 203,000 | | 2,147,019 |
Artnature, Inc. | 628,500 | | 6,043,267 |
Asahi Co. Ltd. | 463,200 | | 4,549,641 |
Asia Securities Printing Co. Ltd. | 644,800 | | 4,752,487 |
Autobacs Seven Co. Ltd. | 307,000 | | 5,383,421 |
Azbil Corp. | 436,300 | | 11,007,498 |
Broadleaf Co. Ltd. | 77,800 | | 891,167 |
Coca-Cola Central Japan Co. Ltd. | 383,300 | | 5,387,042 |
Daiichikosho Co. Ltd. | 194,600 | | 6,490,308 |
Daikokutenbussan Co. Ltd. | 168,700 | | 5,795,204 |
GCA Savvian Group Corp. | 372,900 | | 4,378,352 |
Glory Ltd. | 288,100 | | 7,288,736 |
Goldcrest Co. Ltd. | 422,130 | | 7,898,257 |
Iwatsuka Confectionary Co. Ltd. | 50,400 | | 2,605,131 |
Japan Digital Laboratory Co. | 334,800 | | 4,280,994 |
Kobayashi Pharmaceutical Co. Ltd. | 115,000 | | 8,915,752 |
Koshidaka Holdings Co. Ltd. | 166,900 | | 3,021,378 |
Lasertec Corp. | 330,236 | | 3,603,891 |
Medikit Co. Ltd. | 105,000 | | 3,130,875 |
Meiko Network Japan Co. Ltd. | 112,600 | | 1,336,814 |
Miraial Co. Ltd. | 73,200 | | 710,087 |
Nagaileben Co. Ltd. | 472,600 | | 8,055,401 |
ND Software Co. Ltd. | 71,982 | | 830,895 |
Nihon Parkerizing Co. Ltd. | 1,048,000 | | 9,322,239 |
Nippon Seiki Co. Ltd. | 177,000 | | 3,709,206 |
NS Tool Co. Ltd. (d) | 35,600 | | 618,104 |
OBIC Co. Ltd. | 319,500 | | 16,862,249 |
OSG Corp. | 663,600 | | 12,482,431 |
Paramount Bed Holdings Co. Ltd. | 198,500 | | 6,366,919 |
San-Ai Oil Co. Ltd. | 620,000 | | 4,735,609 |
Seven Bank Ltd. | 2,768,800 | | 12,616,191 |
SHO-BOND Holdings Co. Ltd. | 263,700 | | 10,472,846 |
Shoei Co. Ltd. (d) | 280,100 | | 4,837,564 |
SK Kaken Co. Ltd. | 54,000 | | 5,259,333 |
Software Service, Inc. | 62,900 | | 2,370,885 |
Techno Medica Co. Ltd. | 79,400 | | 1,812,945 |
Common Stocks - continued |
| Shares | | Value |
Japan - continued |
The Monogatari Corp. | 61,200 | | $ 2,601,764 |
The Nippon Synthetic Chemical Industry Co. Ltd. | 471,000 | | 3,488,572 |
TKC Corp. | 214,900 | | 5,065,518 |
Tocalo Co. Ltd. | 117,000 | | 2,348,578 |
Tsutsumi Jewelry Co. Ltd. | 121,100 | | 2,406,897 |
USS Co. Ltd. | 1,110,800 | | 19,609,931 |
Workman Co. Ltd. | 90,300 | | 5,564,943 |
Yamada Consulting Group Co. Ltd. | 103,700 | | 3,035,223 |
Yamato Kogyo Co. Ltd. | 181,500 | | 4,834,639 |
TOTAL JAPAN | | 248,926,203 |
Korea (South) - 1.6% |
BGFretail Co. Ltd. | 65,707 | | 9,783,223 |
Coway Co. Ltd. | 44,576 | | 3,326,305 |
Leeno Industrial, Inc. | 57,500 | | 2,203,268 |
TOTAL KOREA (SOUTH) | | 15,312,796 |
Mexico - 0.6% |
Consorcio ARA S.A.B. de CV (a) | 14,924,378 | | 5,592,870 |
Netherlands - 2.8% |
Aalberts Industries NV | 319,501 | | 10,387,346 |
Heijmans NV (Certificaten Van Aandelen) (a)(d) | 356,792 | | 3,001,449 |
VastNed Retail NV | 271,729 | | 13,222,201 |
TOTAL NETHERLANDS | | 26,610,996 |
Norway - 0.4% |
Kongsberg Gruppen ASA | 240,900 | | 3,770,818 |
Philippines - 0.4% |
Jollibee Food Corp. | 866,090 | | 3,806,557 |
South Africa - 0.8% |
Alexander Forbes Group Holding | 4,368,721 | | 2,752,746 |
Clicks Group Ltd. | 723,287 | | 5,283,931 |
TOTAL SOUTH AFRICA | | 8,036,677 |
Spain - 1.8% |
Hispania Activos Inmobiliarios SA (a) | 210,543 | | 3,171,873 |
Merlin Properties Socimi SA | 518,100 | | 6,643,036 |
Prosegur Compania de Seguridad SA (Reg.) | 1,687,590 | | 7,515,821 |
TOTAL SPAIN | | 17,330,730 |
Common Stocks - continued |
| Shares | | Value |
Sweden - 3.0% |
Fagerhult AB | 728,290 | | $ 12,445,686 |
Intrum Justitia AB | 446,534 | | 16,045,548 |
TOTAL SWEDEN | | 28,491,234 |
Switzerland - 0.2% |
Tecan Group AG | 11,481 | | 1,565,723 |
Taiwan - 0.4% |
Addcn Technology Co. Ltd. | 426,900 | | 4,148,682 |
United Kingdom - 21.7% |
AA PLC | 1,236,400 | | 5,277,809 |
Babcock International Group PLC | 164,700 | | 2,447,611 |
Bellway PLC | 359,872 | | 14,402,054 |
Berendsen PLC | 1,033,163 | | 16,325,422 |
Britvic PLC | 761,971 | | 8,210,835 |
Dechra Pharmaceuticals PLC | 532,950 | | 7,965,371 |
Derwent London PLC | 83,710 | | 5,007,037 |
DP Poland PLC (a)(e) | 7,188,000 | | 2,507,081 |
Elementis PLC | 2,052,810 | | 7,424,180 |
Great Portland Estates PLC | 741,189 | | 10,163,578 |
H&T Group PLC | 264,353 | | 798,752 |
Hilton Food Group PLC | 220,288 | | 1,579,121 |
Howden Joinery Group PLC | 1,287,000 | | 9,198,006 |
Informa PLC | 1,001,781 | | 8,771,883 |
InterContinental Hotel Group PLC ADR | 116,931 | | 4,663,208 |
ITE Group PLC | 1,752,534 | | 3,789,143 |
JUST EAT Ltd. (a) | 777,370 | | 5,105,157 |
Meggitt PLC | 537,590 | | 2,930,456 |
Rightmove PLC | 116,414 | | 6,889,616 |
Shaftesbury PLC | 837,673 | | 12,145,210 |
Spectris PLC | 415,478 | | 10,677,150 |
Spirax-Sarco Engineering PLC | 335,791 | | 15,741,901 |
Taylor Wimpey PLC | 1,486,800 | | 4,538,261 |
Ted Baker PLC | 198,700 | | 9,272,183 |
Topps Tiles PLC | 1,983,300 | | 4,448,597 |
Ultra Electronics Holdings PLC | 340,558 | | 8,835,821 |
Unite Group PLC | 1,774,823 | | 18,194,846 |
TOTAL UNITED KINGDOM | | 207,310,289 |
United States of America - 6.8% |
ANSYS, Inc. (a) | 21,085 | | 2,009,611 |
Autoliv, Inc. (d) | 38,200 | | 4,631,368 |
Broadridge Financial Solutions, Inc. | 48,905 | | 2,913,760 |
Common Stocks - continued |
| Shares | | Value |
United States of America - continued |
China Biologic Products, Inc. (a) | 77,180 | | $ 8,793,889 |
Kennedy-Wilson Holdings, Inc. | 436,429 | | 10,701,239 |
Martin Marietta Materials, Inc. | 19,720 | | 3,059,558 |
Mohawk Industries, Inc. (a) | 32,600 | | 6,373,300 |
PriceSmart, Inc. | 120,899 | | 10,394,896 |
ResMed, Inc. | 43,300 | | 2,494,513 |
SS&C Technologies Holdings, Inc. | 189,258 | | 14,033,481 |
TOTAL UNITED STATES OF AMERICA | | 65,405,615 |
TOTAL COMMON STOCKS (Cost $739,886,661) |
863,140,749
|
Nonconvertible Preferred Stocks - 1.6% |
| | | |
Germany - 1.6% |
Sartorius AG (non-vtg.)
(Cost $9,373,614) | 69,179 | |
15,655,759
|
Money Market Funds - 8.9% |
| | | |
Fidelity Cash Central Fund, 0.18% (b) | 78,298,533 | | 78,298,533 |
Fidelity Securities Lending Cash Central Fund, 0.19% (b)(c) | 6,756,054 | | 6,756,054 |
TOTAL MONEY MARKET FUNDS (Cost $85,054,587) |
85,054,587
|
TOTAL INVESTMENT PORTFOLIO - 100.7% (Cost $834,314,862) | | 963,851,095 |
NET OTHER ASSETS (LIABILITIES) - (0.7)% | | (7,006,746) |
NET ASSETS - 100% | $ 956,844,349 |
Legend |
(a) Non-income producing |
(b) Affiliated fund that is generally available only to investment companies and other accounts managed by Fidelity Investments. The rate quoted is the annualized seven-day yield of the fund at period end. A complete unaudited listing of the fund's holdings as of its most recent quarter end is available upon request. In addition, each Fidelity Central Fund's financial statements, which are not covered by the Fund's Report of Independent Registered Public Accounting Firm, are available on the SEC's website or upon request. |
(c) Investment made with cash collateral received from securities on loan. |
(d) Security or a portion of the security is on loan at period end. |
(e) Affiliated company |
Affiliated Central Funds |
Information regarding fiscal year to date income earned by the Fund from investments in Fidelity Central Funds is as follows: |
Fund | Income earned |
Fidelity Cash Central Fund | $ 69,465 |
Fidelity Securities Lending Cash Central Fund | 43,254 |
Total | $ 112,719 |
Other Affiliated Issuers |
An affiliated company is a company in which the Fund has ownership of at least 5% of the voting securities. Fiscal year to date transactions with companies which are or were affiliates are as follows: |
Affiliate | Value, beginning of period | Purchases | Sales Proceeds | Dividend Income | Value,
end of
period |
DP Poland PLC | $ - | $ 1,799,096 | $ - | $ - | $ 2,507,081 |
Other Information |
Categorizations in the Schedule of Investments are based on country or territory of incorporation. |
The following is a summary of the inputs used, as of October 31, 2015, involving the Fund's assets and liabilities carried at fair value. The inputs or methodology used for valuing securities may not be an indication of the risk associated with investing in those securities. For more information on valuation inputs, and their aggregation into the levels used in the table below, please refer to the Investment Valuation section in the accompanying Notes to Financial Statements. |
Valuation Inputs at Reporting Date: |
Description | Total | Level 1 | Level 2 | Level 3 |
Investments in Securities: | | | | |
Equities: | | | | |
Consumer Discretionary | $ 193,110,292 | $ 124,130,156 | $ 68,980,136 | $ - |
Consumer Staples | 80,110,906 | 43,943,727 | 36,167,179 | - |
Energy | 13,512,923 | 8,777,314 | 4,735,609 | - |
Financials | 178,821,710 | 151,321,856 | 27,499,854 | - |
Health Care | 83,964,658 | 61,396,738 | 22,567,920 | - |
Industrials | 175,615,594 | 129,823,047 | 45,792,547 | - |
Information Technology | 89,465,483 | 47,044,079 | 42,421,404 | - |
Materials | 64,194,942 | 29,222,550 | 34,972,392 | - |
Money Market Funds | 85,054,587 | 85,054,587 | - | - |
Total Investments in Securities: | $ 963,851,095 | $ 680,714,054 | $ 283,137,041 | $ - |
See accompanying notes which are an integral part of the financial statements.
Annual Report
Statement of Assets and Liabilities
| | October 31, 2015 |
| | |
Assets | | |
Investment in securities, at value (including securities loaned of $6,608,284) - See accompanying schedule: Unaffiliated issuers (cost $747,461,179) | $ 876,289,427 | |
Fidelity Central Funds (cost $85,054,587) | 85,054,587 | |
Other affiliated issuers (cost $1,799,096) | 2,507,081 | |
Total Investments (cost $834,314,862) | | $ 963,851,095 |
Cash | | 35,705 |
Receivable for fund shares sold | | 1,959,910 |
Dividends receivable | | 2,626,567 |
Distributions receivable from Fidelity Central Funds | | 20,131 |
Prepaid expenses | | 2,218 |
Other receivables | | 8,171 |
Total assets | | 968,503,797 |
| | |
Liabilities | | |
Payable to custodian | $ 4,255 | |
Payable for investments purchased | 2,996,514 | |
Payable for fund shares redeemed | 922,123 | |
Accrued management fee | 669,820 | |
Distribution and service plan fees payable | 27,606 | |
Other affiliated payables | 204,936 | |
Other payables and accrued expenses | 78,140 | |
Collateral on securities loaned, at value | 6,756,054 | |
Total liabilities | | 11,659,448 |
| | |
Net Assets | | $ 956,844,349 |
Net Assets consist of: | | |
Paid in capital | | $ 1,079,462,131 |
Undistributed net investment income | | 4,878,283 |
Accumulated undistributed net realized gain (loss) on investments and foreign currency transactions | | (256,995,467) |
Net unrealized appreciation (depreciation) on investments and assets and liabilities in foreign currencies | | 129,499,402 |
Net Assets | | $ 956,844,349 |
See accompanying notes which are an integral part of the financial statements.
Annual Report
Financial Statements - continued
Statement of Assets and Liabilities - continued
| | October 31, 2015 |
Calculation of Maximum Offering Price | | |
Class A:
Net Asset Value and redemption price per share ($42,288,833 ÷ 2,866,188 shares) | | $ 14.75 |
| | |
Maximum offering price per share (100/94.25 of $14.75) | | $ 15.65 |
Class T:
Net Asset Value and redemption price per share ($13,295,749 ÷ 909,157 shares) | | $ 14.62 |
| | |
Maximum offering price per share (100/96.50 of $14.62) | | $ 15.15 |
Class B:
Net Asset Value and offering price per share ($604,112 ÷ 42,095 shares)A | | $ 14.35 |
| | |
Class C:
Net Asset Value and offering price per share ($17,369,639 ÷ 1,217,958 shares)A | | $ 14.26 |
| | |
International Small Cap Opportunities:
Net Asset Value, offering price and redemption price per share ($762,562,645 ÷ 51,136,318 shares) | | $ 14.91 |
| | |
Class I:
Net Asset Value, offering price and redemption price per share ($120,723,371 ÷ 8,096,650 shares) | | $ 14.91 |
A Redemption price per share is equal to net asset value less any applicable contingent deferred sales charge.
See accompanying notes which are an integral part of the financial statements.
Annual Report
Statement of Operations
| Year ended October 31, 2015 |
| | |
Investment Income | | |
Dividends | | $ 15,396,244 |
Interest | | 1,191 |
Income from Fidelity Central Funds | | 112,719 |
Income before foreign taxes withheld | | 15,510,154 |
Less foreign taxes withheld | | (1,188,664) |
Total income | | 14,321,490 |
| | |
Expenses | | |
Management fee | | |
Basic fee | $ 6,379,946 | |
Performance adjustment | 411,545 | |
Transfer agent fees | 1,704,191 | |
Distribution and service plan fees | 248,267 | |
Accounting and security lending fees | 364,305 | |
Custodian fees and expenses | 171,042 | |
Independent trustees' compensation | 3,095 | |
Registration fees | 122,475 | |
Audit | 74,244 | |
Legal | 1,956 | |
Miscellaneous | 6,233 | |
Total expenses before reductions | 9,487,299 | |
Expense reductions | (46,082) | 9,441,217 |
Net investment income (loss) | | 4,880,273 |
Realized and Unrealized Gain (Loss) | | |
Net realized gain (loss) on: | | |
Investment securities: | | |
Unaffiliated issuers | 32,176,139 | |
Foreign currency transactions | (20,188) | |
Total net realized gain (loss) | | 32,155,951 |
Change in net unrealized appreciation (depreciation) on: Investment securities | 15,699,549 | |
Assets and liabilities in foreign currencies | 9,159 | |
Total change in net unrealized appreciation (depreciation) | | 15,708,708 |
Net gain (loss) | | 47,864,659 |
Net increase (decrease) in net assets resulting from operations | | $ 52,744,932 |
See accompanying notes which are an integral part of the financial statements.
Annual Report
Financial Statements - continued
Statement of Changes in Net Assets
| Year ended
October 31,
2015 | Year ended
October 31,
2014 |
Increase (Decrease) in Net Assets | | |
Operations | | |
Net investment income (loss) | $ 4,880,273 | $ 3,975,650 |
Net realized gain (loss) | 32,155,951 | 27,466,423 |
Change in net unrealized appreciation (depreciation) | 15,708,708 | (28,661,157) |
Net increase (decrease) in net assets resulting from operations | 52,744,932 | 2,780,916 |
Distributions to shareholders from net investment income | (3,982,311) | (3,580,601) |
Distributions to shareholders from net realized gain | (949,656) | (3,233,620) |
Total distributions | (4,931,967) | (6,814,221) |
Share transactions - net increase (decrease) | 250,623,581 | 97,201,705 |
Redemption fees | 196,651 | 84,800 |
Total increase (decrease) in net assets | 298,633,197 | 93,253,200 |
| | |
Net Assets | | |
Beginning of period | 658,211,152 | 564,957,952 |
End of period (including undistributed net investment income of $4,878,283 and undistributed net investment income of $3,990,517, respectively) | $ 956,844,349 | $ 658,211,152 |
See accompanying notes which are an integral part of the financial statements.
Annual Report
Financial Highlights - Fidelity International Small Cap Opportunities Fund Class A
Years ended October 31, | 2015 | 2014 | 2013 | 2012 | 2011 |
Selected Per-Share Data | | | | | |
Net asset value, beginning of period | $ 13.65 | $ 13.68 | $ 10.78 | $ 9.75 | $ 9.82 |
Income from Investment Operations | | | | | |
Net investment income (loss) C | .06 | .05 | .07 | .08 | .15F |
Net realized and unrealized gain (loss) | 1.11 | .05 | 2.91 | 1.07 | (.07) |
Total from investment operations | 1.17 | .10 | 2.98 | 1.15 | .08 |
Distributions from net investment income | (.05) | (.06) | (.08) | (.11) | (.11) |
Distributions from net realized gain | (.02) | (.08) | (.01) | (.01) | (.04) |
Total distributions | (.07) | (.13) J | (.08) I | (.12) | (.15) |
Redemption fees added to paid in capitalC, H | - | - | - | - | - |
Net asset value, end of period | $ 14.75 | $ 13.65 | $ 13.68 | $ 10.78 | $ 9.75 |
Total ReturnA, B | 8.62% | .78% | 27.85% | 12.00% | .81% |
Ratios to Average Net AssetsD, G | | | | | |
Expenses before reductions | 1.52% | 1.63% | 1.70% | 1.75% | 1.34% |
Expenses net of fee waivers, if any | 1.52% | 1.63% | 1.65% | 1.65% | 1.33% |
Expenses net of all reductions | 1.51% | 1.63% | 1.64% | 1.64% | 1.32% |
Net investment income (loss) | .38% | .33% | .59% | .85% | 1.44%F |
Supplemental Data | | | | | |
Net assets, end of period (000 omitted) | $ 42,289 | $ 25,041 | $ 22,052 | $ 18,194 | $ 18,686 |
Portfolio turnover rateE | 21% | 18% | 31% | 28% | 24% |
A Total returns would have been lower if certain expenses had not been reduced during the applicable periods shown.
B Total returns do not include the effect of the sales charges.
C Calculated based on average shares outstanding during the period.
D Fees and expenses of any underlying Fidelity Central Funds are not included in the Fund's expense ratio. The Fund indirectly bears its proportionate share of the expenses of any underlying Fidelity Central Funds.
E Amount does not include the portfolio activity of any underlying Fidelity Central Funds.
F Investment income per share reflects a large, non-recurring dividend which amounted to $.06 per share. Excluding this non-recurring dividend, the ratio of net investment income (loss) to average net assets would have been .80%.
G Expense ratios reflect operating expenses of the class. Expenses before reductions do not reflect amounts reimbursed by the investment adviser or reductions from brokerage service arrangements or reductions from other expense offset arrangements and do not represent the amount paid by the class during periods when reimbursements or reductions occur. Expenses net of fee waivers reflect expenses after reimbursement by the investment adviser but prior to reductions from brokerage service arrangements or other expense offset arrangements. Expenses net of all reductions represent the net expenses paid by the class.
H Amount represents less than $.005 per share.
I Total distributions of $.08 per share is comprised of distributions from net investment income of $.077 and distributions from net realized gain of $.005 per share.
J Total distributions of $.13 per share is comprised of distributions from net investment income of $.055 and distributions from net realized gain of $.079 per share.
See accompanying notes which are an integral part of the financial statements.
Annual Report
Financial Highlights - Fidelity International Small Cap Opportunities Fund Class T
Years ended October 31, | 2015 | 2014 | 2013 | 2012 | 2011 |
Selected Per-Share Data | | | | | |
Net asset value, beginning of period | $ 13.53 | $ 13.56 | $ 10.69 | $ 9.66 | $ 9.72 |
Income from Investment Operations | | | | | |
Net investment income (loss) C | .01 | .01 | .04 | .06 | .12F |
Net realized and unrealized gain (loss) | 1.11 | .06 | 2.89 | 1.06 | (.06) |
Total from investment operations | 1.12 | .07 | 2.93 | 1.12 | .06 |
Distributions from net investment income | (.01) | (.02) | (.05) | (.08) | (.08) |
Distributions from net realized gain | (.02) | (.08) | (.01) | (.01) | (.04) |
Total distributions | (.03) | (.10) | (.06) | (.09) | (.12) |
Redemption fees added to paid in capitalC, H | - | - | - | - | - |
Net asset value, end of period | $ 14.62 | $ 13.53 | $ 13.56 | $ 10.69 | $ 9.66 |
Total ReturnA, B | 8.27% | .55% | 27.53% | 11.72% | .60% |
Ratios to Average Net AssetsD, G | | | | | |
Expenses before reductions | 1.80% | 1.89% | 1.96% | 2.02% | 1.60% |
Expenses net of fee waivers, if any | 1.80% | 1.89% | 1.90% | 1.90% | 1.60% |
Expenses net of all reductions | 1.80% | 1.89% | 1.89% | 1.89% | 1.59% |
Net investment income (loss) | .10% | .07% | .34% | .60% | 1.17%F |
Supplemental Data | | | | | |
Net assets, end of period (000 omitted) | $ 13,296 | $ 9,913 | $ 9,634 | $ 8,169 | $ 8,701 |
Portfolio turnover rateE | 21% | 18% | 31% | 28% | 24% |
A Total returns would have been lower if certain expenses had not been reduced during the applicable periods shown.
B Total returns do not include the effect of the sales charges.
C Calculated based on average shares outstanding during the period.
D Fees and expenses of any underlying Fidelity Central Funds are not included in the Fund's expense ratio. The Fund indirectly bears its proportionate share of the expenses of any underlying Fidelity Central Funds.
E Amount does not include the portfolio activity of any underlying Fidelity Central Funds.
F Investment income per share reflects a large, non-recurring dividend which amounted to $.06 per share. Excluding this non-recurring dividend, the ratio of net investment income (loss) to average net assets would have been .54%.
G Expense ratios reflect operating expenses of the class. Expenses before reductions do not reflect amounts reimbursed by the investment adviser or reductions from brokerage service arrangements or reductions from other expense offset arrangements and do not represent the amount paid by the class during periods when reimbursements or reductions occur. Expenses net of fee waivers reflect expenses after reimbursement by the investment adviser but prior to reductions from brokerage service arrangements or other expense offset arrangements. Expenses net of all reductions represent the net expenses paid by the class.
H Amount represents less than $.005 per share.
See accompanying notes which are an integral part of the financial statements.
Annual Report
Financial Highlights - Fidelity International Small Cap Opportunities Fund Class B
Years ended October 31, | 2015 | 2014 | 2013 | 2012 | 2011 |
Selected Per-Share Data | | | | | |
Net asset value, beginning of period | $ 13.31 | $ 13.31 | $ 10.50 | $ 9.48 | $ 9.54 |
Income from Investment Operations | | | | | |
Net investment income (loss) C | (.06) | (.06) | (.02) | .01 | .07F |
Net realized and unrealized gain (loss) | 1.10 | .06 | 2.84 | 1.05 | (.06) |
Total from investment operations | 1.04 | - | 2.82 | 1.06 | .01 |
Distributions from net investment income | - | - | - H | (.03) | (.06) |
Distributions from net realized gain | - | - | (.01) | (.01) | (.02) |
Total distributions | - | - | (.01) | (.04) | (.07) I |
Redemption fees added to paid in capitalC, H | - | - | - | - | - |
Net asset value, end of period | $ 14.35 | $ 13.31 | $ 13.31 | $ 10.50 | $ 9.48 |
Total ReturnA, B | 7.81% | -% | 26.86% | 11.21% | .10% |
Ratios to Average Net AssetsD, G | | | | | |
Expenses before reductions | 2.30% | 2.38% | 2.46% | 2.50% | 2.09% |
Expenses net of fee waivers, if any | 2.30% | 2.38% | 2.40% | 2.40% | 2.09% |
Expenses net of all reductions | 2.29% | 2.38% | 2.39% | 2.39% | 2.07% |
Net investment income (loss) | (.39)% | (.43)% | (.16)% | .10% | .68%F |
Supplemental Data | | | | | |
Net assets, end of period (000 omitted) | $ 604 | $ 744 | $ 1,410 | $ 1,966 | $ 2,293 |
Portfolio turnover rateE | 21% | 18% | 31% | 28% | 24% |
A Total returns would have been lower if certain expenses had not been reduced during the applicable periods shown.
B Total returns do not include the effect of the contingent deferred sales charge.
C Calculated based on average shares outstanding during the period.
D Fees and expenses of any underlying Fidelity Central Funds are not included in the Fund's expense ratio. The Fund indirectly bears its proportionate share of the expenses of any underlying Fidelity Central Funds.
E Amount does not include the portfolio activity of any underlying Fidelity Central Funds.
F Investment income per share reflects a large, non-recurring dividend which amounted to $.06 per share. Excluding this non-recurring dividend, the ratio of net investment income (loss) to average net assets would have been .05%.
G Expense ratios reflect operating expenses of the class. Expenses before reductions do not reflect amounts reimbursed by the investment adviser or reductions from brokerage service arrangements or reductions from other expense offset arrangements and do not represent the amount paid by the class during periods when reimbursements or reductions occur. Expenses net of fee waivers reflect expenses after reimbursement by the investment adviser but prior to reductions from brokerage service arrangements or other expense offset arrangements. Expenses net of all reductions represent the net expenses paid by the class.
H Amount represents less than $.005 per share.
I Total distributions of $.07 per share is comprised of distributions from net investment income of $.058 and distributions from net realized gain of $.015 per share.
See accompanying notes which are an integral part of the financial statements.
Annual Report
Financial Highlights - Fidelity International Small Cap Opportunities Fund Class C
Years ended October 31, | 2015 | 2014 | 2013 | 2012 | 2011 |
Selected Per-Share Data | | | | | |
Net asset value, beginning of period | $ 13.23 | $ 13.28 | $ 10.48 | $ 9.47 | $ 9.53 |
Income from Investment Operations | | | | | |
Net investment income (loss) C | (.05) | (.06) | (.02) | .01 | .07F |
Net realized and unrealized gain (loss) | 1.08 | .06 | 2.84 | 1.04 | (.06) |
Total from investment operations | 1.03 | - | 2.82 | 1.05 | .01 |
Distributions from net investment income | - | - | (.01) | (.03) | (.06) |
Distributions from net realized gain | - | (.05) | (.01) | (.01) | (.02) |
Total distributions | - | (.05) | (.02) | (.04) | (.07) I |
Redemption fees added to paid in capitalC, H | - | - | - | - | - |
Net asset value, end of period | $ 14.26 | $ 13.23 | $ 13.28 | $ 10.48 | $ 9.47 |
Total ReturnA, B | 7.79% | .03% | 26.91% | 11.13% | .10% |
Ratios to Average Net AssetsD, G | | | | | |
Expenses before reductions | 2.27% | 2.38% | 2.45% | 2.50% | 2.09% |
Expenses net of fee waivers, if any | 2.27% | 2.38% | 2.40% | 2.40% | 2.09% |
Expenses net of all reductions | 2.26% | 2.38% | 2.39% | 2.39% | 2.07% |
Net investment income (loss) | (.36)% | (.42)% | (.16)% | .10% | .68%F |
Supplemental Data | | | | | |
Net assets, end of period (000 omitted) | $ 17,370 | $ 8,438 | $ 8,070 | $ 6,608 | $ 6,900 |
Portfolio turnover rateE | 21% | 18% | 31% | 28% | 24% |
A Total returns would have been lower if certain expenses had not been reduced during the applicable periods shown.
B Total returns do not include the effect of the contingent deferred sales charge.
C Calculated based on average shares outstanding during the period.
D Fees and expenses of any underlying Fidelity Central Funds are not included in the Fund's expense ratio. The Fund indirectly bears its proportionate share of the expenses of any underlying Fidelity Central Funds.
E Amount does not include the portfolio activity of any underlying Fidelity Central Funds.
F Investment income per share reflects a large, non-recurring dividend which amounted to $.06 per share. Excluding this non-recurring dividend, the ratio of net investment income (loss) to average net assets would have been .05%.
G Expense ratios reflect operating expenses of the class. Expenses before reductions do not reflect amounts reimbursed by the investment adviser or reductions from brokerage service arrangements or reductions from other expense offset arrangements and do not represent the amount paid by the class during periods when reimbursements or reductions occur. Expenses net of fee waivers reflect expenses after reimbursement by the investment adviser but prior to reductions from brokerage service arrangements or other expense offset arrangements. Expenses net of all reductions represent the net expenses paid by the class.
H Amount represents less than $.005 per share.
I Total distributions of $.07 per share is comprised of distributions from net investment income of $.058 and distributions from net realized gain of $.015 per share.
See accompanying notes which are an integral part of the financial statements.
Annual Report
Financial Highlights - Fidelity International Small Cap Opportunities Fund
Years ended October 31, | 2015 | 2014 | 2013 | 2012 | 2011 |
Selected Per-Share Data | | | | | |
Net asset value, beginning of period | $ 13.80 | $ 13.82 | $ 10.88 | $ 9.85 | $ 9.92 |
Income from Investment Operations | | | | | |
Net investment income (loss) B | .10 | .09 | .10 | .11 | .17E |
Net realized and unrealized gain (loss) | 1.12 | .06 | 2.95 | 1.07 | (.06) |
Total from investment operations | 1.22 | .15 | 3.05 | 1.18 | .11 |
Distributions from net investment income | (.09) | (.09) | (.10) | (.14) | (.14) |
Distributions from net realized gain | (.02) | (.08) | (.01) | (.01) | (.04) |
Total distributions | (.11) | (.17) | (.11) | (.15) | (.18) |
Redemption fees added to paid in capitalB, G | - | - | - | - | - |
Net asset value, end of period | $ 14.91 | $ 13.80 | $ 13.82 | $ 10.88 | $ 9.85 |
Total ReturnA | 8.92% | 1.11% | 28.24% | 12.21% | 1.10% |
Ratios to Average Net AssetsC, F | �� | | | | |
Expenses before reductions | 1.23% | 1.30% | 1.39% | 1.47% | 1.08% |
Expenses net of fee waivers, if any | 1.22% | 1.30% | 1.39% | 1.40% | 1.08% |
Expenses net of all reductions | 1.22% | 1.30% | 1.38% | 1.39% | 1.06% |
Net investment income (loss) | .68% | .65% | .85% | 1.10% | 1.69%E |
Supplemental Data | | | | | |
Net assets, end of period (000 omitted) | $ 762,563 | $ 584,253 | $ 518,121 | $ 334,918 | $ 328,262 |
Portfolio turnover rateD | 21% | 18% | 31% | 28% | 24% |
A Total returns would have been lower if certain expenses had not been reduced during the applicable periods shown.
B Calculated based on average shares outstanding during the period.
C Fees and expenses of any underlying Fidelity Central Funds are not included in the Fund's expense ratio. The Fund indirectly bears its proportionate share of the expenses of any underlying Fidelity Central Funds.
D Amount does not include the portfolio activity of any underlying Fidelity Central Funds.
E Investment income per share reflects a large, non-recurring dividend which amounted to $.07 per share. Excluding this non-recurring dividend, the ratio of net investment income (loss) to average net assets would have been 1.06%.
F Expense ratios reflect operating expenses of the class. Expenses before reductions do not reflect amounts reimbursed by the investment adviser or reductions from brokerage service arrangements or reductions from other expense offset arrangements and do not represent the amount paid by the class during periods when reimbursements or reductions occur. Expenses net of fee waivers reflect expenses after reimbursement by the investment adviser but prior to reductions from brokerage service arrangements or other expense offset arrangements. Expenses net of all reductions represent the net expenses paid by the class.
G Amount represents less than $.005 per share.
See accompanying notes which are an integral part of the financial statements.
Annual Report
Financial Highlights - Fidelity International Small Cap Opportunities Fund Class I
Years ended October 31, | 2015 | 2014 | 2013 | 2012 | 2011 |
Selected Per-Share Data | | | | | |
Net asset value, beginning of period | $ 13.81 | $ 13.83 | $ 10.90 | $ 9.86 | $ 9.93 |
Income from Investment Operations | | | | | |
Net investment income (loss) B | .10 | .08 | .11 | .11 | .18E |
Net realized and unrealized gain (loss) | 1.13 | .07 | 2.93 | 1.08 | (.06) |
Total from investment operations | 1.23 | .15 | 3.04 | 1.19 | .12 |
Distributions from net investment income | (.11) | (.09) | (.10) | (.14) | (.15) |
Distributions from net realized gain | (.02) | (.08) | (.01) | (.01) | (.04) |
Total distributions | (.13) | (.17) | (.11) | (.15) | (.19) |
Redemption fees added to paid in capitalB, G | - | - | - | - | - |
Net asset value, end of period | $ 14.91 | $ 13.81 | $ 13.83 | $ 10.90 | $ 9.86 |
Total Return A | 8.98% | 1.11% | 28.11% | 12.32% | 1.13% |
Ratios to Average Net AssetsC, F | | | | | |
Expenses before reductions | 1.19% | 1.36% | 1.38% | 1.44% | 1.03% |
Expenses net of fee waivers, if any | 1.19% | 1.36% | 1.37% | 1.40% | 1.03% |
Expenses net of all reductions | 1.18% | 1.36% | 1.37% | 1.39% | 1.02% |
Net investment income (loss) | .71% | .60% | .87% | 1.10% | 1.74%E |
Supplemental Data | | | | | |
Net assets, end of period (000 omitted) | $ 120,723 | $ 29,822 | $ 5,670 | $ 4,591 | $ 1,395 |
Portfolio turnover rateD | 21% | 18% | 31% | 28% | 24% |
A Total returns would have been lower if certain expenses had not been reduced during the applicable periods shown.
B Calculated based on average shares outstanding during the period.
C Fees and expenses of any underlying Fidelity Central Funds are not included in the Fund's expense ratio. The Fund indirectly bears its proportionate share of the expenses of any underlying Fidelity Central Funds.
D Amount does not include the portfolio activity of any underlying Fidelity Central Funds.
E Investment income per share reflects a large, non-recurring dividend which amounted to $.07 per share. Excluding this non-recurring dividend, the ratio of net investment income (loss) to average net assets would have been 1.11%.
F Expense ratios reflect operating expenses of the class. Expenses before reductions do not reflect amounts reimbursed by the investment adviser or reductions from brokerage service arrangements or reductions from other expense offset arrangements and do not represent the amount paid by the class during periods when reimbursements or reductions occur. Expenses net of fee waivers reflect expenses after reimbursement by the investment adviser but prior to reductions from brokerage service arrangements or other expense offset arrangements. Expenses net of all reductions represent the net expenses paid by the class.
G Amount represents less than $.005 per share.
See accompanying notes which are an integral part of the financial statements.
Annual Report
For the period ended October 31, 2015
1. Organization.
Fidelity International Small Cap Opportunities Fund (the Fund) is a fund of Fidelity Investment Trust (the Trust) and is authorized to issue an unlimited number of shares. The Trust is registered under the Investment Company Act of 1940, as amended (the 1940 Act), as an open-end management investment company organized as a Massachusetts business trust. The Fund offers Class A, Class T, Class C, International Small Cap Opportunities and Class I (formerly Institutional Class) shares, each of which, along with Class B shares, has equal rights as to assets and voting privileges. Class B shares are closed to new accounts and additional purchases, except for exchanges and reinvestments. Each class has exclusive voting rights with respect to matters that affect that class. Class B shares will automatically convert to Class A shares after a holding period of seven years from the initial date of purchase.
2. Investments in Fidelity Central Funds.
The Fund invests in Fidelity Central Funds, which are open-end investment companies generally available only to other investment companies and accounts managed by the investment adviser and its affiliates. The Fund's Schedule of Investments lists each of the Fidelity Central Funds held as of period end, if any, as an investment of the Fund, but does not include the underlying holdings of each Fidelity Central Fund. As an Investing Fund, the Fund indirectly bears its proportionate share of the expenses of the underlying Fidelity Central Funds.
The Money Market Central Funds seek preservation of capital and current income and are managed by Fidelity Investments Money Management, Inc. (FIMM), an affiliate of the investment adviser. Annualized expenses of the Money Market Central Funds as of their most recent shareholder report date are less than .005%.
A complete unaudited list of holdings for each Fidelity Central Fund is available upon request or at the Securities and Exchange Commission (the SEC) website at www.sec.gov. In addition, the financial statements of the Fidelity Central Funds, which are not covered by the Fund's Report of Independent Registered Public Accounting Firm, are available on the SEC website or upon request.
3. Significant Accounting Policies.
The financial statements have been prepared in conformity with accounting principles generally accepted in the United States of America (GAAP), which require management to make certain estimates and assumptions at the date of the financial statements. Actual results could differ from those estimates. Subsequent events, if any, through the date that the financial statements were issued have been evaluated in the preparation of
Annual Report
Notes to Financial Statements - continued
3. Significant Accounting Policies - continued
the financial statements. The following summarizes the significant accounting policies of the Fund:
Investment Valuation. Investments are valued as of 4:00 p.m. Eastern time on the last calendar day of the period. The Board of Trustees (the Board) has delegated the day to day responsibility for the valuation of the Fund's investments to the Fidelity Management & Research Company (FMR) Fair Value Committee (the Committee). In accordance with valuation policies and procedures approved by the Board, the Fund attempts to obtain prices from one or more third party pricing vendors or brokers to value its investments. When current market prices, quotations or currency exchange rates are not readily available or reliable, investments will be fair valued in good faith by the Committee, in accordance with procedures adopted by the Board. Factors used in determining fair value vary by investment type and may include market or investment specific events. The frequency with which these procedures are used cannot be predicted and they may be utilized to a significant extent. The Committee oversees the Fund's valuation policies and procedures and reports to the Board on the Committee's activities and fair value determinations. The Board monitors the appropriateness of the procedures used in valuing the Fund's investments and ratifies the fair value determinations of the Committee.
The Fund categorizes the inputs to valuation techniques used to value its investments into a disclosure hierarchy consisting of three levels as shown below:
Level 1 - quoted prices in active markets for identical investments
Level 2 - other significant observable inputs (including quoted prices for similar investments, interest rates, prepayment speeds, etc.)
Level 3 - unobservable inputs (including the Fund's own assumptions based on the best information available)
Valuation techniques used to value the Fund's investments by major category are as follows:
Equity securities, including restricted securities, for which market quotations are readily available, are valued at the last reported sale price or official closing price as reported by a third party pricing vendor on the primary market or exchange on which they are traded and are categorized as Level 1 in the hierarchy. In the event there were no sales during the day or closing prices are not available, securities are valued at the last quoted bid price or may be valued using the last available price and are generally categorized as Level 2 in the hierarchy. For foreign equity securities, when market or security specific events arise, comparisons to the valuation of American Depositary Receipts (ADRs),
Annual Report
3. Significant Accounting Policies - continued
Investment Valuation - continued
futures contracts, Exchange-Traded Funds (ETFs) and certain indexes as well as quoted prices for similar securities may be used and would be categorized as Level 2 in the hierarchy. Utilizing these techniques may result in transfers between Level 1 and Level 2. For equity securities, including restricted securities, where observable inputs are limited, assumptions about market activity and risk are used and these securities may be categorized as Level 3 in the hierarchy.
Investments in open-end mutual funds, including the Fidelity Central Funds, are valued at their closing net asset value (NAV) each business day and are categorized as Level 1 in the hierarchy.
Changes in valuation techniques may result in transfers in or out of an assigned level within the disclosure hierarchy. The aggregate value of investments by input level as of October 31, 2015 is included at the end of the Fund's Schedule of Investments.
Foreign Currency. The Fund may use foreign currency contracts to facilitate transactions in foreign-denominated securities. Gains and losses from these transactions may arise from changes in the value of the foreign currency or if the counterparties do not perform under the contracts' terms.
Foreign-denominated assets, including investment securities, and liabilities are translated into U.S. dollars at the exchange rates at period end. Purchases and sales of investment securities, income and dividends received and expenses denominated in foreign currencies are translated into U.S. dollars at the exchange rate in effect on the transaction date.
The effects of exchange rate fluctuations on investments are included with the net realized and unrealized gain (loss) on investment securities. Other foreign currency transactions resulting in realized and unrealized gain (loss) are disclosed separately.
Investment Transactions and Income. For financial reporting purposes, the Fund's investment holdings and NAV include trades executed through the end of the last business day of the period. The NAV per share for processing shareholder transactions is calculated as of the close of business of the New York Stock Exchange (NYSE), normally 4:00 p.m. Eastern time and includes trades executed through the end of the prior business day. Gains and losses on securities sold are determined on the basis of identified cost. Dividend income is recorded on the ex-dividend date, except for certain dividends from foreign securities where the ex-dividend date may have passed, which are recorded as soon as the Fund is informed of the ex-dividend date. Non-cash dividends included in dividend income, if any, are recorded at the fair market value of the securities received.
Annual Report
Notes to Financial Statements - continued
3. Significant Accounting Policies - continued
Investment Transactions and Income - continued
Income and capital gain distributions from Fidelity Central Funds, if any, are recorded on the ex-dividend date. Distributions received on securities that represent a return of capital or capital gain are recorded as a reduction of cost of investments and/or as a realized gain. Subsequent to ex-dividend date the Fund determines the components of these distributions, based upon receipt of tax filings or other correspondence relating to the underlying investment. Interest income is accrued as earned and includes coupon interest and amortization of premium and accretion of discount on debt securities as applicable. Investment income is recorded net of foreign taxes withheld where recovery of such taxes is uncertain.
Class Allocations and Expenses. Investment income, realized and unrealized capital gains and losses, common expenses of the Fund, and certain fund-level expense reductions, if any, are allocated daily on a pro-rata basis to each class based on the relative net assets of each class to the total net assets of the Fund. Each class differs with respect to transfer agent and distribution and service plan fees incurred. Certain expense reductions may also differ by class. For the reporting period, the allocated portion of income and expenses to each class as a percent of its average net assets may vary due to the timing of recording these transactions in relation to fluctuating net assets of the classes. Expenses directly attributable to a fund are charged to that fund. Expenses attributable to more than one fund are allocated among the respective funds on the basis of relative net assets or other appropriate methods. Expense estimates are accrued in the period to which they relate and adjustments are made when actual amounts are known.
Income Tax Information and Distributions to Shareholders. Each year, the Fund intends to qualify as a regulated investment company under Subchapter M of the Internal Revenue Code, including distributing substantially all of its taxable income and realized gains. As a result, no provision for U.S. Federal income taxes is required. As of October 31, 2015, the Fund did not have any unrecognized tax benefits in the financial statements; nor is the Fund aware of any tax positions for which it is reasonably possible that the total amounts of unrecognized tax benefits will significantly change in the next twelve months. The Fund files a U.S. federal tax return, in addition to state and local tax returns as required. The Fund's federal income tax returns are subject to examination by the Internal Revenue Service (IRS) for a period of three fiscal years after they are filed. State and local tax returns may be subject to examination for an additional fiscal year depending on the jurisdiction. Foreign taxes are provided for based on the Fund's understanding of the tax rules and rates that exist in the foreign markets in which it invests.
Distributions are declared and recorded on the ex-dividend date. Income dividends and capital gain distributions are declared separately for each class. Income and capital gain
Annual Report
3. Significant Accounting Policies - continued
Income Tax Information and Distributions to Shareholders - continued
distributions are determined in accordance with income tax regulations, which may differ from GAAP.
Capital accounts within the financial statements are adjusted for permanent book-tax differences. These adjustments have no impact on net assets or the results of operations. Capital accounts are not adjusted for temporary book-tax differences which will reverse in a subsequent period.
Book-tax differences are primarily due to foreign currency transactions, partnerships, passive foreign investment companies (PFIC), capital loss carryforwards and losses deferred due to wash sales.
The federal tax cost of investment securities and unrealized appreciation (depreciation) as of period end were as follows:
Gross unrealized appreciation | $ 170,087,781 |
Gross unrealized depreciation | (49,282,874) |
Net unrealized appreciation (depreciation) on securities | $ 120,804,907 |
Tax Cost | $ 843,046,188 |
The tax-based components of distributable earnings as of period end were as follows:
Undistributed ordinary income | $ 9,403,138 |
Capital loss carryforward | $ (252,792,060) |
Net unrealized appreciation (depreciation) on securities and other investments | $ 120,771,140 |
Capital loss carryforwards are only available to offset future capital gains of the Fund to the extent provided by regulations and may be limited. Under the Regulated Investment Company Modernization Act of 2010 (the Act), the Fund is permitted to carry forward capital losses incurred in taxable years beginning after December 22, 2010 for an unlimited period and such capital losses are required to be used prior to any losses that expire. The capital loss carryforward information presented below, including any applicable limitation, is estimated as of fiscal period end and is subject to adjustment.
Fiscal year of expiration | |
2017 | $ (252,792,060) |
The tax character of distributions paid was as follows:
| October 31, 2015 | October 31, 2014 |
Ordinary Income | $ 4,931,967 | $ 6,814,221 |
Annual Report
Notes to Financial Statements - continued
3. Significant Accounting Policies - continued
Short-Term Trading (Redemption) Fees. Shares held by investors in the Fund less than 90 days may have been subject to a redemption fee equal to 2.00% of the NAV of shares redeemed. All redemption fees, which reduce the proceeds of the shareholder redemption, are retained by the Fund and accounted for as an addition to paid in capital.
4. Purchases and Sales of Investments.
Purchases and sales of securities, other than short-term securities, aggregated $339,740,366 and $147,999,305, respectively.
5. Fees and Other Transactions with Affiliates.
Management Fee. Fidelity Management & Research Company (the investment adviser) and its affiliates provide the Fund with investment management related services for which the Fund pays a monthly management fee. The management fee is the sum of an individual fund fee rate that is based on an annual rate of .60% of the Fund's average net assets and an annualized group fee rate that averaged .25% during the period. The group fee rate is based upon the average net assets of all the mutual funds advised by the investment adviser, including any mutual funds previously advised by the investment adviser that are currently advised by Fidelity SelectCo, LLC, an affiliate of the investment adviser. The group fee rate decreases as assets under management increase and increases as assets under management decrease. In addition, the management fee is subject to a performance adjustment (up to a maximum of ± .20% of the Fund's average net assets over a 36 month performance period). The upward or downward adjustment to the management fee is based on the relative investment performance of International Small Cap Opportunities as compared to its benchmark index, the MSCI EAFE Small Cap Index, over the same 36 month performance period. For the reporting period, the total annual management fee rate, including the performance adjustment, was .90% of the Fund's average net assets. The performance adjustment included in the management fee rate may be higher or lower than the maximum performance adjustment rate due to the difference between the average net assets for the reporting and performance periods.
Distribution and Service Plan Fees. In accordance with Rule 12b-1 of the 1940 Act, the Fund has adopted separate Distribution and Service Plans for each class of shares. Certain classes pay Fidelity Distributors Corporation (FDC), an affiliate of the investment adviser, separate Distribution and Service Fees, each of which is based on an annual percentage of each class' average net assets. In addition, FDC may pay financial intermediaries for selling shares of the Fund and providing shareholder support services.
Annual Report
5. Fees and Other Transactions with Affiliates - continued
Distribution and Service Plan Fees - continued
For the period, the Distribution and Service Fee rates, total fees and amounts retained by FDC were as follows:
| Distribution
Fee | Service
Fee | Total Fees | Retained
by FDC |
Class A | -% | .25% | $ 72,286 | $ 920 |
Class T | .25% | .25% | 53,206 | - |
Class B | .75% | .25% | 6,808 | 5,112 |
Class C | .75% | .25% | 115,967 | 20,094 |
| | | $ 248,267 | $ 26,126 |
Sales Load. FDC may receive a front-end sales charge of up to 5.75% for selling Class A shares and 3.50% for selling Class T shares, some of which is paid to financial intermediaries for selling shares of the Fund. Depending on the holding period, FDC may receive contingent deferred sales charges levied on Class A, Class T, Class B, and Class C redemptions. The deferred sales charges range from 5.00% to 1.00% for Class B shares, 1.00% for Class C shares, 1.00% for certain purchases of Class A shares and .25% for certain purchases of Class T shares.
For the period, sales charge amounts retained by FDC were as follows:
| Retained
by FDC |
Class A | $ 24,104 |
Class T | 3,744 |
Class BA | 149 |
Class CA | 3,738 |
| $ 31,735 |
A When Class B and Class C shares are initially sold, FDC pays commissions from its own resources to financial intermediaries through which the sales are made.
Transfer Agent Fees. Fidelity Investments Institutional Operations Company, Inc., (FIIOC), an affiliate of the investment adviser, is the transfer, dividend disbursing and shareholder servicing agent for each class of the Fund. FIIOC receives account fees and asset-based fees that vary according to the account size and type of account of the shareholders of the respective classes of the Fund. FIIOC pays for typesetting, printing and mailing of shareholder reports, except proxy statements.
Annual Report
Notes to Financial Statements - continued
5. Fees and Other Transactions with Affiliates - continued
Transfer Agent Fees - continued
For the period, transfer agent fees for each class were as follows:
| Amount | % of
Class-Level Average
Net Assets |
Class A | $ 78,679 | .27 |
Class T | 32,323 | .30 |
Class B | 2,026 | .30 |
Class C | 32,269 | .28 |
International Small Cap Opportunities | 1,405,016 | .23 |
Class I | 153,878 | .19 |
| $ 1,704,191 | |
Accounting and Security Lending Fees. Fidelity Service Company, Inc. (FSC), an affiliate of the investment adviser, maintains the Fund's accounting records. The accounting fee is based on the level of average net assets for each month. Under a separate contract, FSC administers the security lending program. The security lending fee is based on the number and duration of lending transactions.
Brokerage Commissions. The Fund placed a portion of its portfolio transactions with brokerage firms which are affiliates of the investment adviser. Brokerage commissions are included in net realized gain (loss) and change in net unrealized appreciation (depreciation) in the Statement of Operations. The commissions paid to these affiliated firms were $318 for the period.
Other. During the period, the investment adviser reimbursed the Fund for certain losses in the amount of $8,890.
6. Committed Line of Credit.
The Fund participates with other funds managed by the investment adviser or an affiliate in a $4.25 billion credit facility (the "line of credit") to be utilized for temporary or emergency purposes to fund shareholder redemptions or for other short-term liquidity purposes. The Fund has agreed to pay commitment fees on its pro-rata portion of the line of credit, which amounted to $1,034 and is reflected in Miscellaneous expenses on the Statement of Operations. During the period, the Fund did not borrow on this line of credit.
7. Security Lending.
The Fund lends portfolio securities through a lending agent from time to time in order to earn additional income. For equity securities, a lending agent is used and may loan securities to certain qualified borrowers, including Fidelity Capital Markets (FCM), a
Annual Report
7. Security Lending - continued
broker-dealer affiliated with the Fund. On the settlement date of the loan, the Fund receives collateral (in the form of U.S. Treasury obligations, letters of credit and/or cash) against the loaned securities and maintains collateral in an amount not less than 100% of the market value of the loaned securities during the period of the loan. The market value of the loaned securities is determined at the close of business of the Fund and any additional required collateral is delivered to the Fund on the next business day. The Fund or borrower may terminate the loan at any time, and if the borrower defaults on its obligation to return the securities loaned because of insolvency or other reasons, the Fund may apply collateral received from the borrower against the obligation. The Fund may experience delays and costs in recovering the securities loaned. Any cash collateral received is invested in the Fidelity Securities Lending Cash Central Fund. The value of loaned securities and cash collateral at period end are disclosed on the Fund's Statement of Assets and Liabilities. Security lending income represents the income earned on investing cash collateral, less rebates paid to borrowers and any lending agent fees associated with the loan, plus any premium payments received for lending certain types of securities. Security lending income is presented in the Statement of Operations as a component of income from Fidelity Central Funds. Total security lending income during the period amounted to $43,254. During the period, there were no securities loaned to FCM.
8. Expense Reductions.
Commissions paid to certain brokers with whom the investment adviser, or its affiliates, places trades on behalf of the Fund include an amount in addition to trade execution, which may be rebated back to the Fund to offset certain expenses. This amount totaled $29,791 for the period.
In addition, during the period the investment adviser reimbursed and/or waived a portion of fund-level operating expenses in the amount of $3,109 and a portion of class-level operating expenses as follows:
| Amount |
Class A | $ 113 |
Class T | 25 |
Class B | 1 |
Class C | 24 |
International Small Cap Opportunities | 12,565 |
Class I | 454 |
| $ 13,182 |
Annual Report
Notes to Financial Statements - continued
9. Distributions to Shareholders.
Distributions to shareholders of each class were as follows:
Years ended October 31, | 2015 | 2014 |
From net investment income | | |
Class A | $ 91,925 | $ 88,584 |
Class T | 4,261 | 17,038 |
International Small Cap Opportunities | 3,599,410 | 3,435,414 |
Class I | 286,715 | 39,565 |
Total | $ 3,982,311 | $ 3,580,601 |
From net realized gain | | |
Class A | $ 38,609 | $ 127,238 |
Class T | 14,913 | 56,084 |
Class C | - | 33,933 |
International Small Cap Opportunities | 839,863 | 2,982,391 |
Class I | 56,271 | 33,974 |
Total | $ 949,656 | $ 3,233,620 |
10. Share Transactions.
Share transactions for each class were as follows and may contain automatic conversions between classes or exchanges between funds:
| Shares | Dollars |
Years ended October 31, | 2015 | 2014 | 2015 | 2014 |
Class A | | | | |
Shares sold | 1,605,762 | 589,478 | $ 23,674,805 | $ 8,266,636 |
Reinvestment of distributions | 9,185 | 14,226 | 124,545 | 191,200 |
Shares redeemed | (582,997) | (381,134) | (8,244,833) | (5,353,937) |
Net increase (decrease) | 1,031,950 | 222,570 | $ 15,554,517 | $ 3,103,899 |
Class T | | | | |
Shares sold | 309,765 | 159,216 | $ 4,543,322 | $ 2,266,530 |
Reinvestment of distributions | 1,404 | 5,309 | 18,926 | 70,882 |
Shares redeemed | (134,926) | (142,062) | (1,907,198) | (1,989,964) |
Net increase (decrease) | 176,243 | 22,463 | $ 2,655,050 | $ 347,448 |
Class B | | | | |
Shares sold | 9,791 | 1,461 | $ 136,845 | $ 20,212 |
Shares redeemed | (23,615) | (51,497) | (329,326) | (706,187) |
Net increase (decrease) | (13,824) | (50,036) | $ (192,481) | $ (685,975) |
Class C | | | | |
Shares sold | 838,785 | 200,445 | $ 12,019,463 | $ 2,745,030 |
Reinvestment of distributions | - | 2,336 | - | 30,621 |
Shares redeemed | (258,762) | (172,604) | (3,578,649) | (2,374,401) |
Net increase (decrease) | 580,023 | 30,177 | $ 8,440,814 | $ 401,250 |
Annual Report
10. Share Transactions - continued
| Shares | Dollars |
Years ended October 31, | 2015 | 2014 | 2015 | 2014 |
International Small Cap Opportunities | | | | |
Shares sold | 18,903,102 | 13,421,171 | $ 282,906,392 | $ 191,269,160 |
Reinvestment of distributions | 239,997 | 360,554 | 3,280,752 | 4,881,895 |
Shares redeemed | (10,354,861) | (8,930,544) | (146,998,081) | (127,222,877) |
Net increase (decrease) | 8,788,238 | 4,851,181 | $ 139,189,063 | $ 68,928,178 |
Class I | | | | |
Shares sold | 7,108,830 | 2,469,158 | $ 102,023,907 | $ 34,766,175 |
Reinvestment of distributions | 23,468 | 4,980 | 320,812 | 67,530 |
Shares redeemed | (1,195,608) | (724,026) | (17,368,101) | (9,726,800) |
Net increase (decrease) | 5,936,690 | 1,750,112 | $ 84,976,618 | $ 25,106,905 |
11. Other.
The Fund's organizational documents provide former and current trustees and officers with a limited indemnification against liabilities arising in connection with the performance of their duties to the Fund. In the normal course of business, the Fund may also enter into contracts that provide general indemnifications. The Fund's maximum exposure under these arrangements is unknown as this would be dependent on future claims that may be made against the Fund. The risk of material loss from such claims is considered remote.
Annual Report
To the Trustees of Fidelity Investment Trust and Shareholders of Fidelity International Small Cap Opportunities Fund:
We have audited the accompanying statement of assets and liabilities of Fidelity International Small Cap Opportunities Fund (the Fund), a fund of Fidelity Investment Trust, including the schedule of investments, as of October 31, 2015, and the related statement of operations for the year then ended, the statement of changes in net assets for each of the two years in the period then ended, and the financial highlights for each of the five years in the period then ended. These financial statements and financial highlights are the responsibility of the Fund's management. Our responsibility is to express an opinion on these financial statements and financial highlights based on our audits.
We conducted our audits in accordance with the standards of the Public Company Accounting Oversight Board (United States). Those standards require that we plan and perform the audit to obtain reasonable assurance about whether the financial statements and financial highlights are free of material misstatement. The Fund is not required to have, nor were we engaged to perform, an audit of its internal control over financial reporting. Our audits included consideration of internal control over financial reporting as a basis for designing audit procedures that are appropriate in the circumstances, but not for the purpose of expressing an opinion on the effectiveness of the Fund's internal control over financial reporting. Accordingly, we express no such opinion. An audit also includes examining, on a test basis, evidence supporting the amounts and disclosures in the financial statements, assessing the accounting principles used and significant estimates made by management, as well as evaluating the overall financial statement presentation. Our procedures included confirmation of securities owned as of October 31, 2015, by correspondence with the custodians and brokers; when replies were not received from brokers, we performed other auditing procedures. We believe that our audits provide a reasonable basis for our opinion.
In our opinion, such financial statements and financial highlights referred to above present fairly, in all material respects, the financial position of Fidelity International Small Cap Opportunities Fund as of October 31, 2015, the results of its operations for the year then ended, the changes in its net assets for each of the two years in the period then ended, and the financial highlights for each of the five years in the period then ended, in conformity with accounting principles generally accepted in the United States of America.
DELOITTE & TOUCHE LLP
Boston, Massachusetts
December 16, 2015
Annual Report
The Trustees, Member of the Advisory Board, and officers of the trust and fund, as applicable, are listed below. The Board of Trustees governs the fund and is responsible for protecting the interests of shareholders. The Trustees are experienced executives who meet periodically throughout the year to oversee the fund's activities, review contractual arrangements with companies that provide services to the fund, oversee management of the risks associated with such activities and contractual arrangements, and review the fund's performance. Each of the Trustees oversees 170 funds.
The Trustees hold office without limit in time except that (a) any Trustee may resign; (b) any Trustee may be removed by written instrument, signed by at least two-thirds of the number of Trustees prior to such removal; (c) any Trustee who requests to be retired or who has become incapacitated by illness or injury may be retired by written instrument signed by a majority of the other Trustees; and (d) any Trustee may be removed at any special meeting of shareholders by a two-thirds vote of the outstanding voting securities of the trust. Each Trustee who is not an interested person (as defined in the 1940 Act) of the trust and the fund (Independent Trustee), shall retire not later than the last day of the calendar year in which his or her 75th birthday occurs. The Independent Trustees may waive this mandatory retirement age policy with respect to individual Trustees. The officers and Advisory Board Member hold office without limit in time, except that any officer and Advisory Board Member may resign or may be removed by a vote of a majority of the Trustees at any regular meeting or any special meeting of the Trustees. Except as indicated, each individual has held the office shown or other offices in the same company for the past five years.
Experience, Skills, Attributes, and Qualifications of the Fund's Trustees. The Governance and Nominating Committee has adopted a statement of policy that describes the experience, qualifications, attributes, and skills that are necessary and desirable for potential Independent Trustee candidates (Statement of Policy). The Board believes that each Trustee satisfied at the time he or she was initially elected or appointed a Trustee, and continues to satisfy, the standards contemplated by the Statement of Policy. The Governance and Nominating Committee also engages professional search firms to help identify potential Independent Trustee candidates who have the experience, qualifications, attributes, and skills consistent with the Statement of Policy. From time to time, additional criteria based on the composition and skills of the current Independent Trustees, as well as experience or skills that may be appropriate in light of future changes to board composition, business conditions, and regulatory or other developments, have also been considered by the professional search firms and the Governance and Nominating Committee. In addition, the Board takes into account the Trustees' commitment and participation in Board and committee meetings, as well as their leadership of standing and ad hoc committees throughout their tenure.
In determining that a particular Trustee was and continues to be qualified to serve as a Trustee, the Board has considered a variety of criteria, none of which, in isolation, was controlling. The Board believes that, collectively, the Trustees have balanced and diverse experience, qualifications, attributes, and skills, which allow the Board to operate effectively in governing the fund and protecting the interests of shareholders. Information about the specific experience, skills, attributes, and qualifications of each Trustee, which in each case led to the Board's conclusion that the Trustee should serve (or continue to serve) as a trustee of the fund, is provided below.
Annual Report
Board Structure and Oversight Function. James C. Curvey is an interested person (as defined in the 1940 Act) and currently serves as Chairman. The Trustees have determined that an interested Chairman is appropriate and benefits shareholders because an interested Chairman has a personal and professional stake in the quality and continuity of services provided to the fund. Independent Trustees exercise their informed business judgment to appoint an individual of their choosing to serve as Chairman, regardless of whether the Trustee happens to be independent or a member of management. The Independent Trustees have determined that they can act independently and effectively without having an Independent Trustee serve as Chairman and that a key structural component for assuring that they are in a position to do so is for the Independent Trustees to constitute a substantial majority for the Board. The Independent Trustees also regularly meet in executive session. Ned C. Lautenbach serves as Chairman of the Independent Trustees and as such (i) acts as a liaison between the Independent Trustees and management with respect to matters important to the Independent Trustees and (ii) with management prepares agendas for Board meetings.
Fidelity funds are overseen by different Boards of Trustees. The fund's Board oversees Fidelity's high income and certain equity funds, and other Boards oversee Fidelity's investment-grade bond, money market, asset allocation, and sector funds. The asset allocation funds may invest in Fidelity funds overseen by the fund's Board. The use of separate Boards, each with its own committee structure, allows the Trustees of each group of Fidelity funds to focus on the unique issues of the funds they oversee, including common research, investment, and operational issues. On occasion, the separate Boards establish joint committees to address issues of overlapping consequences for the Fidelity funds overseen by each Board.
The Trustees operate using a system of committees to facilitate the timely and efficient consideration of all matters of importance to the Trustees, the fund, and fund shareholders and to facilitate compliance with legal and regulatory requirements and oversight of the fund's activities and associated risks. The Board, acting through its committees, has charged FMR and its affiliates with (i) identifying events or circumstances the occurrence of which could have demonstrably adverse effects on the fund's business and/or reputation; (ii) implementing processes and controls to lessen the possibility that such events or circumstances occur or to mitigate the effects of such events or circumstances if they do occur; and (iii) creating and maintaining a system designed to evaluate continuously business and market conditions in order to facilitate the identification and implementation processes described in (i) and (ii) above. Because the day-to-day operations and activities of the fund are carried out by or through FMR, its affiliates and other service providers, the fund's exposure to risks is mitigated but not eliminated by the processes overseen by the Trustees. While each of the Board's committees has responsibility for overseeing different aspects of the fund's activities, oversight is exercised primarily through the Operations, Audit, and Compliance Committees. In addition, the Independent Trustees have worked with FMR to enhance the Board's oversight of investment and financial risks, legal and regulatory risks, technology risks, and operational risks, including the development of additional risk reporting to the Board. For example, a working group comprised of Independent Trustees and FMR has worked and continues to work to review the Fidelity funds' valuation-related activities, reporting and risk management. Appropriate personnel, including but not limited to the fund's Chief Compliance Officer (CCO), FMR's internal auditor, the independent accountants, the fund's Treasurer and portfolio management personnel, make periodic reports to the Board's committees, as appropriate, including an annual review of Fidelity's risk management program for the Fidelity funds. The responsibilities of each standing committee, including their oversight responsibilities, are described further under "Standing Committees of the Fund's Trustees."
Annual Report
Trustees and Officers - continued
The fund's Statement of Additional Information (SAI) includes more information about the Trustees. To request a free copy, call Fidelity at 1-877-208-0098.
Interested Trustees*:
Correspondence intended for each Trustee who is an interested person may be sent to Fidelity Investments, 245 Summer Street, Boston, Massachusetts 02210.
Name, Year of Birth; Principal Occupations and Other Relevant Experience+ |
James C. Curvey (1935) |
Year of Election or Appointment: 2007 Trustee Chairman of the Board of Trustees |
| Mr. Curvey also serves as Trustee of other Fidelity funds. Mr. Curvey is a Director of Fidelity Research & Analysis Co. (investment adviser firm, 2009-present), and Vice Chairman (2007-present) and Director of FMR LLC (diversified financial services company). In addition, Mr. Curvey serves as an Overseer for the Boston Symphony Orchestra and a member of the board of Artis-Naples, Naples, Florida, and as a Trustee for Brewster Academy, Wolfeboro, New Hampshire. Previously, Mr. Curvey served as a Director of Fidelity Investments Money Management, Inc. (investment adviser firm, 2009-2014) and a Director of FMR and FMR Co., Inc. (investment adviser firms, 2007-2014). |
Charles S. Morrison (1960) |
Year of Election or Appointment: 2014 Trustee |
| Mr. Morrison also serves as Trustee of other funds. He serves as a Director of Fidelity Investments Money Management, Inc. (FIMM) (investment adviser firm, 2014-present), Director of Fidelity SelectCo, LLC (investment adviser firm, 2014-present), President, Asset Management (2014-present), and is an employee of Fidelity Investments. Previously, Mr. Morrison served as Vice President of Fidelity's Fixed Income and Asset Allocation Funds (2012-2014), President, Fixed Income (2011-2014), Vice President of Fidelity's Money Market Funds (2005-2009), President, Money Market Group Leader of FMR (investment adviser firm, 2009), and Senior Vice President, Money Market Group of FMR (2004-2009). Mr. Morrison also served as Vice President of Fidelity's Bond Funds (2002-2005), certain Balanced Funds (2002-2005), and certain Asset Allocation Funds (2002-2007), and as Senior Vice President (2002-2005) of Fidelity's Bond Division. |
* Trustees have been determined to be "Interested Trustees" by virtue of, among other things, their affiliation with the trust or various entities under common control with FMR.
+ The information above includes each Trustee's principal occupation during the last five years and other information relating to the experience, attributes, and skills relevant to each Trustee's qualifications to serve as a Trustee, which led to the conclusion that each Trustee should serve as a Trustee for the fund.
Annual Report
Trustees and Officers - continued
Independent Trustees:
Correspondence intended for each Independent Trustee (that is, the Trustees other than the Interested Trustees) may be sent to Fidelity Investments, P.O. Box 55235, Boston, Massachusetts 02205-5235.
Name, Year of Birth; Principal Occupations and Other Relevant Experience+ |
Dennis J. Dirks (1948) |
Year of Election or Appointment: 2005 Trustee |
| Mr. Dirks also serves as Trustee of other Fidelity funds. Prior to his retirement in May 2003, Mr. Dirks was Chief Operating Officer and a member of the Board of The Depository Trust & Clearing Corporation (DTCC). He also served as President, Chief Operating Officer, and Board member of The Depository Trust Company (DTC) and President and Board member of the National Securities Clearing Corporation (NSCC). In addition, Mr. Dirks served as Chief Executive Officer and Board member of the Government Securities Clearing Corporation, Chief Executive Officer and Board member of the Mortgage-Backed Securities Clearing Corporation, as a Trustee and a member of the Finance Committee of Manhattan College (2005-2008), as a Trustee and a member of the Finance Committee of AHRC of Nassau County (2006-2008), and as a member of the Independent Directors Council (IDC) Governing Council (2010-2015). Mr. Dirks is a member of the Board of Directors for The Brookville Center for Children's Services, Inc. (2009-present). |
Alan J. Lacy (1953) |
Year of Election or Appointment: 2008 Trustee |
| Mr. Lacy also serves as Trustee of other Fidelity funds. Mr. Lacy serves as a member of the Board of Directors of Dave & Buster's Entertainment, Inc. (restaurant and entertainment complexes, 2010-present) and Bristol-Myers Squibb Company (global pharmaceuticals, 2008-present). In addition, Mr. Lacy served as Senior Adviser (2007-2014) of Oak Hill Capital Partners, L.P. (private equity) and also served as Chief Executive Officer (2000-2005) and Vice Chairman (2005-2006) of Sears Holdings Corporation and Sears, Roebuck and Co. (retail). Mr. Lacy is a member of the Board of Trustees of The National Parks Conservation Association (2006-present). Previously, Mr. Lacy served as Chairman of the Board of Trustees of the National Parks Conservation Association (2008-2011) and as a member of the Board of Directors for The Western Union Company (global money transfer, 2006-2011), The Hillman Companies, Inc. (hardware wholesalers, 2010-2014), and Earth Fare, Inc. (retail grocery, 2010-2014). |
Ned C. Lautenbach (1944) |
Year of Election or Appointment: 2000 Trustee Chairman of the Independent Trustees |
| Mr. Lautenbach also serves as Trustee of other Fidelity funds. Mr. Lautenbach currently serves as the Lead Director of the Eaton Corporation Board of Directors (diversified industrial, 1997-present). Mr. Lautenbach is Chairman of the Board of Directors of Artis-Naples in Naples, Florida (2012-present), a member of the Council on Foreign Relations (1994-present), and a member of the Board of Governors, State University System of Florida (2013-present). Previously, Mr. Lautenbach was a Partner/Advisory Partner at Clayton, Dubilier & Rice, LLC (private equity investment, 1998-2010), as well as a Director of Sony Corporation (2006-2007). |
Joseph Mauriello (1944) |
Year of Election or Appointment: 2008 Trustee |
| Mr. Mauriello also serves as Trustee of other Fidelity funds. Prior to his retirement in January 2006, Mr. Mauriello served in numerous senior management positions including Deputy Chairman and Chief Operating Officer (2004-2005), and Vice Chairman of Financial Services (2002-2004) of KPMG LLP US (professional services, 1965-2005). Mr. Mauriello currently serves as a member of the Board of Directors of XL Group plc. (global insurance and re-insurance, 2006-present) and the Independent Directors Council (IDC) Governing Council (2015-present). Previously, Mr. Mauriello served as a Director of the Hamilton Funds of the Bank of New York (2006-2007) and of Arcadia Resources Inc. (health care services and products, 2007-2012). |
Robert W. Selander (1950) |
Year of Election or Appointment: 2011 Trustee |
| Mr. Selander also serves as Trustee of other Fidelity funds. Mr. Selander serves as a Director of The Western Union Company (global money transfer, 2014-present). Previously, Mr. Selander served as a Member of the Advisory Board of other Fidelity funds (2011), and Executive Vice Chairman (2010), Chief Executive Officer (2009-2010), and President and Chief Executive Officer (1997-2009) of Mastercard, Inc. |
Cornelia M. Small (1944) |
Year of Election or Appointment: 2005 Trustee |
| Ms. Small also serves as Trustee of other Fidelity funds. Ms. Small is a member of the Board of Directors (2009-present) and Chair of the Investment Committee (2010-present) of the Teagle Foundation. Ms. Small also serves on the Investment Committee of the Berkshire Taconic Community Foundation (2008-present). Previously, Ms. Small served as Chairperson (2002-2008) and a member of the Investment Committee and Chairperson (2008-2012) and a member of the Board of Trustees of Smith College. In addition, Ms. Small served as Chief Investment Officer, Director of Global Equity Investments, and a member of the Board of Directors of Scudder, Stevens & Clark and Scudder Kemper Investments. |
William S. Stavropoulos (1939) |
Year of Election or Appointment: 2001 Trustee Vice Chairman of the Independent Trustees |
| Mr. Stavropoulos also serves as Trustee of other Fidelity funds. Mr. Stavropoulos serves as President and Founder of the Michigan Baseball Foundation, the Great Lakes Loons (2007-present). Mr. Stavropoulos is Chairman Emeritus of the Board of Directors of The Dow Chemical Company, where he previously served in numerous senior management positions, including President, CEO (1995-2000; 2002-2004), Chairman of the Executive Committee (2000-2006), and as a member of the Board of Directors (1990-2006). Currently, Mr. Stavropoulos is Chairman of the Board of Directors of Univar Inc. (global distributor of commodity and specialty chemicals), a Director of Teradata Corporation (data warehousing and technology solutions), and Maersk Inc. (industrial conglomerate), and a member of the Advisory Board for Metalmark Capital LLC (private equity investment, 2005-present). Mr. Stavropoulos is an operating advisor to Clayton, Dubilier & Rice, LLC (private equity investment). In addition, Mr. Stavropoulos is a member of the University of Notre Dame Advisory Council for the College of Science, a Trustee of the Rollin L. Gerstacker Foundation, and a Director of the Naples Philharmonic Center for the Arts. Previously, Mr. Stavropoulos served as a Director of Chemical Financial Corporation (bank holding company, 1993-2012) and Tyco International, Ltd. (multinational manufacturing and services, 2007-2012). |
David M. Thomas (1949) |
Year of Election or Appointment: 2008 Trustee |
| Mr. Thomas also serves as Trustee of other Fidelity funds. Mr. Thomas serves as Non-Executive Chairman of the Board of Directors of Fortune Brands Home and Security (home and security products, 2011-present), as a member of the Board of Directors (2004-present) and Presiding Director (2013-present) of Interpublic Group of Companies, Inc. (marketing communication), and as a member of the Board of Trustees of the University of Florida (2013-present). Previously, Mr. Thomas served as Executive Chairman (2005-2006) and Chairman and Chief Executive Officer (2000-2005) of IMS Health, Inc. (pharmaceutical and healthcare information solutions), and a Director of Fortune Brands, Inc. (consumer products, 2000-2011). |
+ The information above includes each Trustee's principal occupation during the last five years and other information relating to the experience, attributes, and skills relevant to each Trustee's qualifications to serve as a Trustee, which led to the conclusion that each Trustee should serve as a Trustee for the fund.
Advisory Board Member and Officers:
Correspondence intended for each officer and Peter S. Lynch may be sent to Fidelity Investments, 245 Summer Street, Boston, Massachusetts 02210. Officers appear below in alphabetical order.
Name, Year of Birth; Principal Occupation |
Peter S. Lynch (1944) |
Year of Election or Appointment: 2003 Member of the Advisory Board |
| Mr. Lynch also serves as Member of the Advisory Board of other Fidelity funds. Mr. Lynch is Vice Chairman and a Director of FMR (investment adviser firm) and FMR Co., Inc. (investment adviser firm). In addition, Mr. Lynch serves as a Trustee of Boston College and as the Chairman of the Inner-City Scholarship Fund. Previously, Mr. Lynch served on the Special Olympics International Board of Directors (1997-2006). |
Elizabeth Paige Baumann (1968) |
Year of Election or Appointment: 2012 Anti-Money Laundering (AML) Officer |
| Ms. Baumann also serves as AML Officer of other funds. She is Chief AML Officer of FMR LLC (diversified financial services company, 2012-present) and is an employee of Fidelity Investments. Previously, Ms. Baumann served as Vice President and Deputy Anti-Money Laundering Officer (2007-2012). |
Marc R. Bryant (1966) |
Year of Election or Appointment: 2015 Secretary and Chief Legal Officer (CLO) |
| Mr. Bryant also serves as Secretary and CLO of other funds. Mr. Bryant serves as CLO, Secretary, and Senior Vice President of Fidelity Management & Research Company (investment adviser firm, 2015-present) and FMR Co., Inc. (investment adviser firm, 2015-present); Secretary of Fidelity SelectCo, LLC (investment adviser firm, 2015-present) and Fidelity Investments Money Management, Inc. (investment adviser firm, 2015-present); and CLO of Fidelity Management & Research (Hong Kong) Limited (investment adviser firm, 2015-present). He is Senior Vice President and Deputy General Counsel of FMR LLC (diversified financial services company). Previously, Mr. Bryant served as Secretary and Chief Legal Officer of Fidelity Rutland Square Trust II (2010-2014) and Assistant Secretary of Fidelity's Fixed Income and Asset Allocation Funds (2013-2015). Prior to joining Fidelity Investments, Mr. Bryant served as a Senior Vice President and the Head of Global Retail Legal for AllianceBernstein L.P. (2006-2010), and as the General Counsel for ProFund Advisors LLC (2001-2006). |
William C. Coffey (1969) |
Year of Election or Appointment: 2009 Assistant Secretary |
| Mr. Coffey also serves as Assistant Secretary of other funds. He is Senior Vice President and Deputy General Counsel of FMR LLC (diversified financial services company, 2010-present), and is an employee of Fidelity Investments. Previously, Mr. Coffey served as Vice President and Associate General Counsel of FMR LLC (2005-2009). |
Timothy M. Cohen (1969) |
Year of Election or Appointment: 2014 Vice President of certain Equity Funds |
| Mr. Cohen also serves as Vice President of other funds. Mr. Cohen serves as Chief Compliance Officer of FMR Investment Management (U.K.) Limited (investment adviser firm, 2013-present) and is an employee of Fidelity Investments. Previously, Mr. Cohen served as a Director of FMR Investment Management (U.K.) Limited (2013-2015). |
Jonathan Davis (1968) |
Year of Election or Appointment: 2010 Assistant Treasurer |
| Mr. Davis also serves as Assistant Treasurer of other funds, and is an employee of Fidelity Investments. Previously, Mr. Davis served as Vice President and Associate General Counsel of FMR LLC (diversified financial services company, 2003-2010). |
Adrien E. Deberghes (1967) |
Year of Election or Appointment: 2008 Deputy Treasurer |
| Mr. Deberghes also serves as an officer of other funds. He is an employee of Fidelity Investments (2008-present). Prior to joining Fidelity Investments, Mr. Deberghes was Senior Vice President of Mutual Fund Administration at State Street Corporation (2007-2008), Senior Director of Mutual Fund Administration at Investors Bank & Trust (2005-2007), and Director of Finance for Dunkin' Brands (2000-2005). |
Stephanie J. Dorsey (1969) |
Year of Election or Appointment: 2010 Assistant Treasurer |
| Ms. Dorsey also serves as an officer of other funds. She is an employee of Fidelity Investments (2008-present) and has served in other fund officer roles. Prior to joining Fidelity Investments, Ms. Dorsey served as Treasurer (2004-2008) of the JPMorgan Mutual Funds and Vice President (2004-2008) of JPMorgan Chase Bank. |
Howard J. Galligan III (1966) |
Year of Election or Appointment: 2014 Chief Financial Officer |
| Mr. Galligan also serves as Chief Financial Officer of other funds. Mr. Galligan serves as President of Fidelity Pricing and Cash Management Services (FPCMS) (2014-present) and as a Director of Strategic Advisers, Inc. (investment adviser firm, 2008-present). Previously, Mr. Galligan served as Chief Administrative Officer of Asset Management (2011-2014) and Chief Operating Officer and Senior Vice President of Investment Support for Strategic Advisers, Inc. (2003-2011). |
Scott C. Goebel (1968) |
Year of Election or Appointment: 2015 Vice President |
| Mr. Goebel serves as Vice President of other funds and is an employee of Fidelity Investments (2001-present). Previously, Mr. Goebel served as Secretary of Fidelity SelectCo, LLC (investment adviser firm, 2013-2015), Fidelity Investments Money Management, Inc. (FIMM) (investment adviser firm, 2010-2015), and Fidelity Research and Analysis Company (FRAC) (investment adviser firm, 2010-2015); General Counsel, Secretary, and Senior Vice President of Fidelity Management & Research Company (investment adviser firm, 2008-2015) and FMR Co., Inc. (investment adviser firm, 2008-2015); Assistant Secretary of Fidelity Management & Research (Japan) Limited (investment adviser firm, 2008-2015) and FMR Investment Management (U.K.) Limited (investment adviser firm, 2008-2015); Chief Legal Officer (CLO) of Fidelity Management & Research (Hong Kong) Limited (investment adviser firm, 2008-2015); Secretary and CLO of certain Fidelity funds (2008-2015); Assistant Secretary of FIMM (2008-2010), FRAC (2008-2010), and certain funds (2007-2008); and as Vice President and Secretary of Fidelity Distributors Corporation (FDC) (2005-2007). |
Brian B. Hogan (1964) |
Year of Election or Appointment: 2009 Vice President |
| Mr. Hogan also serves as Trustee or Vice President of other funds. Mr. Hogan serves as a Director of Fidelity SelectCo, LLC (investment adviser firm, 2014-present) and President of the Equity Division of FMR (investment adviser firm, 2009-present). Previously, Mr. Hogan served as Senior Vice President, Equity Research of FMR (2006-2009) and as a portfolio manager. |
Chris Maher (1972) |
Year of Election or Appointment: 2013 Assistant Treasurer |
| Mr. Maher serves as Assistant Treasurer of other funds. Mr. Maher is Vice President of Valuation Oversight and is an employee of Fidelity Investments. Previously, Mr. Maher served as Vice President of Asset Management Compliance (2013), Vice President of the Program Management Group of FMR (investment adviser firm, 2010-2013), and Vice President of Valuation Oversight (2008-2010). |
Kenneth B. Robins (1969) |
Year of Election or Appointment: 2008 President and Treasurer |
| Mr. Robins also serves as an officer of other funds. Mr. Robins serves as Executive Vice President of Fidelity Investments Money Management, Inc. (FIMM) (investment adviser firm, 2013-present) and is an employee of Fidelity Investments (2004-present). Previously, Mr. Robins served in other fund officer roles. |
Stacie M. Smith (1974) |
Year of Election or Appointment: 2013 Deputy Treasurer |
| Ms. Smith also serves as an officer of other funds. She is an employee of Fidelity Investments (2009-present) and has served in other fund officer roles. Prior to joining Fidelity Investments, Ms. Smith served as Senior Audit Manager of Ernst & Young LLP (1996-2009). |
Renee Stagnone (1975) |
Year of Election or Appointment: 2013 Deputy Treasurer |
| Ms. Stagnone also serves as Deputy Treasurer of other funds. Ms. Stagnone is an employee of Fidelity Investments (1997-present). |
Linda J. Wondrack (1964) |
Year of Election or Appointment: 2014 Chief Compliance Officer |
| Ms. Wondrack also serves as Chief Compliance Officer of other funds. Ms. Wondrack is Executive Vice President and head of the Ethics Office and Asset Management Compliance for Fidelity Investments (2012-present). Ms. Wondrack also serves as Chief Compliance Officer of Fidelity SelectCo, LLC (investment adviser firm, 2014-present); Chief Compliance Officer of Impresa Management LLC (2013-present); and Chief Compliance Officer of FMR Co., Inc. (investment adviser firm), Fidelity Investments Money Management, Inc. (investment adviser firm), Fidelity Management & Research (Japan) Limited (investment adviser firm), FMR Investment Management (U.K.) Limited (investment adviser firm), Fidelity Management & Research (Hong Kong) (investment adviser firm), Fidelity Management & Research Company (investment adviser firm), FIAM LLC (investment adviser firm), and Strategic Advisers, Inc. (investment adviser firm), Ballyrock Investment Advisors LLC, and Northern Neck Investors LLC (2012-present). Previously, Ms. Wondrack served as Senior Vice President and Chief Compliance Officer for Columbia Management Investment Advisers, LLC (2005-2012); Chief Compliance Officer for certain funds within the Columbia Family of Funds (2007-2012); and Senior Vice President of Compliance Risk Management at Bank of America (2005-2010). |
Joseph F. Zambello (1957) |
Year of Election or Appointment: 2011 Deputy Treasurer |
| Mr. Zambello also serves as Deputy Treasurer of other funds. Mr. Zambello is an employee of Fidelity Investments (1991-present). Previously, Mr. Zambello served as Vice President of the Program Management Group of FMR (investment adviser firm, 2009-2011) and Vice President of the Transfer Agent Oversight Group (2005-2009). |
Annual Report
The Board of Trustees of Advisor International Small Cap Opportunities Fund voted to pay to shareholders of record at the opening of business on record date, the following distributions per share derived from capital gains realized from sales of portfolio securities, and dividends derived from net investment income:
| Pay Date | Record Date | Dividends | Capital Gains |
Class I | 12/07/15 | 12/04/15 | $0.083 | $0.070 |
Class I designates 8% of the dividends distributed in December 2014 during the fiscal year as qualifying for the dividends-received deduction for corporate shareholders.
Class I designates 100% of the dividends distributed in December 2014 during the fiscal year as amounts which may be taken into account as a dividend for purposes of the maximum rate under section 1(h) (11) of the Internal Revenue Code.
The amounts per share which represent income derived from sources within, and taxes paid to, foreign countries or possessions of the United States are as follows:
| Pay Date | Income | Taxes |
Class I | 12/08/2014 | $0.1499 | $0.0219 |
The fund will notify shareholders in January 2016 of amounts for use in preparing 2015 income tax returns.
Annual Report
Fidelity International Small Cap Opportunities Fund
Each year, the Board of Trustees, including the Independent Trustees (together, the Board), votes on the renewal of the management contract with Fidelity Management & Research Company (FMR) and the sub-advisory agreements (together, the Advisory Contracts) for the fund. The Board, assisted by the advice of fund counsel and Independent Trustees' counsel, requests and considers a broad range of information relevant to the renewal of the Advisory Contracts throughout the year.
The Board meets regularly and, at each of its meetings, covers an extensive agenda of topics and materials and considers factors that are relevant to its annual consideration of the renewal of the fund's Advisory Contracts, including the services and support provided to the fund and its shareholders. The Board has established various standing committees (Committees), each composed of and chaired by Independent Trustees with varying backgrounds, to which the Board has assigned specific subject matter responsibilities in order to enhance effective decision-making by the Board. The Board, acting directly and through its Committees, requests and receives information concerning the annual consideration of the renewal of the fund's Advisory Contracts. The Board also meets as needed to consider matters specifically related to the Board's annual consideration of the renewal of the Advisory Contracts. Members of the Board may also meet with trustees of other Fidelity funds through ad hoc joint committees to discuss certain matters relevant to all of the Fidelity funds.
At its July 2015 meeting, the Board unanimously determined to renew the fund's Advisory Contracts. In reaching its determination, the Board considered all factors it believed relevant, including (i) the nature, extent, and quality of the services to be provided to the fund and its shareholders (including the investment performance of the fund); (ii) the competitiveness of the fund's management fee and total expense ratio relative to peer funds; (iii) the total costs of the services to be provided by and the profits to be realized by Fidelity from its relationship with the fund; and (iv) the extent to which (if any) economies of scale exist and would be realized as the fund grows, and whether any economies of scale are appropriately shared with fund shareholders.
In considering whether to renew the Advisory Contracts for the fund, the Board reached a determination, with the assistance of fund counsel and Independent Trustees' counsel and through the exercise of its business judgment, that the renewal of the Advisory Contracts was in the best interests of the fund and its shareholders and that the compensation payable under the Advisory Contracts was fair and reasonable. The Board's decision to renew the Advisory Contracts was not based on any single factor, but rather was based on a comprehensive consideration of all the information provided to the Board at its meetings throughout the year. The Board, in reaching its determination to renew the Advisory Contracts, was aware that shareholders of the fund have a broad range of investment choices available to them, including a wide choice among funds offered by Fidelity's competitors, and that the fund's shareholders, who have the opportunity to review and weigh the disclosure provided by the fund in its prospectus and other public disclosures, have chosen to invest in this fund, which is part of the Fidelity family of funds.
Annual Report
Nature, Extent, and Quality of Services Provided. The Board considered Fidelity's staffing as it relates to the fund, including the backgrounds of investment personnel of Fidelity, and also considered the fund's investment objective, strategies, and related investment philosophy. The Independent Trustees also had discussions with senior management of Fidelity's investment operations and investment groups. The Board considered the structure of the portfolio manager compensation program and whether this structure provides appropriate incentives to act in the best interests of the fund. Additionally, the Board considered the portfolio managers' investments, if any, in the funds that they manage.
Resources Dedicated to Investment Management and Support Services. The Board and the Fund Oversight and Research Committees reviewed the general qualifications and capabilities of Fidelity's investment staff, including its size, education, experience, and resources, as well as Fidelity's approach to recruiting, training, managing, and compensating investment personnel. The Board noted that Fidelity has continued to increase the resources devoted to non-U.S. offices, including expansion of Fidelity's global investment organization. The Board also noted that Fidelity's analysts have extensive resources, tools and capabilities that allow them to conduct sophisticated quantitative and fundamental analysis, as well as credit analysis of issuers, counterparties and guarantors. Further, the Board considered that Fidelity's investment professionals have sufficient access to global information and data so as to provide competitive investment results over time, and that those professionals also have access to sophisticated tools that permit them to assess portfolio construction and risk and performance attribution characteristics continuously, as well as to transmit new information and research conclusions rapidly around the world. Additionally, in its deliberations, the Board considered Fidelity's trading, risk management, and compliance capabilities and resources, which are integral parts of the investment management process.
Shareholder and Administrative Services. The Board considered (i) the nature, extent, quality, and cost of advisory, administrative, and shareholder services performed by FMR, the sub-advisers (together with FMR, the Investment Advisers), and their affiliates under the Advisory Contracts and under separate agreements covering transfer agency, pricing and bookkeeping, and securities lending services for the fund; (ii) the nature and extent of the supervision of third party service providers, principally custodians and subcustodians; and (iii) the resources devoted to, and the record of compliance with, the fund's compliance policies and procedures. The Board also reviewed the allocation of fund brokerage, including allocations to brokers affiliated with the Investment Advisers, the use of brokerage commissions to pay fund expenses, and the use of "soft" commission dollars to pay for research services.
Annual Report
Board Approval of Investment Advisory Contracts and
Management Fees - continued
The Board noted that the growth of fund assets over time across the complex allows Fidelity to reinvest in the development of services designed to enhance the value or convenience of the Fidelity funds as investment vehicles. These services include 24-hour access to account information and market information through telephone representatives and over the Internet, investor education materials and asset allocation tools, and the expanded availability of Fidelity Investor Centers.
In 2014, the Board formed an ad hoc Committee on Transfer Agency Fees to review the variety of transfer agency fee structures throughout the industry and Fidelity's competitive positioning with respect to industry participants.
Investment in a Large Fund Family. The Board considered the benefits to shareholders of investing in a Fidelity fund, including the benefits of investing in a fund that is part of a large family of funds offering a variety of investment disciplines and providing a large variety of mutual fund investor services. The Board noted that Fidelity had taken, or had made recommendations that resulted in the Fidelity funds taking, a number of actions over the previous year that benefited particular funds, including (i) continuing to dedicate additional resources to investment research and to the support of the senior management team that oversees asset management; (ii) continuing efforts to enhance Fidelity's global research capabilities; (iii) launching new funds and making other enhancements to meet client needs; (iv) reducing management fees and total expenses for certain index funds and diversified international funds; (v) continuing to launch dedicated lower cost underlying funds to meet portfolio construction needs related to expanding underlying fund options for Fidelity funds of funds, specifically for the Freedom Fund product lines; (vi) rationalizing product lines and gaining increased efficiencies through fund mergers; (vii) launching active fixed-income exchange-traded funds; (viii) continuing to develop, acquire and implement systems and technology to improve services to the funds and information security and to increase efficiency; (ix) implementing investment enhancements to further strengthen Fidelity's target date product line to increase investors' probability of success in achieving their goals; (x) modifying the eligibility criteria for certain share classes to accommodate roll-over assets from employer-sponsored retirement plans; (xi) launching a new Class W of the Freedom Index Funds to attract and retain Fidelity record-kept retirement plan assets; and (xii) implementing changes to Fidelity's money market product line in response to recent money market regulatory reforms.
Investment Performance. The Board considered whether the fund has operated in accordance with its investment objective, as well as its record of compliance with its investment restrictions and its performance history.
Annual Report
The Board took into account discussions with representatives of the Investment Advisers about fund investment performance that occur at Board meetings throughout the year. In this regard the Board noted that as part of regularly scheduled fund reviews and other reports to the Board on fund performance, the Board considers annualized return information for the fund, for different time periods, measured against a securities market index ("benchmark index") and a peer group of funds with similar objectives ("peer group"), if any. In its evaluation of fund investment performance, the Board gave particular attention to information indicating changes in performance of certain Fidelity funds for specific time periods and discussed with the Investment Advisers the reasons for any overperformance or underperformance.
In addition to reviewing absolute and relative fund performance, the Independent Trustees periodically consider the appropriateness of fund performance metrics in evaluating the results achieved. In general, the Independent Trustees believe that fund performance should be evaluated based on net performance (after fees and expenses) of both the highest performing and lowest performing fund share classes, where applicable, compared to appropriate benchmark indices, over appropriate time periods that may include full market cycles, and compared to peer groups, as applicable, over the same periods, taking into account relevant factors including the following: general market conditions; issuer-specific information; and fund cash flows and other factors.
The Independent Trustees recognize that shareholders evaluate performance on a net basis over their own holding periods, for which one-, three-, and five-year periods are often used as a proxy. For this reason, the performance information reviewed by the Board also included net cumulative calendar year total return information for the fund and an appropriate benchmark index and peer group for the most recent one-, three-, and five-year periods, as shown below. Returns are shown compared to the 25th percentile (top of box, 75% beaten) and 75th percentile (bottom of box, 25% beaten) of the peer universe. Returns of the benchmark index are "net MA," i.e., adjusted for tax withholding rates applicable to U.S.-based funds organized as Massachusetts business trusts.
Annual Report
Board Approval of Investment Advisory Contracts and
Management Fees - continued
Fidelity International Small Cap Opportunities Fund

The Board also considered that the fund's management fee is subject to upward or downward adjustment depending upon whether, and to what extent, the fund's investment performance for the performance period exceeds, or is exceeded by, a securities index, thus leading to a performance adjustment for the same period. The Board noted that the performance adjustment provides FMR with a strong economic incentive to seek to achieve superior performance for the fund's shareholders and helps to more closely align the interests of FMR and the shareholders of the fund.
Based on its review, the Board concluded that the nature, extent, and quality of services provided to the fund under the Advisory Contracts should benefit the shareholders of the fund.
Competitiveness of Management Fee and Total Expense Ratio. The Board considered the fund's management fee and total expense ratio compared to "mapped groups" of competitive funds and classes created for the purpose of facilitating the Trustees' competitive analysis of management fees and total expenses. Fidelity creates "mapped groups" by combining similar Lipper investment objective categories that have comparable investment mandates. Combining Lipper investment objective categories aids the Board's management fee and total expense ratio comparisons by broadening the competitive group used for comparison.
Management Fee. The Board considered two proprietary management fee comparisons for the 12-month periods shown in basis points (BP) in the chart below. The group of Lipper funds used by the Board for management fee comparisons is referred to below as the "Total Mapped Group." The Total Mapped Group is broader than the Lipper peer group used by the Board for performance comparisons because the Total Mapped Group combines several Lipper investment objective categories while the Lipper peer group does not. The Total Mapped Group comparison focuses on a fund's standing in terms of gross management fees before expense reimbursements or caps, and without giving effect to the fund's performance adjustment, relative to the total universe of funds with comparable investment mandates, regardless of whether their management fee structures also are comparable. Funds with comparable investment mandates offer exposure to similar types of securities. Funds with comparable management fee structures have similar management fee contractual arrangements (e.g., flat rate charged for advisory services, all-inclusive fee rate, etc.). "TMG %" represents the percentage of funds in the Total Mapped Group that had management fees that were lower than the fund's. For example, a hypothetical TMG % of 20% would mean that 80% of the funds in the Total Mapped Group had higher, and 20% had lower, management fees than the fund. The fund's actual TMG %s and the number of funds in the Total Mapped Group are in the chart below. The "Asset-Size Peer Group" (ASPG) comparison focuses on a fund's standing relative to a subset of non-Fidelity funds within the Total Mapped Group that are similar in size and management fee structure without taking into account performance adjustments, if any. For example, if a fund is in the first quartile of the ASPG, the fund's management fee ranks in the least expensive or lowest 25% of funds in the ASPG. The ASPG represents at least 15% of the funds in the Total Mapped Group with comparable asset size and management fee structures, subject to a minimum of 50 funds (or all funds in the Total Mapped Group if fewer than 50). Additional information, such as the ASPG quartile in which the fund's management fee rate ranked and the impact of the fund's performance adjustment, is also included in the chart and considered by the Board.
Annual Report
Fidelity International Small Cap Opportunities Fund
Annual Report

The Board noted that the fund's management fee rate ranked below the median of its Total Mapped Group and below the median of its ASPG for 2014. The Board also noted the effect of the fund's performance adjustment, if any, on the fund's management fee ranking.
The Board noted that, in 2014, the ad hoc Committee on Group Fee was formed by it and other Fidelity fund boards to conduct an in-depth review of the "group fee" component of the management fee of funds with such management fee structures. Committee focus included the mechanics of the group fee, the competitive landscape of group fee structures, Fidelity funds with no group fee component and investment products not included in group fee assets. The Board also considered that, for funds subject to the group fee, FMR agreed to voluntarily waive fees over a specified period of time in amounts designed to account for assets converted from certain funds to certain collective investment trusts.
The Board also noted that, in 2013, the ad hoc Committee on Management Fees was formed to conduct an in-depth review of the management fee rates of Fidelity's active equity mutual funds. The Committee focused on the following areas: (i) standard fee structures; (ii) research consumption and trading evolution; (iii) management fee competitiveness/profitability by category; and (iv) factors that drive institutional pricing.
Board Approval of Investment Advisory Contracts and
Management Fees - continued
Based on its review, the Board concluded that the fund's management fee is fair and reasonable in light of the services that the fund receives and the other factors considered.
Annual Report
Total Expense Ratio. In its review of each class's total expense ratio, the Board considered the fund's management fee as well as other fund or class expenses, as applicable, such as transfer agent fees, pricing and bookkeeping fees, fund-paid 12b-1 fees, and custodial, legal, and audit fees. The Board noted the impact of the fund's performance adjustment. The Board also noted that Fidelity may agree to waive fees and expenses from time to time, and the extent to which, if any, it has done so for the fund. As part of its review, the Board also considered the current and historical total expense ratios of each class of the fund compared to competitive fund median expenses. Each class of the fund is compared to those funds and classes in the Total Mapped Group (used by the Board for management fee comparisons) that have a similar sales load structure.
The Board noted that the total expense ratio of each of Class A and the retail class ranked below its competitive median for 2014 and the total expense ratio of each of Class T, Class B, Class C, and Class I ranked above its competitive median for 2014. The Board considered that, in general, various factors can affect total expense ratios. The Board noted that the total expense ratio of Class T was above the competitive median primarily because of higher 12b-1 fees on Class T as compared to most competitor funds. Class T has a higher 12b-1 fee, but a lower front-end sales charge, than traditionally priced front-end sales charge classes. The Board considered that Class T is primarily sold load-waived in the retirement plan market where its 0.50% 12b-1 fee is comparable to competing no-load, higher 12b-1 fee classes designed specifically for retirement plans. The Board noted that the fund offers multiple classes, each of which has a different sales load and 12b-1 fee structure, and that the multiple structures are intended to offer a range of pricing options for the intermediary market. The Board also noted that the total expense ratios of the classes vary primarily by the level of their 12b-1 fees, although differences in transfer agent fees may also cause expenses to vary from class to class.
Fees Charged to Other Fidelity Clients. The Board also considered Fidelity fee structures and other information with respect to clients of Fidelity, such as other funds advised or subadvised by Fidelity, pension plan clients, and other institutional clients with similar mandates. The Board noted the findings of the 2013 ad hoc joint committee (created with the board of other Fidelity funds), which reviewed and compared Fidelity's institutional investment advisory business with its business of providing services to the Fidelity funds, including the differences in services provided, fees charged, and costs incurred, as well as competition in their respective marketplaces.
Based on its review of total expense ratios and fees charged to other Fidelity clients, the Board concluded that, although in some cases above the median of the universe presented for comparison, the total expense ratio of each class of the fund was reasonable in light of the services that the fund and its shareholders receive and the other factors considered.
Annual Report
Board Approval of Investment Advisory Contracts and
Management Fees - continued
Costs of the Services and Profitability. The Board considered the revenues earned and the expenses incurred by Fidelity in conducting the business of developing, marketing, distributing, managing, administering and servicing the fund and servicing the fund's shareholders. The Board also considered the level of Fidelity's profits in respect of all the Fidelity funds.
On an annual basis, Fidelity presents to the Board information about the profitability of its relationship with the fund. Fidelity calculates profitability information for each fund, as well as aggregate profitability information for groups of Fidelity funds and all Fidelity funds, using a series of detailed revenue and cost allocation methodologies which originate with the books and records of Fidelity on which Fidelity's audited financial statements are based. The Audit Committee of the Board reviews any significant changes from the prior year's methodologies.
PricewaterhouseCoopers LLP (PwC), independent registered public accounting firm and auditor to Fidelity and certain Fidelity funds, has been engaged annually by the Board as part of the Board's assessment of Fidelity's profitability analysis. PwC's engagement includes the review and assessment of the methodologies used by Fidelity in determining the revenues and expenses attributable to Fidelity's mutual fund business, and completion of agreed-upon procedures in respect of the mathematical accuracy of fund profitability and its conformity to established allocation methodologies. After considering PwC's reports issued under the engagement and information provided by Fidelity, the Board concluded that while other allocation methods may also be reasonable, Fidelity's profitability methodologies are reasonable in all material respects.
The Board also reviewed Fidelity's non-fund businesses and fall-out benefits related to the mutual fund business as well as cases where Fidelity's affiliates may benefit from or be related to the fund's business.
The Board considered the costs of the services provided by and the profits realized by Fidelity in connection with the operation of the fund and was satisfied that the profitability was not excessive.
Economies of Scale. The Board considered whether there have been economies of scale in respect of the management of the Fidelity funds, whether the Fidelity funds (including the fund) have appropriately benefited from any such economies of scale, and whether there is potential for realization of any further economies of scale. The Board considered the extent to which the fund will benefit from economies of scale as assets grow through increased services to the fund, through waivers or reimbursements, or through fee or expense ratio reductions. The Board also noted that in 2013, it and the boards of other Fidelity funds created an ad hoc committee (the Economies of Scale Committee) to analyze whether Fidelity attains economies of scale in respect of the management and servicing of the Fidelity funds, whether the Fidelity funds have appropriately benefited from such economies of scale, and whether there is potential for realization of any further economies of scale.
Annual Report
The Board recognized that the fund's management contract incorporates a "group fee" structure, which provides for lower group fee rates as total group assets increase, and for higher group fee rates as total group assets decrease (with "group assets" defined to include fund assets under FMR's management plus sector fund assets previously under FMR's management and currently managed by Fidelity SelectCo, LLC). FMR calculates the group fee rates based on a tiered asset "breakpoint" schedule that varies based on asset class. The Board considered that the group fee is designed to deliver the benefits of economies of scale to fund shareholders when total Fidelity fund assets increase, even if assets of any particular fund are unchanged or have declined, because some portion of Fidelity's costs are attributable to services provided to all Fidelity funds, and all funds benefit if those costs can be allocated among more assets. The Board concluded that, given the group fee structure, fund shareholders will benefit from lower management fees as group assets increase at the fund complex level, regardless of whether Fidelity achieves any such economies of scale.
The Board concluded, taking into account the analysis of the Economies of Scale Committee, that economies of scale, if any, are being appropriately shared between fund shareholders and Fidelity.
Additional Information Requested by the Board. In order to develop fully the factual basis for consideration of the Fidelity funds' Advisory Contracts, the Board requested and received additional information on certain topics, including: (i) fund performance trends and Fidelity's long-term strategies for certain funds; (ii) the various share classes employed by Fidelity and the attributes of each class, together with similar information on the distribution and servicing payments made by Fidelity or the funds to third-party participants in the distribution channels; (iii) fund profitability, and fund performance in relation to fund profitability; (iv) the methodology with respect to evaluating competitive fund data and peer group classifications and fee comparisons; (v) annual fund profitability margins, with particular focus on certain funds with negative margins; (vi) the realization of fall-out benefits in certain Fidelity business units; (vii) economies of scale and the way in which they are shared with fund shareholders; (viii) Fidelity's group fee structures, including the group fee schedule of breakpoints; (ix) the impact of cost containment measures on the funds; and (x) the transfer agent fee structure.
Based on its evaluation of all of the conclusions noted above, and after considering all factors it believed relevant, the Board concluded that the advisory fee structures are fair and reasonable, and that the fund's Advisory Contracts should be renewed.
Annual Report
Investment Adviser
Fidelity Management & Research Company
Boston, MA
Investment Sub-Advisers
FMR Co., Inc.
FMR Investment Management
(U.K.) Limited
Fidelity Management & Research
(Hong Kong) Limited
Fidelity Management & Research
(Japan) Limited
FIL Investment Advisors
FIL Investments (Japan) Limited
FIL Investment Advisors (UK) Limited
General Distributor
Fidelity Distributors Corporation
Smithfield, RI
Transfer and Service Agents
Fidelity Investments Institutional
Operations Company, Inc.
Boston, MA
Fidelity Service Company, Inc.
Boston, MA
Custodian
The Northern Trust Company
Chicago, IL
(Fidelity Investment logo)(registered trademark)
AILSI-UANN-1215
1.815081.110
ContentsPerformance: The Bottom LineManagement's Discussion of Fund PerformanceShareholder Expense ExampleInvestment Changes (Unaudited)Investments October 31, 2015Financial StatementsNotes to Financial StatementsReport of Independent Registered Public Accounting FirmTrustees and OfficersDistributions (Unaudited)Board Approval of Investment Advisory Contracts and Management Fees
Fidelity®
International Discovery
Fund -
Class K
Annual Report
October 31, 2015
(Fidelity Cover Art)
Contents
Performance | (Click Here) | How the fund has done over time. |
Management's Discussion of Fund Performance | (Click Here) | The Portfolio Manager's review of fund performance and strategy. |
Shareholder Expense Example | (Click Here) | An example of shareholder expenses. |
Investment Changes | (Click Here) | A summary of major shifts in the fund's investments over the past six months. |
Investments | (Click Here) | A complete list of the fund's investments with their market values. |
Financial Statements | (Click Here) | Statements of assets and liabilities, operations, and changes in net assets, as well as financial highlights. |
Notes | (Click Here) | Notes to the financial statements. |
Report of Independent Registered Public Accounting Firm | (Click Here) | |
Trustees and Officers | (Click Here) | |
Distributions | (Click Here) | |
Board Approval of Investment Advisory Contracts and Management Fees | (Click Here) | |
To view a fund's proxy voting guidelines and proxy voting record for the 12-month period ended June 30, visit http://www.fidelity.com/proxyvotingresults or visit the Securities and Exchange Commission's (SEC) web site at http://www.sec.gov. You may also call 1-800-835-5092 to request a free copy of the proxy voting guidelines.
Standard & Poor's, S&P and S&P 500 are registered service marks of The McGraw-Hill Companies, Inc. and have been licensed for use by Fidelity Distributors Corporation.
Other third-party marks appearing herein are the property of their respective owners.
All other marks appearing herein are registered or unregistered trademarks or service marks of FMR LLC or an affiliated company. © 2015 FMR LLC. All rights reserved.
Annual Report
This report and the financial statements contained herein are submitted for the general information of the shareholders of the fund. This report is not authorized for distribution to prospective investors in the fund unless preceded or accompanied by an effective prospectus.
A fund files its complete schedule of portfolio holdings with the SEC for the first and third quarters of each fiscal year on Form N-Q. Forms N-Q are available on the SEC's web site at http://www.sec.gov. A fund's Forms N-Q may be reviewed and copied at the SEC's Public Reference Room in Washington, DC. Information regarding the operation of the SEC's Public Reference Room may be obtained by calling 1-800-SEC-0330. For a complete list of a fund's portfolio holdings, view the most recent holdings listing, semiannual report, or annual report on Fidelity's web site at http://www.fidelity.com, http://www.advisor.fidelity.com, or http://www.401k.com, as applicable.
NOT FDIC INSURED • MAY LOSE VALUE • NO BANK GUARANTEE
Neither the fund nor Fidelity Distributors Corporation is a bank.
Annual Report
Average annual total return reflects the change in the value of an investment, assuming reinvestment of the class' distributions from dividend income and capital gains (the profits earned upon the sale of securities that have grown in value, if any) and assuming a constant rate of performance each year. The $10,000 table and the fund's returns do not reflect the deduction of taxes that a shareholder would pay on fund distributions or the redemption of fund shares. During periods of reimbursement by Fidelity, a fund's total return will be greater than it would be had the reimbursement not occurred. How a fund did yesterday is no guarantee of how it will do tomorrow.
Average Annual Total Returns
Periods ended October 31, 2015 | Past 1
year | Past 5
years | Past 10
years |
Class KA | 3.61% | 6.22% | 5.40% |
A The initial offering of Class K shares took place on May 9, 2008. Returns prior to May 9, 2008 are those of Fidelity® International Discovery Fund, the original class of the fund.
$10,000 Over 10 Years
Let's say hypothetically that $10,000 was invested in Fidelity® International Discovery Fund - Class K on October 31, 2005. The chart shows how the value of your investment would have changed, and also shows how the MSCI EAFE Index performed over the same period. See footnote A above for additional information regarding the performance of Class K.
Annual Report
Market Recap: International equities suffered a moderate setback for the 12 months ending October 31, 2015, held back by a collapse in commodities prices that hurt resources-related sectors and geographies. The MSCI ACWI (All Country World Index) ex USA Index returned -4.55% for the period, affected also by concerns about global economic growth. Commodity producers remained under pressure for much of the past year, largely related to economic deceleration in China (-1%), the world's second-largest economy and a leading consumer of raw materials. This effect was exacerbated by U.S. dollar strength relative to global currencies, which weighed on commodities priced in dollars and acutely impacted equity returns within regions most exposed to resources prices. The emerging-markets group, for example, returned about -15% this period. Canada, a significant energy producer, returned roughly -17%. Net energy consumer Japan (+9%) was the best-performing region by far. Only about a quarter of the nearly 50 index countries managed a gain this period: Ireland (+19%) - the EU's fastest-growing economy - and Israel (+17%) proved top performers; Greece (-56%) and Brazil (-46%), among the worst. As for sectors, energy (-25%) and materials (-16%) declined sharply, whereas the two consumer sectors each gained about 6%.
Comments from Portfolio Manager William Kennedy: For the year, the fund's share classes (excluding sales charges, if applicable) outpaced the 0.08% return of the benchmark MSCI EAFE Index. Most of the fund's outperformance came from security selection in the financials and consumer discretionary sectors, favorable positioning in continental Europe and Asia Pacific ex Japan and stock picks in the United Kingdom. Sector allocations gave an added boost. In terms of top individual contributors, an average underweighting in U.K.-listed oil and gas company Royal Dutch Shell helped, as plunging oil prices caused the stock to decline. An out-of-index stake in Constellation Software returned roughly 55%, as the Canadian company's track record of smart acquisitions drove better-than-expected earnings growth. Another winner was Luxembourg-based media company Altice, which saw its entrepreneurial management team and appetite for acquisitions drive a huge gain. By contrast, the fund's underweighting in Japan modestly hindered relative performance. In terms of individual detractors, an overweighting in France-based exploration and production company Total hurt as oil prices slid. A tiny out-of-index stake in Australia-based online fashion retailer MySale Group detracted when a profit warning sank the stock. Altice and MySale were not in the portfolio at period end.
The views expressed above reflect those of the portfolio manager(s) only through the end of the period as stated on the cover of this report and do not necessarily represent the views of Fidelity or any other person in the Fidelity organization. Any such views are subject to change at any time based upon market or other conditions and Fidelity disclaims any responsibility to update such views. These views may not be relied on as investment advice and, because investment decisions for a Fidelity fund are based on numerous factors, may not be relied on as an indication of trading intent on behalf of any Fidelity fund.
Annual Report
Shareholder Expense Example
As a shareholder of the Fund, you incur two types of costs: (1) transaction costs, including sales charges (loads) on purchase payments or redemption proceeds, redemption fees and (2) ongoing costs, including management fees, distribution and/or service (12b-1) fees and other Fund expenses. This Example is intended to help you understand your ongoing costs (in dollars) of investing in the Fund and to compare these costs with the ongoing costs of investing in other mutual funds.
The Example is based on an investment of $1,000 invested at the beginning of the period and held for the entire period (May 1, 2015 to October 31, 2015).
Actual Expenses
The first line of the accompanying table for each class of the Fund provides information about actual account values and actual expenses. You may use the information in this line, together with the amount you invested, to estimate the expenses that you paid over the period. Simply divide your account value by $1,000.00 (for example, an $8,600 account value divided by $1,000.00 = 8.6), then multiply the result by the number in the first line for a class of the Fund under the heading entitled "Expenses Paid During Period" to estimate the expenses you paid on your account during this period. A small balance maintenance fee of $12.00 that is charged once a year may apply for certain accounts with a value of less than $2,000. This fee is not included in the table below. If it was, the estimate of expenses you paid during the period would be higher, and your ending account value lower, by this amount. In addition, the Fund, as a shareholder in the underlying Fidelity Central Funds, will indirectly bear its pro-rata share of the fees and expenses incurred by the underlying Fidelity Central Funds. These fees and expenses are not included in the Fund's annualized expense ratio used to calculate the expense estimate in the table below.
Hypothetical Example for Comparison Purposes
The second line of the accompanying table for each class of the Fund provides information about hypothetical account values and hypothetical expenses based on a Class' actual expense ratio and an assumed rate of return of 5% per year before expenses, which is not the Class' actual return. The hypothetical account values and expenses may not be used to estimate the actual ending account balance or expenses you paid for the period. You may use this information to compare the ongoing costs of investing in the Fund and other funds. To do so, compare this 5% hypothetical example with the 5% hypothetical examples that appear in the shareholder reports of the other funds. A small balance maintenance fee of $12.00 that is charged once a year may apply for certain accounts with a value of less than $2,000. This fee is not included in the table below. If it was, the estimate of expenses you paid during the period would be higher, and your ending account value lower, by this amount. In addition, the Fund, as a shareholder in the underlying Fidelity Central Funds, will indirectly bear its pro-rata share of the fees and expenses incurred by the underlying Fidelity Central Funds. These fees and expenses are not included in the Fund's annualized expense ratio used to calculate the expense estimate in the table below.
Please note that the expenses shown in the table are meant to highlight your ongoing costs only and do not reflect any transaction costs. Therefore, the second line of the table is useful in comparing ongoing costs only, and will not help you determine the relative total costs of owning different funds. In addition, if these transactional costs were included, your costs would have been higher.
Annual Report
Shareholder Expense Example - continued
| Annualized
Expense RatioB | Beginning
Account Value
May 1, 2015 | Ending
Account Value
October 31, 2015 | Expenses Paid
During PeriodC
May 1, 2015 to
October 31, 2015 |
Class A | 1.33% | | | |
Actual | | $ 1,000.00 | $ 965.80 | $ 6.59 |
HypotheticalA | | $ 1,000.00 | $ 1,018.50 | $ 6.77 |
Class T | 1.57% | | | |
Actual | | $ 1,000.00 | $ 964.80 | $ 7.78 |
HypotheticalA | | $ 1,000.00 | $ 1,017.29 | $ 7.98 |
Class B | 2.11% | | | |
Actual | | $ 1,000.00 | $ 962.00 | $ 10.43 |
HypotheticalA | | $ 1,000.00 | $ 1,014.57 | $ 10.71 |
Class C | 2.09% | | | |
Actual | | $ 1,000.00 | $ 962.10 | $ 10.34 |
HypotheticalA | | $ 1,000.00 | $ 1,014.67 | $ 10.61 |
International Discovery | .99% | | | |
Actual | | $ 1,000.00 | $ 967.70 | $ 4.91 |
HypotheticalA | | $ 1,000.00 | $ 1,020.21 | $ 5.04 |
Class K | .86% | | | |
Actual | | $ 1,000.00 | $ 968.10 | $ 4.27 |
HypotheticalA | | $ 1,000.00 | $ 1,020.87 | $ 4.38 |
Class I | 1.00% | | | |
Actual | | $ 1,000.00 | $ 967.40 | $ 4.96 |
HypotheticalA | | $ 1,000.00 | $ 1,020.16 | $ 5.09 |
Class Z | .87% | | | |
Actual | | $ 1,000.00 | $ 968.10 | $ 4.32 |
HypotheticalA | | $ 1,000.00 | $ 1,020.82 | $ 4.43 |
A 5% return per year before expenses
B Annualized expense ratio reflects expenses net of applicable fee waivers.
C Expenses are equal to each Class' annualized expense ratio, multiplied by the average account value over the period, multiplied by 184/365 (to reflect the one-half year period).
Annual Report
Investment Changes (Unaudited)
Annual Report
Asset Allocation as of October 31, 2015 |
| % of fund's
net assets | % of fund's net assets
6 months ago |
Stocks and Equity Futures | 97.5 | 99.1 |
Other Investments | 0.1 | 0.1 |
Short-Term Investments and Net Other Assets (Liabilities) | 2.4 | 0.8 |
Top Ten Stocks as of October 31, 2015 |
| % of fund's
net assets | % of fund's net assets
6 months ago |
Total SA (France, Oil, Gas & Consumable Fuels) | 2.0 | 1.8 |
Novartis AG (Switzerland, Pharmaceuticals) | 1.8 | 1.7 |
Unilever NV (Certificaten Van Aandelen) (Bearer) (Netherlands, Personal Products) | 1.6 | 1.5 |
Anheuser-Busch InBev SA NV (Belgium, Beverages) | 1.4 | 1.6 |
AIA Group Ltd. (Hong Kong, Insurance) | 1.3 | 1.3 |
Techtronic Industries Co. Ltd. (Hong Kong, Household Durables) | 1.3 | 1.2 |
Housing Development Finance Corp. Ltd. (India, Thrifts & Mortgage Finance) | 1.3 | 1.2 |
Mitsubishi UFJ Financial Group, Inc. (Japan, Banks) | 1.3 | 1.2 |
Novo Nordisk A/S Series B (Denmark, Pharmaceuticals) | 1.2 | 1.1 |
KDDI Corp. (Japan, Wireless Telecommunication Services) | 1.1 | 1.1 |
| 14.3 | |
Market Sectors as of October 31, 2015 |
| % of fund's
net assets | % of fund's net assets
6 months ago |
Financials | 24.2 | 24.6 |
Consumer Discretionary | 17.4 | 16.9 |
Health Care | 12.8 | 13.2 |
Consumer Staples | 11.9 | 9.5 |
Industrials | 10.5 | 10.9 |
Information Technology | 7.5 | 9.7 |
Telecommunication Services | 4.9 | 4.7 |
Energy | 4.3 | 5.0 |
Materials | 2.3 | 3.0 |
Annual Report
Investments October 31, 2015
Showing Percentage of Net Assets
Common Stocks - 95.5% |
| Shares | | Value (000s) |
Australia - 1.7% |
1-Page Ltd. (a) | 2,546,348 | | $ 8,566 |
Ansell Ltd. | 1,597,592 | | 22,734 |
Australia & New Zealand Banking Group Ltd. | 3,558,240 | | 68,817 |
Flight Centre Travel Group Ltd. (d) | 485,418 | | 13,059 |
Mantra Group Ltd. | 7,839,732 | | 22,935 |
Ramsay Health Care Ltd. | 1,171,082 | | 51,478 |
TOTAL AUSTRALIA | | 187,589 |
Austria - 0.3% |
Andritz AG | 447,100 | | 22,518 |
Erste Group Bank AG (a) | 456,800 | | 13,397 |
TOTAL AUSTRIA | | 35,915 |
Bailiwick of Jersey - 1.7% |
Integrated Diagnostics Holdings PLC (a) | 4,961,400 | | 27,337 |
Regus PLC | 11,120,488 | | 57,362 |
Shire PLC | 588,700 | | 44,583 |
Wolseley PLC | 1,048,393 | | 61,553 |
TOTAL BAILIWICK OF JERSEY | | 190,835 |
Belgium - 1.9% |
Anheuser-Busch InBev SA NV | 1,256,127 | | 149,887 |
KBC Groep NV | 955,745 | | 58,225 |
TOTAL BELGIUM | | 208,112 |
Bermuda - 0.5% |
PAX Global Technology Ltd. | 43,428,000 | | 56,789 |
Canada - 2.2% |
Alimentation Couche-Tard, Inc. Class B (sub. vtg.) | 786,100 | | 33,816 |
Constellation Software, Inc. | 230,700 | | 99,683 |
Entertainment One Ltd. | 3,283,077 | | 11,119 |
Imperial Oil Ltd. | 1,249,100 | | 41,563 |
PrairieSky Royalty Ltd. (d) | 1,502,800 | | 29,571 |
Suncor Energy, Inc. | 680,200 | | 20,241 |
TOTAL CANADA | | 235,993 |
Cayman Islands - 1.3% |
Alibaba Group Holding Ltd. sponsored ADR (a) | 385,500 | | 32,316 |
CK Hutchison Holdings Ltd. | 1,264,716 | | 17,318 |
Ctrip.com International Ltd. sponsored ADR (a) | 148,100 | | 13,769 |
Lee's Pharmaceutical Holdings Ltd. | 6,774,164 | | 8,746 |
Qunar Cayman Islands Ltd. sponsored ADR (a) | 515,900 | | 25,042 |
Common Stocks - continued |
| Shares | | Value (000s) |
Cayman Islands - continued |
Regina Miracle International Holdings Ltd. | 15,269,891 | | $ 13,845 |
WuXi PharmaTech Cayman, Inc. sponsored ADR (a) | 826,200 | | 36,931 |
TOTAL CAYMAN ISLANDS | | 147,967 |
China - 0.5% |
Jiangsu Hengrui Medicine Co. Ltd. | 4,183,623 | | 34,711 |
Kweichow Moutai Co. Ltd. | 663,582 | | 22,405 |
Yantai Changyu Pioneer Wine Co. Ltd. (B Shares) | 697,195 | | 2,215 |
TOTAL CHINA | | 59,331 |
Cyprus - 0.0% |
SPDI Secure Property Development & Investment PLC (a) | 520,230 | | 229 |
Denmark - 1.2% |
Novo Nordisk A/S Series B | 2,385,545 | | 126,681 |
Finland - 0.7% |
Sampo Oyj (A Shares) | 1,663,200 | | 81,351 |
France - 9.6% |
Accor SA | 1,694,818 | | 84,314 |
Air Liquide SA | 429,100 | | 55,632 |
ALTEN | 88,659 | | 4,602 |
Atos Origin SA | 441,674 | | 35,237 |
AXA SA | 3,834,100 | | 102,325 |
Capgemini SA | 860,800 | | 76,701 |
Cegedim SA (a) | 539,590 | | 19,136 |
Havas SA | 4,843,944 | | 42,027 |
Numericable Group SA (a) | 340,324 | | 15,419 |
Rexel SA | 1,265,582 | | 17,299 |
Safran SA | 614,700 | | 46,689 |
Sanofi SA | 992,072 | | 100,076 |
Sodexo SA | 433,700 | | 38,616 |
SR Teleperformance SA | 291,800 | | 22,936 |
Total SA (d) | 4,569,799 | | 220,991 |
Unibail-Rodamco | 157,400 | | 43,981 |
VINCI SA | 1,425,100 | | 96,189 |
Vivendi SA | 1,148,200 | | 27,622 |
TOTAL FRANCE | | 1,049,792 |
Germany - 5.5% |
Aareal Bank AG | 1,026,009 | | 39,094 |
Axel Springer Verlag AG | 526,702 | | 29,620 |
Beiersdorf AG | 244,300 | | 23,219 |
Continental AG | 299,300 | | 71,980 |
Common Stocks - continued |
| Shares | | Value (000s) |
Germany - continued |
Deutsche Boerse AG | 529,594 | | $ 48,773 |
Deutsche Telekom AG | 3,260,600 | | 61,076 |
Fresenius SE & Co. KGaA | 471,500 | | 34,647 |
GEA Group AG | 884,110 | | 35,452 |
KION Group AG | 1,377,249 | | 62,109 |
LEG Immobilien AG | 254,661 | | 20,317 |
OSRAM Licht AG | 1,016,232 | | 59,797 |
ProSiebenSat.1 Media AG | 1,176,900 | | 63,661 |
Rational AG | 84,000 | | 33,350 |
United Internet AG | 433,247 | | 22,513 |
TOTAL GERMANY | | 605,608 |
Hong Kong - 3.0% |
AIA Group Ltd. | 24,849,200 | | 145,699 |
China Resources Beer Holdings Co. Ltd. | 21,482,000 | | 40,562 |
Techtronic Industries Co. Ltd. | 38,670,000 | | 141,365 |
TOTAL HONG KONG | | 327,626 |
India - 3.0% |
Bharti Infratel Ltd. (a) | 12,647,734 | | 75,119 |
HDFC Bank Ltd. sponsored ADR | 1,298,584 | | 79,395 |
Housing Development Finance Corp. Ltd. | 7,355,732 | | 140,900 |
Lupin Ltd. | 452,781 | | 13,331 |
Sun Pharmaceutical Industries Ltd. | 347,397 | | 4,721 |
Titan Co. Ltd. (a) | 2,186,522 | | 11,862 |
TOTAL INDIA | | 325,328 |
Ireland - 1.4% |
Bank of Ireland (a) | 62,440,800 | | 23,002 |
Dalata Hotel Group PLC (a) | 388,200 | | 1,930 |
Glanbia PLC | 2,527,500 | | 49,028 |
Kerry Group PLC Class A | 989,500 | | 80,465 |
TOTAL IRELAND | | 154,425 |
Isle of Man - 0.7% |
Optimal Payments PLC (a) | 11,615,044 | | 54,433 |
Playtech Ltd. | 1,395,092 | | 18,410 |
TOTAL ISLE OF MAN | | 72,843 |
Israel - 1.3% |
Frutarom Industries Ltd. | 1,038,100 | | 44,860 |
Common Stocks - continued |
| Shares | | Value (000s) |
Israel - continued |
Partner Communications Co. Ltd. (a) | 1,755,983 | | $ 7,969 |
Teva Pharmaceutical Industries Ltd. sponsored ADR | 1,558,300 | | 92,236 |
TOTAL ISRAEL | | 145,065 |
Italy - 2.9% |
De Longhi SpA | 2,630,100 | | 64,438 |
Intesa Sanpaolo SpA | 25,324,300 | | 88,222 |
Mediaset SpA | 17,602,100 | | 89,425 |
Telecom Italia SpA (a) | 50,788,000 | | 70,853 |
TOTAL ITALY | | 312,938 |
Japan - 15.9% |
ACOM Co. Ltd. (a)(d) | 5,223,800 | | 28,599 |
Aozora Bank Ltd. | 11,048,000 | | 40,381 |
Asahi Group Holdings | 1,240,200 | | 38,255 |
Astellas Pharma, Inc. | 6,994,600 | | 101,523 |
Coca-Cola Central Japan Co. Ltd. | 536,400 | | 7,539 |
Dentsu, Inc. | 1,281,800 | | 72,060 |
Don Quijote Holdings Co. Ltd. | 1,346,000 | | 49,444 |
Hitachi Ltd. | 10,000 | | 58 |
Hoya Corp. | 2,994,400 | | 123,569 |
Japan Exchange Group, Inc. | 1,932,000 | | 31,088 |
Japan Tobacco, Inc. | 1,302,700 | | 45,089 |
KDDI Corp. | 5,167,900 | | 125,055 |
Keyence Corp. | 147,360 | | 76,717 |
Misumi Group, Inc. | 3,200,000 | | 41,671 |
Mitsubishi UFJ Financial Group, Inc. | 21,656,100 | | 140,062 |
Monex Group, Inc. | 12,212,749 | | 34,330 |
NEC Corp. | 25,011,000 | | 77,159 |
Nidec Corp. | 701,900 | | 52,892 |
Olympus Corp. | 1,784,400 | | 60,190 |
ORIX Corp. | 6,891,200 | | 100,638 |
Sanken Electric Co. Ltd. | 1,393,000 | | 4,841 |
Seven & i Holdings Co. Ltd. | 931,900 | | 42,331 |
Seven Bank Ltd. | 12,110,400 | | 55,182 |
Shinsei Bank Ltd. | 32,483,000 | | 68,109 |
SoftBank Corp. | 724,300 | | 40,581 |
Sony Corp. | 2,320,500 | | 65,961 |
Sundrug Co. Ltd. | 626,200 | | 32,988 |
Tsuruha Holdings, Inc. | 1,040,400 | | 82,425 |
United Arrows Ltd. | 847,000 | | 36,490 |
Common Stocks - continued |
| Shares | | Value (000s) |
Japan - continued |
VT Holdings Co. Ltd. | 3,895,300 | | $ 24,089 |
Welcia Holdings Co. Ltd. | 964,000 | | 47,511 |
TOTAL JAPAN | | 1,746,827 |
Luxembourg - 0.8% |
Eurofins Scientific SA | 83,911 | | 30,381 |
Grand City Properties SA | 3,000,560 | | 59,920 |
TOTAL LUXEMBOURG | | 90,301 |
Marshall Islands - 0.1% |
Hoegh LNG Partners LP (e) | 715,655 | | 11,465 |
Netherlands - 4.0% |
AerCap Holdings NV (a) | 2,303,100 | | 95,579 |
Arcadis NV | 1,205,000 | | 30,411 |
IMCD Group BV | 1,938,100 | | 72,505 |
ING Groep NV (Certificaten Van Aandelen) | 4,566,600 | | 66,462 |
Unilever NV (Certificaten Van Aandelen) (Bearer) | 3,836,500 | | 173,477 |
TOTAL NETHERLANDS | | 438,434 |
New Zealand - 0.6% |
EBOS Group Ltd. | 3,173,554 | | 29,333 |
Ryman Healthcare Group Ltd. | 7,179,412 | | 38,358 |
TOTAL NEW ZEALAND | | 67,691 |
Philippines - 0.3% |
SM Investments Corp. | 1,651,390 | | 30,830 |
Portugal - 0.3% |
NOS SGPS SA | 3,466,500 | | 28,814 |
South Africa - 1.1% |
EOH Holdings Ltd. | 2,871,867 | | 31,751 |
Naspers Ltd. Class N | 593,000 | | 86,857 |
TOTAL SOUTH AFRICA | | 118,608 |
Spain - 2.5% |
Amadeus IT Holding SA Class A | 1,727,200 | | 73,617 |
Atresmedia Corporacion de Medios de Comunicacion SA | 2,218,100 | | 28,465 |
Hispania Activos Inmobiliarios SA (a) | 1,091,600 | | 16,445 |
Inditex SA | 2,302,339 | | 86,346 |
Mediaset Espana Comunicacion SA | 3,431,200 | | 41,712 |
Merlin Properties Socimi SA | 2,497,700 | | 32,025 |
TOTAL SPAIN | | 278,610 |
Common Stocks - continued |
| Shares | | Value (000s) |
Sweden - 3.1% |
ASSA ABLOY AB (B Shares) | 2,977,200 | | $ 59,226 |
Getinge AB (B Shares) | 2,702,600 | | 67,663 |
HEXPOL AB (B Shares) | 2,985,000 | | 29,069 |
Nordea Bank AB | 5,783,000 | | 63,966 |
Sandvik AB | 3,361,100 | | 31,433 |
Svenska Cellulosa AB (SCA) (B Shares) | 1,545,100 | | 45,509 |
Svenska Handelsbanken AB (A Shares) | 2,990,700 | | 40,618 |
TOTAL SWEDEN | | 337,484 |
Switzerland - 5.1% |
Credit Suisse Group AG (h)(k) | 3,643,900 | | 83,867 |
EFG International | 1,747,368 | | 17,554 |
GAM Holding Ltd. | 1,413,451 | | 25,882 |
Julius Baer Group Ltd. | 955,230 | | 47,363 |
Novartis AG | 2,126,476 | | 192,635 |
Partners Group Holding AG | 225,896 | | 81,816 |
Schindler Holding AG (participation certificate) | 182,339 | | 29,626 |
Syngenta AG (Switzerland) | 101,678 | | 34,161 |
UBS Group AG | 2,453,481 | | 49,097 |
TOTAL SWITZERLAND | | 562,001 |
Taiwan - 0.1% |
JHL Biotech, Inc. (a) | 4,995,560 | | 11,141 |
Turkey - 0.0% |
Logo Yazilim Sanayi Ve Ticar | 2 | | 0 |
United Kingdom - 19.1% |
AA PLC | 3,853,399 | | 16,449 |
Aberdeen Asset Management PLC | 4,206,932 | | 22,485 |
Al Noor Hospitals Group PLC | 2,335,318 | | 42,337 |
Associated British Foods PLC | 776,700 | | 41,369 |
Aviva PLC | 6,618,100 | | 49,461 |
B&M European Value Retail S.A. | 8,573,709 | | 44,066 |
Barclays PLC | 16,052,760 | | 57,192 |
BCA Marketplace PLC | 7,808,000 | | 21,275 |
BG Group PLC | 2,346,020 | | 37,064 |
BT Group PLC | 6,169,700 | | 44,061 |
BTG PLC (a) | 1,727,000 | | 14,696 |
Bunzl PLC | 2,087,500 | | 59,824 |
Compass Group PLC | 2,024,800 | | 34,808 |
Diploma PLC | 2,326,200 | | 23,005 |
Essentra PLC | 2,145,000 | | 27,843 |
Hikma Pharmaceuticals PLC | 2,598,333 | | 86,681 |
Common Stocks - continued |
| Shares | | Value (000s) |
United Kingdom - continued |
Howden Joinery Group PLC | 10,977,300 | | $ 78,453 |
HSBC Holdings PLC (United Kingdom) | 10,446,000 | | 81,614 |
Imperial Tobacco Group PLC | 2,092,292 | | 112,859 |
ITV PLC | 21,873,900 | | 85,111 |
JUST EAT Ltd. (a) | 595,900 | | 3,913 |
Liberty Global PLC Class A (a) | 665,500 | | 29,628 |
Lloyds Banking Group PLC | 69,588,800 | | 78,984 |
London Stock Exchange Group PLC | 2,190,936 | | 85,959 |
Melrose PLC | 10,942,678 | | 44,906 |
Micro Focus International PLC | 3,266,700 | | 63,251 |
Next PLC | 760,844 | | 93,833 |
Persimmon PLC | 1,478,400 | | 45,445 |
Poundland Group PLC | 6,866,990 | | 29,112 |
Reckitt Benckiser Group PLC | 759,700 | | 74,140 |
Rex Bionics PLC (a)(e) | 1,304,916 | | 976 |
Rio Tinto PLC | 1,353,600 | | 49,332 |
Royal Dutch Shell PLC Class A (United Kingdom) | 1,108,500 | | 28,940 |
SABMiller PLC | 723,500 | | 44,558 |
Schroders PLC | 598,200 | | 27,509 |
Shawbrook Group Ltd. | 9,004,300 | | 47,098 |
Spirax-Sarco Engineering PLC | 542,700 | | 25,442 |
St. James's Place Capital PLC | 5,426,000 | | 80,678 |
Taylor Wimpey PLC | 11,785,800 | | 35,975 |
The Restaurant Group PLC | 1,956,100 | | 21,621 |
Virgin Money Holdings Uk PLC | 5,909,100 | | 35,327 |
Vodafone Group PLC | 31,387,896 | | 103,296 |
Whitbread PLC | 700,994 | | 53,665 |
Workspace Group PLC | 652,800 | | 9,636 |
TOTAL UNITED KINGDOM | | 2,093,877 |
United States of America - 3.1% |
Chevron Corp. | 854,400 | | 77,648 |
Constellation Brands, Inc. Class A (sub. vtg.) | 626,700 | | 84,479 |
McGraw Hill Financial, Inc. | 686,300 | | 63,579 |
Monster Beverage Corp. (a) | 168,900 | | 23,024 |
Visa, Inc. Class A | 1,154,500 | | 89,566 |
TOTAL UNITED STATES OF AMERICA | | 338,296 |
TOTAL COMMON STOCKS (Cost $9,171,863) |
10,478,796
|
Nonconvertible Preferred Stocks - 0.2% |
| Shares | | Value (000s) |
Cayman Islands - 0.2% |
China Internet Plus Holdings Ltd. (k) | 5,958,244 | | $ 22,999 |
Germany - 0.0% |
Henkel AG & Co. KGaA | 476 | | 52 |
TOTAL NONCONVERTIBLE PREFERRED STOCKS (Cost $18,888) |
23,051
|
Government Obligations - 0.0% |
| Principal
Amount (000s) (j) | | |
United States of America - 0.0% |
U.S. Treasury Bills, yield at date of purchase 0.03% to 0.06% 12/3/15 to 12/17/15 (i)
(Cost $1,930) | | $ 1,930 | |
1,930
|
Preferred Securities - 0.1% |
|
Ireland - 0.1% |
Baggot Securities Ltd. 10.24% (f)(g)
(Cost $13,883) | EUR | 9,040 | |
10,747
|
Money Market Funds - 5.3% |
| Shares | | |
Fidelity Cash Central Fund, 0.18% (b) | 529,294,097 | | 529,294 |
Fidelity Securities Lending Cash Central Fund, 0.19% (b)(c) | 46,206,017 | | 46,206 |
TOTAL MONEY MARKET FUNDS (Cost $575,500) |
575,500
|
TOTAL INVESTMENT PORTFOLIO - 101.1% (Cost $9,782,064) | | 11,090,024 |
NET OTHER ASSETS (LIABILITIES) - (1.1)% | | (122,851) |
NET ASSETS - 100% | $ 10,967,173 |
Futures Contracts |
| Expiration Date | | Underlying Face Amount at Value (000s) | | Unrealized Appreciation/
(Depreciation)
(000s) |
Purchased |
Equity Index Contracts |
2,033 CME Nikkei 225 Index Contracts (United States) | Dec. 2015 | | $ 192,271 | | $ 9,203 |
The face value of futures purchased as a percentage of net assets is 1.8% |
For the period, the average monthly underlying face amount at value for futures contracts in the aggregate was $226,950,000. |
Currency Abbreviations |
EUR | - | European Monetary Unit |
Legend |
(a) Non-income producing |
(b) Affiliated fund that is generally available only to investment companies and other accounts managed by Fidelity Investments. The rate quoted is the annualized seven-day yield of the fund at period end. A complete unaudited listing of the fund's holdings as of its most recent quarter end is available upon request. In addition, each Fidelity Central Fund's financial statements, which are not covered by the Fund's Report of Independent Registered Public Accounting Firm, are available on the SEC's website or upon request. |
(c) Investment made with cash collateral received from securities on loan. |
(d) Security or a portion of the security is on loan at period end. |
(e) Affiliated company |
(f) Security exempt from registration under Rule 144A of the Securities Act of 1933. These securities may be resold in transactions exempt from registration, normally to qualified institutional buyers. At the end of the period, the value of these securities amounted to $10,747,000 or 0.1% of net assets. |
(g) Security is perpetual in nature with no stated maturity date. |
(h) Security or a portion of the security purchased on a delayed delivery or when-issued basis. |
(i) Security or a portion of the security was pledged to cover margin requirements for futures contracts. At period end, the value of securities pledged amounted to $1,930,000. |
(j) Amount is stated in United States dollars unless otherwise noted. |
(k) Restricted securities - Investment in securities not registered under the Securities Act of 1933 (excluding 144A issues). At the end of the period, the value of restricted securities (excluding 144A issues) amounted to $106,866,000 or 1.0% of net assets. |
Additional information on each restricted holding is as follows: |
Security | Acquisition Date | Acquisition Cost (000s) |
China Internet Plus Holdings Ltd. | 1/26/15 | $ 18,833 |
Credit Suisse Group AG | 10/21/15 | $ 86,402 |
Affiliated Central Funds |
Information regarding fiscal year to date income earned by the Fund from investments in Fidelity Central Funds is as follows: |
Fund | Income earned
(Amounts in thousands) |
Fidelity Cash Central Fund | $ 655 |
Fidelity Securities Lending Cash Central Fund | 3,281 |
Total | $ 3,936 |
Other Affiliated Issuers |
An affiliated company is a company in which the Fund has ownership of at least 5% of the voting securities. Fiscal year to date transactions with companies which are or were affiliates are as follows: |
Affiliate
(Amounts in thousands) | Value, beginning of period | Purchases | Sales Proceeds* | Dividend Income | Value,
end of
period |
Hoegh LNG Partners LP | $ 12,426 | $ 2,837 | $ 275 | $ 729 | $ 11,465 |
MySale Group PLC | 26,053 | - | 5,920 | - | - |
PAX Global Technology Ltd. | 71,203 | 795 | 36,965 | 112 | - |
Rex Bionics PLC | 3,518 | - | 24 | - | 976 |
Total | $ 113,200 | $ 3,632 | $ 43,184 | $ 841 | $ 12,441 |
* Includes the value of securities delivered through in-kind transactions, if applicable.
See accompanying notes which are an integral part of the financial statements.
Annual Report
Other Information |
Categorizations in the Schedule of Investments are based on country or territory of incorporation. |
The following is a summary of the inputs used, as of October 31, 2015, involving the Fund's assets and liabilities carried at fair value. The inputs or methodology used for valuing securities may not be an indication of the risk associated with investing in those securities. For more information on valuation inputs, and their aggregation into the levels used in the tables below, please refer to the Investment Valuation section in the accompanying Notes to Financial Statements. |
Valuation Inputs at Reporting Date: |
Description
(Amounts in thousands) | Total | Level 1 | Level 2 | Level 3 |
Investments in Securities: | | | | |
Equities: | | | | |
Consumer Discretionary | $ 1,898,277 | $ 1,361,738 | $ 513,540 | $ 22,999 |
Consumer Staples | 1,297,202 | 666,346 | 630,856 | - |
Energy | 467,483 | 180,488 | 286,995 | - |
Financials | 2,676,653 | 1,281,424 | 1,395,229 | - |
Health Care | 1,416,831 | 497,206 | 919,625 | - |
Industrials | 1,146,371 | 836,192 | 310,179 | - |
Information Technology | 830,123 | 605,993 | 224,130 | - |
Materials | 240,897 | 157,404 | 83,493 | - |
Telecommunication Services | 528,010 | 7,969 | 520,041 | - |
Government Obligations | 1,930 | - | 1,930 | - |
Preferred Securities | 10,747 | - | 10,747 | - |
Money Market Funds | 575,500 | 575,500 | - | - |
Total Investments in Securities: | $ 11,090,024 | $ 6,170,260 | $ 4,896,765 | $ 22,999 |
Derivative Instruments: | | | | |
Assets | | | | |
Futures Contracts | $ 9,203 | $ 9,203 | $ - | $ - |
The following is a summary of transfers between Level 1 and Level 2 for the period ended October 31, 2015. Transfers are assumed to have occurred at the beginning of the period, and are primarily attributable to the valuation techniques used for foreign equity securities, as discussed in the accompanying Notes to Financial Statements: |
Transfers | Total (000s) |
Level 1 to Level 2 | $ 381,182 |
Level 2 to Level 1 | $ 79,997 |
Value of Derivative Instruments |
The following table is a summary of the Fund's value of derivative instruments by primary risk exposure as of October 31, 2015. For additional information on derivative instruments, please refer to the Derivative Instruments section in the accompanying Notes to Financial Statements. |
Primary Risk Exposure /
Derivative Type | Value (000s) |
| Asset | Liability |
Equity Risk | | |
Futures Contracts (a) | $ 9,203 | $ - |
Total Value of Derivatives | $ 9,203 | $ - |
(a) Reflects gross cumulative appreciation (depreciation) on futures contracts as presented in the Schedule of Investments. Only the period end receivable or payable for daily variation margin and net unrealized appreciation (depreciation) are presented in the Statement of Assets and Liabilities. |
See accompanying notes which are an integral part of the financial statements.
Annual Report
Statement of Assets and Liabilities
Amounts in thousands (except per-share amounts) | | October 31, 2015 |
| | |
Assets | | |
Investment in securities, at value (including securities loaned of $44,670) - See accompanying schedule: Unaffiliated issuers (cost $9,188,061) | $ 10,502,083 | |
Fidelity Central Funds (cost $575,500) | 575,500 | |
Other affiliated issuers (cost $18,503) | 12,441 | |
Total Investments (cost $9,782,064) | | $ 11,090,024 |
Segregated cash with brokers for derivative instruments | | 9,348 |
Cash | | 172 |
Foreign currency held at value (cost $21,001) | | 21,001 |
Receivable for investments sold | | 28,370 |
Receivable for fund shares sold | | 12,338 |
Dividends receivable | | 24,068 |
Distributions receivable from Fidelity Central Funds | | 111 |
Prepaid expenses | | 30 |
Other receivables | | 3,575 |
Total assets | | 11,189,037 |
| | |
Liabilities | | |
Payable for investments purchased | | |
Regular delivery | $ 75,392 | |
Delayed delivery | 83,867 | |
Payable for fund shares redeemed | 5,982 | |
Accrued management fee | 7,145 | |
Distribution and service plan fees payable | 104 | |
Payable for daily variation margin for derivative instruments | 1,067 | |
Other affiliated payables | 1,508 | |
Other payables and accrued expenses | 593 | |
Collateral on securities loaned, at value | 46,206 | |
Total liabilities | | 221,864 |
| | |
Net Assets | | $ 10,967,173 |
Net Assets consist of: | | |
Paid in capital | | $ 9,614,122 |
Undistributed net investment income | | 108,769 |
Accumulated undistributed net realized gain (loss) on investments and foreign currency transactions | | (73,154) |
Net unrealized appreciation (depreciation) on investments and assets and liabilities in foreign currencies | | 1,317,436 |
Net Assets | | $ 10,967,173 |
See accompanying notes which are an integral part of the financial statements.
Annual Report
Statement of Assets and Liabilities - continued
Amounts in thousands (except per-share amounts) | | October 31, 2015 |
| | |
Calculation of Maximum Offering Price | | |
Class A:
Net Asset Value and redemption price per share ($282,714 ÷ 7,106.131 shares) | | $ 39.78 |
| | |
Maximum offering price per share (100/94.25 of $39.78) | | $ 42.21 |
Class T:
Net Asset Value and redemption price per share ($42,965 ÷ 1,087.491 shares) | | $ 39.51 |
| | |
Maximum offering price per share (100/96.50 of $39.51) | | $ 40.94 |
Class B:
Net Asset Value and offering price per share ($2,249 ÷ 57.378 shares)A | | $ 39.20 |
| | |
Class C:
Net Asset Value and offering price per share ($31,737 ÷ 810.917 shares)A | | $ 39.14 |
| | |
International Discovery:
Net Asset Value, offering price and redemption price per share ($7,208,744 ÷ 179,698.201 shares) | | $ 40.12 |
| | |
Class K:
Net Asset Value, offering price and redemption price per share ($2,307,850 ÷ 57,614.604 shares) | | $ 40.06 |
| | |
Class I:
Net Asset Value, offering price and redemption price per share ($1,060,821 ÷ 26,500.627 shares) | | $ 40.03 |
| | |
Class Z:
Net Asset Value, offering price and redemption price per share ($30,093 ÷ 751.671 shares) | | $ 40.03 |
A Redemption price per share is equal to net asset value less any applicable contingent deferred sales charge.
See accompanying notes which are an integral part of the financial statements.
Annual Report
Financial Statements - continued
Statement of Operations
Amounts in thousands | Year ended October 31, 2015 |
| | |
Investment Income | | |
Dividends (including $841 earned from other affiliated issuers) | | $ 237,713 |
Special dividends | | 34,094 |
Interest | | 101 |
Income from Fidelity Central Funds | | 3,936 |
Income before foreign taxes withheld | | 275,844 |
Less foreign taxes withheld | | (19,005) |
Total income | | 256,839 |
| | |
Expenses | | |
Management fee | | |
Basic fee | $ 74,535 | |
Performance adjustment | 11,730 | |
Transfer agent fees | 16,773 | |
Distribution and service plan fees | 1,337 | |
Accounting and security lending fees | 1,839 | |
Custodian fees and expenses | 1,612 | |
Independent trustees' compensation | 47 | |
Registration fees | 226 | |
Audit | 124 | |
Legal | 30 | |
Miscellaneous | 101 | |
Total expenses before reductions | 108,354 | |
Expense reductions | (1,353) | 107,001 |
Net investment income (loss) | | 149,838 |
Realized and Unrealized Gain (Loss) | | |
Net realized gain (loss) on: | | |
Investment securities: | | |
Unaffiliated issuers (net of foreign taxes of $606) | 220,061 | |
Other affiliated issuers | (3,654) | |
Foreign currency transactions | (3,878) | |
Futures contracts | 33,241 | |
Total net realized gain (loss) | | 245,770 |
Change in net unrealized appreciation (depreciation) on: Investment securities (net of decrease in deferred foreign taxes of $7,503) | 13,737 | |
Assets and liabilities in foreign currencies | 2,313 | |
Futures contracts | (15,395) | |
Total change in net unrealized appreciation (depreciation) | | 655 |
Net gain (loss) | | 246,425 |
Net increase (decrease) in net assets resulting from operations | | $ 396,263 |
See accompanying notes which are an integral part of the financial statements.
Annual Report
Statement of Changes in Net Assets
Amounts in thousands | Year ended
October 31,
2015 | Year ended
October 31,
2014 |
Increase (Decrease) in Net Assets | | |
Operations | | |
Net investment income (loss) | $ 149,838 | $ 199,098 |
Net realized gain (loss) | 245,770 | 758,004 |
Change in net unrealized appreciation (depreciation) | 655 | (958,756) |
Net increase (decrease) in net assets resulting from operations | 396,263 | (1,654) |
Distributions to shareholders from net investment income | (74,589) | (136,326) |
Distributions to shareholders from net realized gain | - | (88,586) |
Total distributions | (74,589) | (224,912) |
Share transactions - net increase (decrease) | (353,147) | (69,908) |
Redemption fees | 95 | 139 |
Total increase (decrease) in net assets | (31,378) | (296,335) |
| | |
Net Assets | | |
Beginning of period | 10,998,551 | 11,294,886 |
End of period (including undistributed net investment income of $108,769 and undistributed net investment income of $68,609, respectively) | $ 10,967,173 | $ 10,998,551 |
See accompanying notes which are an integral part of the financial statements.
Annual Report
Financial Highlights - Fidelity International Discovery Fund Class A
Years ended October 31, | 2015 | 2014 | 2013 | 2012 | 2011 |
Selected Per-Share Data | | | | | |
Net asset value, beginning of period | $ 38.70 | $ 39.49 | $ 31.66 | $ 29.43 | $ 32.07 |
Income from Investment Operations | | | | | |
Net investment income (loss) C | .40F | .53G | .34 | .41 | .42 |
Net realized and unrealized gain (loss) | .79 | (.67) | 7.97 | 2.11 | (2.52) |
Total from investment operations | 1.19 | (.14) | 8.31 | 2.52 | (2.10) |
Distributions from net investment income | (.11) | (.33) | (.45) | (.29) | (.38) |
Distributions from net realized gain | - | (.31) | (.03) | - | (.16) |
Total distributions | (.11) | (.65) K | (.48) | (.29) | (.54) |
Redemption fees added to paid in capitalC, I | - | - | - | - | - |
Net asset value, end of period | $ 39.78 | $ 38.70 | $ 39.49 | $ 31.66 | $ 29.43 |
Total ReturnA, B | 3.09% | (.36)% | 26.59% | 8.70% | (6.71)% |
Ratios to Average Net AssetsD, H | | | | |
Expenses before reductions | 1.33% | 1.28% | 1.35% | 1.34% | 1.30% |
Expenses net of fee waivers, if any | 1.33% | 1.28% | 1.35% | 1.34% | 1.29% |
Expenses net of all reductions | 1.32% | 1.28% | 1.33% | 1.31% | 1.25% |
Net investment income (loss) | 1.00%F | 1.35%G | .97% | 1.41% | 1.31% |
Supplemental Data | | | | | |
Net assets, end of period (in millions) | $ 283 | $ 297 | $ 347 | $ 299 | $ 320 |
Portfolio turnover rateE | 60%J | 57% | 65% | 68% | 75% |
A Total returns would have been lower if certain expenses had not been reduced during the applicable periods shown.
B Total returns do not include the effect of the sales charges.
C Calculated based on average shares outstanding during the period.
D Fees and expenses of any underlying Fidelity Central Funds are not included in the Fund's expense ratio. The Fund indirectly bears its proportionate share of the expenses of any underlying Fidelity Central Funds.
E Amount does not include the portfolio activity of any underlying Fidelity Central Funds.
F Investment income per share reflects a large, non-recurring dividend which amounted to $.12 per share. Excluding this non-recurring dividend, the ratio of net investment income (loss) to average net assets would have been .69%.
G Investment income per share reflects a large, non-recurring dividend which amounted to $.22 per share. Excluding this non-recurring dividend, the ratio of net investment income (loss) to average net assets would have been .80%.
H Expense ratios reflect operating expenses of the class. Expenses before reductions do not reflect amounts reimbursed by the investment adviser or reductions from brokerage service arrangements or reductions from other expense offset arrangements and do not represent the amount paid by the class during periods when reimbursements or reductions occur. Expenses net of fee waivers reflect expenses after reimbursement by the investment adviser but prior to reductions from brokerage service arrangements or other expense offset arrangements. Expenses net of all reductions represent the net expenses paid by the class.
I Amount represents less than $.005 per share.
J Portfolio turnover rate excludes securities received or delivered in-kind.
K Total distributions of $.65 per share is comprised of distributions from net investment income of $.334 and distributions from net realized gain of $.311 per share.
See accompanying notes which are an integral part of the financial statements.
Annual Report
Financial Highlights - Fidelity International Discovery Fund Class T
Years ended October 31, | 2015 | 2014 | 2013 | 2012 | 2011 |
Selected Per-Share Data | | | | | |
Net asset value, beginning of period | $ 38.43 | $ 39.23 | $ 31.42 | $ 29.18 | $ 31.81 |
Income from Investment Operations | | | | | |
Net investment income (loss) C | .30F | .44G | .26 | .34 | .34 |
Net realized and unrealized gain (loss) | .80 | (.68) | 7.92 | 2.09 | (2.51) |
Total from investment operations | 1.10 | (.24) | 8.18 | 2.43 | (2.17) |
Distributions from net investment income | (.02) | (.25) | (.34) | (.19) | (.30) |
Distributions from net realized gain | - | (.31) | (.03) | - | (.16) |
Total distributions | (.02) | (.56) | (.37) | (.19) | (.46) |
Redemption fees added to paid in capitalC, I | - | - | - | - | - |
Net asset value, end of period | $ 39.51 | $ 38.43 | $ 39.23 | $ 31.42 | $ 29.18 |
Total ReturnA, B | 2.86% | (.60)% | 26.31% | 8.41% | (6.96)% |
Ratios to Average Net AssetsD, H | | | | | |
Expenses before reductions | 1.57% | 1.51% | 1.59% | 1.59% | 1.56% |
Expenses net of fee waivers, if any | 1.57% | 1.51% | 1.59% | 1.59% | 1.55% |
Expenses net of all reductions | 1.56% | 1.51% | 1.57% | 1.56% | 1.51% |
Net investment income (loss) | .76%F | 1.11%G | .73% | 1.16% | 1.05% |
Supplemental Data | | | | | |
Net assets, end of period (in millions) | $ 43 | $ 49 | $ 53 | $ 46 | $ 61 |
Portfolio turnover rateE | 60%J | 57% | 65% | 68% | 75% |
A Total returns would have been lower if certain expenses had not been reduced during the applicable periods shown.
B Total returns do not include the effect of the sales charges.
C Calculated based on average shares outstanding during the period.
D Fees and expenses of any underlying Fidelity Central Funds are not included in the Fund's expense ratio. The Fund indirectly bears its proportionate share of the expenses of any underlying Fidelity Central Funds.
E Amount does not include the portfolio activity of any underlying Fidelity Central Funds.
F Investment income per share reflects a large, non-recurring dividend which amounted to $.12 per share. Excluding this non-recurring dividend, the ratio of net investment income (loss) to average net assets would have been .45%.
G Investment income per share reflects a large, non-recurring dividend which amounted to $.21 per share. Excluding this non-recurring dividend, the ratio of net investment income (loss) to average net assets would have been .56%.
H Expense ratios reflect operating expenses of the class. Expenses before reductions do not reflect amounts reimbursed by the investment adviser or reductions from brokerage service arrangements or reductions from other expense offset arrangements and do not represent the amount paid by the class during periods when reimbursements or reductions occur. Expenses net of fee waivers reflect expenses after reimbursement by the investment adviser but prior to reductions from brokerage service arrangements or other expense offset arrangements. Expenses net of all reductions represent the net expenses paid by the class.
I Amount represents less than $.005 per share.
J Portfolio turnover rate excludes securities received or delivered in-kind.
See accompanying notes which are an integral part of the financial statements.
Annual Report
Financial Highlights - Fidelity International Discovery Fund Class B
Years ended October 31, | 2015 | 2014 | 2013 | 2012 | 2011 |
Selected Per-Share Data | | | | | |
Net asset value, beginning of period | $ 38.32 | $ 39.08 | $ 31.28 | $ 29.02 | $ 31.60 |
Income from Investment Operations | | | | | |
Net investment income (loss) C | .08F | .22G | .08 | .19 | .17 |
Net realized and unrealized gain (loss) | .80 | (.66) | 7.90 | 2.09 | (2.48) |
Total from investment operations | .88 | (.44) | 7.98 | 2.28 | (2.31) |
Distributions from net investment income | - | (.01) | (.15) | (.02) | (.12) |
Distributions from net realized gain | - | (.31) | (.03) | - | (.16) |
Total distributions | - | (.32) | (.18) | (.02) | (.27) K |
Redemption fees added to paid in capitalC, I | - | - | - | - | - |
Net asset value, end of period | $ 39.20 | $ 38.32 | $ 39.08 | $ 31.28 | $ 29.02 |
Total ReturnA, B | 2.30% | (1.12)% | 25.64% | 7.85% | (7.39)% |
Ratios to Average Net AssetsD, H | | | | |
Expenses before reductions | 2.12% | 2.06% | 2.10% | 2.09% | 2.06% |
Expenses net of fee waivers, if any | 2.12% | 2.06% | 2.10% | 2.09% | 2.06% |
Expenses net of all reductions | 2.11% | 2.05% | 2.08% | 2.06% | 2.02% |
Net investment income (loss) | .21%F | .57%G | .22% | .66% | .54% |
Supplemental Data | | | | | |
Net assets, end of period (in millions) | $ 2 | $ 5 | $ 7 | $ 8 | $ 10 |
Portfolio turnover rateE | 60%J | 57% | 65% | 68% | 75% |
A Total returns would have been lower if certain expenses had not been reduced during the applicable periods shown.
B Total returns do not include the effect of the contingent deferred sales charge.
C Calculated based on average shares outstanding during the period.
D Fees and expenses of any underlying Fidelity Central Funds are not included in the Fund's expense ratio. The Fund indirectly bears its proportionate share of the expenses of any underlying Fidelity Central Funds.
E Amount does not include the portfolio activity of any underlying Fidelity Central Funds.
F Investment income per share reflects a large, non-recurring dividend which amounted to $.12 per share. Excluding this non-recurring dividend, the ratio of net investment income (loss) to average net assets would have been (.10)%.
G Investment income per share reflects a large, non-recurring dividend which amounted to $.21 per share. Excluding this non-recurring dividend, the ratio of net investment income (loss) to average net assets would have been .02%.
H Expense ratios reflect operating expenses of the class. Expenses before reductions do not reflect amounts reimbursed by the investment adviser or reductions from brokerage service arrangements or reductions from other expense offset arrangements and do not represent the amount paid by the class during periods when reimbursements or reductions occur. Expenses net of fee waivers reflect expenses after reimbursement by the investment adviser but prior to reductions from brokerage service arrangements or other expense offset arrangements. Expenses net of all reductions represent the net expenses paid by the class.
I Amount represents less than $.005 per share.
J Portfolio turnover rate excludes securities received or delivered in-kind.
K Total distributions of $.27 per share is comprised of distributions from net investment income of $.115 and distributions from net realized gain of $.155 per share.
See accompanying notes which are an integral part of the financial statements.
Annual Report
Financial Highlights - Fidelity International Discovery Fund Class C
Years ended October 31, | 2015 | 2014 | 2013 | 2012 | 2011 |
Selected Per-Share Data | | | | | |
Net asset value, beginning of period | $ 38.25 | $ 39.07 | $ 31.32 | $ 29.08 | $ 31.68 |
Income from Investment Operations | | | | | |
Net investment income (loss) C | .10F | .23G | .08 | .19 | .18 |
Net realized and unrealized gain (loss) | .79 | (.66) | 7.90 | 2.09 | (2.49) |
Total from investment operations | .89 | (.43) | 7.98 | 2.28 | (2.31) |
Distributions from net investment income | - | (.08) | (.20) | (.04) | (.14) |
Distributions from net realized gain | - | (.31) | (.03) | - | (.16) |
Total distributions | - | (.39) | (.23) | (.04) | (.29) K |
Redemption fees added to paid in capitalC, I | - | - | - | - | - |
Net asset value, end of period | $ 39.14 | $ 38.25 | $ 39.07 | $ 31.32 | $ 29.08 |
Total ReturnA, B | 2.33% | (1.10)% | 25.65% | 7.86% | (7.37)% |
Ratios to Average Net AssetsD, H | | | | | |
Expenses before reductions | 2.09% | 2.03% | 2.10% | 2.09% | 2.05% |
Expenses net of fee waivers, if any | 2.09% | 2.03% | 2.09% | 2.09% | 2.04% |
Expenses net of all reductions | 2.08% | 2.02% | 2.07% | 2.06% | 2.00% |
Net investment income (loss) | .24%F | .60%G | .23% | .66% | .56% |
Supplemental Data | | | | | |
Net assets, end of period (in millions) | $ 32 | $ 35 | $ 36 | $ 30 | $ 33 |
Portfolio turnover rateE | 60%J | 57% | 65% | 68% | 75% |
A Total returns would have been lower if certain expenses had not been reduced during the applicable periods shown.
B Total returns do not include the effect of the contingent deferred sales charge.
C Calculated based on average shares outstanding during the period.
D Fees and expenses of any underlying Fidelity Central Funds are not included in the Fund's expense ratio. The Fund indirectly bears its proportionate share of the expenses of any underlying Fidelity Central Funds.
E Amount does not include the portfolio activity of any underlying Fidelity Central Funds.
F Investment income per share reflects a large, non-recurring dividend which amounted to $.12 per share. Excluding this non-recurring dividend, the ratio of net investment income (loss) to average net assets would have been (.06)%.
G Investment income per share reflects a large, non-recurring dividend which amounted to $.21 per share. Excluding this non-recurring dividend, the ratio of net investment income (loss) to average net assets would have been .05%.
H Expense ratios reflect operating expenses of the class. Expenses before reductions do not reflect amounts reimbursed by the investment adviser or reductions from brokerage service arrangements or reductions from other expense offset arrangements and do not represent the amount paid by the class during periods when reimbursements or reductions occur. Expenses net of fee waivers reflect expenses after reimbursement by the investment adviser but prior to reductions from brokerage service arrangements or other expense offset arrangements. Expenses net of all reductions represent the net expenses paid by the class.
I Amount represents less than $.005 per share.
J Portfolio turnover rate excludes securities received or delivered in-kind.
K Total distributions of $.29 per share is comprised of distributions from net investment income of $.137 and distributions from net realized gain of $.155 per share.
See accompanying notes which are an integral part of the financial statements.
Annual Report
Financial Highlights - Fidelity International Discovery Fund
Years ended October 31, | 2015 | 2014 | 2013 | 2012 | 2011 |
Selected Per-Share Data | | | | | |
Net asset value, beginning of period | $ 39.03 | $ 39.82 | $ 31.91 | $ 29.69 | $ 32.34 |
Income from Investment Operations | | | | | |
Net investment income (loss) B | .54E | .67F | .47 | .51 | .53 |
Net realized and unrealized gain (loss) | .81 | (.68) | 8.02 | 2.12 | (2.54) |
Total from investment operations | 1.35 | (.01) | 8.49 | 2.63 | (2.01) |
Distributions from net investment income | (.26) | (.47) | (.55) | (.41) | (.48) |
Distributions from net realized gain | - | (.31) | (.03) | - | (.16) |
Total distributions | (.26) | (.78) | (.58) | (.41) | (.64) |
Redemption fees added to paid in capitalB, H | - | - | - | - | - |
Net asset value, end of period | $ 40.12 | $ 39.03 | $ 39.82 | $ 31.91 | $ 29.69 |
Total ReturnA | 3.47% | (.01)% | 27.03% | 9.03% | (6.39)% |
Ratios to Average Net AssetsC, G | | | | | |
Expenses before reductions | .99% | .93% | 1.00% | 1.01% | .97% |
Expenses net of fee waivers, if any | .99% | .93% | 1.00% | 1.01% | .96% |
Expenses net of all reductions | .98% | .93% | .98% | �� .98% | .92% |
Net investment income (loss) | 1.34%E | 1.69%F | 1.32% | 1.73% | 1.64% |
Supplemental Data | | | | | |
Net assets, end of period (in millions) | $ 7,209 | $ 7,464 | $ 7,800 | $ 5,965 | $ 6,806 |
Portfolio turnover rateD | 60%I | 57% | 65% | 68% | 75% |
A Total returns would have been lower if certain expenses had not been reduced during the applicable periods shown.
B Calculated based on average shares outstanding during the period.
C Fees and expenses of any underlying Fidelity Central Funds are not included in the Fund's expense ratio. The Fund indirectly bears its proportionate share of the expenses of any underlying Fidelity Central Funds.
D Amount does not include the portfolio activity of any underlying Fidelity Central Funds.
E Investment income per share reflects a large, non-recurring dividend which amounted to $.12 per share. Excluding this non-recurring dividend, the ratio of net investment income (loss) to average net assets would have been 1.03%.
F Investment income per share reflects a large, non-recurring dividend which amounted to $.22 per share. Excluding this non-recurring dividend, the ratio of net investment income (loss) to average net assets would have been 1.15%.
G Expense ratios reflect operating expenses of the class. Expenses before reductions do not reflect amounts reimbursed by the investment adviser or reductions from brokerage service arrangements or reductions from other expense offset arrangements and do not represent the amount paid by the class during periods when reimbursements or reductions occur. Expenses net of fee waivers reflect expenses after reimbursement by the investment adviser but prior to reductions from brokerage service arrangements or other expense offset arrangements. Expenses net of all reductions represent the net expenses paid by the class.
H Amount represents less than $.005 per share.
I Portfolio turnover rate excludes securities received or delivered in-kind.
See accompanying notes which are an integral part of the financial statements.
Annual Report
Financial Highlights - Fidelity International Discovery Fund Class K
Years ended October 31, | 2015 | 2014 | 2013 | 2012 | 2011 |
Selected Per-Share Data | | | | | |
Net asset value, beginning of period | $ 38.97 | $ 39.76 | $ 31.87 | $ 29.66 | $ 32.32 |
Income from Investment Operations | | | | | |
Net investment income (loss) B | .59E | .72F | .52 | .57 | .58 |
Net realized and unrealized gain (loss) | .81 | (.67) | 8.01 | 2.11 | (2.54) |
Total from investment operations | 1.40 | .05 | 8.53 | 2.68 | (1.96) |
Distributions from net investment income | (.31) | (.53) | (.61) | (.47) | (.55) |
Distributions from net realized gain | - | (.31) | (.03) | - | (.16) |
Total distributions | (.31) | (.84) | (.64) | (.47) | (.70) J |
Redemption fees added to paid in capitalB, H | - | - | - | - | - |
Net asset value, end of period | $ 40.06 | $ 38.97 | $ 39.76 | $ 31.87 | $ 29.66 |
Total ReturnA | 3.61% | .13% | 27.23% | 9.24% | (6.24)% |
Ratios to Average Net AssetsC, G | | | | |
Expenses before reductions | .86% | .80% | .85% | .83% | .80% |
Expenses net of fee waivers, if any | .86% | .80% | .85% | .83% | .79% |
Expenses net of all reductions | .85% | .79% | .83% | .80% | .75% |
Net investment income (loss) | 1.47%E | 1.83%F | 1.47% | 1.91% | 1.81% |
Supplemental Data | | | | | |
Net assets, end of period (in millions) | $ 2,308 | $ 2,464 | $ 2,576 | $ 1,776 | $ 1,245 |
Portfolio turnover rateD | 60%I | 57% | 65% | 68% | 75% |
A Total returns would have been lower if certain expenses had not been reduced during the applicable periods shown.
B Calculated based on average shares outstanding during the period.
C Fees and expenses of any underlying Fidelity Central Funds are not included in the Fund's expense ratio. The Fund indirectly bears its proportionate share of the expenses of any underlying Fidelity Central Funds.
D Amount does not include the portfolio activity of any underlying Fidelity Central Funds.
E Investment income per share reflects a large, non-recurring dividend which amounted to $.12 per share. Excluding this non-recurring dividend, the ratio of net investment income (loss) to average net assets would have been 1.16%.
F Investment income per share reflects a large, non-recurring dividend which amounted to $.22 per share. Excluding this non-recurring dividend, the ratio of net investment income (loss) to average net assets would have been 1.28%.
G Expense ratios reflect operating expenses of the class. Expenses before reductions do not reflect amounts reimbursed by the investment adviser or reductions from brokerage service arrangements or reductions from other expense offset arrangements and do not represent the amount paid by the class during periods when reimbursements or reductions occur. Expenses net of fee waivers reflect expenses after reimbursement by the investment adviser but prior to reductions from brokerage service arrangements or other expense offset arrangements. Expenses net of all reductions represent the net expenses paid by the class.
H Amount represents less than $.005 per share.
I Portfolio turnover rate excludes securities received or delivered in-kind.
J Total distributions of $.70 per share is comprised of distributions from net investment income of $.548 and distributions from net realized gain of $.155 per share.
See accompanying notes which are an integral part of the financial statements.
Annual Report
Financial Highlights - Fidelity International Discovery Fund Class I
Years ended October 31, | 2015 | 2014 | 2013 | 2012 | 2011 |
Selected Per-Share Data | | | | | |
Net asset value, beginning of period | $ 38.96 | $ 39.76 | $ 31.87 | $ 29.65 | $ 32.31 |
Income from Investment Operations | | | | | |
Net investment income (loss) B | .53E | .67F | .47 | .52 | .54 |
Net realized and unrealized gain (loss) | .80 | (.68) | 8.01 | 2.11 | (2.55) |
Total from investment operations | 1.33 | (.01) | 8.48 | 2.63 | (2.01) |
Distributions from net investment income | (.26) | (.48) | (.56) | (.41) | (.50) |
Distributions from net realized gain | - | (.31) | (.03) | - | (.16) |
Total distributions | (.26) | (.79) | (.59) | (.41) | (.65) J |
Redemption fees added to paid in capitalB, H | - | - | - | - | - |
Net asset value, end of period | $ 40.03 | $ 38.96 | $ 39.76 | $ 31.87 | $ 29.65 |
Total ReturnA | 3.44% | (.01)% | 27.03% | 9.07% | (6.39)% |
Ratios to Average Net AssetsC, G | | | | | |
Expenses before reductions | 1.00% | .93% | 1.00% | 1.00% | .95% |
Expenses net of fee waivers, if any | .99% | .93% | 1.00% | 1.00% | .94% |
Expenses net of all reductions | .98% | .93% | .97% | .97% | .90% |
Net investment income (loss) | 1.33%E | 1.69%F | 1.33% | 1.75% | 1.66% |
Supplemental Data | | | | | |
Net assets, end of period (in millions) | $ 1,061 | $ 650 | $ 476 | $ 294 | $ 278 |
Portfolio turnover rateD | 60%I | 57% | 65% | 68% | 75% |
A Total returns would have been lower if certain expenses had not been reduced during the applicable periods shown.
B Calculated based on average shares outstanding during the period.
C Fees and expenses of any underlying Fidelity Central Funds are not included in the Fund's expense ratio. The Fund indirectly bears its proportionate share of the expenses of any underlying Fidelity Central Funds.
D Amount does not include the portfolio activity of any underlying Fidelity Central Funds.
E Investment income per share reflects a large, non-recurring dividend which amounted to $.12 per share. Excluding this non-recurring dividend, the ratio of net investment income (loss) to average net assets would have been 1.03%.
F Investment income per share reflects a large, non-recurring dividend which amounted to $.22 per share. Excluding this non-recurring dividend, the ratio of net investment income (loss) to average net assets would have been 1.14%.
G Expense ratios reflect operating expenses of the class. Expenses before reductions do not reflect amounts reimbursed by the investment adviser or reductions from brokerage service arrangements or reductions from other expense offset arrangements and do not represent the amount paid by the class during periods when reimbursements or reductions occur. Expenses net of fee waivers reflect expenses after reimbursement by the investment adviser but prior to reductions from brokerage service arrangements or other expense offset arrangements. Expenses net of all reductions represent the net expenses paid by the class.
H Amount represents less than $.005 per share.
I Portfolio turnover rate excludes securities received or delivered in-kind.
J Total distributions of $.65 per share is comprised of distributions from net investment income of $.497 and distributions from net realized gain of $.155 per share.
See accompanying notes which are an integral part of the financial statements.
Annual Report
Financial Highlights - Fidelity International Discovery Fund Class Z
Years ended October 31, | 2015 | 2014 | 2013 I |
Selected Per-Share Data | | | |
Net asset value, beginning of period | $ 38.96 | $ 39.77 | $ 37.22 |
Income from Investment Operations | | | |
Net investment income (loss)D | .59G | .72H | .07 |
Net realized and unrealized gain (loss) | .80 | (.68) | 2.48 |
Total from investment operations | 1.39 | .04 | 2.55 |
Distributions from net investment income | (.32) | (.54) | - |
Distributions from net realized gain | - | (.31) | - |
Total distributions | (.32) | (.85) | - |
Redemption fees added to paid in capitalD, K | - | - | - |
Net asset value, end of period | $ 40.03 | $ 38.96 | $ 39.77 |
Total ReturnB, C | 3.58% | .12% | 6.85% |
Ratios to Average Net AssetsE, J | | | |
Expenses before reductions | .86% | .80% | .85%A |
Expenses net of fee waivers, if any | .86% | .80% | .85%A |
Expenses net of all reductions | .85% | .79% | .83%A |
Net investment income (loss) | 1.47%G | 1.83%H | .76%A |
Supplemental Data | | | |
Net assets, end of period (000 omitted) | $ 30,093 | $ 35,125 | $ 107 |
Portfolio turnover rateF | 60%L | 57% | 65% |
A Annualized
B Total returns for periods of less than one year are not annualized.
C Total returns would have been lower if certain expenses had not been reduced during the applicable periods shown.
D Calculated based on average shares outstanding during the period.
E Fees and expenses of any underlying Fidelity Central Funds are not included in the Fund's expense ratio. The Fund indirectly bears its proportionate share of the expenses of any underlying Fidelity Central Funds.
F Amount does not include the portfolio activity of any underlying Fidelity Central Funds.
G Investment income per share reflects a large, non-recurring dividend which amounted to $.12 per share. Excluding this non-recurring dividend, the ratio of net investment income (loss) to average net assets would have been 1.16%.
H Investment income per share reflects a large, non-recurring dividend which amounted to $.21 per share. Excluding this non-recurring dividend, the ratio of net investment income (loss) to average net assets would have been 1.28%.
I For the period August 13, 2013 (commencement of sale of shares) to October 31, 2013.
J Expense ratios reflect operating expenses of the class. Expenses before reductions do not reflect amounts reimbursed by the investment adviser or reductions from brokerage service arrangements or reductions from other expense offset arrangements and do not represent the amount paid by the class during periods when reimbursements or reductions occur. Expense ratios before reductions for start-up periods may not be representative of larger-term operating periods. Expenses net of fee waivers reflect expenses after reimbursement by the investment adviser but prior to reductions from brokerage service arrangements or other expense offset arrangements. Expenses net of all reductions represent the net expenses paid by the class.
K Amount represents less than $.005 per share.
L Portfolio turnover rate excludes securities received or delivered in-kind.
See accompanying notes which are an integral part of the financial statements.
Annual Report
For the period ended October 31, 2015
(Amounts in thousands except percentages)
1. Organization.
Fidelity International Discovery Fund (the Fund) is a fund of Fidelity Investment Trust (the Trust) and is authorized to issue an unlimited number of shares. The Trust is registered under the Investment Company Act of 1940, as amended (the 1940 Act), as an open-end management investment company organized as a Massachusetts business trust. The Fund offers Class A, Class T, Class C, International Discovery, Class K, Class I (formerly Institutional Class) and Class Z shares, each of which, along with Class B shares, has equal rights as to assets and voting privileges. Class B shares are closed to new accounts and additional purchases, except for exchanges and reinvestments. Each class has exclusive voting rights with respect to matters that affect that class. Class B shares will automatically convert to Class A shares after a holding period of seven years from the initial date of purchase.
2. Investments in Fidelity Central Funds.
The Fund invests in Fidelity Central Funds, which are open-end investment companies generally available only to other investment companies and accounts managed by the investment adviser and its affiliates. The Fund's Schedule of Investments lists each of the Fidelity Central Funds held as of period end, if any, as an investment of the Fund, but does not include the underlying holdings of each Fidelity Central Fund. As an Investing Fund, the Fund indirectly bears its proportionate share of the expenses of the underlying Fidelity Central Funds.
The Money Market Central Funds seek preservation of capital and current income and are managed by Fidelity Investments Money Management, Inc. (FIMM), an affiliate of the investment adviser. Annualized expenses of the Money Market Central Funds as of their most recent shareholder report date are less than .005%.
A complete unaudited list of holdings for each Fidelity Central Fund is available upon request or at the Securities and Exchange Commission (the SEC) website at www.sec.gov. In addition, the financial statements of the Fidelity Central Funds, which are not covered by the Fund's Report of Independent Registered Public Accounting Firm, are available on the SEC website or upon request.
3. Significant Accounting Policies.
The financial statements have been prepared in conformity with accounting principles generally accepted in the United States of America (GAAP), which require management to make certain estimates and assumptions at the date of the financial statements. Actual results could differ from those estimates. Subsequent events, if any, through the date that the financial statements were issued have been evaluated in the preparation of
Annual Report
Notes to Financial Statements - continued
(Amounts in thousands except percentages)
3. Significant Accounting Policies - continued
the financial statements. The following summarizes the significant accounting policies of the Fund:
Investment Valuation. Investments are valued as of 4:00 p.m. Eastern time on the last calendar day of the period. The Board of Trustees (the Board) has delegated the day to day responsibility for the valuation of the Fund's investments to the Fidelity Management & Research Company (FMR) Fair Value Committee (the Committee). In accordance with valuation policies and procedures approved by the Board, the Fund attempts to obtain prices from one or more third party pricing vendors or brokers to value its investments. When current market prices, quotations or currency exchange rates are not readily available or reliable, investments will be fair valued in good faith by the Committee, in accordance with procedures adopted by the Board. Factors used in determining fair value vary by investment type and may include market or investment specific events, changes in interest rates and credit quality. The frequency with which these procedures are used cannot be predicted and they may be utilized to a significant extent. The Committee oversees the Fund's valuation policies and procedures and reports to the Board on the Committee's activities and fair value determinations. The Board monitors the appropriateness of the procedures used in valuing the Fund's investments and ratifies the fair value determinations of the Committee.
The Fund categorizes the inputs to valuation techniques used to value its investments into a disclosure hierarchy consisting of three levels as shown below:
Level 1 - quoted prices in active markets for identical investments
Level 2 - other significant observable inputs (including quoted prices for similar investments, interest rates, prepayment speeds, etc.)
Level 3 - unobservable inputs (including the Fund's own assumptions based on the best information available)
Valuation techniques used to value the Fund's investments by major category are as follows:
Equity securities, including restricted securities, for which market quotations are readily available, are valued at the last reported sale price or official closing price as reported by a third party pricing vendor on the primary market or exchange on which they are traded and are categorized as Level 1 in the hierarchy. In the event there were no sales during the day or closing prices are not available, securities are valued at the last quoted bid price or may be valued using the last available price and are generally categorized as Level 2 in the hierarchy. For foreign equity securities, when market or security specific events arise, comparisons to the valuation of American Depositary Receipts (ADRs), futures contracts, Exchange-Traded Funds (ETFs) and certain indexes as well as quoted
Annual Report
3. Significant Accounting Policies - continued
Investment Valuation - continued
prices for similar securities may be used and would be categorized as Level 2 in the hierarchy. Utilizing these techniques may result in transfers between Level 1 and Level 2. For equity securities, including restricted securities, where observable inputs are limited, assumptions about market activity and risk are used and these securities may be categorized as Level 3 in the hierarchy.
Debt securities, including restricted securities, are valued based on evaluated prices received from third party pricing vendors or from brokers who make markets in such securities. Preferred securities and U.S. government and government agency obligations are valued by pricing vendors who utilize matrix pricing which considers yield or price of bonds of comparable quality, coupon, maturity and type or by broker-supplied prices. When independent prices are unavailable or unreliable, debt securities may be valued utilizing pricing methodologies which consider similar factors that would be used by third party pricing vendors. Debt securities are generally categorized as Level 2 in the hierarchy but may be Level 3 depending on the circumstances.
Futures contracts are valued at the settlement price established each day by the board of trade or exchange on which they are traded and are categorized as Level 1 in the hierarchy. Investments in open-end mutual funds, including the Fidelity Central Funds, are valued at their closing net asset value (NAV) each business day and are categorized as Level 1 in the hierarchy.
Changes in valuation techniques may result in transfers in or out of an assigned level within the disclosure hierarchy. The aggregate value of investments by input level as of October 31, 2015, including information on transfers between Levels 1 and 2 is included at the end of the Fund's Schedule of Investments.
Foreign Currency. The Fund may use foreign currency contracts to facilitate transactions in foreign-denominated securities. Gains and losses from these transactions may arise from changes in the value of the foreign currency or if the counterparties do not perform under the contracts' terms.
Foreign-denominated assets, including investment securities, and liabilities are translated into U.S. dollars at the exchange rates at period end. Purchases and sales of investment securities, income and dividends received and expenses denominated in foreign currencies are translated into U.S. dollars at the exchange rate in effect on the transaction date.
The effects of exchange rate fluctuations on investments are included with the net realized and unrealized gain (loss) on investment securities. Other foreign currency transactions resulting in realized and unrealized gain (loss) are disclosed separately.
Annual Report
Notes to Financial Statements - continued
(Amounts in thousands except percentages)
3. Significant Accounting Policies - continued
Investment Transactions and Income. For financial reporting purposes, the Fund's investment holdings and NAV include trades executed through the end of the last business day of the period. The NAV per share for processing shareholder transactions is calculated as of the close of business of the New York Stock Exchange (NYSE), normally 4:00 p.m. Eastern time and includes trades executed through the end of the prior business day. Gains and losses on securities sold are determined on the basis of identified cost and may include proceeds received from litigation. Dividend income is recorded on the ex-dividend date, except for certain dividends from foreign securities where the ex-dividend date may have passed, which are recorded as soon as the Fund is informed of the ex-dividend date. Non-cash dividends included in dividend income, if any, are recorded at the fair market value of the securities received. Income and capital gain distributions from Fidelity Central Funds, if any, are recorded on the ex-dividend date. Distributions received on securities that represent a return of capital or capital gain are recorded as a reduction of cost of investments and/or as a realized gain. Subsequent to ex-dividend date the Fund determines the components of these distributions, based upon receipt of tax filings or other correspondence relating to the underlying investment. Large, non-recurring dividends recognized by the Fund are presented separately on the Statement of Operations as "Special Dividends" and the impact of these dividends is presented in the Financial Highlights. Interest income is accrued as earned and includes coupon interest and amortization of premium and accretion of discount on debt securities as applicable. Investment income is recorded net of foreign taxes withheld where recovery of such taxes is uncertain.
Class Allocations and Expenses. Investment income, realized and unrealized capital gains and losses, common expenses of the Fund, and certain fund-level expense reductions, if any, are allocated daily on a pro-rata basis to each class based on the relative net assets of each class to the total net assets of the Fund. Each class differs with respect to transfer agent and distribution and service plan fees incurred. Certain expense reductions may also differ by class. For the reporting period, the allocated portion of income and expenses to each class as a percent of its average net assets may vary due to the timing of recording these transactions in relation to fluctuating net assets of the classes. Expenses directly attributable to a fund are charged to that fund. Expenses attributable to more than one fund are allocated among the respective funds on the basis of relative net assets or other appropriate methods. Expense estimates are accrued in the period to which they relate and adjustments are made when actual amounts are known.
Deferred Trustee Compensation. Under a Deferred Compensation Plan (the Plan), independent Trustees may elect to defer receipt of a portion of their annual compensation. Deferred amounts are invested in a cross-section of Fidelity funds, are marked-to-market and remain in the Fund until distributed in accordance with the Plan. The
Annual Report
3. Significant Accounting Policies - continued
Deferred Trustee Compensation - continued
investment of deferred amounts and the offsetting payable to the Trustees are included in the accompanying Statement of Assets and Liabilities.
Income Tax Information and Distributions to Shareholders. Each year, the Fund intends to qualify as a regulated investment company under Subchapter M of the Internal Revenue Code, including distributing substantially all of its taxable income and realized gains. As a result, no provision for U.S. Federal income taxes is required. As of October 31, 2015, the Fund did not have any unrecognized tax benefits in the financial statements; nor is the Fund aware of any tax positions for which it is reasonably possible that the total amounts of unrecognized tax benefits will significantly change in the next twelve months. The Fund files a U.S. federal tax return, in addition to state and local tax returns as required. The Fund's federal income tax returns are subject to examination by the Internal Revenue Service (IRS) for a period of three fiscal years after they are filed. State and local tax returns may be subject to examination for an additional fiscal year depending on the jurisdiction. Foreign taxes are provided for based on the Fund's understanding of the tax rules and rates that exist in the foreign markets in which it invests. The Fund is subject to a tax imposed on capital gains by certain countries in which it invests.
Distributions are declared and recorded on the ex-dividend date. Income dividends and capital gain distributions are declared separately for each class. Income and capital gain distributions are determined in accordance with income tax regulations, which may differ from GAAP. In addition, the Fund claimed a portion of the payment made to redeeming shareholders as a distribution for income tax purposes.
Capital accounts within the financial statements are adjusted for permanent book-tax differences. These adjustments have no impact on net assets or the results of operations. Capital accounts are not adjusted for temporary book-tax differences which will reverse in a subsequent period.
Book-tax differences are primarily due to futures contracts, foreign currency transactions, passive foreign investment companies (PFIC), market discount, certain foreign taxes, redemptions in-kind, deferred trustees compensation, capital loss carryforwards and losses deferred due to wash sales.
The federal tax cost of investment securities and unrealized appreciation (depreciation) as of period end were as follows:
Gross unrealized appreciation | $ 1,751,994 |
Gross unrealized depreciation | (459,470) |
Net unrealized appreciation (depreciation) on securities | $ 1,292,524 |
Tax Cost | $ 9,797,500 |
Annual Report
Notes to Financial Statements - continued
(Amounts in thousands except percentages)
3. Significant Accounting Policies - continued
Income Tax Information and Distributions to Shareholders - continued
The tax-based components of distributable earnings as of period end were as follows:
Undistributed ordinary income | $ 109,669 |
Capital loss carryforward | $ (49,248) |
Net unrealized appreciation (depreciation) on securities and other investments | $ 1,292,925 |
Capital loss carryforwards are only available to offset future capital gains of the Fund to the extent provided by regulations and may be limited. Under the Regulated Investment Company Modernization Act of 2010 (the Act), the Fund is permitted to carry forward capital losses incurred in taxable years beginning after December 22, 2010 for an unlimited period and such capital losses are required to be used prior to any losses that expire. The capital loss carryforward information presented below, including any applicable limitation, is estimated as of fiscal period end and is subject to adjustment.
Fiscal year of expiration | |
2017 | $ (49,248) |
The tax character of distributions paid was as follows:
| October 31, 2015 | October 31, 2014 |
Ordinary Income | $ 74,589 | $ 224,912 |
Short-Term Trading (Redemption) Fees. Shares held by investors in the Fund less than 30 days may have been subject to a redemption fee equal to 1.00% of the NAV of shares redeemed. All redemption fees, which reduce the proceeds of the shareholder redemption, are retained by the Fund and accounted for as an addition to paid in capital.
Delayed Delivery Transactions and When-Issued Securities. During the period, the Fund transacted in securities on a delayed delivery or when-issued basis. Payment and delivery may take place after the customary settlement period for that security. The price of the underlying securities and the date when the securities will be delivered and paid for are fixed at the time the transaction is negotiated. The securities purchased on a delayed delivery or when-issued basis are identified as such in the Fund's Schedule of Investments. The Fund may receive compensation for interest forgone in the purchase of a delayed delivery or when-issued security. With respect to purchase commitments, the Fund identifies securities as segregated in its records with a value at least equal to the amount of the commitment. Losses may arise due to changes in the value of the underlying securities or if the counterparty does not perform under the contract's terms, or if the issuer does not issue the securities due to political, economic, or other factors.
Annual Report
3. Significant Accounting Policies - continued
Restricted Securities. The Fund may invest in securities that are subject to legal or contractual restrictions on resale. These securities generally may be resold in transactions exempt from registration or to the public if the securities are registered. Disposal of these securities may involve time-consuming negotiations and expense, and prompt sale at an acceptable price may be difficult. Information regarding restricted securities is included at the end of the Fund's Schedule of Investments.
4. Derivative Instruments.
Risk Exposures and the Use of Derivative Instruments. The Fund's investment objective allows the Fund to enter into various types of derivative contracts, including futures contracts. Derivatives are investments whose value is primarily derived from underlying assets, indices or reference rates and may be transacted on an exchange or over-the-counter (OTC). Derivatives may involve a future commitment to buy or sell a specified asset based on specified terms, to exchange future cash flows at periodic intervals based on a notional principal amount, or for one party to make one or more payments upon the occurrence of specified events in exchange for periodic payments from the other party.
The Fund used derivatives to increase returns and to manage exposure to certain risks as defined below. The success of any strategy involving derivatives depends on analysis of numerous economic factors, and if the strategies for investment do not work as intended, the Fund may not achieve its objectives.
The Fund's use of derivatives increased or decreased its exposure to the following risk:
Equity Risk | Equity risk relates to the fluctuations in the value of financial instruments as a result of changes in market prices (other than those arising from interest rate risk or foreign exchange risk), whether caused by factors specific to an individual investment, its issuer, or all factors affecting all instruments traded in a market or market segment. |
The Fund is also exposed to additional risks from investing in derivatives, such as liquidity risk and counterparty credit risk. Liquidity risk is the risk that the Fund will be unable to close out the derivative in the open market in a timely manner. Counterparty credit risk is the risk that the counterparty will not be able to fulfill its obligation to the Fund. Counterparty credit risk related to exchange-traded futures contracts may be mitigated by the protection provided by the exchange on which they trade.
Investing in derivatives may involve greater risks than investing in the underlying assets directly and, to varying degrees, may involve risk of loss in excess of any initial investment and collateral received and amounts recognized in the Statement of Assets and Liabilities. In addition, there may be the risk that the change in value of the derivative contract does not correspond to the change in value of the underlying instrument.
Annual Report
Notes to Financial Statements - continued
(Amounts in thousands except percentages)
4. Derivative Instruments - continued
Futures Contracts. A futures contract is an agreement between two parties to buy or sell a specified underlying instrument for a fixed price at a specified future date. The Fund used futures contracts to manage its exposure to the stock market.
Upon entering into a futures contract, a fund is required to deposit either cash or securities (initial margin) with a clearing broker in an amount equal to a certain percentage of the face value of the contract. Futures contracts are marked-to-market daily and subsequent daily payments (variation margin) are made or received by a fund depending on the daily fluctuations in the value of the futures contracts and are recorded as unrealized appreciation or (depreciation). This receivable and/or payable, if any, is included in daily variation margin for derivative instruments in the Statement of Assets and Liabilities. Realized gain or (loss) is recorded upon the expiration or closing of a futures contract.
Any open futures contracts at period end are presented in the Schedule of Investments under the caption "Futures Contracts." The underlying face amount at value reflects each contract's exposure to the underlying instrument or index at period end. Securities deposited to meet initial margin requirements are identified in the Schedule of Investments. Cash deposited to meet initial margin requirements is presented as segregated cash with brokers for derivative instruments in the Statement of Assets and Liabilities.
During the period the Fund recognized net realized gain (loss) of $33,241 and a change in net unrealized appreciation (depreciation) of $(15,395) related to its investment in futures contracts. These amounts are included in the Statement of Operations.
5. Purchases and Sales of Investments.
Purchases and sales of securities, other than short-term securities and in-kind transactions, aggregated $6,392,387 and $6,317,742, respectively.
Redemptions In-Kind. During the period, 4,932 shares of the Fund held by unaffiliated entities were redeemed for cash and investments, including accrued interest with a value of $197,848. The net realized gain of $41,387 on investments delivered through in-kind redemptions is included in the accompanying Statement of Operations. The amount of in-kind redemptions is included in share transactions in the accompanying Statement of Changes in Net Assets as well as Note 11: Share Transactions. The Fund recognized no gain or loss for federal income tax purposes.
6. Fees and Other Transactions with Affiliates.
Management Fee. Fidelity Management & Research Company (the investment adviser) and its affiliates provide the Fund with investment management related services for which the Fund pays a monthly management fee. The management fee is the
Annual Report
6. Fees and Other Transactions with Affiliates - continued
Management Fee - continued
sum of an individual fund fee rate that is based on an annual rate of .424% of the Fund's average net assets and an annualized group fee rate that averaged .25% during the period. The group fee rate is based upon the average net assets of all the mutual funds advised by the investment adviser, including any mutual funds previously advised by the investment adviser that are currently advised by Fidelity SelectCo, LLC, an affiliate of the investment adviser. The group fee rate decreases as assets under management increase and increases as assets under management decrease. In addition, the management fee is subject to a performance adjustment (up to a maximum of ± .20% of the Fund's average net assets over a 36 month performance period). The upward or downward adjustment to the management fee is based on the relative investment performance of International Discovery as compared to its benchmark index, the MSCI EAFE Index, over the same 36 month performance period. For the reporting period, the total annual management fee rate, including the performance adjustment, was .78% of the Fund's average net assets. The performance adjustment included in the management fee rate may be higher or lower than the maximum performance adjustment rate due to the difference between the average net assets for the reporting and performance periods.
Distribution and Service Plan Fees. In accordance with Rule 12b-1 of the 1940 Act, the Fund has adopted separate Distribution and Service Plans for each class of shares. Certain classes pay Fidelity Distributors Corporation (FDC), an affiliate of the investment adviser, separate Distribution and Service Fees, each of which is based on an annual percentage of each class' average net assets. In addition, FDC may pay financial intermediaries for selling shares of the Fund and providing shareholder support services.
For the period, the Distribution and Service Fee rates, total fees and amounts retained by FDC were as follows:
| Distribution
Fee | Service
Fee | Total Fees | Retained
by FDC |
Class A | -% | .25% | $ 731 | $ 4 |
Class T | .25% | .25% | 229 | 1 |
Class B | .75% | .25% | 34 | 25 |
Class C | .75% | .25% | 343 | 37 |
| | | $ 1,337 | $ 67 |
Sales Load. FDC may receive a front-end sales charge of up to 5.75% for selling Class A shares and 3.50% for selling Class T shares, some of which is paid to financial intermediaries for selling shares of the Fund. Depending on the holding period, FDC may receive contingent deferred sales charges levied on Class A, Class T, Class B, and Class C redemptions. The deferred sales charges range from 5.00% to 1.00% for Class B shares, 1.00% for Class C shares, 1.00% for certain purchases of Class A shares and .25% for certain purchases of Class T shares.
Annual Report
Notes to Financial Statements - continued
(Amounts in thousands except percentages)
6. Fees and Other Transactions with Affiliates - continued
Sales Load - continued
For the period, sales charge amounts retained by FDC were as follows:
| Retained
by FDC |
Class A | $ 62 |
Class T | 7 |
Class B A | 1 |
Class C A | 3 |
| $ 73 |
A When Class B and Class C shares are initially sold, FDC pays commissions from its own resources to financial intermediaries through which the sales are made.
Transfer Agent Fees. Fidelity Investments Institutional Operations Company, Inc., (FIIOC), an affiliate of the investment adviser, is the transfer, dividend disbursing and shareholder servicing agent for each class of the Fund. FIIOC receives account fees and asset-based fees that vary according to the account size and type of account of the shareholders of the respective classes of the Fund, except for Class K and Class Z. FIIOC receives an asset-based fee of Class K's and Class Z's average net assets. FIIOC pays for typesetting, printing and mailing of shareholder reports, except proxy statements.
For the period, transfer agent fees for each class were as follows:
| Amount | % of
Class-Level Average
Net Assets |
Class A | $ 788 | .27 |
Class T | 117 | .26 |
Class B | 10 | .30 |
Class C | 93 | .27 |
International Discovery | 13,037 | .18 |
Class K | 1,135 | .05 |
Class I | 1,576 | .18 |
Class Z | 17 | .05 |
| $ 16,773 | |
Accounting and Security Lending Fees. Fidelity Service Company, Inc. (FSC), an affiliate of the investment adviser, maintains the Fund's accounting records. The accounting fee is based on the level of average net assets for each month. Under a separate contract, FSC administers the security lending program. The security lending fee is based on the number and duration of lending transactions.
Annual Report
6. Fees and Other Transactions with Affiliates - continued
Brokerage Commissions. The Fund placed a portion of its portfolio transactions with brokerage firms which are affiliates of the investment adviser. Brokerage commissions are included in net realized gain (loss) and change in net unrealized appreciation (depreciation) in the Statement of Operations. The commissions paid to these affiliated firms were $6 for the period.
Other. During the period, the investment adviser reimbursed the Fund for certain losses in the amount of $46
7. Committed Line of Credit.
The Fund participates with other funds managed by the investment adviser or an affiliate in a $4.25 billion credit facility (the "line of credit") to be utilized for temporary or emergency purposes to fund shareholder redemptions or for other short-term liquidity purposes. The Fund has agreed to pay commitment fees on its pro-rata portion of the line of credit, which amounted to $16 and is reflected in Miscellaneous expenses on the Statement of Operations. During the period, the Fund did not borrow on this line of credit.
8. Security Lending.
The Fund lends portfolio securities through a lending agent from time to time in order to earn additional income. For equity securities, a lending agent is used and may loan securities to certain qualified borrowers, including Fidelity Capital Markets (FCM), a broker-dealer affiliated with the Fund. On the settlement date of the loan, the Fund receives collateral (in the form of U.S. Treasury obligations, letters of credit and/or cash) against the loaned securities and maintains collateral in an amount not less than 100% of the market value of the loaned securities during the period of the loan. The market value of the loaned securities is determined at the close of business of the Fund and any additional required collateral is delivered to the Fund on the next business day. The Fund or borrower may terminate the loan at any time, and if the borrower defaults on its obligation to return the securities loaned because of insolvency or other reasons, the Fund may apply collateral received from the borrower against the obligation. The Fund may experience delays and costs in recovering the securities loaned. Any cash collateral received is invested in the Fidelity Securities Lending Cash Central Fund. The value of loaned securities and cash collateral at period end are disclosed on the Fund's Statement of Assets and Liabilities. Security lending income represents the income earned on investing cash collateral, less rebates paid to borrowers and any lending agent fees associated with the loan, plus any premium payments received for lending certain types of securities. Security lending income is presented in the Statement of Operations as a component of income from Fidelity Central Funds. Total security lending income during the period amounted to $3,281. During the period, there were no securities loaned to FCM.
Annual Report
Notes to Financial Statements - continued
(Amounts in thousands except percentages)
9. Expense Reductions.
Commissions paid to certain brokers with whom the investment adviser, or its affiliates, places trades on behalf of the Fund include an amount in addition to trade execution, which may be rebated back to the Fund to offset certain expenses. This amount totaled $1,110 for the period.
In addition, during the period the investment adviser reimbursed and/or waived a portion of fund-level operating expenses in the amount of $45 and a portion of class-level operating expenses as follows:
| Amount |
Class A | $ 6 |
Class T | 1 |
Class B | -* |
Class C | 1 |
International Discovery | 177 |
Class I | 13 |
| $ 198 |
* In the amount of less than five hundred dollars.
10. Distributions to Shareholders.
Distributions to shareholders of each class were as follows:
Years ended October 31, | 2015 | 2014 |
From net investment income | | |
Class A | $ 864 | $ 2,857 |
Class T | 23 | 344 |
Class B | - | 2 |
Class C | - | 79 |
International Discovery | 49,040 | 93,065 |
Class K | 19,835 | 33,983 |
Class I | 4,544 | 5,936 |
Class Z | 283 | 60 |
Total | $ 74,589 | $ 136,326 |
From net realized gain | | |
Class A | $ - | $ 2,660 |
Class T | - | 423 |
Class B | - | 52 |
Class C | - | 295 |
International Discovery | - | 61,190 |
Class K | - | 20,093 |
Class I | - | 3,838 |
Class Z | - | 35 |
Total | $ - | $ 88,586 |
Annual Report
11. Share Transactions.
Share transactions for each class were as follows and may contain automatic conversions between classes or exchanges between funds:
| Shares | Dollars |
Years ended October 31, | 2015 | 2014 | 2015 | 2014 |
Class A | | | | |
Shares sold | 1,331 | 1,382 | $ 53,289 | $ 54,489 |
Reinvestment of distributions | 22 | 137 | 843 | 5,280 |
Shares redeemed | (1,915) | (2,632) | (76,178) | (104,067) |
Net increase (decrease) | (562) | (1,113) | $ (22,046) | $ (44,298) |
Class T | | | | |
Shares sold | 178 | 200 | $ 7,105 | $ 7,804 |
Reinvestment of distributions | 1 | 19 | 23 | 736 |
Shares redeemed | (355) | (311) | (13,954) | (12,118) |
Net increase (decrease) | (176) | (92) | $ (6,826) | $ (3,578) |
Class B | | | | |
Shares sold | 1 | 6 | $ 53 | $ 233 |
Reinvestment of distributions | - | 1 | - | 51 |
Shares redeemed | (64) | (58) | (2,536) | (2,266) |
Net increase (decrease) | (63) | (51) | $ (2,483) | $ (1,982) |
Class C | | | | |
Shares sold | 201 | 232 | $ 7,918 | $ 9,059 |
Reinvestment of distributions | - | 9 | - | 337 |
Shares redeemed | (314) | (250) | (12,486) | (9,726) |
Net increase (decrease) | (113) | (9) | $ (4,568) | $ (330) |
International Discovery | | | | |
Shares sold | 20,827 | 28,809 | $ 832,233 | $ 1,144,588 |
Reinvestment of distributions | 1,199 | 3,813 | 46,913 | 148,138 |
Shares redeemed | (33,573) | (37,231) | (1,345,593) | (1,476,965) |
Net increase (decrease) | (11,547) | (4,609) | $ (466,447) | $ (184,239) |
Class K | | | | |
Shares sold | 15,372 | 15,775 | $ 613,737 | $ 628,261 |
Reinvestment of distributions | 508 | 1,396 | 19,835 | 54,076 |
Shares redeemed | (21,494) A | (18,729) | (860,632) A | (741,205) |
Net increase (decrease) | (5,614) | (1,558) | $ (227,060) | $ (58,868) |
Class I | | | | |
Shares sold | 15,392 | 10,468 | $ 602,134 | $ 410,346 |
Reinvestment of distributions | 33 | 91 | 1,286 | 3,529 |
Shares redeemed | (5,606) | (5,852) | (221,504) | (225,868) |
Net increase (decrease) | 9,819 | 4,707 | $ 381,916 | $ 188,007 |
Class Z | | | | |
Shares sold | 402 | 993 | $ 16,312 | $ 39,070 |
Reinvestment of distributions | 7 | 2 | 283 | 95 |
Shares redeemed | (559) | (96) | (22,228) | (3,785) |
Net increase (decrease) | (150) | 899 | $ (5,633) | $ 35,380 |
A Amount includes in-kind redemptions (see Note 5: Redemptions In-Kind).
Annual Report
Notes to Financial Statements - continued
(Amounts in thousands except percentages)
12. Other.
The Fund's organizational documents provide former and current trustees and officers with a limited indemnification against liabilities arising in connection with the performance of their duties to the Fund. In the normal course of business, the Fund may also enter into contracts that provide general indemnifications. The Fund's maximum exposure under these arrangements is unknown as this would be dependent on future claims that may be made against the Fund. The risk of material loss from such claims is considered remote.
At the end of the period, Strategic Advisers International Fund was the owner of record of approximately 13% of the total outstanding shares of the Fund.
Annual Report
To the Trustees of Fidelity Investment Trust and the Shareholders of Fidelity International Discovery Fund:
In our opinion, the accompanying statement of assets and liabilities, including the schedule of investments, and the related statements of operations and of changes in net assets and the financial highlights present fairly, in all material respects, the financial position of Fidelity International Discovery Fund (a fund of Fidelity Investment Trust) at October 31, 2015, the results of its operations for the year then ended, the changes in its net assets for each of the two years in the period then ended and the financial highlights for each of the five years in the period then ended, in conformity with accounting principles generally accepted in the United States of America. These financial statements and financial highlights (hereafter referred to as "financial statements") are the responsibility of the Fidelity International Discovery Fund's management. Our responsibility is to express an opinion on these financial statements based on our audits. We conducted our audits of these financial statements in accordance with the standards of the Public Company Accounting Oversight Board (United States). Those standards require that we plan and perform the audit to obtain reasonable assurance about whether the financial statements are free of material misstatement. An audit includes examining, on a test basis, evidence supporting the amounts and disclosures in the financial statements, assessing the accounting principles used and significant estimates made by management, and evaluating the overall financial statement presentation. We believe that our audits, which included confirmation of securities at October 31, 2015 by correspondence with the custodian and brokers, provide a reasonable basis for our opinion.
PricewaterhouseCoopers LLP
Boston, Massachusetts
December 16, 2015
Annual Report
The Trustees, Member of the Advisory Board, and officers of the trust and fund, as applicable, are listed below. The Board of Trustees governs the fund and is responsible for protecting the interests of shareholders. The Trustees are experienced executives who meet periodically throughout the year to oversee the fund's activities, review contractual arrangements with companies that provide services to the fund, oversee management of the risks associated with such activities and contractual arrangements, and review the fund's performance. Each of the Trustees oversees 170 funds.
The Trustees hold office without limit in time except that (a) any Trustee may resign; (b) any Trustee may be removed by written instrument, signed by at least two-thirds of the number of Trustees prior to such removal; (c) any Trustee who requests to be retired or who has become incapacitated by illness or injury may be retired by written instrument signed by a majority of the other Trustees; and (d) any Trustee may be removed at any special meeting of shareholders by a two-thirds vote of the outstanding voting securities of the trust. Each Trustee who is not an interested person (as defined in the 1940 Act) of the trust and the fund (Independent Trustee), shall retire not later than the last day of the calendar year in which his or her 75th birthday occurs. The Independent Trustees may waive this mandatory retirement age policy with respect to individual Trustees. The officers and Advisory Board Member hold office without limit in time, except that any officer and Advisory Board Member may resign or may be removed by a vote of a majority of the Trustees at any regular meeting or any special meeting of the Trustees. Except as indicated, each individual has held the office shown or other offices in the same company for the past five years.
Experience, Skills, Attributes, and Qualifications of the Fund's Trustees. The Governance and Nominating Committee has adopted a statement of policy that describes the experience, qualifications, attributes, and skills that are necessary and desirable for potential Independent Trustee candidates (Statement of Policy). The Board believes that each Trustee satisfied at the time he or she was initially elected or appointed a Trustee, and continues to satisfy, the standards contemplated by the Statement of Policy. The Governance and Nominating Committee also engages professional search firms to help identify potential Independent Trustee candidates who have the experience, qualifications, attributes, and skills consistent with the Statement of Policy. From time to time, additional criteria based on the composition and skills of the current Independent Trustees, as well as experience or skills that may be appropriate in light of future changes to board composition, business conditions, and regulatory or other developments, have also been considered by the professional search firms and the Governance and Nominating Committee. In addition, the Board takes into account the Trustees' commitment and participation in Board and committee meetings, as well as their leadership of standing and ad hoc committees throughout their tenure.
In determining that a particular Trustee was and continues to be qualified to serve as a Trustee, the Board has considered a variety of criteria, none of which, in isolation, was controlling. The Board believes that, collectively, the Trustees have balanced and diverse experience, qualifications, attributes, and skills, which allow the Board to operate effectively in governing the fund and protecting the interests of shareholders. Information about the specific experience, skills, attributes, and qualifications of each Trustee, which in each case led to the Board's conclusion that the Trustee should serve (or continue to serve) as a trustee of the fund, is provided below.
Annual Report
Board Structure and Oversight Function. James C. Curvey is an interested person (as defined in the 1940 Act) and currently serves as Chairman. The Trustees have determined that an interested Chairman is appropriate and benefits shareholders because an interested Chairman has a personal and professional stake in the quality and continuity of services provided to the fund. Independent Trustees exercise their informed business judgment to appoint an individual of their choosing to serve as Chairman, regardless of whether the Trustee happens to be independent or a member of management. The Independent Trustees have determined that they can act independently and effectively without having an Independent Trustee serve as Chairman and that a key structural component for assuring that they are in a position to do so is for the Independent Trustees to constitute a substantial majority for the Board. The Independent Trustees also regularly meet in executive session. Ned C. Lautenbach serves as Chairman of the Independent Trustees and as such (i) acts as a liaison between the Independent Trustees and management with respect to matters important to the Independent Trustees and (ii) with management prepares agendas for Board meetings.
Fidelity funds are overseen by different Boards of Trustees. The fund's Board oversees Fidelity's high income and certain equity funds, and other Boards oversee Fidelity's investment-grade bond, money market, asset allocation, and sector funds. The asset allocation funds may invest in Fidelity funds overseen by the fund's Board. The use of separate Boards, each with its own committee structure, allows the Trustees of each group of Fidelity funds to focus on the unique issues of the funds they oversee, including common research, investment, and operational issues. On occasion, the separate Boards establish joint committees to address issues of overlapping consequences for the Fidelity funds overseen by each Board.
The Trustees operate using a system of committees to facilitate the timely and efficient consideration of all matters of importance to the Trustees, the fund, and fund shareholders and to facilitate compliance with legal and regulatory requirements and oversight of the fund's activities and associated risks. The Board, acting through its committees, has charged FMR and its affiliates with (i) identifying events or circumstances the occurrence of which could have demonstrably adverse effects on the fund's business and/or reputation; (ii) implementing processes and controls to lessen the possibility that such events or circumstances occur or to mitigate the effects of such events or circumstances if they do occur; and (iii) creating and maintaining a system designed to evaluate continuously business and market conditions in order to facilitate the identification and implementation processes described in (i) and (ii) above. Because the day-to-day operations and activities of the fund are carried out by or through FMR, its affiliates and other service providers, the fund's exposure to risks is mitigated but not eliminated by the processes overseen by the Trustees. While each of the Board's committees has responsibility for overseeing different aspects of the fund's activities, oversight is exercised primarily through the Operations, Audit, and Compliance Committees. In addition, the Independent Trustees have worked with FMR to enhance the Board's oversight of investment and financial risks, legal and regulatory risks, technology risks, and operational risks, including the development of additional risk reporting to the Board. For example, a working group comprised of Independent Trustees and FMR has worked and continues to work to review the Fidelity funds' valuation-related activities, reporting and risk management. Appropriate personnel, including but not limited to the fund's Chief Compliance Officer (CCO), FMR's internal auditor, the independent accountants, the fund's Treasurer and portfolio management personnel, make periodic reports to the Board's committees, as appropriate, including an annual review of Fidelity's risk management program for the Fidelity funds. The responsibilities of each standing committee, including their oversight responsibilities, are described further under "Standing Committees of the Fund's Trustees."
Annual Report
Trustees and Officers - continued
The fund's Statement of Additional Information (SAI) includes more information about the Trustees. To request a free copy, call Fidelity at 1-800-835-5092.
Interested Trustees*:
Correspondence intended for each Trustee who is an interested person may be sent to Fidelity Investments, 245 Summer Street, Boston, Massachusetts 02210.
Name, Year of Birth; Principal Occupations and Other Relevant Experience+ |
James C. Curvey (1935) |
Year of Election or Appointment: 2007 Trustee Chairman of the Board of Trustees |
| Mr. Curvey also serves as Trustee of other Fidelity funds. Mr. Curvey is a Director of Fidelity Research & Analysis Co. (investment adviser firm, 2009-present), and Vice Chairman (2007-present) and Director of FMR LLC (diversified financial services company). In addition, Mr. Curvey serves as an Overseer for the Boston Symphony Orchestra and a member of the board of Artis-Naples, Naples, Florida, and as a Trustee for Brewster Academy, Wolfeboro, New Hampshire. Previously, Mr. Curvey served as a Director of Fidelity Investments Money Management, Inc. (investment adviser firm, 2009-2014) and a Director of FMR and FMR Co., Inc. (investment adviser firms, 2007-2014). |
Charles S. Morrison (1960) |
Year of Election or Appointment: 2014 Trustee |
| Mr. Morrison also serves as Trustee of other funds. He serves as a Director of Fidelity Investments Money Management, Inc. (FIMM) (investment adviser firm, 2014-present), Director of Fidelity SelectCo, LLC (investment adviser firm, 2014-present), President, Asset Management (2014-present), and is an employee of Fidelity Investments. Previously, Mr. Morrison served as Vice President of Fidelity's Fixed Income and Asset Allocation Funds (2012-2014), President, Fixed Income (2011-2014), Vice President of Fidelity's Money Market Funds (2005-2009), President, Money Market Group Leader of FMR (investment adviser firm, 2009), and Senior Vice President, Money Market Group of FMR (2004-2009). Mr. Morrison also served as Vice President of Fidelity's Bond Funds (2002-2005), certain Balanced Funds (2002-2005), and certain Asset Allocation Funds (2002-2007), and as Senior Vice President (2002-2005) of Fidelity's Bond Division. |
* Trustees have been determined to be "Interested Trustees" by virtue of, among other things, their affiliation with the trust or various entities under common control with FMR.
+ The information above includes each Trustee's principal occupation during the last five years and other information relating to the experience, attributes, and skills relevant to each Trustee's qualifications to serve as a Trustee, which led to the conclusion that each Trustee should serve as a Trustee for the fund.
Annual Report
Trustees and Officers - continued
Independent Trustees:
Correspondence intended for each Independent Trustee (that is, the Trustees other than the Interested Trustees) may be sent to Fidelity Investments, P.O. Box 55235, Boston, Massachusetts 02205-5235.
Name, Year of Birth; Principal Occupations and Other Relevant Experience+ |
Dennis J. Dirks (1948) |
Year of Election or Appointment: 2005 Trustee |
| Mr. Dirks also serves as Trustee of other Fidelity funds. Prior to his retirement in May 2003, Mr. Dirks was Chief Operating Officer and a member of the Board of The Depository Trust & Clearing Corporation (DTCC). He also served as President, Chief Operating Officer, and Board member of The Depository Trust Company (DTC) and President and Board member of the National Securities Clearing Corporation (NSCC). In addition, Mr. Dirks served as Chief Executive Officer and Board member of the Government Securities Clearing Corporation, Chief Executive Officer and Board member of the Mortgage-Backed Securities Clearing Corporation, as a Trustee and a member of the Finance Committee of Manhattan College (2005-2008), as a Trustee and a member of the Finance Committee of AHRC of Nassau County (2006-2008), and as a member of the Independent Directors Council (IDC) Governing Council (2010-2015). Mr. Dirks is a member of the Board of Directors for The Brookville Center for Children's Services, Inc. (2009-present). |
Alan J. Lacy (1953) |
Year of Election or Appointment: 2008 Trustee |
| Mr. Lacy also serves as Trustee of other Fidelity funds. Mr. Lacy serves as a member of the Board of Directors of Dave & Buster's Entertainment, Inc. (restaurant and entertainment complexes, 2010-present) and Bristol-Myers Squibb Company (global pharmaceuticals, 2008-present). In addition, Mr. Lacy served as Senior Adviser (2007-2014) of Oak Hill Capital Partners, L.P. (private equity) and also served as Chief Executive Officer (2000-2005) and Vice Chairman (2005-2006) of Sears Holdings Corporation and Sears, Roebuck and Co. (retail). Mr. Lacy is a member of the Board of Trustees of The National Parks Conservation Association (2006-present). Previously, Mr. Lacy served as Chairman of the Board of Trustees of the National Parks Conservation Association (2008-2011) and as a member of the Board of Directors for The Western Union Company (global money transfer, 2006-2011), The Hillman Companies, Inc. (hardware wholesalers, 2010-2014), and Earth Fare, Inc. (retail grocery, 2010-2014). |
Ned C. Lautenbach (1944) |
Year of Election or Appointment: 2000 Trustee Chairman of the Independent Trustees |
| Mr. Lautenbach also serves as Trustee of other Fidelity funds. Mr. Lautenbach currently serves as the Lead Director of the Eaton Corporation Board of Directors (diversified industrial, 1997-present). Mr. Lautenbach is Chairman of the Board of Directors of Artis-Naples in Naples, Florida (2012-present), a member of the Council on Foreign Relations (1994-present), and a member of the Board of Governors, State University System of Florida (2013-present). Previously, Mr. Lautenbach was a Partner/Advisory Partner at Clayton, Dubilier & Rice, LLC (private equity investment, 1998-2010), as well as a Director of Sony Corporation (2006-2007). |
Joseph Mauriello (1944) |
Year of Election or Appointment: 2008 Trustee |
| Mr. Mauriello also serves as Trustee of other Fidelity funds. Prior to his retirement in January 2006, Mr. Mauriello served in numerous senior management positions including Deputy Chairman and Chief Operating Officer (2004-2005), and Vice Chairman of Financial Services (2002-2004) of KPMG LLP US (professional services, 1965-2005). Mr. Mauriello currently serves as a member of the Board of Directors of XL Group plc. (global insurance and re-insurance, 2006-present) and the Independent Directors Council (IDC) Governing Council (2015-present). Previously, Mr. Mauriello served as a Director of the Hamilton Funds of the Bank of New York (2006-2007) and of Arcadia Resources Inc. (health care services and products, 2007-2012). |
Robert W. Selander (1950) |
Year of Election or Appointment: 2011 Trustee |
| Mr. Selander also serves as Trustee of other Fidelity funds. Mr. Selander serves as a Director of The Western Union Company (global money transfer, 2014-present). Previously, Mr. Selander served as a Member of the Advisory Board of other Fidelity funds (2011), and Executive Vice Chairman (2010), Chief Executive Officer (2009-2010), and President and Chief Executive Officer (1997-2009) of Mastercard, Inc. |
Cornelia M. Small (1944) |
Year of Election or Appointment: 2005 Trustee |
| Ms. Small also serves as Trustee of other Fidelity funds. Ms. Small is a member of the Board of Directors (2009-present) and Chair of the Investment Committee (2010-present) of the Teagle Foundation. Ms. Small also serves on the Investment Committee of the Berkshire Taconic Community Foundation (2008-present). Previously, Ms. Small served as Chairperson (2002-2008) and a member of the Investment Committee and Chairperson (2008-2012) and a member of the Board of Trustees of Smith College. In addition, Ms. Small served as Chief Investment Officer, Director of Global Equity Investments, and a member of the Board of Directors of Scudder, Stevens & Clark and Scudder Kemper Investments. |
William S. Stavropoulos (1939) |
Year of Election or Appointment: 2001 Trustee Vice Chairman of the Independent Trustees |
| Mr. Stavropoulos also serves as Trustee of other Fidelity funds. Mr. Stavropoulos serves as President and Founder of the Michigan Baseball Foundation, the Great Lakes Loons (2007-present). Mr. Stavropoulos is Chairman Emeritus of the Board of Directors of The Dow Chemical Company, where he previously served in numerous senior management positions, including President, CEO (1995-2000; 2002-2004), Chairman of the Executive Committee (2000-2006), and as a member of the Board of Directors (1990-2006). Currently, Mr. Stavropoulos is Chairman of the Board of Directors of Univar Inc. (global distributor of commodity and specialty chemicals), a Director of Teradata Corporation (data warehousing and technology solutions), and Maersk Inc. (industrial conglomerate), and a member of the Advisory Board for Metalmark Capital LLC (private equity investment, 2005-present). Mr. Stavropoulos is an operating advisor to Clayton, Dubilier & Rice, LLC (private equity investment). In addition, Mr. Stavropoulos is a member of the University of Notre Dame Advisory Council for the College of Science, a Trustee of the Rollin L. Gerstacker Foundation, and a Director of the Naples Philharmonic Center for the Arts. Previously, Mr. Stavropoulos served as a Director of Chemical Financial Corporation (bank holding company, 1993-2012) and Tyco International, Ltd. (multinational manufacturing and services, 2007-2012). |
David M. Thomas (1949) |
Year of Election or Appointment: 2008 Trustee |
| Mr. Thomas also serves as Trustee of other Fidelity funds. Mr. Thomas serves as Non-Executive Chairman of the Board of Directors of Fortune Brands Home and Security (home and security products, 2011-present), as a member of the Board of Directors (2004-present) and Presiding Director (2013-present) of Interpublic Group of Companies, Inc. (marketing communication), and as a member of the Board of Trustees of the University of Florida (2013-present). Previously, Mr. Thomas served as Executive Chairman (2005-2006) and Chairman and Chief Executive Officer (2000-2005) of IMS Health, Inc. (pharmaceutical and healthcare information solutions), and a Director of Fortune Brands, Inc. (consumer products, 2000-2011). |
+ The information above includes each Trustee's principal occupation during the last five years and other information relating to the experience, attributes, and skills relevant to each Trustee's qualifications to serve as a Trustee, which led to the conclusion that each Trustee should serve as a Trustee for the fund.
Advisory Board Member and Officers:
Correspondence intended for each officer and Peter S. Lynch may be sent to Fidelity Investments, 245 Summer Street, Boston, Massachusetts 02210. Officers appear below in alphabetical order.
Name, Year of Birth; Principal Occupation |
Peter S. Lynch (1944) |
Year of Election or Appointment: 2003 Member of the Advisory Board |
| Mr. Lynch also serves as Member of the Advisory Board of other Fidelity funds. Mr. Lynch is Vice Chairman and a Director of FMR (investment adviser firm) and FMR Co., Inc. (investment adviser firm). In addition, Mr. Lynch serves as a Trustee of Boston College and as the Chairman of the Inner-City Scholarship Fund. Previously, Mr. Lynch served on the Special Olympics International Board of Directors (1997-2006). |
Elizabeth Paige Baumann (1968) |
Year of Election or Appointment: 2012 Anti-Money Laundering (AML) Officer |
| Ms. Baumann also serves as AML Officer of other funds. She is Chief AML Officer of FMR LLC (diversified financial services company, 2012-present) and is an employee of Fidelity Investments. Previously, Ms. Baumann served as Vice President and Deputy Anti-Money Laundering Officer (2007-2012). |
Marc R. Bryant (1966) |
Year of Election or Appointment: 2015 Secretary and Chief Legal Officer (CLO) |
| Mr. Bryant also serves as Secretary and CLO of other funds. Mr. Bryant serves as CLO, Secretary, and Senior Vice President of Fidelity Management & Research Company (investment adviser firm, 2015-present) and FMR Co., Inc. (investment adviser firm, 2015-present); Secretary of Fidelity SelectCo, LLC (investment adviser firm, 2015-present) and Fidelity Investments Money Management, Inc. (investment adviser firm, 2015-present); and CLO of Fidelity Management & Research (Hong Kong) Limited (investment adviser firm, 2015-present). He is Senior Vice President and Deputy General Counsel of FMR LLC (diversified financial services company). Previously, Mr. Bryant served as Secretary and Chief Legal Officer of Fidelity Rutland Square Trust II (2010-2014) and Assistant Secretary of Fidelity's Fixed Income and Asset Allocation Funds (2013-2015). Prior to joining Fidelity Investments, Mr. Bryant served as a Senior Vice President and the Head of Global Retail Legal for AllianceBernstein L.P. (2006-2010), and as the General Counsel for ProFund Advisors LLC (2001-2006). |
William C. Coffey (1969) |
Year of Election or Appointment: 2009 Assistant Secretary |
| Mr. Coffey also serves as Assistant Secretary of other funds. He is Senior Vice President and Deputy General Counsel of FMR LLC (diversified financial services company, 2010-present), and is an employee of Fidelity Investments. Previously, Mr. Coffey served as Vice President and Associate General Counsel of FMR LLC (2005-2009). |
Timothy M. Cohen (1969) |
Year of Election or Appointment: 2014 Vice President of certain Equity Funds |
| Mr. Cohen also serves as Vice President of other funds. Mr. Cohen serves as Chief Compliance Officer of FMR Investment Management (U.K.) Limited (investment adviser firm, 2013-present) and is an employee of Fidelity Investments. Previously, Mr. Cohen served as a Director of FMR Investment Management (U.K.) Limited (2013-2015). |
Jonathan Davis (1968) |
Year of Election or Appointment: 2010 Assistant Treasurer |
| Mr. Davis also serves as Assistant Treasurer of other funds, and is an employee of Fidelity Investments. Previously, Mr. Davis served as Vice President and Associate General Counsel of FMR LLC (diversified financial services company, 2003-2010). |
Adrien E. Deberghes (1967) |
Year of Election or Appointment: 2008 Deputy Treasurer |
| Mr. Deberghes also serves as an officer of other funds. He is an employee of Fidelity Investments (2008-present). Prior to joining Fidelity Investments, Mr. Deberghes was Senior Vice President of Mutual Fund Administration at State Street Corporation (2007-2008), Senior Director of Mutual Fund Administration at Investors Bank & Trust (2005-2007), and Director of Finance for Dunkin' Brands (2000-2005). |
Stephanie J. Dorsey (1969) |
Year of Election or Appointment: 2010 Assistant Treasurer |
| Ms. Dorsey also serves as an officer of other funds. She is an employee of Fidelity Investments (2008-present) and has served in other fund officer roles. Prior to joining Fidelity Investments, Ms. Dorsey served as Treasurer (2004-2008) of the JPMorgan Mutual Funds and Vice President (2004-2008) of JPMorgan Chase Bank. |
Howard J. Galligan III (1966) |
Year of Election or Appointment: 2014 Chief Financial Officer |
| Mr. Galligan also serves as Chief Financial Officer of other funds. Mr. Galligan serves as President of Fidelity Pricing and Cash Management Services (FPCMS) (2014-present) and as a Director of Strategic Advisers, Inc. (investment adviser firm, 2008-present). Previously, Mr. Galligan served as Chief Administrative Officer of Asset Management (2011-2014) and Chief Operating Officer and Senior Vice President of Investment Support for Strategic Advisers, Inc. (2003-2011). |
Scott C. Goebel (1968) |
Year of Election or Appointment: 2015 Vice President |
| Mr. Goebel serves as Vice President of other funds and is an employee of Fidelity Investments (2001-present). Previously, Mr. Goebel served as Secretary of Fidelity SelectCo, LLC (investment adviser firm, 2013-2015), Fidelity Investments Money Management, Inc. (FIMM) (investment adviser firm, 2010-2015), and Fidelity Research and Analysis Company (FRAC) (investment adviser firm, 2010-2015); General Counsel, Secretary, and Senior Vice President of Fidelity Management & Research Company (investment adviser firm, 2008-2015) and FMR Co., Inc. (investment adviser firm, 2008-2015); Assistant Secretary of Fidelity Management & Research (Japan) Limited (investment adviser firm, 2008-2015) and FMR Investment Management (U.K.) Limited (investment adviser firm, 2008-2015); Chief Legal Officer (CLO) of Fidelity Management & Research (Hong Kong) Limited (investment adviser firm, 2008-2015); Secretary and CLO of certain Fidelity funds (2008-2015); Assistant Secretary of FIMM (2008-2010), FRAC (2008-2010), and certain funds (2007-2008); and as Vice President and Secretary of Fidelity Distributors Corporation (FDC) (2005-2007). |
Brian B. Hogan (1964) |
Year of Election or Appointment: 2009 Vice President |
| Mr. Hogan also serves as Trustee or Vice President of other funds. Mr. Hogan serves as a Director of Fidelity SelectCo, LLC (investment adviser firm, 2014-present) and President of the Equity Division of FMR (investment adviser firm, 2009-present). Previously, Mr. Hogan served as Senior Vice President, Equity Research of FMR (2006-2009) and as a portfolio manager. |
Chris Maher (1972) |
Year of Election or Appointment: 2013 Assistant Treasurer |
| Mr. Maher serves as Assistant Treasurer of other funds. Mr. Maher is Vice President of Valuation Oversight and is an employee of Fidelity Investments. Previously, Mr. Maher served as Vice President of Asset Management Compliance (2013), Vice President of the Program Management Group of FMR (investment adviser firm, 2010-2013), and Vice President of Valuation Oversight (2008-2010). |
Kenneth B. Robins (1969) |
Year of Election or Appointment: 2008 President and Treasurer |
| Mr. Robins also serves as an officer of other funds. Mr. Robins serves as Executive Vice President of Fidelity Investments Money Management, Inc. (FIMM) (investment adviser firm, 2013-present) and is an employee of Fidelity Investments (2004-present). Previously, Mr. Robins served in other fund officer roles. |
Stacie M. Smith (1974) |
Year of Election or Appointment: 2013 Deputy Treasurer |
| Ms. Smith also serves as an officer of other funds. She is an employee of Fidelity Investments (2009-present) and has served in other fund officer roles. Prior to joining Fidelity Investments, Ms. Smith served as Senior Audit Manager of Ernst & Young LLP (1996-2009). |
Renee Stagnone (1975) |
Year of Election or Appointment: 2013 Deputy Treasurer |
| Ms. Stagnone also serves as Deputy Treasurer of other funds. Ms. Stagnone is an employee of Fidelity Investments (1997-present). |
Linda J. Wondrack (1964) |
Year of Election or Appointment: 2014 Chief Compliance Officer |
| Ms. Wondrack also serves as Chief Compliance Officer of other funds. Ms. Wondrack is Executive Vice President and head of the Ethics Office and Asset Management Compliance for Fidelity Investments (2012-present). Ms. Wondrack also serves as Chief Compliance Officer of Fidelity SelectCo, LLC (investment adviser firm, 2014-present); Chief Compliance Officer of Impresa Management LLC (2013-present); and Chief Compliance Officer of FMR Co., Inc. (investment adviser firm), Fidelity Investments Money Management, Inc. (investment adviser firm), Fidelity Management & Research (Japan) Limited (investment adviser firm), FMR Investment Management (U.K.) Limited (investment adviser firm), Fidelity Management & Research (Hong Kong) (investment adviser firm), Fidelity Management & Research Company (investment adviser firm), FIAM LLC (investment adviser firm), and Strategic Advisers, Inc. (investment adviser firm), Ballyrock Investment Advisors LLC, and Northern Neck Investors LLC (2012-present). Previously, Ms. Wondrack served as Senior Vice President and Chief Compliance Officer for Columbia Management Investment Advisers, LLC (2005-2012); Chief Compliance Officer for certain funds within the Columbia Family of Funds (2007-2012); and Senior Vice President of Compliance Risk Management at Bank of America (2005-2010). |
Joseph F. Zambello (1957) |
Year of Election or Appointment: 2011 Deputy Treasurer |
| Mr. Zambello also serves as Deputy Treasurer of other funds. Mr. Zambello is an employee of Fidelity Investments (1991-present). Previously, Mr. Zambello served as Vice President of the Program Management Group of FMR (investment adviser firm, 2009-2011) and Vice President of the Transfer Agent Oversight Group (2005-2009). |
Annual Report
The Board of Trustees of Fidelity International Discovery Fund voted to pay to shareholders of record at the opening of business on record date, the following distributions per share derived from capital gains realized from sales of portfolio securities, and dividends derived from net investment income:
| Pay Date | Record Date | Dividends | Capital Gains |
Class K | 12/07/15 | 12/04/15 | $0.462 | $0.005 |
Class K designates 5% of the dividends distributed during the fiscal year as qualifying for the dividends-received deduction for corporate shareholders.
Class K designates 100% of dividends distributed during the fiscal year as amounts which may be taken into account as a dividend for purposes of the maximum rate under section 1(h)(11) of the Internal Revenue Code.
The amounts per share which represent income derived from sources within, and taxes paid to, foreign countries or possessions of the United States are as follows:
| Pay Date | Income | Taxes |
Class K | 12/08/14 | $0.3586 | $0.0486 |
The fund will notify shareholders in January 2016 of amounts for use in preparing 2015 income tax returns.
Annual Report
Fidelity International Discovery Fund
Each year, the Board of Trustees, including the Independent Trustees (together, the Board), votes on the renewal of the management contract with Fidelity Management & Research Company (FMR) and the sub-advisory agreements (together, the Advisory Contracts) for the fund. The Board, assisted by the advice of fund counsel and Independent Trustees' counsel, requests and considers a broad range of information relevant to the renewal of the Advisory Contracts throughout the year.
The Board meets regularly and, at each of its meetings, covers an extensive agenda of topics and materials and considers factors that are relevant to its annual consideration of the renewal of the fund's Advisory Contracts, including the services and support provided to the fund and its shareholders. The Board has established various standing committees (Committees), each composed of and chaired by Independent Trustees with varying backgrounds, to which the Board has assigned specific subject matter responsibilities in order to enhance effective decision-making by the Board. The Board, acting directly and through its Committees, requests and receives information concerning the annual consideration of the renewal of the fund's Advisory Contracts. The Board also meets as needed to consider matters specifically related to the Board's annual consideration of the renewal of the Advisory Contracts. Members of the Board may also meet with trustees of other Fidelity funds through ad hoc joint committees to discuss certain matters relevant to all of the Fidelity funds.
At its July 2015 meeting, the Board unanimously determined to renew the fund's Advisory Contracts. In reaching its determination, the Board considered all factors it believed relevant, including (i) the nature, extent, and quality of the services to be provided to the fund and its shareholders (including the investment performance of the fund); (ii) the competitiveness of the fund's management fee and total expense ratio relative to peer funds; (iii) the total costs of the services to be provided by and the profits to be realized by Fidelity from its relationship with the fund; and (iv) the extent to which (if any) economies of scale exist and would be realized as the fund grows, and whether any economies of scale are appropriately shared with fund shareholders.
In considering whether to renew the Advisory Contracts for the fund, the Board reached a determination, with the assistance of fund counsel and Independent Trustees' counsel and through the exercise of its business judgment, that the renewal of the Advisory Contracts was in the best interests of the fund and its shareholders and that the compensation payable under the Advisory Contracts was fair and reasonable. The Board's decision to renew the Advisory Contracts was not based on any single factor, but rather was based on a comprehensive consideration of all the information provided to the Board at its meetings throughout the year. The Board, in reaching its determination to renew the Advisory Contracts, was aware that shareholders of the fund have a broad range of investment choices available to them, including a wide choice among funds offered by Fidelity's competitors, and that the fund's shareholders, who have the opportunity to review and weigh the disclosure provided by the fund in its prospectus and other public disclosures, have chosen to invest in this fund, which is part of the Fidelity family of funds.
Annual Report
Nature, Extent, and Quality of Services Provided. The Board considered Fidelity's staffing as it relates to the fund, including the backgrounds of investment personnel of Fidelity, and also considered the fund's investment objective, strategies, and related investment philosophy. The Independent Trustees also had discussions with senior management of Fidelity's investment operations and investment groups. The Board considered the structure of the portfolio manager compensation program and whether this structure provides appropriate incentives to act in the best interests of the fund. Additionally, the Board considered the portfolio managers' investments, if any, in the funds that they manage.
Resources Dedicated to Investment Management and Support Services. The Board and the Fund Oversight and Research Committees reviewed the general qualifications and capabilities of Fidelity's investment staff, including its size, education, experience, and resources, as well as Fidelity's approach to recruiting, training, managing, and compensating investment personnel. The Board noted that Fidelity has continued to increase the resources devoted to non-U.S. offices, including expansion of Fidelity's global investment organization. The Board also noted that Fidelity's analysts have extensive resources, tools and capabilities that allow them to conduct sophisticated quantitative and fundamental analysis, as well as credit analysis of issuers, counterparties and guarantors. Further, the Board considered that Fidelity's investment professionals have sufficient access to global information and data so as to provide competitive investment results over time, and that those professionals also have access to sophisticated tools that permit them to assess portfolio construction and risk and performance attribution characteristics continuously, as well as to transmit new information and research conclusions rapidly around the world. Additionally, in its deliberations, the Board considered Fidelity's trading, risk management, and compliance capabilities and resources, which are integral parts of the investment management process.
Shareholder and Administrative Services. The Board considered (i) the nature, extent, quality, and cost of advisory, administrative, and shareholder services performed by FMR, the sub-advisers (together with FMR, the Investment Advisers), and their affiliates under the Advisory Contracts and under separate agreements covering transfer agency, pricing and bookkeeping, and securities lending services for the fund; (ii) the nature and extent of the supervision of third party service providers, principally custodians and subcustodians; and (iii) the resources devoted to, and the record of compliance with, the fund's compliance policies and procedures. The Board also reviewed the allocation of fund brokerage, including allocations to brokers affiliated with the Investment Advisers, the use of brokerage commissions to pay fund expenses, and the use of "soft" commission dollars to pay for research services.
Annual Report
Board Approval of Investment Advisory Contracts and
Management Fees - continued
The Board noted that the growth of fund assets over time across the complex allows Fidelity to reinvest in the development of services designed to enhance the value or convenience of the Fidelity funds as investment vehicles. These services include 24-hour access to account information and market information through telephone representatives and over the Internet, investor education materials and asset allocation tools, and the expanded availability of Fidelity Investor Centers.
In 2014, the Board formed an ad hoc Committee on Transfer Agency Fees to review the variety of transfer agency fee structures throughout the industry and Fidelity's competitive positioning with respect to industry participants.
Investment in a Large Fund Family. The Board considered the benefits to shareholders of investing in a Fidelity fund, including the benefits of investing in a fund that is part of a large family of funds offering a variety of investment disciplines and providing a large variety of mutual fund investor services. The Board noted that Fidelity had taken, or had made recommendations that resulted in the Fidelity funds taking, a number of actions over the previous year that benefited particular funds, including (i) continuing to dedicate additional resources to investment research and to the support of the senior management team that oversees asset management; (ii) continuing efforts to enhance Fidelity's global research capabilities; (iii) launching new funds and making other enhancements to meet client needs; (iv) reducing management fees and total expenses for certain index funds and diversified international funds; (v) continuing to launch dedicated lower cost underlying funds to meet portfolio construction needs related to expanding underlying fund options for Fidelity funds of funds, specifically for the Freedom Fund product lines; (vi) rationalizing product lines and gaining increased efficiencies through fund mergers; (vii) launching active fixed-income exchange-traded funds; (viii) continuing to develop, acquire and implement systems and technology to improve services to the funds and information security and to increase efficiency; (ix) implementing investment enhancements to further strengthen Fidelity's target date product line to increase investors' probability of success in achieving their goals; (x) modifying the eligibility criteria for certain share classes to accommodate roll-over assets from employer-sponsored retirement plans; (xi) launching a new Class W of the Freedom Index Funds to attract and retain Fidelity record-kept retirement plan assets; and (xii) implementing changes to Fidelity's money market product line in response to recent money market regulatory reforms.
Investment Performance. The Board considered whether the fund has operated in accordance with its investment objective, as well as its record of compliance with its investment restrictions and its performance history.
Annual Report
The Board took into account discussions with representatives of the Investment Advisers about fund investment performance that occur at Board meetings throughout the year. In this regard the Board noted that as part of regularly scheduled fund reviews and other reports to the Board on fund performance, the Board considers annualized return information for the fund, for different time periods, measured against a securities market index ("benchmark index") and a peer group of funds with similar objectives ("peer group"), if any. In its evaluation of fund investment performance, the Board gave particular attention to information indicating changes in performance of certain Fidelity funds for specific time periods and discussed with the Investment Advisers the reasons for any overperformance or underperformance.
In addition to reviewing absolute and relative fund performance, the Independent Trustees periodically consider the appropriateness of fund performance metrics in evaluating the results achieved. In general, the Independent Trustees believe that fund performance should be evaluated based on net performance (after fees and expenses) of both the highest performing and lowest performing fund share classes, where applicable, compared to appropriate benchmark indices, over appropriate time periods that may include full market cycles, and compared to peer groups, as applicable, over the same periods, taking into account relevant factors including the following: general market conditions; issuer-specific information; and fund cash flows and other factors.
The Independent Trustees recognize that shareholders evaluate performance on a net basis over their own holding periods, for which one-, three-, and five-year periods are often used as a proxy. For this reason, the performance information reviewed by the Board also included net cumulative calendar year total return information for the fund and an appropriate benchmark index and peer group for the most recent one-, three-, and five-year periods, as shown below. Returns are shown compared to the 25th percentile (top of box, 75% beaten) and 75th percentile (bottom of box, 25% beaten) of the peer universe. Returns of the benchmark index are "net MA," i.e., adjusted for tax withholding rates applicable to U.S.-based funds organized as Massachusetts business trusts.
Annual Report
Board Approval of Investment Advisory Contracts and
Management Fees - continued
Fidelity International Discovery Fund

The Board also considered that the fund's management fee is subject to upward or downward adjustment depending upon whether, and to what extent, the fund's investment performance for the performance period exceeds, or is exceeded by, a securities index, thus leading to a performance adjustment for the same period. The Board noted that the performance adjustment provides FMR with a strong economic incentive to seek to achieve superior performance for the fund's shareholders and helps to more closely align the interests of FMR and the shareholders of the fund.
Based on its review, the Board concluded that the nature, extent, and quality of services provided to the fund under the Advisory Contracts should benefit the shareholders of the fund.
Competitiveness of Management Fee and Total Expense Ratio. The Board considered the fund's management fee and total expense ratio compared to "mapped groups" of competitive funds and classes created for the purpose of facilitating the Trustees' competitive analysis of management fees and total expenses. Fidelity creates "mapped groups" by combining similar Lipper investment objective categories that have comparable investment mandates. Combining Lipper investment objective categories aids the Board's management fee and total expense ratio comparisons by broadening the competitive group used for comparison.
Management Fee. The Board considered two proprietary management fee comparisons for the 12-month periods shown in basis points (BP) in the chart below. The group of Lipper funds used by the Board for management fee comparisons is referred to below as the "Total Mapped Group." The Total Mapped Group comparison focuses on a fund's standing in terms of gross management fees before expense reimbursements or caps, and without giving effect to the fund's performance adjustment, relative to the total universe of funds with comparable investment mandates, regardless of whether their management fee structures also are comparable. Funds with comparable investment mandates offer exposure to similar types of securities. Funds with comparable management fee structures have similar management fee contractual arrangements (e.g., flat rate charged for advisory services, all-inclusive fee rate, etc.). "TMG %" represents the percentage of funds in the Total Mapped Group that had management fees that were lower than the fund's. For example, a hypothetical TMG % of 20% would mean that 80% of the funds in the Total Mapped Group had higher, and 20% had lower, management fees than the fund. The fund's actual TMG %s and the number of funds in the Total Mapped Group are in the chart below. The "Asset-Size Peer Group" (ASPG) comparison focuses on a fund's standing relative to a subset of non-Fidelity funds within the Total Mapped Group that are similar in size and management fee structure without taking into account performance adjustments, if any. For example, if a fund is in the first quartile of the ASPG, the fund's management fee ranks in the least expensive or lowest 25% of funds in the ASPG. The ASPG represents at least 15% of the funds in the Total Mapped Group with comparable asset size and management fee structures, subject to a minimum of 50 funds (or all funds in the Total Mapped Group if fewer than 50). Additional information, such as the ASPG quartile in which the fund's management fee rate ranked and the impact of the fund's performance adjustment, is also included in the chart and considered by the Board.
Annual Report
Fidelity International Discovery Fund

Annual Report
Board Approval of Investment Advisory Contracts and
Management Fees - continued
The Board noted that the fund's management fee rate ranked below the median of its Total Mapped Group and below the median of its ASPG for 2014. The Board also noted the effect of the fund's performance adjustment, if any, on the fund's management fee ranking.
Furthermore, the Board considered that it had approved a reduction (effective August 1, 2014) in the individual fund fee rate component of the management fee rate for the fund from 0.450% to 0.424%. The Board considered that the chart reflects the fund's lower management fee for 2014, as if the lower fee were in effect for the entire year.
The Board noted that, in 2014, the ad hoc Committee on Group Fee was formed by it and other Fidelity fund boards to conduct an in-depth review of the "group fee" component of the management fee of funds with such management fee structures. Committee focus included the mechanics of the group fee, the competitive landscape of group fee structures, Fidelity funds with no group fee component and investment products not included in group fee assets. The Board also considered that, for funds subject to the group fee, FMR agreed to voluntarily waive fees over a specified period of time in amounts designed to account for assets converted from certain funds to certain collective investment trusts.
The Board also noted that, in 2013, the ad hoc Committee on Management Fees was formed to conduct an in-depth review of the management fee rates of Fidelity's active equity mutual funds. The Committee focused on the following areas: (i) standard fee structures; (ii) research consumption and trading evolution; (iii) management fee competitiveness/profitability by category; and (iv) factors that drive institutional pricing.
Based on its review, the Board concluded that the fund's management fee is fair and reasonable in light of the services that the fund receives and the other factors considered.
Total Expense Ratio. In its review of each class's total expense ratio, the Board considered the fund's management fee as well as other fund or class expenses, as applicable, such as transfer agent fees, pricing and bookkeeping fees, fund-paid 12b-1 fees, and custodial, legal, and audit fees. The Board noted the impact of the fund's performance adjustment. The Board also noted that Fidelity may agree to waive fees and expenses from time to time, and the extent to which, if any, it has done so for the fund. As part of its review, the Board also considered the current and historical total expense ratios of each class of the fund compared to competitive fund median expenses. Each class of the fund is compared to those funds and classes in the Total Mapped Group (used by the Board for management fee comparisons) that have a similar sales load structure.
The Board noted that the total expense ratio of each of Class A, Class B, Class C, Class I, Class Z, the retail class, and Class K ranked below its competitive median for 2014 and the total expense ratio of Class T ranked above its competitive median for 2014. The Board considered that, in general, various factors can affect total expense ratios. The Board noted that the total expense ratio of Class T was above the competitive median primarily because of higher 12b-1 fees on Class T as compared to most competitor funds. Class T has a higher 12b-1 fee, but a lower front-end sales charge, than traditionally priced front-end sales charge classes. The Board considered that Class T is primarily sold load-waived in the retirement plan market where its 0.50% 12b-1 fee is comparable to competing no-load, higher 12b-1 fee classes designed specifically for retirement plans. The Board noted that the fund offers multiple classes, each of which has a different sales load and 12b-1 fee structure, and that the multiple structures are intended to offer a range of pricing options for the intermediary market. The Board also noted that the total expense ratios of the classes vary primarily by the level of their 12b-1 fees, although differences in transfer agent fees may also cause expenses to vary from class to class.
Annual Report
Fees Charged to Other Fidelity Clients. The Board also considered Fidelity fee structures and other information with respect to clients of Fidelity, such as other funds advised or subadvised by Fidelity, pension plan clients, and other institutional clients with similar mandates. The Board noted the findings of the 2013 ad hoc joint committee (created with the board of other Fidelity funds), which reviewed and compared Fidelity's institutional investment advisory business with its business of providing services to the Fidelity funds, including the differences in services provided, fees charged, and costs incurred, as well as competition in their respective marketplaces.
Based on its review of total expense ratios and fees charged to other Fidelity clients, the Board concluded that, although Class T was above the median of the universe presented for comparison, the total expense ratio of each class of the fund was reasonable in light of the services that the fund and its shareholders receive and the other factors considered.
Costs of the Services and Profitability. The Board considered the revenues earned and the expenses incurred by Fidelity in conducting the business of developing, marketing, distributing, managing, administering and servicing the fund and servicing the fund's shareholders. The Board also considered the level of Fidelity's profits in respect of all the Fidelity funds.
On an annual basis, Fidelity presents to the Board information about the profitability of its relationship with the fund. Fidelity calculates profitability information for each fund, as well as aggregate profitability information for groups of Fidelity funds and all Fidelity funds, using a series of detailed revenue and cost allocation methodologies which originate with the books and records of Fidelity on which Fidelity's audited financial statements are based. The Audit Committee of the Board reviews any significant changes from the prior year's methodologies.
PricewaterhouseCoopers LLP (PwC), independent registered public accounting firm and auditor to Fidelity and certain Fidelity funds, has been engaged annually by the Board as part of the Board's assessment of Fidelity's profitability analysis. PwC's engagement includes the review and assessment of the methodologies used by Fidelity in determining the revenues and expenses attributable to Fidelity's mutual fund business, and completion of agreed-upon procedures in respect of the mathematical accuracy of fund profitability and its conformity to established allocation methodologies. After considering PwC's reports issued under the engagement and information provided by Fidelity, the Board concluded that while other allocation methods may also be reasonable, Fidelity's profitability methodologies are reasonable in all material respects.
Annual Report
Board Approval of Investment Advisory Contracts and
Management Fees - continued
The Board also reviewed Fidelity's non-fund businesses and fall-out benefits related to the mutual fund business as well as cases where Fidelity's affiliates may benefit from or be related to the fund's business.
The Board considered the costs of the services provided by and the profits realized by Fidelity in connection with the operation of the fund and was satisfied that the profitability was not excessive.
Economies of Scale. The Board considered whether there have been economies of scale in respect of the management of the Fidelity funds, whether the Fidelity funds (including the fund) have appropriately benefited from any such economies of scale, and whether there is potential for realization of any further economies of scale. The Board considered the extent to which the fund will benefit from economies of scale as assets grow through increased services to the fund, through waivers or reimbursements, or through fee or expense ratio reductions. The Board also noted that in 2013, it and the boards of other Fidelity funds created an ad hoc committee (the Economies of Scale Committee) to analyze whether Fidelity attains economies of scale in respect of the management and servicing of the Fidelity funds, whether the Fidelity funds have appropriately benefited from such economies of scale, and whether there is potential for realization of any further economies of scale.
The Board recognized that the fund's management contract incorporates a "group fee" structure, which provides for lower group fee rates as total group assets increase, and for higher group fee rates as total group assets decrease (with "group assets" defined to include fund assets under FMR's management plus sector fund assets previously under FMR's management and currently managed by Fidelity SelectCo, LLC). FMR calculates the group fee rates based on a tiered asset "breakpoint" schedule that varies based on asset class. The Board considered that the group fee is designed to deliver the benefits of economies of scale to fund shareholders when total Fidelity fund assets increase, even if assets of any particular fund are unchanged or have declined, because some portion of Fidelity's costs are attributable to services provided to all Fidelity funds, and all funds benefit if those costs can be allocated among more assets. The Board concluded that, given the group fee structure, fund shareholders will benefit from lower management fees as group assets increase at the fund complex level, regardless of whether Fidelity achieves any such economies of scale.
Annual Report
The Board concluded, taking into account the analysis of the Economies of Scale Committee, that economies of scale, if any, are being appropriately shared between fund shareholders and Fidelity.
Additional Information Requested by the Board. In order to develop fully the factual basis for consideration of the Fidelity funds' Advisory Contracts, the Board requested and received additional information on certain topics, including: (i) fund performance trends and Fidelity's long-term strategies for certain funds; (ii) the various share classes employed by Fidelity and the attributes of each class, together with similar information on the distribution and servicing payments made by Fidelity or the funds to third-party participants in the distribution channels; (iii) fund profitability, and fund performance in relation to fund profitability; (iv) the methodology with respect to evaluating competitive fund data and peer group classifications and fee comparisons; (v) annual fund profitability margins, with particular focus on certain funds with negative margins; (vi) the realization of fall-out benefits in certain Fidelity business units; (vii) economies of scale and the way in which they are shared with fund shareholders; (viii) Fidelity's group fee structures, including the group fee schedule of breakpoints; (ix) the impact of cost containment measures on the funds; and (x) the transfer agent fee structure.
Based on its evaluation of all of the conclusions noted above, and after considering all factors it believed relevant, the Board concluded that the advisory fee structures are fair and reasonable, and that the fund's Advisory Contracts should be renewed.
Annual Report
Investment Adviser
Fidelity Management & Research Company
Boston, MA
Investment Sub-Advisers
FMR Co., Inc.
FMR Investment Management
(U.K.) Limited
FIL Investments (Japan) Limited
FIL Investment Advisors
FIL Investment Advisors
(UK) Limited
Fidelity Management & Research
(Hong Kong) Limited
Fidelity Management & Research
(Japan) Limited
General Distributor
Fidelity Distributors Corporation
Smithfield, RI
Transfer and Service Agents
Fidelity Investments Institutional
Operations Company, Inc.
Boston, MA
Fidelity Service Company, Inc.
Boston, MA
Custodian
The Northern Trust Company
Chicago, IL
(Fidelity Investment logo)(registered trademark)
Corporate Headquarters
245 Summer St., Boston, MA 02210
www.fidelity.com
IGI-K-UANN-1215
1.863305.107
ContentsPerformance: The Bottom LineManagement's Discussion of Fund PerformanceShareholder Expense ExampleInvestment Changes (Unaudited)Investments October 31, 2015Financial StatementsNotes to Financial StatementsReport of Independent Registered Public Accounting FirmTrustees and OfficersDistributions (Unaudited)Board Approval of Investment Advisory Contracts and Management Fees
(Fidelity Investment logo)(registered trademark)
Fidelity Advisor®
International Growth
Fund - Class I
(formerly Institutional Class)
Annual Report
October 31, 2015
(Fidelity Cover Art)
Class I
is a class of Fidelity®
International Growth Fund
Contents
Performance | (Click Here) | How the fund has done over time. |
Management's Discussion of Fund Performance | (Click Here) | The Portfolio Manager's review of fund performance and strategy. |
Shareholder Expense Example | (Click Here) | An example of shareholder expenses. |
Investment Changes | (Click Here) | A summary of major shifts in the fund's investments over the past six months. |
Investments | (Click Here) | A complete list of the fund's investments with their market values. |
Financial Statements | (Click Here) | Statements of assets and liabilities, operations, and changes in net assets, as well as financial highlights. |
Notes | (Click Here) | Notes to financial statements. |
Report of Independent Registered Public Accounting Firm | (Click Here) | |
Trustees and Officers | (Click Here) | |
Distributions | (Click Here) | |
Board Approval of Investment Advisory Contracts and Management Fees | (Click Here) | |
To view a fund's proxy voting guidelines and proxy voting record for the 12-month period ended June 30, visit http://www.fidelity.com/proxyvotingresults or visit the Securities and Exchange Commission's (SEC) web site at http://www.sec.gov. You may also call 1-877-208-0098 to request a free copy of the proxy voting guidelines.
Standard & Poor's, S&P and S&P 500 are registered service marks of The McGraw-Hill Companies, Inc. and have been licensed for use by Fidelity Distributors Corporation.
Other third-party marks appearing herein are the property of their respective owners.
All other marks appearing herein are registered or unregistered trademarks or service marks of FMR LLC or an affiliated company. © 2015 FMR LLC. All rights reserved.
Annual Report
This report and the financial statements contained herein are submitted for the general information of the shareholders of the fund. This report is not authorized for distribution to prospective investors in the fund unless preceded or accompanied by an effective prospectus.
A fund files its complete schedule of portfolio holdings with the SEC for the first and third quarters of each fiscal year on Form N-Q. Forms N-Q are available on the SEC's web site at http://www.sec.gov. A fund's Forms N-Q may be reviewed and copied at the SEC's Public Reference Room in Washington, DC. Information regarding the operation of the SEC's Public Reference Room may be obtained by calling 1-800-SEC-0330. For a complete list of a fund's portfolio holdings, view the most recent holdings listing, semiannual report, or annual report on Fidelity's web site at http://www.fidelity.com, http://www.advisor.fidelity.com, or http://www.401k.com, as applicable.
NOT FDIC INSURED • MAY LOSE VALUE • NO BANK GUARANTEE
Neither the fund nor Fidelity Distributors Corporation is a bank.
Annual Report
Average annual total return reflects the change in the value of an investment, assuming reinvestment of the class' distributions from dividend income and capital gains (the profits earned upon the sale of securities that have grown in value, if any) and assuming a constant rate of performance each year. The $10,000 table and the fund's returns do not reflect the deduction of taxes that a shareholder would pay on fund distributions or the redemption of fund shares. During periods of reimbursement by Fidelity, a fund's total return will be greater than it would be had the reimbursement not occurred. How a fund did yesterday is no guarantee of how it will do tomorrow.
Average Annual Total Returns
Periods ended October 31, 2015 | Past 1
year | Past 5
years | Life of
fund A |
Class I | 3.41% | 7.20% | 2.50% |
A From November 1, 2007.
$10,000 Over Life of Fund
Let's say hypothetically that $10,000 was invested in Fidelity Advisor® International Growth Fund - Class I on November 1, 2007, when the fund started. The chart shows how the value of your investment would have changed, and also shows how the MSCI EAFE Growth Index performed over the same period.
Annual Report
Market Recap: International equities suffered a moderate setback for the 12 months ending October 31, 2015, held back by a collapse in commodities prices that hurt resources-related sectors and geographies. The MSCI ACWI (All Country World Index) ex USA Index returned -4.55% for the period, affected also by concerns about global economic growth. Commodity producers remained under pressure for much of the past year, largely related to economic deceleration in China (-1%), the world's second-largest economy and a leading consumer of raw materials. This effect was exacerbated by U.S. dollar strength relative to global currencies, which weighed on commodities priced in dollars and acutely impacted equity returns within regions most exposed to resources prices. The emerging-markets group, for example, returned about -15% this period. Canada, a significant energy producer, returned roughly -17%. Net energy consumer Japan (+9%) was the best-performing region by far. Only about a quarter of the nearly 50 index countries managed a gain this period: Ireland (+19%) - the EU's fastest-growing economy - and Israel (+17%) proved top performers; Greece (-56%) and Brazil (-46%), among the worst. As for sectors, energy (-25%) and materials (-16%) declined sharply, whereas the two consumer sectors each gained about 6%.
Comments from Portfolio Manager Jed Weiss: For the year, the fund's share classes (excluding sales charges, if applicable) produced low-single-digit gains, underperforming the 4.28% result of the benchmark MSCI EAFE Growth Index. The fund underperformed the benchmark largely for idiosyncratic reasons, including a fair-value pricing adjustment and unfavorable currency movements. Security selection was helpful overall, especially in information technology, materials and financials. Conversely, picks in health care hampered our relative result. In country terms, stock picking was strong in Australia, Spain and Switzerland, but weak in Hong Kong and Germany. Two of the fund's biggest individual detractors were Wynn Macau and Sands China, owners of casino properties in Macau. These stocks struggled for various reasons, and I eliminated the fund's stake in both. Another negative was Turkey-based Coca-Cola Icecek Sanayi. I sold the fund's stake in this owner of the Coca-Cola bottling franchise in various emerging markets and reinvested the proceeds in other stocks I thought offered a better risk/reward balance. In contrast, our biggest contributor was BGF Retail, a South Korean convenience-store retailer, while Visa and Mastercard, two U.S.-based payment processors, also contributed. Of all the stocks I mentioned, only Wynn and Sands were in our benchmark.
The views expressed above reflect those of the portfolio manager(s) only through the end of the period as stated on the cover of this report and do not necessarily represent the views of Fidelity or any other person in the Fidelity organization. Any such views are subject to change at any time based upon market or other conditions and Fidelity disclaims any responsibility to update such views. These views may not be relied on as investment advice and, because investment decisions for a Fidelity fund are based on numerous factors, may not be relied on as an indication of trading intent on behalf of any Fidelity fund.
Annual Report
Shareholder Expense Example
As a shareholder of the Fund, you incur two types of costs: (1) transaction costs, including sales charges (loads) on purchase payments or redemption proceeds, redemption fees and (2) ongoing costs, including management fees, distribution and/or service (12b-1) fees and other Fund expenses. This Example is intended to help you understand your ongoing costs (in dollars) of investing in the Fund and to compare these costs with the ongoing costs of investing in other mutual funds.
The Example is based on an investment of $1,000 invested at the beginning of the period and held for the entire period (May 1, 2015 to October 31, 2015).
Actual Expenses
The first line of the accompanying table for each class of the Fund provides information about actual account values and actual expenses. You may use the information in this line, together with the amount you invested, to estimate the expenses that you paid over the period. Simply divide your account value by $1,000.00 (for example, an $8,600 account value divided by $1,000.00 = 8.6), then multiply the result by the number in the first line for a class of the Fund under the heading entitled "Expenses Paid During Period" to estimate the expenses you paid on your account during this period. A small balance maintenance fee of $12.00 that is charged once a year may apply for certain accounts with a value of less than $2,000. This fee is not included in the table below. If it was, the estimate of expenses you paid during the period would be higher, and your ending account value lower, by this amount. In addition, the Fund, as a shareholder in the underlying Fidelity Central Funds, will indirectly bear its pro-rata share of the fees and expenses incurred by the underlying Fidelity Central Funds. These fees and expenses are not included in the Fund's annualized expense ratio used to calculate the expense estimate in the table below.
Hypothetical Example for Comparison Purposes
The second line of the accompanying table for each class of the Fund provides information about hypothetical account values and hypothetical expenses based on a Class' actual expense ratio and an assumed rate of return of 5% per year before expenses, which is not the Class' actual return. The hypothetical account values and expenses may not be used to estimate the actual ending account balance or expenses you paid for the period. You may use this information to compare the ongoing costs of investing in the Fund and other funds. To do so, compare this 5% hypothetical example with the 5% hypothetical examples that appear in the shareholder reports of the other funds. A small balance maintenance fee of $12.00 that is charged once a year may apply for certain accounts with a value of less than $2,000. This fee is not included in the table below. If it was, the estimate of expenses you paid during the period would be higher, and your ending account value lower, by this amount. In addition, the Fund, as a shareholder in the underlying Fidelity Central Funds, will indirectly bear its pro-rata share of the fees and expenses incurred by the underlying Fidelity Central Funds. These fees and expenses are not included in the Fund's annualized expense ratio used to calculate the expense estimate in the table below.
Please note that the expenses shown in the table are meant to highlight your ongoing costs only and do not reflect any transaction costs. Therefore, the second line of the table is useful in comparing ongoing costs only, and will not help you determine the relative total costs of owning different funds. In addition, if these transactional costs were included, your costs would have been higher.
Annual Report
Shareholder Expense Example - continued
| Annualized
Expense RatioB | Beginning
Account Value
May 1, 2015 | Ending
Account Value
October 31, 2015 | Expenses Paid
During PeriodC
May 1, 2015
to October 31, 2015 |
Class A | 1.25% | | | |
Actual | | $ 1,000.00 | $ 967.50 | $ 6.20 |
HypotheticalA | | $ 1,000.00 | $ 1,018.90 | $ 6.36 |
Class T | 1.56% | | | |
Actual | | $ 1,000.00 | $ 965.70 | $ 7.73 |
HypotheticalA | | $ 1,000.00 | $ 1,017.34 | $ 7.93 |
Class B | 2.05% | | | |
Actual | | $ 1,000.00 | $ 963.70 | $ 10.15 |
HypotheticalA | | $ 1,000.00 | $ 1,014.87 | $ 10.41 |
Class C | 2.05% | | | |
Actual | | $ 1,000.00 | $ 963.60 | $ 10.15 |
HypotheticalA | | $ 1,000.00 | $ 1,014.87 | $ 10.41 |
International Growth | .95% | | | |
Actual | | $ 1,000.00 | $ 968.50 | $ 4.71 |
HypotheticalA | | $ 1,000.00 | $ 1,020.42 | $ 4.84 |
Class I | .97% | | | |
Actual | | $ 1,000.00 | $ 968.50 | $ 4.81 |
HypotheticalA | | $ 1,000.00 | $ 1,020.32 | $ 4.94 |
Class Z | .84% | | | |
Actual | | $ 1,000.00 | $ 968.50 | $ 4.17 |
HypotheticalA | | $ 1,000.00 | $ 1,020.97 | $ 4.28 |
A 5% return per year before expenses
B Annualized expense ratio reflects expenses net of applicable fee waivers.
C Expenses are equal to each Class' annualized expense ratio, multiplied by the average account value over the period, multiplied by 184/365 (to reflect the one-half year period).
Annual Report
Investment Changes (Unaudited)

Annual Report
Investment Changes (Unaudited) - continued
Asset Allocation as of October 31, 2015 |
| % of fund's
net assets | % of fund's net assets
6 months ago |
Stocks | 97.7 | 98.1 |
Short-Term Investments and Net Other Assets (Liabilities) | 2.3 | 1.9 |
Top Ten Stocks as of October 31, 2015 |
| % of fund's
net assets | % of fund's net assets
6 months ago |
Novartis AG (Switzerland, Pharmaceuticals) | 3.7 | 3.9 |
Roche Holding AG (participation certificate) (Switzerland, Pharmaceuticals) | 3.6 | 3.8 |
Nestle SA (Switzerland, Food Products) | 3.0 | 3.6 |
Reckitt Benckiser Group PLC (United Kingdom, Household Products) | 2.8 | 2.2 |
Inditex SA (Spain, Specialty Retail) | 2.8 | 2.0 |
Anheuser-Busch InBev SA NV (Belgium, Beverages) | 2.6 | 2.9 |
Novo Nordisk A/S Series B sponsored ADR (Denmark, Pharmaceuticals) | 2.5 | 2.3 |
CSL Ltd. (Australia, Biotechnology) | 2.2 | 2.1 |
Visa, Inc. Class A (United States of America, IT Services) | 2.2 | 1.6 |
ASSA ABLOY AB (B Shares) (Sweden, Building Products) | 2.2 | 1.8 |
| 27.6 | |
Market Sectors as of October 31, 2015 |
| % of fund's
net assets | % of fund's net assets
6 months ago |
Health Care | 18.5 | 17.5 |
Financials | 18.1 | 16.6 |
Consumer Staples | 15.3 | 15.0 |
Consumer Discretionary | 15.1 | 15.2 |
Industrials | 12.5 | 14.9 |
Information Technology | 11.7 | 10.5 |
Materials | 6.0 | 5.9 |
Energy | 0.3 | 1.5 |
Telecommunication Services | 0.2 | 1.0 |
Annual Report
Investments October 31, 2015
Showing Percentage of Net Assets
Common Stocks - 97.7% |
| Shares | | Value |
Australia - 3.4% |
CSL Ltd. | 486,892 | | $ 32,363,861 |
Sydney Airport unit | 1,681,347 | | 7,683,937 |
Transurban Group unit | 1,384,277 | | 10,257,556 |
TOTAL AUSTRALIA | | 50,305,354 |
Austria - 0.9% |
Andritz AG | 251,621 | | 12,672,632 |
Bailiwick of Jersey - 1.3% |
Shire PLC | 259,100 | | 19,621,870 |
Belgium - 4.2% |
Anheuser-Busch InBev SA NV | 323,891 | | 38,648,165 |
KBC Groep NV | 391,998 | | 23,880,757 |
TOTAL BELGIUM | | 62,528,922 |
Canada - 0.3% |
Pason Systems, Inc. | 334,300 | | 4,918,883 |
Cayman Islands - 1.0% |
58.com, Inc. ADR (a)(d) | 79,700 | | 4,183,453 |
Alibaba Group Holding Ltd. sponsored ADR (a) | 127,500 | | 10,688,325 |
TOTAL CAYMAN ISLANDS | | 14,871,778 |
Denmark - 3.3% |
Jyske Bank A/S (Reg.) (a) | 224,900 | | 10,979,143 |
Novo Nordisk A/S Series B sponsored ADR | 698,800 | | 37,162,184 |
TOTAL DENMARK | | 48,141,327 |
Finland - 0.3% |
Tikkurila Oyj | 211,000 | | 3,872,516 |
France - 1.0% |
Safran SA | 194,500 | | 14,773,065 |
Germany - 3.1% |
Bayer AG | 164,100 | | 21,897,919 |
Linde AG | 134,277 | | 23,293,003 |
TOTAL GERMANY | | 45,190,922 |
Hong Kong - 1.8% |
AIA Group Ltd. | 4,403,400 | | 25,818,593 |
India - 0.7% |
Housing Development Finance Corp. Ltd. | 570,836 | | 10,934,415 |
Ireland - 2.7% |
CRH PLC sponsored ADR | 688,966 | | 18,850,110 |
Common Stocks - continued |
| Shares | | Value |
Ireland - continued |
James Hardie Industries PLC: | | | |
CDI | 978,142 | | $ 12,662,146 |
sponsored ADR (d) | 651,500 | | 8,567,225 |
TOTAL IRELAND | | 40,079,481 |
Israel - 0.3% |
Azrieli Group | 99,200 | | 3,886,828 |
Italy - 0.7% |
Azimut Holding SpA | 161,600 | | 3,889,928 |
Interpump Group SpA | 470,251 | | 6,929,294 |
TOTAL ITALY | | 10,819,222 |
Japan - 14.0% |
Astellas Pharma, Inc. | 1,867,900 | | 27,111,597 |
Coca-Cola Central Japan Co. Ltd. | 240,700 | | 3,382,888 |
DENSO Corp. | 642,300 | | 29,945,752 |
East Japan Railway Co. | 127,000 | | 12,074,600 |
Fast Retailing Co. Ltd. | 30,800 | | 11,250,698 |
Hoya Corp. | 336,800 | | 13,898,651 |
Japan Tobacco, Inc. | 333,200 | | 11,532,648 |
Keyence Corp. | 32,962 | | 17,160,297 |
Mitsui Fudosan Co. Ltd. | 645,000 | | 17,552,806 |
Nintendo Co. Ltd. | 46,900 | | 7,497,744 |
OSG Corp. | 185,500 | | 3,489,287 |
Seven Bank Ltd. | 2,950,000 | | 13,441,839 |
Shinsei Bank Ltd. | 4,579,000 | | 9,601,125 |
SHO-BOND Holdings Co. Ltd. | 182,600 | | 7,251,960 |
USS Co. Ltd. | 1,222,400 | | 21,580,109 |
TOTAL JAPAN | | 206,772,001 |
Kenya - 0.2% |
Safaricom Ltd. | 23,504,000 | | 3,305,070 |
Korea (South) - 0.9% |
BGFretail Co. Ltd. | 43,338 | | 6,452,666 |
NAVER Corp. | 13,427 | | 7,055,887 |
TOTAL KOREA (SOUTH) | | 13,508,553 |
Mexico - 0.6% |
Fomento Economico Mexicano S.A.B. de CV sponsored ADR | 83,555 | | 8,279,465 |
Netherlands - 1.0% |
ING Groep NV (Certificaten Van Aandelen) | 997,564 | | 14,518,414 |
Common Stocks - continued |
| Shares | | Value |
South Africa - 1.1% |
Clicks Group Ltd. | 524,756 | | $ 3,833,574 |
Naspers Ltd. Class N | 85,400 | | 12,508,548 |
TOTAL SOUTH AFRICA | | 16,342,122 |
Spain - 4.5% |
Amadeus IT Holding SA Class A | 344,400 | | 14,679,166 |
Hispania Activos Inmobiliarios SA (a) | 215,259 | | 3,242,921 |
Inditex SA (d) | 1,094,531 | | 41,048,812 |
Merlin Properties Socimi SA | 328,600 | | 4,213,283 |
Prosegur Compania de Seguridad SA (Reg.) | 725,749 | | 3,232,183 |
TOTAL SPAIN | | 66,416,365 |
Sweden - 6.1% |
ASSA ABLOY AB (B Shares) | 1,602,483 | | 31,878,324 |
Atlas Copco AB (A Shares) (d) | 460,909 | | 12,030,445 |
Fagerhult AB | 347,753 | | 5,942,721 |
H&M Hennes & Mauritz AB (B Shares) | 401,483 | | 15,615,617 |
Intrum Justitia AB | 189,300 | | 6,802,219 |
Svenska Handelsbanken AB (A Shares) | 1,283,620 | | 17,433,460 |
TOTAL SWEDEN | | 89,702,786 |
Switzerland - 13.6% |
Credit Suisse Group AG (e)(f) | 199,196 | | 4,584,662 |
Nestle SA | 575,034 | | 43,917,645 |
Novartis AG | 605,045 | | 54,810,263 |
Roche Holding AG (participation certificate) | 194,838 | | 52,898,295 |
Schindler Holding AG: | | | |
(participation certificate) | 87,617 | | 14,235,713 |
(Reg.) | 10,980 | | 1,786,215 |
UBS Group AG | 1,398,461 | | 28,011,174 |
TOTAL SWITZERLAND | | 200,243,967 |
Taiwan - 0.9% |
Taiwan Semiconductor Manufacturing Co. Ltd. | 3,093,000 | | 13,032,276 |
United Kingdom - 14.4% |
Associated British Foods PLC | 311,000 | | 16,564,569 |
Babcock International Group PLC | 627,284 | | 9,322,083 |
BAE Systems PLC | 1,392,900 | | 9,422,262 |
Berendsen PLC | 523,573 | | 8,273,186 |
Informa PLC | 1,098,226 | | 9,616,383 |
InterContinental Hotel Group PLC ADR | 754,296 | | 30,081,324 |
Johnson Matthey PLC | 188,977 | | 7,530,801 |
Common Stocks - continued |
| Shares | | Value |
United Kingdom - continued |
Lloyds Banking Group PLC | 10,251,500 | | $ 11,635,578 |
Prudential PLC | 1,005,426 | | 23,483,228 |
Reckitt Benckiser Group PLC | 429,145 | | 41,880,483 |
Rightmove PLC | 65,000 | | 3,846,832 |
Rolls-Royce Group PLC | 518,537 | | 5,483,278 |
SABMiller PLC | 446,166 | | 27,477,990 |
Shaftesbury PLC | 277,333 | | 4,020,981 |
Unite Group PLC | 413,776 | | 4,241,883 |
TOTAL UNITED KINGDOM | | 212,880,861 |
United States of America - 15.4% |
Alphabet, Inc. Class A (a) | 26,336 | | 19,419,903 |
Autoliv, Inc. (d) | 156,569 | | 18,982,426 |
Berkshire Hathaway, Inc. Class B (a) | 96,184 | | 13,082,948 |
BorgWarner, Inc. | 184,492 | | 7,899,947 |
China Biologic Products, Inc. (a) | 63,166 | | 7,197,134 |
Domino's Pizza, Inc. | 33,790 | | 3,604,379 |
Martin Marietta Materials, Inc. | 52,600 | | 8,160,890 |
MasterCard, Inc. Class A | 303,000 | | 29,993,970 |
McGraw Hill Financial, Inc. | 92,100 | | 8,532,144 |
Mohawk Industries, Inc. (a) | 97,900 | | 19,139,450 |
Moody's Corp. | 69,100 | | 6,644,656 |
Philip Morris International, Inc. | 206,108 | | 18,219,947 |
PriceSmart, Inc. | 73,800 | | 6,345,324 |
ResMed, Inc. | 128,000 | | 7,374,080 |
Sherwin-Williams Co. | 15,000 | | 4,002,450 |
SS&C Technologies Holdings, Inc. | 210,300 | | 15,593,745 |
Visa, Inc. Class A | 415,800 | | 32,257,764 |
TOTAL UNITED STATES OF AMERICA | | 226,451,157 |
TOTAL COMMON STOCKS (Cost $1,309,769,980) |
1,439,888,845
|
Nonconvertible Preferred Stocks - 0.0% |
| | | |
United Kingdom - 0.0% |
Rolls-Royce Group PLC
(Cost $73,994) | 48,068,379 | |
74,102
|
Money Market Funds - 7.4% |
| Shares | | Value |
Fidelity Cash Central Fund, 0.18% (b) | 35,048,921 | | $ 35,048,921 |
Fidelity Securities Lending Cash Central Fund, 0.19% (b)(c) | 73,928,962 | | 73,928,962 |
TOTAL MONEY MARKET FUNDS (Cost $108,977,883) |
108,977,883
|
TOTAL INVESTMENT PORTFOLIO - 105.1% (Cost $1,418,821,857) | | 1,548,940,830 |
NET OTHER ASSETS (LIABILITIES) - (5.1)% | | (75,061,785) |
NET ASSETS - 100% | $ 1,473,879,045 |
Legend |
(a) Non-income producing |
(b) Affiliated fund that is generally available only to investment companies and other accounts managed by Fidelity Investments. The rate quoted is the annualized seven-day yield of the fund at period end. A complete unaudited listing of the fund's holdings as of its most recent quarter end is available upon request. In addition, each Fidelity Central Fund's financial statements, which are not covered by the Fund's Report of Independent Registered Public Accounting Firm, are available on the SEC's website or upon request. |
(c) Investment made with cash collateral received from securities on loan. |
(d) Security or a portion of the security is on loan at period end. |
(e) Security or a portion of the security purchased on a delayed delivery or when-issued basis. Interest rate to be determined at settlement date. |
(f) Restricted securities - Investment in securities not registered under the Securities Act of 1933 (excluding 144A issues). At the end of the period, the value of restricted securities (excluding 144A issues) amounted to $4,584,662 or 0.3% of net assets. |
Additional information on each restricted holding is as follows: |
Security | Acquisition Date | Acquisition Cost |
Credit Suisse Group AG | 10/21/15 | $ 4,723,236 |
Affiliated Central Funds |
Information regarding fiscal year to date income earned by the Fund from investments in Fidelity Central Funds is as follows: |
Fund | Income earned |
Fidelity Cash Central Fund | $ 49,088 |
Fidelity Securities Lending Cash Central Fund | 197,556 |
Total | $ 246,644 |
Other Information |
Categorizations in the Schedule of Investments are based on country or territory of incorporation. |
The following is a summary of the inputs used, as of October 31, 2015, involving the Fund's assets and liabilities carried at fair value. The inputs or methodology used for valuing securities may not be an indication of the risk associated with investing in those securities. For more information on valuation inputs, and their aggregation into the levels used in the tables below, please refer to the Investment Valuation section in the accompanying Notes to Financial Statements. |
Valuation Inputs at Reporting Date: |
Description | Total | Level 1 | Level 2 | Level 3 |
Investments in Securities: | | | | |
Equities: | | | | |
Consumer Discretionary | $ 225,120,277 | $ 162,343,718 | $ 62,776,559 | $ - |
Consumer Staples | 226,535,364 | 87,173,535 | 139,361,829 | - |
Energy | 4,918,883 | 4,918,883 | - | - |
Financials | 263,630,766 | 129,145,060 | 134,485,706 | - |
Health Care | 274,335,854 | 73,631,317 | 200,704,537 | - |
Industrials | 183,615,062 | 81,300,793 | 102,314,269 | - |
Information Technology | 171,562,530 | 133,872,213 | 37,690,317 | - |
Materials | 86,939,141 | 74,276,995 | 12,662,146 | - |
Telecommunication Services | 3,305,070 | 3,305,070 | - | - |
Money Market Funds | 108,977,883 | 108,977,883 | - | - |
Total Investments in Securities: | $ 1,548,940,830 | $ 858,945,467 | $ 689,995,363 | $ - |
The following is a summary of transfers between Level 1 and Level 2 for the period ended October 31, 2015. Transfers are assumed to have occurred at the beginning of the period, and are primarily attributable to the valuation techniques used for foreign equity securities, as discussed in the accompanying Notes to Financial Statements: |
Transfers | Total |
Level 1 to Level 2 | $ 68,602,068 |
Level 2 to Level 1 | $ 15,033,001 |
See accompanying notes which are an integral part of the financial statements.
Annual Report
Statement of Assets and Liabilities
| | October 31, 2015 |
| | |
Assets | | |
Investment in securities, at value (including securities loaned of $71,231,511) - See accompanying schedule: Unaffiliated issuers (cost $1,309,843,974) | $ 1,439,962,947 | |
Fidelity Central Funds (cost $108,977,883) | 108,977,883 | |
Total Investments (cost $1,418,821,857) | | $ 1,548,940,830 |
Receivable for fund shares sold | | 2,613,468 |
Dividends receivable | | 3,193,478 |
Distributions receivable from Fidelity Central Funds | | 26,736 |
Prepaid expenses | | 3,605 |
Other receivables | | 11,410 |
Total assets | | 1,554,789,527 |
| | |
Liabilities | | |
Payable to custodian bank | $ 669 | |
Payable for investments purchased | | |
Regular delivery | 74,296 | |
Delayed delivery | 4,723,236 | |
Payable for fund shares redeemed | 878,160 | |
Accrued management fee | 840,888 | |
Distribution and service plan fees payable | 92,259 | |
Other affiliated payables | 269,569 | |
Other payables and accrued expenses | 102,443 | |
Collateral on securities loaned, at value | 73,928,962 | |
Total liabilities | | 80,910,482 |
| | |
Net Assets | | $ 1,473,879,045 |
Net Assets consist of: | | |
Paid in capital | | $ 1,371,308,764 |
Undistributed net investment income | | 9,047,261 |
Accumulated undistributed net realized gain (loss) on investments and foreign currency transactions | | (36,661,663) |
Net unrealized appreciation (depreciation) on investments and assets and liabilities in foreign currencies | | 130,184,683 |
Net Assets | | $ 1,473,879,045 |
See accompanying notes which are an integral part of the financial statements.
Annual Report
Financial Statements - continued
Statement of Assets and Liabilities - continued
| | October 31, 2015 |
Calculation of Maximum Offering Price | | |
Class A: | | |
Net Asset Value and redemption price per share ($184,878,255 ÷ 16,367,440 shares) | | $ 11.30 |
| | |
Maximum offering price per share (100/94.25 of $11.30) | | $ 11.99 |
Class T: | | |
Net Asset Value and redemption price per share ($28,832,624 ÷ 2,560,965 shares) | | $ 11.26 |
| | |
Maximum offering price per share (100/96.50 of $11.26) | | $ 11.67 |
Class B: | | |
Net Asset Value and offering price per share ($799,594 ÷ 71,668 shares)A | | $ 11.16 |
| | |
Class C: | | |
Net Asset Value and offering price per share ($52,378,157 ÷ 4,709,671 shares)A | | $ 11.12 |
| | |
International Growth: | | |
Net Asset Value, offering price and redemption price per share ($938,347,837 ÷ 82,424,899 shares) | | $ 11.38 |
| | |
Class I: | | |
Net Asset Value, offering price and redemption price per share ($267,745,321 ÷ 23,560,669 shares) | | $ 11.36 |
| | |
Class Z: | | |
Net Asset Value, offering price and redemption price per share ($897,257 ÷ 78,813 shares) | | $ 11.38 |
A Redemption price per share is equal to net asset value less any applicable contingent deferred sales charge.
See accompanying notes which are an integral part of the financial statements.
Annual Report
Statement of Operations
| Year ended October 31, 2015 |
Investment Income | | |
Dividends | | $ 24,663,808 |
Income from Fidelity Central Funds | | 246,644 |
Income before foreign taxes withheld | | 24,910,452 |
Less foreign taxes withheld | | (2,081,814) |
Total income | | 22,828,638 |
| | |
Expenses | | |
Management fee | | |
Basic fee | $ 8,327,944 | |
Performance adjustment | 167,926 | |
Transfer agent fees | 2,302,155 | |
Distribution and service plan fees | 939,382 | |
Accounting and security lending fees | 550,149 | |
Custodian fees and expenses | 146,301 | |
Independent trustees' compensation | 4,871 | |
Registration fees | 185,556 | |
Audit | 69,990 | |
Legal | 2,556 | |
Miscellaneous | 14,108 | |
Total expenses before reductions | 12,710,938 | |
Expense reductions | (87,519) | 12,623,419 |
Net investment income (loss) | | 10,205,219 |
Realized and Unrealized Gain (Loss) | | |
Net realized gain (loss) on: | | |
Investment securities: | | |
Unaffiliated issuers (net of foreign taxes of $16,052) | (27,244,971) | |
Foreign currency transactions | (218,206) | |
Total net realized gain (loss) | | (27,463,177) |
Change in net unrealized appreciation (depreciation) on: Investment securities (net of increase in deferred foreign taxes of $6,961) | 41,313,127 | |
Assets and liabilities in foreign currencies | 137,123 | |
Total change in net unrealized appreciation (depreciation) | | 41,450,250 |
Net gain (loss) | | 13,987,073 |
Net increase (decrease) in net assets resulting from operations | | $ 24,192,292 |
See accompanying notes which are an integral part of the financial statements.
Annual Report
Financial Statements - continued
Statement of Changes in Net Assets
| Year ended
October 31,
2015 | Year ended
October 31,
2014 |
Increase (Decrease) in Net Assets | | |
Operations | | |
Net investment income (loss) | $ 10,205,219 | $ 8,064,649 |
Net realized gain (loss) | (27,463,177) | (8,929,624) |
Change in net unrealized appreciation (depreciation) | 41,450,250 | 17,872,842 |
Net increase (decrease) in net assets resulting from operations | 24,192,292 | 17,007,867 |
Distributions to shareholders from net investment income | (7,019,924) | (2,592,643) |
Distributions to shareholders from net realized gain | - | (513,441) |
Total distributions | (7,019,924) | (3,106,084) |
Share transactions - net increase (decrease) | 519,861,476 | 336,569,228 |
Redemption fees | 54,094 | 42,228 |
Total increase (decrease) in net assets | 537,087,938 | 350,513,239 |
| | |
Net Assets | | |
Beginning of period | 936,791,107 | 586,277,868 |
End of period (including undistributed net investment income of $9,047,261 and undistributed net investment income of $6,829,762, respectively) | $ 1,473,879,045 | $ 936,791,107 |
See accompanying notes which are an integral part of the financial statements.
Annual Report
Financial Highlights - Fidelity International Growth Fund Class A
Years ended October 31, | 2015 | 2014 | 2013 | 2012 | 2011 |
Selected Per-Share Data | | | | | |
Net asset value, beginning of period | $ 11.01 | $ 10.78 | $ 8.91 | $ 8.09 | $ 8.38 |
Income from Investment Operations | | | | |
Net investment income (loss) C | .07 | .09 | .08 | .08 | .08 |
Net realized and unrealized gain (loss) | .28 | .18 | 1.88 | .81 | (.31) |
Total from investment operations | .35 | .27 | 1.96 | .89 | (.23) |
Distributions from net investment income | (.06) | (.03) | (.08) | (.06) | (.05) |
Distributions from net realized gain | - | (.01) | (.01) | (.01) | (.01) |
Total distributions | (.06) | (.04) | (.09) | (.07) | (.06) |
Redemption fees added to paid in capitalC, G | - | - | - | - | - |
Net asset value, end of period | $ 11.30 | $ 11.01 | $ 10.78 | $ 8.91 | $ 8.09 |
Total ReturnA, B | 3.20% | 2.54% | 22.18% | 11.10% | (2.76)% |
Ratios to Average Net AssetsD, F | | | | | |
Expenses before reductions | 1.26% | 1.35% | 1.44% | 1.58% | 1.77% |
Expenses net of fee waivers, if any | 1.26% | 1.35% | 1.43% | 1.45% | 1.45% |
Expenses net of all reductions | 1.25% | 1.34% | 1.42% | 1.44% | 1.43% |
Net investment income (loss) | .66% | .84% | .80% | .99% | .92% |
Supplemental Data | | | | | |
Net assets, end of period (000 omitted) | $ 184,878 | $ 119,017 | $ 74,595 | $ 21,874 | $ 6,352 |
Portfolio turnover rateE | 26% | 27% | 32% | 32% | 68% |
A Total returns would have been lower if certain expenses had not been reduced during the applicable periods shown.
B Total returns do not include the effect of the sales charges.
C Calculated based on average shares outstanding during the period.
D Fees and expenses of any underlying Fidelity Central Funds are not included in the Fund's expense ratio. The Fund indirectly bears its proportionate share of the expenses of any underlying Fidelity Central Funds.
E Amount does not include the portfolio activity of any underlying Fidelity Central Funds.
F Expense ratios reflect operating expenses of the class. Expenses before reductions do not reflect amounts reimbursed by the investment adviser or reductions from brokerage service arrangements or reductions from other expense offset arrangements and do not represent the amount paid by the class during periods when reimbursements or reductions occur. Expenses net of fee waivers reflect expenses after reimbursement by the investment adviser but prior to reductions from brokerage service arrangements or other expense offset arrangements. Expenses net of all reductions represent the net expenses paid by the class.
G Amount represents less than $.005 per share.
See accompanying notes which are an integral part of the financial statements.
Annual Report
Financial Highlights - Fidelity International Growth Fund Class T
Years ended October 31, | 2015 | 2014 | 2013 | 2012 | 2011 |
Selected Per-Share Data | | | | | |
Net asset value, beginning of period | $ 10.96 | $ 10.75 | $ 8.89 | $ 8.08 | $ 8.38 |
Income from Investment Operations | | | | |
Net investment income (loss) C | .04 | .06 | .05 | .06 | .06 |
Net realized and unrealized gain (loss) | .27 | .18 | 1.88 | .81 | (.31) |
Total from investment operations | .31 | .24 | 1.93 | .87 | (.25) |
Distributions from net investment income | (.01) | (.02) | (.07) | (.05) | (.04) |
Distributions from net realized gain | - | (.01) | (.01) | (.01) | (.01) |
Total distributions | (.01) | (.03) | (.07) H | (.06) | (.05) |
Redemption fees added to paid in capitalC, G | - | - | - | - | - |
Net asset value, end of period | $ 11.26 | $ 10.96 | $ 10.75 | $ 8.89 | $ 8.08 |
Total ReturnA, B | 2.85% | 2.21% | 21.91% | 10.82% | (3.03)% |
Ratios to Average Net AssetsD, F | | | | | |
Expenses before reductions | 1.58% | 1.65% | 1.69% | 1.85% | 2.03% |
Expenses net of fee waivers, if any | 1.58% | 1.65% | 1.69% | 1.70% | 1.70% |
Expenses net of all reductions | 1.58% | 1.65% | 1.68% | 1.69% | 1.68% |
Net investment income (loss) | .33% | .53% | .54% | .74% | .67% |
Supplemental Data | | | | | |
Net assets, end of period (000 omitted) | $ 28,833 | $ 26,369 | $ 23,118 | $ 10,690 | $ 2,917 |
Portfolio turnover rateE | 26% | 27% | 32% | 32% | 68% |
A Total returns would have been lower if certain expenses had not been reduced during the applicable periods shown.
B Total returns do not include the effect of the sales charges.
C Calculated based on average shares outstanding during the period.
D Fees and expenses of any underlying Fidelity Central Funds are not included in the Fund's expense ratio. The Fund indirectly bears its proportionate share of the expenses of any underlying Fidelity Central Funds.
E Amount does not include the portfolio activity of any underlying Fidelity Central Funds.
F Expense ratios reflect operating expenses of the class. Expenses before reductions do not reflect amounts reimbursed by the investment adviser or reductions from brokerage service arrangements or reductions from other expense offset arrangements and do not represent the amount paid by the class during periods when reimbursements or reductions occur. Expenses net of fee waivers reflect expenses after reimbursement by the investment adviser but prior to reductions from brokerage service arrangements or other expense offset arrangements. Expenses net of all reductions represent the net expenses paid by the class.
G Amount represents less than $.005 per share.
H Total distributions of $.07 per share is comprised of distributions from net investment income of $0.69 and distributions from net realized gain of $.005 per share.
See accompanying notes which are an integral part of the financial statements.
Annual Report
Financial Highlights - Fidelity International Growth Fund Class B
Years ended October 31, | 2015 | 2014 | 2013 | 2012 | 2011 |
Selected Per-Share Data | | | | | |
Net asset value, beginning of period | $ 10.91 | $ 10.73 | $ 8.88 | $ 8.06 | $ 8.36 |
Income from Investment Operations | | | | |
Net investment income (loss) C | (.02) | - G | - G | .02 | .01 |
Net realized and unrealized gain (loss) | .27 | .19 | 1.89 | .80 | (.30) |
Total from investment operations | .25 | .19 | 1.89 | .82 | (.29) |
Distributions from net investment income | - | - | (.03) | - | (.01) |
Distributions from net realized gain | - | (.01) | (.01) | - | - G |
Total distributions | - | (.01) | (.04) | - | (.01) |
Redemption fees added to paid in capitalC, G | - | - | - | - | - |
Net asset value, end of period | $ 11.16 | $ 10.91 | $ 10.73 | $ 8.88 | $ 8.06 |
Total ReturnA, B | 2.29% | 1.76% | 21.35% | 10.17% | (3.47)% |
Ratios to Average Net AssetsD, F | | | | | |
Expenses before reductions | 2.07% | 2.14% | 2.19% | 2.35% | 2.55% |
Expenses net of fee waivers, if any | 2.07% | 2.14% | 2.18% | 2.20% | 2.20% |
Expenses net of all reductions | 2.06% | 2.14% | 2.17% | 2.19% | 2.18% |
Net investment income (loss) | (.15)% | .04% | .05% | .24% | .17% |
Supplemental Data | | | | | |
Net assets, end of period (000 omitted) | $ 800 | $ 1,404 | $ 1,579 | $ 1,116 | $ 473 |
Portfolio turnover rateE | 26% | 27% | 32% | 32% | 68% |
A Total returns would have been lower if certain expenses had not been reduced during the applicable periods shown.
B Total returns do not include the effect of the contingent deferred sales charge.
C Calculated based on average shares outstanding during the period.
D Fees and expenses of any underlying Fidelity Central Funds are not included in the Fund's expense ratio. The Fund indirectly bears its proportionate share of the expenses of any underlying Fidelity Central Funds.
E Amount does not include the portfolio activity of any underlying Fidelity Central Funds.
F Expense ratios reflect operating expenses of the class. Expenses before reductions do not reflect amounts reimbursed by the investment adviser or reductions from brokerage service arrangements or reductions from other expense offset arrangements and do not represent the amount paid by the class during periods when reimbursements or reductions occur. Expenses net of fee waivers reflect expenses after reimbursement by the investment adviser but prior to reductions from brokerage service arrangements or other expense offset arrangements. Expenses net of all reductions represent the net expenses paid by the class.
G Amount represents less than $.005 per share.
See accompanying notes which are an integral part of the financial statements.
Annual Report
Financial Highlights - Fidelity International Growth Fund Class C
Years ended October 31, | 2015 | 2014 | 2013 | 2012 | 2011 |
Selected Per-Share Data | | | | | |
Net asset value, beginning of period | $ 10.87 | $ 10.69 | $ 8.84 | $ 8.03 | $ 8.34 |
Income from Investment Operations | | | | |
Net investment income (loss) C | (.02) | .01 | .01 | .02 | .01 |
Net realized and unrealized gain (loss) | .27 | .18 | 1.87 | .80 | (.31) |
Total from investment operations | .25 | .19 | 1.88 | .82 | (.30) |
Distributions from net investment income | - | - | (.02) | (.01) | (.01) |
Distributions from net realized gain | - | (.01) | (.01) | (.01) | (.01) |
Total distributions | - | (.01) | (.03) | (.01) I | (.01) H |
Redemption fees added to paid in capitalC, G | - | - | - | - | - |
Net asset value, end of period | $ 11.12 | $ 10.87 | $ 10.69 | $ 8.84 | $ 8.03 |
Total ReturnA, B | 2.30% | 1.77% | 21.29% | 10.27% | (3.57)% |
Ratios to Average Net AssetsD, F | | | | | |
Expenses before reductions | 2.06% | 2.12% | 2.19% | 2.33% | 2.52% |
Expenses net of fee waivers, if any | 2.06% | 2.12% | 2.18% | 2.20% | 2.20% |
Expenses net of all reductions | 2.05% | 2.12% | 2.17% | 2.19% | 2.18% |
Net investment income (loss) | (.15)% | .06% | .05% | .24% | .17% |
Supplemental Data | | | | | |
Net assets, end of period (000 omitted) | $ 52,378 | $ 32,737 | $ 17,196 | $ 5,648 | $ 2,767 |
Portfolio turnover rateE | 26% | 27% | 32% | 32% | 68% |
A Total returns would have been lower if certain expenses had not been reduced during the applicable periods shown.
B Total returns do not include the effect of the contingent deferred sales charge.
C Calculated based on average shares outstanding during the period.
D Fees and expenses of any underlying Fidelity Central Funds are not included in the Fund's expense ratio. The Fund indirectly bears its proportionate share of the expenses of any underlying Fidelity Central Funds.
E Amount does not include the portfolio activity of any underlying Fidelity Central Funds.
F Expense ratios reflect operating expenses of the class. Expenses before reductions do not reflect amounts reimbursed by the investment adviser or reductions from brokerage service arrangements or reductions from other expense offset arrangements and do not represent the amount paid by the class during periods when reimbursements or reductions occur. Expenses net of fee waivers reflect expenses after reimbursement by the investment adviser but prior to reductions from brokerage service arrangements or other expense offset arrangements. Expenses net of all reductions represent the net expenses paid by the class.
G Amount represents less than $.005 per share.
H Total distributions of $.01 per share is comprised of distributions from net investment income of $.008 and distributions from net realized gain of $.005 per share.
I Total distributions of $.01 per share is comprised of distributions from net investment income of $.007 and distributions from net realized gain of $.006 per share.
See accompanying notes which are an integral part of the financial statements.
Annual Report
Financial Highlights - Fidelity International Growth Fund
Years ended October 31, | 2015 | 2014 | 2013 | 2012 | 2011 |
Selected Per-Share Data | | | | | |
Net asset value, beginning of period | $ 11.10 | $ 10.84 | $ 8.95 | $ 8.12 | $ 8.40 |
Income from Investment Operations | | | | |
Net investment income (loss) B | .11 | .13 | .11 | .11 | .10 |
Net realized and unrealized gain (loss) | .26 | .19 | 1.88 | .81 | (.30) |
Total from investment operations | .37 | .32 | 1.99 | .92 | (.20) |
Distributions from net investment income | (.09) | (.05) | (.10) | (.08) | (.07) |
Distributions from net realized gain | - | (.01) | (.01) | (.01) | (.01) |
Total distributions | (.09) | (.06) | (.10) G | (.09) | (.08) |
Redemption fees added to paid in capitalB, F | - | - | - | - | - |
Net asset value, end of period | $ 11.38 | $ 11.10 | $ 10.84 | $ 8.95 | $ 8.12 |
Total ReturnA | 3.36% | 2.96% | 22.48% | 11.41% | (2.47)% |
Ratios to Average Net AssetsC, E | | | | | |
Expenses before reductions | .97% | 1.04% | 1.13% | 1.28% | 1.52% |
Expenses net of fee waivers, if any | .97% | 1.04% | 1.13% | 1.20% | 1.20% |
Expenses net of all reductions | .96% | 1.04% | 1.11% | 1.19% | 1.18% |
Net investment income (loss) | .94% | 1.14% | 1.11% | 1.24% | 1.17% |
Supplemental Data | | | | | |
Net assets, end of period (000 omitted) | $ 938,348 | $ 635,607 | $ 430,914 | $ 149,526 | $ 53,437 |
Portfolio turnover rateD | 26% | 27% | 32% | 32% | 68% |
A Total returns would have been lower if certain expenses had not been reduced during the applicable periods shown.
B Calculated based on average shares outstanding during the period.
C Fees and expenses of any underlying Fidelity Central Funds are not included in the Fund's expense ratio. The Fund indirectly bears its proportionate share of the expenses of any underlying Fidelity Central Funds.
D Amount does not include the portfolio activity of any underlying Fidelity Central Funds.
E Expense ratios reflect operating expenses of the class. Expenses before reductions do not reflect amounts reimbursed by the investment adviser or reductions from brokerage service arrangements or reductions from other expense offset arrangements and do not represent the amount paid by the class during periods when reimbursements or reductions occur. Expenses net of fee waivers reflect expenses after reimbursement by the investment adviser but prior to reductions from brokerage service arrangements or other expense offset arrangements. Expenses net of all reductions represent the net expenses paid by the class.
F Amount represents less than $.005 per share.
G Total distributions of $.10 per share is comprised of distributions from net investment income of $.097 and distributions from net realized gain of $.005 per share.
See accompanying notes which are an integral part of the financial statements.
Annual Report
Financial Highlights - Fidelity International Growth Fund Class I
Years ended October 31, | 2015 | 2014 | 2013 | 2012 | 2011 |
Selected Per-Share Data | | | | | |
Net asset value, beginning of period | $ 11.08 | $ 10.84 | $ 8.94 | $ 8.12 | $ 8.40 |
Income from Investment Operations | | | | |
Net investment income (loss) B | .11 | .13 | .11 | .10 | .10 |
Net realized and unrealized gain (loss) | .27 | .18 | 1.90 | .81 | (.30) |
Total from investment operations | .38 | .31 | 2.01 | .91 | (.20) |
Distributions from net investment income | (.10) | (.06) | (.10) | (.08) | (.07) |
Distributions from net realized gain | - | (.01) | (.01) | (.01) | (.01) |
Total distributions | (.10) | (.07) | (.11) | (.09) | (.08) |
Redemption fees added to paid in capitalB, F | - | - | - | - | - |
Net asset value, end of period | $ 11.36 | $ 11.08 | $ 10.84 | $ 8.94 | $ 8.12 |
Total ReturnA | 3.41% | 2.84% | 22.66% | 11.28% | (2.47)% |
Ratios to Average Net AssetsC, E | | | | | |
Expenses before reductions | .98% | 1.04% | 1.11% | 1.27% | 1.50% |
Expenses net of fee waivers, if any | .98% | 1.04% | 1.11% | 1.20% | 1.20% |
Expenses net of all reductions | .97% | 1.04% | 1.09% | 1.19% | 1.18% |
Net investment income (loss) | .94% | 1.14% | 1.13% | 1.24% | 1.17% |
Supplemental Data | | | | | |
Net assets, end of period (000 omitted) | $ 267,745 | $ 121,554 | $ 38,771 | $ 3,992 | $ 493 |
Portfolio turnover rateD | 26% | 27% | 32% | 32% | 68% |
A Total returns would have been lower if certain expenses had not been reduced during the applicable periods shown.
B Calculated based on average shares outstanding during the period.
C Fees and expenses of any underlying Fidelity Central Funds are not included in the Fund's expense ratio. The Fund indirectly bears its proportionate share of the expenses of any underlying Fidelity Central Funds.
D Amount does not include the portfolio activity of any underlying Fidelity Central Funds.
E Expense ratios reflect operating expenses of the class. Expenses before reductions do not reflect amounts reimbursed by the investment adviser or reductions from brokerage service arrangements or reductions from other expense offset arrangements and do not represent the amount paid by the class during periods when reimbursements or reductions occur. Expenses net of fee waivers reflect expenses after reimbursement by the investment adviser but prior to reductions from brokerage service arrangements or other expense offset arrangements. Expenses net of all reductions represent the net expenses paid by the class.
F Amount represents less than $.005 per share.
See accompanying notes which are an integral part of the financial statements.
Annual Report
Financial Highlights - Fidelity International Growth Fund Class Z
Years ended October 31, | 2015 | 2014 | 2013 G |
Selected Per-Share Data | | | |
Net asset value, beginning of period | $ 11.10 | $ 10.84 | $ 10.26 |
Income from Investment Operations | | | |
Net investment income (loss) D | .12 | .14 | .02 |
Net realized and unrealized gain (loss) | .27 | .19 | .56 |
Total from investment operations | .39 | .33 | .58 |
Distributions from net investment income | (.11) | (.06) | - |
Distributions from net realized gain | - | (.01) | - |
Total distributions | (.11) | (.07) | - |
Redemption fees added to paid in capitalD, I | - | - | - |
Net asset value, end of period | $ 11.38 | $ 11.10 | $ 10.84 |
Total ReturnB, C | 3.52% | 3.07% | 5.65% |
Ratios to Average Net AssetsE, H | | | |
Expenses before reductions | .84% | .88% | .94%A |
Expenses net of fee waivers, if any | .84% | .88% | .94%A |
Expenses net of all reductions | .83% | .88% | .93%A |
Net investment income (loss) | 1.07% | 1.30% | .65%A |
Supplemental Data | | | |
Net assets, end of period (000 omitted) | $ 897 | $ 104 | $ 106 |
Portfolio turnover rateF | 26% | 27% | 32% |
A Annualized
B Total returns for periods of less than one year are not annualized.
C Total returns would have been lower if certain expenses had not been reduced during the applicable periods shown.
D Calculated based on average shares outstanding during the period.
E Fees and expenses of any underlying Fidelity Central Funds are not included in the Fund's expense ratio. The Fund indirectly bears its proportionate share of the expenses of any underlying Fidelity Central Funds.
F Amount does not include the portfolio activity of any underlying Fidelity Central Funds.
G For the period August 13, 2013 (commencement of sale of shares) to October 31, 2013.
H Expense ratios reflect operating expenses of the class. Expenses before reductions do not reflect amounts reimbursed by the investment adviser or reductions from brokerage service arrangements or reductions from other expense offset arrangements and do not represent the amount paid by the class during periods when reimbursements or reductions occur. Expenses net of fee waivers reflect expenses after reimbursement by the investment adviser but prior to reductions from brokerage service arrangements or other expense offset arrangements. Expenses net of all reductions represent the net expenses paid by the class.
I Amount represents less than $.005 per share.
See accompanying notes which are an integral part of the financial statements.
Annual Report
For the period ended October 31, 2015
1. Organization.
Fidelity International Growth Fund (the Fund) is a fund of Fidelity Investment Trust (the Trust) and is authorized to issue an unlimited number of shares. The Trust is registered under the Investment Company Act of 1940, as amended (the 1940 Act), as an open-end management investment company organized as a Massachusetts business trust. The Fund offers Class A, Class T, Class C, International Growth, Class I (formerly Institutional Class) and Class Z shares, each of which, along with Class B shares, has equal rights as to assets and voting privileges. Class B shares are closed to new accounts and additional purchases, except for exchanges and reinvestments. Each class has exclusive voting rights with respect to matters that affect that class. Class B shares will automatically convert to Class A shares after a holding period of seven years from the initial date of purchase.
2. Investments in Fidelity Central Funds.
The Fund invests in Fidelity Central Funds, which are open-end investment companies generally available only to other investment companies and accounts managed by the investment adviser and its affiliates. The Fund's Schedule of Investments lists each of the Fidelity Central Funds held as of period end, if any, as an investment of the Fund, but does not include the underlying holdings of each Fidelity Central Fund. As an Investing Fund, the Fund indirectly bears its proportionate share of the expenses of the underlying Fidelity Central Funds.
The Money Market Central Funds seek preservation of capital and current income and are managed by Fidelity Investments Money Management, Inc. (FIMM), an affiliate of the investment adviser. Annualized expenses of the Money Market Central Funds as of their most recent shareholder report date are less than .005%.
A complete unaudited list of holdings for each Fidelity Central Fund is available upon request or at the Securities and Exchange Commission (the SEC) website at www.sec.gov. In addition, the financial statements of the Fidelity Central Funds, which are not covered by the Fund's Report of Independent Registered Public Accounting Firm, are available on the SEC website or upon request.
3. Significant Accounting Policies.
The financial statements have been prepared in conformity with accounting principles generally accepted in the United States of America (GAAP), which require management to make certain estimates and assumptions at the date of the financial statements. Actual results could differ from those estimates. Subsequent events, if any, through the
Annual Report
Notes to Financial Statements - continued
3. Significant Accounting Policies - continued
date that the financial statements were issued have been evaluated in the preparation of the financial statements. The following summarizes the significant accounting policies of the Fund:
Investment Valuation. Investments are valued as of 4:00 p.m. Eastern time on the last calendar day of the period. The Board of Trustees (the Board) has delegated the day to day responsibility for the valuation of the Fund's investments to the Fidelity Management & Research Company (FMR) Fair Value Committee (the Committee). In accordance with valuation policies and procedures approved by the Board, the Fund attempts to obtain prices from one or more third party pricing vendors or brokers to value its investments. When current market prices, quotations or currency exchange rates are not readily available or reliable, investments will be fair valued in good faith by the Committee, in accordance with procedures adopted by the Board. Factors used in determining fair value vary by investment type and may include market or investment specific events. The frequency with which these procedures are used cannot be predicted and they may be utilized to a significant extent. The Committee oversees the Fund's valuation policies and procedures and reports to the Board on the Committee's activities and fair value determinations. The Board monitors the appropriateness of the procedures used in valuing the Fund's investments and ratifies the fair value determinations of the Committee.
The Fund categorizes the inputs to valuation techniques used to value its investments into a disclosure hierarchy consisting of three levels as shown below:
Level 1 - quoted prices in active markets for identical investments
Level 2 - other significant observable inputs (including quoted prices for similar investments, interest rates, prepayment speeds, etc.)
Level 3 - unobservable inputs (including the Fund's own assumptions based on the best information available)
Valuation techniques used to value the Fund's investments by major category are as follows:
Equity securities, including restricted securities, for which market quotations are readily available, are valued at the last reported sale price or official closing price as reported by a third party pricing vendor on the primary market or exchange on which they are traded and are categorized as Level 1 in the hierarchy. In the event there were no sales during the day or closing prices are not available, securities are valued at the last quoted bid price or may be valued using the last available price and are generally categorized as
Annual Report
3. Significant Accounting Policies - continued
Investment Valuation - continued
Level 2 in the hierarchy. For foreign equity securities, when market or security specific events arise, comparisons to the valuation of American Depositary Receipts (ADRs), futures contracts, Exchange-Traded Funds (ETFs) and certain indexes as well as quoted prices for similar securities may be used and would be categorized as Level 2 in the hierarchy. Utilizing these techniques may result in transfers between Level 1 and Level 2. For equity securities, including restricted securities, where observable inputs are limited, assumptions about market activity and risk are used and these securities may be categorized as Level 3 in the hierarchy.
Investments in open-end mutual funds, including the Fidelity Central Funds, are valued at their closing net asset value (NAV) each business day and are categorized as Level 1 in the hierarchy.
Changes in valuation techniques may result in transfers in or out of an assigned level within the disclosure hierarchy. The aggregate value of investments by input level as of October 31, 2015, including information on transfers between Levels 1 and 2, is included at the end of the Fund's Schedule of Investments.
Foreign Currency. The Fund may use foreign currency contracts to facilitate transactions in foreign-denominated securities. Gains and losses from these transactions may arise from changes in the value of the foreign currency or if the counterparties do not perform under the contracts' terms.
Foreign-denominated assets, including investment securities, and liabilities are translated into U.S. dollars at the exchange rates at period end. Purchases and sales of investment securities, income and dividends received and expenses denominated in foreign currencies are translated into U.S. dollars at the exchange rate in effect on the transaction date.
The effects of exchange rate fluctuations on investments are included with the net realized and unrealized gain (loss) on investment securities. Other foreign currency transactions resulting in realized and unrealized gain (loss) are disclosed separately.
Investment Transactions and Income. For financial reporting purposes, the Fund's investment holdings and NAV include trades executed through the end of the last business day of the period. The NAV per share for processing shareholder transactions is calculated as of the close of business of the New York Stock Exchange (NYSE), normally 4:00 p.m. Eastern time and includes trades executed through the end of the prior business day. Gains and losses on securities sold are determined on the basis of identified cost and may include proceeds received from litigation. Dividend income is recorded on
Annual Report
Notes to Financial Statements - continued
3. Significant Accounting Policies - continued
Investment Transactions and Income - continued
the ex-dividend date, except for certain dividends from foreign securities where the ex-dividend date may have passed, which are recorded as soon as the Fund is informed of the ex-dividend date. Non-cash dividends included in dividend income, if any, are recorded at the fair market value of the securities received. Income and capital gain distributions from Fidelity Central Funds, if any, are recorded on the ex-dividend date. Distributions received on securities that represent a return of capital or capital gain are recorded as a reduction of cost of investments and/or as a realized gain. Subsequent to ex-dividend date the Fund determines the components of these distributions, based upon receipt of tax filings or other correspondence relating to the underlying investment. Interest income is accrued as earned and includes coupon interest and amortization of premium and accretion of discount on debt securities as applicable. Investment income is recorded net of foreign taxes withheld where recovery of such taxes is uncertain.
Class Allocations and Expenses. Investment income, realized and unrealized capital gains and losses, common expenses of the Fund, and certain fund-level expense reductions, if any, are allocated daily on a pro-rata basis to each class based on the relative net assets of each class to the total net assets of the Fund. Each class differs with respect to transfer agent and distribution and service plan fees incurred. Certain expense reductions may also differ by class. For the reporting period, the allocated portion of income and expenses to each class as a percent of its average net assets may vary due to the timing of recording these transactions in relation to fluctuating net assets of the classes. Expenses directly attributable to a fund are charged to that fund. Expenses attributable to more than one fund are allocated among the respective funds on the basis of relative net assets or other appropriate methods. Expense estimates are accrued in the period to which they relate and adjustments are made when actual amounts are known.
Income Tax Information and Distributions to Shareholders. Each year, the Fund intends to qualify as a regulated investment company under Subchapter M of the Internal Revenue Code, including distributing substantially all of its taxable income and realized gains. As a result, no provision for U.S. Federal income taxes is required. As of October 31, 2015, the Fund did not have any unrecognized tax benefits in the financial statements; nor is the Fund aware of any tax positions for which it is reasonably possible that the total amounts of unrecognized tax benefits will significantly change in the next twelve months. The Fund files a U.S. federal tax return, in addition to state and local tax returns as required. The Fund's federal income tax returns are subject to examination by the Internal Revenue Service (IRS) for a period of three fiscal years after they are filed. State and local tax returns may be subject to examination for an additional fiscal year depending on the jurisdiction. Foreign taxes are provided for based on the Fund's understanding of the tax rules and rates that exist in the foreign markets in which it
Annual Report
3. Significant Accounting Policies - continued
Income Tax Information and Distributions to Shareholders - continued
invests. The Fund is subject to a tax imposed on capital gains by certain countries in which it invests. An estimated deferred tax liability for net unrealized appreciation on the applicable securities is included in Other payables and accrued expenses on the Statement of Assets & Liabilities.
Distributions are declared and recorded on the ex-dividend date. Income dividends and capital gain distributions are declared separately for each class. Income and capital gain distributions are determined in accordance with income tax regulations, which may differ from GAAP. In addition, the Fund claimed a portion of the payment made to redeeming shareholders as a distribution for income tax purposes.
Capital accounts within the financial statements are adjusted for permanent book-tax differences. These adjustments have no impact on net assets or the results of operations. Capital accounts are not adjusted for temporary book-tax differences which will reverse in a subsequent period.
Book-tax differences are primarily due to foreign currency transactions, certain foreign taxes, passive foreign investment companies (PFIC), partnerships, capital loss carryforwards, and losses deferred due to wash sales.
The federal tax cost of investment securities and unrealized appreciation (depreciation) as of period end were as follows:
Gross unrealized appreciation | $ 171,926,225 |
Gross unrealized depreciation | (45,542,097) |
Net unrealized appreciation (depreciation) on securities | $ 126,384,128 |
Tax Cost | $ 1,422,556,702 |
The tax-based components of distributable earnings as of period end were as follows:
Undistributed ordinary income | $ 9,875,277 |
Capital loss carryforward | $ (33,754,835) |
Net unrealized appreciation (depreciation) on securities and other investments | $ 126,454,576 |
Capital loss carryforwards are only available to offset future capital gains of the Fund to the extent provided by regulations and may be limited. Under the Regulated Investment Company Modernization Act of 2010 (the Act), the Fund is permitted to carry forward capital losses incurred in taxable years beginning after December 22, 2010 for an unlimited period and such capital losses are required to be used prior to any losses that expire.
Annual Report
Notes to Financial Statements - continued
3. Significant Accounting Policies - continued
Income Tax Information and Distributions to Shareholders - continued
The capital loss carryforward information presented below, including any applicable limitation, is estimated as of fiscal period end and is subject to adjustment.
No expiration | |
Short-term | (26,434,969) |
Long-term | (7,319,866) |
Total no expiration | (33,754,835) |
The tax character of distributions paid was as follows:
| October 31, 2015 | October 31, 2014 |
Ordinary Income | $ 7,019,924 | $ 2,592,642 |
Long-term Capital Gains | - | 513,442 |
Total | $ 7,019,924 | $ 3,106,084 |
Short-Term Trading (Redemption) Fees. Shares held by investors in the Fund less than 30 days may have been subject to a redemption fee equal to 1.00% of the NAV of shares redeemed. All redemption fees, which reduce the proceeds of the shareholder redemption, are retained by the Fund and accounted for as an addition to paid in capital.
Delayed Delivery Transactions and When-Issued Securities. During the period, the Fund transacted in securities on a delayed delivery or when-issued basis. Payment and delivery may take place after the customary settlement period for that security. The price of the underlying securities and the date when the securities will be delivered and paid for are fixed at the time the transaction is negotiated. The securities purchased on a delayed delivery or when-issued basis are identified as such in the Fund's Schedule of Investments. With respect to purchase commitments, the Fund identifies securities as segregated in its records with a value at least equal to the amount of the commitment. Losses may arise due to changes in the value of the underlying securities or if the counterparty does not perform under the contract's terms, or if the issuer does not issue the securities due to political, economic, or other factors.
Restricted Securities. The Fund may invest in securities that are subject to legal or contractual restrictions on resale. These securities generally may be resold in transactions exempt from registration or to the public if the securities are registered. Disposal of these securities may involve time-consuming negotiations and expense, and prompt sale at an acceptable price may be difficult. Information regarding restricted securities is included at the end of the Fund's Schedule of Investments.
Annual Report
4. Purchases and Sales of Investments.
Purchases and sales of securities, other than short-term securities, aggregated $817,391,288 and $297,421,341, respectively.
5. Fees and Other Transactions with Affiliates.
Management Fee. Fidelity Management & Research Company (the investment adviser) and its affiliates provide the Fund with investment management related services for which the Fund pays a monthly management fee. The management fee is the sum of an individual fund fee rate that is based on an annual rate of .45% of the Fund's average net assets and an annualized group fee rate that averaged .25% during the period. The group fee rate is based upon the average net assets of all the mutual funds advised by the investment adviser, including any mutual funds previously advised by the investment adviser that are currently advised by Fidelity SelectCo, LLC, an affiliate of the investment adviser. The group fee rate decreases as assets under management increase and increases as assets under management decrease. In addition, the management fee is subject to a performance adjustment (up to a maximum of ± .20% of the Fund's average net assets over a 36 month performance period). The upward or downward adjustment to the management fee is based on the relative investment performance of International Growth as compared to its benchmark index, the MSCI EAFE Growth Index, over the same 36 month performance period. For the reporting period, the total annual management fee rate, including the performance adjustment, was .71% of the Fund's average net assets. The performance adjustment included in the management fee rate may be higher or lower than the maximum performance adjustment rate due to the difference between the average net assets for the reporting and performance periods.
Distribution and Service Plan Fees. In accordance with Rule 12b-1 of the 1940 Act, the Fund has adopted separate Distribution and Service Plans for each class of shares. Certain classes pay Fidelity Distributors Corporation (FDC), an affiliate of the investment adviser, separate Distribution and Service Fees, each of which is based on an annual percentage of each class' average net assets. In addition, FDC may pay financial intermediaries for selling shares of the Fund and providing shareholder support services. For the period, the Distribution and Service Fee rates, total fees and amounts retained by FDC were as follows:
| Distribution
Fee | Service
Fee | Total Fees | Retained
by FDC |
Class A | -% | .25% | $ 372,877 | $ 7,701 |
Class T | .25% | .25% | 136,338 | 179 |
Class B | .75% | .25% | 10,860 | 8,157 |
Class C | .75% | .25% | 419,307 | 145,878 |
| | | $ 939,382 | $ 161,915 |
Annual Report
Notes to Financial Statements - continued
5. Fees and Other Transactions with Affiliates - continued
Sales Load. FDC may receive a front-end sales charge of up to 5.75% for selling Class A shares and 3.50% for selling Class T shares, some of which is paid to financial intermediaries for selling shares of the Fund. Depending on the holding period, FDC may receive contingent deferred sales charges levied on Class A, Class T, Class B, and Class C redemptions. The deferred sales charges range from 5.00% to 1.00% for Class B shares, 1.00% for Class C shares, 1.00% for certain purchases of Class A shares and .25% for certain purchases of Class T shares.
For the period, sales charge amounts retained by FDC were as follows:
| Retained
by FDC |
Class A | $ 94,764 |
Class T | 15,334 |
Class BA | 413 |
Class CA | 7,496 |
| $ 118,007 |
A When Class B and Class C shares are initially sold, FDC pays commissions from its own resources to financial intermediaries through which the sales are made.
Transfer Agent Fees. Fidelity Investments Institutional Operations Company, Inc., (FIIOC), an affiliate of the investment adviser, is the transfer, dividend disbursing and shareholder servicing agent for each class of the Fund. FIIOC receives account fees and asset-based fees that vary according to the account size and type of account of the shareholders of the respective classes of the Fund, except for Class Z. FIIOC receives an asset-based fee of Class Z's average net assets. FIIOC pays for typesetting, printing and mailing of shareholder reports, except proxy statements.
For the period, transfer agent fees for each class were as follows:
| Amount | % of
Class-Level Average
Net Assets |
Class A | $ 327,480 | .22 |
Class T | 80,017 | .29 |
Class B | 2,930 | .27 |
Class C | 115,354 | .27 |
International Growth | 1,419,079 | .18 |
Class I | 357,209 | .19 |
Class Z | 86 | .05 |
| $ 2,302,155 | |
Annual Report
5. Fees and Other Transactions with Affiliates - continued
Accounting and Security Lending Fees. Fidelity Service Company, Inc. (FSC), an affiliate of the investment adviser, maintains the Fund's accounting records. The accounting fee is based on the level of average net assets for each month. Under a separate contract, FSC administers the security lending program. The security lending fee is based on the number and duration of lending transactions.
Brokerage Commissions. The Fund placed a portion of its portfolio transactions with brokerage firms which are affiliates of the investment adviser. Brokerage commissions are included in net realized gain (loss) and change in net unrealized appreciation (depreciation) in the Statement of Operations. The commissions paid to these affiliated firms were $1,335 for the period.
6. Committed Line of Credit.
The Fund participates with other funds managed by the investment adviser or an affiliate in a $4.25 billion credit facility (the "line of credit") to be utilized for temporary or emergency purposes to fund shareholder redemptions or for other short-term liquidity purposes. The Fund has agreed to pay commitment fees on its pro-rata portion of the line of credit, which amounted to $1,622 and is reflected in Miscellaneous expenses on the Statement of Operations. During the period, the Fund did not borrow on this line of credit.
7. Security Lending.
The Fund lends portfolio securities through a lending agent from time to time in order to earn additional income. For equity securities, a lending agent is used and may loan securities to certain qualified borrowers, including Fidelity Capital Markets (FCM), a broker-dealer affiliated with the Fund. On the settlement date of the loan, the Fund receives collateral (in the form of U.S. Treasury obligations, letters of credit and/or cash) against the loaned securities and maintains collateral in an amount not less than 100% of the market value of the loaned securities during the period of the loan. The market value of the loaned securities is determined at the close of business of the Fund and any additional required collateral is delivered to the Fund on the next business day. The Fund or borrower may terminate the loan at any time, and if the borrower defaults on its obligation to return the securities loaned because of insolvency or other reasons, the Fund may apply collateral received from the borrower against the obligation. The Fund may experience delays and costs in recovering the securities loaned. Any cash collateral received is invested in the Fidelity Securities Lending Cash Central Fund. The value of loaned securities and cash collateral at period end are disclosed on the Fund's Statement of Assets and Liabilities. The value of securities loaned to FCM at period end was $2,824,892. Security lending income represents the income earned on investing cash
Annual Report
Notes to Financial Statements - continued
7. Security Lending - continued
collateral, less rebates paid to borrowers and any lending agent fees associated with the loan, plus any premium payments received for lending certain types of securities. Security lending income is presented in the Statement of Operations as a component of income from Fidelity Central Funds. Total security lending income during the period amounted to $197,556, including $7,864 from securities loaned to FCM.
8. Expense Reductions.
Commissions paid to certain brokers with whom the investment adviser, or its affiliates, places trades on behalf of the Fund include an amount in addition to trade execution, which may be rebated back to the Fund to offset certain expenses. This amount totaled $66,064 for the period. In addition, through arrangements with the Fund's custodian, credits realized as a result of certain uninvested cash balances were used to reduce the Fund's expenses. During the period, these credits reduced the Fund's custody expenses by $39.
In addition, during the period the investment adviser reimbursed and/or waived a portion of fund-level operating expenses in the amount of $5,134 and a portion of class-level operating expenses as follows:
| Amount |
Class A | $ 1,835 |
Class T | 148 |
Class B | 6 |
Class C | 454 |
International Growth | 11,998 |
Class I | 1,841 |
| $ 16,282 |
9. Distributions to Shareholders.
Distributions to shareholders of each class were as follows:
Years ended October 31, | 2015 | 2014 |
From net investment income | | |
Class A | $ 684,914 | $ 253,092 |
Class T | 29,128 | 40,595 |
International Growth | 5,239,951 | 2,051,403 |
Class I | 1,064,923 | 246,949 |
Class Z | 1,008 | 604 |
Total | $ 7,019,924 | $ 2,592,643 |
Annual Report
9. Distributions to Shareholders - continued
Years ended October 31, | 2015 | 2014 |
From net realized gain | | |
Class A | $ - | $ 66,995 |
Class T | - | 20,298 |
Class B | - | 1,337 |
Class C | - | 16,479 |
International Growth | - | 369,252 |
Class I | - | 38,992 |
Class Z | - | 88 |
Total | $ - | $ 513,441 |
10. Share Transactions.
Share transactions for each class were as follows and may contain automatic conversions between classes or exchanges between funds:
| Shares | Dollars |
Years ended October 31, | 2015 | 2014 | 2015 | 2014 |
Class A | | | | |
Shares sold | 9,298,452 | 6,584,484 | $ 105,707,223 | $ 72,326,606 |
Reinvestment of distributions | 60,570 | 27,068 | 669,298 | 291,793 |
Shares redeemed | (3,798,128) | (2,724,911) | (42,982,992) | (30,099,985) |
Net increase (decrease) | 5,560,894 | 3,886,641 | $ 63,393,529 | $ 42,518,414 |
Class T | | | | |
Shares sold | 1,158,910 | 834,072 | $ 13,286,739 | $ 9,114,198 |
Reinvestment of distributions | 2,593 | 5,459 | 28,654 | 58,733 |
Shares redeemed | (1,005,399) | (585,464) | (11,627,373) | (6,459,248) |
Net increase (decrease) | 156,104 | 254,067 | $ 1,688,020 | $ 2,713,683 |
Class B | | | | |
Shares sold | 30,282 | 35,020 | $ 347,009 | $ 380,789 |
Reinvestment of distributions | - | 123 | - | 1,323 |
Shares redeemed | (87,349) | (53,583) | (994,341) | (587,919) |
Net increase (decrease) | (57,067) | (18,440) | $ (647,332) | $ (205,807) |
Class C | | | | |
Shares sold | 2,689,800 | 1,827,859 | $ 30,433,427 | $ 19,884,401 |
Reinvestment of distributions | - | 1,498 | - | 16,049 |
Shares redeemed | (991,400) | (426,678) | (10,978,888) | (4,637,384) |
Net increase (decrease) | 1,698,400 | 1,402,679 | $ 19,454,539 | $ 15,263,066 |
International Growth | | | | |
Shares sold | 39,705,804 | 27,835,093 | $ 456,131,993 | $ 307,440,711 |
Reinvestment of distributions | 387,169 | 197,948 | 4,301,448 | 2,143,781 |
Shares redeemed | (14,942,156) | (10,494,762) | (169,380,325) | (115,997,211) |
Net increase (decrease) | 25,150,817 | 17,538,279 | $ 291,053,116 | $ 193,587,281 |
Annual Report
Notes to Financial Statements - continued
10. Share Transactions - continued
| Shares | Dollars |
Years ended October 31, | 2015 | 2014 | 2015 | 2014 |
Class I | | | | |
Shares sold | 17,728,493 | 10,292,704 | $ 201,877,753 | $ 113,864,505 |
Reinvestment of distributions | 92,582 | 24,180 | 1,026,733 | 261,623 |
Shares redeemed | (5,227,430) | (2,927,192) | (58,733,231) | (31,428,962) |
Net increase (decrease) | 12,593,645 | 7,389,692 | $ 144,171,255 | $ 82,697,166 |
Class Z | | | | |
Shares sold | 88,007 | - | $ 956,120 | $ - |
Reinvestment of distributions | 91 | 64 | 1,008 | 692 |
Shares redeemed | (18,621) | (475) | (208,779) | (5,267) |
Net increase (decrease) | 69,477 | (411) | $ 748,349 | $ (4,575) |
11. Other.
The Fund's organizational documents provide former and current trustees and officers with a limited indemnification against liabilities arising in connection with the performance of their duties to the Fund. In the normal course of business, the Fund may also enter into contracts that provide general indemnifications. The Fund's maximum exposure under these arrangements is unknown as this would be dependent on future claims that may be made against the Fund. The risk of material loss from such claims is considered remote.
Annual Report
To the Trustees of Fidelity Investment Trust and the Shareholders of Fidelity International Growth Fund:
In our opinion, the accompanying statement of assets and liabilities, including the schedule of investments, and the related statements of operations and of changes in net assets and the financial highlights present fairly, in all material respects, the financial position of Fidelity International Growth Fund (a fund of Fidelity Investment Trust) at October 31, 2015, the results of its operations for the year then ended, the changes in its net assets for each of the two years in the period then ended and the financial highlights for each of the periods indicated, in conformity with accounting principles generally accepted in the United States of America. These financial statements and financial highlights (hereafter referred to as "financial statements") are the responsibility of the Fidelity International Growth Fund's management. Our responsibility is to express an opinion on these financial statements based on our audits. We conducted our audits of these financial statements in accordance with the standards of the Public Company Accounting Oversight Board (United States). Those standards require that we plan and perform the audit to obtain reasonable assurance about whether the financial statements are free of material misstatement. An audit includes examining, on a test basis, evidence supporting the amounts and disclosures in the financial statements, assessing the accounting principles used and significant estimates made by management, and evaluating the overall financial statement presentation. We believe that our audits, which included confirmation of securities at October 31, 2015 by correspondence with the custodian and brokers, provide a reasonable basis for our opinion.
PricewaterhouseCoopers LLP
Boston, Massachusetts
December 16, 2015
Annual Report
The Trustees, Member of the Advisory Board, and officers of the trust and fund, as applicable, are listed below. The Board of Trustees governs the fund and is responsible for protecting the interests of shareholders. The Trustees are experienced executives who meet periodically throughout the year to oversee the fund's activities, review contractual arrangements with companies that provide services to the fund, oversee management of the risks associated with such activities and contractual arrangements, and review the fund's performance. Each of the Trustees oversees 170 funds.
The Trustees hold office without limit in time except that (a) any Trustee may resign; (b) any Trustee may be removed by written instrument, signed by at least two-thirds of the number of Trustees prior to such removal; (c) any Trustee who requests to be retired or who has become incapacitated by illness or injury may be retired by written instrument signed by a majority of the other Trustees; and (d) any Trustee may be removed at any special meeting of shareholders by a two-thirds vote of the outstanding voting securities of the trust. Each Trustee who is not an interested person (as defined in the 1940 Act) of the trust and the fund (Independent Trustee), shall retire not later than the last day of the calendar year in which his or her 75th birthday occurs. The Independent Trustees may waive this mandatory retirement age policy with respect to individual Trustees. The officers and Advisory Board Member hold office without limit in time, except that any officer and Advisory Board Member may resign or may be removed by a vote of a majority of the Trustees at any regular meeting or any special meeting of the Trustees. Except as indicated, each individual has held the office shown or other offices in the same company for the past five years.
Experience, Skills, Attributes, and Qualifications of the Fund's Trustees. The Governance and Nominating Committee has adopted a statement of policy that describes the experience, qualifications, attributes, and skills that are necessary and desirable for potential Independent Trustee candidates (Statement of Policy). The Board believes that each Trustee satisfied at the time he or she was initially elected or appointed a Trustee, and continues to satisfy, the standards contemplated by the Statement of Policy. The Governance and Nominating Committee also engages professional search firms to help identify potential Independent Trustee candidates who have the experience, qualifications, attributes, and skills consistent with the Statement of Policy. From time to time, additional criteria based on the composition and skills of the current Independent Trustees, as well as experience or skills that may be appropriate in light of future changes to board composition, business conditions, and regulatory or other developments, have also been considered by the professional search firms and the Governance and Nominating Committee. In addition, the Board takes into account the Trustees' commitment and participation in Board and committee meetings, as well as their leadership of standing and ad hoc committees throughout their tenure.
In determining that a particular Trustee was and continues to be qualified to serve as a Trustee, the Board has considered a variety of criteria, none of which, in isolation, was controlling. The Board believes that, collectively, the Trustees have balanced and diverse experience, qualifications, attributes, and skills, which allow the Board to operate effectively in governing the fund and protecting the interests of shareholders. Information about the specific experience, skills, attributes, and qualifications of each Trustee, which in each case led to the Board's conclusion that the Trustee should serve (or continue to serve) as a trustee of the fund, is provided below.
Annual Report
Trustees and Officers - continued
Board Structure and Oversight Function. James C. Curvey is an interested person (as defined in the 1940 Act) and currently serves as Chairman. The Trustees have determined that an interested Chairman is appropriate and benefits shareholders because an interested Chairman has a personal and professional stake in the quality and continuity of services provided to the fund. Independent Trustees exercise their informed business judgment to appoint an individual of their choosing to serve as Chairman, regardless of whether the Trustee happens to be independent or a member of management. The Independent Trustees have determined that they can act independently and effectively without having an Independent Trustee serve as Chairman and that a key structural component for assuring that they are in a position to do so is for the Independent Trustees to constitute a substantial majority for the Board. The Independent Trustees also regularly meet in executive session. Ned C. Lautenbach serves as Chairman of the Independent Trustees and as such (i) acts as a liaison between the Independent Trustees and management with respect to matters important to the Independent Trustees and (ii) with management prepares agendas for Board meetings.
Fidelity funds are overseen by different Boards of Trustees. The fund's Board oversees Fidelity's high income and certain equity funds, and other Boards oversee Fidelity's investment-grade bond, money market, asset allocation, and sector funds. The asset allocation funds may invest in Fidelity funds overseen by the fund's Board. The use of separate Boards, each with its own committee structure, allows the Trustees of each group of Fidelity funds to focus on the unique issues of the funds they oversee, including common research, investment, and operational issues. On occasion, the separate Boards establish joint committees to address issues of overlapping consequences for the Fidelity funds overseen by each Board.
The Trustees operate using a system of committees to facilitate the timely and efficient consideration of all matters of importance to the Trustees, the fund, and fund shareholders and to facilitate compliance with legal and regulatory requirements and oversight of the fund's activities and associated risks. The Board, acting through its committees, has charged FMR and its affiliates with (i) identifying events or circumstances the occurrence of which could have demonstrably adverse effects on the fund's business and/or reputation; (ii) implementing processes and controls to lessen the possibility that such events or circumstances occur or to mitigate the effects of such events or circumstances if they do occur; and (iii) creating and maintaining a system designed to evaluate continuously business and market conditions in order to facilitate the identification and implementation processes described in (i) and (ii) above. Because the day-to-day operations and activities of the fund are carried out by or through FMR, its affiliates and other service providers, the fund's exposure to risks is mitigated but not eliminated by the processes overseen by the Trustees. While each of the Board's committees has responsibility for overseeing different aspects of the fund's activities, oversight is exercised primarily through the Operations, Audit, and Compliance Committees. In addition, the Independent Trustees have worked with FMR to enhance the Board's oversight of investment and financial risks, legal and regulatory risks, technology risks, and operational risks, including the development of additional risk reporting to the Board. For example, a working group comprised of Independent Trustees and FMR has worked and continues to work to review the Fidelity funds' valuation-related activities, reporting and risk management. Appropriate personnel, including but not limited to the fund's Chief Compliance Officer (CCO), FMR's internal auditor, the independent accountants, the fund's Treasurer and portfolio management personnel, make periodic reports to the Board's committees, as appropriate, including an annual review of Fidelity's risk management program for the Fidelity funds. The responsibilities of each standing committee, including their oversight responsibilities, are described further under "Standing Committees of the Fund's Trustees."
Annual Report
The fund's Statement of Additional Information (SAI) includes more information about the Trustees. To request a free copy, call Fidelity at 1-877-208-0098.
Interested Trustees*:
Correspondence intended for each Trustee who is an interested person may be sent to Fidelity Investments, 245 Summer Street, Boston, Massachusetts 02210.
Name, Year of Birth; Principal Occupations and Other Relevant Experience+ |
James C. Curvey (1935) |
Year of Election or Appointment: 2007 Trustee Chairman of the Board of Trustees |
| Mr. Curvey also serves as Trustee of other Fidelity funds. Mr. Curvey is a Director of Fidelity Research & Analysis Co. (investment adviser firm, 2009-present), and Vice Chairman (2007-present) and Director of FMR LLC (diversified financial services company). In addition, Mr. Curvey serves as an Overseer for the Boston Symphony Orchestra and a member of the board of Artis-Naples, Naples, Florida, and as a Trustee for Brewster Academy, Wolfeboro, New Hampshire. Previously, Mr. Curvey served as a Director of Fidelity Investments Money Management, Inc. (investment adviser firm, 2009-2014) and a Director of FMR and FMR Co., Inc. (investment adviser firms, 2007-2014). |
Charles S. Morrison (1960) |
Year of Election or Appointment: 2014 Trustee |
| Mr. Morrison also serves as Trustee of other funds. He serves as a Director of Fidelity Investments Money Management, Inc. (FIMM) (investment adviser firm, 2014-present), Director of Fidelity SelectCo, LLC (investment adviser firm, 2014-present), President, Asset Management (2014-present), and is an employee of Fidelity Investments. Previously, Mr. Morrison served as Vice President of Fidelity's Fixed Income and Asset Allocation Funds (2012-2014), President, Fixed Income (2011-2014), Vice President of Fidelity's Money Market Funds (2005-2009), President, Money Market Group Leader of FMR (investment adviser firm, 2009), and Senior Vice President, Money Market Group of FMR (2004-2009). Mr. Morrison also served as Vice President of Fidelity's Bond Funds (2002-2005), certain Balanced Funds (2002-2005), and certain Asset Allocation Funds (2002-2007), and as Senior Vice President (2002-2005) of Fidelity's Bond Division. |
* Trustees have been determined to be "Interested Trustees" by virtue of, among other things, their affiliation with the trust or various entities under common control with FMR.
+ The information above includes each Trustee's principal occupation during the last five years and other information relating to the experience, attributes, and skills relevant to each Trustee's qualifications to serve as a Trustee, which led to the conclusion that each Trustee should serve as a Trustee for the fund.
Annual Report
Independent Trustees:
Correspondence intended for each Independent Trustee (that is, the Trustees other than the Interested Trustees) may be sent to Fidelity Investments, P.O. Box 55235, Boston, Massachusetts 02205-5235.
Name, Year of Birth; Principal Occupations and Other Relevant Experience+ |
Dennis J. Dirks (1948) |
Year of Election or Appointment: 2005 Trustee |
| Mr. Dirks also serves as Trustee of other Fidelity funds. Prior to his retirement in May 2003, Mr. Dirks was Chief Operating Officer and a member of the Board of The Depository Trust & Clearing Corporation (DTCC). He also served as President, Chief Operating Officer, and Board member of The Depository Trust Company (DTC) and President and Board member of the National Securities Clearing Corporation (NSCC). In addition, Mr. Dirks served as Chief Executive Officer and Board member of the Government Securities Clearing Corporation, Chief Executive Officer and Board member of the Mortgage-Backed Securities Clearing Corporation, as a Trustee and a member of the Finance Committee of Manhattan College (2005-2008), as a Trustee and a member of the Finance Committee of AHRC of Nassau County (2006-2008), and as a member of the Independent Directors Council (IDC) Governing Council (2010-2015). Mr. Dirks is a member of the Board of Directors for The Brookville Center for Children's Services, Inc. (2009-present). |
Alan J. Lacy (1953) |
Year of Election or Appointment: 2008 Trustee |
| Mr. Lacy also serves as Trustee of other Fidelity funds. Mr. Lacy serves as a member of the Board of Directors of Dave & Buster's Entertainment, Inc. (restaurant and entertainment complexes, 2010-present) and Bristol-Myers Squibb Company (global pharmaceuticals, 2008-present). In addition, Mr. Lacy served as Senior Adviser (2007-2014) of Oak Hill Capital Partners, L.P. (private equity) and also served as Chief Executive Officer (2000-2005) and Vice Chairman (2005-2006) of Sears Holdings Corporation and Sears, Roebuck and Co. (retail). Mr. Lacy is a member of the Board of Trustees of The National Parks Conservation Association (2006-present). Previously, Mr. Lacy served as Chairman of the Board of Trustees of the National Parks Conservation Association (2008-2011) and as a member of the Board of Directors for The Western Union Company (global money transfer, 2006-2011), The Hillman Companies, Inc. (hardware wholesalers, 2010-2014), and Earth Fare, Inc. (retail grocery, 2010-2014). |
Ned C. Lautenbach (1944) |
Year of Election or Appointment: 2000 Trustee Chairman of the Independent Trustees |
| Mr. Lautenbach also serves as Trustee of other Fidelity funds. Mr. Lautenbach currently serves as the Lead Director of the Eaton Corporation Board of Directors (diversified industrial, 1997-present). Mr. Lautenbach is Chairman of the Board of Directors of Artis-Naples in Naples, Florida (2012-present), a member of the Council on Foreign Relations (1994-present), and a member of the Board of Governors, State University System of Florida (2013-present). Previously, Mr. Lautenbach was a Partner/Advisory Partner at Clayton, Dubilier & Rice, LLC (private equity investment, 1998-2010), as well as a Director of Sony Corporation (2006-2007). |
Joseph Mauriello (1944) |
Year of Election or Appointment: 2008 Trustee |
| Mr. Mauriello also serves as Trustee of other Fidelity funds. Prior to his retirement in January 2006, Mr. Mauriello served in numerous senior management positions including Deputy Chairman and Chief Operating Officer (2004-2005), and Vice Chairman of Financial Services (2002-2004) of KPMG LLP US (professional services, 1965-2005). Mr. Mauriello currently serves as a member of the Board of Directors of XL Group plc. (global insurance and re-insurance, 2006-present) and the Independent Directors Council (IDC) Governing Council (2015-present). Previously, Mr. Mauriello served as a Director of the Hamilton Funds of the Bank of New York (2006-2007) and of Arcadia Resources Inc. (health care services and products, 2007-2012). |
Robert W. Selander (1950) |
Year of Election or Appointment: 2011 Trustee |
| Mr. Selander also serves as Trustee of other Fidelity funds. Mr. Selander serves as a Director of The Western Union Company (global money transfer, 2014-present). Previously, Mr. Selander served as a Member of the Advisory Board of other Fidelity funds (2011), and Executive Vice Chairman (2010), Chief Executive Officer (2009-2010), and President and Chief Executive Officer (1997-2009) of Mastercard, Inc. |
Cornelia M. Small (1944) |
Year of Election or Appointment: 2005 Trustee |
| Ms. Small also serves as Trustee of other Fidelity funds. Ms. Small is a member of the Board of Directors (2009-present) and Chair of the Investment Committee (2010-present) of the Teagle Foundation. Ms. Small also serves on the Investment Committee of the Berkshire Taconic Community Foundation (2008-present). Previously, Ms. Small served as Chairperson (2002-2008) and a member of the Investment Committee and Chairperson (2008-2012) and a member of the Board of Trustees of Smith College. In addition, Ms. Small served as Chief Investment Officer, Director of Global Equity Investments, and a member of the Board of Directors of Scudder, Stevens & Clark and Scudder Kemper Investments. |
William S. Stavropoulos (1939) |
Year of Election or Appointment: 2001 Trustee Vice Chairman of the Independent Trustees |
| Mr. Stavropoulos also serves as Trustee of other Fidelity funds. Mr. Stavropoulos serves as President and Founder of the Michigan Baseball Foundation, the Great Lakes Loons (2007-present). Mr. Stavropoulos is Chairman Emeritus of the Board of Directors of The Dow Chemical Company, where he previously served in numerous senior management positions, including President, CEO (1995-2000; 2002-2004), Chairman of the Executive Committee (2000-2006), and as a member of the Board of Directors (1990-2006). Currently, Mr. Stavropoulos is Chairman of the Board of Directors of Univar Inc. (global distributor of commodity and specialty chemicals), a Director of Teradata Corporation (data warehousing and technology solutions), and Maersk Inc. (industrial conglomerate), and a member of the Advisory Board for Metalmark Capital LLC (private equity investment, 2005-present). Mr. Stavropoulos is an operating advisor to Clayton, Dubilier & Rice, LLC (private equity investment). In addition, Mr. Stavropoulos is a member of the University of Notre Dame Advisory Council for the College of Science, a Trustee of the Rollin L. Gerstacker Foundation, and a Director of the Naples Philharmonic Center for the Arts. Previously, Mr. Stavropoulos served as a Director of Chemical Financial Corporation (bank holding company, 1993-2012) and Tyco International, Ltd. (multinational manufacturing and services, 2007-2012). |
David M. Thomas (1949) |
Year of Election or Appointment: 2008 Trustee |
| Mr. Thomas also serves as Trustee of other Fidelity funds. Mr. Thomas serves as Non-Executive Chairman of the Board of Directors of Fortune Brands Home and Security (home and security products, 2011-present), as a member of the Board of Directors (2004-present) and Presiding Director (2013-present) of Interpublic Group of Companies, Inc. (marketing communication), and as a member of the Board of Trustees of the University of Florida (2013-present). Previously, Mr. Thomas served as Executive Chairman (2005-2006) and Chairman and Chief Executive Officer (2000-2005) of IMS Health, Inc. (pharmaceutical and healthcare information solutions), and a Director of Fortune Brands, Inc. (consumer products, 2000-2011). |
+ The information above includes each Trustee's principal occupation during the last five years and other information relating to the experience, attributes, and skills relevant to each Trustee's qualifications to serve as a Trustee, which led to the conclusion that each Trustee should serve as a Trustee for the fund.
Advisory Board Member and Officers:
Correspondence intended for each officer and Peter S. Lynch may be sent to Fidelity Investments, 245 Summer Street, Boston, Massachusetts 02210. Officers appear below in alphabetical order.
Name, Year of Birth; Principal Occupation |
Peter S. Lynch (1944) |
Year of Election or Appointment: 2003 Member of the Advisory Board |
| Mr. Lynch also serves as Member of the Advisory Board of other Fidelity funds. Mr. Lynch is Vice Chairman and a Director of FMR (investment adviser firm) and FMR Co., Inc. (investment adviser firm). In addition, Mr. Lynch serves as a Trustee of Boston College and as the Chairman of the Inner-City Scholarship Fund. Previously, Mr. Lynch served on the Special Olympics International Board of Directors (1997-2006). |
Elizabeth Paige Baumann (1968) |
Year of Election or Appointment: 2012 Anti-Money Laundering (AML) Officer |
| Ms. Baumann also serves as AML Officer of other funds. She is Chief AML Officer of FMR LLC (diversified financial services company, 2012-present) and is an employee of Fidelity Investments. Previously, Ms. Baumann served as Vice President and Deputy Anti-Money Laundering Officer (2007-2012). |
Marc R. Bryant (1966) |
Year of Election or Appointment: 2015 Secretary and Chief Legal Officer (CLO) |
| Mr. Bryant also serves as Secretary and CLO of other funds. Mr. Bryant serves as CLO, Secretary, and Senior Vice President of Fidelity Management & Research Company (investment adviser firm, 2015-present) and FMR Co., Inc. (investment adviser firm, 2015-present); Secretary of Fidelity SelectCo, LLC (investment adviser firm, 2015-present) and Fidelity Investments Money Management, Inc. (investment adviser firm, 2015-present); and CLO of Fidelity Management & Research (Hong Kong) Limited (investment adviser firm, 2015-present). He is Senior Vice President and Deputy General Counsel of FMR LLC (diversified financial services company). Previously, Mr. Bryant served as Secretary and Chief Legal Officer of Fidelity Rutland Square Trust II (2010-2014) and Assistant Secretary of Fidelity's Fixed Income and Asset Allocation Funds (2013-2015). Prior to joining Fidelity Investments, Mr. Bryant served as a Senior Vice President and the Head of Global Retail Legal for AllianceBernstein L.P. (2006-2010), and as the General Counsel for ProFund Advisors LLC (2001-2006). |
William C. Coffey (1969) |
Year of Election or Appointment: 2009 Assistant Secretary |
| Mr. Coffey also serves as Assistant Secretary of other funds. He is Senior Vice President and Deputy General Counsel of FMR LLC (diversified financial services company, 2010-present), and is an employee of Fidelity Investments. Previously, Mr. Coffey served as Vice President and Associate General Counsel of FMR LLC (2005-2009). |
Timothy M. Cohen (1969) |
Year of Election or Appointment: 2014 Vice President of certain Equity Funds |
| Mr. Cohen also serves as Vice President of other funds. Mr. Cohen serves as Chief Compliance Officer of FMR Investment Management (U.K.) Limited (investment adviser firm, 2013-present) and is an employee of Fidelity Investments. Previously, Mr. Cohen served as a Director of FMR Investment Management (U.K.) Limited (2013-2015). |
Jonathan Davis (1968) |
Year of Election or Appointment: 2010 Assistant Treasurer |
| Mr. Davis also serves as Assistant Treasurer of other funds, and is an employee of Fidelity Investments. Previously, Mr. Davis served as Vice President and Associate General Counsel of FMR LLC (diversified financial services company, 2003-2010). |
Adrien E. Deberghes (1967) |
Year of Election or Appointment: 2008 Deputy Treasurer |
| Mr. Deberghes also serves as an officer of other funds. He is an employee of Fidelity Investments (2008-present). Prior to joining Fidelity Investments, Mr. Deberghes was Senior Vice President of Mutual Fund Administration at State Street Corporation (2007-2008), Senior Director of Mutual Fund Administration at Investors Bank & Trust (2005-2007), and Director of Finance for Dunkin' Brands (2000-2005). |
Stephanie J. Dorsey (1969) |
Year of Election or Appointment: 2010 Assistant Treasurer |
| Ms. Dorsey also serves as an officer of other funds. She is an employee of Fidelity Investments (2008-present) and has served in other fund officer roles. Prior to joining Fidelity Investments, Ms. Dorsey served as Treasurer (2004-2008) of the JPMorgan Mutual Funds and Vice President (2004-2008) of JPMorgan Chase Bank. |
Howard J. Galligan III (1966) |
Year of Election or Appointment: 2014 Chief Financial Officer |
| Mr. Galligan also serves as Chief Financial Officer of other funds. Mr. Galligan serves as President of Fidelity Pricing and Cash Management Services (FPCMS) (2014-present) and as a Director of Strategic Advisers, Inc. (investment adviser firm, 2008-present). Previously, Mr. Galligan served as Chief Administrative Officer of Asset Management (2011-2014) and Chief Operating Officer and Senior Vice President of Investment Support for Strategic Advisers, Inc. (2003-2011). |
Scott C. Goebel (1968) |
Year of Election or Appointment: 2015 Vice President |
| Mr. Goebel serves as Vice President of other funds and is an employee of Fidelity Investments (2001-present). Previously, Mr. Goebel served as Secretary of Fidelity SelectCo, LLC (investment adviser firm, 2013-2015), Fidelity Investments Money Management, Inc. (FIMM) (investment adviser firm, 2010-2015), and Fidelity Research and Analysis Company (FRAC) (investment adviser firm, 2010-2015); General Counsel, Secretary, and Senior Vice President of Fidelity Management & Research Company (investment adviser firm, 2008-2015) and FMR Co., Inc. (investment adviser firm, 2008-2015); Assistant Secretary of Fidelity Management & Research (Japan) Limited (investment adviser firm, 2008-2015) and FMR Investment Management (U.K.) Limited (investment adviser firm, 2008-2015); Chief Legal Officer (CLO) of Fidelity Management & Research (Hong Kong) Limited (investment adviser firm, 2008-2015); Secretary and CLO of certain Fidelity funds (2008-2015); Assistant Secretary of FIMM (2008-2010), FRAC (2008-2010), and certain funds (2007-2008); and as Vice President and Secretary of Fidelity Distributors Corporation (FDC) (2005-2007). |
Brian B. Hogan (1964) |
Year of Election or Appointment: 2009 Vice President |
| Mr. Hogan also serves as Trustee or Vice President of other funds. Mr. Hogan serves as a Director of Fidelity SelectCo, LLC (investment adviser firm, 2014-present) and President of the Equity Division of FMR (investment adviser firm, 2009-present). Previously, Mr. Hogan served as Senior Vice President, Equity Research of FMR (2006-2009) and as a portfolio manager. |
Chris Maher (1972) |
Year of Election or Appointment: 2013 Assistant Treasurer |
| Mr. Maher serves as Assistant Treasurer of other funds. Mr. Maher is Vice President of Valuation Oversight and is an employee of Fidelity Investments. Previously, Mr. Maher served as Vice President of Asset Management Compliance (2013), Vice President of the Program Management Group of FMR (investment adviser firm, 2010-2013), and Vice President of Valuation Oversight (2008-2010). |
Kenneth B. Robins (1969) |
Year of Election or Appointment: 2008 President and Treasurer |
| Mr. Robins also serves as an officer of other funds. Mr. Robins serves as Executive Vice President of Fidelity Investments Money Management, Inc. (FIMM) (investment adviser firm, 2013-present) and is an employee of Fidelity Investments (2004-present). Previously, Mr. Robins served in other fund officer roles. |
Stacie M. Smith (1974) |
Year of Election or Appointment: 2013 Deputy Treasurer |
| Ms. Smith also serves as an officer of other funds. She is an employee of Fidelity Investments (2009-present) and has served in other fund officer roles. Prior to joining Fidelity Investments, Ms. Smith served as Senior Audit Manager of Ernst & Young LLP (1996-2009). |
Renee Stagnone (1975) |
Year of Election or Appointment: 2013 Deputy Treasurer |
| Ms. Stagnone also serves as Deputy Treasurer of other funds. Ms. Stagnone is an employee of Fidelity Investments (1997-present). |
Linda J. Wondrack (1964) |
Year of Election or Appointment: 2014 Chief Compliance Officer |
| Ms. Wondrack also serves as Chief Compliance Officer of other funds. Ms. Wondrack is Executive Vice President and head of the Ethics Office and Asset Management Compliance for Fidelity Investments (2012-present). Ms. Wondrack also serves as Chief Compliance Officer of Fidelity SelectCo, LLC (investment adviser firm, 2014-present); Chief Compliance Officer of Impresa Management LLC (2013-present); and Chief Compliance Officer of FMR Co., Inc. (investment adviser firm), Fidelity Investments Money Management, Inc. (investment adviser firm), Fidelity Management & Research (Japan) Limited (investment adviser firm), FMR Investment Management (U.K.) Limited (investment adviser firm), Fidelity Management & Research (Hong Kong) (investment adviser firm), Fidelity Management & Research Company (investment adviser firm), FIAM LLC (investment adviser firm), and Strategic Advisers, Inc. (investment adviser firm), Ballyrock Investment Advisors LLC, and Northern Neck Investors LLC (2012-present). Previously, Ms. Wondrack served as Senior Vice President and Chief Compliance Officer for Columbia Management Investment Advisers, LLC (2005-2012); Chief Compliance Officer for certain funds within the Columbia Family of Funds (2007-2012); and Senior Vice President of Compliance Risk Management at Bank of America (2005-2010). |
Joseph F. Zambello (1957) |
Year of Election or Appointment: 2011 Deputy Treasurer |
| Mr. Zambello also serves as Deputy Treasurer of other funds. Mr. Zambello is an employee of Fidelity Investments (1991-present). Previously, Mr. Zambello served as Vice President of the Program Management Group of FMR (investment adviser firm, 2009-2011) and Vice President of the Transfer Agent Oversight Group (2005-2009). |
Annual Report
The Board of Trustees of Fidelity International Growth Fund voted to pay to shareholders of record at the opening of business on record date, the following distributions per share derived from capital gains realized from sales of portfolio securities, and dividends derived from net investment income:
| Pay Date | Record Date | Dividends | Capital Gains |
Class I | 12/07/15 | 12/04/15 | $0.078 | $0.008 |
Class I designates 13% of the dividends distributed during the fiscal year as qualifying for the dividends-received deduction for corporate shareholders.
Class I designates 100% of the dividends distributed in December during the fiscal year as amounts which may be taken into account as a dividend for purposes of the maximum rate under section 1(h)(11) of the Internal Revenue Code.
The amounts per share which represent income derived from sources within, and taxes paid to, foreign countries or possessions of the United States are as follows:
| Pay Date | Income | Taxes |
Class I | 12/08/2014 | $0.1058 | $0.0098 |
The fund will notify shareholders in January 2016 of amounts for use in preparing 2015 income tax returns.
Annual Report
Fidelity International Growth Fund
Each year, the Board of Trustees, including the Independent Trustees (together, the Board), votes on the renewal of the management contract with Fidelity Management & Research Company (FMR) and the sub-advisory agreements (together, the Advisory Contracts) for the fund. The Board, assisted by the advice of fund counsel and Independent Trustees' counsel, requests and considers a broad range of information relevant to the renewal of the Advisory Contracts throughout the year.
The Board meets regularly and, at each of its meetings, covers an extensive agenda of topics and materials and considers factors that are relevant to its annual consideration of the renewal of the fund's Advisory Contracts, including the services and support provided to the fund and its shareholders. The Board has established various standing committees (Committees), each composed of and chaired by Independent Trustees with varying backgrounds, to which the Board has assigned specific subject matter responsibilities in order to enhance effective decision-making by the Board. The Board, acting directly and through its Committees, requests and receives information concerning the annual consideration of the renewal of the fund's Advisory Contracts. The Board also meets as needed to consider matters specifically related to the Board's annual consideration of the renewal of the Advisory Contracts. Members of the Board may also meet with trustees of other Fidelity funds through ad hoc joint committees to discuss certain matters relevant to all of the Fidelity funds.
At its July 2015 meeting, the Board unanimously determined to renew the fund's Advisory Contracts. In reaching its determination, the Board considered all factors it believed relevant, including (i) the nature, extent, and quality of the services to be provided to the fund and its shareholders (including the investment performance of the fund); (ii) the competitiveness of the fund's management fee and total expense ratio relative to peer funds; (iii) the total costs of the services to be provided by and the profits to be realized by Fidelity from its relationship with the fund; and (iv) the extent to which (if any) economies of scale exist and would be realized as the fund grows, and whether any economies of scale are appropriately shared with fund shareholders.
In considering whether to renew the Advisory Contracts for the fund, the Board reached a determination, with the assistance of fund counsel and Independent Trustees' counsel and through the exercise of its business judgment, that the renewal of the Advisory Contracts was in the best interests of the fund and its shareholders and that the compensation payable under the Advisory Contracts was fair and reasonable. The Board's decision to renew the Advisory Contracts was not based on any single factor, but rather was based on a comprehensive consideration of all the information provided to the Board at its meetings throughout the year. The Board, in reaching its determination to renew the Advisory Contracts, was aware that shareholders of the fund have a broad range of investment choices available to them, including a wide choice among funds offered by Fidelity's competitors, and that the fund's shareholders, who have the opportunity to review and weigh the disclosure provided by the fund in its prospectus and other public disclosures, have chosen to invest in this fund, which is part of the Fidelity family of funds.
Annual Report
Board Approval of Investment Advisory Contracts and
Management Fees - continued
Nature, Extent, and Quality of Services Provided. The Board considered Fidelity's staffing as it relates to the fund, including the backgrounds of investment personnel of Fidelity, and also considered the fund's investment objective, strategies, and related investment philosophy. The Independent Trustees also had discussions with senior management of Fidelity's investment operations and investment groups. The Board considered the structure of the portfolio manager compensation program and whether this structure provides appropriate incentives to act in the best interests of the fund. Additionally, the Board considered the portfolio managers' investments, if any, in the funds that they manage.
Resources Dedicated to Investment Management and Support Services. The Board and the Fund Oversight and Research Committees reviewed the general qualifications and capabilities of Fidelity's investment staff, including its size, education, experience, and resources, as well as Fidelity's approach to recruiting, training, managing, and compensating investment personnel. The Board noted that Fidelity has continued to increase the resources devoted to non-U.S. offices, including expansion of Fidelity's global investment organization. The Board also noted that Fidelity's analysts have extensive resources, tools and capabilities that allow them to conduct sophisticated quantitative and fundamental analysis, as well as credit analysis of issuers, counterparties and guarantors. Further, the Board considered that Fidelity's investment professionals have sufficient access to global information and data so as to provide competitive investment results over time, and that those professionals also have access to sophisticated tools that permit them to assess portfolio construction and risk and performance attribution characteristics continuously, as well as to transmit new information and research conclusions rapidly around the world. Additionally, in its deliberations, the Board considered Fidelity's trading, risk management, and compliance capabilities and resources, which are integral parts of the investment management process.
Shareholder and Administrative Services. The Board considered (i) the nature, extent, quality, and cost of advisory, administrative, and shareholder services performed by FMR, the sub-advisers (together with FMR, the Investment Advisers), and their affiliates under the Advisory Contracts and under separate agreements covering transfer agency, pricing and bookkeeping, and securities lending services for the fund; (ii) the nature and extent of the supervision of third party service providers, principally custodians and subcustodians; and (iii) the resources devoted to, and the record of compliance with, the fund's compliance policies and procedures. The Board also reviewed the allocation of fund brokerage, including allocations to brokers affiliated with the Investment Advisers, the use of brokerage commissions to pay fund expenses, and the use of "soft" commission dollars to pay for research services.
Annual Report
The Board noted that the growth of fund assets over time across the complex allows Fidelity to reinvest in the development of services designed to enhance the value or convenience of the Fidelity funds as investment vehicles. These services include 24-hour access to account information and market information through telephone representatives and over the Internet, investor education materials and asset allocation tools, and the expanded availability of Fidelity Investor Centers.
In 2014, the Board formed an ad hoc Committee on Transfer Agency Fees to review the variety of transfer agency fee structures throughout the industry and Fidelity's competitive positioning with respect to industry participants.
Investment in a Large Fund Family. The Board considered the benefits to shareholders of investing in a Fidelity fund, including the benefits of investing in a fund that is part of a large family of funds offering a variety of investment disciplines and providing a large variety of mutual fund investor services. The Board noted that Fidelity had taken, or had made recommendations that resulted in the Fidelity funds taking, a number of actions over the previous year that benefited particular funds, including (i) continuing to dedicate additional resources to investment research and to the support of the senior management team that oversees asset management; (ii) continuing efforts to enhance Fidelity's global research capabilities; (iii) launching new funds and making other enhancements to meet client needs; (iv) reducing management fees and total expenses for certain index funds and diversified international funds; (v) continuing to launch dedicated lower cost underlying funds to meet portfolio construction needs related to expanding underlying fund options for Fidelity funds of funds, specifically for the Freedom Fund product lines; (vi) rationalizing product lines and gaining increased efficiencies through fund mergers; (vii) launching active fixed-income exchange-traded funds; (viii) continuing to develop, acquire and implement systems and technology to improve services to the funds and information security and to increase efficiency; (ix) implementing investment enhancements to further strengthen Fidelity's target date product line to increase investors' probability of success in achieving their goals; (x) modifying the eligibility criteria for certain share classes to accommodate roll-over assets from employer-sponsored retirement plans; (xi) launching a new Class W of the Freedom Index Funds to attract and retain Fidelity record-kept retirement plan assets; and (xii) implementing changes to Fidelity's money market product line in response to recent money market regulatory reforms.
Investment Performance. The Board considered whether the fund has operated in accordance with its investment objective, as well as its record of compliance with its investment restrictions and its performance history.
Annual Report
Board Approval of Investment Advisory Contracts and
Management Fees - continued
The Board took into account discussions with representatives of the Investment Advisers about fund investment performance that occur at Board meetings throughout the year. In this regard the Board noted that as part of regularly scheduled fund reviews and other reports to the Board on fund performance, the Board considers annualized return information for the fund, for different time periods, measured against a securities market index ("benchmark index") and a peer group of funds with similar objectives ("peer group"), if any. In its evaluation of fund investment performance, the Board gave particular attention to information indicating changes in performance of certain Fidelity funds for specific time periods and discussed with the Investment Advisers the reasons for any overperformance or underperformance.
In addition to reviewing absolute and relative fund performance, the Independent Trustees periodically consider the appropriateness of fund performance metrics in evaluating the results achieved. In general, the Independent Trustees believe that fund performance should be evaluated based on net performance (after fees and expenses) of both the highest performing and lowest performing fund share classes, where applicable, compared to appropriate benchmark indices, over appropriate time periods that may include full market cycles, and compared to peer groups, as applicable, over the same periods, taking into account relevant factors including the following: general market conditions; issuer-specific information; and fund cash flows and other factors.
The Independent Trustees recognize that shareholders evaluate performance on a net basis over their own holding periods, for which one-, three-, and five-year periods are often used as a proxy. For this reason, the performance information reviewed by the Board also included net cumulative calendar year total return information for the fund and an appropriate benchmark index and peer group for the most recent one-, three-, and five-year periods, as shown below. Returns are shown compared to the 25th percentile (top of box, 75% beaten) and 75th percentile (bottom of box, 25% beaten) of the peer universe. Returns of the benchmark index are "net MA," i.e., adjusted for tax withholding rates applicable to U.S.-based funds organized as Massachusetts business trusts.
Annual Report
Fidelity International Growth Fund

The Board also considered that the fund's management fee is subject to upward or downward adjustment depending upon whether, and to what extent, the fund's investment performance for the performance period exceeds, or is exceeded by, a securities index, thus leading to a performance adjustment for the same period. The Board noted that the performance adjustment provides FMR with a strong economic incentive to seek to achieve superior performance for the fund's shareholders and helps to more closely align the interests of FMR and the shareholders of the fund.
Based on its review, the Board concluded that the nature, extent, and quality of services provided to the fund under the Advisory Contracts should benefit the shareholders of the fund.
Competitiveness of Management Fee and Total Expense Ratio. The Board considered the fund's management fee and total expense ratio compared to "mapped groups" of competitive funds and classes created for the purpose of facilitating the Trustees' competitive analysis of management fees and total expenses. Fidelity creates "mapped groups" by combining similar Lipper investment objective categories that have comparable investment mandates. Combining Lipper investment objective categories aids the Board's management fee and total expense ratio comparisons by broadening the competitive group used for comparison.
Management Fee. The Board considered two proprietary management fee comparisons for the 12-month periods shown in basis points (BP) in the chart below. The group of Lipper funds used by the Board for management fee comparisons is referred to below as the "Total Mapped Group." The Total Mapped Group comparison focuses on a fund's standing in terms of gross management fees before expense reimbursements or caps, and without giving effect to the fund's performance adjustment, relative to the total universe of funds with comparable investment mandates, regardless of whether their management fee structures also are comparable. Funds with comparable investment mandates offer exposure to similar types of securities. Funds with comparable management fee structures have similar management fee contractual arrangements (e.g., flat rate charged for advisory services, all-inclusive fee rate, etc.). "TMG %" represents the percentage of funds in the Total Mapped Group that had management fees that were lower than the fund's. For example, a hypothetical TMG % of 20% would mean that 80% of the funds in the Total Mapped Group had higher, and 20% had lower, management fees than the fund. The fund's actual TMG %s and the number of funds in the Total Mapped Group are in the chart below. The "Asset-Size Peer Group" (ASPG) comparison focuses on a fund's standing relative to a subset of non-Fidelity funds within the Total Mapped Group that are similar in size and management fee structure without taking into account performance adjustments, if any. For example, if a fund is in the first quartile of the ASPG, the fund's management fee ranks in the least expensive or lowest 25% of funds in the ASPG. The ASPG represents at least 15% of the funds in the Total Mapped Group with comparable asset size and management fee structures, subject to a minimum of 50 funds (or all funds in the Total Mapped Group if fewer than 50). Additional information, such as the ASPG quartile in which the fund's management fee rate ranked and the impact of the fund's performance adjustment, is also included in the chart and considered by the Board.
Annual Report
Board Approval of Investment Advisory Contracts and
Management Fees - continued
Fidelity International Growth Fund
Annual Report
The Board noted that the fund's management fee rate ranked below the median of its Total Mapped Group and below the median of its ASPG for 2014. The Board also noted the effect of the fund's performance adjustment, if any, on the fund's management fee ranking.
The Board noted that, in 2014, the ad hoc Committee on Group Fee was formed by it and other Fidelity fund boards to conduct an in-depth review of the "group fee" component of the management fee of funds with such management fee structures. Committee focus included the mechanics of the group fee, the competitive landscape of group fee structures, Fidelity funds with no group fee component and investment products not included in group fee assets. The Board also considered that, for funds subject to the group fee, FMR agreed to voluntarily waive fees over a specified period of time in amounts designed to account for assets converted from certain funds to certain collective investment trusts.
The Board also noted that, in 2013, the ad hoc Committee on Management Fees was formed to conduct an in-depth review of the management fee rates of Fidelity's active equity mutual funds. The Committee focused on the following areas: (i) standard fee structures; (ii) research consumption and trading evolution; (iii) management fee competitiveness/profitability by category; and (iv) factors that drive institutional pricing.
Based on its review, the Board concluded that the fund's management fee is fair and reasonable in light of the services that the fund receives and the other factors considered.
Total Expense Ratio. In its review of each class's total expense ratio, the Board considered the fund's management fee as well as other fund or class expenses, as applicable, such as transfer agent fees, pricing and bookkeeping fees, fund-paid 12b-1 fees, and custodial, legal, and audit fees. The Board noted the impact of the fund's performance adjustment. The Board also noted that Fidelity may agree to waive fees and expenses from time to time, and the extent to which, if any, it has done so for the fund. As part of its review, the Board also considered the current and historical total expense ratios of each class of the fund compared to competitive fund median expenses. Each class of the fund is compared to those funds and classes in the Total Mapped Group (used by the Board for management fee comparisons) that have a similar sales load structure.
The Board noted that the total expense ratio of each of Class A, Class I, Class Z, and the retail class ranked below its competitive median for 2014 and the total expense ratio of each of Class T, Class B, and Class C ranked above its competitive median for 2014. The Board considered that, in general, various factors can affect total expense ratios. The Board noted that the total expense ratio of Class T was above the competitive median primarily because of higher 12b-1 fees on Class T as compared to most competitor funds. Class T has a higher 12b-1 fee, but a lower front-end sales charge, than traditionally priced front-end sales charge classes. The Board considered that Class T is primarily sold load-waived in the retirement plan market where its 0.50% 12b-1 fee is comparable to competing no-load, higher 12b-1 fee classes designed specifically for retirement plans. The Board noted that the fund offers multiple classes, each of which has a different sales load and 12b-1 fee structure, and that the multiple structures are intended to offer a range of pricing options for the intermediary market. The Board also noted that the total expense ratios of the classes vary primarily by the level of their 12b-1 fees, although differences in transfer agent fees may also cause expenses to vary from class to class.
Annual Report
Board Approval of Investment Advisory Contracts and
Management Fees - continued
The Board further considered that FMR contractually agreed to reimburse Class A, Class T, Class B, Class C, Class I, Class Z, and the retail class of the fund to the extent that total operating expenses (excluding interest, certain taxes, certain securities lending costs, brokerage commissions, extraordinary expenses, and acquired fund fees and expenses, if any), as a percentage of their respective average net assets, exceed 1.45%, 1.70%, 2.20%, 2.20%, 1.20%, 1.05%, and 1.20% through December 31, 2015.
Fees Charged to Other Fidelity Clients. The Board also considered Fidelity fee structures and other information with respect to clients of Fidelity, such as other funds advised or subadvised by Fidelity, pension plan clients, and other institutional clients with similar mandates. The Board noted the findings of the 2013 ad hoc joint committee (created with the board of other Fidelity funds), which reviewed and compared Fidelity's institutional investment advisory business with its business of providing services to the Fidelity funds, including the differences in services provided, fees charged, and costs incurred, as well as competition in their respective marketplaces.
Based on its review of total expense ratios and fees charged to other Fidelity clients, the Board concluded that, although in some cases above the median of the universe presented for comparison, the total expense ratio of each class of the fund was reasonable in light of the services that the fund and its shareholders receive and the other factors considered.
Costs of the Services and Profitability. The Board considered the revenues earned and the expenses incurred by Fidelity in conducting the business of developing, marketing, distributing, managing, administering and servicing the fund and servicing the fund's shareholders. The Board also considered the level of Fidelity's profits in respect of all the Fidelity funds.
On an annual basis, Fidelity presents to the Board information about the profitability of its relationship with the fund. Fidelity calculates profitability information for each fund, as well as aggregate profitability information for groups of Fidelity funds and all Fidelity funds, using a series of detailed revenue and cost allocation methodologies which originate with the books and records of Fidelity on which Fidelity's audited financial statements are based. The Audit Committee of the Board reviews any significant changes from the prior year's methodologies.
Annual Report
PricewaterhouseCoopers LLP (PwC), independent registered public accounting firm and auditor to Fidelity and certain Fidelity funds, has been engaged annually by the Board as part of the Board's assessment of Fidelity's profitability analysis. PwC's engagement includes the review and assessment of the methodologies used by Fidelity in determining the revenues and expenses attributable to Fidelity's mutual fund business, and completion of agreed-upon procedures in respect of the mathematical accuracy of fund profitability and its conformity to established allocation methodologies. After considering PwC's reports issued under the engagement and information provided by Fidelity, the Board concluded that while other allocation methods may also be reasonable, Fidelity's profitability methodologies are reasonable in all material respects.
The Board also reviewed Fidelity's non-fund businesses and fall-out benefits related to the mutual fund business as well as cases where Fidelity's affiliates may benefit from or be related to the fund's business.
The Board considered the costs of the services provided by and the profits realized by Fidelity in connection with the operation of the fund and was satisfied that the profitability was not excessive.
Economies of Scale. The Board considered whether there have been economies of scale in respect of the management of the Fidelity funds, whether the Fidelity funds (including the fund) have appropriately benefited from any such economies of scale, and whether there is potential for realization of any further economies of scale. The Board considered the extent to which the fund will benefit from economies of scale as assets grow through increased services to the fund, through waivers or reimbursements, or through fee or expense ratio reductions. The Board also noted that in 2013, it and the boards of other Fidelity funds created an ad hoc committee (the Economies of Scale Committee) to analyze whether Fidelity attains economies of scale in respect of the management and servicing of the Fidelity funds, whether the Fidelity funds have appropriately benefited from such economies of scale, and whether there is potential for realization of any further economies of scale.
The Board recognized that the fund's management contract incorporates a "group fee" structure, which provides for lower group fee rates as total group assets increase, and for higher group fee rates as total group assets decrease (with "group assets" defined to include fund assets under FMR's management plus sector fund assets previously under FMR's management and currently managed by Fidelity SelectCo, LLC). FMR calculates the group fee rates based on a tiered asset "breakpoint" schedule that varies based on asset class. The Board considered that the group fee is designed to deliver the benefits of economies of scale to fund shareholders when total Fidelity fund assets increase, even if assets of any particular fund are unchanged or have declined, because some portion of Fidelity's costs are attributable to services provided to all Fidelity funds, and all funds benefit if those costs can be allocated among more assets. The Board concluded that, given the group fee structure, fund shareholders will benefit from lower management fees as group assets increase at the fund complex level, regardless of whether Fidelity achieves any such economies of scale.
Annual Report
Board Approval of Investment Advisory Contracts and
Management Fees - continued
The Board concluded, taking into account the analysis of the Economies of Scale Committee, that economies of scale, if any, are being appropriately shared between fund shareholders and Fidelity.
Additional Information Requested by the Board. In order to develop fully the factual basis for consideration of the Fidelity funds' Advisory Contracts, the Board requested and received additional information on certain topics, including: (i) fund performance trends and Fidelity's long-term strategies for certain funds; (ii) the various share classes employed by Fidelity and the attributes of each class, together with similar information on the distribution and servicing payments made by Fidelity or the funds to third-party participants in the distribution channels; (iii) fund profitability, and fund performance in relation to fund profitability; (iv) the methodology with respect to evaluating competitive fund data and peer group classifications and fee comparisons; (v) annual fund profitability margins, with particular focus on certain funds with negative margins; (vi) the realization of fall-out benefits in certain Fidelity business units; (vii) economies of scale and the way in which they are shared with fund shareholders; (viii) Fidelity's group fee structures, including the group fee schedule of breakpoints; (ix) the impact of cost containment measures on the funds; and (x) the transfer agent fee structure.
Based on its evaluation of all of the conclusions noted above, and after considering all factors it believed relevant, the Board concluded that the advisory fee structures are fair and reasonable, and that the fund's Advisory Contracts should be renewed.
Annual Report
Investment Adviser
Fidelity Management & Research Company
Boston, MA
Investment Sub-Advisers
FMR Co., Inc.
FMR Investment Management
(U.K.) Limited
Fidelity Management & Research
(Hong Kong) Limited
Fidelity Management & Research
(Japan) Limited
FIL Investment Advisors
FIL Investments (Japan) Limited
FIL Investment Advisors (UK) Limited
General Distributor
Fidelity Distributors Corporation
Smithfield, RI
Transfer and Service Agents
Fidelity Investments Institutional Operations Company, Inc.
Boston, MA
Fidelity Service Company, Inc.
Boston, MA
Custodian
State Street Bank and Trust Company
Quincy, MA
(Fidelity Investment logo)(registered trademark)
AIGFI-UANN-1215
1.853341.107
ContentsPerformance: The Bottom LineManagement's Discussion of Fund PerformanceShareholder Expense ExampleInvestment Changes (Unaudited)Investments October 31, 2015Financial StatementsNotes to Financial StatementsReport of Independent Registered Public Accounting FirmTrustees and OfficersDistributions (Unaudited)Board Approval of Investment Advisory Contracts and Management Fees
(Fidelity Investment logo)(registered trademark)
Fidelity Advisor®
International Growth
Fund - Class Z
Annual Report
October 31, 2015
(Fidelity Cover Art)
Class Z is
a class of Fidelity®
International Growth Fund
Contents
Performance | (Click Here) | How the fund has done over time. |
Management's Discussion of Fund Performance | (Click Here) | The Portfolio Manager's review of fund performance and strategy. |
Shareholder Expense Example | (Click Here) | An example of shareholder expenses. |
Investment Changes | (Click Here) | A summary of major shifts in the fund's investments over the past six months. |
Investments | (Click Here) | A complete list of the fund's investments with their market values. |
Financial Statements | (Click Here) | Statements of assets and liabilities, operations, and changes in net assets, as well as financial highlights. |
Notes | (Click Here) | Notes to financial statements. |
Report of Independent Registered Public Accounting Firm | (Click Here) | |
Trustees and Officers | (Click Here) | |
Distributions | (Click Here) | |
Board Approval of Investment Advisory Contracts and Management Fees | (Click Here) | |
To view a fund's proxy voting guidelines and proxy voting record for the 12-month period ended June 30, visit http://www.fidelity.com/proxyvotingresults or visit the Securities and Exchange Commission's (SEC) web site at http://www.sec.gov. You may also call 1-877-208-0098 to request a free copy of the proxy voting guidelines.
Standard & Poor's, S&P and S&P 500 are registered service marks of The McGraw-Hill Companies, Inc. and have been licensed for use by Fidelity Distributors Corporation.
Other third-party marks appearing herein are the property of their respective owners.
All other marks appearing herein are registered or unregistered trademarks or service marks of FMR LLC or an affiliated company. © 2015 FMR LLC. All rights reserved.
Annual Report
This report and the financial statements contained herein are submitted for the general information of the shareholders of the fund. This report is not authorized for distribution to prospective investors in the fund unless preceded or accompanied by an effective prospectus.
A fund files its complete schedule of portfolio holdings with the SEC for the first and third quarters of each fiscal year on Form N-Q. Forms N-Q are available on the SEC's web site at http://www.sec.gov. A fund's Forms N-Q may be reviewed and copied at the SEC's Public Reference Room in Washington, DC. Information regarding the operation of the SEC's Public Reference Room may be obtained by calling 1-800-SEC-0330. For a complete list of a fund's portfolio holdings, view the most recent holdings listing, semiannual report, or annual report on Fidelity's web site at http://www.fidelity.com, http://www.advisor.fidelity.com, or http://www.401k.com, as applicable.
NOT FDIC INSURED • MAY LOSE VALUE • NO BANK GUARANTEE
Neither the fund nor Fidelity Distributors Corporation is a bank.
Annual Report
Average annual total return reflects the change in the value of an investment, assuming reinvestment of the class' distributions from dividend income and capital gains (the profits earned upon the sale of securities that have grown in value, if any) and assuming a constant rate of performance each year. The $10,000 table and the fund's returns do not reflect the deduction of taxes that a shareholder would pay on fund distributions or the redemption of fund shares. During periods of reimbursement by Fidelity, a fund's total return will be greater than it would be had the reimbursement not occurred. How a fund did yesterday is no guarantee of how it will do tomorrow.
Average Annual Total Returns
Periods ended October 31, 2015 | Past 1
year | Past 5
years | Life of
fund A |
Class Z B | 3.52% | 7.27% | 2.54% |
A From November 1, 2007.
B The initial offering of Class Z shares took place on August 13, 2013. Returns prior to August 13, 2013, are those of Class I.
$10,000 Over Life of Fund
Let's say hypothetically that $10,000 was invested in Fidelity Advisor® International Growth Fund - Class Z on November 1, 2007, when the fund started. The chart shows how the value of your investment would have changed, and also shows how the MSCI EAFE Growth Index performed over the same period. See footnote B above for additional information regarding the performance of Class Z.
Annual Report
Market Recap: International equities suffered a moderate setback for the 12 months ending October 31, 2015, held back by a collapse in commodities prices that hurt resources-related sectors and geographies. The MSCI ACWI (All Country World Index) ex USA Index returned -4.55% for the period, affected also by concerns about global economic growth. Commodity producers remained under pressure for much of the past year, largely related to economic deceleration in China (-1%), the world's second-largest economy and a leading consumer of raw materials. This effect was exacerbated by U.S. dollar strength relative to global currencies, which weighed on commodities priced in dollars and acutely impacted equity returns within regions most exposed to resources prices. The emerging-markets group, for example, returned about -15% this period. Canada, a significant energy producer, returned roughly -17%. Net energy consumer Japan (+9%) was the best-performing region by far. Only about a quarter of the nearly 50 index countries managed a gain this period: Ireland (+19%) - the EU's fastest-growing economy - and Israel (+17%) proved top performers; Greece (-56%) and Brazil (-46%), among the worst. As for sectors, energy (-25%) and materials (-16%) declined sharply, whereas the two consumer sectors each gained about 6%.
Comments from Portfolio Manager Jed Weiss: For the year, the fund's share classes (excluding sales charges, if applicable) produced low-single-digit gains, underperforming the 4.28% result of the benchmark MSCI EAFE Growth Index. The fund underperformed the benchmark largely for idiosyncratic reasons, including a fair-value pricing adjustment and unfavorable currency movements. Security selection was helpful overall, especially in information technology, materials and financials. Conversely, picks in health care hampered our relative result. In country terms, stock picking was strong in Australia, Spain and Switzerland, but weak in Hong Kong and Germany. Two of the fund's biggest individual detractors were Wynn Macau and Sands China, owners of casino properties in Macau. These stocks struggled for various reasons, and I eliminated the fund's stake in both. Another negative was Turkey-based Coca-Cola Icecek Sanayi. I sold the fund's stake in this owner of the Coca-Cola bottling franchise in various emerging markets and reinvested the proceeds in other stocks I thought offered a better risk/reward balance. In contrast, our biggest contributor was BGF Retail, a South Korean convenience-store retailer, while Visa and Mastercard, two U.S.-based payment processors, also contributed. Of all the stocks I mentioned, only Wynn and Sands were in our benchmark.
The views expressed above reflect those of the portfolio manager(s) only through the end of the period as stated on the cover of this report and do not necessarily represent the views of Fidelity or any other person in the Fidelity organization. Any such views are subject to change at any time based upon market or other conditions and Fidelity disclaims any responsibility to update such views. These views may not be relied on as investment advice and, because investment decisions for a Fidelity fund are based on numerous factors, may not be relied on as an indication of trading intent on behalf of any Fidelity fund.
Annual Report
Shareholder Expense Example
As a shareholder of the Fund, you incur two types of costs: (1) transaction costs, including sales charges (loads) on purchase payments or redemption proceeds, redemption fees and (2) ongoing costs, including management fees, distribution and/or service (12b-1) fees and other Fund expenses. This Example is intended to help you understand your ongoing costs (in dollars) of investing in the Fund and to compare these costs with the ongoing costs of investing in other mutual funds.
The Example is based on an investment of $1,000 invested at the beginning of the period and held for the entire period (May 1, 2015 to October 31, 2015).
Actual Expenses
The first line of the accompanying table for each class of the Fund provides information about actual account values and actual expenses. You may use the information in this line, together with the amount you invested, to estimate the expenses that you paid over the period. Simply divide your account value by $1,000.00 (for example, an $8,600 account value divided by $1,000.00 = 8.6), then multiply the result by the number in the first line for a class of the Fund under the heading entitled "Expenses Paid During Period" to estimate the expenses you paid on your account during this period. A small balance maintenance fee of $12.00 that is charged once a year may apply for certain accounts with a value of less than $2,000. This fee is not included in the table below. If it was, the estimate of expenses you paid during the period would be higher, and your ending account value lower, by this amount. In addition, the Fund, as a shareholder in the underlying Fidelity Central Funds, will indirectly bear its pro-rata share of the fees and expenses incurred by the underlying Fidelity Central Funds. These fees and expenses are not included in the Fund's annualized expense ratio used to calculate the expense estimate in the table below.
Hypothetical Example for Comparison Purposes
The second line of the accompanying table for each class of the Fund provides information about hypothetical account values and hypothetical expenses based on a Class' actual expense ratio and an assumed rate of return of 5% per year before expenses, which is not the Class' actual return. The hypothetical account values and expenses may not be used to estimate the actual ending account balance or expenses you paid for the period. You may use this information to compare the ongoing costs of investing in the Fund and other funds. To do so, compare this 5% hypothetical example with the 5% hypothetical examples that appear in the shareholder reports of the other funds. A small balance maintenance fee of $12.00 that is charged once a year may apply for certain accounts with a value of less than $2,000. This fee is not included in the table below. If it was, the estimate of expenses you paid during the period would be higher, and your ending account value lower, by this amount. In addition, the Fund, as a shareholder in the underlying Fidelity Central Funds, will indirectly bear its pro-rata share of the fees and expenses incurred by the underlying Fidelity Central Funds. These fees and expenses are not included in the Fund's annualized expense ratio used to calculate the expense estimate in the table below.
Please note that the expenses shown in the table are meant to highlight your ongoing costs only and do not reflect any transaction costs. Therefore, the second line of the table is useful in comparing ongoing costs only, and will not help you determine the relative total costs of owning different funds. In addition, if these transactional costs were included, your costs would have been higher.
Annual Report
Shareholder Expense Example - continued
| Annualized
Expense RatioB | Beginning
Account Value
May 1, 2015 | Ending
Account Value
October 31, 2015 | Expenses Paid
During PeriodC
May 1, 2015
to October 31, 2015 |
Class A | 1.25% | | | |
Actual | | $ 1,000.00 | $ 967.50 | $ 6.20 |
HypotheticalA | | $ 1,000.00 | $ 1,018.90 | $ 6.36 |
Class T | 1.56% | | | |
Actual | | $ 1,000.00 | $ 965.70 | $ 7.73 |
HypotheticalA | | $ 1,000.00 | $ 1,017.34 | $ 7.93 |
Class B | 2.05% | | | |
Actual | | $ 1,000.00 | $ 963.70 | $ 10.15 |
HypotheticalA | | $ 1,000.00 | $ 1,014.87 | $ 10.41 |
Class C | 2.05% | | | |
Actual | | $ 1,000.00 | $ 963.60 | $ 10.15 |
HypotheticalA | | $ 1,000.00 | $ 1,014.87 | $ 10.41 |
International Growth | .95% | | | |
Actual | | $ 1,000.00 | $ 968.50 | $ 4.71 |
HypotheticalA | | $ 1,000.00 | $ 1,020.42 | $ 4.84 |
Class I | .97% | | | |
Actual | | $ 1,000.00 | $ 968.50 | $ 4.81 |
HypotheticalA | | $ 1,000.00 | $ 1,020.32 | $ 4.94 |
Class Z | .84% | | | |
Actual | | $ 1,000.00 | $ 968.50 | $ 4.17 |
HypotheticalA | | $ 1,000.00 | $ 1,020.97 | $ 4.28 |
A 5% return per year before expenses
B Annualized expense ratio reflects expenses net of applicable fee waivers.
C Expenses are equal to each Class' annualized expense ratio, multiplied by the average account value over the period, multiplied by 184/365 (to reflect the one-half year period).
Annual Report
Investment Changes (Unaudited)
Annual Report
Investment Changes (Unaudited) - continued
Asset Allocation as of October 31, 2015 |
| % of fund's
net assets | % of fund's net assets
6 months ago |
Stocks | 97.7 | 98.1 |
Short-Term Investments and Net Other Assets (Liabilities) | 2.3 | 1.9 |
Top Ten Stocks as of October 31, 2015 |
| % of fund's
net assets | % of fund's net assets
6 months ago |
Novartis AG (Switzerland, Pharmaceuticals) | 3.7 | 3.9 |
Roche Holding AG (participation certificate) (Switzerland, Pharmaceuticals) | 3.6 | 3.8 |
Nestle SA (Switzerland, Food Products) | 3.0 | 3.6 |
Reckitt Benckiser Group PLC (United Kingdom, Household Products) | 2.8 | 2.2 |
Inditex SA (Spain, Specialty Retail) | 2.8 | 2.0 |
Anheuser-Busch InBev SA NV (Belgium, Beverages) | 2.6 | 2.9 |
Novo Nordisk A/S Series B sponsored ADR (Denmark, Pharmaceuticals) | 2.5 | 2.3 |
CSL Ltd. (Australia, Biotechnology) | 2.2 | 2.1 |
Visa, Inc. Class A (United States of America, IT Services) | 2.2 | 1.6 |
ASSA ABLOY AB (B Shares) (Sweden, Building Products) | 2.2 | 1.8 |
| 27.6 | |
Market Sectors as of October 31, 2015 |
| % of fund's
net assets | % of fund's net assets
6 months ago |
Health Care | 18.5 | 17.5 |
Financials | 18.1 | 16.6 |
Consumer Staples | 15.3 | 15.0 |
Consumer Discretionary | 15.1 | 15.2 |
Industrials | 12.5 | 14.9 |
Information Technology | 11.7 | 10.5 |
Materials | 6.0 | 5.9 |
Energy | 0.3 | 1.5 |
Telecommunication Services | 0.2 | 1.0 |
Annual Report
Investments October 31, 2015
Showing Percentage of Net Assets
Common Stocks - 97.7% |
| Shares | | Value |
Australia - 3.4% |
CSL Ltd. | 486,892 | | $ 32,363,861 |
Sydney Airport unit | 1,681,347 | | 7,683,937 |
Transurban Group unit | 1,384,277 | | 10,257,556 |
TOTAL AUSTRALIA | | 50,305,354 |
Austria - 0.9% |
Andritz AG | 251,621 | | 12,672,632 |
Bailiwick of Jersey - 1.3% |
Shire PLC | 259,100 | | 19,621,870 |
Belgium - 4.2% |
Anheuser-Busch InBev SA NV | 323,891 | | 38,648,165 |
KBC Groep NV | 391,998 | | 23,880,757 |
TOTAL BELGIUM | | 62,528,922 |
Canada - 0.3% |
Pason Systems, Inc. | 334,300 | | 4,918,883 |
Cayman Islands - 1.0% |
58.com, Inc. ADR (a)(d) | 79,700 | | 4,183,453 |
Alibaba Group Holding Ltd. sponsored ADR (a) | 127,500 | | 10,688,325 |
TOTAL CAYMAN ISLANDS | | 14,871,778 |
Denmark - 3.3% |
Jyske Bank A/S (Reg.) (a) | 224,900 | | 10,979,143 |
Novo Nordisk A/S Series B sponsored ADR | 698,800 | | 37,162,184 |
TOTAL DENMARK | | 48,141,327 |
Finland - 0.3% |
Tikkurila Oyj | 211,000 | | 3,872,516 |
France - 1.0% |
Safran SA | 194,500 | | 14,773,065 |
Germany - 3.1% |
Bayer AG | 164,100 | | 21,897,919 |
Linde AG | 134,277 | | 23,293,003 |
TOTAL GERMANY | | 45,190,922 |
Hong Kong - 1.8% |
AIA Group Ltd. | 4,403,400 | | 25,818,593 |
India - 0.7% |
Housing Development Finance Corp. Ltd. | 570,836 | | 10,934,415 |
Ireland - 2.7% |
CRH PLC sponsored ADR | 688,966 | | 18,850,110 |
Common Stocks - continued |
| Shares | | Value |
Ireland - continued |
James Hardie Industries PLC: | | | |
CDI | 978,142 | | $ 12,662,146 |
sponsored ADR (d) | 651,500 | | 8,567,225 |
TOTAL IRELAND | | 40,079,481 |
Israel - 0.3% |
Azrieli Group | 99,200 | | 3,886,828 |
Italy - 0.7% |
Azimut Holding SpA | 161,600 | | 3,889,928 |
Interpump Group SpA | 470,251 | | 6,929,294 |
TOTAL ITALY | | 10,819,222 |
Japan - 14.0% |
Astellas Pharma, Inc. | 1,867,900 | | 27,111,597 |
Coca-Cola Central Japan Co. Ltd. | 240,700 | | 3,382,888 |
DENSO Corp. | 642,300 | | 29,945,752 |
East Japan Railway Co. | 127,000 | | 12,074,600 |
Fast Retailing Co. Ltd. | 30,800 | | 11,250,698 |
Hoya Corp. | 336,800 | | 13,898,651 |
Japan Tobacco, Inc. | 333,200 | | 11,532,648 |
Keyence Corp. | 32,962 | | 17,160,297 |
Mitsui Fudosan Co. Ltd. | 645,000 | | 17,552,806 |
Nintendo Co. Ltd. | 46,900 | | 7,497,744 |
OSG Corp. | 185,500 | | 3,489,287 |
Seven Bank Ltd. | 2,950,000 | | 13,441,839 |
Shinsei Bank Ltd. | 4,579,000 | | 9,601,125 |
SHO-BOND Holdings Co. Ltd. | 182,600 | | 7,251,960 |
USS Co. Ltd. | 1,222,400 | | 21,580,109 |
TOTAL JAPAN | | 206,772,001 |
Kenya - 0.2% |
Safaricom Ltd. | 23,504,000 | | 3,305,070 |
Korea (South) - 0.9% |
BGFretail Co. Ltd. | 43,338 | | 6,452,666 |
NAVER Corp. | 13,427 | | 7,055,887 |
TOTAL KOREA (SOUTH) | | 13,508,553 |
Mexico - 0.6% |
Fomento Economico Mexicano S.A.B. de CV sponsored ADR | 83,555 | | 8,279,465 |
Netherlands - 1.0% |
ING Groep NV (Certificaten Van Aandelen) | 997,564 | | 14,518,414 |
Common Stocks - continued |
| Shares | | Value |
South Africa - 1.1% |
Clicks Group Ltd. | 524,756 | | $ 3,833,574 |
Naspers Ltd. Class N | 85,400 | | 12,508,548 |
TOTAL SOUTH AFRICA | | 16,342,122 |
Spain - 4.5% |
Amadeus IT Holding SA Class A | 344,400 | | 14,679,166 |
Hispania Activos Inmobiliarios SA (a) | 215,259 | | 3,242,921 |
Inditex SA (d) | 1,094,531 | | 41,048,812 |
Merlin Properties Socimi SA | 328,600 | | 4,213,283 |
Prosegur Compania de Seguridad SA (Reg.) | 725,749 | | 3,232,183 |
TOTAL SPAIN | | 66,416,365 |
Sweden - 6.1% |
ASSA ABLOY AB (B Shares) | 1,602,483 | | 31,878,324 |
Atlas Copco AB (A Shares) (d) | 460,909 | | 12,030,445 |
Fagerhult AB | 347,753 | | 5,942,721 |
H&M Hennes & Mauritz AB (B Shares) | 401,483 | | 15,615,617 |
Intrum Justitia AB | 189,300 | | 6,802,219 |
Svenska Handelsbanken AB (A Shares) | 1,283,620 | | 17,433,460 |
TOTAL SWEDEN | | 89,702,786 |
Switzerland - 13.6% |
Credit Suisse Group AG (e)(f) | 199,196 | | 4,584,662 |
Nestle SA | 575,034 | | 43,917,645 |
Novartis AG | 605,045 | | 54,810,263 |
Roche Holding AG (participation certificate) | 194,838 | | 52,898,295 |
Schindler Holding AG: | | | |
(participation certificate) | 87,617 | | 14,235,713 |
(Reg.) | 10,980 | | 1,786,215 |
UBS Group AG | 1,398,461 | | 28,011,174 |
TOTAL SWITZERLAND | | 200,243,967 |
Taiwan - 0.9% |
Taiwan Semiconductor Manufacturing Co. Ltd. | 3,093,000 | | 13,032,276 |
United Kingdom - 14.4% |
Associated British Foods PLC | 311,000 | | 16,564,569 |
Babcock International Group PLC | 627,284 | | 9,322,083 |
BAE Systems PLC | 1,392,900 | | 9,422,262 |
Berendsen PLC | 523,573 | | 8,273,186 |
Informa PLC | 1,098,226 | | 9,616,383 |
InterContinental Hotel Group PLC ADR | 754,296 | | 30,081,324 |
Johnson Matthey PLC | 188,977 | | 7,530,801 |
Common Stocks - continued |
| Shares | | Value |
United Kingdom - continued |
Lloyds Banking Group PLC | 10,251,500 | | $ 11,635,578 |
Prudential PLC | 1,005,426 | | 23,483,228 |
Reckitt Benckiser Group PLC | 429,145 | | 41,880,483 |
Rightmove PLC | 65,000 | | 3,846,832 |
Rolls-Royce Group PLC | 518,537 | | 5,483,278 |
SABMiller PLC | 446,166 | | 27,477,990 |
Shaftesbury PLC | 277,333 | | 4,020,981 |
Unite Group PLC | 413,776 | | 4,241,883 |
TOTAL UNITED KINGDOM | | 212,880,861 |
United States of America - 15.4% |
Alphabet, Inc. Class A (a) | 26,336 | | 19,419,903 |
Autoliv, Inc. (d) | 156,569 | | 18,982,426 |
Berkshire Hathaway, Inc. Class B (a) | 96,184 | | 13,082,948 |
BorgWarner, Inc. | 184,492 | | 7,899,947 |
China Biologic Products, Inc. (a) | 63,166 | | 7,197,134 |
Domino's Pizza, Inc. | 33,790 | | 3,604,379 |
Martin Marietta Materials, Inc. | 52,600 | | 8,160,890 |
MasterCard, Inc. Class A | 303,000 | | 29,993,970 |
McGraw Hill Financial, Inc. | 92,100 | | 8,532,144 |
Mohawk Industries, Inc. (a) | 97,900 | | 19,139,450 |
Moody's Corp. | 69,100 | | 6,644,656 |
Philip Morris International, Inc. | 206,108 | | 18,219,947 |
PriceSmart, Inc. | 73,800 | | 6,345,324 |
ResMed, Inc. | 128,000 | | 7,374,080 |
Sherwin-Williams Co. | 15,000 | | 4,002,450 |
SS&C Technologies Holdings, Inc. | 210,300 | | 15,593,745 |
Visa, Inc. Class A | 415,800 | | 32,257,764 |
TOTAL UNITED STATES OF AMERICA | | 226,451,157 |
TOTAL COMMON STOCKS (Cost $1,309,769,980) |
1,439,888,845
|
Nonconvertible Preferred Stocks - 0.0% |
| | | |
United Kingdom - 0.0% |
Rolls-Royce Group PLC
(Cost $73,994) | 48,068,379 | |
74,102
|
Money Market Funds - 7.4% |
| Shares | | Value |
Fidelity Cash Central Fund, 0.18% (b) | 35,048,921 | | $ 35,048,921 |
Fidelity Securities Lending Cash Central Fund, 0.19% (b)(c) | 73,928,962 | | 73,928,962 |
TOTAL MONEY MARKET FUNDS (Cost $108,977,883) |
108,977,883
|
TOTAL INVESTMENT PORTFOLIO - 105.1% (Cost $1,418,821,857) | | 1,548,940,830 |
NET OTHER ASSETS (LIABILITIES) - (5.1)% | | (75,061,785) |
NET ASSETS - 100% | $ 1,473,879,045 |
Legend |
(a) Non-income producing |
(b) Affiliated fund that is generally available only to investment companies and other accounts managed by Fidelity Investments. The rate quoted is the annualized seven-day yield of the fund at period end. A complete unaudited listing of the fund's holdings as of its most recent quarter end is available upon request. In addition, each Fidelity Central Fund's financial statements, which are not covered by the Fund's Report of Independent Registered Public Accounting Firm, are available on the SEC's website or upon request. |
(c) Investment made with cash collateral received from securities on loan. |
(d) Security or a portion of the security is on loan at period end. |
(e) Security or a portion of the security purchased on a delayed delivery or when-issued basis. Interest rate to be determined at settlement date. |
(f) Restricted securities - Investment in securities not registered under the Securities Act of 1933 (excluding 144A issues). At the end of the period, the value of restricted securities (excluding 144A issues) amounted to $4,584,662 or 0.3% of net assets. |
Additional information on each restricted holding is as follows: |
Security | Acquisition Date | Acquisition Cost |
Credit Suisse Group AG | 10/21/15 | $ 4,723,236 |
Affiliated Central Funds |
Information regarding fiscal year to date income earned by the Fund from investments in Fidelity Central Funds is as follows: |
Fund | Income earned |
Fidelity Cash Central Fund | $ 49,088 |
Fidelity Securities Lending Cash Central Fund | 197,556 |
Total | $ 246,644 |
Other Information |
Categorizations in the Schedule of Investments are based on country or territory of incorporation. |
The following is a summary of the inputs used, as of October 31, 2015, involving the Fund's assets and liabilities carried at fair value. The inputs or methodology used for valuing securities may not be an indication of the risk associated with investing in those securities. For more information on valuation inputs, and their aggregation into the levels used in the tables below, please refer to the Investment Valuation section in the accompanying Notes to Financial Statements. |
Valuation Inputs at Reporting Date: |
Description | Total | Level 1 | Level 2 | Level 3 |
Investments in Securities: | | | | |
Equities: | | | | |
Consumer Discretionary | $ 225,120,277 | $ 162,343,718 | $ 62,776,559 | $ - |
Consumer Staples | 226,535,364 | 87,173,535 | 139,361,829 | - |
Energy | 4,918,883 | 4,918,883 | - | - |
Financials | 263,630,766 | 129,145,060 | 134,485,706 | - |
Health Care | 274,335,854 | 73,631,317 | 200,704,537 | - |
Industrials | 183,615,062 | 81,300,793 | 102,314,269 | - |
Information Technology | 171,562,530 | 133,872,213 | 37,690,317 | - |
Materials | 86,939,141 | 74,276,995 | 12,662,146 | - |
Telecommunication Services | 3,305,070 | 3,305,070 | - | - |
Money Market Funds | 108,977,883 | 108,977,883 | - | - |
Total Investments in Securities: | $ 1,548,940,830 | $ 858,945,467 | $ 689,995,363 | $ - |
The following is a summary of transfers between Level 1 and Level 2 for the period ended October 31, 2015. Transfers are assumed to have occurred at the beginning of the period, and are primarily attributable to the valuation techniques used for foreign equity securities, as discussed in the accompanying Notes to Financial Statements: |
Transfers | Total |
Level 1 to Level 2 | $ 68,602,068 |
Level 2 to Level 1 | $ 15,033,001 |
See accompanying notes which are an integral part of the financial statements.
Annual Report
Statement of Assets and Liabilities
| | October 31, 2015 |
| | |
Assets | | |
Investment in securities, at value (including securities loaned of $71,231,511) - See accompanying schedule: Unaffiliated issuers (cost $1,309,843,974) | $ 1,439,962,947 | |
Fidelity Central Funds (cost $108,977,883) | 108,977,883 | |
Total Investments (cost $1,418,821,857) | | $ 1,548,940,830 |
Receivable for fund shares sold | | 2,613,468 |
Dividends receivable | | 3,193,478 |
Distributions receivable from Fidelity Central Funds | | 26,736 |
Prepaid expenses | | 3,605 |
Other receivables | | 11,410 |
Total assets | | 1,554,789,527 |
| | |
Liabilities | | |
Payable to custodian bank | $ 669 | |
Payable for investments purchased | | |
Regular delivery | 74,296 | |
Delayed delivery | 4,723,236 | |
Payable for fund shares redeemed | 878,160 | |
Accrued management fee | 840,888 | |
Distribution and service plan fees payable | 92,259 | |
Other affiliated payables | 269,569 | |
Other payables and accrued expenses | 102,443 | |
Collateral on securities loaned, at value | 73,928,962 | |
Total liabilities | | 80,910,482 |
| | |
Net Assets | | $ 1,473,879,045 |
Net Assets consist of: | | |
Paid in capital | | $ 1,371,308,764 |
Undistributed net investment income | | 9,047,261 |
Accumulated undistributed net realized gain (loss) on investments and foreign currency transactions | | (36,661,663) |
Net unrealized appreciation (depreciation) on investments and assets and liabilities in foreign currencies | | 130,184,683 |
Net Assets | | $ 1,473,879,045 |
See accompanying notes which are an integral part of the financial statements.
Annual Report
Financial Statements - continued
Statement of Assets and Liabilities - continued
| | October 31, 2015 |
Calculation of Maximum Offering Price | | |
Class A: | | |
Net Asset Value and redemption price per share ($184,878,255 ÷ 16,367,440 shares) | | $ 11.30 |
| | |
Maximum offering price per share (100/94.25 of $11.30) | | $ 11.99 |
Class T: | | |
Net Asset Value and redemption price per share ($28,832,624 ÷ 2,560,965 shares) | | $ 11.26 |
| | |
Maximum offering price per share (100/96.50 of $11.26) | | $ 11.67 |
Class B: | | |
Net Asset Value and offering price per share ($799,594 ÷ 71,668 shares)A | | $ 11.16 |
| | |
Class C: | | |
Net Asset Value and offering price per share ($52,378,157 ÷ 4,709,671 shares)A | | $ 11.12 |
| | |
International Growth: | | |
Net Asset Value, offering price and redemption price per share ($938,347,837 ÷ 82,424,899 shares) | | $ 11.38 |
| | |
Class I: | | |
Net Asset Value, offering price and redemption price per share ($267,745,321 ÷ 23,560,669 shares) | | $ 11.36 |
| | |
Class Z: | | |
Net Asset Value, offering price and redemption price per share ($897,257 ÷ 78,813 shares) | | $ 11.38 |
A Redemption price per share is equal to net asset value less any applicable contingent deferred sales charge.
See accompanying notes which are an integral part of the financial statements.
Annual Report
Statement of Operations
| Year ended October 31, 2015 |
Investment Income | | |
Dividends | | $ 24,663,808 |
Income from Fidelity Central Funds | | 246,644 |
Income before foreign taxes withheld | | 24,910,452 |
Less foreign taxes withheld | | (2,081,814) |
Total income | | 22,828,638 |
| | |
Expenses | | |
Management fee | | |
Basic fee | $ 8,327,944 | |
Performance adjustment | 167,926 | |
Transfer agent fees | 2,302,155 | |
Distribution and service plan fees | 939,382 | |
Accounting and security lending fees | 550,149 | |
Custodian fees and expenses | 146,301 | |
Independent trustees' compensation | 4,871 | |
Registration fees | 185,556 | |
Audit | 69,990 | |
Legal | 2,556 | |
Miscellaneous | 14,108 | |
Total expenses before reductions | 12,710,938 | |
Expense reductions | (87,519) | 12,623,419 |
Net investment income (loss) | | 10,205,219 |
Realized and Unrealized Gain (Loss) | | |
Net realized gain (loss) on: | | |
Investment securities: | | |
Unaffiliated issuers (net of foreign taxes of $16,052) | (27,244,971) | |
Foreign currency transactions | (218,206) | |
Total net realized gain (loss) | | (27,463,177) |
Change in net unrealized appreciation (depreciation) on: Investment securities (net of increase in deferred foreign taxes of $6,961) | 41,313,127 | |
Assets and liabilities in foreign currencies | 137,123 | |
Total change in net unrealized appreciation (depreciation) | | 41,450,250 |
Net gain (loss) | | 13,987,073 |
Net increase (decrease) in net assets resulting from operations | | $ 24,192,292 |
See accompanying notes which are an integral part of the financial statements.
Annual Report
Financial Statements - continued
Statement of Changes in Net Assets
| Year ended
October 31,
2015 | Year ended
October 31,
2014 |
Increase (Decrease) in Net Assets | | |
Operations | | |
Net investment income (loss) | $ 10,205,219 | $ 8,064,649 |
Net realized gain (loss) | (27,463,177) | (8,929,624) |
Change in net unrealized appreciation (depreciation) | 41,450,250 | 17,872,842 |
Net increase (decrease) in net assets resulting from operations | 24,192,292 | 17,007,867 |
Distributions to shareholders from net investment income | (7,019,924) | (2,592,643) |
Distributions to shareholders from net realized gain | - | (513,441) |
Total distributions | (7,019,924) | (3,106,084) |
Share transactions - net increase (decrease) | 519,861,476 | 336,569,228 |
Redemption fees | 54,094 | 42,228 |
Total increase (decrease) in net assets | 537,087,938 | 350,513,239 |
| | |
Net Assets | | |
Beginning of period | 936,791,107 | 586,277,868 |
End of period (including undistributed net investment income of $9,047,261 and undistributed net investment income of $6,829,762, respectively) | $ 1,473,879,045 | $ 936,791,107 |
See accompanying notes which are an integral part of the financial statements.
Annual Report
Financial Highlights - Fidelity International Growth Fund Class A
Years ended October 31, | 2015 | 2014 | 2013 | 2012 | 2011 |
Selected Per-Share Data | | | | | |
Net asset value, beginning of period | $ 11.01 | $ 10.78 | $ 8.91 | $ 8.09 | $ 8.38 |
Income from Investment Operations | | | | |
Net investment income (loss) C | .07 | .09 | .08 | .08 | .08 |
Net realized and unrealized gain (loss) | .28 | .18 | 1.88 | .81 | (.31) |
Total from investment operations | .35 | .27 | 1.96 | .89 | (.23) |
Distributions from net investment income | (.06) | (.03) | (.08) | (.06) | (.05) |
Distributions from net realized gain | - | (.01) | (.01) | (.01) | (.01) |
Total distributions | (.06) | (.04) | (.09) | (.07) | (.06) |
Redemption fees added to paid in capitalC, G | - | - | - | - | - |
Net asset value, end of period | $ 11.30 | $ 11.01 | $ 10.78 | $ 8.91 | $ 8.09 |
Total ReturnA, B | 3.20% | 2.54% | 22.18% | 11.10% | (2.76)% |
Ratios to Average Net AssetsD, F | | | | | |
Expenses before reductions | 1.26% | 1.35% | 1.44% | 1.58% | 1.77% |
Expenses net of fee waivers, if any | 1.26% | 1.35% | 1.43% | 1.45% | 1.45% |
Expenses net of all reductions | 1.25% | 1.34% | 1.42% | 1.44% | 1.43% |
Net investment income (loss) | .66% | .84% | .80% | .99% | .92% |
Supplemental Data | | | | | |
Net assets, end of period (000 omitted) | $ 184,878 | $ 119,017 | $ 74,595 | $ 21,874 | $ 6,352 |
Portfolio turnover rateE | 26% | 27% | 32% | 32% | 68% |
A Total returns would have been lower if certain expenses had not been reduced during the applicable periods shown.
B Total returns do not include the effect of the sales charges.
C Calculated based on average shares outstanding during the period.
D Fees and expenses of any underlying Fidelity Central Funds are not included in the Fund's expense ratio. The Fund indirectly bears its proportionate share of the expenses of any underlying Fidelity Central Funds.
E Amount does not include the portfolio activity of any underlying Fidelity Central Funds.
F Expense ratios reflect operating expenses of the class. Expenses before reductions do not reflect amounts reimbursed by the investment adviser or reductions from brokerage service arrangements or reductions from other expense offset arrangements and do not represent the amount paid by the class during periods when reimbursements or reductions occur. Expenses net of fee waivers reflect expenses after reimbursement by the investment adviser but prior to reductions from brokerage service arrangements or other expense offset arrangements. Expenses net of all reductions represent the net expenses paid by the class.
G Amount represents less than $.005 per share.
See accompanying notes which are an integral part of the financial statements.
Annual Report
Financial Highlights - Fidelity International Growth Fund Class T
Years ended October 31, | 2015 | 2014 | 2013 | 2012 | 2011 |
Selected Per-Share Data | | | | | |
Net asset value, beginning of period | $ 10.96 | $ 10.75 | $ 8.89 | $ 8.08 | $ 8.38 |
Income from Investment Operations | | | | |
Net investment income (loss) C | .04 | .06 | .05 | .06 | .06 |
Net realized and unrealized gain (loss) | .27 | .18 | 1.88 | .81 | (.31) |
Total from investment operations | .31 | .24 | 1.93 | .87 | (.25) |
Distributions from net investment income | (.01) | (.02) | (.07) | (.05) | (.04) |
Distributions from net realized gain | - | (.01) | (.01) | (.01) | (.01) |
Total distributions | (.01) | (.03) | (.07) H | (.06) | (.05) |
Redemption fees added to paid in capitalC, G | - | - | - | - | - |
Net asset value, end of period | $ 11.26 | $ 10.96 | $ 10.75 | $ 8.89 | $ 8.08 |
Total ReturnA, B | 2.85% | 2.21% | 21.91% | 10.82% | (3.03)% |
Ratios to Average Net AssetsD, F | | | | | |
Expenses before reductions | 1.58% | 1.65% | 1.69% | 1.85% | 2.03% |
Expenses net of fee waivers, if any | 1.58% | 1.65% | 1.69% | 1.70% | 1.70% |
Expenses net of all reductions | 1.58% | 1.65% | 1.68% | 1.69% | 1.68% |
Net investment income (loss) | .33% | .53% | .54% | .74% | .67% |
Supplemental Data | | | | | |
Net assets, end of period (000 omitted) | $ 28,833 | $ 26,369 | $ 23,118 | $ 10,690 | $ 2,917 |
Portfolio turnover rateE | 26% | 27% | 32% | 32% | 68% |
A Total returns would have been lower if certain expenses had not been reduced during the applicable periods shown.
B Total returns do not include the effect of the sales charges.
C Calculated based on average shares outstanding during the period.
D Fees and expenses of any underlying Fidelity Central Funds are not included in the Fund's expense ratio. The Fund indirectly bears its proportionate share of the expenses of any underlying Fidelity Central Funds.
E Amount does not include the portfolio activity of any underlying Fidelity Central Funds.
F Expense ratios reflect operating expenses of the class. Expenses before reductions do not reflect amounts reimbursed by the investment adviser or reductions from brokerage service arrangements or reductions from other expense offset arrangements and do not represent the amount paid by the class during periods when reimbursements or reductions occur. Expenses net of fee waivers reflect expenses after reimbursement by the investment adviser but prior to reductions from brokerage service arrangements or other expense offset arrangements. Expenses net of all reductions represent the net expenses paid by the class.
G Amount represents less than $.005 per share.
H Total distributions of $.07 per share is comprised of distributions from net investment income of $0.69 and distributions from net realized gain of $.005 per share.
See accompanying notes which are an integral part of the financial statements.
Annual Report
Financial Highlights - Fidelity International Growth Fund Class B
Years ended October 31, | 2015 | 2014 | 2013 | 2012 | 2011 |
Selected Per-Share Data | | | | | |
Net asset value, beginning of period | $ 10.91 | $ 10.73 | $ 8.88 | $ 8.06 | $ 8.36 |
Income from Investment Operations | | | | |
Net investment income (loss) C | (.02) | - G | - G | .02 | .01 |
Net realized and unrealized gain (loss) | .27 | .19 | 1.89 | .80 | (.30) |
Total from investment operations | .25 | .19 | 1.89 | .82 | (.29) |
Distributions from net investment income | - | - | (.03) | - | (.01) |
Distributions from net realized gain | - | (.01) | (.01) | - | - G |
Total distributions | - | (.01) | (.04) | - | (.01) |
Redemption fees added to paid in capitalC, G | - | - | - | - | - |
Net asset value, end of period | $ 11.16 | $ 10.91 | $ 10.73 | $ 8.88 | $ 8.06 |
Total ReturnA, B | 2.29% | 1.76% | 21.35% | 10.17% | (3.47)% |
Ratios to Average Net AssetsD, F | | | | | |
Expenses before reductions | 2.07% | 2.14% | 2.19% | 2.35% | 2.55% |
Expenses net of fee waivers, if any | 2.07% | 2.14% | 2.18% | 2.20% | 2.20% |
Expenses net of all reductions | 2.06% | 2.14% | 2.17% | 2.19% | 2.18% |
Net investment income (loss) | (.15)% | .04% | .05% | .24% | .17% |
Supplemental Data | | | | | |
Net assets, end of period (000 omitted) | $ 800 | $ 1,404 | $ 1,579 | $ 1,116 | $ 473 |
Portfolio turnover rateE | 26% | 27% | 32% | 32% | 68% |
A Total returns would have been lower if certain expenses had not been reduced during the applicable periods shown.
B Total returns do not include the effect of the contingent deferred sales charge.
C Calculated based on average shares outstanding during the period.
D Fees and expenses of any underlying Fidelity Central Funds are not included in the Fund's expense ratio. The Fund indirectly bears its proportionate share of the expenses of any underlying Fidelity Central Funds.
E Amount does not include the portfolio activity of any underlying Fidelity Central Funds.
F Expense ratios reflect operating expenses of the class. Expenses before reductions do not reflect amounts reimbursed by the investment adviser or reductions from brokerage service arrangements or reductions from other expense offset arrangements and do not represent the amount paid by the class during periods when reimbursements or reductions occur. Expenses net of fee waivers reflect expenses after reimbursement by the investment adviser but prior to reductions from brokerage service arrangements or other expense offset arrangements. Expenses net of all reductions represent the net expenses paid by the class.
G Amount represents less than $.005 per share.
See accompanying notes which are an integral part of the financial statements.
Annual Report
Financial Highlights - Fidelity International Growth Fund Class C
Years ended October 31, | 2015 | 2014 | 2013 | 2012 | 2011 |
Selected Per-Share Data | | | | | |
Net asset value, beginning of period | $ 10.87 | $ 10.69 | $ 8.84 | $ 8.03 | $ 8.34 |
Income from Investment Operations | | | | |
Net investment income (loss) C | (.02) | .01 | .01 | .02 | .01 |
Net realized and unrealized gain (loss) | .27 | .18 | 1.87 | .80 | (.31) |
Total from investment operations | .25 | .19 | 1.88 | .82 | (.30) |
Distributions from net investment income | - | - | (.02) | (.01) | (.01) |
Distributions from net realized gain | - | (.01) | (.01) | (.01) | (.01) |
Total distributions | - | (.01) | (.03) | (.01) I | (.01) H |
Redemption fees added to paid in capitalC, G | - | - | - | - | - |
Net asset value, end of period | $ 11.12 | $ 10.87 | $ 10.69 | $ 8.84 | $ 8.03 |
Total ReturnA, B | 2.30% | 1.77% | 21.29% | 10.27% | (3.57)% |
Ratios to Average Net AssetsD, F | | | | | |
Expenses before reductions | 2.06% | 2.12% | 2.19% | 2.33% | 2.52% |
Expenses net of fee waivers, if any | 2.06% | 2.12% | 2.18% | 2.20% | 2.20% |
Expenses net of all reductions | 2.05% | 2.12% | 2.17% | 2.19% | 2.18% |
Net investment income (loss) | (.15)% | .06% | .05% | .24% | .17% |
Supplemental Data | | | | | |
Net assets, end of period (000 omitted) | $ 52,378 | $ 32,737 | $ 17,196 | $ 5,648 | $ 2,767 |
Portfolio turnover rateE | 26% | 27% | 32% | 32% | 68% |
A Total returns would have been lower if certain expenses had not been reduced during the applicable periods shown.
B Total returns do not include the effect of the contingent deferred sales charge.
C Calculated based on average shares outstanding during the period.
D Fees and expenses of any underlying Fidelity Central Funds are not included in the Fund's expense ratio. The Fund indirectly bears its proportionate share of the expenses of any underlying Fidelity Central Funds.
E Amount does not include the portfolio activity of any underlying Fidelity Central Funds.
F Expense ratios reflect operating expenses of the class. Expenses before reductions do not reflect amounts reimbursed by the investment adviser or reductions from brokerage service arrangements or reductions from other expense offset arrangements and do not represent the amount paid by the class during periods when reimbursements or reductions occur. Expenses net of fee waivers reflect expenses after reimbursement by the investment adviser but prior to reductions from brokerage service arrangements or other expense offset arrangements. Expenses net of all reductions represent the net expenses paid by the class.
G Amount represents less than $.005 per share.
H Total distributions of $.01 per share is comprised of distributions from net investment income of $.008 and distributions from net realized gain of $.005 per share.
I Total distributions of $.01 per share is comprised of distributions from net investment income of $.007 and distributions from net realized gain of $.006 per share.
See accompanying notes which are an integral part of the financial statements.
Annual Report
Financial Highlights - Fidelity International Growth Fund
Years ended October 31, | 2015 | 2014 | 2013 | 2012 | 2011 |
Selected Per-Share Data | | | | | |
Net asset value, beginning of period | $ 11.10 | $ 10.84 | $ 8.95 | $ 8.12 | $ 8.40 |
Income from Investment Operations | | | | |
Net investment income (loss) B | .11 | .13 | .11 | .11 | .10 |
Net realized and unrealized gain (loss) | .26 | .19 | 1.88 | .81 | (.30) |
Total from investment operations | .37 | .32 | 1.99 | .92 | (.20) |
Distributions from net investment income | (.09) | (.05) | (.10) | (.08) | (.07) |
Distributions from net realized gain | - | (.01) | (.01) | (.01) | (.01) |
Total distributions | (.09) | (.06) | (.10) G | (.09) | (.08) |
Redemption fees added to paid in capitalB, F | - | - | - | - | - |
Net asset value, end of period | $ 11.38 | $ 11.10 | $ 10.84 | $ 8.95 | $ 8.12 |
Total ReturnA | 3.36% | 2.96% | 22.48% | 11.41% | (2.47)% |
Ratios to Average Net AssetsC, E | | | | | |
Expenses before reductions | .97% | 1.04% | 1.13% | 1.28% | 1.52% |
Expenses net of fee waivers, if any | .97% | 1.04% | 1.13% | 1.20% | 1.20% |
Expenses net of all reductions | .96% | 1.04% | 1.11% | 1.19% | 1.18% |
Net investment income (loss) | .94% | 1.14% | 1.11% | 1.24% | 1.17% |
Supplemental Data | | | | | |
Net assets, end of period (000 omitted) | $ 938,348 | $ 635,607 | $ 430,914 | $ 149,526 | $ 53,437 |
Portfolio turnover rateD | 26% | 27% | 32% | 32% | 68% |
A Total returns would have been lower if certain expenses had not been reduced during the applicable periods shown.
B Calculated based on average shares outstanding during the period.
C Fees and expenses of any underlying Fidelity Central Funds are not included in the Fund's expense ratio. The Fund indirectly bears its proportionate share of the expenses of any underlying Fidelity Central Funds.
D Amount does not include the portfolio activity of any underlying Fidelity Central Funds.
E Expense ratios reflect operating expenses of the class. Expenses before reductions do not reflect amounts reimbursed by the investment adviser or reductions from brokerage service arrangements or reductions from other expense offset arrangements and do not represent the amount paid by the class during periods when reimbursements or reductions occur. Expenses net of fee waivers reflect expenses after reimbursement by the investment adviser but prior to reductions from brokerage service arrangements or other expense offset arrangements. Expenses net of all reductions represent the net expenses paid by the class.
F Amount represents less than $.005 per share.
G Total distributions of $.10 per share is comprised of distributions from net investment income of $.097 and distributions from net realized gain of $.005 per share.
See accompanying notes which are an integral part of the financial statements.
Annual Report
Financial Highlights - Fidelity International Growth Fund Class I
Years ended October 31, | 2015 | 2014 | 2013 | 2012 | 2011 |
Selected Per-Share Data | | | | | |
Net asset value, beginning of period | $ 11.08 | $ 10.84 | $ 8.94 | $ 8.12 | $ 8.40 |
Income from Investment Operations | | | | |
Net investment income (loss) B | .11 | .13 | .11 | .10 | .10 |
Net realized and unrealized gain (loss) | .27 | .18 | 1.90 | .81 | (.30) |
Total from investment operations | .38 | .31 | 2.01 | .91 | (.20) |
Distributions from net investment income | (.10) | (.06) | (.10) | (.08) | (.07) |
Distributions from net realized gain | - | (.01) | (.01) | (.01) | (.01) |
Total distributions | (.10) | (.07) | (.11) | (.09) | (.08) |
Redemption fees added to paid in capitalB, F | - | - | - | - | - |
Net asset value, end of period | $ 11.36 | $ 11.08 | $ 10.84 | $ 8.94 | $ 8.12 |
Total ReturnA | 3.41% | 2.84% | 22.66% | 11.28% | (2.47)% |
Ratios to Average Net AssetsC, E | | | | | |
Expenses before reductions | .98% | 1.04% | 1.11% | 1.27% | 1.50% |
Expenses net of fee waivers, if any | .98% | 1.04% | 1.11% | 1.20% | 1.20% |
Expenses net of all reductions | .97% | 1.04% | 1.09% | 1.19% | 1.18% |
Net investment income (loss) | .94% | 1.14% | 1.13% | 1.24% | 1.17% |
Supplemental Data | | | | | |
Net assets, end of period (000 omitted) | $ 267,745 | $ 121,554 | $ 38,771 | $ 3,992 | $ 493 |
Portfolio turnover rateD | 26% | 27% | 32% | 32% | 68% |
A Total returns would have been lower if certain expenses had not been reduced during the applicable periods shown.
B Calculated based on average shares outstanding during the period.
C Fees and expenses of any underlying Fidelity Central Funds are not included in the Fund's expense ratio. The Fund indirectly bears its proportionate share of the expenses of any underlying Fidelity Central Funds.
D Amount does not include the portfolio activity of any underlying Fidelity Central Funds.
E Expense ratios reflect operating expenses of the class. Expenses before reductions do not reflect amounts reimbursed by the investment adviser or reductions from brokerage service arrangements or reductions from other expense offset arrangements and do not represent the amount paid by the class during periods when reimbursements or reductions occur. Expenses net of fee waivers reflect expenses after reimbursement by the investment adviser but prior to reductions from brokerage service arrangements or other expense offset arrangements. Expenses net of all reductions represent the net expenses paid by the class.
F Amount represents less than $.005 per share.
See accompanying notes which are an integral part of the financial statements.
Annual Report
Financial Highlights - Fidelity International Growth Fund Class Z
Years ended October 31, | 2015 | 2014 | 2013 G |
Selected Per-Share Data | | | |
Net asset value, beginning of period | $ 11.10 | $ 10.84 | $ 10.26 |
Income from Investment Operations | | | |
Net investment income (loss) D | .12 | .14 | .02 |
Net realized and unrealized gain (loss) | .27 | .19 | .56 |
Total from investment operations | .39 | .33 | .58 |
Distributions from net investment income | (.11) | (.06) | - |
Distributions from net realized gain | - | (.01) | - |
Total distributions | (.11) | (.07) | - |
Redemption fees added to paid in capitalD, I | - | - | - |
Net asset value, end of period | $ 11.38 | $ 11.10 | $ 10.84 |
Total ReturnB, C | 3.52% | 3.07% | 5.65% |
Ratios to Average Net AssetsE, H | | | |
Expenses before reductions | .84% | .88% | .94%A |
Expenses net of fee waivers, if any | .84% | .88% | .94%A |
Expenses net of all reductions | .83% | .88% | .93%A |
Net investment income (loss) | 1.07% | 1.30% | .65%A |
Supplemental Data | | | |
Net assets, end of period (000 omitted) | $ 897 | $ 104 | $ 106 |
Portfolio turnover rateF | 26% | 27% | 32% |
A Annualized
B Total returns for periods of less than one year are not annualized.
C Total returns would have been lower if certain expenses had not been reduced during the applicable periods shown.
D Calculated based on average shares outstanding during the period.
E Fees and expenses of any underlying Fidelity Central Funds are not included in the Fund's expense ratio. The Fund indirectly bears its proportionate share of the expenses of any underlying Fidelity Central Funds.
F Amount does not include the portfolio activity of any underlying Fidelity Central Funds.
G For the period August 13, 2013 (commencement of sale of shares) to October 31, 2013.
H Expense ratios reflect operating expenses of the class. Expenses before reductions do not reflect amounts reimbursed by the investment adviser or reductions from brokerage service arrangements or reductions from other expense offset arrangements and do not represent the amount paid by the class during periods when reimbursements or reductions occur. Expenses net of fee waivers reflect expenses after reimbursement by the investment adviser but prior to reductions from brokerage service arrangements or other expense offset arrangements. Expenses net of all reductions represent the net expenses paid by the class.
I Amount represents less than $.005 per share.
See accompanying notes which are an integral part of the financial statements.
Annual Report
For the period ended October 31, 2015
1. Organization.
Fidelity International Growth Fund (the Fund) is a fund of Fidelity Investment Trust (the Trust) and is authorized to issue an unlimited number of shares. The Trust is registered under the Investment Company Act of 1940, as amended (the 1940 Act), as an open-end management investment company organized as a Massachusetts business trust. The Fund offers Class A, Class T, Class C, International Growth, Class I (formerly Institutional Class) and Class Z shares, each of which, along with Class B shares, has equal rights as to assets and voting privileges. Class B shares are closed to new accounts and additional purchases, except for exchanges and reinvestments. Each class has exclusive voting rights with respect to matters that affect that class. Class B shares will automatically convert to Class A shares after a holding period of seven years from the initial date of purchase.
2. Investments in Fidelity Central Funds.
The Fund invests in Fidelity Central Funds, which are open-end investment companies generally available only to other investment companies and accounts managed by the investment adviser and its affiliates. The Fund's Schedule of Investments lists each of the Fidelity Central Funds held as of period end, if any, as an investment of the Fund, but does not include the underlying holdings of each Fidelity Central Fund. As an Investing Fund, the Fund indirectly bears its proportionate share of the expenses of the underlying Fidelity Central Funds.
The Money Market Central Funds seek preservation of capital and current income and are managed by Fidelity Investments Money Management, Inc. (FIMM), an affiliate of the investment adviser. Annualized expenses of the Money Market Central Funds as of their most recent shareholder report date are less than .005%.
A complete unaudited list of holdings for each Fidelity Central Fund is available upon request or at the Securities and Exchange Commission (the SEC) website at www.sec.gov. In addition, the financial statements of the Fidelity Central Funds, which are not covered by the Fund's Report of Independent Registered Public Accounting Firm, are available on the SEC website or upon request.
3. Significant Accounting Policies.
The financial statements have been prepared in conformity with accounting principles generally accepted in the United States of America (GAAP), which require management to make certain estimates and assumptions at the date of the financial statements. Actual results could differ from those estimates. Subsequent events, if any, through the
Annual Report
Notes to Financial Statements - continued
3. Significant Accounting Policies - continued
date that the financial statements were issued have been evaluated in the preparation of the financial statements. The following summarizes the significant accounting policies of the Fund:
Investment Valuation. Investments are valued as of 4:00 p.m. Eastern time on the last calendar day of the period. The Board of Trustees (the Board) has delegated the day to day responsibility for the valuation of the Fund's investments to the Fidelity Management & Research Company (FMR) Fair Value Committee (the Committee). In accordance with valuation policies and procedures approved by the Board, the Fund attempts to obtain prices from one or more third party pricing vendors or brokers to value its investments. When current market prices, quotations or currency exchange rates are not readily available or reliable, investments will be fair valued in good faith by the Committee, in accordance with procedures adopted by the Board. Factors used in determining fair value vary by investment type and may include market or investment specific events. The frequency with which these procedures are used cannot be predicted and they may be utilized to a significant extent. The Committee oversees the Fund's valuation policies and procedures and reports to the Board on the Committee's activities and fair value determinations. The Board monitors the appropriateness of the procedures used in valuing the Fund's investments and ratifies the fair value determinations of the Committee.
The Fund categorizes the inputs to valuation techniques used to value its investments into a disclosure hierarchy consisting of three levels as shown below:
Level 1 - quoted prices in active markets for identical investments
Level 2 - other significant observable inputs (including quoted prices for similar investments, interest rates, prepayment speeds, etc.)
Level 3 - unobservable inputs (including the Fund's own assumptions based on the best information available)
Valuation techniques used to value the Fund's investments by major category are as follows:
Equity securities, including restricted securities, for which market quotations are readily available, are valued at the last reported sale price or official closing price as reported by a third party pricing vendor on the primary market or exchange on which they are traded and are categorized as Level 1 in the hierarchy. In the event there were no sales during the day or closing prices are not available, securities are valued at the last quoted bid price or may be valued using the last available price and are generally categorized as
Annual Report
3. Significant Accounting Policies - continued
Investment Valuation - continued
Level 2 in the hierarchy. For foreign equity securities, when market or security specific events arise, comparisons to the valuation of American Depositary Receipts (ADRs), futures contracts, Exchange-Traded Funds (ETFs) and certain indexes as well as quoted prices for similar securities may be used and would be categorized as Level 2 in the hierarchy. Utilizing these techniques may result in transfers between Level 1 and Level 2. For equity securities, including restricted securities, where observable inputs are limited, assumptions about market activity and risk are used and these securities may be categorized as Level 3 in the hierarchy.
Investments in open-end mutual funds, including the Fidelity Central Funds, are valued at their closing net asset value (NAV) each business day and are categorized as Level 1 in the hierarchy.
Changes in valuation techniques may result in transfers in or out of an assigned level within the disclosure hierarchy. The aggregate value of investments by input level as of October 31, 2015, including information on transfers between Levels 1 and 2, is included at the end of the Fund's Schedule of Investments.
Foreign Currency. The Fund may use foreign currency contracts to facilitate transactions in foreign-denominated securities. Gains and losses from these transactions may arise from changes in the value of the foreign currency or if the counterparties do not perform under the contracts' terms.
Foreign-denominated assets, including investment securities, and liabilities are translated into U.S. dollars at the exchange rates at period end. Purchases and sales of investment securities, income and dividends received and expenses denominated in foreign currencies are translated into U.S. dollars at the exchange rate in effect on the transaction date.
The effects of exchange rate fluctuations on investments are included with the net realized and unrealized gain (loss) on investment securities. Other foreign currency transactions resulting in realized and unrealized gain (loss) are disclosed separately.
Investment Transactions and Income. For financial reporting purposes, the Fund's investment holdings and NAV include trades executed through the end of the last business day of the period. The NAV per share for processing shareholder transactions is calculated as of the close of business of the New York Stock Exchange (NYSE), normally 4:00 p.m. Eastern time and includes trades executed through the end of the prior business day. Gains and losses on securities sold are determined on the basis of identified cost and may include proceeds received from litigation. Dividend income is recorded on
Annual Report
Notes to Financial Statements - continued
3. Significant Accounting Policies - continued
Investment Transactions and Income - continued
the ex-dividend date, except for certain dividends from foreign securities where the ex-dividend date may have passed, which are recorded as soon as the Fund is informed of the ex-dividend date. Non-cash dividends included in dividend income, if any, are recorded at the fair market value of the securities received. Income and capital gain distributions from Fidelity Central Funds, if any, are recorded on the ex-dividend date. Distributions received on securities that represent a return of capital or capital gain are recorded as a reduction of cost of investments and/or as a realized gain. Subsequent to ex-dividend date the Fund determines the components of these distributions, based upon receipt of tax filings or other correspondence relating to the underlying investment. Interest income is accrued as earned and includes coupon interest and amortization of premium and accretion of discount on debt securities as applicable. Investment income is recorded net of foreign taxes withheld where recovery of such taxes is uncertain.
Class Allocations and Expenses. Investment income, realized and unrealized capital gains and losses, common expenses of the Fund, and certain fund-level expense reductions, if any, are allocated daily on a pro-rata basis to each class based on the relative net assets of each class to the total net assets of the Fund. Each class differs with respect to transfer agent and distribution and service plan fees incurred. Certain expense reductions may also differ by class. For the reporting period, the allocated portion of income and expenses to each class as a percent of its average net assets may vary due to the timing of recording these transactions in relation to fluctuating net assets of the classes. Expenses directly attributable to a fund are charged to that fund. Expenses attributable to more than one fund are allocated among the respective funds on the basis of relative net assets or other appropriate methods. Expense estimates are accrued in the period to which they relate and adjustments are made when actual amounts are known.
Income Tax Information and Distributions to Shareholders. Each year, the Fund intends to qualify as a regulated investment company under Subchapter M of the Internal Revenue Code, including distributing substantially all of its taxable income and realized gains. As a result, no provision for U.S. Federal income taxes is required. As of October 31, 2015, the Fund did not have any unrecognized tax benefits in the financial statements; nor is the Fund aware of any tax positions for which it is reasonably possible that the total amounts of unrecognized tax benefits will significantly change in the next twelve months. The Fund files a U.S. federal tax return, in addition to state and local tax returns as required. The Fund's federal income tax returns are subject to examination by the Internal Revenue Service (IRS) for a period of three fiscal years after they are filed. State and local tax returns may be subject to examination for an additional fiscal year depending on the jurisdiction. Foreign taxes are provided for based on the Fund's understanding of the tax rules and rates that exist in the foreign markets in which it
Annual Report
3. Significant Accounting Policies - continued
Income Tax Information and Distributions to Shareholders - continued
invests. The Fund is subject to a tax imposed on capital gains by certain countries in which it invests. An estimated deferred tax liability for net unrealized appreciation on the applicable securities is included in Other payables and accrued expenses on the Statement of Assets & Liabilities.
Distributions are declared and recorded on the ex-dividend date. Income dividends and capital gain distributions are declared separately for each class. Income and capital gain distributions are determined in accordance with income tax regulations, which may differ from GAAP. In addition, the Fund claimed a portion of the payment made to redeeming shareholders as a distribution for income tax purposes.
Capital accounts within the financial statements are adjusted for permanent book-tax differences. These adjustments have no impact on net assets or the results of operations. Capital accounts are not adjusted for temporary book-tax differences which will reverse in a subsequent period.
Book-tax differences are primarily due to foreign currency transactions, certain foreign taxes, passive foreign investment companies (PFIC), partnerships, capital loss carryforwards, and losses deferred due to wash sales.
The federal tax cost of investment securities and unrealized appreciation (depreciation) as of period end were as follows:
Gross unrealized appreciation | $ 171,926,225 |
Gross unrealized depreciation | (45,542,097) |
Net unrealized appreciation (depreciation) on securities | $ 126,384,128 |
Tax Cost | $ 1,422,556,702 |
The tax-based components of distributable earnings as of period end were as follows:
Undistributed ordinary income | $ 9,875,277 |
Capital loss carryforward | $ (33,754,835) |
Net unrealized appreciation (depreciation) on securities and other investments | $ 126,454,576 |
Capital loss carryforwards are only available to offset future capital gains of the Fund to the extent provided by regulations and may be limited. Under the Regulated Investment Company Modernization Act of 2010 (the Act), the Fund is permitted to carry forward capital losses incurred in taxable years beginning after December 22, 2010 for an unlimited period and such capital losses are required to be used prior to any losses that expire.
Annual Report
Notes to Financial Statements - continued
3. Significant Accounting Policies - continued
Income Tax Information and Distributions to Shareholders - continued
The capital loss carryforward information presented below, including any applicable limitation, is estimated as of fiscal period end and is subject to adjustment.
No expiration | |
Short-term | (26,434,969) |
Long-term | (7,319,866) |
Total no expiration | (33,754,835) |
The tax character of distributions paid was as follows:
| October 31, 2015 | October 31, 2014 |
Ordinary Income | $ 7,019,924 | $ 2,592,642 |
Long-term Capital Gains | - | 513,442 |
Total | $ 7,019,924 | $ 3,106,084 |
Short-Term Trading (Redemption) Fees. Shares held by investors in the Fund less than 30 days may have been subject to a redemption fee equal to 1.00% of the NAV of shares redeemed. All redemption fees, which reduce the proceeds of the shareholder redemption, are retained by the Fund and accounted for as an addition to paid in capital.
Delayed Delivery Transactions and When-Issued Securities. During the period, the Fund transacted in securities on a delayed delivery or when-issued basis. Payment and delivery may take place after the customary settlement period for that security. The price of the underlying securities and the date when the securities will be delivered and paid for are fixed at the time the transaction is negotiated. The securities purchased on a delayed delivery or when-issued basis are identified as such in the Fund's Schedule of Investments. With respect to purchase commitments, the Fund identifies securities as segregated in its records with a value at least equal to the amount of the commitment. Losses may arise due to changes in the value of the underlying securities or if the counterparty does not perform under the contract's terms, or if the issuer does not issue the securities due to political, economic, or other factors.
Restricted Securities. The Fund may invest in securities that are subject to legal or contractual restrictions on resale. These securities generally may be resold in transactions exempt from registration or to the public if the securities are registered. Disposal of these securities may involve time-consuming negotiations and expense, and prompt sale at an acceptable price may be difficult. Information regarding restricted securities is included at the end of the Fund's Schedule of Investments.
Annual Report
4. Purchases and Sales of Investments.
Purchases and sales of securities, other than short-term securities, aggregated $817,391,288 and $297,421,341, respectively.
5. Fees and Other Transactions with Affiliates.
Management Fee. Fidelity Management & Research Company (the investment adviser) and its affiliates provide the Fund with investment management related services for which the Fund pays a monthly management fee. The management fee is the sum of an individual fund fee rate that is based on an annual rate of .45% of the Fund's average net assets and an annualized group fee rate that averaged .25% during the period. The group fee rate is based upon the average net assets of all the mutual funds advised by the investment adviser, including any mutual funds previously advised by the investment adviser that are currently advised by Fidelity SelectCo, LLC, an affiliate of the investment adviser. The group fee rate decreases as assets under management increase and increases as assets under management decrease. In addition, the management fee is subject to a performance adjustment (up to a maximum of ± .20% of the Fund's average net assets over a 36 month performance period). The upward or downward adjustment to the management fee is based on the relative investment performance of International Growth as compared to its benchmark index, the MSCI EAFE Growth Index, over the same 36 month performance period. For the reporting period, the total annual management fee rate, including the performance adjustment, was .71% of the Fund's average net assets. The performance adjustment included in the management fee rate may be higher or lower than the maximum performance adjustment rate due to the difference between the average net assets for the reporting and performance periods.
Distribution and Service Plan Fees. In accordance with Rule 12b-1 of the 1940 Act, the Fund has adopted separate Distribution and Service Plans for each class of shares. Certain classes pay Fidelity Distributors Corporation (FDC), an affiliate of the investment adviser, separate Distribution and Service Fees, each of which is based on an annual percentage of each class' average net assets. In addition, FDC may pay financial intermediaries for selling shares of the Fund and providing shareholder support services. For the period, the Distribution and Service Fee rates, total fees and amounts retained by FDC were as follows:
| Distribution
Fee | Service
Fee | Total Fees | Retained
by FDC |
Class A | -% | .25% | $ 372,877 | $ 7,701 |
Class T | .25% | .25% | 136,338 | 179 |
Class B | .75% | .25% | 10,860 | 8,157 |
Class C | .75% | .25% | 419,307 | 145,878 |
| | | $ 939,382 | $ 161,915 |
Annual Report
Notes to Financial Statements - continued
5. Fees and Other Transactions with Affiliates - continued
Sales Load. FDC may receive a front-end sales charge of up to 5.75% for selling Class A shares and 3.50% for selling Class T shares, some of which is paid to financial intermediaries for selling shares of the Fund. Depending on the holding period, FDC may receive contingent deferred sales charges levied on Class A, Class T, Class B, and Class C redemptions. The deferred sales charges range from 5.00% to 1.00% for Class B shares, 1.00% for Class C shares, 1.00% for certain purchases of Class A shares and .25% for certain purchases of Class T shares.
For the period, sales charge amounts retained by FDC were as follows:
| Retained
by FDC |
Class A | $ 94,764 |
Class T | 15,334 |
Class BA | 413 |
Class CA | 7,496 |
| $ 118,007 |
A When Class B and Class C shares are initially sold, FDC pays commissions from its own resources to financial intermediaries through which the sales are made.
Transfer Agent Fees. Fidelity Investments Institutional Operations Company, Inc., (FIIOC), an affiliate of the investment adviser, is the transfer, dividend disbursing and shareholder servicing agent for each class of the Fund. FIIOC receives account fees and asset-based fees that vary according to the account size and type of account of the shareholders of the respective classes of the Fund, except for Class Z. FIIOC receives an asset-based fee of Class Z's average net assets. FIIOC pays for typesetting, printing and mailing of shareholder reports, except proxy statements.
For the period, transfer agent fees for each class were as follows:
| Amount | % of
Class-Level Average
Net Assets |
Class A | $ 327,480 | .22 |
Class T | 80,017 | .29 |
Class B | 2,930 | .27 |
Class C | 115,354 | .27 |
International Growth | 1,419,079 | .18 |
Class I | 357,209 | .19 |
Class Z | 86 | .05 |
| $ 2,302,155 | |
Annual Report
5. Fees and Other Transactions with Affiliates - continued
Accounting and Security Lending Fees. Fidelity Service Company, Inc. (FSC), an affiliate of the investment adviser, maintains the Fund's accounting records. The accounting fee is based on the level of average net assets for each month. Under a separate contract, FSC administers the security lending program. The security lending fee is based on the number and duration of lending transactions.
Brokerage Commissions. The Fund placed a portion of its portfolio transactions with brokerage firms which are affiliates of the investment adviser. Brokerage commissions are included in net realized gain (loss) and change in net unrealized appreciation (depreciation) in the Statement of Operations. The commissions paid to these affiliated firms were $1,335 for the period.
6. Committed Line of Credit.
The Fund participates with other funds managed by the investment adviser or an affiliate in a $4.25 billion credit facility (the "line of credit") to be utilized for temporary or emergency purposes to fund shareholder redemptions or for other short-term liquidity purposes. The Fund has agreed to pay commitment fees on its pro-rata portion of the line of credit, which amounted to $1,622 and is reflected in Miscellaneous expenses on the Statement of Operations. During the period, the Fund did not borrow on this line of credit.
7. Security Lending.
The Fund lends portfolio securities through a lending agent from time to time in order to earn additional income. For equity securities, a lending agent is used and may loan securities to certain qualified borrowers, including Fidelity Capital Markets (FCM), a broker-dealer affiliated with the Fund. On the settlement date of the loan, the Fund receives collateral (in the form of U.S. Treasury obligations, letters of credit and/or cash) against the loaned securities and maintains collateral in an amount not less than 100% of the market value of the loaned securities during the period of the loan. The market value of the loaned securities is determined at the close of business of the Fund and any additional required collateral is delivered to the Fund on the next business day. The Fund or borrower may terminate the loan at any time, and if the borrower defaults on its obligation to return the securities loaned because of insolvency or other reasons, the Fund may apply collateral received from the borrower against the obligation. The Fund may experience delays and costs in recovering the securities loaned. Any cash collateral received is invested in the Fidelity Securities Lending Cash Central Fund. The value of loaned securities and cash collateral at period end are disclosed on the Fund's Statement of Assets and Liabilities. The value of securities loaned to FCM at period end was $2,824,892. Security lending income represents the income earned on investing cash
Annual Report
Notes to Financial Statements - continued
7. Security Lending - continued
collateral, less rebates paid to borrowers and any lending agent fees associated with the loan, plus any premium payments received for lending certain types of securities. Security lending income is presented in the Statement of Operations as a component of income from Fidelity Central Funds. Total security lending income during the period amounted to $197,556, including $7,864 from securities loaned to FCM.
8. Expense Reductions.
Commissions paid to certain brokers with whom the investment adviser, or its affiliates, places trades on behalf of the Fund include an amount in addition to trade execution, which may be rebated back to the Fund to offset certain expenses. This amount totaled $66,064 for the period. In addition, through arrangements with the Fund's custodian, credits realized as a result of certain uninvested cash balances were used to reduce the Fund's expenses. During the period, these credits reduced the Fund's custody expenses by $39.
In addition, during the period the investment adviser reimbursed and/or waived a portion of fund-level operating expenses in the amount of $5,134 and a portion of class-level operating expenses as follows:
| Amount |
Class A | $ 1,835 |
Class T | 148 |
Class B | 6 |
Class C | 454 |
International Growth | 11,998 |
Class I | 1,841 |
| $ 16,282 |
9. Distributions to Shareholders.
Distributions to shareholders of each class were as follows:
Years ended October 31, | 2015 | 2014 |
From net investment income | | |
Class A | $ 684,914 | $ 253,092 |
Class T | 29,128 | 40,595 |
International Growth | 5,239,951 | 2,051,403 |
Class I | 1,064,923 | 246,949 |
Class Z | 1,008 | 604 |
Total | $ 7,019,924 | $ 2,592,643 |
Annual Report
9. Distributions to Shareholders - continued
Years ended October 31, | 2015 | 2014 |
From net realized gain | | |
Class A | $ - | $ 66,995 |
Class T | - | 20,298 |
Class B | - | 1,337 |
Class C | - | 16,479 |
International Growth | - | 369,252 |
Class I | - | 38,992 |
Class Z | - | 88 |
Total | $ - | $ 513,441 |
10. Share Transactions.
Share transactions for each class were as follows and may contain automatic conversions between classes or exchanges between funds:
| Shares | Dollars |
Years ended October 31, | 2015 | 2014 | 2015 | 2014 |
Class A | | | | |
Shares sold | 9,298,452 | 6,584,484 | $ 105,707,223 | $ 72,326,606 |
Reinvestment of distributions | 60,570 | 27,068 | 669,298 | 291,793 |
Shares redeemed | (3,798,128) | (2,724,911) | (42,982,992) | (30,099,985) |
Net increase (decrease) | 5,560,894 | 3,886,641 | $ 63,393,529 | $ 42,518,414 |
Class T | | | | |
Shares sold | 1,158,910 | 834,072 | $ 13,286,739 | $ 9,114,198 |
Reinvestment of distributions | 2,593 | 5,459 | 28,654 | 58,733 |
Shares redeemed | (1,005,399) | (585,464) | (11,627,373) | (6,459,248) |
Net increase (decrease) | 156,104 | 254,067 | $ 1,688,020 | $ 2,713,683 |
Class B | | | | |
Shares sold | 30,282 | 35,020 | $ 347,009 | $ 380,789 |
Reinvestment of distributions | - | 123 | - | 1,323 |
Shares redeemed | (87,349) | (53,583) | (994,341) | (587,919) |
Net increase (decrease) | (57,067) | (18,440) | $ (647,332) | $ (205,807) |
Class C | | | | |
Shares sold | 2,689,800 | 1,827,859 | $ 30,433,427 | $ 19,884,401 |
Reinvestment of distributions | - | 1,498 | - | 16,049 |
Shares redeemed | (991,400) | (426,678) | (10,978,888) | (4,637,384) |
Net increase (decrease) | 1,698,400 | 1,402,679 | $ 19,454,539 | $ 15,263,066 |
International Growth | | | | |
Shares sold | 39,705,804 | 27,835,093 | $ 456,131,993 | $ 307,440,711 |
Reinvestment of distributions | 387,169 | 197,948 | 4,301,448 | 2,143,781 |
Shares redeemed | (14,942,156) | (10,494,762) | (169,380,325) | (115,997,211) |
Net increase (decrease) | 25,150,817 | 17,538,279 | $ 291,053,116 | $ 193,587,281 |
Annual Report
Notes to Financial Statements - continued
10. Share Transactions - continued
| Shares | Dollars |
Years ended October 31, | 2015 | 2014 | 2015 | 2014 |
Class I | | | | |
Shares sold | 17,728,493 | 10,292,704 | $ 201,877,753 | $ 113,864,505 |
Reinvestment of distributions | 92,582 | 24,180 | 1,026,733 | 261,623 |
Shares redeemed | (5,227,430) | (2,927,192) | (58,733,231) | (31,428,962) |
Net increase (decrease) | 12,593,645 | 7,389,692 | $ 144,171,255 | $ 82,697,166 |
Class Z | | | | |
Shares sold | 88,007 | - | $ 956,120 | $ - |
Reinvestment of distributions | 91 | 64 | 1,008 | 692 |
Shares redeemed | (18,621) | (475) | (208,779) | (5,267) |
Net increase (decrease) | 69,477 | (411) | $ 748,349 | $ (4,575) |
11. Other.
The Fund's organizational documents provide former and current trustees and officers with a limited indemnification against liabilities arising in connection with the performance of their duties to the Fund. In the normal course of business, the Fund may also enter into contracts that provide general indemnifications. The Fund's maximum exposure under these arrangements is unknown as this would be dependent on future claims that may be made against the Fund. The risk of material loss from such claims is considered remote.
Annual Report
To the Trustees of Fidelity Investment Trust and the Shareholders of Fidelity International Growth Fund:
In our opinion, the accompanying statement of assets and liabilities, including the schedule of investments, and the related statements of operations and of changes in net assets and the financial highlights present fairly, in all material respects, the financial position of Fidelity International Growth Fund (a fund of Fidelity Investment Trust) at October 31, 2015, the results of its operations for the year then ended, the changes in its net assets for each of the two years in the period then ended and the financial highlights for each of the periods indicated, in conformity with accounting principles generally accepted in the United States of America. These financial statements and financial highlights (hereafter referred to as "financial statements") are the responsibility of the Fidelity International Growth Fund's management. Our responsibility is to express an opinion on these financial statements based on our audits. We conducted our audits of these financial statements in accordance with the standards of the Public Company Accounting Oversight Board (United States). Those standards require that we plan and perform the audit to obtain reasonable assurance about whether the financial statements are free of material misstatement. An audit includes examining, on a test basis, evidence supporting the amounts and disclosures in the financial statements, assessing the accounting principles used and significant estimates made by management, and evaluating the overall financial statement presentation. We believe that our audits, which included confirmation of securities at October 31, 2015 by correspondence with the custodian and brokers, provide a reasonable basis for our opinion.
PricewaterhouseCoopers LLP
Boston, Massachusetts
December 16, 2015
Annual Report
The Trustees, Member of the Advisory Board, and officers of the trust and fund, as applicable, are listed below. The Board of Trustees governs the fund and is responsible for protecting the interests of shareholders. The Trustees are experienced executives who meet periodically throughout the year to oversee the fund's activities, review contractual arrangements with companies that provide services to the fund, oversee management of the risks associated with such activities and contractual arrangements, and review the fund's performance. Each of the Trustees oversees 170 funds.
The Trustees hold office without limit in time except that (a) any Trustee may resign; (b) any Trustee may be removed by written instrument, signed by at least two-thirds of the number of Trustees prior to such removal; (c) any Trustee who requests to be retired or who has become incapacitated by illness or injury may be retired by written instrument signed by a majority of the other Trustees; and (d) any Trustee may be removed at any special meeting of shareholders by a two-thirds vote of the outstanding voting securities of the trust. Each Trustee who is not an interested person (as defined in the 1940 Act) of the trust and the fund (Independent Trustee), shall retire not later than the last day of the calendar year in which his or her 75th birthday occurs. The Independent Trustees may waive this mandatory retirement age policy with respect to individual Trustees. The officers and Advisory Board Member hold office without limit in time, except that any officer and Advisory Board Member may resign or may be removed by a vote of a majority of the Trustees at any regular meeting or any special meeting of the Trustees. Except as indicated, each individual has held the office shown or other offices in the same company for the past five years.
Experience, Skills, Attributes, and Qualifications of the Fund's Trustees. The Governance and Nominating Committee has adopted a statement of policy that describes the experience, qualifications, attributes, and skills that are necessary and desirable for potential Independent Trustee candidates (Statement of Policy). The Board believes that each Trustee satisfied at the time he or she was initially elected or appointed a Trustee, and continues to satisfy, the standards contemplated by the Statement of Policy. The Governance and Nominating Committee also engages professional search firms to help identify potential Independent Trustee candidates who have the experience, qualifications, attributes, and skills consistent with the Statement of Policy. From time to time, additional criteria based on the composition and skills of the current Independent Trustees, as well as experience or skills that may be appropriate in light of future changes to board composition, business conditions, and regulatory or other developments, have also been considered by the professional search firms and the Governance and Nominating Committee. In addition, the Board takes into account the Trustees' commitment and participation in Board and committee meetings, as well as their leadership of standing and ad hoc committees throughout their tenure.
In determining that a particular Trustee was and continues to be qualified to serve as a Trustee, the Board has considered a variety of criteria, none of which, in isolation, was controlling. The Board believes that, collectively, the Trustees have balanced and diverse experience, qualifications, attributes, and skills, which allow the Board to operate effectively in governing the fund and protecting the interests of shareholders. Information about the specific experience, skills, attributes, and qualifications of each Trustee, which in each case led to the Board's conclusion that the Trustee should serve (or continue to serve) as a trustee of the fund, is provided below.
Annual Report
Trustees and Officers - continued
Board Structure and Oversight Function. James C. Curvey is an interested person (as defined in the 1940 Act) and currently serves as Chairman. The Trustees have determined that an interested Chairman is appropriate and benefits shareholders because an interested Chairman has a personal and professional stake in the quality and continuity of services provided to the fund. Independent Trustees exercise their informed business judgment to appoint an individual of their choosing to serve as Chairman, regardless of whether the Trustee happens to be independent or a member of management. The Independent Trustees have determined that they can act independently and effectively without having an Independent Trustee serve as Chairman and that a key structural component for assuring that they are in a position to do so is for the Independent Trustees to constitute a substantial majority for the Board. The Independent Trustees also regularly meet in executive session. Ned C. Lautenbach serves as Chairman of the Independent Trustees and as such (i) acts as a liaison between the Independent Trustees and management with respect to matters important to the Independent Trustees and (ii) with management prepares agendas for Board meetings.
Fidelity funds are overseen by different Boards of Trustees. The fund's Board oversees Fidelity's high income and certain equity funds, and other Boards oversee Fidelity's investment-grade bond, money market, asset allocation, and sector funds. The asset allocation funds may invest in Fidelity funds overseen by the fund's Board. The use of separate Boards, each with its own committee structure, allows the Trustees of each group of Fidelity funds to focus on the unique issues of the funds they oversee, including common research, investment, and operational issues. On occasion, the separate Boards establish joint committees to address issues of overlapping consequences for the Fidelity funds overseen by each Board.
The Trustees operate using a system of committees to facilitate the timely and efficient consideration of all matters of importance to the Trustees, the fund, and fund shareholders and to facilitate compliance with legal and regulatory requirements and oversight of the fund's activities and associated risks. The Board, acting through its committees, has charged FMR and its affiliates with (i) identifying events or circumstances the occurrence of which could have demonstrably adverse effects on the fund's business and/or reputation; (ii) implementing processes and controls to lessen the possibility that such events or circumstances occur or to mitigate the effects of such events or circumstances if they do occur; and (iii) creating and maintaining a system designed to evaluate continuously business and market conditions in order to facilitate the identification and implementation processes described in (i) and (ii) above. Because the day-to-day operations and activities of the fund are carried out by or through FMR, its affiliates and other service providers, the fund's exposure to risks is mitigated but not eliminated by the processes overseen by the Trustees. While each of the Board's committees has responsibility for overseeing different aspects of the fund's activities, oversight is exercised primarily through the Operations, Audit, and Compliance Committees. In addition, the Independent Trustees have worked with FMR to enhance the Board's oversight of investment and financial risks, legal and regulatory risks, technology risks, and operational risks, including the development of additional risk reporting to the Board. For example, a working group comprised of Independent Trustees and FMR has worked and continues to work to review the Fidelity funds' valuation-related activities, reporting and risk management. Appropriate personnel, including but not limited to the fund's Chief Compliance Officer (CCO), FMR's internal auditor, the independent accountants, the fund's Treasurer and portfolio management personnel, make periodic reports to the Board's committees, as appropriate, including an annual review of Fidelity's risk management program for the Fidelity funds. The responsibilities of each standing committee, including their oversight responsibilities, are described further under "Standing Committees of the Fund's Trustees."
Annual Report
The fund's Statement of Additional Information (SAI) includes more information about the Trustees. To request a free copy, call Fidelity at 1-877-208-0098.
Interested Trustees*:
Correspondence intended for each Trustee who is an interested person may be sent to Fidelity Investments, 245 Summer Street, Boston, Massachusetts 02210.
Name, Year of Birth; Principal Occupations and Other Relevant Experience+ |
James C. Curvey (1935) |
Year of Election or Appointment: 2007 Trustee Chairman of the Board of Trustees |
| Mr. Curvey also serves as Trustee of other Fidelity funds. Mr. Curvey is a Director of Fidelity Research & Analysis Co. (investment adviser firm, 2009-present), and Vice Chairman (2007-present) and Director of FMR LLC (diversified financial services company). In addition, Mr. Curvey serves as an Overseer for the Boston Symphony Orchestra and a member of the board of Artis-Naples, Naples, Florida, and as a Trustee for Brewster Academy, Wolfeboro, New Hampshire. Previously, Mr. Curvey served as a Director of Fidelity Investments Money Management, Inc. (investment adviser firm, 2009-2014) and a Director of FMR and FMR Co., Inc. (investment adviser firms, 2007-2014). |
Charles S. Morrison (1960) |
Year of Election or Appointment: 2014 Trustee |
| Mr. Morrison also serves as Trustee of other funds. He serves as a Director of Fidelity Investments Money Management, Inc. (FIMM) (investment adviser firm, 2014-present), Director of Fidelity SelectCo, LLC (investment adviser firm, 2014-present), President, Asset Management (2014-present), and is an employee of Fidelity Investments. Previously, Mr. Morrison served as Vice President of Fidelity's Fixed Income and Asset Allocation Funds (2012-2014), President, Fixed Income (2011-2014), Vice President of Fidelity's Money Market Funds (2005-2009), President, Money Market Group Leader of FMR (investment adviser firm, 2009), and Senior Vice President, Money Market Group of FMR (2004-2009). Mr. Morrison also served as Vice President of Fidelity's Bond Funds (2002-2005), certain Balanced Funds (2002-2005), and certain Asset Allocation Funds (2002-2007), and as Senior Vice President (2002-2005) of Fidelity's Bond Division. |
* Trustees have been determined to be "Interested Trustees" by virtue of, among other things, their affiliation with the trust or various entities under common control with FMR.
+ The information above includes each Trustee's principal occupation during the last five years and other information relating to the experience, attributes, and skills relevant to each Trustee's qualifications to serve as a Trustee, which led to the conclusion that each Trustee should serve as a Trustee for the fund.
Annual Report
Independent Trustees:
Correspondence intended for each Independent Trustee (that is, the Trustees other than the Interested Trustees) may be sent to Fidelity Investments, P.O. Box 55235, Boston, Massachusetts 02205-5235.
Name, Year of Birth; Principal Occupations and Other Relevant Experience+ |
Dennis J. Dirks (1948) |
Year of Election or Appointment: 2005 Trustee |
| Mr. Dirks also serves as Trustee of other Fidelity funds. Prior to his retirement in May 2003, Mr. Dirks was Chief Operating Officer and a member of the Board of The Depository Trust & Clearing Corporation (DTCC). He also served as President, Chief Operating Officer, and Board member of The Depository Trust Company (DTC) and President and Board member of the National Securities Clearing Corporation (NSCC). In addition, Mr. Dirks served as Chief Executive Officer and Board member of the Government Securities Clearing Corporation, Chief Executive Officer and Board member of the Mortgage-Backed Securities Clearing Corporation, as a Trustee and a member of the Finance Committee of Manhattan College (2005-2008), as a Trustee and a member of the Finance Committee of AHRC of Nassau County (2006-2008), and as a member of the Independent Directors Council (IDC) Governing Council (2010-2015). Mr. Dirks is a member of the Board of Directors for The Brookville Center for Children's Services, Inc. (2009-present). |
Alan J. Lacy (1953) |
Year of Election or Appointment: 2008 Trustee |
| Mr. Lacy also serves as Trustee of other Fidelity funds. Mr. Lacy serves as a member of the Board of Directors of Dave & Buster's Entertainment, Inc. (restaurant and entertainment complexes, 2010-present) and Bristol-Myers Squibb Company (global pharmaceuticals, 2008-present). In addition, Mr. Lacy served as Senior Adviser (2007-2014) of Oak Hill Capital Partners, L.P. (private equity) and also served as Chief Executive Officer (2000-2005) and Vice Chairman (2005-2006) of Sears Holdings Corporation and Sears, Roebuck and Co. (retail). Mr. Lacy is a member of the Board of Trustees of The National Parks Conservation Association (2006-present). Previously, Mr. Lacy served as Chairman of the Board of Trustees of the National Parks Conservation Association (2008-2011) and as a member of the Board of Directors for The Western Union Company (global money transfer, 2006-2011), The Hillman Companies, Inc. (hardware wholesalers, 2010-2014), and Earth Fare, Inc. (retail grocery, 2010-2014). |
Ned C. Lautenbach (1944) |
Year of Election or Appointment: 2000 Trustee Chairman of the Independent Trustees |
| Mr. Lautenbach also serves as Trustee of other Fidelity funds. Mr. Lautenbach currently serves as the Lead Director of the Eaton Corporation Board of Directors (diversified industrial, 1997-present). Mr. Lautenbach is Chairman of the Board of Directors of Artis-Naples in Naples, Florida (2012-present), a member of the Council on Foreign Relations (1994-present), and a member of the Board of Governors, State University System of Florida (2013-present). Previously, Mr. Lautenbach was a Partner/Advisory Partner at Clayton, Dubilier & Rice, LLC (private equity investment, 1998-2010), as well as a Director of Sony Corporation (2006-2007). |
Joseph Mauriello (1944) |
Year of Election or Appointment: 2008 Trustee |
| Mr. Mauriello also serves as Trustee of other Fidelity funds. Prior to his retirement in January 2006, Mr. Mauriello served in numerous senior management positions including Deputy Chairman and Chief Operating Officer (2004-2005), and Vice Chairman of Financial Services (2002-2004) of KPMG LLP US (professional services, 1965-2005). Mr. Mauriello currently serves as a member of the Board of Directors of XL Group plc. (global insurance and re-insurance, 2006-present) and the Independent Directors Council (IDC) Governing Council (2015-present). Previously, Mr. Mauriello served as a Director of the Hamilton Funds of the Bank of New York (2006-2007) and of Arcadia Resources Inc. (health care services and products, 2007-2012). |
Robert W. Selander (1950) |
Year of Election or Appointment: 2011 Trustee |
| Mr. Selander also serves as Trustee of other Fidelity funds. Mr. Selander serves as a Director of The Western Union Company (global money transfer, 2014-present). Previously, Mr. Selander served as a Member of the Advisory Board of other Fidelity funds (2011), and Executive Vice Chairman (2010), Chief Executive Officer (2009-2010), and President and Chief Executive Officer (1997-2009) of Mastercard, Inc. |
Cornelia M. Small (1944) |
Year of Election or Appointment: 2005 Trustee |
| Ms. Small also serves as Trustee of other Fidelity funds. Ms. Small is a member of the Board of Directors (2009-present) and Chair of the Investment Committee (2010-present) of the Teagle Foundation. Ms. Small also serves on the Investment Committee of the Berkshire Taconic Community Foundation (2008-present). Previously, Ms. Small served as Chairperson (2002-2008) and a member of the Investment Committee and Chairperson (2008-2012) and a member of the Board of Trustees of Smith College. In addition, Ms. Small served as Chief Investment Officer, Director of Global Equity Investments, and a member of the Board of Directors of Scudder, Stevens & Clark and Scudder Kemper Investments. |
William S. Stavropoulos (1939) |
Year of Election or Appointment: 2001 Trustee Vice Chairman of the Independent Trustees |
| Mr. Stavropoulos also serves as Trustee of other Fidelity funds. Mr. Stavropoulos serves as President and Founder of the Michigan Baseball Foundation, the Great Lakes Loons (2007-present). Mr. Stavropoulos is Chairman Emeritus of the Board of Directors of The Dow Chemical Company, where he previously served in numerous senior management positions, including President, CEO (1995-2000; 2002-2004), Chairman of the Executive Committee (2000-2006), and as a member of the Board of Directors (1990-2006). Currently, Mr. Stavropoulos is Chairman of the Board of Directors of Univar Inc. (global distributor of commodity and specialty chemicals), a Director of Teradata Corporation (data warehousing and technology solutions), and Maersk Inc. (industrial conglomerate), and a member of the Advisory Board for Metalmark Capital LLC (private equity investment, 2005-present). Mr. Stavropoulos is an operating advisor to Clayton, Dubilier & Rice, LLC (private equity investment). In addition, Mr. Stavropoulos is a member of the University of Notre Dame Advisory Council for the College of Science, a Trustee of the Rollin L. Gerstacker Foundation, and a Director of the Naples Philharmonic Center for the Arts. Previously, Mr. Stavropoulos served as a Director of Chemical Financial Corporation (bank holding company, 1993-2012) and Tyco International, Ltd. (multinational manufacturing and services, 2007-2012). |
David M. Thomas (1949) |
Year of Election or Appointment: 2008 Trustee |
| Mr. Thomas also serves as Trustee of other Fidelity funds. Mr. Thomas serves as Non-Executive Chairman of the Board of Directors of Fortune Brands Home and Security (home and security products, 2011-present), as a member of the Board of Directors (2004-present) and Presiding Director (2013-present) of Interpublic Group of Companies, Inc. (marketing communication), and as a member of the Board of Trustees of the University of Florida (2013-present). Previously, Mr. Thomas served as Executive Chairman (2005-2006) and Chairman and Chief Executive Officer (2000-2005) of IMS Health, Inc. (pharmaceutical and healthcare information solutions), and a Director of Fortune Brands, Inc. (consumer products, 2000-2011). |
+ The information above includes each Trustee's principal occupation during the last five years and other information relating to the experience, attributes, and skills relevant to each Trustee's qualifications to serve as a Trustee, which led to the conclusion that each Trustee should serve as a Trustee for the fund.
Advisory Board Member and Officers:
Correspondence intended for each officer and Peter S. Lynch may be sent to Fidelity Investments, 245 Summer Street, Boston, Massachusetts 02210. Officers appear below in alphabetical order.
Name, Year of Birth; Principal Occupation |
Peter S. Lynch (1944) |
Year of Election or Appointment: 2003 Member of the Advisory Board |
| Mr. Lynch also serves as Member of the Advisory Board of other Fidelity funds. Mr. Lynch is Vice Chairman and a Director of FMR (investment adviser firm) and FMR Co., Inc. (investment adviser firm). In addition, Mr. Lynch serves as a Trustee of Boston College and as the Chairman of the Inner-City Scholarship Fund. Previously, Mr. Lynch served on the Special Olympics International Board of Directors (1997-2006). |
Elizabeth Paige Baumann (1968) |
Year of Election or Appointment: 2012 Anti-Money Laundering (AML) Officer |
| Ms. Baumann also serves as AML Officer of other funds. She is Chief AML Officer of FMR LLC (diversified financial services company, 2012-present) and is an employee of Fidelity Investments. Previously, Ms. Baumann served as Vice President and Deputy Anti-Money Laundering Officer (2007-2012). |
Marc R. Bryant (1966) |
Year of Election or Appointment: 2015 Secretary and Chief Legal Officer (CLO) |
| Mr. Bryant also serves as Secretary and CLO of other funds. Mr. Bryant serves as CLO, Secretary, and Senior Vice President of Fidelity Management & Research Company (investment adviser firm, 2015-present) and FMR Co., Inc. (investment adviser firm, 2015-present); Secretary of Fidelity SelectCo, LLC (investment adviser firm, 2015-present) and Fidelity Investments Money Management, Inc. (investment adviser firm, 2015-present); and CLO of Fidelity Management & Research (Hong Kong) Limited (investment adviser firm, 2015-present). He is Senior Vice President and Deputy General Counsel of FMR LLC (diversified financial services company). Previously, Mr. Bryant served as Secretary and Chief Legal Officer of Fidelity Rutland Square Trust II (2010-2014) and Assistant Secretary of Fidelity's Fixed Income and Asset Allocation Funds (2013-2015). Prior to joining Fidelity Investments, Mr. Bryant served as a Senior Vice President and the Head of Global Retail Legal for AllianceBernstein L.P. (2006-2010), and as the General Counsel for ProFund Advisors LLC (2001-2006). |
William C. Coffey (1969) |
Year of Election or Appointment: 2009 Assistant Secretary |
| Mr. Coffey also serves as Assistant Secretary of other funds. He is Senior Vice President and Deputy General Counsel of FMR LLC (diversified financial services company, 2010-present), and is an employee of Fidelity Investments. Previously, Mr. Coffey served as Vice President and Associate General Counsel of FMR LLC (2005-2009). |
Timothy M. Cohen (1969) |
Year of Election or Appointment: 2014 Vice President of certain Equity Funds |
| Mr. Cohen also serves as Vice President of other funds. Mr. Cohen serves as Chief Compliance Officer of FMR Investment Management (U.K.) Limited (investment adviser firm, 2013-present) and is an employee of Fidelity Investments. Previously, Mr. Cohen served as a Director of FMR Investment Management (U.K.) Limited (2013-2015). |
Jonathan Davis (1968) |
Year of Election or Appointment: 2010 Assistant Treasurer |
| Mr. Davis also serves as Assistant Treasurer of other funds, and is an employee of Fidelity Investments. Previously, Mr. Davis served as Vice President and Associate General Counsel of FMR LLC (diversified financial services company, 2003-2010). |
Adrien E. Deberghes (1967) |
Year of Election or Appointment: 2008 Deputy Treasurer |
| Mr. Deberghes also serves as an officer of other funds. He is an employee of Fidelity Investments (2008-present). Prior to joining Fidelity Investments, Mr. Deberghes was Senior Vice President of Mutual Fund Administration at State Street Corporation (2007-2008), Senior Director of Mutual Fund Administration at Investors Bank & Trust (2005-2007), and Director of Finance for Dunkin' Brands (2000-2005). |
Stephanie J. Dorsey (1969) |
Year of Election or Appointment: 2010 Assistant Treasurer |
| Ms. Dorsey also serves as an officer of other funds. She is an employee of Fidelity Investments (2008-present) and has served in other fund officer roles. Prior to joining Fidelity Investments, Ms. Dorsey served as Treasurer (2004-2008) of the JPMorgan Mutual Funds and Vice President (2004-2008) of JPMorgan Chase Bank. |
Howard J. Galligan III (1966) |
Year of Election or Appointment: 2014 Chief Financial Officer |
| Mr. Galligan also serves as Chief Financial Officer of other funds. Mr. Galligan serves as President of Fidelity Pricing and Cash Management Services (FPCMS) (2014-present) and as a Director of Strategic Advisers, Inc. (investment adviser firm, 2008-present). Previously, Mr. Galligan served as Chief Administrative Officer of Asset Management (2011-2014) and Chief Operating Officer and Senior Vice President of Investment Support for Strategic Advisers, Inc. (2003-2011). |
Scott C. Goebel (1968) |
Year of Election or Appointment: 2015 Vice President |
| Mr. Goebel serves as Vice President of other funds and is an employee of Fidelity Investments (2001-present). Previously, Mr. Goebel served as Secretary of Fidelity SelectCo, LLC (investment adviser firm, 2013-2015), Fidelity Investments Money Management, Inc. (FIMM) (investment adviser firm, 2010-2015), and Fidelity Research and Analysis Company (FRAC) (investment adviser firm, 2010-2015); General Counsel, Secretary, and Senior Vice President of Fidelity Management & Research Company (investment adviser firm, 2008-2015) and FMR Co., Inc. (investment adviser firm, 2008-2015); Assistant Secretary of Fidelity Management & Research (Japan) Limited (investment adviser firm, 2008-2015) and FMR Investment Management (U.K.) Limited (investment adviser firm, 2008-2015); Chief Legal Officer (CLO) of Fidelity Management & Research (Hong Kong) Limited (investment adviser firm, 2008-2015); Secretary and CLO of certain Fidelity funds (2008-2015); Assistant Secretary of FIMM (2008-2010), FRAC (2008-2010), and certain funds (2007-2008); and as Vice President and Secretary of Fidelity Distributors Corporation (FDC) (2005-2007). |
Brian B. Hogan (1964) |
Year of Election or Appointment: 2009 Vice President |
| Mr. Hogan also serves as Trustee or Vice President of other funds. Mr. Hogan serves as a Director of Fidelity SelectCo, LLC (investment adviser firm, 2014-present) and President of the Equity Division of FMR (investment adviser firm, 2009-present). Previously, Mr. Hogan served as Senior Vice President, Equity Research of FMR (2006-2009) and as a portfolio manager. |
Chris Maher (1972) |
Year of Election or Appointment: 2013 Assistant Treasurer |
| Mr. Maher serves as Assistant Treasurer of other funds. Mr. Maher is Vice President of Valuation Oversight and is an employee of Fidelity Investments. Previously, Mr. Maher served as Vice President of Asset Management Compliance (2013), Vice President of the Program Management Group of FMR (investment adviser firm, 2010-2013), and Vice President of Valuation Oversight (2008-2010). |
Kenneth B. Robins (1969) |
Year of Election or Appointment: 2008 President and Treasurer |
| Mr. Robins also serves as an officer of other funds. Mr. Robins serves as Executive Vice President of Fidelity Investments Money Management, Inc. (FIMM) (investment adviser firm, 2013-present) and is an employee of Fidelity Investments (2004-present). Previously, Mr. Robins served in other fund officer roles. |
Stacie M. Smith (1974) |
Year of Election or Appointment: 2013 Deputy Treasurer |
| Ms. Smith also serves as an officer of other funds. She is an employee of Fidelity Investments (2009-present) and has served in other fund officer roles. Prior to joining Fidelity Investments, Ms. Smith served as Senior Audit Manager of Ernst & Young LLP (1996-2009). |
Renee Stagnone (1975) |
Year of Election or Appointment: 2013 Deputy Treasurer |
| Ms. Stagnone also serves as Deputy Treasurer of other funds. Ms. Stagnone is an employee of Fidelity Investments (1997-present). |
Linda J. Wondrack (1964) |
Year of Election or Appointment: 2014 Chief Compliance Officer |
| Ms. Wondrack also serves as Chief Compliance Officer of other funds. Ms. Wondrack is Executive Vice President and head of the Ethics Office and Asset Management Compliance for Fidelity Investments (2012-present). Ms. Wondrack also serves as Chief Compliance Officer of Fidelity SelectCo, LLC (investment adviser firm, 2014-present); Chief Compliance Officer of Impresa Management LLC (2013-present); and Chief Compliance Officer of FMR Co., Inc. (investment adviser firm), Fidelity Investments Money Management, Inc. (investment adviser firm), Fidelity Management & Research (Japan) Limited (investment adviser firm), FMR Investment Management (U.K.) Limited (investment adviser firm), Fidelity Management & Research (Hong Kong) (investment adviser firm), Fidelity Management & Research Company (investment adviser firm), FIAM LLC (investment adviser firm), and Strategic Advisers, Inc. (investment adviser firm), Ballyrock Investment Advisors LLC, and Northern Neck Investors LLC (2012-present). Previously, Ms. Wondrack served as Senior Vice President and Chief Compliance Officer for Columbia Management Investment Advisers, LLC (2005-2012); Chief Compliance Officer for certain funds within the Columbia Family of Funds (2007-2012); and Senior Vice President of Compliance Risk Management at Bank of America (2005-2010). |
Joseph F. Zambello (1957) |
Year of Election or Appointment: 2011 Deputy Treasurer |
| Mr. Zambello also serves as Deputy Treasurer of other funds. Mr. Zambello is an employee of Fidelity Investments (1991-present). Previously, Mr. Zambello served as Vice President of the Program Management Group of FMR (investment adviser firm, 2009-2011) and Vice President of the Transfer Agent Oversight Group (2005-2009). |
Annual Report
The Board of Trustees of Fidelity International Growth Fund voted to pay to shareholders of record at the opening of business on record date, the following distributions per share derived from capital gains realized from sales of portfolio securities, and dividends derived from net investment income:
| Pay Date | Record Date | Dividends | Capital Gains |
Class Z | 12/07/15 | 12/04/15 | $0.094 | $0.008 |
Class Z designates 12% of the dividends distributed during the fiscal year as qualifying for the dividends-received deduction for corporate shareholders.
Class Z designates 100% of the dividends distributed in December during the fiscal year as amounts which may be taken into account as a dividend for purposes of the maximum rate under section 1(h)(11) of the Internal Revenue Code.
The amounts per share which represent income derived from sources within, and taxes paid to, foreign countries or possessions of the United States are as follows:
| Pay Date | Income | Taxes |
Class Z | 12/08/2014 | $0.1178 | $0.0098 |
The fund will notify shareholders in January 2016 of amounts for use in preparing 2015 income tax returns.
Annual Report
Fidelity International Growth Fund
Each year, the Board of Trustees, including the Independent Trustees (together, the Board), votes on the renewal of the management contract with Fidelity Management & Research Company (FMR) and the sub-advisory agreements (together, the Advisory Contracts) for the fund. The Board, assisted by the advice of fund counsel and Independent Trustees' counsel, requests and considers a broad range of information relevant to the renewal of the Advisory Contracts throughout the year.
The Board meets regularly and, at each of its meetings, covers an extensive agenda of topics and materials and considers factors that are relevant to its annual consideration of the renewal of the fund's Advisory Contracts, including the services and support provided to the fund and its shareholders. The Board has established various standing committees (Committees), each composed of and chaired by Independent Trustees with varying backgrounds, to which the Board has assigned specific subject matter responsibilities in order to enhance effective decision-making by the Board. The Board, acting directly and through its Committees, requests and receives information concerning the annual consideration of the renewal of the fund's Advisory Contracts. The Board also meets as needed to consider matters specifically related to the Board's annual consideration of the renewal of the Advisory Contracts. Members of the Board may also meet with trustees of other Fidelity funds through ad hoc joint committees to discuss certain matters relevant to all of the Fidelity funds.
At its July 2015 meeting, the Board unanimously determined to renew the fund's Advisory Contracts. In reaching its determination, the Board considered all factors it believed relevant, including (i) the nature, extent, and quality of the services to be provided to the fund and its shareholders (including the investment performance of the fund); (ii) the competitiveness of the fund's management fee and total expense ratio relative to peer funds; (iii) the total costs of the services to be provided by and the profits to be realized by Fidelity from its relationship with the fund; and (iv) the extent to which (if any) economies of scale exist and would be realized as the fund grows, and whether any economies of scale are appropriately shared with fund shareholders.
In considering whether to renew the Advisory Contracts for the fund, the Board reached a determination, with the assistance of fund counsel and Independent Trustees' counsel and through the exercise of its business judgment, that the renewal of the Advisory Contracts was in the best interests of the fund and its shareholders and that the compensation payable under the Advisory Contracts was fair and reasonable. The Board's decision to renew the Advisory Contracts was not based on any single factor, but rather was based on a comprehensive consideration of all the information provided to the Board at its meetings throughout the year. The Board, in reaching its determination to renew the Advisory Contracts, was aware that shareholders of the fund have a broad range of investment choices available to them, including a wide choice among funds offered by Fidelity's competitors, and that the fund's shareholders, who have the opportunity to review and weigh the disclosure provided by the fund in its prospectus and other public disclosures, have chosen to invest in this fund, which is part of the Fidelity family of funds.
Annual Report
Board Approval of Investment Advisory Contracts and
Management Fees - continued
Nature, Extent, and Quality of Services Provided. The Board considered Fidelity's staffing as it relates to the fund, including the backgrounds of investment personnel of Fidelity, and also considered the fund's investment objective, strategies, and related investment philosophy. The Independent Trustees also had discussions with senior management of Fidelity's investment operations and investment groups. The Board considered the structure of the portfolio manager compensation program and whether this structure provides appropriate incentives to act in the best interests of the fund. Additionally, the Board considered the portfolio managers' investments, if any, in the funds that they manage.
Resources Dedicated to Investment Management and Support Services. The Board and the Fund Oversight and Research Committees reviewed the general qualifications and capabilities of Fidelity's investment staff, including its size, education, experience, and resources, as well as Fidelity's approach to recruiting, training, managing, and compensating investment personnel. The Board noted that Fidelity has continued to increase the resources devoted to non-U.S. offices, including expansion of Fidelity's global investment organization. The Board also noted that Fidelity's analysts have extensive resources, tools and capabilities that allow them to conduct sophisticated quantitative and fundamental analysis, as well as credit analysis of issuers, counterparties and guarantors. Further, the Board considered that Fidelity's investment professionals have sufficient access to global information and data so as to provide competitive investment results over time, and that those professionals also have access to sophisticated tools that permit them to assess portfolio construction and risk and performance attribution characteristics continuously, as well as to transmit new information and research conclusions rapidly around the world. Additionally, in its deliberations, the Board considered Fidelity's trading, risk management, and compliance capabilities and resources, which are integral parts of the investment management process.
Shareholder and Administrative Services. The Board considered (i) the nature, extent, quality, and cost of advisory, administrative, and shareholder services performed by FMR, the sub-advisers (together with FMR, the Investment Advisers), and their affiliates under the Advisory Contracts and under separate agreements covering transfer agency, pricing and bookkeeping, and securities lending services for the fund; (ii) the nature and extent of the supervision of third party service providers, principally custodians and subcustodians; and (iii) the resources devoted to, and the record of compliance with, the fund's compliance policies and procedures. The Board also reviewed the allocation of fund brokerage, including allocations to brokers affiliated with the Investment Advisers, the use of brokerage commissions to pay fund expenses, and the use of "soft" commission dollars to pay for research services.
Annual Report
The Board noted that the growth of fund assets over time across the complex allows Fidelity to reinvest in the development of services designed to enhance the value or convenience of the Fidelity funds as investment vehicles. These services include 24-hour access to account information and market information through telephone representatives and over the Internet, investor education materials and asset allocation tools, and the expanded availability of Fidelity Investor Centers.
In 2014, the Board formed an ad hoc Committee on Transfer Agency Fees to review the variety of transfer agency fee structures throughout the industry and Fidelity's competitive positioning with respect to industry participants.
Investment in a Large Fund Family. The Board considered the benefits to shareholders of investing in a Fidelity fund, including the benefits of investing in a fund that is part of a large family of funds offering a variety of investment disciplines and providing a large variety of mutual fund investor services. The Board noted that Fidelity had taken, or had made recommendations that resulted in the Fidelity funds taking, a number of actions over the previous year that benefited particular funds, including (i) continuing to dedicate additional resources to investment research and to the support of the senior management team that oversees asset management; (ii) continuing efforts to enhance Fidelity's global research capabilities; (iii) launching new funds and making other enhancements to meet client needs; (iv) reducing management fees and total expenses for certain index funds and diversified international funds; (v) continuing to launch dedicated lower cost underlying funds to meet portfolio construction needs related to expanding underlying fund options for Fidelity funds of funds, specifically for the Freedom Fund product lines; (vi) rationalizing product lines and gaining increased efficiencies through fund mergers; (vii) launching active fixed-income exchange-traded funds; (viii) continuing to develop, acquire and implement systems and technology to improve services to the funds and information security and to increase efficiency; (ix) implementing investment enhancements to further strengthen Fidelity's target date product line to increase investors' probability of success in achieving their goals; (x) modifying the eligibility criteria for certain share classes to accommodate roll-over assets from employer-sponsored retirement plans; (xi) launching a new Class W of the Freedom Index Funds to attract and retain Fidelity record-kept retirement plan assets; and (xii) implementing changes to Fidelity's money market product line in response to recent money market regulatory reforms.
Investment Performance. The Board considered whether the fund has operated in accordance with its investment objective, as well as its record of compliance with its investment restrictions and its performance history.
Annual Report
Board Approval of Investment Advisory Contracts and
Management Fees - continued
The Board took into account discussions with representatives of the Investment Advisers about fund investment performance that occur at Board meetings throughout the year. In this regard the Board noted that as part of regularly scheduled fund reviews and other reports to the Board on fund performance, the Board considers annualized return information for the fund, for different time periods, measured against a securities market index ("benchmark index") and a peer group of funds with similar objectives ("peer group"), if any. In its evaluation of fund investment performance, the Board gave particular attention to information indicating changes in performance of certain Fidelity funds for specific time periods and discussed with the Investment Advisers the reasons for any overperformance or underperformance.
In addition to reviewing absolute and relative fund performance, the Independent Trustees periodically consider the appropriateness of fund performance metrics in evaluating the results achieved. In general, the Independent Trustees believe that fund performance should be evaluated based on net performance (after fees and expenses) of both the highest performing and lowest performing fund share classes, where applicable, compared to appropriate benchmark indices, over appropriate time periods that may include full market cycles, and compared to peer groups, as applicable, over the same periods, taking into account relevant factors including the following: general market conditions; issuer-specific information; and fund cash flows and other factors.
The Independent Trustees recognize that shareholders evaluate performance on a net basis over their own holding periods, for which one-, three-, and five-year periods are often used as a proxy. For this reason, the performance information reviewed by the Board also included net cumulative calendar year total return information for the fund and an appropriate benchmark index and peer group for the most recent one-, three-, and five-year periods, as shown below. Returns are shown compared to the 25th percentile (top of box, 75% beaten) and 75th percentile (bottom of box, 25% beaten) of the peer universe. Returns of the benchmark index are "net MA," i.e., adjusted for tax withholding rates applicable to U.S.-based funds organized as Massachusetts business trusts.
Annual Report
Fidelity International Growth Fund

The Board also considered that the fund's management fee is subject to upward or downward adjustment depending upon whether, and to what extent, the fund's investment performance for the performance period exceeds, or is exceeded by, a securities index, thus leading to a performance adjustment for the same period. The Board noted that the performance adjustment provides FMR with a strong economic incentive to seek to achieve superior performance for the fund's shareholders and helps to more closely align the interests of FMR and the shareholders of the fund.
Based on its review, the Board concluded that the nature, extent, and quality of services provided to the fund under the Advisory Contracts should benefit the shareholders of the fund.
Competitiveness of Management Fee and Total Expense Ratio. The Board considered the fund's management fee and total expense ratio compared to "mapped groups" of competitive funds and classes created for the purpose of facilitating the Trustees' competitive analysis of management fees and total expenses. Fidelity creates "mapped groups" by combining similar Lipper investment objective categories that have comparable investment mandates. Combining Lipper investment objective categories aids the Board's management fee and total expense ratio comparisons by broadening the competitive group used for comparison.
Management Fee. The Board considered two proprietary management fee comparisons for the 12-month periods shown in basis points (BP) in the chart below. The group of Lipper funds used by the Board for management fee comparisons is referred to below as the "Total Mapped Group." The Total Mapped Group comparison focuses on a fund's standing in terms of gross management fees before expense reimbursements or caps, and without giving effect to the fund's performance adjustment, relative to the total universe of funds with comparable investment mandates, regardless of whether their management fee structures also are comparable. Funds with comparable investment mandates offer exposure to similar types of securities. Funds with comparable management fee structures have similar management fee contractual arrangements (e.g., flat rate charged for advisory services, all-inclusive fee rate, etc.). "TMG %" represents the percentage of funds in the Total Mapped Group that had management fees that were lower than the fund's. For example, a hypothetical TMG % of 20% would mean that 80% of the funds in the Total Mapped Group had higher, and 20% had lower, management fees than the fund. The fund's actual TMG %s and the number of funds in the Total Mapped Group are in the chart below. The "Asset-Size Peer Group" (ASPG) comparison focuses on a fund's standing relative to a subset of non-Fidelity funds within the Total Mapped Group that are similar in size and management fee structure without taking into account performance adjustments, if any. For example, if a fund is in the first quartile of the ASPG, the fund's management fee ranks in the least expensive or lowest 25% of funds in the ASPG. The ASPG represents at least 15% of the funds in the Total Mapped Group with comparable asset size and management fee structures, subject to a minimum of 50 funds (or all funds in the Total Mapped Group if fewer than 50). Additional information, such as the ASPG quartile in which the fund's management fee rate ranked and the impact of the fund's performance adjustment, is also included in the chart and considered by the Board.
Annual Report
Board Approval of Investment Advisory Contracts and
Management Fees - continued
Fidelity International Growth Fund

Annual Report
The Board noted that the fund's management fee rate ranked below the median of its Total Mapped Group and below the median of its ASPG for 2014. The Board also noted the effect of the fund's performance adjustment, if any, on the fund's management fee ranking.
The Board noted that, in 2014, the ad hoc Committee on Group Fee was formed by it and other Fidelity fund boards to conduct an in-depth review of the "group fee" component of the management fee of funds with such management fee structures. Committee focus included the mechanics of the group fee, the competitive landscape of group fee structures, Fidelity funds with no group fee component and investment products not included in group fee assets. The Board also considered that, for funds subject to the group fee, FMR agreed to voluntarily waive fees over a specified period of time in amounts designed to account for assets converted from certain funds to certain collective investment trusts.
The Board also noted that, in 2013, the ad hoc Committee on Management Fees was formed to conduct an in-depth review of the management fee rates of Fidelity's active equity mutual funds. The Committee focused on the following areas: (i) standard fee structures; (ii) research consumption and trading evolution; (iii) management fee competitiveness/profitability by category; and (iv) factors that drive institutional pricing.
Based on its review, the Board concluded that the fund's management fee is fair and reasonable in light of the services that the fund receives and the other factors considered.
Total Expense Ratio. In its review of each class's total expense ratio, the Board considered the fund's management fee as well as other fund or class expenses, as applicable, such as transfer agent fees, pricing and bookkeeping fees, fund-paid 12b-1 fees, and custodial, legal, and audit fees. The Board noted the impact of the fund's performance adjustment. The Board also noted that Fidelity may agree to waive fees and expenses from time to time, and the extent to which, if any, it has done so for the fund. As part of its review, the Board also considered the current and historical total expense ratios of each class of the fund compared to competitive fund median expenses. Each class of the fund is compared to those funds and classes in the Total Mapped Group (used by the Board for management fee comparisons) that have a similar sales load structure.
The Board noted that the total expense ratio of each of Class A, Class I, Class Z, and the retail class ranked below its competitive median for 2014 and the total expense ratio of each of Class T, Class B, and Class C ranked above its competitive median for 2014. The Board considered that, in general, various factors can affect total expense ratios. The Board noted that the total expense ratio of Class T was above the competitive median primarily because of higher 12b-1 fees on Class T as compared to most competitor funds. Class T has a higher 12b-1 fee, but a lower front-end sales charge, than traditionally priced front-end sales charge classes. The Board considered that Class T is primarily sold load-waived in the retirement plan market where its 0.50% 12b-1 fee is comparable to competing no-load, higher 12b-1 fee classes designed specifically for retirement plans. The Board noted that the fund offers multiple classes, each of which has a different sales load and 12b-1 fee structure, and that the multiple structures are intended to offer a range of pricing options for the intermediary market. The Board also noted that the total expense ratios of the classes vary primarily by the level of their 12b-1 fees, although differences in transfer agent fees may also cause expenses to vary from class to class.
Annual Report
Board Approval of Investment Advisory Contracts and
Management Fees - continued
The Board further considered that FMR contractually agreed to reimburse Class A, Class T, Class B, Class C, Class I, Class Z, and the retail class of the fund to the extent that total operating expenses (excluding interest, certain taxes, certain securities lending costs, brokerage commissions, extraordinary expenses, and acquired fund fees and expenses, if any), as a percentage of their respective average net assets, exceed 1.45%, 1.70%, 2.20%, 2.20%, 1.20%, 1.05%, and 1.20% through December 31, 2015.
Fees Charged to Other Fidelity Clients. The Board also considered Fidelity fee structures and other information with respect to clients of Fidelity, such as other funds advised or subadvised by Fidelity, pension plan clients, and other institutional clients with similar mandates. The Board noted the findings of the 2013 ad hoc joint committee (created with the board of other Fidelity funds), which reviewed and compared Fidelity's institutional investment advisory business with its business of providing services to the Fidelity funds, including the differences in services provided, fees charged, and costs incurred, as well as competition in their respective marketplaces.
Based on its review of total expense ratios and fees charged to other Fidelity clients, the Board concluded that, although in some cases above the median of the universe presented for comparison, the total expense ratio of each class of the fund was reasonable in light of the services that the fund and its shareholders receive and the other factors considered.
Costs of the Services and Profitability. The Board considered the revenues earned and the expenses incurred by Fidelity in conducting the business of developing, marketing, distributing, managing, administering and servicing the fund and servicing the fund's shareholders. The Board also considered the level of Fidelity's profits in respect of all the Fidelity funds.
On an annual basis, Fidelity presents to the Board information about the profitability of its relationship with the fund. Fidelity calculates profitability information for each fund, as well as aggregate profitability information for groups of Fidelity funds and all Fidelity funds, using a series of detailed revenue and cost allocation methodologies which originate with the books and records of Fidelity on which Fidelity's audited financial statements are based. The Audit Committee of the Board reviews any significant changes from the prior year's methodologies.
Annual Report
PricewaterhouseCoopers LLP (PwC), independent registered public accounting firm and auditor to Fidelity and certain Fidelity funds, has been engaged annually by the Board as part of the Board's assessment of Fidelity's profitability analysis. PwC's engagement includes the review and assessment of the methodologies used by Fidelity in determining the revenues and expenses attributable to Fidelity's mutual fund business, and completion of agreed-upon procedures in respect of the mathematical accuracy of fund profitability and its conformity to established allocation methodologies. After considering PwC's reports issued under the engagement and information provided by Fidelity, the Board concluded that while other allocation methods may also be reasonable, Fidelity's profitability methodologies are reasonable in all material respects.
The Board also reviewed Fidelity's non-fund businesses and fall-out benefits related to the mutual fund business as well as cases where Fidelity's affiliates may benefit from or be related to the fund's business.
The Board considered the costs of the services provided by and the profits realized by Fidelity in connection with the operation of the fund and was satisfied that the profitability was not excessive.
Economies of Scale. The Board considered whether there have been economies of scale in respect of the management of the Fidelity funds, whether the Fidelity funds (including the fund) have appropriately benefited from any such economies of scale, and whether there is potential for realization of any further economies of scale. The Board considered the extent to which the fund will benefit from economies of scale as assets grow through increased services to the fund, through waivers or reimbursements, or through fee or expense ratio reductions. The Board also noted that in 2013, it and the boards of other Fidelity funds created an ad hoc committee (the Economies of Scale Committee) to analyze whether Fidelity attains economies of scale in respect of the management and servicing of the Fidelity funds, whether the Fidelity funds have appropriately benefited from such economies of scale, and whether there is potential for realization of any further economies of scale.
The Board recognized that the fund's management contract incorporates a "group fee" structure, which provides for lower group fee rates as total group assets increase, and for higher group fee rates as total group assets decrease (with "group assets" defined to include fund assets under FMR's management plus sector fund assets previously under FMR's management and currently managed by Fidelity SelectCo, LLC). FMR calculates the group fee rates based on a tiered asset "breakpoint" schedule that varies based on asset class. The Board considered that the group fee is designed to deliver the benefits of economies of scale to fund shareholders when total Fidelity fund assets increase, even if assets of any particular fund are unchanged or have declined, because some portion of Fidelity's costs are attributable to services provided to all Fidelity funds, and all funds benefit if those costs can be allocated among more assets. The Board concluded that, given the group fee structure, fund shareholders will benefit from lower management fees as group assets increase at the fund complex level, regardless of whether Fidelity achieves any such economies of scale.
Annual Report
Board Approval of Investment Advisory Contracts and
Management Fees - continued
The Board concluded, taking into account the analysis of the Economies of Scale Committee, that economies of scale, if any, are being appropriately shared between fund shareholders and Fidelity.
Additional Information Requested by the Board. In order to develop fully the factual basis for consideration of the Fidelity funds' Advisory Contracts, the Board requested and received additional information on certain topics, including: (i) fund performance trends and Fidelity's long-term strategies for certain funds; (ii) the various share classes employed by Fidelity and the attributes of each class, together with similar information on the distribution and servicing payments made by Fidelity or the funds to third-party participants in the distribution channels; (iii) fund profitability, and fund performance in relation to fund profitability; (iv) the methodology with respect to evaluating competitive fund data and peer group classifications and fee comparisons; (v) annual fund profitability margins, with particular focus on certain funds with negative margins; (vi) the realization of fall-out benefits in certain Fidelity business units; (vii) economies of scale and the way in which they are shared with fund shareholders; (viii) Fidelity's group fee structures, including the group fee schedule of breakpoints; (ix) the impact of cost containment measures on the funds; and (x) the transfer agent fee structure.
Based on its evaluation of all of the conclusions noted above, and after considering all factors it believed relevant, the Board concluded that the advisory fee structures are fair and reasonable, and that the fund's Advisory Contracts should be renewed.
Annual Report
Investment Adviser
Fidelity Management & Research Company
Boston, MA
Investment Sub-Advisers
FMR Co., Inc.
FMR Investment Management
(U.K.) Limited
Fidelity Management & Research
(Hong Kong) Limited
Fidelity Management & Research
(Japan) Limited
FIL Investment Advisors
FIL Investments (Japan) Limited
FIL Investment Advisors (UK) Limited
General Distributor
Fidelity Distributors Corporation
Smithfield, RI
Transfer and Service Agents
Fidelity Investments Institutional Operations Company, Inc.
Boston, MA
Fidelity Service Company, Inc.
Boston, MA
Custodian
State Street Bank and Trust Company
Quincy, MA
(Fidelity Investment logo)(registered trademark)
AIGFZ-UANN-1215
1.9585036.102
ContentsPerformance: The Bottom LineManagement's Discussion of Fund PerformanceShareholder Expense ExampleInvestment Changes (Unaudited)Investments October 31, 2015Financial StatementsNotes to Financial StatementsReport of Independent Registered Public Accounting FirmTrustees and OfficersDistributions (Unaudited)Board Approval of Investment Advisory Contracts and Management Fees
Fidelity®
International Discovery
Fund
Annual Report
October 31, 2015
(Fidelity Cover Art)
Contents
Performance | (Click Here) | How the fund has done over time. |
Management's Discussion of Fund Performance | (Click Here) | The Portfolio Manager's review of fund performance and strategy. |
Shareholder Expense Example | (Click Here) | An example of shareholder expenses. |
Investment Changes | (Click Here) | A summary of major shifts in the fund's investments over the past six months. |
Investments | (Click Here) | A complete list of the fund's investments with their market values. |
Financial Statements | (Click Here) | Statements of assets and liabilities, operations, and changes in net assets, as well as financial highlights. |
Notes | (Click Here) | Notes to the financial statements. |
Report of Independent Registered Public Accounting Firm | (Click Here) | |
Trustees and Officers | (Click Here) | |
Distributions | (Click Here) | |
Board Approval of Investment Advisory Contracts and Management Fees | (Click Here) | |
To view a fund's proxy voting guidelines and proxy voting record for the 12-month period ended June 30, visit http://www.fidelity.com/proxyvotingresults or visit the Securities and Exchange Commission's (SEC) web site at http://www.sec.gov. You may also call 1-800-544-8544 to request a free copy of the proxy voting guidelines.
Standard & Poor's, S&P and S&P 500 are registered service marks of The McGraw-Hill Companies, Inc. and have been licensed for use by Fidelity Distributors Corporation.
Other third-party marks appearing herein are the property of their respective owners.
All other marks appearing herein are registered or unregistered trademarks or service marks of FMR LLC or an affiliated company. © 2015 FMR LLC. All rights reserved.
Annual Report
This report and the financial statements contained herein are submitted for the general information of the shareholders of the fund. This report is not authorized for distribution to prospective investors in the fund unless preceded or accompanied by an effective prospectus.
A fund files its complete schedule of portfolio holdings with the SEC for the first and third quarters of each fiscal year on Form N-Q. Forms N-Q are available on the SEC's web site at http://www.sec.gov. A fund's Forms N-Q may be reviewed and copied at the SEC's Public Reference Room in Washington, DC. Information regarding the operation of the SEC's Public Reference Room may be obtained by calling 1-800-SEC-0330. For a complete list of a fund's portfolio holdings, view the most recent holdings listing, semiannual report, or annual report on Fidelity's web site at http://www.fidelity.com, http://www.advisor.fidelity.com, or http://www.401k.com, as applicable.
NOT FDIC INSURED • MAY LOSE VALUE • NO BANK GUARANTEE
Neither the fund nor Fidelity Distributors Corporation is a bank.
Annual Report
Average annual total return reflects the change in the value of an investment, assuming reinvestment of the class' distributions from dividend income and capital gains (the profits earned upon the sale of securities that have grown in value, if any) and assuming a constant rate of performance each year. The $10,000 table and the fund's returns do not reflect the deduction of taxes that a shareholder would pay on fund distributions or the redemption of fund shares. During periods of reimbursement by Fidelity, a fund's total return will be greater than it would be had the reimbursement not occurred. How a fund did yesterday is no guarantee of how it will do tomorrow.
Average Annual Total Returns
Periods ended October 31, 2015 | Past 1
year | Past 5
years | Past 10
years |
Fidelity® International Discovery Fund | 3.47% | 6.05% | 5.26% |
$10,000 Over 10 Years
Let's say hypothetically that $10,000 was invested in Fidelity® International Discovery Fund, a class of the fund, on October 31, 2005. The chart shows how the value of your investment would have changed, and also shows how the MSCI EAFE Index performed over the same period.
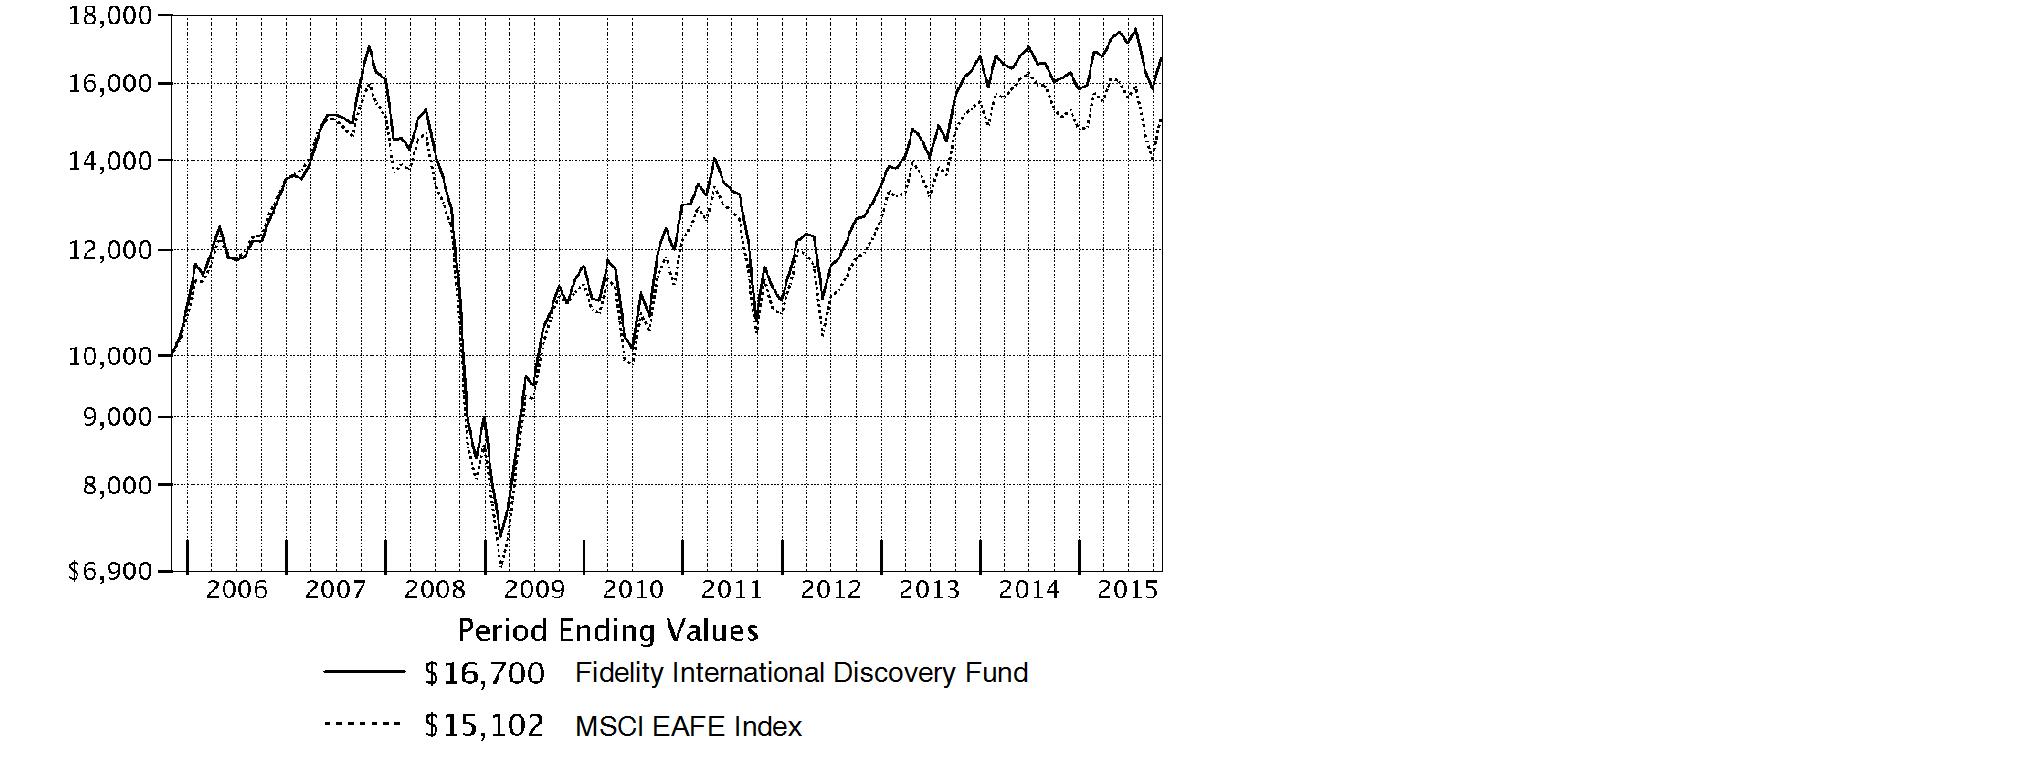
Annual Report
Market Recap: International equities suffered a moderate setback for the 12 months ending October 31, 2015, held back by a collapse in commodities prices that hurt resources-related sectors and geographies. The MSCI ACWI (All Country World Index) ex USA Index returned -4.55% for the period, affected also by concerns about global economic growth. Commodity producers remained under pressure for much of the past year, largely related to economic deceleration in China (-1%), the world's second-largest economy and a leading consumer of raw materials. This effect was exacerbated by U.S. dollar strength relative to global currencies, which weighed on commodities priced in dollars and acutely impacted equity returns within regions most exposed to resources prices. The emerging-markets group, for example, returned about -15% this period. Canada, a significant energy producer, returned roughly -17%. Net energy consumer Japan (+9%) was the best-performing region by far. Only about a quarter of the nearly 50 index countries managed a gain this period: Ireland (+19%) - the EU's fastest-growing economy - and Israel (+17%) proved top performers; Greece (-56%) and Brazil (-46%), among the worst. As for sectors, energy (-25%) and materials (-16%) declined sharply, whereas the two consumer sectors each gained about 6%.
Comments from Portfolio Manager William Kennedy: For the year, the fund's share classes (excluding sales charges, if applicable) outpaced the 0.08% return of the benchmark MSCI EAFE Index. Most of the fund's outperformance came from security selection in the financials and consumer discretionary sectors, favorable positioning in continental Europe and Asia Pacific ex Japan and stock picks in the United Kingdom. Sector allocations gave an added boost. In terms of top individual contributors, an average underweighting in U.K.-listed oil and gas company Royal Dutch Shell helped, as plunging oil prices caused the stock to decline. An out-of-index stake in Constellation Software returned roughly 55%, as the Canadian company's track record of smart acquisitions drove better-than-expected earnings growth. Another winner was Luxembourg-based media company Altice, which saw its entrepreneurial management team and appetite for acquisitions drive a huge gain. By contrast, the fund's underweighting in Japan modestly hindered relative performance. In terms of individual detractors, an overweighting in France-based exploration and production company Total hurt as oil prices slid. A tiny out-of-index stake in Australia-based online fashion retailer MySale Group detracted when a profit warning sank the stock. Altice and MySale were not in the portfolio at period end.
The views expressed above reflect those of the portfolio manager(s) only through the end of the period as stated on the cover of this report and do not necessarily represent the views of Fidelity or any other person in the Fidelity organization. Any such views are subject to change at any time based upon market or other conditions and Fidelity disclaims any responsibility to update such views. These views may not be relied on as investment advice and, because investment decisions for a Fidelity fund are based on numerous factors, may not be relied on as an indication of trading intent on behalf of any Fidelity fund.
Annual Report
Shareholder Expense Example
As a shareholder of the Fund, you incur two types of costs: (1) transaction costs, including sales charges (loads) on purchase payments or redemption proceeds, redemption fees and (2) ongoing costs, including management fees, distribution and/or service (12b-1) fees and other Fund expenses. This Example is intended to help you understand your ongoing costs (in dollars) of investing in the Fund and to compare these costs with the ongoing costs of investing in other mutual funds.
The Example is based on an investment of $1,000 invested at the beginning of the period and held for the entire period (May 1, 2015 to October 31, 2015).
Actual Expenses
The first line of the accompanying table for each class of the Fund provides information about actual account values and actual expenses. You may use the information in this line, together with the amount you invested, to estimate the expenses that you paid over the period. Simply divide your account value by $1,000.00 (for example, an $8,600 account value divided by $1,000.00 = 8.6), then multiply the result by the number in the first line for a class of the Fund under the heading entitled "Expenses Paid During Period" to estimate the expenses you paid on your account during this period. A small balance maintenance fee of $12.00 that is charged once a year may apply for certain accounts with a value of less than $2,000. This fee is not included in the table below. If it was, the estimate of expenses you paid during the period would be higher, and your ending account value lower, by this amount. In addition, the Fund, as a shareholder in the underlying Fidelity Central Funds, will indirectly bear its pro-rata share of the fees and expenses incurred by the underlying Fidelity Central Funds. These fees and expenses are not included in the Fund's annualized expense ratio used to calculate the expense estimate in the table below.
Hypothetical Example for Comparison Purposes
The second line of the accompanying table for each class of the Fund provides information about hypothetical account values and hypothetical expenses based on a Class' actual expense ratio and an assumed rate of return of 5% per year before expenses, which is not the Class' actual return. The hypothetical account values and expenses may not be used to estimate the actual ending account balance or expenses you paid for the period. You may use this information to compare the ongoing costs of investing in the Fund and other funds. To do so, compare this 5% hypothetical example with the 5% hypothetical examples that appear in the shareholder reports of the other funds. A small balance maintenance fee of $12.00 that is charged once a year may apply for certain accounts with a value of less than $2,000. This fee is not included in the table below. If it was, the estimate of expenses you paid during the period would be higher, and your ending account value lower, by this amount. In addition, the Fund, as a shareholder in the underlying Fidelity Central Funds, will indirectly bear its pro-rata share of the fees and expenses incurred by the underlying Fidelity Central Funds. These fees and expenses are not included in the Fund's annualized expense ratio used to calculate the expense estimate in the table below.
Please note that the expenses shown in the table are meant to highlight your ongoing costs only and do not reflect any transaction costs. Therefore, the second line of the table is useful in comparing ongoing costs only, and will not help you determine the relative total costs of owning different funds. In addition, if these transactional costs were included, your costs would have been higher.
Annual Report
Shareholder Expense Example - continued
| Annualized
Expense RatioB | Beginning
Account Value
May 1, 2015 | Ending
Account Value
October 31, 2015 | Expenses Paid
During PeriodC
May 1, 2015 to
October 31, 2015 |
Class A | 1.33% | | | |
Actual | | $ 1,000.00 | $ 965.80 | $ 6.59 |
HypotheticalA | | $ 1,000.00 | $ 1,018.50 | $ 6.77 |
Class T | 1.57% | | | |
Actual | | $ 1,000.00 | $ 964.80 | $ 7.78 |
HypotheticalA | | $ 1,000.00 | $ 1,017.29 | $ 7.98 |
Class B | 2.11% | | | |
Actual | | $ 1,000.00 | $ 962.00 | $ 10.43 |
HypotheticalA | | $ 1,000.00 | $ 1,014.57 | $ 10.71 |
Class C | 2.09% | | | |
Actual | | $ 1,000.00 | $ 962.10 | $ 10.34 |
HypotheticalA | | $ 1,000.00 | $ 1,014.67 | $ 10.61 |
International Discovery | .99% | | | |
Actual | | $ 1,000.00 | $ 967.70 | $ 4.91 |
HypotheticalA | | $ 1,000.00 | $ 1,020.21 | $ 5.04 |
Class K | .86% | | | |
Actual | | $ 1,000.00 | $ 968.10 | $ 4.27 |
HypotheticalA | | $ 1,000.00 | $ 1,020.87 | $ 4.38 |
Class I | 1.00% | | | |
Actual | | $ 1,000.00 | $ 967.40 | $ 4.96 |
HypotheticalA | | $ 1,000.00 | $ 1,020.16 | $ 5.09 |
Class Z | .87% | | | |
Actual | | $ 1,000.00 | $ 968.10 | $ 4.32 |
HypotheticalA | | $ 1,000.00 | $ 1,020.82 | $ 4.43 |
A 5% return per year before expenses
B Annualized expense ratio reflects expenses net of applicable fee waivers.
C Expenses are equal to each Class' annualized expense ratio, multiplied by the average account value over the period, multiplied by 184/365 (to reflect the one-half year period).
Annual Report
Investment Changes (Unaudited)
Annual Report
Asset Allocation as of October 31, 2015 |
| % of fund's
net assets | % of fund's net assets
6 months ago |
Stocks and Equity Futures | 97.5 | 99.1 |
Other Investments | 0.1 | 0.1 |
Short-Term Investments and Net Other Assets (Liabilities) | 2.4 | 0.8 |
Top Ten Stocks as of October 31, 2015 |
| % of fund's
net assets | % of fund's net assets
6 months ago |
Total SA (France, Oil, Gas & Consumable Fuels) | 2.0 | 1.8 |
Novartis AG (Switzerland, Pharmaceuticals) | 1.8 | 1.7 |
Unilever NV (Certificaten Van Aandelen) (Bearer) (Netherlands, Personal Products) | 1.6 | 1.5 |
Anheuser-Busch InBev SA NV (Belgium, Beverages) | 1.4 | 1.6 |
AIA Group Ltd. (Hong Kong, Insurance) | 1.3 | 1.3 |
Techtronic Industries Co. Ltd. (Hong Kong, Household Durables) | 1.3 | 1.2 |
Housing Development Finance Corp. Ltd. (India, Thrifts & Mortgage Finance) | 1.3 | 1.2 |
Mitsubishi UFJ Financial Group, Inc. (Japan, Banks) | 1.3 | 1.2 |
Novo Nordisk A/S Series B (Denmark, Pharmaceuticals) | 1.2 | 1.1 |
KDDI Corp. (Japan, Wireless Telecommunication Services) | 1.1 | 1.1 |
| 14.3 | |
Market Sectors as of October 31, 2015 |
| % of fund's
net assets | % of fund's net assets
6 months ago |
Financials | 24.2 | 24.6 |
Consumer Discretionary | 17.4 | 16.9 |
Health Care | 12.8 | 13.2 |
Consumer Staples | 11.9 | 9.5 |
Industrials | 10.5 | 10.9 |
Information Technology | 7.5 | 9.7 |
Telecommunication Services | 4.9 | 4.7 |
Energy | 4.3 | 5.0 |
Materials | 2.3 | 3.0 |
Annual Report
Investments October 31, 2015
Showing Percentage of Net Assets
Common Stocks - 95.5% |
| Shares | | Value (000s) |
Australia - 1.7% |
1-Page Ltd. (a) | 2,546,348 | | $ 8,566 |
Ansell Ltd. | 1,597,592 | | 22,734 |
Australia & New Zealand Banking Group Ltd. | 3,558,240 | | 68,817 |
Flight Centre Travel Group Ltd. (d) | 485,418 | | 13,059 |
Mantra Group Ltd. | 7,839,732 | | 22,935 |
Ramsay Health Care Ltd. | 1,171,082 | | 51,478 |
TOTAL AUSTRALIA | | 187,589 |
Austria - 0.3% |
Andritz AG | 447,100 | | 22,518 |
Erste Group Bank AG (a) | 456,800 | | 13,397 |
TOTAL AUSTRIA | | 35,915 |
Bailiwick of Jersey - 1.7% |
Integrated Diagnostics Holdings PLC (a) | 4,961,400 | | 27,337 |
Regus PLC | 11,120,488 | | 57,362 |
Shire PLC | 588,700 | | 44,583 |
Wolseley PLC | 1,048,393 | | 61,553 |
TOTAL BAILIWICK OF JERSEY | | 190,835 |
Belgium - 1.9% |
Anheuser-Busch InBev SA NV | 1,256,127 | | 149,887 |
KBC Groep NV | 955,745 | | 58,225 |
TOTAL BELGIUM | | 208,112 |
Bermuda - 0.5% |
PAX Global Technology Ltd. | 43,428,000 | | 56,789 |
Canada - 2.2% |
Alimentation Couche-Tard, Inc. Class B (sub. vtg.) | 786,100 | | 33,816 |
Constellation Software, Inc. | 230,700 | | 99,683 |
Entertainment One Ltd. | 3,283,077 | | 11,119 |
Imperial Oil Ltd. | 1,249,100 | | 41,563 |
PrairieSky Royalty Ltd. (d) | 1,502,800 | | 29,571 |
Suncor Energy, Inc. | 680,200 | | 20,241 |
TOTAL CANADA | | 235,993 |
Cayman Islands - 1.3% |
Alibaba Group Holding Ltd. sponsored ADR (a) | 385,500 | | 32,316 |
CK Hutchison Holdings Ltd. | 1,264,716 | | 17,318 |
Ctrip.com International Ltd. sponsored ADR (a) | 148,100 | | 13,769 |
Lee's Pharmaceutical Holdings Ltd. | 6,774,164 | | 8,746 |
Qunar Cayman Islands Ltd. sponsored ADR (a) | 515,900 | | 25,042 |
Common Stocks - continued |
| Shares | | Value (000s) |
Cayman Islands - continued |
Regina Miracle International Holdings Ltd. | 15,269,891 | | $ 13,845 |
WuXi PharmaTech Cayman, Inc. sponsored ADR (a) | 826,200 | | 36,931 |
TOTAL CAYMAN ISLANDS | | 147,967 |
China - 0.5% |
Jiangsu Hengrui Medicine Co. Ltd. | 4,183,623 | | 34,711 |
Kweichow Moutai Co. Ltd. | 663,582 | | 22,405 |
Yantai Changyu Pioneer Wine Co. Ltd. (B Shares) | 697,195 | | 2,215 |
TOTAL CHINA | | 59,331 |
Cyprus - 0.0% |
SPDI Secure Property Development & Investment PLC (a) | 520,230 | | 229 |
Denmark - 1.2% |
Novo Nordisk A/S Series B | 2,385,545 | | 126,681 |
Finland - 0.7% |
Sampo Oyj (A Shares) | 1,663,200 | | 81,351 |
France - 9.6% |
Accor SA | 1,694,818 | | 84,314 |
Air Liquide SA | 429,100 | | 55,632 |
ALTEN | 88,659 | | 4,602 |
Atos Origin SA | 441,674 | | 35,237 |
AXA SA | 3,834,100 | | 102,325 |
Capgemini SA | 860,800 | | 76,701 |
Cegedim SA (a) | 539,590 | | 19,136 |
Havas SA | 4,843,944 | | 42,027 |
Numericable Group SA (a) | 340,324 | | 15,419 |
Rexel SA | 1,265,582 | | 17,299 |
Safran SA | 614,700 | | 46,689 |
Sanofi SA | 992,072 | | 100,076 |
Sodexo SA | 433,700 | | 38,616 |
SR Teleperformance SA | 291,800 | | 22,936 |
Total SA (d) | 4,569,799 | | 220,991 |
Unibail-Rodamco | 157,400 | | 43,981 |
VINCI SA | 1,425,100 | | 96,189 |
Vivendi SA | 1,148,200 | | 27,622 |
TOTAL FRANCE | | 1,049,792 |
Germany - 5.5% |
Aareal Bank AG | 1,026,009 | | 39,094 |
Axel Springer Verlag AG | 526,702 | | 29,620 |
Beiersdorf AG | 244,300 | | 23,219 |
Continental AG | 299,300 | | 71,980 |
Common Stocks - continued |
| Shares | | Value (000s) |
Germany - continued |
Deutsche Boerse AG | 529,594 | | $ 48,773 |
Deutsche Telekom AG | 3,260,600 | | 61,076 |
Fresenius SE & Co. KGaA | 471,500 | | 34,647 |
GEA Group AG | 884,110 | | 35,452 |
KION Group AG | 1,377,249 | | 62,109 |
LEG Immobilien AG | 254,661 | | 20,317 |
OSRAM Licht AG | 1,016,232 | | 59,797 |
ProSiebenSat.1 Media AG | 1,176,900 | | 63,661 |
Rational AG | 84,000 | | 33,350 |
United Internet AG | 433,247 | | 22,513 |
TOTAL GERMANY | | 605,608 |
Hong Kong - 3.0% |
AIA Group Ltd. | 24,849,200 | | 145,699 |
China Resources Beer Holdings Co. Ltd. | 21,482,000 | | 40,562 |
Techtronic Industries Co. Ltd. | 38,670,000 | | 141,365 |
TOTAL HONG KONG | | 327,626 |
India - 3.0% |
Bharti Infratel Ltd. (a) | 12,647,734 | | 75,119 |
HDFC Bank Ltd. sponsored ADR | 1,298,584 | | 79,395 |
Housing Development Finance Corp. Ltd. | 7,355,732 | | 140,900 |
Lupin Ltd. | 452,781 | | 13,331 |
Sun Pharmaceutical Industries Ltd. | 347,397 | | 4,721 |
Titan Co. Ltd. (a) | 2,186,522 | | 11,862 |
TOTAL INDIA | | 325,328 |
Ireland - 1.4% |
Bank of Ireland (a) | 62,440,800 | | 23,002 |
Dalata Hotel Group PLC (a) | 388,200 | | 1,930 |
Glanbia PLC | 2,527,500 | | 49,028 |
Kerry Group PLC Class A | 989,500 | | 80,465 |
TOTAL IRELAND | | 154,425 |
Isle of Man - 0.7% |
Optimal Payments PLC (a) | 11,615,044 | | 54,433 |
Playtech Ltd. | 1,395,092 | | 18,410 |
TOTAL ISLE OF MAN | | 72,843 |
Israel - 1.3% |
Frutarom Industries Ltd. | 1,038,100 | | 44,860 |
Common Stocks - continued |
| Shares | | Value (000s) |
Israel - continued |
Partner Communications Co. Ltd. (a) | 1,755,983 | | $ 7,969 |
Teva Pharmaceutical Industries Ltd. sponsored ADR | 1,558,300 | | 92,236 |
TOTAL ISRAEL | | 145,065 |
Italy - 2.9% |
De Longhi SpA | 2,630,100 | | 64,438 |
Intesa Sanpaolo SpA | 25,324,300 | | 88,222 |
Mediaset SpA | 17,602,100 | | 89,425 |
Telecom Italia SpA (a) | 50,788,000 | | 70,853 |
TOTAL ITALY | | 312,938 |
Japan - 15.9% |
ACOM Co. Ltd. (a)(d) | 5,223,800 | | 28,599 |
Aozora Bank Ltd. | 11,048,000 | | 40,381 |
Asahi Group Holdings | 1,240,200 | | 38,255 |
Astellas Pharma, Inc. | 6,994,600 | | 101,523 |
Coca-Cola Central Japan Co. Ltd. | 536,400 | | 7,539 |
Dentsu, Inc. | 1,281,800 | | 72,060 |
Don Quijote Holdings Co. Ltd. | 1,346,000 | | 49,444 |
Hitachi Ltd. | 10,000 | | 58 |
Hoya Corp. | 2,994,400 | | 123,569 |
Japan Exchange Group, Inc. | 1,932,000 | | 31,088 |
Japan Tobacco, Inc. | 1,302,700 | | 45,089 |
KDDI Corp. | 5,167,900 | | 125,055 |
Keyence Corp. | 147,360 | | 76,717 |
Misumi Group, Inc. | 3,200,000 | | 41,671 |
Mitsubishi UFJ Financial Group, Inc. | 21,656,100 | | 140,062 |
Monex Group, Inc. | 12,212,749 | | 34,330 |
NEC Corp. | 25,011,000 | | 77,159 |
Nidec Corp. | 701,900 | | 52,892 |
Olympus Corp. | 1,784,400 | | 60,190 |
ORIX Corp. | 6,891,200 | | 100,638 |
Sanken Electric Co. Ltd. | 1,393,000 | | 4,841 |
Seven & i Holdings Co. Ltd. | 931,900 | | 42,331 |
Seven Bank Ltd. | 12,110,400 | | 55,182 |
Shinsei Bank Ltd. | 32,483,000 | | 68,109 |
SoftBank Corp. | 724,300 | | 40,581 |
Sony Corp. | 2,320,500 | | 65,961 |
Sundrug Co. Ltd. | 626,200 | | 32,988 |
Tsuruha Holdings, Inc. | 1,040,400 | | 82,425 |
United Arrows Ltd. | 847,000 | | 36,490 |
Common Stocks - continued |
| Shares | | Value (000s) |
Japan - continued |
VT Holdings Co. Ltd. | 3,895,300 | | $ 24,089 |
Welcia Holdings Co. Ltd. | 964,000 | | 47,511 |
TOTAL JAPAN | | 1,746,827 |
Luxembourg - 0.8% |
Eurofins Scientific SA | 83,911 | | 30,381 |
Grand City Properties SA | 3,000,560 | | 59,920 |
TOTAL LUXEMBOURG | | 90,301 |
Marshall Islands - 0.1% |
Hoegh LNG Partners LP (e) | 715,655 | | 11,465 |
Netherlands - 4.0% |
AerCap Holdings NV (a) | 2,303,100 | | 95,579 |
Arcadis NV | 1,205,000 | | 30,411 |
IMCD Group BV | 1,938,100 | | 72,505 |
ING Groep NV (Certificaten Van Aandelen) | 4,566,600 | | 66,462 |
Unilever NV (Certificaten Van Aandelen) (Bearer) | 3,836,500 | | 173,477 |
TOTAL NETHERLANDS | | 438,434 |
New Zealand - 0.6% |
EBOS Group Ltd. | 3,173,554 | | 29,333 |
Ryman Healthcare Group Ltd. | 7,179,412 | | 38,358 |
TOTAL NEW ZEALAND | | 67,691 |
Philippines - 0.3% |
SM Investments Corp. | 1,651,390 | | 30,830 |
Portugal - 0.3% |
NOS SGPS SA | 3,466,500 | | 28,814 |
South Africa - 1.1% |
EOH Holdings Ltd. | 2,871,867 | | 31,751 |
Naspers Ltd. Class N | 593,000 | | 86,857 |
TOTAL SOUTH AFRICA | | 118,608 |
Spain - 2.5% |
Amadeus IT Holding SA Class A | 1,727,200 | | 73,617 |
Atresmedia Corporacion de Medios de Comunicacion SA | 2,218,100 | | 28,465 |
Hispania Activos Inmobiliarios SA (a) | 1,091,600 | | 16,445 |
Inditex SA | 2,302,339 | | 86,346 |
Mediaset Espana Comunicacion SA | 3,431,200 | | 41,712 |
Merlin Properties Socimi SA | 2,497,700 | | 32,025 |
TOTAL SPAIN | | 278,610 |
Common Stocks - continued |
| Shares | | Value (000s) |
Sweden - 3.1% |
ASSA ABLOY AB (B Shares) | 2,977,200 | | $ 59,226 |
Getinge AB (B Shares) | 2,702,600 | | 67,663 |
HEXPOL AB (B Shares) | 2,985,000 | | 29,069 |
Nordea Bank AB | 5,783,000 | | 63,966 |
Sandvik AB | 3,361,100 | | 31,433 |
Svenska Cellulosa AB (SCA) (B Shares) | 1,545,100 | | 45,509 |
Svenska Handelsbanken AB (A Shares) | 2,990,700 | | 40,618 |
TOTAL SWEDEN | | 337,484 |
Switzerland - 5.1% |
Credit Suisse Group AG (h)(k) | 3,643,900 | | 83,867 |
EFG International | 1,747,368 | | 17,554 |
GAM Holding Ltd. | 1,413,451 | | 25,882 |
Julius Baer Group Ltd. | 955,230 | | 47,363 |
Novartis AG | 2,126,476 | | 192,635 |
Partners Group Holding AG | 225,896 | | 81,816 |
Schindler Holding AG (participation certificate) | 182,339 | | 29,626 |
Syngenta AG (Switzerland) | 101,678 | | 34,161 |
UBS Group AG | 2,453,481 | | 49,097 |
TOTAL SWITZERLAND | | 562,001 |
Taiwan - 0.1% |
JHL Biotech, Inc. (a) | 4,995,560 | | 11,141 |
Turkey - 0.0% |
Logo Yazilim Sanayi Ve Ticar | 2 | | 0 |
United Kingdom - 19.1% |
AA PLC | 3,853,399 | | 16,449 |
Aberdeen Asset Management PLC | 4,206,932 | | 22,485 |
Al Noor Hospitals Group PLC | 2,335,318 | | 42,337 |
Associated British Foods PLC | 776,700 | | 41,369 |
Aviva PLC | 6,618,100 | | 49,461 |
B&M European Value Retail S.A. | 8,573,709 | | 44,066 |
Barclays PLC | 16,052,760 | | 57,192 |
BCA Marketplace PLC | 7,808,000 | | 21,275 |
BG Group PLC | 2,346,020 | | 37,064 |
BT Group PLC | 6,169,700 | | 44,061 |
BTG PLC (a) | 1,727,000 | | 14,696 |
Bunzl PLC | 2,087,500 | | 59,824 |
Compass Group PLC | 2,024,800 | | 34,808 |
Diploma PLC | 2,326,200 | | 23,005 |
Essentra PLC | 2,145,000 | | 27,843 |
Hikma Pharmaceuticals PLC | 2,598,333 | | 86,681 |
Common Stocks - continued |
| Shares | | Value (000s) |
United Kingdom - continued |
Howden Joinery Group PLC | 10,977,300 | | $ 78,453 |
HSBC Holdings PLC (United Kingdom) | 10,446,000 | | 81,614 |
Imperial Tobacco Group PLC | 2,092,292 | | 112,859 |
ITV PLC | 21,873,900 | | 85,111 |
JUST EAT Ltd. (a) | 595,900 | | 3,913 |
Liberty Global PLC Class A (a) | 665,500 | | 29,628 |
Lloyds Banking Group PLC | 69,588,800 | | 78,984 |
London Stock Exchange Group PLC | 2,190,936 | | 85,959 |
Melrose PLC | 10,942,678 | | 44,906 |
Micro Focus International PLC | 3,266,700 | | 63,251 |
Next PLC | 760,844 | | 93,833 |
Persimmon PLC | 1,478,400 | | 45,445 |
Poundland Group PLC | 6,866,990 | | 29,112 |
Reckitt Benckiser Group PLC | 759,700 | | 74,140 |
Rex Bionics PLC (a)(e) | 1,304,916 | | 976 |
Rio Tinto PLC | 1,353,600 | | 49,332 |
Royal Dutch Shell PLC Class A (United Kingdom) | 1,108,500 | | 28,940 |
SABMiller PLC | 723,500 | | 44,558 |
Schroders PLC | 598,200 | | 27,509 |
Shawbrook Group Ltd. | 9,004,300 | | 47,098 |
Spirax-Sarco Engineering PLC | 542,700 | | 25,442 |
St. James's Place Capital PLC | 5,426,000 | | 80,678 |
Taylor Wimpey PLC | 11,785,800 | | 35,975 |
The Restaurant Group PLC | 1,956,100 | | 21,621 |
Virgin Money Holdings Uk PLC | 5,909,100 | | 35,327 |
Vodafone Group PLC | 31,387,896 | | 103,296 |
Whitbread PLC | 700,994 | | 53,665 |
Workspace Group PLC | 652,800 | | 9,636 |
TOTAL UNITED KINGDOM | | 2,093,877 |
United States of America - 3.1% |
Chevron Corp. | 854,400 | | 77,648 |
Constellation Brands, Inc. Class A (sub. vtg.) | 626,700 | | 84,479 |
McGraw Hill Financial, Inc. | 686,300 | | 63,579 |
Monster Beverage Corp. (a) | 168,900 | | 23,024 |
Visa, Inc. Class A | 1,154,500 | | 89,566 |
TOTAL UNITED STATES OF AMERICA | | 338,296 |
TOTAL COMMON STOCKS (Cost $9,171,863) |
10,478,796
|
Nonconvertible Preferred Stocks - 0.2% |
| Shares | | Value (000s) |
Cayman Islands - 0.2% |
China Internet Plus Holdings Ltd. (k) | 5,958,244 | | $ 22,999 |
Germany - 0.0% |
Henkel AG & Co. KGaA | 476 | | 52 |
TOTAL NONCONVERTIBLE PREFERRED STOCKS (Cost $18,888) |
23,051
|
Government Obligations - 0.0% |
| Principal
Amount (000s) (j) | | |
United States of America - 0.0% |
U.S. Treasury Bills, yield at date of purchase 0.03% to 0.06% 12/3/15 to 12/17/15 (i)
(Cost $1,930) | | $ 1,930 | |
1,930
|
Preferred Securities - 0.1% |
|
Ireland - 0.1% |
Baggot Securities Ltd. 10.24% (f)(g)
(Cost $13,883) | EUR | 9,040 | |
10,747
|
Money Market Funds - 5.3% |
| Shares | | |
Fidelity Cash Central Fund, 0.18% (b) | 529,294,097 | | 529,294 |
Fidelity Securities Lending Cash Central Fund, 0.19% (b)(c) | 46,206,017 | | 46,206 |
TOTAL MONEY MARKET FUNDS (Cost $575,500) |
575,500
|
TOTAL INVESTMENT PORTFOLIO - 101.1% (Cost $9,782,064) | | 11,090,024 |
NET OTHER ASSETS (LIABILITIES) - (1.1)% | | (122,851) |
NET ASSETS - 100% | $ 10,967,173 |
Futures Contracts |
| Expiration Date | | Underlying Face Amount at Value (000s) | | Unrealized Appreciation/
(Depreciation)
(000s) |
Purchased |
Equity Index Contracts |
2,033 CME Nikkei 225 Index Contracts (United States) | Dec. 2015 | | $ 192,271 | | $ 9,203 |
The face value of futures purchased as a percentage of net assets is 1.8% |
For the period, the average monthly underlying face amount at value for futures contracts in the aggregate was $226,950,000. |
Currency Abbreviations |
EUR | - | European Monetary Unit |
Legend |
(a) Non-income producing |
(b) Affiliated fund that is generally available only to investment companies and other accounts managed by Fidelity Investments. The rate quoted is the annualized seven-day yield of the fund at period end. A complete unaudited listing of the fund's holdings as of its most recent quarter end is available upon request. In addition, each Fidelity Central Fund's financial statements, which are not covered by the Fund's Report of Independent Registered Public Accounting Firm, are available on the SEC's website or upon request. |
(c) Investment made with cash collateral received from securities on loan. |
(d) Security or a portion of the security is on loan at period end. |
(e) Affiliated company |
(f) Security exempt from registration under Rule 144A of the Securities Act of 1933. These securities may be resold in transactions exempt from registration, normally to qualified institutional buyers. At the end of the period, the value of these securities amounted to $10,747,000 or 0.1% of net assets. |
(g) Security is perpetual in nature with no stated maturity date. |
(h) Security or a portion of the security purchased on a delayed delivery or when-issued basis. |
(i) Security or a portion of the security was pledged to cover margin requirements for futures contracts. At period end, the value of securities pledged amounted to $1,930,000. |
(j) Amount is stated in United States dollars unless otherwise noted. |
(k) Restricted securities - Investment in securities not registered under the Securities Act of 1933 (excluding 144A issues). At the end of the period, the value of restricted securities (excluding 144A issues) amounted to $106,866,000 or 1.0% of net assets. |
Additional information on each restricted holding is as follows: |
Security | Acquisition Date | Acquisition Cost (000s) |
China Internet Plus Holdings Ltd. | 1/26/15 | $ 18,833 |
Credit Suisse Group AG | 10/21/15 | $ 86,402 |
Affiliated Central Funds |
Information regarding fiscal year to date income earned by the Fund from investments in Fidelity Central Funds is as follows: |
Fund | Income earned
(Amounts in thousands) |
Fidelity Cash Central Fund | $ 655 |
Fidelity Securities Lending Cash Central Fund | 3,281 |
Total | $ 3,936 |
Other Affiliated Issuers |
An affiliated company is a company in which the Fund has ownership of at least 5% of the voting securities. Fiscal year to date transactions with companies which are or were affiliates are as follows: |
Affiliate
(Amounts in thousands) | Value, beginning of period | Purchases | Sales Proceeds* | Dividend Income | Value,
end of
period |
Hoegh LNG Partners LP | $ 12,426 | $ 2,837 | $ 275 | $ 729 | $ 11,465 |
MySale Group PLC | 26,053 | - | 5,920 | - | - |
PAX Global Technology Ltd. | 71,203 | 795 | 36,965 | 112 | - |
Rex Bionics PLC | 3,518 | - | 24 | - | 976 |
Total | $ 113,200 | $ 3,632 | $ 43,184 | $ 841 | $ 12,441 |
* Includes the value of securities delivered through in-kind transactions, if applicable.
See accompanying notes which are an integral part of the financial statements.
Annual Report
Other Information |
Categorizations in the Schedule of Investments are based on country or territory of incorporation. |
The following is a summary of the inputs used, as of October 31, 2015, involving the Fund's assets and liabilities carried at fair value. The inputs or methodology used for valuing securities may not be an indication of the risk associated with investing in those securities. For more information on valuation inputs, and their aggregation into the levels used in the tables below, please refer to the Investment Valuation section in the accompanying Notes to Financial Statements. |
Valuation Inputs at Reporting Date: |
Description
(Amounts in thousands) | Total | Level 1 | Level 2 | Level 3 |
Investments in Securities: | | | | |
Equities: | | | | |
Consumer Discretionary | $ 1,898,277 | $ 1,361,738 | $ 513,540 | $ 22,999 |
Consumer Staples | 1,297,202 | 666,346 | 630,856 | - |
Energy | 467,483 | 180,488 | 286,995 | - |
Financials | 2,676,653 | 1,281,424 | 1,395,229 | - |
Health Care | 1,416,831 | 497,206 | 919,625 | - |
Industrials | 1,146,371 | 836,192 | 310,179 | - |
Information Technology | 830,123 | 605,993 | 224,130 | - |
Materials | 240,897 | 157,404 | 83,493 | - |
Telecommunication Services | 528,010 | 7,969 | 520,041 | - |
Government Obligations | 1,930 | - | 1,930 | - |
Preferred Securities | 10,747 | - | 10,747 | - |
Money Market Funds | 575,500 | 575,500 | - | - |
Total Investments in Securities: | $ 11,090,024 | $ 6,170,260 | $ 4,896,765 | $ 22,999 |
Derivative Instruments: | | | | |
Assets | | | | |
Futures Contracts | $ 9,203 | $ 9,203 | $ - | $ - |
The following is a summary of transfers between Level 1 and Level 2 for the period ended October 31, 2015. Transfers are assumed to have occurred at the beginning of the period, and are primarily attributable to the valuation techniques used for foreign equity securities, as discussed in the accompanying Notes to Financial Statements: |
Transfers | Total (000s) |
Level 1 to Level 2 | $ 381,182 |
Level 2 to Level 1 | $ 79,997 |
Value of Derivative Instruments |
The following table is a summary of the Fund's value of derivative instruments by primary risk exposure as of October 31, 2015. For additional information on derivative instruments, please refer to the Derivative Instruments section in the accompanying Notes to Financial Statements. |
Primary Risk Exposure /
Derivative Type | Value (000s) |
| Asset | Liability |
Equity Risk | | |
Futures Contracts (a) | $ 9,203 | $ - |
Total Value of Derivatives | $ 9,203 | $ - |
(a) Reflects gross cumulative appreciation (depreciation) on futures contracts as presented in the Schedule of Investments. Only the period end receivable or payable for daily variation margin and net unrealized appreciation (depreciation) are presented in the Statement of Assets and Liabilities. |
See accompanying notes which are an integral part of the financial statements.
Annual Report
Statement of Assets and Liabilities
Amounts in thousands (except per-share amounts) | | October 31, 2015 |
| | |
Assets | | |
Investment in securities, at value (including securities loaned of $44,670) - See accompanying schedule: Unaffiliated issuers (cost $9,188,061) | $ 10,502,083 | |
Fidelity Central Funds (cost $575,500) | 575,500 | |
Other affiliated issuers (cost $18,503) | 12,441 | |
Total Investments (cost $9,782,064) | | $ 11,090,024 |
Segregated cash with brokers for derivative instruments | | 9,348 |
Cash | | 172 |
Foreign currency held at value (cost $21,001) | | 21,001 |
Receivable for investments sold | | 28,370 |
Receivable for fund shares sold | | 12,338 |
Dividends receivable | | 24,068 |
Distributions receivable from Fidelity Central Funds | | 111 |
Prepaid expenses | | 30 |
Other receivables | | 3,575 |
Total assets | | 11,189,037 |
| | |
Liabilities | | |
Payable for investments purchased | | |
Regular delivery | $ 75,392 | |
Delayed delivery | 83,867 | |
Payable for fund shares redeemed | 5,982 | |
Accrued management fee | 7,145 | |
Distribution and service plan fees payable | 104 | |
Payable for daily variation margin for derivative instruments | 1,067 | |
Other affiliated payables | 1,508 | |
Other payables and accrued expenses | 593 | |
Collateral on securities loaned, at value | 46,206 | |
Total liabilities | | 221,864 |
| | |
Net Assets | | $ 10,967,173 |
Net Assets consist of: | | |
Paid in capital | | $ 9,614,122 |
Undistributed net investment income | | 108,769 |
Accumulated undistributed net realized gain (loss) on investments and foreign currency transactions | | (73,154) |
Net unrealized appreciation (depreciation) on investments and assets and liabilities in foreign currencies | | 1,317,436 |
Net Assets | | $ 10,967,173 |
See accompanying notes which are an integral part of the financial statements.
Annual Report
Statement of Assets and Liabilities - continued
Amounts in thousands (except per-share amounts) | | October 31, 2015 |
| | |
Calculation of Maximum Offering Price | | |
Class A:
Net Asset Value and redemption price per share ($282,714 ÷ 7,106.131 shares) | | $ 39.78 |
| | |
Maximum offering price per share (100/94.25 of $39.78) | | $ 42.21 |
Class T:
Net Asset Value and redemption price per share ($42,965 ÷ 1,087.491 shares) | | $ 39.51 |
| | |
Maximum offering price per share (100/96.50 of $39.51) | | $ 40.94 |
Class B:
Net Asset Value and offering price per share ($2,249 ÷ 57.378 shares)A | | $ 39.20 |
| | |
Class C:
Net Asset Value and offering price per share ($31,737 ÷ 810.917 shares)A | | $ 39.14 |
| | |
International Discovery:
Net Asset Value, offering price and redemption price per share ($7,208,744 ÷ 179,698.201 shares) | | $ 40.12 |
| | |
Class K:
Net Asset Value, offering price and redemption price per share ($2,307,850 ÷ 57,614.604 shares) | | $ 40.06 |
| | |
Class I:
Net Asset Value, offering price and redemption price per share ($1,060,821 ÷ 26,500.627 shares) | | $ 40.03 |
| | |
Class Z:
Net Asset Value, offering price and redemption price per share ($30,093 ÷ 751.671 shares) | | $ 40.03 |
A Redemption price per share is equal to net asset value less any applicable contingent deferred sales charge.
See accompanying notes which are an integral part of the financial statements.
Annual Report
Financial Statements - continued
Statement of Operations
Amounts in thousands | Year ended October 31, 2015 |
| | |
Investment Income | | |
Dividends (including $841 earned from other affiliated issuers) | | $ 237,713 |
Special dividends | | 34,094 |
Interest | | 101 |
Income from Fidelity Central Funds | | 3,936 |
Income before foreign taxes withheld | | 275,844 |
Less foreign taxes withheld | | (19,005) |
Total income | | 256,839 |
| | |
Expenses | | |
Management fee | | |
Basic fee | $ 74,535 | |
Performance adjustment | 11,730 | |
Transfer agent fees | 16,773 | |
Distribution and service plan fees | 1,337 | |
Accounting and security lending fees | 1,839 | |
Custodian fees and expenses | 1,612 | |
Independent trustees' compensation | 47 | |
Registration fees | 226 | |
Audit | 124 | |
Legal | 30 | |
Miscellaneous | 101 | |
Total expenses before reductions | 108,354 | |
Expense reductions | (1,353) | 107,001 |
Net investment income (loss) | | 149,838 |
Realized and Unrealized Gain (Loss) | | |
Net realized gain (loss) on: | | |
Investment securities: | | |
Unaffiliated issuers (net of foreign taxes of $606) | 220,061 | |
Other affiliated issuers | (3,654) | |
Foreign currency transactions | (3,878) | |
Futures contracts | 33,241 | |
Total net realized gain (loss) | | 245,770 |
Change in net unrealized appreciation (depreciation) on: Investment securities (net of decrease in deferred foreign taxes of $7,503) | 13,737 | |
Assets and liabilities in foreign currencies | 2,313 | |
Futures contracts | (15,395) | |
Total change in net unrealized appreciation (depreciation) | | 655 |
Net gain (loss) | | 246,425 |
Net increase (decrease) in net assets resulting from operations | | $ 396,263 |
See accompanying notes which are an integral part of the financial statements.
Annual Report
Statement of Changes in Net Assets
Amounts in thousands | Year ended
October 31,
2015 | Year ended
October 31,
2014 |
Increase (Decrease) in Net Assets | | |
Operations | | |
Net investment income (loss) | $ 149,838 | $ 199,098 |
Net realized gain (loss) | 245,770 | 758,004 |
Change in net unrealized appreciation (depreciation) | 655 | (958,756) |
Net increase (decrease) in net assets resulting from operations | 396,263 | (1,654) |
Distributions to shareholders from net investment income | (74,589) | (136,326) |
Distributions to shareholders from net realized gain | - | (88,586) |
Total distributions | (74,589) | (224,912) |
Share transactions - net increase (decrease) | (353,147) | (69,908) |
Redemption fees | 95 | 139 |
Total increase (decrease) in net assets | (31,378) | (296,335) |
| | |
Net Assets | | |
Beginning of period | 10,998,551 | 11,294,886 |
End of period (including undistributed net investment income of $108,769 and undistributed net investment income of $68,609, respectively) | $ 10,967,173 | $ 10,998,551 |
See accompanying notes which are an integral part of the financial statements.
Annual Report
Financial Highlights - Fidelity International Discovery Fund Class A
Years ended October 31, | 2015 | 2014 | 2013 | 2012 | 2011 |
Selected Per-Share Data | | | | | |
Net asset value, beginning of period | $ 38.70 | $ 39.49 | $ 31.66 | $ 29.43 | $ 32.07 |
Income from Investment Operations | | | | | |
Net investment income (loss) C | .40F | .53G | .34 | .41 | .42 |
Net realized and unrealized gain (loss) | .79 | (.67) | 7.97 | 2.11 | (2.52) |
Total from investment operations | 1.19 | (.14) | 8.31 | 2.52 | (2.10) |
Distributions from net investment income | (.11) | (.33) | (.45) | (.29) | (.38) |
Distributions from net realized gain | - | (.31) | (.03) | - | (.16) |
Total distributions | (.11) | (.65) K | (.48) | (.29) | (.54) |
Redemption fees added to paid in capitalC, I | - | - | - | - | - |
Net asset value, end of period | $ 39.78 | $ 38.70 | $ 39.49 | $ 31.66 | $ 29.43 |
Total ReturnA, B | 3.09% | (.36)% | 26.59% | 8.70% | (6.71)% |
Ratios to Average Net AssetsD, H | | | | |
Expenses before reductions | 1.33% | 1.28% | 1.35% | 1.34% | 1.30% |
Expenses net of fee waivers, if any | 1.33% | 1.28% | 1.35% | 1.34% | 1.29% |
Expenses net of all reductions | 1.32% | 1.28% | 1.33% | 1.31% | 1.25% |
Net investment income (loss) | 1.00%F | 1.35%G | .97% | 1.41% | 1.31% |
Supplemental Data | | | | | |
Net assets, end of period (in millions) | $ 283 | $ 297 | $ 347 | $ 299 | $ 320 |
Portfolio turnover rateE | 60%J | 57% | 65% | 68% | 75% |
A Total returns would have been lower if certain expenses had not been reduced during the applicable periods shown.
B Total returns do not include the effect of the sales charges.
C Calculated based on average shares outstanding during the period.
D Fees and expenses of any underlying Fidelity Central Funds are not included in the Fund's expense ratio. The Fund indirectly bears its proportionate share of the expenses of any underlying Fidelity Central Funds.
E Amount does not include the portfolio activity of any underlying Fidelity Central Funds.
F Investment income per share reflects a large, non-recurring dividend which amounted to $.12 per share. Excluding this non-recurring dividend, the ratio of net investment income (loss) to average net assets would have been .69%.
G Investment income per share reflects a large, non-recurring dividend which amounted to $.22 per share. Excluding this non-recurring dividend, the ratio of net investment income (loss) to average net assets would have been .80%.
H Expense ratios reflect operating expenses of the class. Expenses before reductions do not reflect amounts reimbursed by the investment adviser or reductions from brokerage service arrangements or reductions from other expense offset arrangements and do not represent the amount paid by the class during periods when reimbursements or reductions occur. Expenses net of fee waivers reflect expenses after reimbursement by the investment adviser but prior to reductions from brokerage service arrangements or other expense offset arrangements. Expenses net of all reductions represent the net expenses paid by the class.
I Amount represents less than $.005 per share.
J Portfolio turnover rate excludes securities received or delivered in-kind.
K Total distributions of $.65 per share is comprised of distributions from net investment income of $.334 and distributions from net realized gain of $.311 per share.
See accompanying notes which are an integral part of the financial statements.
Annual Report
Financial Highlights - Fidelity International Discovery Fund Class T
Years ended October 31, | 2015 | 2014 | 2013 | 2012 | 2011 |
Selected Per-Share Data | | | | | |
Net asset value, beginning of period | $ 38.43 | $ 39.23 | $ 31.42 | $ 29.18 | $ 31.81 |
Income from Investment Operations | | | | | |
Net investment income (loss) C | .30F | .44G | .26 | .34 | .34 |
Net realized and unrealized gain (loss) | .80 | (.68) | 7.92 | 2.09 | (2.51) |
Total from investment operations | 1.10 | (.24) | 8.18 | 2.43 | (2.17) |
Distributions from net investment income | (.02) | (.25) | (.34) | (.19) | (.30) |
Distributions from net realized gain | - | (.31) | (.03) | - | (.16) |
Total distributions | (.02) | (.56) | (.37) | (.19) | (.46) |
Redemption fees added to paid in capitalC, I | - | - | - | - | - |
Net asset value, end of period | $ 39.51 | $ 38.43 | $ 39.23 | $ 31.42 | $ 29.18 |
Total ReturnA, B | 2.86% | (.60)% | 26.31% | 8.41% | (6.96)% |
Ratios to Average Net AssetsD, H | | | | | |
Expenses before reductions | 1.57% | 1.51% | 1.59% | 1.59% | 1.56% |
Expenses net of fee waivers, if any | 1.57% | 1.51% | 1.59% | 1.59% | 1.55% |
Expenses net of all reductions | 1.56% | 1.51% | 1.57% | 1.56% | 1.51% |
Net investment income (loss) | .76%F | 1.11%G | .73% | 1.16% | 1.05% |
Supplemental Data | | | | | |
Net assets, end of period (in millions) | $ 43 | $ 49 | $ 53 | $ 46 | $ 61 |
Portfolio turnover rateE | 60%J | 57% | 65% | 68% | 75% |
A Total returns would have been lower if certain expenses had not been reduced during the applicable periods shown.
B Total returns do not include the effect of the sales charges.
C Calculated based on average shares outstanding during the period.
D Fees and expenses of any underlying Fidelity Central Funds are not included in the Fund's expense ratio. The Fund indirectly bears its proportionate share of the expenses of any underlying Fidelity Central Funds.
E Amount does not include the portfolio activity of any underlying Fidelity Central Funds.
F Investment income per share reflects a large, non-recurring dividend which amounted to $.12 per share. Excluding this non-recurring dividend, the ratio of net investment income (loss) to average net assets would have been .45%.
G Investment income per share reflects a large, non-recurring dividend which amounted to $.21 per share. Excluding this non-recurring dividend, the ratio of net investment income (loss) to average net assets would have been .56%.
H Expense ratios reflect operating expenses of the class. Expenses before reductions do not reflect amounts reimbursed by the investment adviser or reductions from brokerage service arrangements or reductions from other expense offset arrangements and do not represent the amount paid by the class during periods when reimbursements or reductions occur. Expenses net of fee waivers reflect expenses after reimbursement by the investment adviser but prior to reductions from brokerage service arrangements or other expense offset arrangements. Expenses net of all reductions represent the net expenses paid by the class.
I Amount represents less than $.005 per share.
J Portfolio turnover rate excludes securities received or delivered in-kind.
See accompanying notes which are an integral part of the financial statements.
Annual Report
Financial Highlights - Fidelity International Discovery Fund Class B
Years ended October 31, | 2015 | 2014 | 2013 | 2012 | 2011 |
Selected Per-Share Data | | | | | |
Net asset value, beginning of period | $ 38.32 | $ 39.08 | $ 31.28 | $ 29.02 | $ 31.60 |
Income from Investment Operations | | | | | |
Net investment income (loss) C | .08F | .22G | .08 | .19 | .17 |
Net realized and unrealized gain (loss) | .80 | (.66) | 7.90 | 2.09 | (2.48) |
Total from investment operations | .88 | (.44) | 7.98 | 2.28 | (2.31) |
Distributions from net investment income | - | (.01) | (.15) | (.02) | (.12) |
Distributions from net realized gain | - | (.31) | (.03) | - | (.16) |
Total distributions | - | (.32) | (.18) | (.02) | (.27) K |
Redemption fees added to paid in capitalC, I | - | - | - | - | - |
Net asset value, end of period | $ 39.20 | $ 38.32 | $ 39.08 | $ 31.28 | $ 29.02 |
Total ReturnA, B | 2.30% | (1.12)% | 25.64% | 7.85% | (7.39)% |
Ratios to Average Net AssetsD, H | | | | |
Expenses before reductions | 2.12% | 2.06% | 2.10% | 2.09% | 2.06% |
Expenses net of fee waivers, if any | 2.12% | 2.06% | 2.10% | 2.09% | 2.06% |
Expenses net of all reductions | 2.11% | 2.05% | 2.08% | 2.06% | 2.02% |
Net investment income (loss) | .21%F | .57%G | .22% | .66% | .54% |
Supplemental Data | | | | | |
Net assets, end of period (in millions) | $ 2 | $ 5 | $ 7 | $ 8 | $ 10 |
Portfolio turnover rateE | 60%J | 57% | 65% | 68% | 75% |
A Total returns would have been lower if certain expenses had not been reduced during the applicable periods shown.
B Total returns do not include the effect of the contingent deferred sales charge.
C Calculated based on average shares outstanding during the period.
D Fees and expenses of any underlying Fidelity Central Funds are not included in the Fund's expense ratio. The Fund indirectly bears its proportionate share of the expenses of any underlying Fidelity Central Funds.
E Amount does not include the portfolio activity of any underlying Fidelity Central Funds.
F Investment income per share reflects a large, non-recurring dividend which amounted to $.12 per share. Excluding this non-recurring dividend, the ratio of net investment income (loss) to average net assets would have been (.10)%.
G Investment income per share reflects a large, non-recurring dividend which amounted to $.21 per share. Excluding this non-recurring dividend, the ratio of net investment income (loss) to average net assets would have been .02%.
H Expense ratios reflect operating expenses of the class. Expenses before reductions do not reflect amounts reimbursed by the investment adviser or reductions from brokerage service arrangements or reductions from other expense offset arrangements and do not represent the amount paid by the class during periods when reimbursements or reductions occur. Expenses net of fee waivers reflect expenses after reimbursement by the investment adviser but prior to reductions from brokerage service arrangements or other expense offset arrangements. Expenses net of all reductions represent the net expenses paid by the class.
I Amount represents less than $.005 per share.
J Portfolio turnover rate excludes securities received or delivered in-kind.
K Total distributions of $.27 per share is comprised of distributions from net investment income of $.115 and distributions from net realized gain of $.155 per share.
See accompanying notes which are an integral part of the financial statements.
Annual Report
Financial Highlights - Fidelity International Discovery Fund Class C
Years ended October 31, | 2015 | 2014 | 2013 | 2012 | 2011 |
Selected Per-Share Data | | | | | |
Net asset value, beginning of period | $ 38.25 | $ 39.07 | $ 31.32 | $ 29.08 | $ 31.68 |
Income from Investment Operations | | | | | |
Net investment income (loss) C | .10F | .23G | .08 | .19 | .18 |
Net realized and unrealized gain (loss) | .79 | (.66) | 7.90 | 2.09 | (2.49) |
Total from investment operations | .89 | (.43) | 7.98 | 2.28 | (2.31) |
Distributions from net investment income | - | (.08) | (.20) | (.04) | (.14) |
Distributions from net realized gain | - | (.31) | (.03) | - | (.16) |
Total distributions | - | (.39) | (.23) | (.04) | (.29) K |
Redemption fees added to paid in capitalC, I | - | - | - | - | - |
Net asset value, end of period | $ 39.14 | $ 38.25 | $ 39.07 | $ 31.32 | $ 29.08 |
Total ReturnA, B | 2.33% | (1.10)% | 25.65% | 7.86% | (7.37)% |
Ratios to Average Net AssetsD, H | | | | | |
Expenses before reductions | 2.09% | 2.03% | 2.10% | 2.09% | 2.05% |
Expenses net of fee waivers, if any | 2.09% | 2.03% | 2.09% | 2.09% | 2.04% |
Expenses net of all reductions | 2.08% | 2.02% | 2.07% | 2.06% | 2.00% |
Net investment income (loss) | .24%F | .60%G | .23% | .66% | .56% |
Supplemental Data | | | | | |
Net assets, end of period (in millions) | $ 32 | $ 35 | $ 36 | $ 30 | $ 33 |
Portfolio turnover rateE | 60%J | 57% | 65% | 68% | 75% |
A Total returns would have been lower if certain expenses had not been reduced during the applicable periods shown.
B Total returns do not include the effect of the contingent deferred sales charge.
C Calculated based on average shares outstanding during the period.
D Fees and expenses of any underlying Fidelity Central Funds are not included in the Fund's expense ratio. The Fund indirectly bears its proportionate share of the expenses of any underlying Fidelity Central Funds.
E Amount does not include the portfolio activity of any underlying Fidelity Central Funds.
F Investment income per share reflects a large, non-recurring dividend which amounted to $.12 per share. Excluding this non-recurring dividend, the ratio of net investment income (loss) to average net assets would have been (.06)%.
G Investment income per share reflects a large, non-recurring dividend which amounted to $.21 per share. Excluding this non-recurring dividend, the ratio of net investment income (loss) to average net assets would have been .05%.
H Expense ratios reflect operating expenses of the class. Expenses before reductions do not reflect amounts reimbursed by the investment adviser or reductions from brokerage service arrangements or reductions from other expense offset arrangements and do not represent the amount paid by the class during periods when reimbursements or reductions occur. Expenses net of fee waivers reflect expenses after reimbursement by the investment adviser but prior to reductions from brokerage service arrangements or other expense offset arrangements. Expenses net of all reductions represent the net expenses paid by the class.
I Amount represents less than $.005 per share.
J Portfolio turnover rate excludes securities received or delivered in-kind.
K Total distributions of $.29 per share is comprised of distributions from net investment income of $.137 and distributions from net realized gain of $.155 per share.
See accompanying notes which are an integral part of the financial statements.
Annual Report
Financial Highlights - Fidelity International Discovery Fund
Years ended October 31, | 2015 | 2014 | 2013 | 2012 | 2011 |
Selected Per-Share Data | | | | | |
Net asset value, beginning of period | $ 39.03 | $ 39.82 | $ 31.91 | $ 29.69 | $ 32.34 |
Income from Investment Operations | | | | | |
Net investment income (loss) B | .54E | .67F | .47 | .51 | .53 |
Net realized and unrealized gain (loss) | .81 | (.68) | 8.02 | 2.12 | (2.54) |
Total from investment operations | 1.35 | (.01) | 8.49 | 2.63 | (2.01) |
Distributions from net investment income | (.26) | (.47) | (.55) | (.41) | (.48) |
Distributions from net realized gain | - | (.31) | (.03) | - | (.16) |
Total distributions | (.26) | (.78) | (.58) | (.41) | (.64) |
Redemption fees added to paid in capitalB, H | - | - | - | - | - |
Net asset value, end of period | $ 40.12 | $ 39.03 | $ 39.82 | $ 31.91 | $ 29.69 |
Total ReturnA | 3.47% | (.01)% | 27.03% | 9.03% | (6.39)% |
Ratios to Average Net AssetsC, G | | | | | |
Expenses before reductions | .99% | .93% | 1.00% | 1.01% | .97% |
Expenses net of fee waivers, if any | .99% | .93% | 1.00% | 1.01% | .96% |
Expenses net of all reductions | .98% | .93% | .98% | .98% | .92% |
Net investment income (loss) | 1.34%E | 1.69%F | 1.32% | 1.73% | 1.64% |
Supplemental Data | | | | | |
Net assets, end of period (in millions) | $ 7,209 | $ 7,464 | $ 7,800 | $ 5,965 | $ 6,806 |
Portfolio turnover rateD | 60%I | 57% | 65% | 68% | 75% |
A Total returns would have been lower if certain expenses had not been reduced during the applicable periods shown.
B Calculated based on average shares outstanding during the period.
C Fees and expenses of any underlying Fidelity Central Funds are not included in the Fund's expense ratio. The Fund indirectly bears its proportionate share of the expenses of any underlying Fidelity Central Funds.
D Amount does not include the portfolio activity of any underlying Fidelity Central Funds.
E Investment income per share reflects a large, non-recurring dividend which amounted to $.12 per share. Excluding this non-recurring dividend, the ratio of net investment income (loss) to average net assets would have been 1.03%.
F Investment income per share reflects a large, non-recurring dividend which amounted to $.22 per share. Excluding this non-recurring dividend, the ratio of net investment income (loss) to average net assets would have been 1.15%.
G Expense ratios reflect operating expenses of the class. Expenses before reductions do not reflect amounts reimbursed by the investment adviser or reductions from brokerage service arrangements or reductions from other expense offset arrangements and do not represent the amount paid by the class during periods when reimbursements or reductions occur. Expenses net of fee waivers reflect expenses after reimbursement by the investment adviser but prior to reductions from brokerage service arrangements or other expense offset arrangements. Expenses net of all reductions represent the net expenses paid by the class.
H Amount represents less than $.005 per share.
I Portfolio turnover rate excludes securities received or delivered in-kind.
See accompanying notes which are an integral part of the financial statements.
Annual Report
Financial Highlights - Fidelity International Discovery Fund Class K
Years ended October 31, | 2015 | 2014 | 2013 | 2012 | 2011 |
Selected Per-Share Data | | | | | |
Net asset value, beginning of period | $ 38.97 | $ 39.76 | $ 31.87 | $ 29.66 | $ 32.32 |
Income from Investment Operations | | | | | |
Net investment income (loss) B | .59E | .72F | .52 | .57 | .58 |
Net realized and unrealized gain (loss) | .81 | (.67) | 8.01 | 2.11 | (2.54) |
Total from investment operations | 1.40 | .05 | 8.53 | 2.68 | (1.96) |
Distributions from net investment income | (.31) | (.53) | (.61) | (.47) | (.55) |
Distributions from net realized gain | - | (.31) | (.03) | - | (.16) |
Total distributions | (.31) | (.84) | (.64) | (.47) | (.70) J |
Redemption fees added to paid in capitalB, H | - | - | - | - | - |
Net asset value, end of period | $ 40.06 | $ 38.97 | $ 39.76 | $ 31.87 | $ 29.66 |
Total ReturnA | 3.61% | .13% | 27.23% | 9.24% | (6.24)% |
Ratios to Average Net AssetsC, G | | | | |
Expenses before reductions | .86% | .80% | .85% | .83% | .80% |
Expenses net of fee waivers, if any | .86% | .80% | .85% | .83% | .79% |
Expenses net of all reductions | .85% | .79% | .83% | .80% | .75% |
Net investment income (loss) | 1.47%E | 1.83%F | 1.47% | 1.91% | 1.81% |
Supplemental Data | | | | | |
Net assets, end of period (in millions) | $ 2,308 | $ 2,464 | $ 2,576 | $ 1,776 | $ 1,245 |
Portfolio turnover rateD | 60%I | 57% | 65% | 68% | 75% |
A Total returns would have been lower if certain expenses had not been reduced during the applicable periods shown.
B Calculated based on average shares outstanding during the period.
C Fees and expenses of any underlying Fidelity Central Funds are not included in the Fund's expense ratio. The Fund indirectly bears its proportionate share of the expenses of any underlying Fidelity Central Funds.
D Amount does not include the portfolio activity of any underlying Fidelity Central Funds.
E Investment income per share reflects a large, non-recurring dividend which amounted to $.12 per share. Excluding this non-recurring dividend, the ratio of net investment income (loss) to average net assets would have been 1.16%.
F Investment income per share reflects a large, non-recurring dividend which amounted to $.22 per share. Excluding this non-recurring dividend, the ratio of net investment income (loss) to average net assets would have been 1.28%.
G Expense ratios reflect operating expenses of the class. Expenses before reductions do not reflect amounts reimbursed by the investment adviser or reductions from brokerage service arrangements or reductions from other expense offset arrangements and do not represent the amount paid by the class during periods when reimbursements or reductions occur. Expenses net of fee waivers reflect expenses after reimbursement by the investment adviser but prior to reductions from brokerage service arrangements or other expense offset arrangements. Expenses net of all reductions represent the net expenses paid by the class.
H Amount represents less than $.005 per share.
I Portfolio turnover rate excludes securities received or delivered in-kind.
J Total distributions of $.70 per share is comprised of distributions from net investment income of $.548 and distributions from net realized gain of $.155 per share.
See accompanying notes which are an integral part of the financial statements.
Annual Report
Financial Highlights - Fidelity International Discovery Fund Class I
Years ended October 31, | 2015 | 2014 | 2013 | 2012 | 2011 |
Selected Per-Share Data | | | | | |
Net asset value, beginning of period | $ 38.96 | $ 39.76 | $ 31.87 | $ 29.65 | $ 32.31 |
Income from Investment Operations | | | | | |
Net investment income (loss) B | .53E | .67F | .47 | .52 | .54 |
Net realized and unrealized gain (loss) | .80 | (.68) | 8.01 | 2.11 | (2.55) |
Total from investment operations | 1.33 | (.01) | 8.48 | 2.63 | (2.01) |
Distributions from net investment income | (.26) | (.48) | (.56) | (.41) | (.50) |
Distributions from net realized gain | - | (.31) | (.03) | - | (.16) |
Total distributions | (.26) | (.79) | (.59) | (.41) | (.65) J |
Redemption fees added to paid in capitalB, H | - | - | - | - | - |
Net asset value, end of period | $ 40.03 | $ 38.96 | $ 39.76 | $ 31.87 | $ 29.65 |
Total ReturnA | 3.44% | (.01)% | 27.03% | 9.07% | (6.39)% |
Ratios to Average Net AssetsC, G | | | | | |
Expenses before reductions | 1.00% | .93% | 1.00% | 1.00% | .95% |
Expenses net of fee waivers, if any | .99% | .93% | 1.00% | 1.00% | .94% |
Expenses net of all reductions | .98% | .93% | .97% | .97% | .90% |
Net investment income (loss) | 1.33%E | 1.69%F | 1.33% | 1.75% | 1.66% |
Supplemental Data | | | | | |
Net assets, end of period (in millions) | $ 1,061 | $ 650 | $ 476 | $ 294 | $ 278 |
Portfolio turnover rateD | 60%I | 57% | 65% | 68% | 75% |
A Total returns would have been lower if certain expenses had not been reduced during the applicable periods shown.
B Calculated based on average shares outstanding during the period.
C Fees and expenses of any underlying Fidelity Central Funds are not included in the Fund's expense ratio. The Fund indirectly bears its proportionate share of the expenses of any underlying Fidelity Central Funds.
D Amount does not include the portfolio activity of any underlying Fidelity Central Funds.
E Investment income per share reflects a large, non-recurring dividend which amounted to $.12 per share. Excluding this non-recurring dividend, the ratio of net investment income (loss) to average net assets would have been 1.03%.
F Investment income per share reflects a large, non-recurring dividend which amounted to $.22 per share. Excluding this non-recurring dividend, the ratio of net investment income (loss) to average net assets would have been 1.14%.
G Expense ratios reflect operating expenses of the class. Expenses before reductions do not reflect amounts reimbursed by the investment adviser or reductions from brokerage service arrangements or reductions from other expense offset arrangements and do not represent the amount paid by the class during periods when reimbursements or reductions occur. Expenses net of fee waivers reflect expenses after reimbursement by the investment adviser but prior to reductions from brokerage service arrangements or other expense offset arrangements. Expenses net of all reductions represent the net expenses paid by the class.
H Amount represents less than $.005 per share.
I Portfolio turnover rate excludes securities received or delivered in-kind.
J Total distributions of $.65 per share is comprised of distributions from net investment income of $.497 and distributions from net realized gain of $.155 per share.
See accompanying notes which are an integral part of the financial statements.
Annual Report
Financial Highlights - Fidelity International Discovery Fund Class Z
Years ended October 31, | 2015 | 2014 | 2013 I |
Selected Per-Share Data | | | |
Net asset value, beginning of period | $ 38.96 | $ 39.77 | $ 37.22 |
Income from Investment Operations | | | |
Net investment income (loss)D | .59G | .72H | .07 |
Net realized and unrealized gain (loss) | .80 | (.68) | 2.48 |
Total from investment operations | 1.39 | .04 | 2.55 |
Distributions from net investment income | (.32) | (.54) | - |
Distributions from net realized gain | - | (.31) | - |
Total distributions | (.32) | (.85) | - |
Redemption fees added to paid in capitalD, K | - | - | - |
Net asset value, end of period | $ 40.03 | $ 38.96 | $ 39.77 |
Total ReturnB, C | 3.58% | .12% | 6.85% |
Ratios to Average Net AssetsE, J | | | |
Expenses before reductions | .86% | .80% | .85%A |
Expenses net of fee waivers, if any | .86% | .80% | .85%A |
Expenses net of all reductions | .85% | .79% | .83%A |
Net investment income (loss) | 1.47%G | 1.83%H | .76%A |
Supplemental Data | | | |
Net assets, end of period (000 omitted) | $ 30,093 | $ 35,125 | $ 107 |
Portfolio turnover rateF | 60%L | 57% | 65% |
A Annualized
B Total returns for periods of less than one year are not annualized.
C Total returns would have been lower if certain expenses had not been reduced during the applicable periods shown.
D Calculated based on average shares outstanding during the period.
E Fees and expenses of any underlying Fidelity Central Funds are not included in the Fund's expense ratio. The Fund indirectly bears its proportionate share of the expenses of any underlying Fidelity Central Funds.
F Amount does not include the portfolio activity of any underlying Fidelity Central Funds.
G Investment income per share reflects a large, non-recurring dividend which amounted to $.12 per share. Excluding this non-recurring dividend, the ratio of net investment income (loss) to average net assets would have been 1.16%.
H Investment income per share reflects a large, non-recurring dividend which amounted to $.21 per share. Excluding this non-recurring dividend, the ratio of net investment income (loss) to average net assets would have been 1.28%.
I For the period August 13, 2013 (commencement of sale of shares) to October 31, 2013.
J Expense ratios reflect operating expenses of the class. Expenses before reductions do not reflect amounts reimbursed by the investment adviser or reductions from brokerage service arrangements or reductions from other expense offset arrangements and do not represent the amount paid by the class during periods when reimbursements or reductions occur. Expense ratios before reductions for start-up periods may not be representative of larger-term operating periods. Expenses net of fee waivers reflect expenses after reimbursement by the investment adviser but prior to reductions from brokerage service arrangements or other expense offset arrangements. Expenses net of all reductions represent the net expenses paid by the class.
K Amount represents less than $.005 per share.
L Portfolio turnover rate excludes securities received or delivered in-kind.
See accompanying notes which are an integral part of the financial statements.
Annual Report
For the period ended October 31, 2015
(Amounts in thousands except percentages)
1. Organization.
Fidelity International Discovery Fund (the Fund) is a fund of Fidelity Investment Trust (the Trust) and is authorized to issue an unlimited number of shares. The Trust is registered under the Investment Company Act of 1940, as amended (the 1940 Act), as an open-end management investment company organized as a Massachusetts business trust. The Fund offers Class A, Class T, Class C, International Discovery, Class K, Class I (formerly Institutional Class) and Class Z shares, each of which, along with Class B shares, has equal rights as to assets and voting privileges. Class B shares are closed to new accounts and additional purchases, except for exchanges and reinvestments. Each class has exclusive voting rights with respect to matters that affect that class. Class B shares will automatically convert to Class A shares after a holding period of seven years from the initial date of purchase.
2. Investments in Fidelity Central Funds.
The Fund invests in Fidelity Central Funds, which are open-end investment companies generally available only to other investment companies and accounts managed by the investment adviser and its affiliates. The Fund's Schedule of Investments lists each of the Fidelity Central Funds held as of period end, if any, as an investment of the Fund, but does not include the underlying holdings of each Fidelity Central Fund. As an Investing Fund, the Fund indirectly bears its proportionate share of the expenses of the underlying Fidelity Central Funds.
The Money Market Central Funds seek preservation of capital and current income and are managed by Fidelity Investments Money Management, Inc. (FIMM), an affiliate of the investment adviser. Annualized expenses of the Money Market Central Funds as of their most recent shareholder report date are less than .005%.
A complete unaudited list of holdings for each Fidelity Central Fund is available upon request or at the Securities and Exchange Commission (the SEC) website at www.sec.gov. In addition, the financial statements of the Fidelity Central Funds, which are not covered by the Fund's Report of Independent Registered Public Accounting Firm, are available on the SEC website or upon request.
3. Significant Accounting Policies.
The financial statements have been prepared in conformity with accounting principles generally accepted in the United States of America (GAAP), which require management to make certain estimates and assumptions at the date of the financial statements. Actual results could differ from those estimates. Subsequent events, if any, through the date that the financial statements were issued have been evaluated in the preparation of
Annual Report
Notes to Financial Statements - continued
(Amounts in thousands except percentages)
3. Significant Accounting Policies - continued
the financial statements. The following summarizes the significant accounting policies of the Fund:
Investment Valuation. Investments are valued as of 4:00 p.m. Eastern time on the last calendar day of the period. The Board of Trustees (the Board) has delegated the day to day responsibility for the valuation of the Fund's investments to the Fidelity Management & Research Company (FMR) Fair Value Committee (the Committee). In accordance with valuation policies and procedures approved by the Board, the Fund attempts to obtain prices from one or more third party pricing vendors or brokers to value its investments. When current market prices, quotations or currency exchange rates are not readily available or reliable, investments will be fair valued in good faith by the Committee, in accordance with procedures adopted by the Board. Factors used in determining fair value vary by investment type and may include market or investment specific events, changes in interest rates and credit quality. The frequency with which these procedures are used cannot be predicted and they may be utilized to a significant extent. The Committee oversees the Fund's valuation policies and procedures and reports to the Board on the Committee's activities and fair value determinations. The Board monitors the appropriateness of the procedures used in valuing the Fund's investments and ratifies the fair value determinations of the Committee.
The Fund categorizes the inputs to valuation techniques used to value its investments into a disclosure hierarchy consisting of three levels as shown below:
Level 1 - quoted prices in active markets for identical investments
Level 2 - other significant observable inputs (including quoted prices for similar investments, interest rates, prepayment speeds, etc.)
Level 3 - unobservable inputs (including the Fund's own assumptions based on the best information available)
Valuation techniques used to value the Fund's investments by major category are as follows:
Equity securities, including restricted securities, for which market quotations are readily available, are valued at the last reported sale price or official closing price as reported by a third party pricing vendor on the primary market or exchange on which they are traded and are categorized as Level 1 in the hierarchy. In the event there were no sales during the day or closing prices are not available, securities are valued at the last quoted bid price or may be valued using the last available price and are generally categorized as Level 2 in the hierarchy. For foreign equity securities, when market or security specific events arise, comparisons to the valuation of American Depositary Receipts (ADRs), futures contracts, Exchange-Traded Funds (ETFs) and certain indexes as well as quoted
Annual Report
3. Significant Accounting Policies - continued
Investment Valuation - continued
prices for similar securities may be used and would be categorized as Level 2 in the hierarchy. Utilizing these techniques may result in transfers between Level 1 and Level 2. For equity securities, including restricted securities, where observable inputs are limited, assumptions about market activity and risk are used and these securities may be categorized as Level 3 in the hierarchy.
Debt securities, including restricted securities, are valued based on evaluated prices received from third party pricing vendors or from brokers who make markets in such securities. Preferred securities and U.S. government and government agency obligations are valued by pricing vendors who utilize matrix pricing which considers yield or price of bonds of comparable quality, coupon, maturity and type or by broker-supplied prices. When independent prices are unavailable or unreliable, debt securities may be valued utilizing pricing methodologies which consider similar factors that would be used by third party pricing vendors. Debt securities are generally categorized as Level 2 in the hierarchy but may be Level 3 depending on the circumstances.
Futures contracts are valued at the settlement price established each day by the board of trade or exchange on which they are traded and are categorized as Level 1 in the hierarchy. Investments in open-end mutual funds, including the Fidelity Central Funds, are valued at their closing net asset value (NAV) each business day and are categorized as Level 1 in the hierarchy.
Changes in valuation techniques may result in transfers in or out of an assigned level within the disclosure hierarchy. The aggregate value of investments by input level as of October 31, 2015, including information on transfers between Levels 1 and 2 is included at the end of the Fund's Schedule of Investments.
Foreign Currency. The Fund may use foreign currency contracts to facilitate transactions in foreign-denominated securities. Gains and losses from these transactions may arise from changes in the value of the foreign currency or if the counterparties do not perform under the contracts' terms.
Foreign-denominated assets, including investment securities, and liabilities are translated into U.S. dollars at the exchange rates at period end. Purchases and sales of investment securities, income and dividends received and expenses denominated in foreign currencies are translated into U.S. dollars at the exchange rate in effect on the transaction date.
The effects of exchange rate fluctuations on investments are included with the net realized and unrealized gain (loss) on investment securities. Other foreign currency transactions resulting in realized and unrealized gain (loss) are disclosed separately.
Annual Report
Notes to Financial Statements - continued
(Amounts in thousands except percentages)
3. Significant Accounting Policies - continued
Investment Transactions and Income. For financial reporting purposes, the Fund's investment holdings and NAV include trades executed through the end of the last business day of the period. The NAV per share for processing shareholder transactions is calculated as of the close of business of the New York Stock Exchange (NYSE), normally 4:00 p.m. Eastern time and includes trades executed through the end of the prior business day. Gains and losses on securities sold are determined on the basis of identified cost and may include proceeds received from litigation. Dividend income is recorded on the ex-dividend date, except for certain dividends from foreign securities where the ex-dividend date may have passed, which are recorded as soon as the Fund is informed of the ex-dividend date. Non-cash dividends included in dividend income, if any, are recorded at the fair market value of the securities received. Income and capital gain distributions from Fidelity Central Funds, if any, are recorded on the ex-dividend date. Distributions received on securities that represent a return of capital or capital gain are recorded as a reduction of cost of investments and/or as a realized gain. Subsequent to ex-dividend date the Fund determines the components of these distributions, based upon receipt of tax filings or other correspondence relating to the underlying investment. Large, non-recurring dividends recognized by the Fund are presented separately on the Statement of Operations as "Special Dividends" and the impact of these dividends is presented in the Financial Highlights. Interest income is accrued as earned and includes coupon interest and amortization of premium and accretion of discount on debt securities as applicable. Investment income is recorded net of foreign taxes withheld where recovery of such taxes is uncertain.
Class Allocations and Expenses. Investment income, realized and unrealized capital gains and losses, common expenses of the Fund, and certain fund-level expense reductions, if any, are allocated daily on a pro-rata basis to each class based on the relative net assets of each class to the total net assets of the Fund. Each class differs with respect to transfer agent and distribution and service plan fees incurred. Certain expense reductions may also differ by class. For the reporting period, the allocated portion of income and expenses to each class as a percent of its average net assets may vary due to the timing of recording these transactions in relation to fluctuating net assets of the classes. Expenses directly attributable to a fund are charged to that fund. Expenses attributable to more than one fund are allocated among the respective funds on the basis of relative net assets or other appropriate methods. Expense estimates are accrued in the period to which they relate and adjustments are made when actual amounts are known.
Deferred Trustee Compensation. Under a Deferred Compensation Plan (the Plan), independent Trustees may elect to defer receipt of a portion of their annual compensation. Deferred amounts are invested in a cross-section of Fidelity funds, are marked-to-market and remain in the Fund until distributed in accordance with the Plan. The
Annual Report
3. Significant Accounting Policies - continued
Deferred Trustee Compensation - continued
investment of deferred amounts and the offsetting payable to the Trustees are included in the accompanying Statement of Assets and Liabilities.
Income Tax Information and Distributions to Shareholders. Each year, the Fund intends to qualify as a regulated investment company under Subchapter M of the Internal Revenue Code, including distributing substantially all of its taxable income and realized gains. As a result, no provision for U.S. Federal income taxes is required. As of October 31, 2015, the Fund did not have any unrecognized tax benefits in the financial statements; nor is the Fund aware of any tax positions for which it is reasonably possible that the total amounts of unrecognized tax benefits will significantly change in the next twelve months. The Fund files a U.S. federal tax return, in addition to state and local tax returns as required. The Fund's federal income tax returns are subject to examination by the Internal Revenue Service (IRS) for a period of three fiscal years after they are filed. State and local tax returns may be subject to examination for an additional fiscal year depending on the jurisdiction. Foreign taxes are provided for based on the Fund's understanding of the tax rules and rates that exist in the foreign markets in which it invests. The Fund is subject to a tax imposed on capital gains by certain countries in which it invests.
Distributions are declared and recorded on the ex-dividend date. Income dividends and capital gain distributions are declared separately for each class. Income and capital gain distributions are determined in accordance with income tax regulations, which may differ from GAAP. In addition, the Fund claimed a portion of the payment made to redeeming shareholders as a distribution for income tax purposes.
Capital accounts within the financial statements are adjusted for permanent book-tax differences. These adjustments have no impact on net assets or the results of operations. Capital accounts are not adjusted for temporary book-tax differences which will reverse in a subsequent period.
Book-tax differences are primarily due to futures contracts, foreign currency transactions, passive foreign investment companies (PFIC), market discount, certain foreign taxes, redemptions in-kind, deferred trustees compensation, capital loss carryforwards and losses deferred due to wash sales.
The federal tax cost of investment securities and unrealized appreciation (depreciation) as of period end were as follows:
Gross unrealized appreciation | $ 1,751,994 |
Gross unrealized depreciation | (459,470) |
Net unrealized appreciation (depreciation) on securities | $ 1,292,524 |
Tax Cost | $ 9,797,500 |
Annual Report
Notes to Financial Statements - continued
(Amounts in thousands except percentages)
3. Significant Accounting Policies - continued
Income Tax Information and Distributions to Shareholders - continued
The tax-based components of distributable earnings as of period end were as follows:
Undistributed ordinary income | $ 109,669 |
Capital loss carryforward | $ (49,248) |
Net unrealized appreciation (depreciation) on securities and other investments | $ 1,292,925 |
Capital loss carryforwards are only available to offset future capital gains of the Fund to the extent provided by regulations and may be limited. Under the Regulated Investment Company Modernization Act of 2010 (the Act), the Fund is permitted to carry forward capital losses incurred in taxable years beginning after December 22, 2010 for an unlimited period and such capital losses are required to be used prior to any losses that expire. The capital loss carryforward information presented below, including any applicable limitation, is estimated as of fiscal period end and is subject to adjustment.
Fiscal year of expiration | |
2017 | $ (49,248) |
The tax character of distributions paid was as follows:
| October 31, 2015 | October 31, 2014 |
Ordinary Income | $ 74,589 | $ 224,912 |
Short-Term Trading (Redemption) Fees. Shares held by investors in the Fund less than 30 days may have been subject to a redemption fee equal to 1.00% of the NAV of shares redeemed. All redemption fees, which reduce the proceeds of the shareholder redemption, are retained by the Fund and accounted for as an addition to paid in capital.
Delayed Delivery Transactions and When-Issued Securities. During the period, the Fund transacted in securities on a delayed delivery or when-issued basis. Payment and delivery may take place after the customary settlement period for that security. The price of the underlying securities and the date when the securities will be delivered and paid for are fixed at the time the transaction is negotiated. The securities purchased on a delayed delivery or when-issued basis are identified as such in the Fund's Schedule of Investments. The Fund may receive compensation for interest forgone in the purchase of a delayed delivery or when-issued security. With respect to purchase commitments, the Fund identifies securities as segregated in its records with a value at least equal to the amount of the commitment. Losses may arise due to changes in the value of the underlying securities or if the counterparty does not perform under the contract's terms, or if the issuer does not issue the securities due to political, economic, or other factors.
Annual Report
3. Significant Accounting Policies - continued
Restricted Securities. The Fund may invest in securities that are subject to legal or contractual restrictions on resale. These securities generally may be resold in transactions exempt from registration or to the public if the securities are registered. Disposal of these securities may involve time-consuming negotiations and expense, and prompt sale at an acceptable price may be difficult. Information regarding restricted securities is included at the end of the Fund's Schedule of Investments.
4. Derivative Instruments.
Risk Exposures and the Use of Derivative Instruments. The Fund's investment objective allows the Fund to enter into various types of derivative contracts, including futures contracts. Derivatives are investments whose value is primarily derived from underlying assets, indices or reference rates and may be transacted on an exchange or over-the-counter (OTC). Derivatives may involve a future commitment to buy or sell a specified asset based on specified terms, to exchange future cash flows at periodic intervals based on a notional principal amount, or for one party to make one or more payments upon the occurrence of specified events in exchange for periodic payments from the other party.
The Fund used derivatives to increase returns and to manage exposure to certain risks as defined below. The success of any strategy involving derivatives depends on analysis of numerous economic factors, and if the strategies for investment do not work as intended, the Fund may not achieve its objectives.
The Fund's use of derivatives increased or decreased its exposure to the following risk:
Equity Risk | Equity risk relates to the fluctuations in the value of financial instruments as a result of changes in market prices (other than those arising from interest rate risk or foreign exchange risk), whether caused by factors specific to an individual investment, its issuer, or all factors affecting all instruments traded in a market or market segment. |
The Fund is also exposed to additional risks from investing in derivatives, such as liquidity risk and counterparty credit risk. Liquidity risk is the risk that the Fund will be unable to close out the derivative in the open market in a timely manner. Counterparty credit risk is the risk that the counterparty will not be able to fulfill its obligation to the Fund. Counterparty credit risk related to exchange-traded futures contracts may be mitigated by the protection provided by the exchange on which they trade.
Investing in derivatives may involve greater risks than investing in the underlying assets directly and, to varying degrees, may involve risk of loss in excess of any initial investment and collateral received and amounts recognized in the Statement of Assets and Liabilities. In addition, there may be the risk that the change in value of the derivative contract does not correspond to the change in value of the underlying instrument.
Annual Report
Notes to Financial Statements - continued
(Amounts in thousands except percentages)
4. Derivative Instruments - continued
Futures Contracts. A futures contract is an agreement between two parties to buy or sell a specified underlying instrument for a fixed price at a specified future date. The Fund used futures contracts to manage its exposure to the stock market.
Upon entering into a futures contract, a fund is required to deposit either cash or securities (initial margin) with a clearing broker in an amount equal to a certain percentage of the face value of the contract. Futures contracts are marked-to-market daily and subsequent daily payments (variation margin) are made or received by a fund depending on the daily fluctuations in the value of the futures contracts and are recorded as unrealized appreciation or (depreciation). This receivable and/or payable, if any, is included in daily variation margin for derivative instruments in the Statement of Assets and Liabilities. Realized gain or (loss) is recorded upon the expiration or closing of a futures contract.
Any open futures contracts at period end are presented in the Schedule of Investments under the caption "Futures Contracts." The underlying face amount at value reflects each contract's exposure to the underlying instrument or index at period end. Securities deposited to meet initial margin requirements are identified in the Schedule of Investments. Cash deposited to meet initial margin requirements is presented as segregated cash with brokers for derivative instruments in the Statement of Assets and Liabilities.
During the period the Fund recognized net realized gain (loss) of $33,241 and a change in net unrealized appreciation (depreciation) of $(15,395) related to its investment in futures contracts. These amounts are included in the Statement of Operations.
5. Purchases and Sales of Investments.
Purchases and sales of securities, other than short-term securities and in-kind transactions, aggregated $6,392,387 and $6,317,742, respectively.
Redemptions In-Kind. During the period, 4,932 shares of the Fund held by unaffiliated entities were redeemed for cash and investments, including accrued interest with a value of $197,848. The net realized gain of $41,387 on investments delivered through in-kind redemptions is included in the accompanying Statement of Operations. The amount of in-kind redemptions is included in share transactions in the accompanying Statement of Changes in Net Assets as well as Note 11: Share Transactions. The Fund recognized no gain or loss for federal income tax purposes.
6. Fees and Other Transactions with Affiliates.
Management Fee. Fidelity Management & Research Company (the investment adviser) and its affiliates provide the Fund with investment management related services for which the Fund pays a monthly management fee. The management fee is the
Annual Report
6. Fees and Other Transactions with Affiliates - continued
Management Fee - continued
sum of an individual fund fee rate that is based on an annual rate of .424% of the Fund's average net assets and an annualized group fee rate that averaged .25% during the period. The group fee rate is based upon the average net assets of all the mutual funds advised by the investment adviser, including any mutual funds previously advised by the investment adviser that are currently advised by Fidelity SelectCo, LLC, an affiliate of the investment adviser. The group fee rate decreases as assets under management increase and increases as assets under management decrease. In addition, the management fee is subject to a performance adjustment (up to a maximum of ± .20% of the Fund's average net assets over a 36 month performance period). The upward or downward adjustment to the management fee is based on the relative investment performance of International Discovery as compared to its benchmark index, the MSCI EAFE Index, over the same 36 month performance period. For the reporting period, the total annual management fee rate, including the performance adjustment, was .78% of the Fund's average net assets. The performance adjustment included in the management fee rate may be higher or lower than the maximum performance adjustment rate due to the difference between the average net assets for the reporting and performance periods.
Distribution and Service Plan Fees. In accordance with Rule 12b-1 of the 1940 Act, the Fund has adopted separate Distribution and Service Plans for each class of shares. Certain classes pay Fidelity Distributors Corporation (FDC), an affiliate of the investment adviser, separate Distribution and Service Fees, each of which is based on an annual percentage of each class' average net assets. In addition, FDC may pay financial intermediaries for selling shares of the Fund and providing shareholder support services.
For the period, the Distribution and Service Fee rates, total fees and amounts retained by FDC were as follows:
| Distribution
Fee | Service
Fee | Total Fees | Retained
by FDC |
Class A | -% | .25% | $ 731 | $ 4 |
Class T | .25% | .25% | 229 | 1 |
Class B | .75% | .25% | 34 | 25 |
Class C | .75% | .25% | 343 | 37 |
| | | $ 1,337 | $ 67 |
Sales Load. FDC may receive a front-end sales charge of up to 5.75% for selling Class A shares and 3.50% for selling Class T shares, some of which is paid to financial intermediaries for selling shares of the Fund. Depending on the holding period, FDC may receive contingent deferred sales charges levied on Class A, Class T, Class B, and Class C redemptions. The deferred sales charges range from 5.00% to 1.00% for Class B shares, 1.00% for Class C shares, 1.00% for certain purchases of Class A shares and .25% for certain purchases of Class T shares.
Annual Report
Notes to Financial Statements - continued
(Amounts in thousands except percentages)
6. Fees and Other Transactions with Affiliates - continued
Sales Load - continued
For the period, sales charge amounts retained by FDC were as follows:
| Retained
by FDC |
Class A | $ 62 |
Class T | 7 |
Class B A | 1 |
Class C A | 3 |
| $ 73 |
A When Class B and Class C shares are initially sold, FDC pays commissions from its own resources to financial intermediaries through which the sales are made.
Transfer Agent Fees. Fidelity Investments Institutional Operations Company, Inc., (FIIOC), an affiliate of the investment adviser, is the transfer, dividend disbursing and shareholder servicing agent for each class of the Fund. FIIOC receives account fees and asset-based fees that vary according to the account size and type of account of the shareholders of the respective classes of the Fund, except for Class K and Class Z. FIIOC receives an asset-based fee of Class K's and Class Z's average net assets. FIIOC pays for typesetting, printing and mailing of shareholder reports, except proxy statements.
For the period, transfer agent fees for each class were as follows:
| Amount | % of
Class-Level Average
Net Assets |
Class A | $ 788 | .27 |
Class T | 117 | .26 |
Class B | 10 | .30 |
Class C | 93 | .27 |
International Discovery | 13,037 | .18 |
Class K | 1,135 | .05 |
Class I | 1,576 | .18 |
Class Z | 17 | .05 |
| $ 16,773 | |
Accounting and Security Lending Fees. Fidelity Service Company, Inc. (FSC), an affiliate of the investment adviser, maintains the Fund's accounting records. The accounting fee is based on the level of average net assets for each month. Under a separate contract, FSC administers the security lending program. The security lending fee is based on the number and duration of lending transactions.
Annual Report
6. Fees and Other Transactions with Affiliates - continued
Brokerage Commissions. The Fund placed a portion of its portfolio transactions with brokerage firms which are affiliates of the investment adviser. Brokerage commissions are included in net realized gain (loss) and change in net unrealized appreciation (depreciation) in the Statement of Operations. The commissions paid to these affiliated firms were $6 for the period.
Other. During the period, the investment adviser reimbursed the Fund for certain losses in the amount of $46
7. Committed Line of Credit.
The Fund participates with other funds managed by the investment adviser or an affiliate in a $4.25 billion credit facility (the "line of credit") to be utilized for temporary or emergency purposes to fund shareholder redemptions or for other short-term liquidity purposes. The Fund has agreed to pay commitment fees on its pro-rata portion of the line of credit, which amounted to $16 and is reflected in Miscellaneous expenses on the Statement of Operations. During the period, the Fund did not borrow on this line of credit.
8. Security Lending.
The Fund lends portfolio securities through a lending agent from time to time in order to earn additional income. For equity securities, a lending agent is used and may loan securities to certain qualified borrowers, including Fidelity Capital Markets (FCM), a broker-dealer affiliated with the Fund. On the settlement date of the loan, the Fund receives collateral (in the form of U.S. Treasury obligations, letters of credit and/or cash) against the loaned securities and maintains collateral in an amount not less than 100% of the market value of the loaned securities during the period of the loan. The market value of the loaned securities is determined at the close of business of the Fund and any additional required collateral is delivered to the Fund on the next business day. The Fund or borrower may terminate the loan at any time, and if the borrower defaults on its obligation to return the securities loaned because of insolvency or other reasons, the Fund may apply collateral received from the borrower against the obligation. The Fund may experience delays and costs in recovering the securities loaned. Any cash collateral received is invested in the Fidelity Securities Lending Cash Central Fund. The value of loaned securities and cash collateral at period end are disclosed on the Fund's Statement of Assets and Liabilities. Security lending income represents the income earned on investing cash collateral, less rebates paid to borrowers and any lending agent fees associated with the loan, plus any premium payments received for lending certain types of securities. Security lending income is presented in the Statement of Operations as a component of income from Fidelity Central Funds. Total security lending income during the period amounted to $3,281. During the period, there were no securities loaned to FCM.
Annual Report
Notes to Financial Statements - continued
(Amounts in thousands except percentages)
9. Expense Reductions.
Commissions paid to certain brokers with whom the investment adviser, or its affiliates, places trades on behalf of the Fund include an amount in addition to trade execution, which may be rebated back to the Fund to offset certain expenses. This amount totaled $1,110 for the period.
In addition, during the period the investment adviser reimbursed and/or waived a portion of fund-level operating expenses in the amount of $45 and a portion of class-level operating expenses as follows:
| Amount |
Class A | $ 6 |
Class T | 1 |
Class B | -* |
Class C | 1 |
International Discovery | 177 |
Class I | 13 |
| $ 198 |
* In the amount of less than five hundred dollars.
10. Distributions to Shareholders.
Distributions to shareholders of each class were as follows:
Years ended October 31, | 2015 | 2014 |
From net investment income | | |
Class A | $ 864 | $ 2,857 |
Class T | 23 | 344 |
Class B | - | 2 |
Class C | - | 79 |
International Discovery | 49,040 | 93,065 |
Class K | 19,835 | 33,983 |
Class I | 4,544 | 5,936 |
Class Z | 283 | 60 |
Total | $ 74,589 | $ 136,326 |
From net realized gain | | |
Class A | $ - | $ 2,660 |
Class T | - | 423 |
Class B | - | 52 |
Class C | - | 295 |
International Discovery | - | 61,190 |
Class K | - | 20,093 |
Class I | - | 3,838 |
Class Z | - | 35 |
Total | $ - | $ 88,586 |
Annual Report
11. Share Transactions.
Share transactions for each class were as follows and may contain automatic conversions between classes or exchanges between funds:
| Shares | Dollars |
Years ended October 31, | 2015 | 2014 | 2015 | 2014 |
Class A | | | | |
Shares sold | 1,331 | 1,382 | $ 53,289 | $ 54,489 |
Reinvestment of distributions | 22 | 137 | 843 | 5,280 |
Shares redeemed | (1,915) | (2,632) | (76,178) | (104,067) |
Net increase (decrease) | (562) | (1,113) | $ (22,046) | $ (44,298) |
Class T | | | | |
Shares sold | 178 | 200 | $ 7,105 | $ 7,804 |
Reinvestment of distributions | 1 | 19 | 23 | 736 |
Shares redeemed | (355) | (311) | (13,954) | (12,118) |
Net increase (decrease) | (176) | (92) | $ (6,826) | $ (3,578) |
Class B | | | | |
Shares sold | 1 | 6 | $ 53 | $ 233 |
Reinvestment of distributions | - | 1 | - | 51 |
Shares redeemed | (64) | (58) | (2,536) | (2,266) |
Net increase (decrease) | (63) | (51) | $ (2,483) | $ (1,982) |
Class C | | | | |
Shares sold | 201 | 232 | $ 7,918 | $ 9,059 |
Reinvestment of distributions | - | 9 | - | 337 |
Shares redeemed | (314) | (250) | (12,486) | (9,726) |
Net increase (decrease) | (113) | (9) | $ (4,568) | $ (330) |
International Discovery | | | | |
Shares sold | 20,827 | 28,809 | $ 832,233 | $ 1,144,588 |
Reinvestment of distributions | 1,199 | 3,813 | 46,913 | 148,138 |
Shares redeemed | (33,573) | (37,231) | (1,345,593) | (1,476,965) |
Net increase (decrease) | (11,547) | (4,609) | $ (466,447) | $ (184,239) |
Class K | | | | |
Shares sold | 15,372 | 15,775 | $ 613,737 | $ 628,261 |
Reinvestment of distributions | 508 | 1,396 | 19,835 | 54,076 |
Shares redeemed | (21,494) A | (18,729) | (860,632) A | (741,205) |
Net increase (decrease) | (5,614) | (1,558) | $ (227,060) | $ (58,868) |
Class I | | | | |
Shares sold | 15,392 | 10,468 | $ 602,134 | $ 410,346 |
Reinvestment of distributions | 33 | 91 | 1,286 | 3,529 |
Shares redeemed | (5,606) | (5,852) | (221,504) | (225,868) |
Net increase (decrease) | 9,819 | 4,707 | $ 381,916 | $ 188,007 |
Class Z | | | | |
Shares sold | 402 | 993 | $ 16,312 | $ 39,070 |
Reinvestment of distributions | 7 | 2 | 283 | 95 |
Shares redeemed | (559) | (96) | (22,228) | (3,785) |
Net increase (decrease) | (150) | 899 | $ (5,633) | $ 35,380 |
A Amount includes in-kind redemptions (see Note 5: Redemptions In-Kind).
Annual Report
Notes to Financial Statements - continued
(Amounts in thousands except percentages)
12. Other.
The Fund's organizational documents provide former and current trustees and officers with a limited indemnification against liabilities arising in connection with the performance of their duties to the Fund. In the normal course of business, the Fund may also enter into contracts that provide general indemnifications. The Fund's maximum exposure under these arrangements is unknown as this would be dependent on future claims that may be made against the Fund. The risk of material loss from such claims is considered remote.
At the end of the period, Strategic Advisers International Fund was the owner of record of approximately 13% of the total outstanding shares of the Fund.
Annual Report
To the Trustees of Fidelity Investment Trust and the Shareholders of Fidelity International Discovery Fund:
In our opinion, the accompanying statement of assets and liabilities, including the schedule of investments, and the related statements of operations and of changes in net assets and the financial highlights present fairly, in all material respects, the financial position of Fidelity International Discovery Fund (a fund of Fidelity Investment Trust) at October 31, 2015, the results of its operations for the year then ended, the changes in its net assets for each of the two years in the period then ended and the financial highlights for each of the five years in the period then ended, in conformity with accounting principles generally accepted in the United States of America. These financial statements and financial highlights (hereafter referred to as "financial statements") are the responsibility of the Fidelity International Discovery Fund's management. Our responsibility is to express an opinion on these financial statements based on our audits. We conducted our audits of these financial statements in accordance with the standards of the Public Company Accounting Oversight Board (United States). Those standards require that we plan and perform the audit to obtain reasonable assurance about whether the financial statements are free of material misstatement. An audit includes examining, on a test basis, evidence supporting the amounts and disclosures in the financial statements, assessing the accounting principles used and significant estimates made by management, and evaluating the overall financial statement presentation. We believe that our audits, which included confirmation of securities at October 31, 2015 by correspondence with the custodian and brokers, provide a reasonable basis for our opinion.
PricewaterhouseCoopers LLP
Boston, Massachusetts
December 16, 2015
Annual Report
The Trustees, Member of the Advisory Board, and officers of the trust and fund, as applicable, are listed below. The Board of Trustees governs the fund and is responsible for protecting the interests of shareholders. The Trustees are experienced executives who meet periodically throughout the year to oversee the fund's activities, review contractual arrangements with companies that provide services to the fund, oversee management of the risks associated with such activities and contractual arrangements, and review the fund's performance. Each of the Trustees oversees 170 funds.
The Trustees hold office without limit in time except that (a) any Trustee may resign; (b) any Trustee may be removed by written instrument, signed by at least two-thirds of the number of Trustees prior to such removal; (c) any Trustee who requests to be retired or who has become incapacitated by illness or injury may be retired by written instrument signed by a majority of the other Trustees; and (d) any Trustee may be removed at any special meeting of shareholders by a two-thirds vote of the outstanding voting securities of the trust. Each Trustee who is not an interested person (as defined in the 1940 Act) of the trust and the fund (Independent Trustee), shall retire not later than the last day of the calendar year in which his or her 75th birthday occurs. The Independent Trustees may waive this mandatory retirement age policy with respect to individual Trustees. The officers and Advisory Board Member hold office without limit in time, except that any officer and Advisory Board Member may resign or may be removed by a vote of a majority of the Trustees at any regular meeting or any special meeting of the Trustees. Except as indicated, each individual has held the office shown or other offices in the same company for the past five years.
Experience, Skills, Attributes, and Qualifications of the Fund's Trustees. The Governance and Nominating Committee has adopted a statement of policy that describes the experience, qualifications, attributes, and skills that are necessary and desirable for potential Independent Trustee candidates (Statement of Policy). The Board believes that each Trustee satisfied at the time he or she was initially elected or appointed a Trustee, and continues to satisfy, the standards contemplated by the Statement of Policy. The Governance and Nominating Committee also engages professional search firms to help identify potential Independent Trustee candidates who have the experience, qualifications, attributes, and skills consistent with the Statement of Policy. From time to time, additional criteria based on the composition and skills of the current Independent Trustees, as well as experience or skills that may be appropriate in light of future changes to board composition, business conditions, and regulatory or other developments, have also been considered by the professional search firms and the Governance and Nominating Committee. In addition, the Board takes into account the Trustees' commitment and participation in Board and committee meetings, as well as their leadership of standing and ad hoc committees throughout their tenure.
In determining that a particular Trustee was and continues to be qualified to serve as a Trustee, the Board has considered a variety of criteria, none of which, in isolation, was controlling. The Board believes that, collectively, the Trustees have balanced and diverse experience, qualifications, attributes, and skills, which allow the Board to operate effectively in governing the fund and protecting the interests of shareholders. Information about the specific experience, skills, attributes, and qualifications of each Trustee, which in each case led to the Board's conclusion that the Trustee should serve (or continue to serve) as a trustee of the fund, is provided below.
Annual Report
Board Structure and Oversight Function. James C. Curvey is an interested person (as defined in the 1940 Act) and currently serves as Chairman. The Trustees have determined that an interested Chairman is appropriate and benefits shareholders because an interested Chairman has a personal and professional stake in the quality and continuity of services provided to the fund. Independent Trustees exercise their informed business judgment to appoint an individual of their choosing to serve as Chairman, regardless of whether the Trustee happens to be independent or a member of management. The Independent Trustees have determined that they can act independently and effectively without having an Independent Trustee serve as Chairman and that a key structural component for assuring that they are in a position to do so is for the Independent Trustees to constitute a substantial majority for the Board. The Independent Trustees also regularly meet in executive session. Ned C. Lautenbach serves as Chairman of the Independent Trustees and as such (i) acts as a liaison between the Independent Trustees and management with respect to matters important to the Independent Trustees and (ii) with management prepares agendas for Board meetings.
Fidelity funds are overseen by different Boards of Trustees. The fund's Board oversees Fidelity's high income and certain equity funds, and other Boards oversee Fidelity's investment-grade bond, money market, asset allocation, and sector funds. The asset allocation funds may invest in Fidelity funds overseen by the fund's Board. The use of separate Boards, each with its own committee structure, allows the Trustees of each group of Fidelity funds to focus on the unique issues of the funds they oversee, including common research, investment, and operational issues. On occasion, the separate Boards establish joint committees to address issues of overlapping consequences for the Fidelity funds overseen by each Board.
The Trustees operate using a system of committees to facilitate the timely and efficient consideration of all matters of importance to the Trustees, the fund, and fund shareholders and to facilitate compliance with legal and regulatory requirements and oversight of the fund's activities and associated risks. The Board, acting through its committees, has charged FMR and its affiliates with (i) identifying events or circumstances the occurrence of which could have demonstrably adverse effects on the fund's business and/or reputation; (ii) implementing processes and controls to lessen the possibility that such events or circumstances occur or to mitigate the effects of such events or circumstances if they do occur; and (iii) creating and maintaining a system designed to evaluate continuously business and market conditions in order to facilitate the identification and implementation processes described in (i) and (ii) above. Because the day-to-day operations and activities of the fund are carried out by or through FMR, its affiliates and other service providers, the fund's exposure to risks is mitigated but not eliminated by the processes overseen by the Trustees. While each of the Board's committees has responsibility for overseeing different aspects of the fund's activities, oversight is exercised primarily through the Operations, Audit, and Compliance Committees. In addition, the Independent Trustees have worked with FMR to enhance the Board's oversight of investment and financial risks, legal and regulatory risks, technology risks, and operational risks, including the development of additional risk reporting to the Board. For example, a working group comprised of Independent Trustees and FMR has worked and continues to work to review the Fidelity funds' valuation-related activities, reporting and risk management. Appropriate personnel, including but not limited to the fund's Chief Compliance Officer (CCO), FMR's internal auditor, the independent accountants, the fund's Treasurer and portfolio management personnel, make periodic reports to the Board's committees, as appropriate, including an annual review of Fidelity's risk management program for the Fidelity funds. The responsibilities of each standing committee, including their oversight responsibilities, are described further under "Standing Committees of the Fund's Trustees."
Annual Report
Trustees and Officers - continued
The fund's Statement of Additional Information (SAI) includes more information about the Trustees. To request a free copy, call Fidelity at 1-800-544-8544.
Interested Trustees*:
Correspondence intended for each Trustee who is an interested person may be sent to Fidelity Investments, 245 Summer Street, Boston, Massachusetts 02210.
Name, Year of Birth; Principal Occupations and Other Relevant Experience+ |
James C. Curvey (1935) |
Year of Election or Appointment: 2007 Trustee Chairman of the Board of Trustees |
| Mr. Curvey also serves as Trustee of other Fidelity funds. Mr. Curvey is a Director of Fidelity Research & Analysis Co. (investment adviser firm, 2009-present), and Vice Chairman (2007-present) and Director of FMR LLC (diversified financial services company). In addition, Mr. Curvey serves as an Overseer for the Boston Symphony Orchestra and a member of the board of Artis-Naples, Naples, Florida, and as a Trustee for Brewster Academy, Wolfeboro, New Hampshire. Previously, Mr. Curvey served as a Director of Fidelity Investments Money Management, Inc. (investment adviser firm, 2009-2014) and a Director of FMR and FMR Co., Inc. (investment adviser firms, 2007-2014). |
Charles S. Morrison (1960) |
Year of Election or Appointment: 2014 Trustee |
| Mr. Morrison also serves as Trustee of other funds. He serves as a Director of Fidelity Investments Money Management, Inc. (FIMM) (investment adviser firm, 2014-present), Director of Fidelity SelectCo, LLC (investment adviser firm, 2014-present), President, Asset Management (2014-present), and is an employee of Fidelity Investments. Previously, Mr. Morrison served as Vice President of Fidelity's Fixed Income and Asset Allocation Funds (2012-2014), President, Fixed Income (2011-2014), Vice President of Fidelity's Money Market Funds (2005-2009), President, Money Market Group Leader of FMR (investment adviser firm, 2009), and Senior Vice President, Money Market Group of FMR (2004-2009). Mr. Morrison also served as Vice President of Fidelity's Bond Funds (2002-2005), certain Balanced Funds (2002-2005), and certain Asset Allocation Funds (2002-2007), and as Senior Vice President (2002-2005) of Fidelity's Bond Division. |
* Trustees have been determined to be "Interested Trustees" by virtue of, among other things, their affiliation with the trust or various entities under common control with FMR.
+ The information above includes each Trustee's principal occupation during the last five years and other information relating to the experience, attributes, and skills relevant to each Trustee's qualifications to serve as a Trustee, which led to the conclusion that each Trustee should serve as a Trustee for the fund.
Annual Report
Trustees and Officers - continued
Independent Trustees:
Correspondence intended for each Independent Trustee (that is, the Trustees other than the Interested Trustees) may be sent to Fidelity Investments, P.O. Box 55235, Boston, Massachusetts 02205-5235.
Name, Year of Birth; Principal Occupations and Other Relevant Experience+ |
Dennis J. Dirks (1948) |
Year of Election or Appointment: 2005 Trustee |
| Mr. Dirks also serves as Trustee of other Fidelity funds. Prior to his retirement in May 2003, Mr. Dirks was Chief Operating Officer and a member of the Board of The Depository Trust & Clearing Corporation (DTCC). He also served as President, Chief Operating Officer, and Board member of The Depository Trust Company (DTC) and President and Board member of the National Securities Clearing Corporation (NSCC). In addition, Mr. Dirks served as Chief Executive Officer and Board member of the Government Securities Clearing Corporation, Chief Executive Officer and Board member of the Mortgage-Backed Securities Clearing Corporation, as a Trustee and a member of the Finance Committee of Manhattan College (2005-2008), as a Trustee and a member of the Finance Committee of AHRC of Nassau County (2006-2008), and as a member of the Independent Directors Council (IDC) Governing Council (2010-2015). Mr. Dirks is a member of the Board of Directors for The Brookville Center for Children's Services, Inc. (2009-present). |
Alan J. Lacy (1953) |
Year of Election or Appointment: 2008 Trustee |
| Mr. Lacy also serves as Trustee of other Fidelity funds. Mr. Lacy serves as a member of the Board of Directors of Dave & Buster's Entertainment, Inc. (restaurant and entertainment complexes, 2010-present) and Bristol-Myers Squibb Company (global pharmaceuticals, 2008-present). In addition, Mr. Lacy served as Senior Adviser (2007-2014) of Oak Hill Capital Partners, L.P. (private equity) and also served as Chief Executive Officer (2000-2005) and Vice Chairman (2005-2006) of Sears Holdings Corporation and Sears, Roebuck and Co. (retail). Mr. Lacy is a member of the Board of Trustees of The National Parks Conservation Association (2006-present). Previously, Mr. Lacy served as Chairman of the Board of Trustees of the National Parks Conservation Association (2008-2011) and as a member of the Board of Directors for The Western Union Company (global money transfer, 2006-2011), The Hillman Companies, Inc. (hardware wholesalers, 2010-2014), and Earth Fare, Inc. (retail grocery, 2010-2014). |
Ned C. Lautenbach (1944) |
Year of Election or Appointment: 2000 Trustee Chairman of the Independent Trustees |
| Mr. Lautenbach also serves as Trustee of other Fidelity funds. Mr. Lautenbach currently serves as the Lead Director of the Eaton Corporation Board of Directors (diversified industrial, 1997-present). Mr. Lautenbach is Chairman of the Board of Directors of Artis-Naples in Naples, Florida (2012-present), a member of the Council on Foreign Relations (1994-present), and a member of the Board of Governors, State University System of Florida (2013-present). Previously, Mr. Lautenbach was a Partner/Advisory Partner at Clayton, Dubilier & Rice, LLC (private equity investment, 1998-2010), as well as a Director of Sony Corporation (2006-2007). |
Joseph Mauriello (1944) |
Year of Election or Appointment: 2008 Trustee |
| Mr. Mauriello also serves as Trustee of other Fidelity funds. Prior to his retirement in January 2006, Mr. Mauriello served in numerous senior management positions including Deputy Chairman and Chief Operating Officer (2004-2005), and Vice Chairman of Financial Services (2002-2004) of KPMG LLP US (professional services, 1965-2005). Mr. Mauriello currently serves as a member of the Board of Directors of XL Group plc. (global insurance and re-insurance, 2006-present) and the Independent Directors Council (IDC) Governing Council (2015-present). Previously, Mr. Mauriello served as a Director of the Hamilton Funds of the Bank of New York (2006-2007) and of Arcadia Resources Inc. (health care services and products, 2007-2012). |
Robert W. Selander (1950) |
Year of Election or Appointment: 2011 Trustee |
| Mr. Selander also serves as Trustee of other Fidelity funds. Mr. Selander serves as a Director of The Western Union Company (global money transfer, 2014-present). Previously, Mr. Selander served as a Member of the Advisory Board of other Fidelity funds (2011), and Executive Vice Chairman (2010), Chief Executive Officer (2009-2010), and President and Chief Executive Officer (1997-2009) of Mastercard, Inc. |
Cornelia M. Small (1944) |
Year of Election or Appointment: 2005 Trustee |
| Ms. Small also serves as Trustee of other Fidelity funds. Ms. Small is a member of the Board of Directors (2009-present) and Chair of the Investment Committee (2010-present) of the Teagle Foundation. Ms. Small also serves on the Investment Committee of the Berkshire Taconic Community Foundation (2008-present). Previously, Ms. Small served as Chairperson (2002-2008) and a member of the Investment Committee and Chairperson (2008-2012) and a member of the Board of Trustees of Smith College. In addition, Ms. Small served as Chief Investment Officer, Director of Global Equity Investments, and a member of the Board of Directors of Scudder, Stevens & Clark and Scudder Kemper Investments. |
William S. Stavropoulos (1939) |
Year of Election or Appointment: 2001 Trustee Vice Chairman of the Independent Trustees |
| Mr. Stavropoulos also serves as Trustee of other Fidelity funds. Mr. Stavropoulos serves as President and Founder of the Michigan Baseball Foundation, the Great Lakes Loons (2007-present). Mr. Stavropoulos is Chairman Emeritus of the Board of Directors of The Dow Chemical Company, where he previously served in numerous senior management positions, including President, CEO (1995-2000; 2002-2004), Chairman of the Executive Committee (2000-2006), and as a member of the Board of Directors (1990-2006). Currently, Mr. Stavropoulos is Chairman of the Board of Directors of Univar Inc. (global distributor of commodity and specialty chemicals), a Director of Teradata Corporation (data warehousing and technology solutions), and Maersk Inc. (industrial conglomerate), and a member of the Advisory Board for Metalmark Capital LLC (private equity investment, 2005-present). Mr. Stavropoulos is an operating advisor to Clayton, Dubilier & Rice, LLC (private equity investment). In addition, Mr. Stavropoulos is a member of the University of Notre Dame Advisory Council for the College of Science, a Trustee of the Rollin L. Gerstacker Foundation, and a Director of the Naples Philharmonic Center for the Arts. Previously, Mr. Stavropoulos served as a Director of Chemical Financial Corporation (bank holding company, 1993-2012) and Tyco International, Ltd. (multinational manufacturing and services, 2007-2012). |
David M. Thomas (1949) |
Year of Election or Appointment: 2008 Trustee |
| Mr. Thomas also serves as Trustee of other Fidelity funds. Mr. Thomas serves as Non-Executive Chairman of the Board of Directors of Fortune Brands Home and Security (home and security products, 2011-present), as a member of the Board of Directors (2004-present) and Presiding Director (2013-present) of Interpublic Group of Companies, Inc. (marketing communication), and as a member of the Board of Trustees of the University of Florida (2013-present). Previously, Mr. Thomas served as Executive Chairman (2005-2006) and Chairman and Chief Executive Officer (2000-2005) of IMS Health, Inc. (pharmaceutical and healthcare information solutions), and a Director of Fortune Brands, Inc. (consumer products, 2000-2011). |
+ The information above includes each Trustee's principal occupation during the last five years and other information relating to the experience, attributes, and skills relevant to each Trustee's qualifications to serve as a Trustee, which led to the conclusion that each Trustee should serve as a Trustee for the fund.
Advisory Board Member and Officers:
Correspondence intended for each officer and Peter S. Lynch may be sent to Fidelity Investments, 245 Summer Street, Boston, Massachusetts 02210. Officers appear below in alphabetical order.
Name, Year of Birth; Principal Occupation |
Peter S. Lynch (1944) |
Year of Election or Appointment: 2003 Member of the Advisory Board |
| Mr. Lynch also serves as Member of the Advisory Board of other Fidelity funds. Mr. Lynch is Vice Chairman and a Director of FMR (investment adviser firm) and FMR Co., Inc. (investment adviser firm). In addition, Mr. Lynch serves as a Trustee of Boston College and as the Chairman of the Inner-City Scholarship Fund. Previously, Mr. Lynch served on the Special Olympics International Board of Directors (1997-2006). |
Elizabeth Paige Baumann (1968) |
Year of Election or Appointment: 2012 Anti-Money Laundering (AML) Officer |
| Ms. Baumann also serves as AML Officer of other funds. She is Chief AML Officer of FMR LLC (diversified financial services company, 2012-present) and is an employee of Fidelity Investments. Previously, Ms. Baumann served as Vice President and Deputy Anti-Money Laundering Officer (2007-2012). |
Marc R. Bryant (1966) |
Year of Election or Appointment: 2015 Secretary and Chief Legal Officer (CLO) |
| Mr. Bryant also serves as Secretary and CLO of other funds. Mr. Bryant serves as CLO, Secretary, and Senior Vice President of Fidelity Management & Research Company (investment adviser firm, 2015-present) and FMR Co., Inc. (investment adviser firm, 2015-present); Secretary of Fidelity SelectCo, LLC (investment adviser firm, 2015-present) and Fidelity Investments Money Management, Inc. (investment adviser firm, 2015-present); and CLO of Fidelity Management & Research (Hong Kong) Limited (investment adviser firm, 2015-present). He is Senior Vice President and Deputy General Counsel of FMR LLC (diversified financial services company). Previously, Mr. Bryant served as Secretary and Chief Legal Officer of Fidelity Rutland Square Trust II (2010-2014) and Assistant Secretary of Fidelity's Fixed Income and Asset Allocation Funds (2013-2015). Prior to joining Fidelity Investments, Mr. Bryant served as a Senior Vice President and the Head of Global Retail Legal for AllianceBernstein L.P. (2006-2010), and as the General Counsel for ProFund Advisors LLC (2001-2006). |
William C. Coffey (1969) |
Year of Election or Appointment: 2009 Assistant Secretary |
| Mr. Coffey also serves as Assistant Secretary of other funds. He is Senior Vice President and Deputy General Counsel of FMR LLC (diversified financial services company, 2010-present), and is an employee of Fidelity Investments. Previously, Mr. Coffey served as Vice President and Associate General Counsel of FMR LLC (2005-2009). |
Timothy M. Cohen (1969) |
Year of Election or Appointment: 2014 Vice President of certain Equity Funds |
| Mr. Cohen also serves as Vice President of other funds. Mr. Cohen serves as Chief Compliance Officer of FMR Investment Management (U.K.) Limited (investment adviser firm, 2013-present) and is an employee of Fidelity Investments. Previously, Mr. Cohen served as a Director of FMR Investment Management (U.K.) Limited (2013-2015). |
Jonathan Davis (1968) |
Year of Election or Appointment: 2010 Assistant Treasurer |
| Mr. Davis also serves as Assistant Treasurer of other funds, and is an employee of Fidelity Investments. Previously, Mr. Davis served as Vice President and Associate General Counsel of FMR LLC (diversified financial services company, 2003-2010). |
Adrien E. Deberghes (1967) |
Year of Election or Appointment: 2008 Deputy Treasurer |
| Mr. Deberghes also serves as an officer of other funds. He is an employee of Fidelity Investments (2008-present). Prior to joining Fidelity Investments, Mr. Deberghes was Senior Vice President of Mutual Fund Administration at State Street Corporation (2007-2008), Senior Director of Mutual Fund Administration at Investors Bank & Trust (2005-2007), and Director of Finance for Dunkin' Brands (2000-2005). |
Stephanie J. Dorsey (1969) |
Year of Election or Appointment: 2010 Assistant Treasurer |
| Ms. Dorsey also serves as an officer of other funds. She is an employee of Fidelity Investments (2008-present) and has served in other fund officer roles. Prior to joining Fidelity Investments, Ms. Dorsey served as Treasurer (2004-2008) of the JPMorgan Mutual Funds and Vice President (2004-2008) of JPMorgan Chase Bank. |
Howard J. Galligan III (1966) |
Year of Election or Appointment: 2014 Chief Financial Officer |
| Mr. Galligan also serves as Chief Financial Officer of other funds. Mr. Galligan serves as President of Fidelity Pricing and Cash Management Services (FPCMS) (2014-present) and as a Director of Strategic Advisers, Inc. (investment adviser firm, 2008-present). Previously, Mr. Galligan served as Chief Administrative Officer of Asset Management (2011-2014) and Chief Operating Officer and Senior Vice President of Investment Support for Strategic Advisers, Inc. (2003-2011). |
Scott C. Goebel (1968) |
Year of Election or Appointment: 2015 Vice President |
| Mr. Goebel serves as Vice President of other funds and is an employee of Fidelity Investments (2001-present). Previously, Mr. Goebel served as Secretary of Fidelity SelectCo, LLC (investment adviser firm, 2013-2015), Fidelity Investments Money Management, Inc. (FIMM) (investment adviser firm, 2010-2015), and Fidelity Research and Analysis Company (FRAC) (investment adviser firm, 2010-2015); General Counsel, Secretary, and Senior Vice President of Fidelity Management & Research Company (investment adviser firm, 2008-2015) and FMR Co., Inc. (investment adviser firm, 2008-2015); Assistant Secretary of Fidelity Management & Research (Japan) Limited (investment adviser firm, 2008-2015) and FMR Investment Management (U.K.) Limited (investment adviser firm, 2008-2015); Chief Legal Officer (CLO) of Fidelity Management & Research (Hong Kong) Limited (investment adviser firm, 2008-2015); Secretary and CLO of certain Fidelity funds (2008-2015); Assistant Secretary of FIMM (2008-2010), FRAC (2008-2010), and certain funds (2007-2008); and as Vice President and Secretary of Fidelity Distributors Corporation (FDC) (2005-2007). |
Brian B. Hogan (1964) |
Year of Election or Appointment: 2009 Vice President |
| Mr. Hogan also serves as Trustee or Vice President of other funds. Mr. Hogan serves as a Director of Fidelity SelectCo, LLC (investment adviser firm, 2014-present) and President of the Equity Division of FMR (investment adviser firm, 2009-present). Previously, Mr. Hogan served as Senior Vice President, Equity Research of FMR (2006-2009) and as a portfolio manager. |
Chris Maher (1972) |
Year of Election or Appointment: 2013 Assistant Treasurer |
| Mr. Maher serves as Assistant Treasurer of other funds. Mr. Maher is Vice President of Valuation Oversight and is an employee of Fidelity Investments. Previously, Mr. Maher served as Vice President of Asset Management Compliance (2013), Vice President of the Program Management Group of FMR (investment adviser firm, 2010-2013), and Vice President of Valuation Oversight (2008-2010). |
Kenneth B. Robins (1969) |
Year of Election or Appointment: 2008 President and Treasurer |
| Mr. Robins also serves as an officer of other funds. Mr. Robins serves as Executive Vice President of Fidelity Investments Money Management, Inc. (FIMM) (investment adviser firm, 2013-present) and is an employee of Fidelity Investments (2004-present). Previously, Mr. Robins served in other fund officer roles. |
Stacie M. Smith (1974) |
Year of Election or Appointment: 2013 Deputy Treasurer |
| Ms. Smith also serves as an officer of other funds. She is an employee of Fidelity Investments (2009-present) and has served in other fund officer roles. Prior to joining Fidelity Investments, Ms. Smith served as Senior Audit Manager of Ernst & Young LLP (1996-2009). |
Renee Stagnone (1975) |
Year of Election or Appointment: 2013 Deputy Treasurer |
| Ms. Stagnone also serves as Deputy Treasurer of other funds. Ms. Stagnone is an employee of Fidelity Investments (1997-present). |
Linda J. Wondrack (1964) |
Year of Election or Appointment: 2014 Chief Compliance Officer |
| Ms. Wondrack also serves as Chief Compliance Officer of other funds. Ms. Wondrack is Executive Vice President and head of the Ethics Office and Asset Management Compliance for Fidelity Investments (2012-present). Ms. Wondrack also serves as Chief Compliance Officer of Fidelity SelectCo, LLC (investment adviser firm, 2014-present); Chief Compliance Officer of Impresa Management LLC (2013-present); and Chief Compliance Officer of FMR Co., Inc. (investment adviser firm), Fidelity Investments Money Management, Inc. (investment adviser firm), Fidelity Management & Research (Japan) Limited (investment adviser firm), FMR Investment Management (U.K.) Limited (investment adviser firm), Fidelity Management & Research (Hong Kong) (investment adviser firm), Fidelity Management & Research Company (investment adviser firm), FIAM LLC (investment adviser firm), and Strategic Advisers, Inc. (investment adviser firm), Ballyrock Investment Advisors LLC, and Northern Neck Investors LLC (2012-present). Previously, Ms. Wondrack served as Senior Vice President and Chief Compliance Officer for Columbia Management Investment Advisers, LLC (2005-2012); Chief Compliance Officer for certain funds within the Columbia Family of Funds (2007-2012); and Senior Vice President of Compliance Risk Management at Bank of America (2005-2010). |
Joseph F. Zambello (1957) |
Year of Election or Appointment: 2011 Deputy Treasurer |
| Mr. Zambello also serves as Deputy Treasurer of other funds. Mr. Zambello is an employee of Fidelity Investments (1991-present). Previously, Mr. Zambello served as Vice President of the Program Management Group of FMR (investment adviser firm, 2009-2011) and Vice President of the Transfer Agent Oversight Group (2005-2009). |
Annual Report
The Board of Trustees of Fidelity International Discovery Fund voted to pay to shareholders of record at the opening of business on record date, the following distributions per share derived from capital gains realized from sales of portfolio securities, and dividends derived from net investment income:
| Pay Date | Record Date | Dividends | Capital Gains |
International Discovery Fund | 12/07/15 | 12/04/15 | $0.409 | $0.005 |
International Discovery Fund designates 6% of the dividends distributed during the fiscal year as qualifying for the dividends-received deduction for corporate shareholders.
International Discovery Fund designates 100% of dividends distributed during the fiscal year as amounts which may be taken into account as a dividend for purposes of the maximum rate under section 1(h)(11) of the Internal Revenue Code.
The amounts per share which represent income derived from sources within, and taxes paid to, foreign countries or possessions of the United States are as follows:
| Pay Date | Income | Taxes |
International Discovery Fund | 12/08/14 | $0.3056 | $0.0486 |
The fund will notify shareholders in January 2016 of amounts for use in preparing 2015 income tax returns.
Annual Report
Fidelity International Discovery Fund
Each year, the Board of Trustees, including the Independent Trustees (together, the Board), votes on the renewal of the management contract with Fidelity Management & Research Company (FMR) and the sub-advisory agreements (together, the Advisory Contracts) for the fund. The Board, assisted by the advice of fund counsel and Independent Trustees' counsel, requests and considers a broad range of information relevant to the renewal of the Advisory Contracts throughout the year.
The Board meets regularly and, at each of its meetings, covers an extensive agenda of topics and materials and considers factors that are relevant to its annual consideration of the renewal of the fund's Advisory Contracts, including the services and support provided to the fund and its shareholders. The Board has established various standing committees (Committees), each composed of and chaired by Independent Trustees with varying backgrounds, to which the Board has assigned specific subject matter responsibilities in order to enhance effective decision-making by the Board. The Board, acting directly and through its Committees, requests and receives information concerning the annual consideration of the renewal of the fund's Advisory Contracts. The Board also meets as needed to consider matters specifically related to the Board's annual consideration of the renewal of the Advisory Contracts. Members of the Board may also meet with trustees of other Fidelity funds through ad hoc joint committees to discuss certain matters relevant to all of the Fidelity funds.
At its July 2015 meeting, the Board unanimously determined to renew the fund's Advisory Contracts. In reaching its determination, the Board considered all factors it believed relevant, including (i) the nature, extent, and quality of the services to be provided to the fund and its shareholders (including the investment performance of the fund); (ii) the competitiveness of the fund's management fee and total expense ratio relative to peer funds; (iii) the total costs of the services to be provided by and the profits to be realized by Fidelity from its relationship with the fund; and (iv) the extent to which (if any) economies of scale exist and would be realized as the fund grows, and whether any economies of scale are appropriately shared with fund shareholders.
In considering whether to renew the Advisory Contracts for the fund, the Board reached a determination, with the assistance of fund counsel and Independent Trustees' counsel and through the exercise of its business judgment, that the renewal of the Advisory Contracts was in the best interests of the fund and its shareholders and that the compensation payable under the Advisory Contracts was fair and reasonable. The Board's decision to renew the Advisory Contracts was not based on any single factor, but rather was based on a comprehensive consideration of all the information provided to the Board at its meetings throughout the year. The Board, in reaching its determination to renew the Advisory Contracts, was aware that shareholders of the fund have a broad range of investment choices available to them, including a wide choice among funds offered by Fidelity's competitors, and that the fund's shareholders, who have the opportunity to review and weigh the disclosure provided by the fund in its prospectus and other public disclosures, have chosen to invest in this fund, which is part of the Fidelity family of funds.
Annual Report
Nature, Extent, and Quality of Services Provided. The Board considered Fidelity's staffing as it relates to the fund, including the backgrounds of investment personnel of Fidelity, and also considered the fund's investment objective, strategies, and related investment philosophy. The Independent Trustees also had discussions with senior management of Fidelity's investment operations and investment groups. The Board considered the structure of the portfolio manager compensation program and whether this structure provides appropriate incentives to act in the best interests of the fund. Additionally, the Board considered the portfolio managers' investments, if any, in the funds that they manage.
Resources Dedicated to Investment Management and Support Services. The Board and the Fund Oversight and Research Committees reviewed the general qualifications and capabilities of Fidelity's investment staff, including its size, education, experience, and resources, as well as Fidelity's approach to recruiting, training, managing, and compensating investment personnel. The Board noted that Fidelity has continued to increase the resources devoted to non-U.S. offices, including expansion of Fidelity's global investment organization. The Board also noted that Fidelity's analysts have extensive resources, tools and capabilities that allow them to conduct sophisticated quantitative and fundamental analysis, as well as credit analysis of issuers, counterparties and guarantors. Further, the Board considered that Fidelity's investment professionals have sufficient access to global information and data so as to provide competitive investment results over time, and that those professionals also have access to sophisticated tools that permit them to assess portfolio construction and risk and performance attribution characteristics continuously, as well as to transmit new information and research conclusions rapidly around the world. Additionally, in its deliberations, the Board considered Fidelity's trading, risk management, and compliance capabilities and resources, which are integral parts of the investment management process.
Shareholder and Administrative Services. The Board considered (i) the nature, extent, quality, and cost of advisory, administrative, and shareholder services performed by FMR, the sub-advisers (together with FMR, the Investment Advisers), and their affiliates under the Advisory Contracts and under separate agreements covering transfer agency, pricing and bookkeeping, and securities lending services for the fund; (ii) the nature and extent of the supervision of third party service providers, principally custodians and subcustodians; and (iii) the resources devoted to, and the record of compliance with, the fund's compliance policies and procedures. The Board also reviewed the allocation of fund brokerage, including allocations to brokers affiliated with the Investment Advisers, the use of brokerage commissions to pay fund expenses, and the use of "soft" commission dollars to pay for research services.
Annual Report
Board Approval of Investment Advisory Contracts and
Management Fees - continued
The Board noted that the growth of fund assets over time across the complex allows Fidelity to reinvest in the development of services designed to enhance the value or convenience of the Fidelity funds as investment vehicles. These services include 24-hour access to account information and market information through telephone representatives and over the Internet, investor education materials and asset allocation tools, and the expanded availability of Fidelity Investor Centers.
In 2014, the Board formed an ad hoc Committee on Transfer Agency Fees to review the variety of transfer agency fee structures throughout the industry and Fidelity's competitive positioning with respect to industry participants.
Investment in a Large Fund Family. The Board considered the benefits to shareholders of investing in a Fidelity fund, including the benefits of investing in a fund that is part of a large family of funds offering a variety of investment disciplines and providing a large variety of mutual fund investor services. The Board noted that Fidelity had taken, or had made recommendations that resulted in the Fidelity funds taking, a number of actions over the previous year that benefited particular funds, including (i) continuing to dedicate additional resources to investment research and to the support of the senior management team that oversees asset management; (ii) continuing efforts to enhance Fidelity's global research capabilities; (iii) launching new funds and making other enhancements to meet client needs; (iv) reducing management fees and total expenses for certain index funds and diversified international funds; (v) continuing to launch dedicated lower cost underlying funds to meet portfolio construction needs related to expanding underlying fund options for Fidelity funds of funds, specifically for the Freedom Fund product lines; (vi) rationalizing product lines and gaining increased efficiencies through fund mergers; (vii) launching active fixed-income exchange-traded funds; (viii) continuing to develop, acquire and implement systems and technology to improve services to the funds and information security and to increase efficiency; (ix) implementing investment enhancements to further strengthen Fidelity's target date product line to increase investors' probability of success in achieving their goals; (x) modifying the eligibility criteria for certain share classes to accommodate roll-over assets from employer-sponsored retirement plans; (xi) launching a new Class W of the Freedom Index Funds to attract and retain Fidelity record-kept retirement plan assets; and (xii) implementing changes to Fidelity's money market product line in response to recent money market regulatory reforms.
Investment Performance. The Board considered whether the fund has operated in accordance with its investment objective, as well as its record of compliance with its investment restrictions and its performance history.
Annual Report
The Board took into account discussions with representatives of the Investment Advisers about fund investment performance that occur at Board meetings throughout the year. In this regard the Board noted that as part of regularly scheduled fund reviews and other reports to the Board on fund performance, the Board considers annualized return information for the fund, for different time periods, measured against a securities market index ("benchmark index") and a peer group of funds with similar objectives ("peer group"), if any. In its evaluation of fund investment performance, the Board gave particular attention to information indicating changes in performance of certain Fidelity funds for specific time periods and discussed with the Investment Advisers the reasons for any overperformance or underperformance.
In addition to reviewing absolute and relative fund performance, the Independent Trustees periodically consider the appropriateness of fund performance metrics in evaluating the results achieved. In general, the Independent Trustees believe that fund performance should be evaluated based on net performance (after fees and expenses) of both the highest performing and lowest performing fund share classes, where applicable, compared to appropriate benchmark indices, over appropriate time periods that may include full market cycles, and compared to peer groups, as applicable, over the same periods, taking into account relevant factors including the following: general market conditions; issuer-specific information; and fund cash flows and other factors.
The Independent Trustees recognize that shareholders evaluate performance on a net basis over their own holding periods, for which one-, three-, and five-year periods are often used as a proxy. For this reason, the performance information reviewed by the Board also included net cumulative calendar year total return information for the fund and an appropriate benchmark index and peer group for the most recent one-, three-, and five-year periods, as shown below. Returns are shown compared to the 25th percentile (top of box, 75% beaten) and 75th percentile (bottom of box, 25% beaten) of the peer universe. Returns of the benchmark index are "net MA," i.e., adjusted for tax withholding rates applicable to U.S.-based funds organized as Massachusetts business trusts.
Annual Report
Board Approval of Investment Advisory Contracts and
Management Fees - continued
Fidelity International Discovery Fund

The Board also considered that the fund's management fee is subject to upward or downward adjustment depending upon whether, and to what extent, the fund's investment performance for the performance period exceeds, or is exceeded by, a securities index, thus leading to a performance adjustment for the same period. The Board noted that the performance adjustment provides FMR with a strong economic incentive to seek to achieve superior performance for the fund's shareholders and helps to more closely align the interests of FMR and the shareholders of the fund.
Based on its review, the Board concluded that the nature, extent, and quality of services provided to the fund under the Advisory Contracts should benefit the shareholders of the fund.
Competitiveness of Management Fee and Total Expense Ratio. The Board considered the fund's management fee and total expense ratio compared to "mapped groups" of competitive funds and classes created for the purpose of facilitating the Trustees' competitive analysis of management fees and total expenses. Fidelity creates "mapped groups" by combining similar Lipper investment objective categories that have comparable investment mandates. Combining Lipper investment objective categories aids the Board's management fee and total expense ratio comparisons by broadening the competitive group used for comparison.
Management Fee. The Board considered two proprietary management fee comparisons for the 12-month periods shown in basis points (BP) in the chart below. The group of Lipper funds used by the Board for management fee comparisons is referred to below as the "Total Mapped Group." The Total Mapped Group comparison focuses on a fund's standing in terms of gross management fees before expense reimbursements or caps, and without giving effect to the fund's performance adjustment, relative to the total universe of funds with comparable investment mandates, regardless of whether their management fee structures also are comparable. Funds with comparable investment mandates offer exposure to similar types of securities. Funds with comparable management fee structures have similar management fee contractual arrangements (e.g., flat rate charged for advisory services, all-inclusive fee rate, etc.). "TMG %" represents the percentage of funds in the Total Mapped Group that had management fees that were lower than the fund's. For example, a hypothetical TMG % of 20% would mean that 80% of the funds in the Total Mapped Group had higher, and 20% had lower, management fees than the fund. The fund's actual TMG %s and the number of funds in the Total Mapped Group are in the chart below. The "Asset-Size Peer Group" (ASPG) comparison focuses on a fund's standing relative to a subset of non-Fidelity funds within the Total Mapped Group that are similar in size and management fee structure without taking into account performance adjustments, if any. For example, if a fund is in the first quartile of the ASPG, the fund's management fee ranks in the least expensive or lowest 25% of funds in the ASPG. The ASPG represents at least 15% of the funds in the Total Mapped Group with comparable asset size and management fee structures, subject to a minimum of 50 funds (or all funds in the Total Mapped Group if fewer than 50). Additional information, such as the ASPG quartile in which the fund's management fee rate ranked and the impact of the fund's performance adjustment, is also included in the chart and considered by the Board.
Annual Report
Fidelity International Discovery Fund

Annual Report
Board Approval of Investment Advisory Contracts and
Management Fees - continued
The Board noted that the fund's management fee rate ranked below the median of its Total Mapped Group and below the median of its ASPG for 2014. The Board also noted the effect of the fund's performance adjustment, if any, on the fund's management fee ranking.
Furthermore, the Board considered that it had approved a reduction (effective August 1, 2014) in the individual fund fee rate component of the management fee rate for the fund from 0.450% to 0.424%. The Board considered that the chart reflects the fund's lower management fee for 2014, as if the lower fee were in effect for the entire year.
The Board noted that, in 2014, the ad hoc Committee on Group Fee was formed by it and other Fidelity fund boards to conduct an in-depth review of the "group fee" component of the management fee of funds with such management fee structures. Committee focus included the mechanics of the group fee, the competitive landscape of group fee structures, Fidelity funds with no group fee component and investment products not included in group fee assets. The Board also considered that, for funds subject to the group fee, FMR agreed to voluntarily waive fees over a specified period of time in amounts designed to account for assets converted from certain funds to certain collective investment trusts.
The Board also noted that, in 2013, the ad hoc Committee on Management Fees was formed to conduct an in-depth review of the management fee rates of Fidelity's active equity mutual funds. The Committee focused on the following areas: (i) standard fee structures; (ii) research consumption and trading evolution; (iii) management fee competitiveness/profitability by category; and (iv) factors that drive institutional pricing.
Based on its review, the Board concluded that the fund's management fee is fair and reasonable in light of the services that the fund receives and the other factors considered.
Total Expense Ratio. In its review of each class's total expense ratio, the Board considered the fund's management fee as well as other fund or class expenses, as applicable, such as transfer agent fees, pricing and bookkeeping fees, fund-paid 12b-1 fees, and custodial, legal, and audit fees. The Board noted the impact of the fund's performance adjustment. The Board also noted that Fidelity may agree to waive fees and expenses from time to time, and the extent to which, if any, it has done so for the fund. As part of its review, the Board also considered the current and historical total expense ratios of each class of the fund compared to competitive fund median expenses. Each class of the fund is compared to those funds and classes in the Total Mapped Group (used by the Board for management fee comparisons) that have a similar sales load structure.
The Board noted that the total expense ratio of each of Class A, Class B, Class C, Class I, Class Z, the retail class, and Class K ranked below its competitive median for 2014 and the total expense ratio of Class T ranked above its competitive median for 2014. The Board considered that, in general, various factors can affect total expense ratios. The Board noted that the total expense ratio of Class T was above the competitive median primarily because of higher 12b-1 fees on Class T as compared to most competitor funds. Class T has a higher 12b-1 fee, but a lower front-end sales charge, than traditionally priced front-end sales charge classes. The Board considered that Class T is primarily sold load-waived in the retirement plan market where its 0.50% 12b-1 fee is comparable to competing no-load, higher 12b-1 fee classes designed specifically for retirement plans. The Board noted that the fund offers multiple classes, each of which has a different sales load and 12b-1 fee structure, and that the multiple structures are intended to offer a range of pricing options for the intermediary market. The Board also noted that the total expense ratios of the classes vary primarily by the level of their 12b-1 fees, although differences in transfer agent fees may also cause expenses to vary from class to class.
Annual Report
Fees Charged to Other Fidelity Clients. The Board also considered Fidelity fee structures and other information with respect to clients of Fidelity, such as other funds advised or subadvised by Fidelity, pension plan clients, and other institutional clients with similar mandates. The Board noted the findings of the 2013 ad hoc joint committee (created with the board of other Fidelity funds), which reviewed and compared Fidelity's institutional investment advisory business with its business of providing services to the Fidelity funds, including the differences in services provided, fees charged, and costs incurred, as well as competition in their respective marketplaces.
Based on its review of total expense ratios and fees charged to other Fidelity clients, the Board concluded that, although Class T was above the median of the universe presented for comparison, the total expense ratio of each class of the fund was reasonable in light of the services that the fund and its shareholders receive and the other factors considered.
Costs of the Services and Profitability. The Board considered the revenues earned and the expenses incurred by Fidelity in conducting the business of developing, marketing, distributing, managing, administering and servicing the fund and servicing the fund's shareholders. The Board also considered the level of Fidelity's profits in respect of all the Fidelity funds.
On an annual basis, Fidelity presents to the Board information about the profitability of its relationship with the fund. Fidelity calculates profitability information for each fund, as well as aggregate profitability information for groups of Fidelity funds and all Fidelity funds, using a series of detailed revenue and cost allocation methodologies which originate with the books and records of Fidelity on which Fidelity's audited financial statements are based. The Audit Committee of the Board reviews any significant changes from the prior year's methodologies.
PricewaterhouseCoopers LLP (PwC), independent registered public accounting firm and auditor to Fidelity and certain Fidelity funds, has been engaged annually by the Board as part of the Board's assessment of Fidelity's profitability analysis. PwC's engagement includes the review and assessment of the methodologies used by Fidelity in determining the revenues and expenses attributable to Fidelity's mutual fund business, and completion of agreed-upon procedures in respect of the mathematical accuracy of fund profitability and its conformity to established allocation methodologies. After considering PwC's reports issued under the engagement and information provided by Fidelity, the Board concluded that while other allocation methods may also be reasonable, Fidelity's profitability methodologies are reasonable in all material respects.
Annual Report
Board Approval of Investment Advisory Contracts and
Management Fees - continued
The Board also reviewed Fidelity's non-fund businesses and fall-out benefits related to the mutual fund business as well as cases where Fidelity's affiliates may benefit from or be related to the fund's business.
The Board considered the costs of the services provided by and the profits realized by Fidelity in connection with the operation of the fund and was satisfied that the profitability was not excessive.
Economies of Scale. The Board considered whether there have been economies of scale in respect of the management of the Fidelity funds, whether the Fidelity funds (including the fund) have appropriately benefited from any such economies of scale, and whether there is potential for realization of any further economies of scale. The Board considered the extent to which the fund will benefit from economies of scale as assets grow through increased services to the fund, through waivers or reimbursements, or through fee or expense ratio reductions. The Board also noted that in 2013, it and the boards of other Fidelity funds created an ad hoc committee (the Economies of Scale Committee) to analyze whether Fidelity attains economies of scale in respect of the management and servicing of the Fidelity funds, whether the Fidelity funds have appropriately benefited from such economies of scale, and whether there is potential for realization of any further economies of scale.
The Board recognized that the fund's management contract incorporates a "group fee" structure, which provides for lower group fee rates as total group assets increase, and for higher group fee rates as total group assets decrease (with "group assets" defined to include fund assets under FMR's management plus sector fund assets previously under FMR's management and currently managed by Fidelity SelectCo, LLC). FMR calculates the group fee rates based on a tiered asset "breakpoint" schedule that varies based on asset class. The Board considered that the group fee is designed to deliver the benefits of economies of scale to fund shareholders when total Fidelity fund assets increase, even if assets of any particular fund are unchanged or have declined, because some portion of Fidelity's costs are attributable to services provided to all Fidelity funds, and all funds benefit if those costs can be allocated among more assets. The Board concluded that, given the group fee structure, fund shareholders will benefit from lower management fees as group assets increase at the fund complex level, regardless of whether Fidelity achieves any such economies of scale.
Annual Report
The Board concluded, taking into account the analysis of the Economies of Scale Committee, that economies of scale, if any, are being appropriately shared between fund shareholders and Fidelity.
Additional Information Requested by the Board. In order to develop fully the factual basis for consideration of the Fidelity funds' Advisory Contracts, the Board requested and received additional information on certain topics, including: (i) fund performance trends and Fidelity's long-term strategies for certain funds; (ii) the various share classes employed by Fidelity and the attributes of each class, together with similar information on the distribution and servicing payments made by Fidelity or the funds to third-party participants in the distribution channels; (iii) fund profitability, and fund performance in relation to fund profitability; (iv) the methodology with respect to evaluating competitive fund data and peer group classifications and fee comparisons; (v) annual fund profitability margins, with particular focus on certain funds with negative margins; (vi) the realization of fall-out benefits in certain Fidelity business units; (vii) economies of scale and the way in which they are shared with fund shareholders; (viii) Fidelity's group fee structures, including the group fee schedule of breakpoints; (ix) the impact of cost containment measures on the funds; and (x) the transfer agent fee structure.
Based on its evaluation of all of the conclusions noted above, and after considering all factors it believed relevant, the Board concluded that the advisory fee structures are fair and reasonable, and that the fund's Advisory Contracts should be renewed.
Annual Report
Investment Adviser
Fidelity Management & Research Company
Boston, MA
Investment Sub-Advisers
FMR Co., Inc.
FMR Investment Management
(U.K.) Limited
FIL Investment Advisors
FIL Investments (Japan) Limited
FIL Investment Advisors (UK) Limited
Fidelity Management & Research
(Hong Kong) Limited
Fidelity Management & Research
(Japan) Limited
General Distributor
Fidelity Distributors Corporation
Smithfield, RI
Transfer and Service Agents
Fidelity Investments Institutional
Operations Company, Inc.
Boston, MA
Fidelity Service Company, Inc.
Boston, MA
Custodian
The Northern Trust Company
Chicago, IL
The Fidelity Telephone Connection
Mutual Fund 24-Hour Service
Exchanges/Redemptions
and Account Assistance 1-800-544-6666
Product Information 1-800-544-8888
Retirement Accounts 1-800-544-4774
(8 a.m. - 9 p.m.)
TDD Service 1-800-544-0118
for the deaf and hearing impaired
(9 a.m. - 9 p.m. Eastern time)
Fidelity Automated Service
Telephone (FAST®)
1-800-544-5555

Automated line for quickest service
(Fidelity Investment logo)(registered trademark)
Corporate Headquarters
245 Summer St., Boston, MA 02210
www.fidelity.com
IGI-UANN-1215
1.807257.111
ContentsPerformance: The Bottom LineManagement's Discussion of Fund PerformanceShareholder Expense ExampleInvestment Changes (Unaudited)Investments October 31, 2015Financial StatementsNotes to Financial StatementsReport of Independent Registered Public Accounting FirmTrustees and OfficersDistributions (Unaudited)Board Approval of Investment Advisory Contracts and Management Fees
Fidelity®
International Small Cap Opportunities
Fund
Annual Report
October 31, 2015
(Fidelity Cover Art)
Contents
Performance | (Click Here) | How the fund has done over time. |
Management's Discussion of Fund Performance | (Click Here) | The Portfolio Manager's review of fund performance and strategy. |
Shareholder Expense Example | (Click Here) | An example of shareholder expenses. |
Investment Changes | (Click Here) | A summary of major shifts in the fund's investments over the past six months. |
Investments | (Click Here) | A complete list of the fund's investments with their market values. |
Financial Statements | (Click Here) | Statements of assets and liabilities, operations, and changes in net assets, as well as financial highlights. |
Notes | (Click Here) | Notes to the financial statements. |
Report of Independent Registered Public Accounting Firm | (Click Here) | |
Trustees and Officers | (Click Here) | |
Distributions | (Click Here) | |
Board Approval of Investment Advisory Contracts and Management Fees | (Click Here) | |
To view a fund's proxy voting guidelines and proxy voting record for the 12-month period ended June 30, visit http://www.fidelity.com/proxyvotingresults or visit the Securities and Exchange Commission's (SEC) web site at http://www.sec.gov. You may also call 1-800-544-8544 to request a free copy of the proxy voting guidelines.
Standard & Poor's, S&P and S&P 500 are registered service marks of The McGraw-Hill Companies, Inc. and have been licensed for use by Fidelity Distributors Corporation.
Other third-party marks appearing herein are the property of their respective owners.
All other marks appearing herein are registered or unregistered trademarks or service marks of FMR LLC or an affiliated company. © 2015 FMR LLC. All rights reserved.
Annual Report
This report and the financial statements contained herein are submitted for the general information of the shareholders of the fund. This report is not authorized for distribution to prospective investors in the fund unless preceded or accompanied by an effective prospectus.
A fund files its complete schedule of portfolio holdings with the SEC for the first and third quarters of each fiscal year on Form N-Q. Forms N-Q are available on the SEC's web site at http://www.sec.gov. A fund's Forms N-Q may be reviewed and copied at the SEC's Public Reference Room in Washington, DC. Information regarding the operation of the SEC's Public Reference Room may be obtained by calling 1-800-SEC-0330. For a complete list of a fund's portfolio holdings, view the most recent holdings listing, semiannual report, or annual report on Fidelity's web site at http://www.fidelity.com, http://www.advisor.fidelity.com, or http://www.401k.com, as applicable.
NOT FDIC INSURED • MAY LOSE VALUE • NO BANK GUARANTEE
Neither the fund nor Fidelity Distributors Corporation is a bank.
Annual Report
Average annual total return reflects the change in the value of an investment, assuming reinvestment of the class' distributions from dividend income and capital gains (the profits earned upon the sale of securities that have grown in value, if any) and assuming a constant rate of performance each year. The $10,000 table and the fund's returns do not reflect the deduction of taxes that a shareholder would pay on fund distributions or the redemption of fund shares. During periods of reimbursement by Fidelity, a fund's total return will be greater than it would be had the reimbursement not occurred. How a fund did yesterday is no guarantee of how it will do tomorrow.
Average Annual Total Returns
Periods ended October 31, 2015 | Past 1
year | Past 5
years | Past 10
years |
Fidelity® International Small Cap Opportunities Fund | 8.92% | 9.88% | 5.82% |
$10,000 Over 10 Years
Let's say hypothetically that $10,000 was invested in Fidelity® International Small Cap Opportunities Fund, a class of the fund, on October 31, 2005. The chart shows how the value of your investment would have changed, and also shows how the MSCI EAFE Small Cap Index performed over the same period.
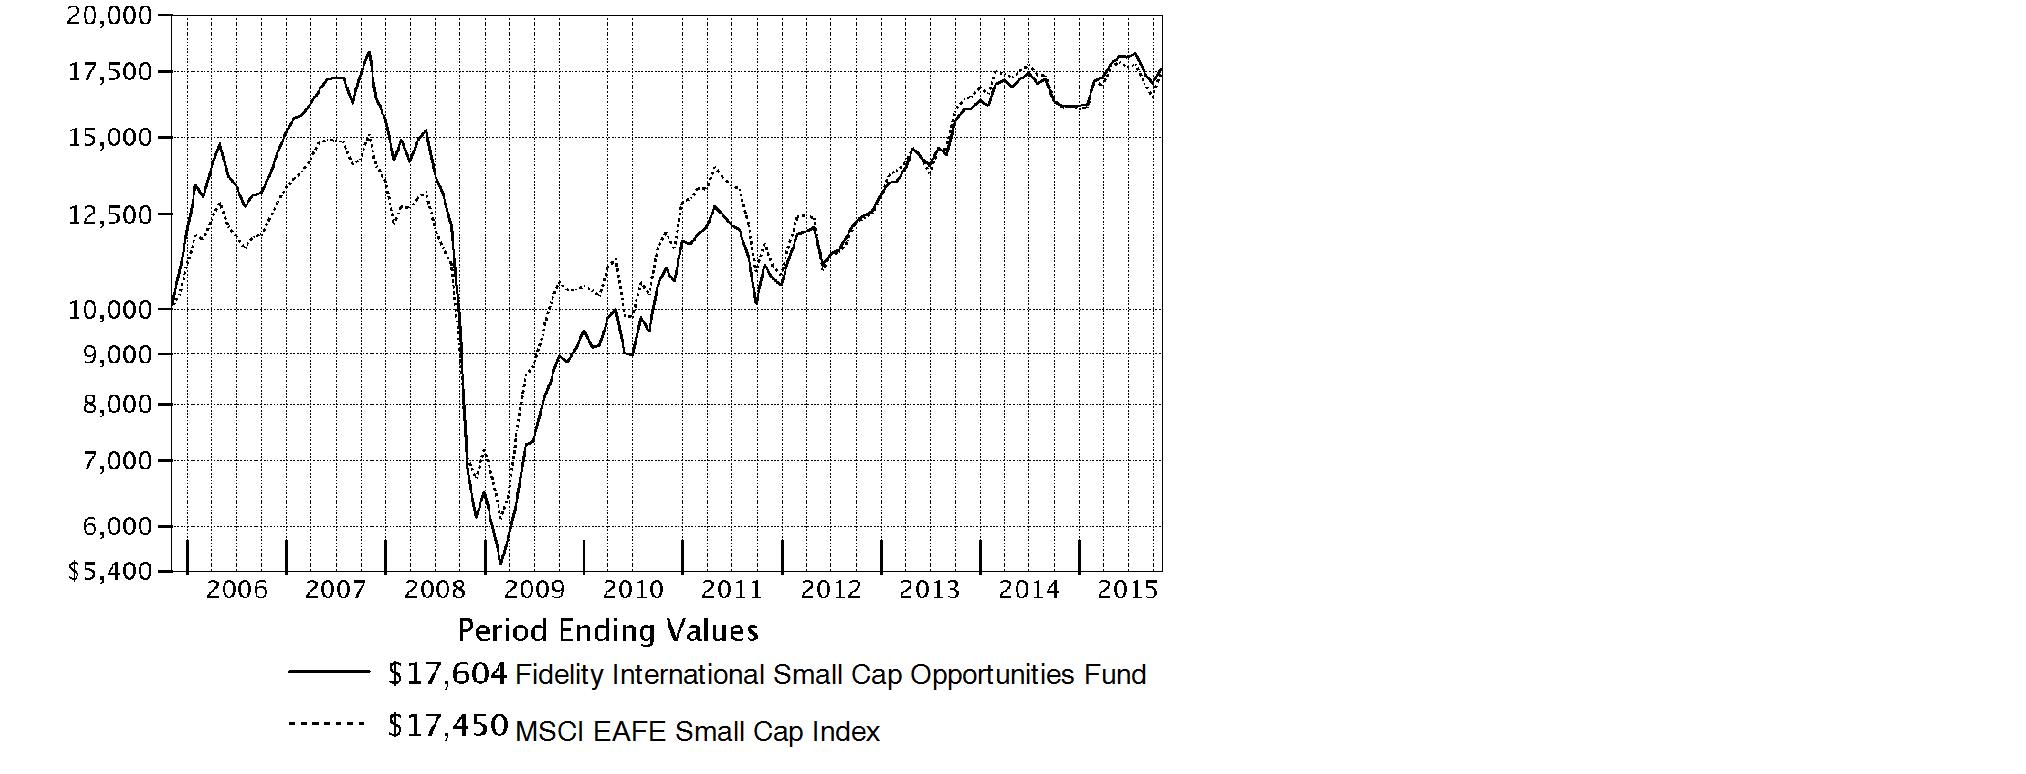
Annual Report
Market Recap: International equities suffered a moderate setback for the 12 months ending October 31, 2015, held back by a collapse in commodities prices that hurt resources-related sectors and geographies. The MSCI ACWI (All Country World Index) ex USA Index returned -4.55% for the period, affected also by concerns about global economic growth. Commodity producers remained under pressure for much of the past year, largely related to economic deceleration in China (-1%), the world's second-largest economy and a leading consumer of raw materials. This effect was exacerbated by U.S. dollar strength relative to global currencies, which weighed on commodities priced in dollars and acutely impacted equity returns within regions most exposed to resources prices. The emerging-markets group, for example, returned about -15% this period. Canada, a significant energy producer, returned roughly -17%. Net energy consumer Japan (+9%) was the best-performing region by far. Only about a quarter of the nearly 50 index countries managed a gain this period: Ireland (+19%) - the EU's fastest-growing economy - and Israel (+17%) proved top performers; Greece (-56%) and Brazil (-46%), among the worst. As for sectors, energy (-25%) and materials (-16%) declined sharply, whereas the two consumer sectors each gained about 6%.
Comments from Portfolio Manager Jed Weiss: For the year, the fund's share classes (excluding sales charges, if applicable) produced solid gains that were roughly in line with the 8.55% gain of the benchmark MSCI EAFE Small Cap Index. Relative to the benchmark, stock picking in the consumer discretionary, information technology and health care sectors was strong, whereas security selection in materials and, to a lesser extent, consumer staples hurt. In country terms, underweightings in Australia, Hong Kong and Singapore helped, as did stock picks in Germany and South Korea. Conversely, positioning in Canada detracted, along with security selection in Japan and several European markets. Another negative was the fund's fair-value pricing adjustment. Our biggest individual contributor was BGF Retail, a South Korean convenience-store retailer that wasn't part of our benchmark. Also contributing was SS&C Technologies Holdings, a provider of back-office software for asset managers. In contrast, non-index energy companies Pason Systems and ShawCor were particularly big detractors this period. Another detractor was Turkey-based Coca-Cola Icecek Sanayi. I sold the fund's stake in this owner of the Coca-Cola bottling franchise in various emerging markets and reinvested the proceeds in other stocks I thought offered a better risk/reward balance.
The views expressed above reflect those of the portfolio manager(s) only through the end of the period as stated on the cover of this report and do not necessarily represent the views of Fidelity or any other person in the Fidelity organization. Any such views are subject to change at any time based upon market or other conditions and Fidelity disclaims any responsibility to update such views. These views may not be relied on as investment advice and, because investment decisions for a Fidelity fund are based on numerous factors, may not be relied on as an indication of trading intent on behalf of any Fidelity fund.
Annual Report
Shareholder Expense Example
As a shareholder of the Fund, you incur two types of costs: (1) transaction costs, including sales charges (loads) on purchase payments or redemption proceeds, redemption fees and (2) ongoing costs, including management fees, distribution and/or service (12b-1) fees and other Fund expenses. This Example is intended to help you understand your ongoing costs (in dollars) of investing in the Fund and to compare these costs with the ongoing costs of investing in other mutual funds.
The Example is based on an investment of $1,000 invested at the beginning of the period and held for the entire period (May 1, 2015 to October 31, 2015).
Actual Expenses
The first line of the accompanying table for each class of the Fund provides information about actual account values and actual expenses. You may use the information in this line, together with the amount you invested, to estimate the expenses that you paid over the period. Simply divide your account value by $1,000.00 (for example, an $8,600 account value divided by $1,000.00 = 8.6), then multiply the result by the number in the first line for a class of the Fund under the heading entitled "Expenses Paid During Period" to estimate the expenses you paid on your account during this period. A small balance maintenance fee of $12.00 that is charged once a year may apply for certain accounts with a value of less than $2,000. This fee is not included in the table below. If it was, the estimate of expenses you paid during the period would be higher, and your ending account value lower, by this amount. In addition, the Fund, as a shareholder in the underlying Fidelity Central Funds, will indirectly bear its pro-rata share of the fees and expenses incurred by the underlying Fidelity Central Funds. These fees and expenses are not included in the Fund's annualized expense ratio used to calculate the expense estimate in the table below.
Hypothetical Example for Comparison Purposes
The second line of the accompanying table for each class of the Fund provides information about hypothetical account values and hypothetical expenses based on a Class' actual expense ratio and an assumed rate of return of 5% per year before expenses, which is not the Class' actual return. The hypothetical account values and expenses may not be used to estimate the actual ending account balance or expenses you paid for the period. You may use this information to compare the ongoing costs of investing in the Fund and other funds. To do so, compare this 5% hypothetical example with the 5% hypothetical examples that appear in the shareholder reports of the other funds. A small balance maintenance fee of $12.00 that is charged once a year may apply for certain accounts with a value of less than $2,000. This fee is not included in the table below. If it was, the estimate of expenses you paid during the period would be higher, and your ending account value lower, by this amount. In addition, the Fund, as a shareholder in the underlying Fidelity Central Funds, will indirectly bear its pro-rata share of the fees and expenses incurred by the underlying Fidelity Central Funds. These fees and expenses are not included in the Fund's annualized expense ratio used to calculate the expense estimate in the table below.
Please note that the expenses shown in the table are meant to highlight your ongoing costs only and do not reflect any transaction costs. Therefore, the second line of the table is useful in comparing ongoing costs only, and will not help you determine the relative total costs of owning different funds. In addition, if these transactional costs were included, your costs would have been higher.
Annual Report
Shareholder Expense Example - continued
| Annualized
Expense Ratio B | Beginning
Account Value
May 1, 2015 | Ending
Account Value
October 31, 2015 | Expenses Paid
During PeriodC
May 1, 2015
to October 31, 2015 |
Class A | 1.49% | | | |
Actual | | $ 1,000.00 | $ 985.30 | $ 7.46 |
HypotheticalA | | $ 1,000.00 | $ 1,017.69 | $ 7.58 |
Class T | 1.78% | | | |
Actual | | $ 1,000.00 | $ 983.80 | $ 8.90 |
HypotheticalA | | $ 1,000.00 | $ 1,016.23 | $ 9.05 |
Class B | 2.26% | | | |
Actual | | $ 1,000.00 | $ 982.20 | $ 11.29 |
HypotheticalA | | $ 1,000.00 | $ 1,013.81 | $ 11.47 |
Class C | 2.25% | | | |
Actual | | $ 1,000.00 | $ 982.10 | $ 11.24 |
HypotheticalA | | $ 1,000.00 | $ 1,013.86 | $ 11.42 |
International Small Cap Opportunities | 1.20% | | | |
Actual | | $ 1,000.00 | $ 987.40 | $ 6.01 |
HypotheticalA | | $ 1,000.00 | $ 1,019.16 | $ 6.11 |
Class I | 1.18% | | | |
Actual | | $ 1,000.00 | $ 987.40 | $ 5.91 |
HypotheticalA | | $ 1,000.00 | $ 1,019.26 | $ 6.01 |
A 5% return per year before expenses
B Annualized expense ratio reflects expenses net of applicable fee waivers.
C Expenses are equal to each Class' annualized expense ratio, multiplied by the average account value over the period, multiplied by 184/365 (to reflect the one-half year period).
Annual Report
Investment Changes (Unaudited)
Annual Report
Investment Changes (Unaudited) - continued
Asset Allocation as of October 31, 2015 |
| % of fund's
net assets | % of fund's net assets
6 months ago |
Stocks | 91.8 | 96.7 |
Short-Term Investments and Net Other Assets (Liabilities) | 8.2 | 3.3 |
Top Ten Stocks as of October 31, 2015 |
| % of fund's
net assets | % of fund's net assets
6 months ago |
USS Co. Ltd. (Japan, Specialty Retail) | 2.0 | 2.2 |
CTS Eventim AG (Germany, Media) | 2.0 | 1.7 |
Unite Group PLC (United Kingdom, Real Estate Management & Development) | 1.9 | 1.8 |
OBIC Co. Ltd. (Japan, IT Services) | 1.8 | 1.1 |
Berendsen PLC (United Kingdom, Commercial Services & Supplies) | 1.7 | 1.4 |
Intrum Justitia AB (Sweden, Commercial Services & Supplies) | 1.7 | 1.3 |
Spirax-Sarco Engineering PLC (United Kingdom, Machinery) | 1.6 | 1.7 |
Sartorius AG (non-vtg.) (Germany, Health Care Equipment & Supplies) | 1.6 | 1.2 |
Bellway PLC (United Kingdom, Household Durables) | 1.5 | 1.2 |
SS&C Technologies Holdings, Inc. (United States of America, Software) | 1.5 | 1.6 |
| 17.3 | |
Market Sectors as of October 31, 2015 |
| % of fund's
net assets | % of fund's net assets
6 months ago |
Consumer Discretionary | 20.5 | 19.3 |
Financials | 18.7 | 19.7 |
Industrials | 18.3 | 20.6 |
Information Technology | 9.2 | 9.9 |
Health Care | 8.5 | 7.1 |
Consumer Staples | 8.5 | 9.3 |
Materials | 6.7 | 8.4 |
Energy | 1.4 | 2.4 |
Annual Report
Investments October 31, 2015
Showing Percentage of Net Assets
Common Stocks - 90.2% |
| Shares | | Value |
Australia - 2.0% |
DuluxGroup Ltd. | 1,324,143 | | $ 5,536,022 |
Imdex Ltd. (a) | 2,238,840 | | 357,061 |
RCG Corp. Ltd. | 5,554,148 | | 5,661,712 |
Sydney Airport unit | 684,757 | | 3,129,413 |
TFS Corp. Ltd. (d) | 3,227,274 | | 4,028,552 |
TOTAL AUSTRALIA | | 18,712,760 |
Austria - 1.2% |
Andritz AG | 139,900 | | 7,045,919 |
Zumtobel AG | 179,381 | | 4,083,206 |
TOTAL AUSTRIA | | 11,129,125 |
Bailiwick of Jersey - 0.4% |
Integrated Diagnostics Holdings PLC (a) | 746,300 | | 4,112,113 |
Belgium - 1.3% |
Gimv NV | 56,688 | | 2,663,658 |
KBC Ancora | 254,438 | | 10,106,114 |
TOTAL BELGIUM | | 12,769,772 |
Bermuda - 0.5% |
Petra Diamonds Ltd. | 1,163,909 | | 1,339,432 |
Vostok New Ventures Ltd. SDR (a) | 527,689 | | 3,366,171 |
TOTAL BERMUDA | | 4,705,603 |
British Virgin Islands - 0.1% |
Gem Diamonds Ltd. | 719,096 | | 1,097,473 |
Canada - 1.9% |
Cara Operations Ltd. | 210,400 | | 5,705,708 |
McCoy Global, Inc. | 629,100 | | 1,424,087 |
New Look Vision Group, Inc. | 172,200 | | 3,950,749 |
Pason Systems, Inc. | 334,600 | | 4,923,298 |
ShawCor Ltd. Class A | 114,500 | | 2,429,929 |
TOTAL CANADA | | 18,433,771 |
Cayman Islands - 0.5% |
58.com, Inc. ADR (a)(d) | 37,900 | | 1,989,371 |
Value Partners Group Ltd. | 2,462,000 | | 2,607,054 |
TOTAL CAYMAN ISLANDS | | 4,596,425 |
Common Stocks - continued |
| Shares | | Value |
Denmark - 1.6% |
Jyske Bank A/S (Reg.) (a) | 169,127 | | $ 8,256,423 |
Spar Nord Bank A/S | 746,369 | | 7,152,976 |
TOTAL DENMARK | | 15,409,399 |
Finland - 0.5% |
Tikkurila Oyj | 267,746 | | 4,913,985 |
France - 1.5% |
Laurent-Perrier Group SA | 39,793 | | 3,447,722 |
Vetoquinol SA | 69,184 | | 2,902,383 |
Virbac SA | 41,252 | | 8,226,537 |
TOTAL FRANCE | | 14,576,642 |
Germany - 4.1% |
alstria office REIT-AG (d) | 281,000 | | 3,922,776 |
CompuGroup Medical AG | 328,478 | | 9,680,450 |
CTS Eventim AG | 488,280 | | 19,117,645 |
Fielmann AG | 96,874 | | 6,791,128 |
TOTAL GERMANY | | 39,511,999 |
Greece - 0.4% |
Titan Cement Co. SA (Reg.) | 180,680 | | 3,963,761 |
India - 0.6% |
Jyothy Laboratories Ltd. | 1,124,354 | | 5,273,764 |
Ireland - 1.2% |
Dalata Hotel Group PLC (a) | 32,402 | | 161,051 |
FBD Holdings PLC | 240,328 | | 1,836,723 |
James Hardie Industries PLC: | | | |
CDI | 165,775 | | 2,145,974 |
sponsored ADR (d) | 564,575 | | 7,424,161 |
TOTAL IRELAND | | 11,567,909 |
Isle of Man - 0.2% |
Playtech Ltd. | 135,589 | | 1,789,245 |
Israel - 1.4% |
Azrieli Group | 104,005 | | 4,075,096 |
Ituran Location & Control Ltd. | 106,586 | | 2,174,354 |
Sarine Technologies Ltd. | 1,497,700 | | 1,664,729 |
Strauss Group Ltd. (a) | 366,044 | | 5,243,999 |
TOTAL ISRAEL | | 13,158,178 |
Italy - 4.3% |
Azimut Holding SpA | 526,997 | | 12,685,523 |
Common Stocks - continued |
| Shares | | Value |
Italy - continued |
Banco di Desio e della Brianza SpA (d) | 940,000 | | $ 3,216,784 |
Beni Stabili SpA SIIQ | 13,645,675 | | 11,239,094 |
Interpump Group SpA | 947,943 | | 13,968,234 |
TOTAL ITALY | | 41,109,635 |
Japan - 26.0% |
Aoki Super Co. Ltd. | 203,000 | | 2,147,019 |
Artnature, Inc. | 628,500 | | 6,043,267 |
Asahi Co. Ltd. | 463,200 | | 4,549,641 |
Asia Securities Printing Co. Ltd. | 644,800 | | 4,752,487 |
Autobacs Seven Co. Ltd. | 307,000 | | 5,383,421 |
Azbil Corp. | 436,300 | | 11,007,498 |
Broadleaf Co. Ltd. | 77,800 | | 891,167 |
Coca-Cola Central Japan Co. Ltd. | 383,300 | | 5,387,042 |
Daiichikosho Co. Ltd. | 194,600 | | 6,490,308 |
Daikokutenbussan Co. Ltd. | 168,700 | | 5,795,204 |
GCA Savvian Group Corp. | 372,900 | | 4,378,352 |
Glory Ltd. | 288,100 | | 7,288,736 |
Goldcrest Co. Ltd. | 422,130 | | 7,898,257 |
Iwatsuka Confectionary Co. Ltd. | 50,400 | | 2,605,131 |
Japan Digital Laboratory Co. | 334,800 | | 4,280,994 |
Kobayashi Pharmaceutical Co. Ltd. | 115,000 | | 8,915,752 |
Koshidaka Holdings Co. Ltd. | 166,900 | | 3,021,378 |
Lasertec Corp. | 330,236 | | 3,603,891 |
Medikit Co. Ltd. | 105,000 | | 3,130,875 |
Meiko Network Japan Co. Ltd. | 112,600 | | 1,336,814 |
Miraial Co. Ltd. | 73,200 | | 710,087 |
Nagaileben Co. Ltd. | 472,600 | | 8,055,401 |
ND Software Co. Ltd. | 71,982 | | 830,895 |
Nihon Parkerizing Co. Ltd. | 1,048,000 | | 9,322,239 |
Nippon Seiki Co. Ltd. | 177,000 | | 3,709,206 |
NS Tool Co. Ltd. (d) | 35,600 | | 618,104 |
OBIC Co. Ltd. | 319,500 | | 16,862,249 |
OSG Corp. | 663,600 | | 12,482,431 |
Paramount Bed Holdings Co. Ltd. | 198,500 | | 6,366,919 |
San-Ai Oil Co. Ltd. | 620,000 | | 4,735,609 |
Seven Bank Ltd. | 2,768,800 | | 12,616,191 |
SHO-BOND Holdings Co. Ltd. | 263,700 | | 10,472,846 |
Shoei Co. Ltd. (d) | 280,100 | | 4,837,564 |
SK Kaken Co. Ltd. | 54,000 | | 5,259,333 |
Software Service, Inc. | 62,900 | | 2,370,885 |
Techno Medica Co. Ltd. | 79,400 | | 1,812,945 |
Common Stocks - continued |
| Shares | | Value |
Japan - continued |
The Monogatari Corp. | 61,200 | | $ 2,601,764 |
The Nippon Synthetic Chemical Industry Co. Ltd. | 471,000 | | 3,488,572 |
TKC Corp. | 214,900 | | 5,065,518 |
Tocalo Co. Ltd. | 117,000 | | 2,348,578 |
Tsutsumi Jewelry Co. Ltd. | 121,100 | | 2,406,897 |
USS Co. Ltd. | 1,110,800 | | 19,609,931 |
Workman Co. Ltd. | 90,300 | | 5,564,943 |
Yamada Consulting Group Co. Ltd. | 103,700 | | 3,035,223 |
Yamato Kogyo Co. Ltd. | 181,500 | | 4,834,639 |
TOTAL JAPAN | | 248,926,203 |
Korea (South) - 1.6% |
BGFretail Co. Ltd. | 65,707 | | 9,783,223 |
Coway Co. Ltd. | 44,576 | | 3,326,305 |
Leeno Industrial, Inc. | 57,500 | | 2,203,268 |
TOTAL KOREA (SOUTH) | | 15,312,796 |
Mexico - 0.6% |
Consorcio ARA S.A.B. de CV (a) | 14,924,378 | | 5,592,870 |
Netherlands - 2.8% |
Aalberts Industries NV | 319,501 | | 10,387,346 |
Heijmans NV (Certificaten Van Aandelen) (a)(d) | 356,792 | | 3,001,449 |
VastNed Retail NV | 271,729 | | 13,222,201 |
TOTAL NETHERLANDS | | 26,610,996 |
Norway - 0.4% |
Kongsberg Gruppen ASA | 240,900 | | 3,770,818 |
Philippines - 0.4% |
Jollibee Food Corp. | 866,090 | | 3,806,557 |
South Africa - 0.8% |
Alexander Forbes Group Holding | 4,368,721 | | 2,752,746 |
Clicks Group Ltd. | 723,287 | | 5,283,931 |
TOTAL SOUTH AFRICA | | 8,036,677 |
Spain - 1.8% |
Hispania Activos Inmobiliarios SA (a) | 210,543 | | 3,171,873 |
Merlin Properties Socimi SA | 518,100 | | 6,643,036 |
Prosegur Compania de Seguridad SA (Reg.) | 1,687,590 | | 7,515,821 |
TOTAL SPAIN | | 17,330,730 |
Common Stocks - continued |
| Shares | | Value |
Sweden - 3.0% |
Fagerhult AB | 728,290 | | $ 12,445,686 |
Intrum Justitia AB | 446,534 | | 16,045,548 |
TOTAL SWEDEN | | 28,491,234 |
Switzerland - 0.2% |
Tecan Group AG | 11,481 | | 1,565,723 |
Taiwan - 0.4% |
Addcn Technology Co. Ltd. | 426,900 | | 4,148,682 |
United Kingdom - 21.7% |
AA PLC | 1,236,400 | | 5,277,809 |
Babcock International Group PLC | 164,700 | | 2,447,611 |
Bellway PLC | 359,872 | | 14,402,054 |
Berendsen PLC | 1,033,163 | | 16,325,422 |
Britvic PLC | 761,971 | | 8,210,835 |
Dechra Pharmaceuticals PLC | 532,950 | | 7,965,371 |
Derwent London PLC | 83,710 | | 5,007,037 |
DP Poland PLC (a)(e) | 7,188,000 | | 2,507,081 |
Elementis PLC | 2,052,810 | | 7,424,180 |
Great Portland Estates PLC | 741,189 | | 10,163,578 |
H&T Group PLC | 264,353 | | 798,752 |
Hilton Food Group PLC | 220,288 | | 1,579,121 |
Howden Joinery Group PLC | 1,287,000 | | 9,198,006 |
Informa PLC | 1,001,781 | | 8,771,883 |
InterContinental Hotel Group PLC ADR | 116,931 | | 4,663,208 |
ITE Group PLC | 1,752,534 | | 3,789,143 |
JUST EAT Ltd. (a) | 777,370 | | 5,105,157 |
Meggitt PLC | 537,590 | | 2,930,456 |
Rightmove PLC | 116,414 | | 6,889,616 |
Shaftesbury PLC | 837,673 | | 12,145,210 |
Spectris PLC | 415,478 | | 10,677,150 |
Spirax-Sarco Engineering PLC | 335,791 | | 15,741,901 |
Taylor Wimpey PLC | 1,486,800 | | 4,538,261 |
Ted Baker PLC | 198,700 | | 9,272,183 |
Topps Tiles PLC | 1,983,300 | | 4,448,597 |
Ultra Electronics Holdings PLC | 340,558 | | 8,835,821 |
Unite Group PLC | 1,774,823 | | 18,194,846 |
TOTAL UNITED KINGDOM | | 207,310,289 |
United States of America - 6.8% |
ANSYS, Inc. (a) | 21,085 | | 2,009,611 |
Autoliv, Inc. (d) | 38,200 | | 4,631,368 |
Broadridge Financial Solutions, Inc. | 48,905 | | 2,913,760 |
Common Stocks - continued |
| Shares | | Value |
United States of America - continued |
China Biologic Products, Inc. (a) | 77,180 | | $ 8,793,889 |
Kennedy-Wilson Holdings, Inc. | 436,429 | | 10,701,239 |
Martin Marietta Materials, Inc. | 19,720 | | 3,059,558 |
Mohawk Industries, Inc. (a) | 32,600 | | 6,373,300 |
PriceSmart, Inc. | 120,899 | | 10,394,896 |
ResMed, Inc. | 43,300 | | 2,494,513 |
SS&C Technologies Holdings, Inc. | 189,258 | | 14,033,481 |
TOTAL UNITED STATES OF AMERICA | | 65,405,615 |
TOTAL COMMON STOCKS (Cost $739,886,661) |
863,140,749
|
Nonconvertible Preferred Stocks - 1.6% |
| | | |
Germany - 1.6% |
Sartorius AG (non-vtg.)
(Cost $9,373,614) | 69,179 | |
15,655,759
|
Money Market Funds - 8.9% |
| | | |
Fidelity Cash Central Fund, 0.18% (b) | 78,298,533 | | 78,298,533 |
Fidelity Securities Lending Cash Central Fund, 0.19% (b)(c) | 6,756,054 | | 6,756,054 |
TOTAL MONEY MARKET FUNDS (Cost $85,054,587) |
85,054,587
|
TOTAL INVESTMENT PORTFOLIO - 100.7% (Cost $834,314,862) | | 963,851,095 |
NET OTHER ASSETS (LIABILITIES) - (0.7)% | | (7,006,746) |
NET ASSETS - 100% | $ 956,844,349 |
Legend |
(a) Non-income producing |
(b) Affiliated fund that is generally available only to investment companies and other accounts managed by Fidelity Investments. The rate quoted is the annualized seven-day yield of the fund at period end. A complete unaudited listing of the fund's holdings as of its most recent quarter end is available upon request. In addition, each Fidelity Central Fund's financial statements, which are not covered by the Fund's Report of Independent Registered Public Accounting Firm, are available on the SEC's website or upon request. |
(c) Investment made with cash collateral received from securities on loan. |
(d) Security or a portion of the security is on loan at period end. |
(e) Affiliated company |
Affiliated Central Funds |
Information regarding fiscal year to date income earned by the Fund from investments in Fidelity Central Funds is as follows: |
Fund | Income earned |
Fidelity Cash Central Fund | $ 69,465 |
Fidelity Securities Lending Cash Central Fund | 43,254 |
Total | $ 112,719 |
Other Affiliated Issuers |
An affiliated company is a company in which the Fund has ownership of at least 5% of the voting securities. Fiscal year to date transactions with companies which are or were affiliates are as follows: |
Affiliate | Value, beginning of period | Purchases | Sales Proceeds | Dividend Income | Value,
end of
period |
DP Poland PLC | $ - | $ 1,799,096 | $ - | $ - | $ 2,507,081 |
Other Information |
Categorizations in the Schedule of Investments are based on country or territory of incorporation. |
The following is a summary of the inputs used, as of October 31, 2015, involving the Fund's assets and liabilities carried at fair value. The inputs or methodology used for valuing securities may not be an indication of the risk associated with investing in those securities. For more information on valuation inputs, and their aggregation into the levels used in the table below, please refer to the Investment Valuation section in the accompanying Notes to Financial Statements. |
Valuation Inputs at Reporting Date: |
Description | Total | Level 1 | Level 2 | Level 3 |
Investments in Securities: | | | | |
Equities: | | | | |
Consumer Discretionary | $ 193,110,292 | $ 124,130,156 | $ 68,980,136 | $ - |
Consumer Staples | 80,110,906 | 43,943,727 | 36,167,179 | - |
Energy | 13,512,923 | 8,777,314 | 4,735,609 | - |
Financials | 178,821,710 | 151,321,856 | 27,499,854 | - |
Health Care | 83,964,658 | 61,396,738 | 22,567,920 | - |
Industrials | 175,615,594 | 129,823,047 | 45,792,547 | - |
Information Technology | 89,465,483 | 47,044,079 | 42,421,404 | - |
Materials | 64,194,942 | 29,222,550 | 34,972,392 | - |
Money Market Funds | 85,054,587 | 85,054,587 | - | - |
Total Investments in Securities: | $ 963,851,095 | $ 680,714,054 | $ 283,137,041 | $ - |
See accompanying notes which are an integral part of the financial statements.
Annual Report
Statement of Assets and Liabilities
| | October 31, 2015 |
| | |
Assets | | |
Investment in securities, at value (including securities loaned of $6,608,284) - See accompanying schedule: Unaffiliated issuers (cost $747,461,179) | $ 876,289,427 | |
Fidelity Central Funds (cost $85,054,587) | 85,054,587 | |
Other affiliated issuers (cost $1,799,096) | 2,507,081 | |
Total Investments (cost $834,314,862) | | $ 963,851,095 |
Cash | | 35,705 |
Receivable for fund shares sold | | 1,959,910 |
Dividends receivable | | 2,626,567 |
Distributions receivable from Fidelity Central Funds | | 20,131 |
Prepaid expenses | | 2,218 |
Other receivables | | 8,171 |
Total assets | | 968,503,797 |
| | |
Liabilities | | |
Payable to custodian | $ 4,255 | |
Payable for investments purchased | 2,996,514 | |
Payable for fund shares redeemed | 922,123 | |
Accrued management fee | 669,820 | |
Distribution and service plan fees payable | 27,606 | |
Other affiliated payables | 204,936 | |
Other payables and accrued expenses | 78,140 | |
Collateral on securities loaned, at value | 6,756,054 | |
Total liabilities | | 11,659,448 |
| | |
Net Assets | | $ 956,844,349 |
Net Assets consist of: | | |
Paid in capital | | $ 1,079,462,131 |
Undistributed net investment income | | 4,878,283 |
Accumulated undistributed net realized gain (loss) on investments and foreign currency transactions | | (256,995,467) |
Net unrealized appreciation (depreciation) on investments and assets and liabilities in foreign currencies | | 129,499,402 |
Net Assets | | $ 956,844,349 |
See accompanying notes which are an integral part of the financial statements.
Annual Report
Statement of Assets and Liabilities - continued
| | October 31, 2015 |
Calculation of Maximum Offering Price | | |
Class A:
Net Asset Value and redemption price per share ($42,288,833 ÷ 2,866,188 shares) | | $ 14.75 |
| | |
Maximum offering price per share (100/94.25 of $14.75) | | $ 15.65 |
Class T:
Net Asset Value and redemption price per share ($13,295,749 ÷ 909,157 shares) | | $ 14.62 |
| | |
Maximum offering price per share (100/96.50 of $14.62) | | $ 15.15 |
Class B:
Net Asset Value and offering price per share ($604,112 ÷ 42,095 shares)A | | $ 14.35 |
| | |
Class C:
Net Asset Value and offering price per share ($17,369,639 ÷ 1,217,958 shares)A | | $ 14.26 |
| | |
International Small Cap Opportunities:
Net Asset Value, offering price and redemption price per share ($762,562,645 ÷ 51,136,318 shares) | | $ 14.91 |
| | |
Class I:
Net Asset Value, offering price and redemption price per share ($120,723,371 ÷ 8,096,650 shares) | | $ 14.91 |
A Redemption price per share is equal to net asset value less any applicable contingent deferred sales charge.
See accompanying notes which are an integral part of the financial statements.
Annual Report
Financial Statements - continued
Statement of Operations
| Year ended October 31, 2015 |
| | |
Investment Income | | |
Dividends | | $ 15,396,244 |
Interest | | 1,191 |
Income from Fidelity Central Funds | | 112,719 |
Income before foreign taxes withheld | | 15,510,154 |
Less foreign taxes withheld | | (1,188,664) |
Total income | | 14,321,490 |
| | |
Expenses | | |
Management fee | | |
Basic fee | $ 6,379,946 | |
Performance adjustment | 411,545 | |
Transfer agent fees | 1,704,191 | |
Distribution and service plan fees | 248,267 | |
Accounting and security lending fees | 364,305 | |
Custodian fees and expenses | 171,042 | |
Independent trustees' compensation | 3,095 | |
Registration fees | 122,475 | |
Audit | 74,244 | |
Legal | 1,956 | |
Miscellaneous | 6,233 | |
Total expenses before reductions | 9,487,299 | |
Expense reductions | (46,082) | 9,441,217 |
Net investment income (loss) | | 4,880,273 |
Realized and Unrealized Gain (Loss) | | |
Net realized gain (loss) on: | | |
Investment securities: | | |
Unaffiliated issuers | 32,176,139 | |
Foreign currency transactions | (20,188) | |
Total net realized gain (loss) | | 32,155,951 |
Change in net unrealized appreciation (depreciation) on: Investment securities | 15,699,549 | |
Assets and liabilities in foreign currencies | 9,159 | |
Total change in net unrealized appreciation (depreciation) | | 15,708,708 |
Net gain (loss) | | 47,864,659 |
Net increase (decrease) in net assets resulting from operations | | $ 52,744,932 |
See accompanying notes which are an integral part of the financial statements.
Annual Report
Statement of Changes in Net Assets
| Year ended
October 31,
2015 | Year ended
October 31,
2014 |
Increase (Decrease) in Net Assets | | |
Operations | | |
Net investment income (loss) | $ 4,880,273 | $ 3,975,650 |
Net realized gain (loss) | 32,155,951 | 27,466,423 |
Change in net unrealized appreciation (depreciation) | 15,708,708 | (28,661,157) |
Net increase (decrease) in net assets resulting from operations | 52,744,932 | 2,780,916 |
Distributions to shareholders from net investment income | (3,982,311) | (3,580,601) |
Distributions to shareholders from net realized gain | (949,656) | (3,233,620) |
Total distributions | (4,931,967) | (6,814,221) |
Share transactions - net increase (decrease) | 250,623,581 | 97,201,705 |
Redemption fees | 196,651 | 84,800 |
Total increase (decrease) in net assets | 298,633,197 | 93,253,200 |
| | |
Net Assets | | |
Beginning of period | 658,211,152 | 564,957,952 |
End of period (including undistributed net investment income of $4,878,283 and undistributed net investment income of $3,990,517, respectively) | $ 956,844,349 | $ 658,211,152 |
See accompanying notes which are an integral part of the financial statements.
Annual Report
Financial Highlights - Fidelity International Small Cap Opportunities Fund Class A
Years ended October 31, | 2015 | 2014 | 2013 | 2012 | 2011 |
Selected Per-Share Data | | | | | |
Net asset value, beginning of period | $ 13.65 | $ 13.68 | $ 10.78 | $ 9.75 | $ 9.82 |
Income from Investment Operations | | | | | |
Net investment income (loss) C | .06 | .05 | .07 | .08 | .15F |
Net realized and unrealized gain (loss) | 1.11 | .05 | 2.91 | 1.07 | (.07) |
Total from investment operations | 1.17 | .10 | 2.98 | 1.15 | .08 |
Distributions from net investment income | (.05) | (.06) | (.08) | (.11) | (.11) |
Distributions from net realized gain | (.02) | (.08) | (.01) | (.01) | (.04) |
Total distributions | (.07) | (.13) J | (.08) I | (.12) | (.15) |
Redemption fees added to paid in capitalC, H | - | - | - | - | - |
Net asset value, end of period | $ 14.75 | $ 13.65 | $ 13.68 | $ 10.78 | $ 9.75 |
Total ReturnA, B | 8.62% | .78% | 27.85% | 12.00% | .81% |
Ratios to Average Net AssetsD, G | | | | | |
Expenses before reductions | 1.52% | 1.63% | 1.70% | 1.75% | 1.34% |
Expenses net of fee waivers, if any | 1.52% | 1.63% | 1.65% | 1.65% | 1.33% |
Expenses net of all reductions | 1.51% | 1.63% | 1.64% | 1.64% | 1.32% |
Net investment income (loss) | .38% | .33% | .59% | .85% | 1.44%F |
Supplemental Data | | | | | |
Net assets, end of period (000 omitted) | $ 42,289 | $ 25,041 | $ 22,052 | $ 18,194 | $ 18,686 |
Portfolio turnover rateE | 21% | 18% | 31% | 28% | 24% |
A Total returns would have been lower if certain expenses had not been reduced during the applicable periods shown.
B Total returns do not include the effect of the sales charges.
C Calculated based on average shares outstanding during the period.
D Fees and expenses of any underlying Fidelity Central Funds are not included in the Fund's expense ratio. The Fund indirectly bears its proportionate share of the expenses of any underlying Fidelity Central Funds.
E Amount does not include the portfolio activity of any underlying Fidelity Central Funds.
F Investment income per share reflects a large, non-recurring dividend which amounted to $.06 per share. Excluding this non-recurring dividend, the ratio of net investment income (loss) to average net assets would have been .80%.
G Expense ratios reflect operating expenses of the class. Expenses before reductions do not reflect amounts reimbursed by the investment adviser or reductions from brokerage service arrangements or reductions from other expense offset arrangements and do not represent the amount paid by the class during periods when reimbursements or reductions occur. Expenses net of fee waivers reflect expenses after reimbursement by the investment adviser but prior to reductions from brokerage service arrangements or other expense offset arrangements. Expenses net of all reductions represent the net expenses paid by the class.
H Amount represents less than $.005 per share.
I Total distributions of $.08 per share is comprised of distributions from net investment income of $.077 and distributions from net realized gain of $.005 per share.
J Total distributions of $.13 per share is comprised of distributions from net investment income of $.055 and distributions from net realized gain of $.079 per share.
See accompanying notes which are an integral part of the financial statements.
Annual Report
Financial Highlights - Fidelity International Small Cap Opportunities Fund Class T
Years ended October 31, | 2015 | 2014 | 2013 | 2012 | 2011 |
Selected Per-Share Data | | | | | |
Net asset value, beginning of period | $ 13.53 | $ 13.56 | $ 10.69 | $ 9.66 | $ 9.72 |
Income from Investment Operations | | | | | |
Net investment income (loss) C | .01 | .01 | .04 | .06 | .12F |
Net realized and unrealized gain (loss) | 1.11 | .06 | 2.89 | 1.06 | (.06) |
Total from investment operations | 1.12 | .07 | 2.93 | 1.12 | .06 |
Distributions from net investment income | (.01) | (.02) | (.05) | (.08) | (.08) |
Distributions from net realized gain | (.02) | (.08) | (.01) | (.01) | (.04) |
Total distributions | (.03) | (.10) | (.06) | (.09) | (.12) |
Redemption fees added to paid in capitalC, H | - | - | - | - | - |
Net asset value, end of period | $ 14.62 | $ 13.53 | $ 13.56 | $ 10.69 | $ 9.66 |
Total ReturnA, B | 8.27% | .55% | 27.53% | 11.72% | .60% |
Ratios to Average Net AssetsD, G | | | | | |
Expenses before reductions | 1.80% | 1.89% | 1.96% | 2.02% | 1.60% |
Expenses net of fee waivers, if any | 1.80% | 1.89% | 1.90% | 1.90% | 1.60% |
Expenses net of all reductions | 1.80% | 1.89% | 1.89% | 1.89% | 1.59% |
Net investment income (loss) | .10% | .07% | .34% | .60% | 1.17%F |
Supplemental Data | | | | | |
Net assets, end of period (000 omitted) | $ 13,296 | $ 9,913 | $ 9,634 | $ 8,169 | $ 8,701 |
Portfolio turnover rateE | 21% | 18% | 31% | 28% | 24% |
A Total returns would have been lower if certain expenses had not been reduced during the applicable periods shown.
B Total returns do not include the effect of the sales charges.
C Calculated based on average shares outstanding during the period.
D Fees and expenses of any underlying Fidelity Central Funds are not included in the Fund's expense ratio. The Fund indirectly bears its proportionate share of the expenses of any underlying Fidelity Central Funds.
E Amount does not include the portfolio activity of any underlying Fidelity Central Funds.
F Investment income per share reflects a large, non-recurring dividend which amounted to $.06 per share. Excluding this non-recurring dividend, the ratio of net investment income (loss) to average net assets would have been .54%.
G Expense ratios reflect operating expenses of the class. Expenses before reductions do not reflect amounts reimbursed by the investment adviser or reductions from brokerage service arrangements or reductions from other expense offset arrangements and do not represent the amount paid by the class during periods when reimbursements or reductions occur. Expenses net of fee waivers reflect expenses after reimbursement by the investment adviser but prior to reductions from brokerage service arrangements or other expense offset arrangements. Expenses net of all reductions represent the net expenses paid by the class.
H Amount represents less than $.005 per share.
See accompanying notes which are an integral part of the financial statements.
Annual Report
Financial Highlights - Fidelity International Small Cap Opportunities Fund Class B
Years ended October 31, | 2015 | 2014 | 2013 | 2012 | 2011 |
Selected Per-Share Data | | | | | |
Net asset value, beginning of period | $ 13.31 | $ 13.31 | $ 10.50 | $ 9.48 | $ 9.54 |
Income from Investment Operations | | | | | |
Net investment income (loss) C | (.06) | (.06) | (.02) | .01 | .07F |
Net realized and unrealized gain (loss) | 1.10 | .06 | 2.84 | 1.05 | (.06) |
Total from investment operations | 1.04 | - | 2.82 | 1.06 | .01 |
Distributions from net investment income | - | - | - H | (.03) | (.06) |
Distributions from net realized gain | - | - | (.01) | (.01) | (.02) |
Total distributions | - | - | (.01) | (.04) | (.07) I |
Redemption fees added to paid in capitalC, H | - | - | - | - | - |
Net asset value, end of period | $ 14.35 | $ 13.31 | $ 13.31 | $ 10.50 | $ 9.48 |
Total ReturnA, B | 7.81% | -% | 26.86% | 11.21% | .10% |
Ratios to Average Net AssetsD, G | | | | | |
Expenses before reductions | 2.30% | 2.38% | 2.46% | 2.50% | 2.09% |
Expenses net of fee waivers, if any | 2.30% | 2.38% | 2.40% | 2.40% | 2.09% |
Expenses net of all reductions | 2.29% | 2.38% | 2.39% | 2.39% | 2.07% |
Net investment income (loss) | (.39)% | (.43)% | (.16)% | .10% | .68%F |
Supplemental Data | | | | | |
Net assets, end of period (000 omitted) | $ 604 | $ 744 | $ 1,410 | $ 1,966 | $ 2,293 |
Portfolio turnover rateE | 21% | 18% | 31% | 28% | 24% |
A Total returns would have been lower if certain expenses had not been reduced during the applicable periods shown.
B Total returns do not include the effect of the contingent deferred sales charge.
C Calculated based on average shares outstanding during the period.
D Fees and expenses of any underlying Fidelity Central Funds are not included in the Fund's expense ratio. The Fund indirectly bears its proportionate share of the expenses of any underlying Fidelity Central Funds.
E Amount does not include the portfolio activity of any underlying Fidelity Central Funds.
F Investment income per share reflects a large, non-recurring dividend which amounted to $.06 per share. Excluding this non-recurring dividend, the ratio of net investment income (loss) to average net assets would have been .05%.
G Expense ratios reflect operating expenses of the class. Expenses before reductions do not reflect amounts reimbursed by the investment adviser or reductions from brokerage service arrangements or reductions from other expense offset arrangements and do not represent the amount paid by the class during periods when reimbursements or reductions occur. Expenses net of fee waivers reflect expenses after reimbursement by the investment adviser but prior to reductions from brokerage service arrangements or other expense offset arrangements. Expenses net of all reductions represent the net expenses paid by the class.
H Amount represents less than $.005 per share.
I Total distributions of $.07 per share is comprised of distributions from net investment income of $.058 and distributions from net realized gain of $.015 per share.
See accompanying notes which are an integral part of the financial statements.
Annual Report
Financial Highlights - Fidelity International Small Cap Opportunities Fund Class C
Years ended October 31, | 2015 | 2014 | 2013 | 2012 | 2011 |
Selected Per-Share Data | | | | | |
Net asset value, beginning of period | $ 13.23 | $ 13.28 | $ 10.48 | $ 9.47 | $ 9.53 |
Income from Investment Operations | | | | | |
Net investment income (loss) C | (.05) | (.06) | (.02) | .01 | .07F |
Net realized and unrealized gain (loss) | 1.08 | .06 | 2.84 | 1.04 | (.06) |
Total from investment operations | 1.03 | - | 2.82 | 1.05 | .01 |
Distributions from net investment income | - | - | (.01) | (.03) | (.06) |
Distributions from net realized gain | - | (.05) | (.01) | (.01) | (.02) |
Total distributions | - | (.05) | (.02) | (.04) | (.07) I |
Redemption fees added to paid in capitalC, H | - | - | - | - | - |
Net asset value, end of period | $ 14.26 | $ 13.23 | $ 13.28 | $ 10.48 | $ 9.47 |
Total ReturnA, B | 7.79% | .03% | 26.91% | 11.13% | .10% |
Ratios to Average Net AssetsD, G | | | | | |
Expenses before reductions | 2.27% | 2.38% | 2.45% | 2.50% | 2.09% |
Expenses net of fee waivers, if any | 2.27% | 2.38% | 2.40% | 2.40% | 2.09% |
Expenses net of all reductions | 2.26% | 2.38% | 2.39% | 2.39% | 2.07% |
Net investment income (loss) | (.36)% | (.42)% | (.16)% | .10% | .68%F |
Supplemental Data | | | | | |
Net assets, end of period (000 omitted) | $ 17,370 | $ 8,438 | $ 8,070 | $ 6,608 | $ 6,900 |
Portfolio turnover rateE | 21% | 18% | 31% | 28% | 24% |
A Total returns would have been lower if certain expenses had not been reduced during the applicable periods shown.
B Total returns do not include the effect of the contingent deferred sales charge.
C Calculated based on average shares outstanding during the period.
D Fees and expenses of any underlying Fidelity Central Funds are not included in the Fund's expense ratio. The Fund indirectly bears its proportionate share of the expenses of any underlying Fidelity Central Funds.
E Amount does not include the portfolio activity of any underlying Fidelity Central Funds.
F Investment income per share reflects a large, non-recurring dividend which amounted to $.06 per share. Excluding this non-recurring dividend, the ratio of net investment income (loss) to average net assets would have been .05%.
G Expense ratios reflect operating expenses of the class. Expenses before reductions do not reflect amounts reimbursed by the investment adviser or reductions from brokerage service arrangements or reductions from other expense offset arrangements and do not represent the amount paid by the class during periods when reimbursements or reductions occur. Expenses net of fee waivers reflect expenses after reimbursement by the investment adviser but prior to reductions from brokerage service arrangements or other expense offset arrangements. Expenses net of all reductions represent the net expenses paid by the class.
H Amount represents less than $.005 per share.
I Total distributions of $.07 per share is comprised of distributions from net investment income of $.058 and distributions from net realized gain of $.015 per share.
See accompanying notes which are an integral part of the financial statements.
Annual Report
Financial Highlights - Fidelity International Small Cap Opportunities Fund
Years ended October 31, | 2015 | 2014 | 2013 | 2012 | 2011 |
Selected Per-Share Data | | | | | |
Net asset value, beginning of period | $ 13.80 | $ 13.82 | $ 10.88 | $ 9.85 | $ 9.92 |
Income from Investment Operations | | | | | |
Net investment income (loss) B | .10 | .09 | .10 | .11 | .17E |
Net realized and unrealized gain (loss) | 1.12 | .06 | 2.95 | 1.07 | (.06) |
Total from investment operations | 1.22 | .15 | 3.05 | 1.18 | .11 |
Distributions from net investment income | (.09) | (.09) | (.10) | (.14) | (.14) |
Distributions from net realized gain | (.02) | (.08) | (.01) | (.01) | (.04) |
Total distributions | (.11) | (.17) | (.11) | (.15) | (.18) |
Redemption fees added to paid in capitalB, G | - | - | - | - | - |
Net asset value, end of period | $ 14.91 | $ 13.80 | $ 13.82 | $ 10.88 | $ 9.85 |
Total ReturnA | 8.92% | 1.11% | 28.24% | 12.21% | 1.10% |
Ratios to Average Net AssetsC, F | | | | | |
Expenses before reductions | 1.23% | 1.30% | 1.39% | 1.47% | 1.08% |
Expenses net of fee waivers, if any | 1.22% | 1.30% | 1.39% | 1.40% | 1.08% |
Expenses net of all reductions | 1.22% | 1.30% | 1.38% | 1.39% | 1.06% |
Net investment income (loss) | .68% | .65% | .85% | 1.10% | 1.69%E |
Supplemental Data | | | | | |
Net assets, end of period (000 omitted) | $ 762,563 | $ 584,253 | $ 518,121 | $ 334,918 | $ 328,262 |
Portfolio turnover rateD | 21% | 18% | 31% | 28% | 24% |
A Total returns would have been lower if certain expenses had not been reduced during the applicable periods shown.
B Calculated based on average shares outstanding during the period.
C Fees and expenses of any underlying Fidelity Central Funds are not included in the Fund's expense ratio. The Fund indirectly bears its proportionate share of the expenses of any underlying Fidelity Central Funds.
D Amount does not include the portfolio activity of any underlying Fidelity Central Funds.
E Investment income per share reflects a large, non-recurring dividend which amounted to $.07 per share. Excluding this non-recurring dividend, the ratio of net investment income (loss) to average net assets would have been 1.06%.
F Expense ratios reflect operating expenses of the class. Expenses before reductions do not reflect amounts reimbursed by the investment adviser or reductions from brokerage service arrangements or reductions from other expense offset arrangements and do not represent the amount paid by the class during periods when reimbursements or reductions occur. Expenses net of fee waivers reflect expenses after reimbursement by the investment adviser but prior to reductions from brokerage service arrangements or other expense offset arrangements. Expenses net of all reductions represent the net expenses paid by the class.
G Amount represents less than $.005 per share.
See accompanying notes which are an integral part of the financial statements.
Annual Report
Financial Highlights - Fidelity International Small Cap Opportunities Fund Class I
Years ended October 31, | 2015 | 2014 | 2013 | 2012 | 2011 |
Selected Per-Share Data | | | | | |
Net asset value, beginning of period | $ 13.81 | $ 13.83 | $ 10.90 | $ 9.86 | $ 9.93 |
Income from Investment Operations | | | | | |
Net investment income (loss) B | .10 | .08 | .11 | .11 | .18E |
Net realized and unrealized gain (loss) | 1.13 | .07 | 2.93 | 1.08 | (.06) |
Total from investment operations | 1.23 | .15 | 3.04 | 1.19 | .12 |
Distributions from net investment income | (.11) | (.09) | (.10) | (.14) | (.15) |
Distributions from net realized gain | (.02) | (.08) | (.01) | (.01) | (.04) |
Total distributions | (.13) | (.17) | (.11) | (.15) | (.19) |
Redemption fees added to paid in capitalB, G | - | - | - | - | - |
Net asset value, end of period | $ 14.91 | $ 13.81 | $ 13.83 | $ 10.90 | $ 9.86 |
Total Return A | 8.98% | 1.11% | 28.11% | 12.32% | 1.13% |
Ratios to Average Net AssetsC, F | | | | | |
Expenses before reductions | 1.19% | 1.36% | 1.38% | 1.44% | 1.03% |
Expenses net of fee waivers, if any | 1.19% | 1.36% | 1.37% | 1.40% | 1.03% |
Expenses net of all reductions | 1.18% | 1.36% | 1.37% | 1.39% | 1.02% |
Net investment income (loss) | .71% | .60% | .87% | 1.10% | 1.74%E |
Supplemental Data | | | | | |
Net assets, end of period (000 omitted) | $ 120,723 | $ 29,822 | $ 5,670 | $ 4,591 | $ 1,395 |
Portfolio turnover rateD | 21% | 18% | 31% | 28% | 24% |
A Total returns would have been lower if certain expenses had not been reduced during the applicable periods shown.
B Calculated based on average shares outstanding during the period.
C Fees and expenses of any underlying Fidelity Central Funds are not included in the Fund's expense ratio. The Fund indirectly bears its proportionate share of the expenses of any underlying Fidelity Central Funds.
D Amount does not include the portfolio activity of any underlying Fidelity Central Funds.
E Investment income per share reflects a large, non-recurring dividend which amounted to $.07 per share. Excluding this non-recurring dividend, the ratio of net investment income (loss) to average net assets would have been 1.11%.
F Expense ratios reflect operating expenses of the class. Expenses before reductions do not reflect amounts reimbursed by the investment adviser or reductions from brokerage service arrangements or reductions from other expense offset arrangements and do not represent the amount paid by the class during periods when reimbursements or reductions occur. Expenses net of fee waivers reflect expenses after reimbursement by the investment adviser but prior to reductions from brokerage service arrangements or other expense offset arrangements. Expenses net of all reductions represent the net expenses paid by the class.
G Amount represents less than $.005 per share.
See accompanying notes which are an integral part of the financial statements.
Annual Report
For the period ended October 31, 2015
1. Organization.
Fidelity International Small Cap Opportunities Fund (the Fund) is a fund of Fidelity Investment Trust (the Trust) and is authorized to issue an unlimited number of shares. The Trust is registered under the Investment Company Act of 1940, as amended (the 1940 Act), as an open-end management investment company organized as a Massachusetts business trust. The Fund offers Class A, Class T, Class C, International Small Cap Opportunities and Class I (formerly Institutional Class) shares, each of which, along with Class B shares, has equal rights as to assets and voting privileges. Class B shares are closed to new accounts and additional purchases, except for exchanges and reinvestments. Each class has exclusive voting rights with respect to matters that affect that class. Class B shares will automatically convert to Class A shares after a holding period of seven years from the initial date of purchase.
2. Investments in Fidelity Central Funds.
The Fund invests in Fidelity Central Funds, which are open-end investment companies generally available only to other investment companies and accounts managed by the investment adviser and its affiliates. The Fund's Schedule of Investments lists each of the Fidelity Central Funds held as of period end, if any, as an investment of the Fund, but does not include the underlying holdings of each Fidelity Central Fund. As an Investing Fund, the Fund indirectly bears its proportionate share of the expenses of the underlying Fidelity Central Funds.
The Money Market Central Funds seek preservation of capital and current income and are managed by Fidelity Investments Money Management, Inc. (FIMM), an affiliate of the investment adviser. Annualized expenses of the Money Market Central Funds as of their most recent shareholder report date are less than .005%.
A complete unaudited list of holdings for each Fidelity Central Fund is available upon request or at the Securities and Exchange Commission (the SEC) website at www.sec.gov. In addition, the financial statements of the Fidelity Central Funds, which are not covered by the Fund's Report of Independent Registered Public Accounting Firm, are available on the SEC website or upon request.
3. Significant Accounting Policies.
The financial statements have been prepared in conformity with accounting principles generally accepted in the United States of America (GAAP), which require management to make certain estimates and assumptions at the date of the financial statements. Actual results could differ from those estimates. Subsequent events, if any, through the date that the financial statements were issued have been evaluated in the preparation of
Annual Report
Notes to Financial Statements - continued
3. Significant Accounting Policies - continued
the financial statements. The following summarizes the significant accounting policies of the Fund:
Investment Valuation. Investments are valued as of 4:00 p.m. Eastern time on the last calendar day of the period. The Board of Trustees (the Board) has delegated the day to day responsibility for the valuation of the Fund's investments to the Fidelity Management & Research Company (FMR) Fair Value Committee (the Committee). In accordance with valuation policies and procedures approved by the Board, the Fund attempts to obtain prices from one or more third party pricing vendors or brokers to value its investments. When current market prices, quotations or currency exchange rates are not readily available or reliable, investments will be fair valued in good faith by the Committee, in accordance with procedures adopted by the Board. Factors used in determining fair value vary by investment type and may include market or investment specific events. The frequency with which these procedures are used cannot be predicted and they may be utilized to a significant extent. The Committee oversees the Fund's valuation policies and procedures and reports to the Board on the Committee's activities and fair value determinations. The Board monitors the appropriateness of the procedures used in valuing the Fund's investments and ratifies the fair value determinations of the Committee.
The Fund categorizes the inputs to valuation techniques used to value its investments into a disclosure hierarchy consisting of three levels as shown below:
Level 1 - quoted prices in active markets for identical investments
Level 2 - other significant observable inputs (including quoted prices for similar investments, interest rates, prepayment speeds, etc.)
Level 3 - unobservable inputs (including the Fund's own assumptions based on the best information available)
Valuation techniques used to value the Fund's investments by major category are as follows:
Equity securities, including restricted securities, for which market quotations are readily available, are valued at the last reported sale price or official closing price as reported by a third party pricing vendor on the primary market or exchange on which they are traded and are categorized as Level 1 in the hierarchy. In the event there were no sales during the day or closing prices are not available, securities are valued at the last quoted bid price or may be valued using the last available price and are generally categorized as Level 2 in the hierarchy. For foreign equity securities, when market or security specific events arise, comparisons to the valuation of American Depositary Receipts (ADRs),
Annual Report
3. Significant Accounting Policies - continued
Investment Valuation - continued
futures contracts, Exchange-Traded Funds (ETFs) and certain indexes as well as quoted prices for similar securities may be used and would be categorized as Level 2 in the hierarchy. Utilizing these techniques may result in transfers between Level 1 and Level 2. For equity securities, including restricted securities, where observable inputs are limited, assumptions about market activity and risk are used and these securities may be categorized as Level 3 in the hierarchy.
Investments in open-end mutual funds, including the Fidelity Central Funds, are valued at their closing net asset value (NAV) each business day and are categorized as Level 1 in the hierarchy.
Changes in valuation techniques may result in transfers in or out of an assigned level within the disclosure hierarchy. The aggregate value of investments by input level as of October 31, 2015 is included at the end of the Fund's Schedule of Investments.
Foreign Currency. The Fund may use foreign currency contracts to facilitate transactions in foreign-denominated securities. Gains and losses from these transactions may arise from changes in the value of the foreign currency or if the counterparties do not perform under the contracts' terms.
Foreign-denominated assets, including investment securities, and liabilities are translated into U.S. dollars at the exchange rates at period end. Purchases and sales of investment securities, income and dividends received and expenses denominated in foreign currencies are translated into U.S. dollars at the exchange rate in effect on the transaction date.
The effects of exchange rate fluctuations on investments are included with the net realized and unrealized gain (loss) on investment securities. Other foreign currency transactions resulting in realized and unrealized gain (loss) are disclosed separately.
Investment Transactions and Income. For financial reporting purposes, the Fund's investment holdings and NAV include trades executed through the end of the last business day of the period. The NAV per share for processing shareholder transactions is calculated as of the close of business of the New York Stock Exchange (NYSE), normally 4:00 p.m. Eastern time and includes trades executed through the end of the prior business day. Gains and losses on securities sold are determined on the basis of identified cost. Dividend income is recorded on the ex-dividend date, except for certain dividends from foreign securities where the ex-dividend date may have passed, which are recorded as soon as the Fund is informed of the ex-dividend date. Non-cash dividends included in dividend income, if any, are recorded at the fair market value of the securities received.
Annual Report
Notes to Financial Statements - continued
3. Significant Accounting Policies - continued
Investment Transactions and Income - continued
Income and capital gain distributions from Fidelity Central Funds, if any, are recorded on the ex-dividend date. Distributions received on securities that represent a return of capital or capital gain are recorded as a reduction of cost of investments and/or as a realized gain. Subsequent to ex-dividend date the Fund determines the components of these distributions, based upon receipt of tax filings or other correspondence relating to the underlying investment. Interest income is accrued as earned and includes coupon interest and amortization of premium and accretion of discount on debt securities as applicable. Investment income is recorded net of foreign taxes withheld where recovery of such taxes is uncertain.
Class Allocations and Expenses. Investment income, realized and unrealized capital gains and losses, common expenses of the Fund, and certain fund-level expense reductions, if any, are allocated daily on a pro-rata basis to each class based on the relative net assets of each class to the total net assets of the Fund. Each class differs with respect to transfer agent and distribution and service plan fees incurred. Certain expense reductions may also differ by class. For the reporting period, the allocated portion of income and expenses to each class as a percent of its average net assets may vary due to the timing of recording these transactions in relation to fluctuating net assets of the classes. Expenses directly attributable to a fund are charged to that fund. Expenses attributable to more than one fund are allocated among the respective funds on the basis of relative net assets or other appropriate methods. Expense estimates are accrued in the period to which they relate and adjustments are made when actual amounts are known.
Income Tax Information and Distributions to Shareholders. Each year, the Fund intends to qualify as a regulated investment company under Subchapter M of the Internal Revenue Code, including distributing substantially all of its taxable income and realized gains. As a result, no provision for U.S. Federal income taxes is required. As of October 31, 2015, the Fund did not have any unrecognized tax benefits in the financial statements; nor is the Fund aware of any tax positions for which it is reasonably possible that the total amounts of unrecognized tax benefits will significantly change in the next twelve months. The Fund files a U.S. federal tax return, in addition to state and local tax returns as required. The Fund's federal income tax returns are subject to examination by the Internal Revenue Service (IRS) for a period of three fiscal years after they are filed. State and local tax returns may be subject to examination for an additional fiscal year depending on the jurisdiction. Foreign taxes are provided for based on the Fund's understanding of the tax rules and rates that exist in the foreign markets in which it invests.
Distributions are declared and recorded on the ex-dividend date. Income dividends and capital gain distributions are declared separately for each class. Income and capital gain
Annual Report
3. Significant Accounting Policies - continued
Income Tax Information and Distributions to Shareholders - continued
distributions are determined in accordance with income tax regulations, which may differ from GAAP.
Capital accounts within the financial statements are adjusted for permanent book-tax differences. These adjustments have no impact on net assets or the results of operations. Capital accounts are not adjusted for temporary book-tax differences which will reverse in a subsequent period.
Book-tax differences are primarily due to foreign currency transactions, partnerships, passive foreign investment companies (PFIC), capital loss carryforwards and losses deferred due to wash sales.
The federal tax cost of investment securities and unrealized appreciation (depreciation) as of period end were as follows:
Gross unrealized appreciation | $ 170,087,781 |
Gross unrealized depreciation | (49,282,874) |
Net unrealized appreciation (depreciation) on securities | $ 120,804,907 |
Tax Cost | $ 843,046,188 |
The tax-based components of distributable earnings as of period end were as follows:
Undistributed ordinary income | $ 9,403,138 |
Capital loss carryforward | $ (252,792,060) |
Net unrealized appreciation (depreciation) on securities and other investments | $ 120,771,140 |
Capital loss carryforwards are only available to offset future capital gains of the Fund to the extent provided by regulations and may be limited. Under the Regulated Investment Company Modernization Act of 2010 (the Act), the Fund is permitted to carry forward capital losses incurred in taxable years beginning after December 22, 2010 for an unlimited period and such capital losses are required to be used prior to any losses that expire. The capital loss carryforward information presented below, including any applicable limitation, is estimated as of fiscal period end and is subject to adjustment.
Fiscal year of expiration | |
2017 | $ (252,792,060) |
The tax character of distributions paid was as follows:
| October 31, 2015 | October 31, 2014 |
Ordinary Income | $ 4,931,967 | $ 6,814,221 |
Annual Report
Notes to Financial Statements - continued
3. Significant Accounting Policies - continued
Short-Term Trading (Redemption) Fees. Shares held by investors in the Fund less than 90 days may have been subject to a redemption fee equal to 2.00% of the NAV of shares redeemed. All redemption fees, which reduce the proceeds of the shareholder redemption, are retained by the Fund and accounted for as an addition to paid in capital.
4. Purchases and Sales of Investments.
Purchases and sales of securities, other than short-term securities, aggregated $339,740,366 and $147,999,305, respectively.
5. Fees and Other Transactions with Affiliates.
Management Fee. Fidelity Management & Research Company (the investment adviser) and its affiliates provide the Fund with investment management related services for which the Fund pays a monthly management fee. The management fee is the sum of an individual fund fee rate that is based on an annual rate of .60% of the Fund's average net assets and an annualized group fee rate that averaged .25% during the period. The group fee rate is based upon the average net assets of all the mutual funds advised by the investment adviser, including any mutual funds previously advised by the investment adviser that are currently advised by Fidelity SelectCo, LLC, an affiliate of the investment adviser. The group fee rate decreases as assets under management increase and increases as assets under management decrease. In addition, the management fee is subject to a performance adjustment (up to a maximum of ± .20% of the Fund's average net assets over a 36 month performance period). The upward or downward adjustment to the management fee is based on the relative investment performance of International Small Cap Opportunities as compared to its benchmark index, the MSCI EAFE Small Cap Index, over the same 36 month performance period. For the reporting period, the total annual management fee rate, including the performance adjustment, was .90% of the Fund's average net assets. The performance adjustment included in the management fee rate may be higher or lower than the maximum performance adjustment rate due to the difference between the average net assets for the reporting and performance periods.
Distribution and Service Plan Fees. In accordance with Rule 12b-1 of the 1940 Act, the Fund has adopted separate Distribution and Service Plans for each class of shares. Certain classes pay Fidelity Distributors Corporation (FDC), an affiliate of the investment adviser, separate Distribution and Service Fees, each of which is based on an annual percentage of each class' average net assets. In addition, FDC may pay financial intermediaries for selling shares of the Fund and providing shareholder support services.
Annual Report
5. Fees and Other Transactions with Affiliates - continued
Distribution and Service Plan Fees - continued
For the period, the Distribution and Service Fee rates, total fees and amounts retained by FDC were as follows:
| Distribution
Fee | Service
Fee | Total Fees | Retained
by FDC |
Class A | -% | .25% | $ 72,286 | $ 920 |
Class T | .25% | .25% | 53,206 | - |
Class B | .75% | .25% | 6,808 | 5,112 |
Class C | .75% | .25% | 115,967 | 20,094 |
| | | $ 248,267 | $ 26,126 |
Sales Load. FDC may receive a front-end sales charge of up to 5.75% for selling Class A shares and 3.50% for selling Class T shares, some of which is paid to financial intermediaries for selling shares of the Fund. Depending on the holding period, FDC may receive contingent deferred sales charges levied on Class A, Class T, Class B, and Class C redemptions. The deferred sales charges range from 5.00% to 1.00% for Class B shares, 1.00% for Class C shares, 1.00% for certain purchases of Class A shares and .25% for certain purchases of Class T shares.
For the period, sales charge amounts retained by FDC were as follows:
| Retained
by FDC |
Class A | $ 24,104 |
Class T | 3,744 |
Class BA | 149 |
Class CA | 3,738 |
| $ 31,735 |
A When Class B and Class C shares are initially sold, FDC pays commissions from its own resources to financial intermediaries through which the sales are made.
Transfer Agent Fees. Fidelity Investments Institutional Operations Company, Inc., (FIIOC), an affiliate of the investment adviser, is the transfer, dividend disbursing and shareholder servicing agent for each class of the Fund. FIIOC receives account fees and asset-based fees that vary according to the account size and type of account of the shareholders of the respective classes of the Fund. FIIOC pays for typesetting, printing and mailing of shareholder reports, except proxy statements.
Annual Report
Notes to Financial Statements - continued
5. Fees and Other Transactions with Affiliates - continued
Transfer Agent Fees - continued
For the period, transfer agent fees for each class were as follows:
| Amount | % of
Class-Level Average
Net Assets |
Class A | $ 78,679 | .27 |
Class T | 32,323 | .30 |
Class B | 2,026 | .30 |
Class C | 32,269 | .28 |
International Small Cap Opportunities | 1,405,016 | .23 |
Class I | 153,878 | .19 |
| $ 1,704,191 | |
Accounting and Security Lending Fees. Fidelity Service Company, Inc. (FSC), an affiliate of the investment adviser, maintains the Fund's accounting records. The accounting fee is based on the level of average net assets for each month. Under a separate contract, FSC administers the security lending program. The security lending fee is based on the number and duration of lending transactions.
Brokerage Commissions. The Fund placed a portion of its portfolio transactions with brokerage firms which are affiliates of the investment adviser. Brokerage commissions are included in net realized gain (loss) and change in net unrealized appreciation (depreciation) in the Statement of Operations. The commissions paid to these affiliated firms were $318 for the period.
Other. During the period, the investment adviser reimbursed the Fund for certain losses in the amount of $8,890.
6. Committed Line of Credit.
The Fund participates with other funds managed by the investment adviser or an affiliate in a $4.25 billion credit facility (the "line of credit") to be utilized for temporary or emergency purposes to fund shareholder redemptions or for other short-term liquidity purposes. The Fund has agreed to pay commitment fees on its pro-rata portion of the line of credit, which amounted to $1,034 and is reflected in Miscellaneous expenses on the Statement of Operations. During the period, the Fund did not borrow on this line of credit.
7. Security Lending.
The Fund lends portfolio securities through a lending agent from time to time in order to earn additional income. For equity securities, a lending agent is used and may loan securities to certain qualified borrowers, including Fidelity Capital Markets (FCM), a
Annual Report
7. Security Lending - continued
broker-dealer affiliated with the Fund. On the settlement date of the loan, the Fund receives collateral (in the form of U.S. Treasury obligations, letters of credit and/or cash) against the loaned securities and maintains collateral in an amount not less than 100% of the market value of the loaned securities during the period of the loan. The market value of the loaned securities is determined at the close of business of the Fund and any additional required collateral is delivered to the Fund on the next business day. The Fund or borrower may terminate the loan at any time, and if the borrower defaults on its obligation to return the securities loaned because of insolvency or other reasons, the Fund may apply collateral received from the borrower against the obligation. The Fund may experience delays and costs in recovering the securities loaned. Any cash collateral received is invested in the Fidelity Securities Lending Cash Central Fund. The value of loaned securities and cash collateral at period end are disclosed on the Fund's Statement of Assets and Liabilities. Security lending income represents the income earned on investing cash collateral, less rebates paid to borrowers and any lending agent fees associated with the loan, plus any premium payments received for lending certain types of securities. Security lending income is presented in the Statement of Operations as a component of income from Fidelity Central Funds. Total security lending income during the period amounted to $43,254. During the period, there were no securities loaned to FCM.
8. Expense Reductions.
Commissions paid to certain brokers with whom the investment adviser, or its affiliates, places trades on behalf of the Fund include an amount in addition to trade execution, which may be rebated back to the Fund to offset certain expenses. This amount totaled $29,791 for the period.
In addition, during the period the investment adviser reimbursed and/or waived a portion of fund-level operating expenses in the amount of $3,109 and a portion of class-level operating expenses as follows:
| Amount |
Class A | $ 113 |
Class T | 25 |
Class B | 1 |
Class C | 24 |
International Small Cap Opportunities | 12,565 |
Class I | 454 |
| $ 13,182 |
Annual Report
Notes to Financial Statements - continued
9. Distributions to Shareholders.
Distributions to shareholders of each class were as follows:
Years ended October 31, | 2015 | 2014 |
From net investment income | | |
Class A | $ 91,925 | $ 88,584 |
Class T | 4,261 | 17,038 |
International Small Cap Opportunities | 3,599,410 | 3,435,414 |
Class I | 286,715 | 39,565 |
Total | $ 3,982,311 | $ 3,580,601 |
From net realized gain | | |
Class A | $ 38,609 | $ 127,238 |
Class T | 14,913 | 56,084 |
Class C | - | 33,933 |
International Small Cap Opportunities | 839,863 | 2,982,391 |
Class I | 56,271 | 33,974 |
Total | $ 949,656 | $ 3,233,620 |
10. Share Transactions.
Share transactions for each class were as follows and may contain automatic conversions between classes or exchanges between funds:
| Shares | Dollars |
Years ended October 31, | 2015 | 2014 | 2015 | 2014 |
Class A | | | | |
Shares sold | 1,605,762 | 589,478 | $ 23,674,805 | $ 8,266,636 |
Reinvestment of distributions | 9,185 | 14,226 | 124,545 | 191,200 |
Shares redeemed | (582,997) | (381,134) | (8,244,833) | (5,353,937) |
Net increase (decrease) | 1,031,950 | 222,570 | $ 15,554,517 | $ 3,103,899 |
Class T | | | | |
Shares sold | 309,765 | 159,216 | $ 4,543,322 | $ 2,266,530 |
Reinvestment of distributions | 1,404 | 5,309 | 18,926 | 70,882 |
Shares redeemed | (134,926) | (142,062) | (1,907,198) | (1,989,964) |
Net increase (decrease) | 176,243 | 22,463 | $ 2,655,050 | $ 347,448 |
Class B | | | | |
Shares sold | 9,791 | 1,461 | $ 136,845 | $ 20,212 |
Shares redeemed | (23,615) | (51,497) | (329,326) | (706,187) |
Net increase (decrease) | (13,824) | (50,036) | $ (192,481) | $ (685,975) |
Class C | | | | |
Shares sold | 838,785 | 200,445 | $ 12,019,463 | $ 2,745,030 |
Reinvestment of distributions | - | 2,336 | - | 30,621 |
Shares redeemed | (258,762) | (172,604) | (3,578,649) | (2,374,401) |
Net increase (decrease) | 580,023 | 30,177 | $ 8,440,814 | $ 401,250 |
Annual Report
10. Share Transactions - continued
| Shares | Dollars |
Years ended October 31, | 2015 | 2014 | 2015 | 2014 |
International Small Cap Opportunities | | | | |
Shares sold | 18,903,102 | 13,421,171 | $ 282,906,392 | $ 191,269,160 |
Reinvestment of distributions | 239,997 | 360,554 | 3,280,752 | 4,881,895 |
Shares redeemed | (10,354,861) | (8,930,544) | (146,998,081) | (127,222,877) |
Net increase (decrease) | 8,788,238 | 4,851,181 | $ 139,189,063 | $ 68,928,178 |
Class I | | | | |
Shares sold | 7,108,830 | 2,469,158 | $ 102,023,907 | $ 34,766,175 |
Reinvestment of distributions | 23,468 | 4,980 | 320,812 | 67,530 |
Shares redeemed | (1,195,608) | (724,026) | (17,368,101) | (9,726,800) |
Net increase (decrease) | 5,936,690 | 1,750,112 | $ 84,976,618 | $ 25,106,905 |
11. Other.
The Fund's organizational documents provide former and current trustees and officers with a limited indemnification against liabilities arising in connection with the performance of their duties to the Fund. In the normal course of business, the Fund may also enter into contracts that provide general indemnifications. The Fund's maximum exposure under these arrangements is unknown as this would be dependent on future claims that may be made against the Fund. The risk of material loss from such claims is considered remote.
Annual Report
To the Trustees of Fidelity Investment Trust and Shareholders of Fidelity International Small Cap Opportunities Fund:
We have audited the accompanying statement of assets and liabilities of Fidelity International Small Cap Opportunities Fund (the Fund), a fund of Fidelity Investment Trust, including the schedule of investments, as of October 31, 2015, and the related statement of operations for the year then ended, the statement of changes in net assets for each of the two years in the period then ended, and the financial highlights for each of the five years in the period then ended. These financial statements and financial highlights are the responsibility of the Fund's management. Our responsibility is to express an opinion on these financial statements and financial highlights based on our audits.
We conducted our audits in accordance with the standards of the Public Company Accounting Oversight Board (United States). Those standards require that we plan and perform the audit to obtain reasonable assurance about whether the financial statements and financial highlights are free of material misstatement. The Fund is not required to have, nor were we engaged to perform, an audit of its internal control over financial reporting. Our audits included consideration of internal control over financial reporting as a basis for designing audit procedures that are appropriate in the circumstances, but not for the purpose of expressing an opinion on the effectiveness of the Fund's internal control over financial reporting. Accordingly, we express no such opinion. An audit also includes examining, on a test basis, evidence supporting the amounts and disclosures in the financial statements, assessing the accounting principles used and significant estimates made by management, as well as evaluating the overall financial statement presentation. Our procedures included confirmation of securities owned as of October 31, 2015, by correspondence with the custodians and brokers; when replies were not received from brokers, we performed other auditing procedures. We believe that our audits provide a reasonable basis for our opinion.
In our opinion, such financial statements and financial highlights referred to above present fairly, in all material respects, the financial position of Fidelity International Small Cap Opportunities Fund as of October 31, 2015, the results of its operations for the year then ended, the changes in its net assets for each of the two years in the period then ended, and the financial highlights for each of the five years in the period then ended, in conformity with accounting principles generally accepted in the United States of America.
DELOITTE & TOUCHE LLP
Boston, Massachusetts
December 16, 2015
Annual Report
The Trustees, Member of the Advisory Board, and officers of the trust and fund, as applicable, are listed below. The Board of Trustees governs the fund and is responsible for protecting the interests of shareholders. The Trustees are experienced executives who meet periodically throughout the year to oversee the fund's activities, review contractual arrangements with companies that provide services to the fund, oversee management of the risks associated with such activities and contractual arrangements, and review the fund's performance. Each of the Trustees oversees 170 funds.
The Trustees hold office without limit in time except that (a) any Trustee may resign; (b) any Trustee may be removed by written instrument, signed by at least two-thirds of the number of Trustees prior to such removal; (c) any Trustee who requests to be retired or who has become incapacitated by illness or injury may be retired by written instrument signed by a majority of the other Trustees; and (d) any Trustee may be removed at any special meeting of shareholders by a two-thirds vote of the outstanding voting securities of the trust. Each Trustee who is not an interested person (as defined in the 1940 Act) of the trust and the fund (Independent Trustee), shall retire not later than the last day of the calendar year in which his or her 75th birthday occurs. The Independent Trustees may waive this mandatory retirement age policy with respect to individual Trustees. The officers and Advisory Board Member hold office without limit in time, except that any officer and Advisory Board Member may resign or may be removed by a vote of a majority of the Trustees at any regular meeting or any special meeting of the Trustees. Except as indicated, each individual has held the office shown or other offices in the same company for the past five years.
Experience, Skills, Attributes, and Qualifications of the Fund's Trustees. The Governance and Nominating Committee has adopted a statement of policy that describes the experience, qualifications, attributes, and skills that are necessary and desirable for potential Independent Trustee candidates (Statement of Policy). The Board believes that each Trustee satisfied at the time he or she was initially elected or appointed a Trustee, and continues to satisfy, the standards contemplated by the Statement of Policy. The Governance and Nominating Committee also engages professional search firms to help identify potential Independent Trustee candidates who have the experience, qualifications, attributes, and skills consistent with the Statement of Policy. From time to time, additional criteria based on the composition and skills of the current Independent Trustees, as well as experience or skills that may be appropriate in light of future changes to board composition, business conditions, and regulatory or other developments, have also been considered by the professional search firms and the Governance and Nominating Committee. In addition, the Board takes into account the Trustees' commitment and participation in Board and committee meetings, as well as their leadership of standing and ad hoc committees throughout their tenure.
In determining that a particular Trustee was and continues to be qualified to serve as a Trustee, the Board has considered a variety of criteria, none of which, in isolation, was controlling. The Board believes that, collectively, the Trustees have balanced and diverse experience, qualifications, attributes, and skills, which allow the Board to operate effectively in governing the fund and protecting the interests of shareholders. Information about the specific experience, skills, attributes, and qualifications of each Trustee, which in each case led to the Board's conclusion that the Trustee should serve (or continue to serve) as a trustee of the fund, is provided below.
Annual Report
Board Structure and Oversight Function. James C. Curvey is an interested person (as defined in the 1940 Act) and currently serves as Chairman. The Trustees have determined that an interested Chairman is appropriate and benefits shareholders because an interested Chairman has a personal and professional stake in the quality and continuity of services provided to the fund. Independent Trustees exercise their informed business judgment to appoint an individual of their choosing to serve as Chairman, regardless of whether the Trustee happens to be independent or a member of management. The Independent Trustees have determined that they can act independently and effectively without having an Independent Trustee serve as Chairman and that a key structural component for assuring that they are in a position to do so is for the Independent Trustees to constitute a substantial majority for the Board. The Independent Trustees also regularly meet in executive session. Ned C. Lautenbach serves as Chairman of the Independent Trustees and as such (i) acts as a liaison between the Independent Trustees and management with respect to matters important to the Independent Trustees and (ii) with management prepares agendas for Board meetings.
Fidelity funds are overseen by different Boards of Trustees. The fund's Board oversees Fidelity's high income and certain equity funds, and other Boards oversee Fidelity's investment-grade bond, money market, asset allocation, and sector funds. The asset allocation funds may invest in Fidelity funds overseen by the fund's Board. The use of separate Boards, each with its own committee structure, allows the Trustees of each group of Fidelity funds to focus on the unique issues of the funds they oversee, including common research, investment, and operational issues. On occasion, the separate Boards establish joint committees to address issues of overlapping consequences for the Fidelity funds overseen by each Board.
The Trustees operate using a system of committees to facilitate the timely and efficient consideration of all matters of importance to the Trustees, the fund, and fund shareholders and to facilitate compliance with legal and regulatory requirements and oversight of the fund's activities and associated risks. The Board, acting through its committees, has charged FMR and its affiliates with (i) identifying events or circumstances the occurrence of which could have demonstrably adverse effects on the fund's business and/or reputation; (ii) implementing processes and controls to lessen the possibility that such events or circumstances occur or to mitigate the effects of such events or circumstances if they do occur; and (iii) creating and maintaining a system designed to evaluate continuously business and market conditions in order to facilitate the identification and implementation processes described in (i) and (ii) above. Because the day-to-day operations and activities of the fund are carried out by or through FMR, its affiliates and other service providers, the fund's exposure to risks is mitigated but not eliminated by the processes overseen by the Trustees. While each of the Board's committees has responsibility for overseeing different aspects of the fund's activities, oversight is exercised primarily through the Operations, Audit, and Compliance Committees. In addition, the Independent Trustees have worked with FMR to enhance the Board's oversight of investment and financial risks, legal and regulatory risks, technology risks, and operational risks, including the development of additional risk reporting to the Board. For example, a working group comprised of Independent Trustees and FMR has worked and continues to work to review the Fidelity funds' valuation-related activities, reporting and risk management. Appropriate personnel, including but not limited to the fund's Chief Compliance Officer (CCO), FMR's internal auditor, the independent accountants, the fund's Treasurer and portfolio management personnel, make periodic reports to the Board's committees, as appropriate, including an annual review of Fidelity's risk management program for the Fidelity funds. The responsibilities of each standing committee, including their oversight responsibilities, are described further under "Standing Committees of the Fund's Trustees."
Annual Report
Trustees and Officers - continued
The fund's Statement of Additional Information (SAI) includes more information about the Trustees. To request a free copy, call Fidelity at 1-800-544-8544.
Interested Trustees*:
Correspondence intended for each Trustee who is an interested person may be sent to Fidelity Investments, 245 Summer Street, Boston, Massachusetts 02210.
Name, Year of Birth; Principal Occupations and Other Relevant Experience+ |
James C. Curvey (1935) |
Year of Election or Appointment: 2007 Trustee Chairman of the Board of Trustees |
| Mr. Curvey also serves as Trustee of other Fidelity funds. Mr. Curvey is a Director of Fidelity Research & Analysis Co. (investment adviser firm, 2009-present), and Vice Chairman (2007-present) and Director of FMR LLC (diversified financial services company). In addition, Mr. Curvey serves as an Overseer for the Boston Symphony Orchestra and a member of the board of Artis-Naples, Naples, Florida, and as a Trustee for Brewster Academy, Wolfeboro, New Hampshire. Previously, Mr. Curvey served as a Director of Fidelity Investments Money Management, Inc. (investment adviser firm, 2009-2014) and a Director of FMR and FMR Co., Inc. (investment adviser firms, 2007-2014). |
Charles S. Morrison (1960) |
Year of Election or Appointment: 2014 Trustee |
| Mr. Morrison also serves as Trustee of other funds. He serves as a Director of Fidelity Investments Money Management, Inc. (FIMM) (investment adviser firm, 2014-present), Director of Fidelity SelectCo, LLC (investment adviser firm, 2014-present), President, Asset Management (2014-present), and is an employee of Fidelity Investments. Previously, Mr. Morrison served as Vice President of Fidelity's Fixed Income and Asset Allocation Funds (2012-2014), President, Fixed Income (2011-2014), Vice President of Fidelity's Money Market Funds (2005-2009), President, Money Market Group Leader of FMR (investment adviser firm, 2009), and Senior Vice President, Money Market Group of FMR (2004-2009). Mr. Morrison also served as Vice President of Fidelity's Bond Funds (2002-2005), certain Balanced Funds (2002-2005), and certain Asset Allocation Funds (2002-2007), and as Senior Vice President (2002-2005) of Fidelity's Bond Division. |
* Trustees have been determined to be "Interested Trustees" by virtue of, among other things, their affiliation with the trust or various entities under common control with FMR.
+ The information above includes each Trustee's principal occupation during the last five years and other information relating to the experience, attributes, and skills relevant to each Trustee's qualifications to serve as a Trustee, which led to the conclusion that each Trustee should serve as a Trustee for the fund.
Annual Report
Trustees and Officers - continued
Independent Trustees:
Correspondence intended for each Independent Trustee (that is, the Trustees other than the Interested Trustees) may be sent to Fidelity Investments, P.O. Box 55235, Boston, Massachusetts 02205-5235.
Name, Year of Birth; Principal Occupations and Other Relevant Experience+ |
Dennis J. Dirks (1948) |
Year of Election or Appointment: 2005 Trustee |
| Mr. Dirks also serves as Trustee of other Fidelity funds. Prior to his retirement in May 2003, Mr. Dirks was Chief Operating Officer and a member of the Board of The Depository Trust & Clearing Corporation (DTCC). He also served as President, Chief Operating Officer, and Board member of The Depository Trust Company (DTC) and President and Board member of the National Securities Clearing Corporation (NSCC). In addition, Mr. Dirks served as Chief Executive Officer and Board member of the Government Securities Clearing Corporation, Chief Executive Officer and Board member of the Mortgage-Backed Securities Clearing Corporation, as a Trustee and a member of the Finance Committee of Manhattan College (2005-2008), as a Trustee and a member of the Finance Committee of AHRC of Nassau County (2006-2008), and as a member of the Independent Directors Council (IDC) Governing Council (2010-2015). Mr. Dirks is a member of the Board of Directors for The Brookville Center for Children's Services, Inc. (2009-present). |
Alan J. Lacy (1953) |
Year of Election or Appointment: 2008 Trustee |
| Mr. Lacy also serves as Trustee of other Fidelity funds. Mr. Lacy serves as a member of the Board of Directors of Dave & Buster's Entertainment, Inc. (restaurant and entertainment complexes, 2010-present) and Bristol-Myers Squibb Company (global pharmaceuticals, 2008-present). In addition, Mr. Lacy served as Senior Adviser (2007-2014) of Oak Hill Capital Partners, L.P. (private equity) and also served as Chief Executive Officer (2000-2005) and Vice Chairman (2005-2006) of Sears Holdings Corporation and Sears, Roebuck and Co. (retail). Mr. Lacy is a member of the Board of Trustees of The National Parks Conservation Association (2006-present). Previously, Mr. Lacy served as Chairman of the Board of Trustees of the National Parks Conservation Association (2008-2011) and as a member of the Board of Directors for The Western Union Company (global money transfer, 2006-2011), The Hillman Companies, Inc. (hardware wholesalers, 2010-2014), and Earth Fare, Inc. (retail grocery, 2010-2014). |
Ned C. Lautenbach (1944) |
Year of Election or Appointment: 2000 Trustee Chairman of the Independent Trustees |
| Mr. Lautenbach also serves as Trustee of other Fidelity funds. Mr. Lautenbach currently serves as the Lead Director of the Eaton Corporation Board of Directors (diversified industrial, 1997-present). Mr. Lautenbach is Chairman of the Board of Directors of Artis-Naples in Naples, Florida (2012-present), a member of the Council on Foreign Relations (1994-present), and a member of the Board of Governors, State University System of Florida (2013-present). Previously, Mr. Lautenbach was a Partner/Advisory Partner at Clayton, Dubilier & Rice, LLC (private equity investment, 1998-2010), as well as a Director of Sony Corporation (2006-2007). |
Joseph Mauriello (1944) |
Year of Election or Appointment: 2008 Trustee |
| Mr. Mauriello also serves as Trustee of other Fidelity funds. Prior to his retirement in January 2006, Mr. Mauriello served in numerous senior management positions including Deputy Chairman and Chief Operating Officer (2004-2005), and Vice Chairman of Financial Services (2002-2004) of KPMG LLP US (professional services, 1965-2005). Mr. Mauriello currently serves as a member of the Board of Directors of XL Group plc. (global insurance and re-insurance, 2006-present) and the Independent Directors Council (IDC) Governing Council (2015-present). Previously, Mr. Mauriello served as a Director of the Hamilton Funds of the Bank of New York (2006-2007) and of Arcadia Resources Inc. (health care services and products, 2007-2012). |
Robert W. Selander (1950) |
Year of Election or Appointment: 2011 Trustee |
| Mr. Selander also serves as Trustee of other Fidelity funds. Mr. Selander serves as a Director of The Western Union Company (global money transfer, 2014-present). Previously, Mr. Selander served as a Member of the Advisory Board of other Fidelity funds (2011), and Executive Vice Chairman (2010), Chief Executive Officer (2009-2010), and President and Chief Executive Officer (1997-2009) of Mastercard, Inc. |
Cornelia M. Small (1944) |
Year of Election or Appointment: 2005 Trustee |
| Ms. Small also serves as Trustee of other Fidelity funds. Ms. Small is a member of the Board of Directors (2009-present) and Chair of the Investment Committee (2010-present) of the Teagle Foundation. Ms. Small also serves on the Investment Committee of the Berkshire Taconic Community Foundation (2008-present). Previously, Ms. Small served as Chairperson (2002-2008) and a member of the Investment Committee and Chairperson (2008-2012) and a member of the Board of Trustees of Smith College. In addition, Ms. Small served as Chief Investment Officer, Director of Global Equity Investments, and a member of the Board of Directors of Scudder, Stevens & Clark and Scudder Kemper Investments. |
William S. Stavropoulos (1939) |
Year of Election or Appointment: 2001 Trustee Vice Chairman of the Independent Trustees |
| Mr. Stavropoulos also serves as Trustee of other Fidelity funds. Mr. Stavropoulos serves as President and Founder of the Michigan Baseball Foundation, the Great Lakes Loons (2007-present). Mr. Stavropoulos is Chairman Emeritus of the Board of Directors of The Dow Chemical Company, where he previously served in numerous senior management positions, including President, CEO (1995-2000; 2002-2004), Chairman of the Executive Committee (2000-2006), and as a member of the Board of Directors (1990-2006). Currently, Mr. Stavropoulos is Chairman of the Board of Directors of Univar Inc. (global distributor of commodity and specialty chemicals), a Director of Teradata Corporation (data warehousing and technology solutions), and Maersk Inc. (industrial conglomerate), and a member of the Advisory Board for Metalmark Capital LLC (private equity investment, 2005-present). Mr. Stavropoulos is an operating advisor to Clayton, Dubilier & Rice, LLC (private equity investment). In addition, Mr. Stavropoulos is a member of the University of Notre Dame Advisory Council for the College of Science, a Trustee of the Rollin L. Gerstacker Foundation, and a Director of the Naples Philharmonic Center for the Arts. Previously, Mr. Stavropoulos served as a Director of Chemical Financial Corporation (bank holding company, 1993-2012) and Tyco International, Ltd. (multinational manufacturing and services, 2007-2012). |
David M. Thomas (1949) |
Year of Election or Appointment: 2008 Trustee |
| Mr. Thomas also serves as Trustee of other Fidelity funds. Mr. Thomas serves as Non-Executive Chairman of the Board of Directors of Fortune Brands Home and Security (home and security products, 2011-present), as a member of the Board of Directors (2004-present) and Presiding Director (2013-present) of Interpublic Group of Companies, Inc. (marketing communication), and as a member of the Board of Trustees of the University of Florida (2013-present). Previously, Mr. Thomas served as Executive Chairman (2005-2006) and Chairman and Chief Executive Officer (2000-2005) of IMS Health, Inc. (pharmaceutical and healthcare information solutions), and a Director of Fortune Brands, Inc. (consumer products, 2000-2011). |
+ The information above includes each Trustee's principal occupation during the last five years and other information relating to the experience, attributes, and skills relevant to each Trustee's qualifications to serve as a Trustee, which led to the conclusion that each Trustee should serve as a Trustee for the fund.
Advisory Board Member and Officers:
Correspondence intended for each officer and Peter S. Lynch may be sent to Fidelity Investments, 245 Summer Street, Boston, Massachusetts 02210. Officers appear below in alphabetical order.
Name, Year of Birth; Principal Occupation |
Peter S. Lynch (1944) |
Year of Election or Appointment: 2003 Member of the Advisory Board |
| Mr. Lynch also serves as Member of the Advisory Board of other Fidelity funds. Mr. Lynch is Vice Chairman and a Director of FMR (investment adviser firm) and FMR Co., Inc. (investment adviser firm). In addition, Mr. Lynch serves as a Trustee of Boston College and as the Chairman of the Inner-City Scholarship Fund. Previously, Mr. Lynch served on the Special Olympics International Board of Directors (1997-2006). |
Elizabeth Paige Baumann (1968) |
Year of Election or Appointment: 2012 Anti-Money Laundering (AML) Officer |
| Ms. Baumann also serves as AML Officer of other funds. She is Chief AML Officer of FMR LLC (diversified financial services company, 2012-present) and is an employee of Fidelity Investments. Previously, Ms. Baumann served as Vice President and Deputy Anti-Money Laundering Officer (2007-2012). |
Marc R. Bryant (1966) |
Year of Election or Appointment: 2015 Secretary and Chief Legal Officer (CLO) |
| Mr. Bryant also serves as Secretary and CLO of other funds. Mr. Bryant serves as CLO, Secretary, and Senior Vice President of Fidelity Management & Research Company (investment adviser firm, 2015-present) and FMR Co., Inc. (investment adviser firm, 2015-present); Secretary of Fidelity SelectCo, LLC (investment adviser firm, 2015-present) and Fidelity Investments Money Management, Inc. (investment adviser firm, 2015-present); and CLO of Fidelity Management & Research (Hong Kong) Limited (investment adviser firm, 2015-present). He is Senior Vice President and Deputy General Counsel of FMR LLC (diversified financial services company). Previously, Mr. Bryant served as Secretary and Chief Legal Officer of Fidelity Rutland Square Trust II (2010-2014) and Assistant Secretary of Fidelity's Fixed Income and Asset Allocation Funds (2013-2015). Prior to joining Fidelity Investments, Mr. Bryant served as a Senior Vice President and the Head of Global Retail Legal for AllianceBernstein L.P. (2006-2010), and as the General Counsel for ProFund Advisors LLC (2001-2006). |
William C. Coffey (1969) |
Year of Election or Appointment: 2009 Assistant Secretary |
| Mr. Coffey also serves as Assistant Secretary of other funds. He is Senior Vice President and Deputy General Counsel of FMR LLC (diversified financial services company, 2010-present), and is an employee of Fidelity Investments. Previously, Mr. Coffey served as Vice President and Associate General Counsel of FMR LLC (2005-2009). |
Timothy M. Cohen (1969) |
Year of Election or Appointment: 2014 Vice President of certain Equity Funds |
| Mr. Cohen also serves as Vice President of other funds. Mr. Cohen serves as Chief Compliance Officer of FMR Investment Management (U.K.) Limited (investment adviser firm, 2013-present) and is an employee of Fidelity Investments. Previously, Mr. Cohen served as a Director of FMR Investment Management (U.K.) Limited (2013-2015). |
Jonathan Davis (1968) |
Year of Election or Appointment: 2010 Assistant Treasurer |
| Mr. Davis also serves as Assistant Treasurer of other funds, and is an employee of Fidelity Investments. Previously, Mr. Davis served as Vice President and Associate General Counsel of FMR LLC (diversified financial services company, 2003-2010). |
Adrien E. Deberghes (1967) |
Year of Election or Appointment: 2008 Deputy Treasurer |
| Mr. Deberghes also serves as an officer of other funds. He is an employee of Fidelity Investments (2008-present). Prior to joining Fidelity Investments, Mr. Deberghes was Senior Vice President of Mutual Fund Administration at State Street Corporation (2007-2008), Senior Director of Mutual Fund Administration at Investors Bank & Trust (2005-2007), and Director of Finance for Dunkin' Brands (2000-2005). |
Stephanie J. Dorsey (1969) |
Year of Election or Appointment: 2010 Assistant Treasurer |
| Ms. Dorsey also serves as an officer of other funds. She is an employee of Fidelity Investments (2008-present) and has served in other fund officer roles. Prior to joining Fidelity Investments, Ms. Dorsey served as Treasurer (2004-2008) of the JPMorgan Mutual Funds and Vice President (2004-2008) of JPMorgan Chase Bank. |
Howard J. Galligan III (1966) |
Year of Election or Appointment: 2014 Chief Financial Officer |
| Mr. Galligan also serves as Chief Financial Officer of other funds. Mr. Galligan serves as President of Fidelity Pricing and Cash Management Services (FPCMS) (2014-present) and as a Director of Strategic Advisers, Inc. (investment adviser firm, 2008-present). Previously, Mr. Galligan served as Chief Administrative Officer of Asset Management (2011-2014) and Chief Operating Officer and Senior Vice President of Investment Support for Strategic Advisers, Inc. (2003-2011). |
Scott C. Goebel (1968) |
Year of Election or Appointment: 2015 Vice President |
| Mr. Goebel serves as Vice President of other funds and is an employee of Fidelity Investments (2001-present). Previously, Mr. Goebel served as Secretary of Fidelity SelectCo, LLC (investment adviser firm, 2013-2015), Fidelity Investments Money Management, Inc. (FIMM) (investment adviser firm, 2010-2015), and Fidelity Research and Analysis Company (FRAC) (investment adviser firm, 2010-2015); General Counsel, Secretary, and Senior Vice President of Fidelity Management & Research Company (investment adviser firm, 2008-2015) and FMR Co., Inc. (investment adviser firm, 2008-2015); Assistant Secretary of Fidelity Management & Research (Japan) Limited (investment adviser firm, 2008-2015) and FMR Investment Management (U.K.) Limited (investment adviser firm, 2008-2015); Chief Legal Officer (CLO) of Fidelity Management & Research (Hong Kong) Limited (investment adviser firm, 2008-2015); Secretary and CLO of certain Fidelity funds (2008-2015); Assistant Secretary of FIMM (2008-2010), FRAC (2008-2010), and certain funds (2007-2008); and as Vice President and Secretary of Fidelity Distributors Corporation (FDC) (2005-2007). |
Brian B. Hogan (1964) |
Year of Election or Appointment: 2009 Vice President |
| Mr. Hogan also serves as Trustee or Vice President of other funds. Mr. Hogan serves as a Director of Fidelity SelectCo, LLC (investment adviser firm, 2014-present) and President of the Equity Division of FMR (investment adviser firm, 2009-present). Previously, Mr. Hogan served as Senior Vice President, Equity Research of FMR (2006-2009) and as a portfolio manager. |
Chris Maher (1972) |
Year of Election or Appointment: 2013 Assistant Treasurer |
| Mr. Maher serves as Assistant Treasurer of other funds. Mr. Maher is Vice President of Valuation Oversight and is an employee of Fidelity Investments. Previously, Mr. Maher served as Vice President of Asset Management Compliance (2013), Vice President of the Program Management Group of FMR (investment adviser firm, 2010-2013), and Vice President of Valuation Oversight (2008-2010). |
Kenneth B. Robins (1969) |
Year of Election or Appointment: 2008 President and Treasurer |
| Mr. Robins also serves as an officer of other funds. Mr. Robins serves as Executive Vice President of Fidelity Investments Money Management, Inc. (FIMM) (investment adviser firm, 2013-present) and is an employee of Fidelity Investments (2004-present). Previously, Mr. Robins served in other fund officer roles. |
Stacie M. Smith (1974) |
Year of Election or Appointment: 2013 Deputy Treasurer |
| Ms. Smith also serves as an officer of other funds. She is an employee of Fidelity Investments (2009-present) and has served in other fund officer roles. Prior to joining Fidelity Investments, Ms. Smith served as Senior Audit Manager of Ernst & Young LLP (1996-2009). |
Renee Stagnone (1975) |
Year of Election or Appointment: 2013 Deputy Treasurer |
| Ms. Stagnone also serves as Deputy Treasurer of other funds. Ms. Stagnone is an employee of Fidelity Investments (1997-present). |
Linda J. Wondrack (1964) |
Year of Election or Appointment: 2014 Chief Compliance Officer |
| Ms. Wondrack also serves as Chief Compliance Officer of other funds. Ms. Wondrack is Executive Vice President and head of the Ethics Office and Asset Management Compliance for Fidelity Investments (2012-present). Ms. Wondrack also serves as Chief Compliance Officer of Fidelity SelectCo, LLC (investment adviser firm, 2014-present); Chief Compliance Officer of Impresa Management LLC (2013-present); and Chief Compliance Officer of FMR Co., Inc. (investment adviser firm), Fidelity Investments Money Management, Inc. (investment adviser firm), Fidelity Management & Research (Japan) Limited (investment adviser firm), FMR Investment Management (U.K.) Limited (investment adviser firm), Fidelity Management & Research (Hong Kong) (investment adviser firm), Fidelity Management & Research Company (investment adviser firm), FIAM LLC (investment adviser firm), and Strategic Advisers, Inc. (investment adviser firm), Ballyrock Investment Advisors LLC, and Northern Neck Investors LLC (2012-present). Previously, Ms. Wondrack served as Senior Vice President and Chief Compliance Officer for Columbia Management Investment Advisers, LLC (2005-2012); Chief Compliance Officer for certain funds within the Columbia Family of Funds (2007-2012); and Senior Vice President of Compliance Risk Management at Bank of America (2005-2010). |
Joseph F. Zambello (1957) |
Year of Election or Appointment: 2011 Deputy Treasurer |
| Mr. Zambello also serves as Deputy Treasurer of other funds. Mr. Zambello is an employee of Fidelity Investments (1991-present). Previously, Mr. Zambello served as Vice President of the Program Management Group of FMR (investment adviser firm, 2009-2011) and Vice President of the Transfer Agent Oversight Group (2005-2009). |
Annual Report
The Board of Trustees of International Small Cap Opportunities Fund voted to pay to shareholders of record at the opening of business on record date, the following distributions per share derived from capital gains realized from sales of portfolio securities, and dividends derived from net investment income:
| Pay Date | Record Date | Dividends | Capital Gains |
International Small
Cap Opportunities | 12/07/15 | 12/04/15 | $0.075 | $0.070 |
International Small Cap Opportunities designates 10% of the dividends distributed in December 2014 during the fiscal year as qualifying for the dividends-received deduction for corporate shareholders.
International Small Cap Opportunities designates 100% of the dividends distributed in December 2014 during the fiscal year as amounts which may be taken into account as a dividends for purposes of the maximum rate under section 1(h) (11) of the Internal Revenue Code.
The amounts per share which represent income derived from sources within, and taxes paid to, foreign countries or possessions of the United States are as follows:
| Pay Date | Income | Taxes |
International Small Cap
Opportunities | 12/08/2014 | $0.1329 | $0.0219 |
The fund will notify shareholders in January 2016 of amounts for use in preparing 2015 income tax returns.
Annual Report
Fidelity International Small Cap Opportunities Fund
Each year, the Board of Trustees, including the Independent Trustees (together, the Board), votes on the renewal of the management contract with Fidelity Management & Research Company (FMR) and the sub-advisory agreements (together, the Advisory Contracts) for the fund. The Board, assisted by the advice of fund counsel and Independent Trustees' counsel, requests and considers a broad range of information relevant to the renewal of the Advisory Contracts throughout the year.
The Board meets regularly and, at each of its meetings, covers an extensive agenda of topics and materials and considers factors that are relevant to its annual consideration of the renewal of the fund's Advisory Contracts, including the services and support provided to the fund and its shareholders. The Board has established various standing committees (Committees), each composed of and chaired by Independent Trustees with varying backgrounds, to which the Board has assigned specific subject matter responsibilities in order to enhance effective decision-making by the Board. The Board, acting directly and through its Committees, requests and receives information concerning the annual consideration of the renewal of the fund's Advisory Contracts. The Board also meets as needed to consider matters specifically related to the Board's annual consideration of the renewal of the Advisory Contracts. Members of the Board may also meet with trustees of other Fidelity funds through ad hoc joint committees to discuss certain matters relevant to all of the Fidelity funds.
At its July 2015 meeting, the Board unanimously determined to renew the fund's Advisory Contracts. In reaching its determination, the Board considered all factors it believed relevant, including (i) the nature, extent, and quality of the services to be provided to the fund and its shareholders (including the investment performance of the fund); (ii) the competitiveness of the fund's management fee and total expense ratio relative to peer funds; (iii) the total costs of the services to be provided by and the profits to be realized by Fidelity from its relationship with the fund; and (iv) the extent to which (if any) economies of scale exist and would be realized as the fund grows, and whether any economies of scale are appropriately shared with fund shareholders.
In considering whether to renew the Advisory Contracts for the fund, the Board reached a determination, with the assistance of fund counsel and Independent Trustees' counsel and through the exercise of its business judgment, that the renewal of the Advisory Contracts was in the best interests of the fund and its shareholders and that the compensation payable under the Advisory Contracts was fair and reasonable. The Board's decision to renew the Advisory Contracts was not based on any single factor, but rather was based on a comprehensive consideration of all the information provided to the Board at its meetings throughout the year. The Board, in reaching its determination to renew the Advisory Contracts, was aware that shareholders of the fund have a broad range of investment choices available to them, including a wide choice among funds offered by Fidelity's competitors, and that the fund's shareholders, who have the opportunity to review and weigh the disclosure provided by the fund in its prospectus and other public disclosures, have chosen to invest in this fund, which is part of the Fidelity family of funds.
Annual Report
Nature, Extent, and Quality of Services Provided. The Board considered Fidelity's staffing as it relates to the fund, including the backgrounds of investment personnel of Fidelity, and also considered the fund's investment objective, strategies, and related investment philosophy. The Independent Trustees also had discussions with senior management of Fidelity's investment operations and investment groups. The Board considered the structure of the portfolio manager compensation program and whether this structure provides appropriate incentives to act in the best interests of the fund. Additionally, the Board considered the portfolio managers' investments, if any, in the funds that they manage.
Resources Dedicated to Investment Management and Support Services. The Board and the Fund Oversight and Research Committees reviewed the general qualifications and capabilities of Fidelity's investment staff, including its size, education, experience, and resources, as well as Fidelity's approach to recruiting, training, managing, and compensating investment personnel. The Board noted that Fidelity has continued to increase the resources devoted to non-U.S. offices, including expansion of Fidelity's global investment organization. The Board also noted that Fidelity's analysts have extensive resources, tools and capabilities that allow them to conduct sophisticated quantitative and fundamental analysis, as well as credit analysis of issuers, counterparties and guarantors. Further, the Board considered that Fidelity's investment professionals have sufficient access to global information and data so as to provide competitive investment results over time, and that those professionals also have access to sophisticated tools that permit them to assess portfolio construction and risk and performance attribution characteristics continuously, as well as to transmit new information and research conclusions rapidly around the world. Additionally, in its deliberations, the Board considered Fidelity's trading, risk management, and compliance capabilities and resources, which are integral parts of the investment management process.
Shareholder and Administrative Services. The Board considered (i) the nature, extent, quality, and cost of advisory, administrative, and shareholder services performed by FMR, the sub-advisers (together with FMR, the Investment Advisers), and their affiliates under the Advisory Contracts and under separate agreements covering transfer agency, pricing and bookkeeping, and securities lending services for the fund; (ii) the nature and extent of the supervision of third party service providers, principally custodians and subcustodians; and (iii) the resources devoted to, and the record of compliance with, the fund's compliance policies and procedures. The Board also reviewed the allocation of fund brokerage, including allocations to brokers affiliated with the Investment Advisers, the use of brokerage commissions to pay fund expenses, and the use of "soft" commission dollars to pay for research services.
Annual Report
Board Approval of Investment Advisory Contracts and
Management Fees - continued
The Board noted that the growth of fund assets over time across the complex allows Fidelity to reinvest in the development of services designed to enhance the value or convenience of the Fidelity funds as investment vehicles. These services include 24-hour access to account information and market information through telephone representatives and over the Internet, investor education materials and asset allocation tools, and the expanded availability of Fidelity Investor Centers.
In 2014, the Board formed an ad hoc Committee on Transfer Agency Fees to review the variety of transfer agency fee structures throughout the industry and Fidelity's competitive positioning with respect to industry participants.
Investment in a Large Fund Family. The Board considered the benefits to shareholders of investing in a Fidelity fund, including the benefits of investing in a fund that is part of a large family of funds offering a variety of investment disciplines and providing a large variety of mutual fund investor services. The Board noted that Fidelity had taken, or had made recommendations that resulted in the Fidelity funds taking, a number of actions over the previous year that benefited particular funds, including (i) continuing to dedicate additional resources to investment research and to the support of the senior management team that oversees asset management; (ii) continuing efforts to enhance Fidelity's global research capabilities; (iii) launching new funds and making other enhancements to meet client needs; (iv) reducing management fees and total expenses for certain index funds and diversified international funds; (v) continuing to launch dedicated lower cost underlying funds to meet portfolio construction needs related to expanding underlying fund options for Fidelity funds of funds, specifically for the Freedom Fund product lines; (vi) rationalizing product lines and gaining increased efficiencies through fund mergers; (vii) launching active fixed-income exchange-traded funds; (viii) continuing to develop, acquire and implement systems and technology to improve services to the funds and information security and to increase efficiency; (ix) implementing investment enhancements to further strengthen Fidelity's target date product line to increase investors' probability of success in achieving their goals; (x) modifying the eligibility criteria for certain share classes to accommodate roll-over assets from employer-sponsored retirement plans; (xi) launching a new Class W of the Freedom Index Funds to attract and retain Fidelity record-kept retirement plan assets; and (xii) implementing changes to Fidelity's money market product line in response to recent money market regulatory reforms.
Investment Performance. The Board considered whether the fund has operated in accordance with its investment objective, as well as its record of compliance with its investment restrictions and its performance history.
Annual Report
The Board took into account discussions with representatives of the Investment Advisers about fund investment performance that occur at Board meetings throughout the year. In this regard the Board noted that as part of regularly scheduled fund reviews and other reports to the Board on fund performance, the Board considers annualized return information for the fund, for different time periods, measured against a securities market index ("benchmark index") and a peer group of funds with similar objectives ("peer group"), if any. In its evaluation of fund investment performance, the Board gave particular attention to information indicating changes in performance of certain Fidelity funds for specific time periods and discussed with the Investment Advisers the reasons for any overperformance or underperformance.
In addition to reviewing absolute and relative fund performance, the Independent Trustees periodically consider the appropriateness of fund performance metrics in evaluating the results achieved. In general, the Independent Trustees believe that fund performance should be evaluated based on net performance (after fees and expenses) of both the highest performing and lowest performing fund share classes, where applicable, compared to appropriate benchmark indices, over appropriate time periods that may include full market cycles, and compared to peer groups, as applicable, over the same periods, taking into account relevant factors including the following: general market conditions; issuer-specific information; and fund cash flows and other factors.
The Independent Trustees recognize that shareholders evaluate performance on a net basis over their own holding periods, for which one-, three-, and five-year periods are often used as a proxy. For this reason, the performance information reviewed by the Board also included net cumulative calendar year total return information for the fund and an appropriate benchmark index and peer group for the most recent one-, three-, and five-year periods, as shown below. Returns are shown compared to the 25th percentile (top of box, 75% beaten) and 75th percentile (bottom of box, 25% beaten) of the peer universe. Returns of the benchmark index are "net MA," i.e., adjusted for tax withholding rates applicable to U.S.-based funds organized as Massachusetts business trusts.
Annual Report
Board Approval of Investment Advisory Contracts and
Management Fees - continued
Fidelity International Small Cap Opportunities Fund
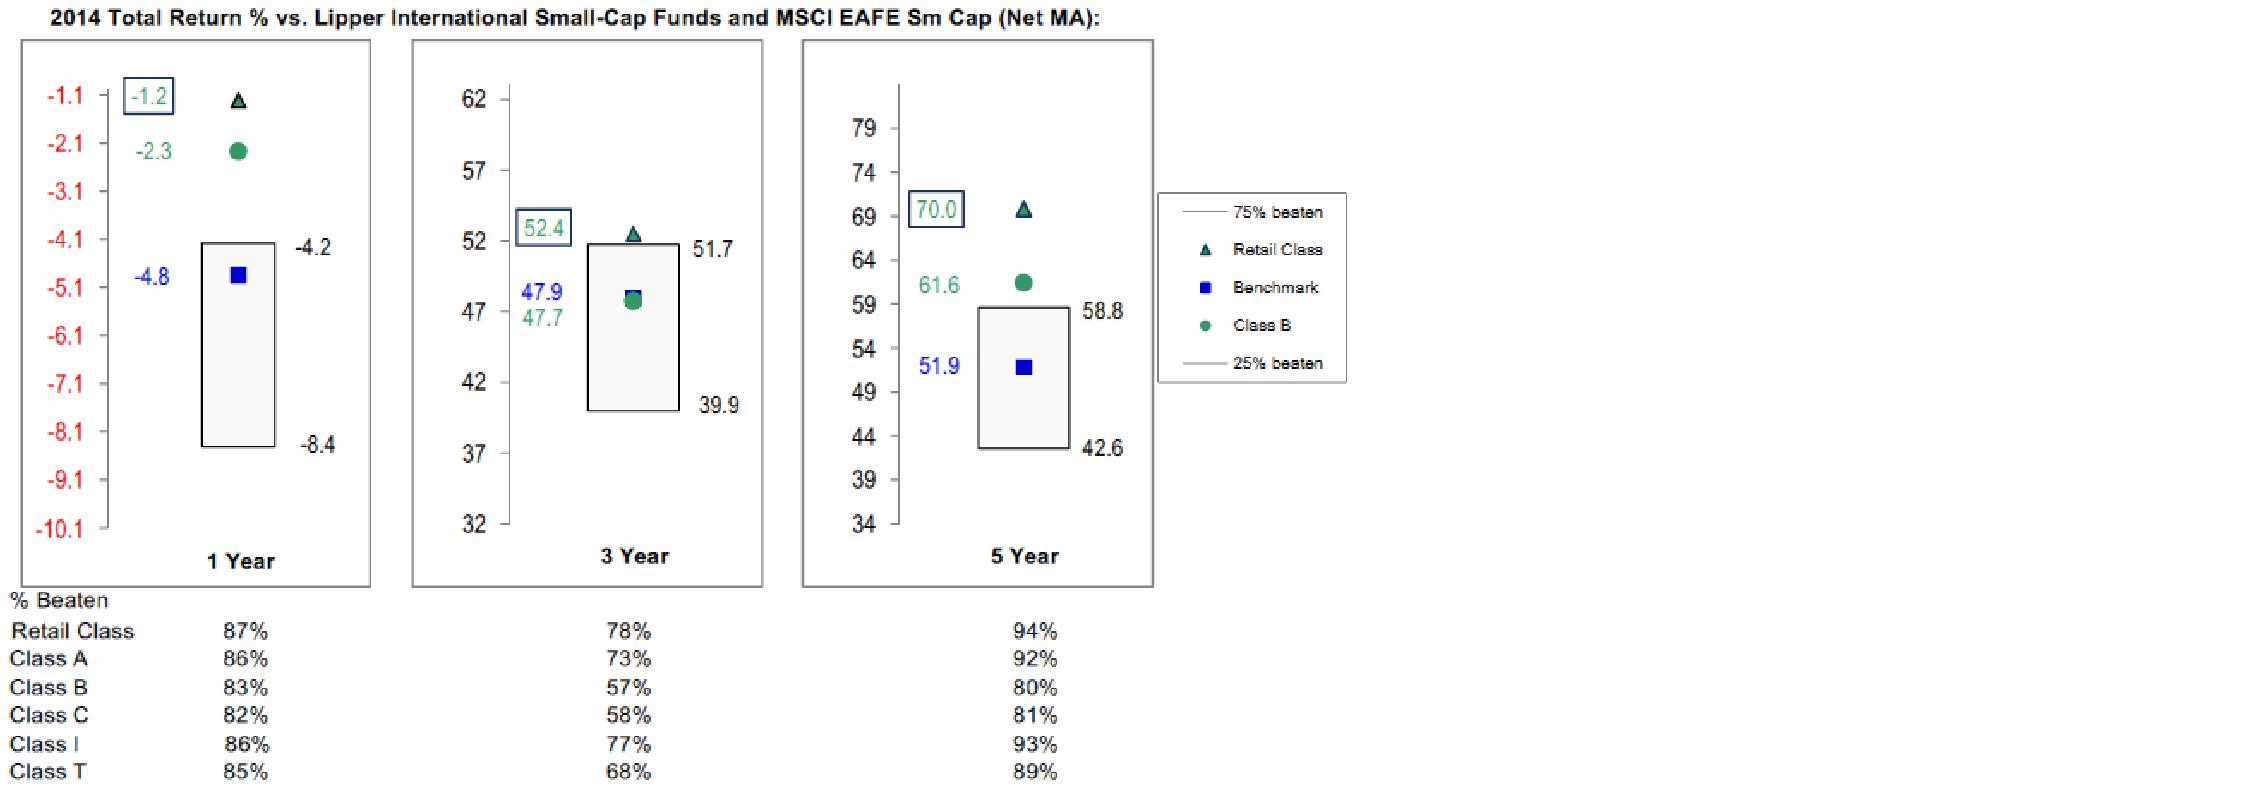
The Board also considered that the fund's management fee is subject to upward or downward adjustment depending upon whether, and to what extent, the fund's investment performance for the performance period exceeds, or is exceeded by, a securities index, thus leading to a performance adjustment for the same period. The Board noted that the performance adjustment provides FMR with a strong economic incentive to seek to achieve superior performance for the fund's shareholders and helps to more closely align the interests of FMR and the shareholders of the fund.
Based on its review, the Board concluded that the nature, extent, and quality of services provided to the fund under the Advisory Contracts should benefit the shareholders of the fund.
Competitiveness of Management Fee and Total Expense Ratio. The Board considered the fund's management fee and total expense ratio compared to "mapped groups" of competitive funds and classes created for the purpose of facilitating the Trustees' competitive analysis of management fees and total expenses. Fidelity creates "mapped groups" by combining similar Lipper investment objective categories that have comparable investment mandates. Combining Lipper investment objective categories aids the Board's management fee and total expense ratio comparisons by broadening the competitive group used for comparison.
Management Fee. The Board considered two proprietary management fee comparisons for the 12-month periods shown in basis points (BP) in the chart below. The group of Lipper funds used by the Board for management fee comparisons is referred to below as the "Total Mapped Group." The Total Mapped Group is broader than the Lipper peer group used by the Board for performance comparisons because the Total Mapped Group combines several Lipper investment objective categories while the Lipper peer group does not. The Total Mapped Group comparison focuses on a fund's standing in terms of gross management fees before expense reimbursements or caps, and without giving effect to the fund's performance adjustment, relative to the total universe of funds with comparable investment mandates, regardless of whether their management fee structures also are comparable. Funds with comparable investment mandates offer exposure to similar types of securities. Funds with comparable management fee structures have similar management fee contractual arrangements (e.g., flat rate charged for advisory services, all-inclusive fee rate, etc.). "TMG %" represents the percentage of funds in the Total Mapped Group that had management fees that were lower than the fund's. For example, a hypothetical TMG % of 20% would mean that 80% of the funds in the Total Mapped Group had higher, and 20% had lower, management fees than the fund. The fund's actual TMG %s and the number of funds in the Total Mapped Group are in the chart below. The "Asset-Size Peer Group" (ASPG) comparison focuses on a fund's standing relative to a subset of non-Fidelity funds within the Total Mapped Group that are similar in size and management fee structure without taking into account performance adjustments, if any. For example, if a fund is in the first quartile of the ASPG, the fund's management fee ranks in the least expensive or lowest 25% of funds in the ASPG. The ASPG represents at least 15% of the funds in the Total Mapped Group with comparable asset size and management fee structures, subject to a minimum of 50 funds (or all funds in the Total Mapped Group if fewer than 50). Additional information, such as the ASPG quartile in which the fund's management fee rate ranked and the impact of the fund's performance adjustment, is also included in the chart and considered by the Board.
Annual Report
Fidelity International Small Cap Opportunities Fund
Annual Report
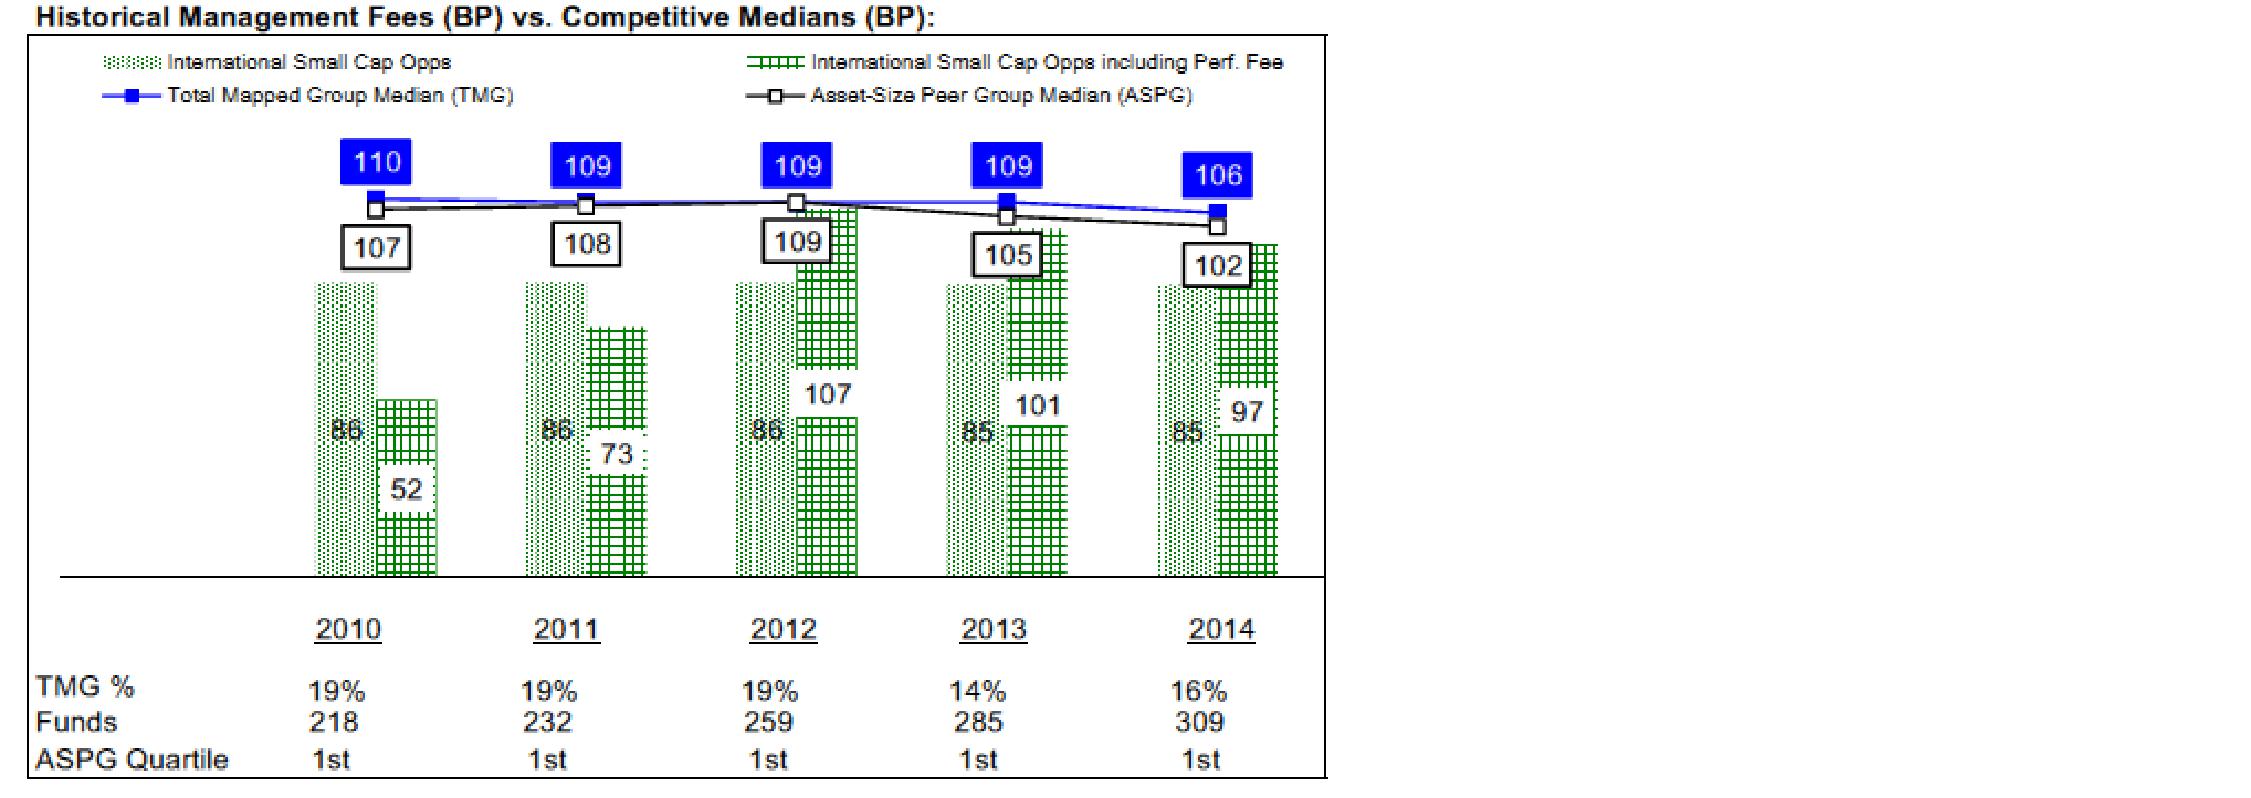
The Board noted that the fund's management fee rate ranked below the median of its Total Mapped Group and below the median of its ASPG for 2014. The Board also noted the effect of the fund's performance adjustment, if any, on the fund's management fee ranking.
The Board noted that, in 2014, the ad hoc Committee on Group Fee was formed by it and other Fidelity fund boards to conduct an in-depth review of the "group fee" component of the management fee of funds with such management fee structures. Committee focus included the mechanics of the group fee, the competitive landscape of group fee structures, Fidelity funds with no group fee component and investment products not included in group fee assets. The Board also considered that, for funds subject to the group fee, FMR agreed to voluntarily waive fees over a specified period of time in amounts designed to account for assets converted from certain funds to certain collective investment trusts.
The Board also noted that, in 2013, the ad hoc Committee on Management Fees was formed to conduct an in-depth review of the management fee rates of Fidelity's active equity mutual funds. The Committee focused on the following areas: (i) standard fee structures; (ii) research consumption and trading evolution; (iii) management fee competitiveness/profitability by category; and (iv) factors that drive institutional pricing.
Board Approval of Investment Advisory Contracts and
Management Fees - continued
Based on its review, the Board concluded that the fund's management fee is fair and reasonable in light of the services that the fund receives and the other factors considered.
Annual Report
Total Expense Ratio. In its review of each class's total expense ratio, the Board considered the fund's management fee as well as other fund or class expenses, as applicable, such as transfer agent fees, pricing and bookkeeping fees, fund-paid 12b-1 fees, and custodial, legal, and audit fees. The Board noted the impact of the fund's performance adjustment. The Board also noted that Fidelity may agree to waive fees and expenses from time to time, and the extent to which, if any, it has done so for the fund. As part of its review, the Board also considered the current and historical total expense ratios of each class of the fund compared to competitive fund median expenses. Each class of the fund is compared to those funds and classes in the Total Mapped Group (used by the Board for management fee comparisons) that have a similar sales load structure.
The Board noted that the total expense ratio of each of Class A and the retail class ranked below its competitive median for 2014 and the total expense ratio of each of Class T, Class B, Class C, and Class I ranked above its competitive median for 2014. The Board considered that, in general, various factors can affect total expense ratios. The Board noted that the total expense ratio of Class T was above the competitive median primarily because of higher 12b-1 fees on Class T as compared to most competitor funds. Class T has a higher 12b-1 fee, but a lower front-end sales charge, than traditionally priced front-end sales charge classes. The Board considered that Class T is primarily sold load-waived in the retirement plan market where its 0.50% 12b-1 fee is comparable to competing no-load, higher 12b-1 fee classes designed specifically for retirement plans. The Board noted that the fund offers multiple classes, each of which has a different sales load and 12b-1 fee structure, and that the multiple structures are intended to offer a range of pricing options for the intermediary market. The Board also noted that the total expense ratios of the classes vary primarily by the level of their 12b-1 fees, although differences in transfer agent fees may also cause expenses to vary from class to class.
Fees Charged to Other Fidelity Clients. The Board also considered Fidelity fee structures and other information with respect to clients of Fidelity, such as other funds advised or subadvised by Fidelity, pension plan clients, and other institutional clients with similar mandates. The Board noted the findings of the 2013 ad hoc joint committee (created with the board of other Fidelity funds), which reviewed and compared Fidelity's institutional investment advisory business with its business of providing services to the Fidelity funds, including the differences in services provided, fees charged, and costs incurred, as well as competition in their respective marketplaces.
Based on its review of total expense ratios and fees charged to other Fidelity clients, the Board concluded that, although in some cases above the median of the universe presented for comparison, the total expense ratio of each class of the fund was reasonable in light of the services that the fund and its shareholders receive and the other factors considered.
Annual Report
Board Approval of Investment Advisory Contracts and
Management Fees - continued
Costs of the Services and Profitability. The Board considered the revenues earned and the expenses incurred by Fidelity in conducting the business of developing, marketing, distributing, managing, administering and servicing the fund and servicing the fund's shareholders. The Board also considered the level of Fidelity's profits in respect of all the Fidelity funds.
On an annual basis, Fidelity presents to the Board information about the profitability of its relationship with the fund. Fidelity calculates profitability information for each fund, as well as aggregate profitability information for groups of Fidelity funds and all Fidelity funds, using a series of detailed revenue and cost allocation methodologies which originate with the books and records of Fidelity on which Fidelity's audited financial statements are based. The Audit Committee of the Board reviews any significant changes from the prior year's methodologies.
PricewaterhouseCoopers LLP (PwC), independent registered public accounting firm and auditor to Fidelity and certain Fidelity funds, has been engaged annually by the Board as part of the Board's assessment of Fidelity's profitability analysis. PwC's engagement includes the review and assessment of the methodologies used by Fidelity in determining the revenues and expenses attributable to Fidelity's mutual fund business, and completion of agreed-upon procedures in respect of the mathematical accuracy of fund profitability and its conformity to established allocation methodologies. After considering PwC's reports issued under the engagement and information provided by Fidelity, the Board concluded that while other allocation methods may also be reasonable, Fidelity's profitability methodologies are reasonable in all material respects.
The Board also reviewed Fidelity's non-fund businesses and fall-out benefits related to the mutual fund business as well as cases where Fidelity's affiliates may benefit from or be related to the fund's business.
The Board considered the costs of the services provided by and the profits realized by Fidelity in connection with the operation of the fund and was satisfied that the profitability was not excessive.
Economies of Scale. The Board considered whether there have been economies of scale in respect of the management of the Fidelity funds, whether the Fidelity funds (including the fund) have appropriately benefited from any such economies of scale, and whether there is potential for realization of any further economies of scale. The Board considered the extent to which the fund will benefit from economies of scale as assets grow through increased services to the fund, through waivers or reimbursements, or through fee or expense ratio reductions. The Board also noted that in 2013, it and the boards of other Fidelity funds created an ad hoc committee (the Economies of Scale Committee) to analyze whether Fidelity attains economies of scale in respect of the management and servicing of the Fidelity funds, whether the Fidelity funds have appropriately benefited from such economies of scale, and whether there is potential for realization of any further economies of scale.
Annual Report
The Board recognized that the fund's management contract incorporates a "group fee" structure, which provides for lower group fee rates as total group assets increase, and for higher group fee rates as total group assets decrease (with "group assets" defined to include fund assets under FMR's management plus sector fund assets previously under FMR's management and currently managed by Fidelity SelectCo, LLC). FMR calculates the group fee rates based on a tiered asset "breakpoint" schedule that varies based on asset class. The Board considered that the group fee is designed to deliver the benefits of economies of scale to fund shareholders when total Fidelity fund assets increase, even if assets of any particular fund are unchanged or have declined, because some portion of Fidelity's costs are attributable to services provided to all Fidelity funds, and all funds benefit if those costs can be allocated among more assets. The Board concluded that, given the group fee structure, fund shareholders will benefit from lower management fees as group assets increase at the fund complex level, regardless of whether Fidelity achieves any such economies of scale.
The Board concluded, taking into account the analysis of the Economies of Scale Committee, that economies of scale, if any, are being appropriately shared between fund shareholders and Fidelity.
Additional Information Requested by the Board. In order to develop fully the factual basis for consideration of the Fidelity funds' Advisory Contracts, the Board requested and received additional information on certain topics, including: (i) fund performance trends and Fidelity's long-term strategies for certain funds; (ii) the various share classes employed by Fidelity and the attributes of each class, together with similar information on the distribution and servicing payments made by Fidelity or the funds to third-party participants in the distribution channels; (iii) fund profitability, and fund performance in relation to fund profitability; (iv) the methodology with respect to evaluating competitive fund data and peer group classifications and fee comparisons; (v) annual fund profitability margins, with particular focus on certain funds with negative margins; (vi) the realization of fall-out benefits in certain Fidelity business units; (vii) economies of scale and the way in which they are shared with fund shareholders; (viii) Fidelity's group fee structures, including the group fee schedule of breakpoints; (ix) the impact of cost containment measures on the funds; and (x) the transfer agent fee structure.
Based on its evaluation of all of the conclusions noted above, and after considering all factors it believed relevant, the Board concluded that the advisory fee structures are fair and reasonable, and that the fund's Advisory Contracts should be renewed.
Annual Report
Investment Adviser
Fidelity Management & Research Company
Boston, MA
Investment Sub-Advisers
FMR Co., Inc.
Fidelity Management & Research
(Hong Kong) Limited
Fidelity Management & Research
(Japan) Limited
FMR Investment Management
(U.K.) Limited
FIL Investments (Japan) Limited
FIL Investment Advisors
FIL Investment Advisors (UK) Limited
General Distributor
Fidelity Distributors Corporation
Smithfield, RI
Transfer and Service Agents
Fidelity Investments Institutional
Operations Company, Inc.
Boston, MA
Fidelity Service Company, Inc.
Boston, MA
Custodian
The Northern Trust Company
Chicago, IL
The Fidelity Telephone Connection
Mutual Fund 24-Hour Service
Exchanges/Redemptions
and Account Assistance 1-800-544-6666
Product Information 1-800-544-6666
Retirement Accounts 1-800-544-4774
(8 a.m. - 9 p.m.)
TDD Service 1-800-544-0118
for the deaf and hearing impaired
(9 a.m. - 9 p.m. Eastern time)
Fidelity Automated Service
Telephone (FAST®)
1-800-544-5555

Automated line for quickest service
(Fidelity Investment logo)(registered trademark)
Corporate Headquarters
245 Summer St., Boston, MA 02210
www.fidelity.com
ILS-UANN-1215
1.815061.111
ContentsPerformance: The Bottom LineManagement's Discussion of Fund PerformanceShareholder Expense ExampleInvestment Changes (Unaudited)Investments October 31, 2015Financial StatementsNotes to Financial StatementsReport of Independent Registered Public Accounting FirmTrustees and OfficersDistributions (Unaudited)Board Approval of Investment Advisory Contracts and Management Fees
Fidelity®
International Growth Fund
Annual Report
October 31, 2015
(Fidelity Cover Art)
Contents
Performance | (Click Here) | How the fund has done over time. |
Management's Discussion of Fund Performance | (Click Here) | The Portfolio Manager's review of fund performance and strategy. |
Shareholder Expense Example | (Click Here) | An example of shareholder expenses. |
Investment Changes | (Click Here) | A summary of major shifts in the fund's investments over the past six months. |
Investments | (Click Here) | A complete list of the fund's investments with their market values. |
Financial Statements | (Click Here) | Statements of assets and liabilities, operations, and changes in net assets, as well as financial highlights. |
Notes | (Click Here) | Notes to financial statements. |
Report of Independent Registered Public Accounting Firm | (Click Here) | |
Trustees and Officers | (Click Here) | |
Distributions | (Click Here) | |
Board Approval of Investment Advisory Contracts and Management Fees | (Click Here) | |
To view a fund's proxy voting guidelines and proxy voting record for the 12-month period ended June 30, visit http://www.fidelity.com/proxyvotingresults or visit the Securities and Exchange Commission's (SEC) web site at http://www.sec.gov. You may also call 1-800-544-8544 to request a free copy of the proxy voting guidelines.
Standard & Poor's, S&P and S&P 500 are registered service marks of The McGraw-Hill Companies, Inc. and have been licensed for use by Fidelity Distributors Corporation.
Other third-party marks appearing herein are the property of their respective owners.
All other marks appearing herein are registered or unregistered trademarks or service marks of FMR LLC or an affiliated company. © 2015 FMR LLC. All rights reserved.
Annual Report
This report and the financial statements contained herein are submitted for the general information of the shareholders of the fund. This report is not authorized for distribution to prospective investors in the fund unless preceded or accompanied by an effective prospectus.
A fund files its complete schedule of portfolio holdings with the SEC for the first and third quarters of each fiscal year on Form N-Q. Forms N-Q are available on the SEC's web site at http://www.sec.gov. A fund's Forms N-Q may be reviewed and copied at the SEC's Public Reference Room in Washington, DC. Information regarding the operation of the SEC's Public Reference Room may be obtained by calling 1-800-SEC-0330. For a complete list of a fund's portfolio holdings, view the most recent holdings listing, semiannual report, or annual report on Fidelity's web site at http://www.fidelity.com, http://www.advisor.fidelity.com, or http://www.401k.com, as applicable.
NOT FDIC INSURED • MAY LOSE VALUE • NO BANK GUARANTEE
Neither the fund nor Fidelity Distributors Corporation is a bank.
Annual Report
Average annual total return reflects the change in the value of an investment, assuming reinvestment of the class' distributions from dividend income and capital gains (the profits earned upon the sale of securities that have grown in value, if any) and assuming a constant rate of performance each year. The $10,000 table and the fund's returns do not reflect the deduction of taxes that a shareholder would pay on fund distributions or the redemption of fund shares. During periods of reimbursement by Fidelity, a fund's total return will be greater than it would be had the reimbursement not occurred. How a fund did yesterday is no guarantee of how it will do tomorrow.
Average Annual Total Returns
Periods ended October 31, 2015 | Past 1
year | Past 5
years | Life of
fundA |
Fidelity® International Growth Fund | 3.36% | 7.21% | 2.51% |
A From November 1, 2007.
$10,000 Over Life of Fund
Let's say hypothetically that $10,000 was invested in Fidelity® International Growth Fund, a class of the fund, on November 1, 2007, when the fund started. The chart shows how the value of your investment would have changed, and also shows how the MSCI EAFE Growth Index performed over the same period.
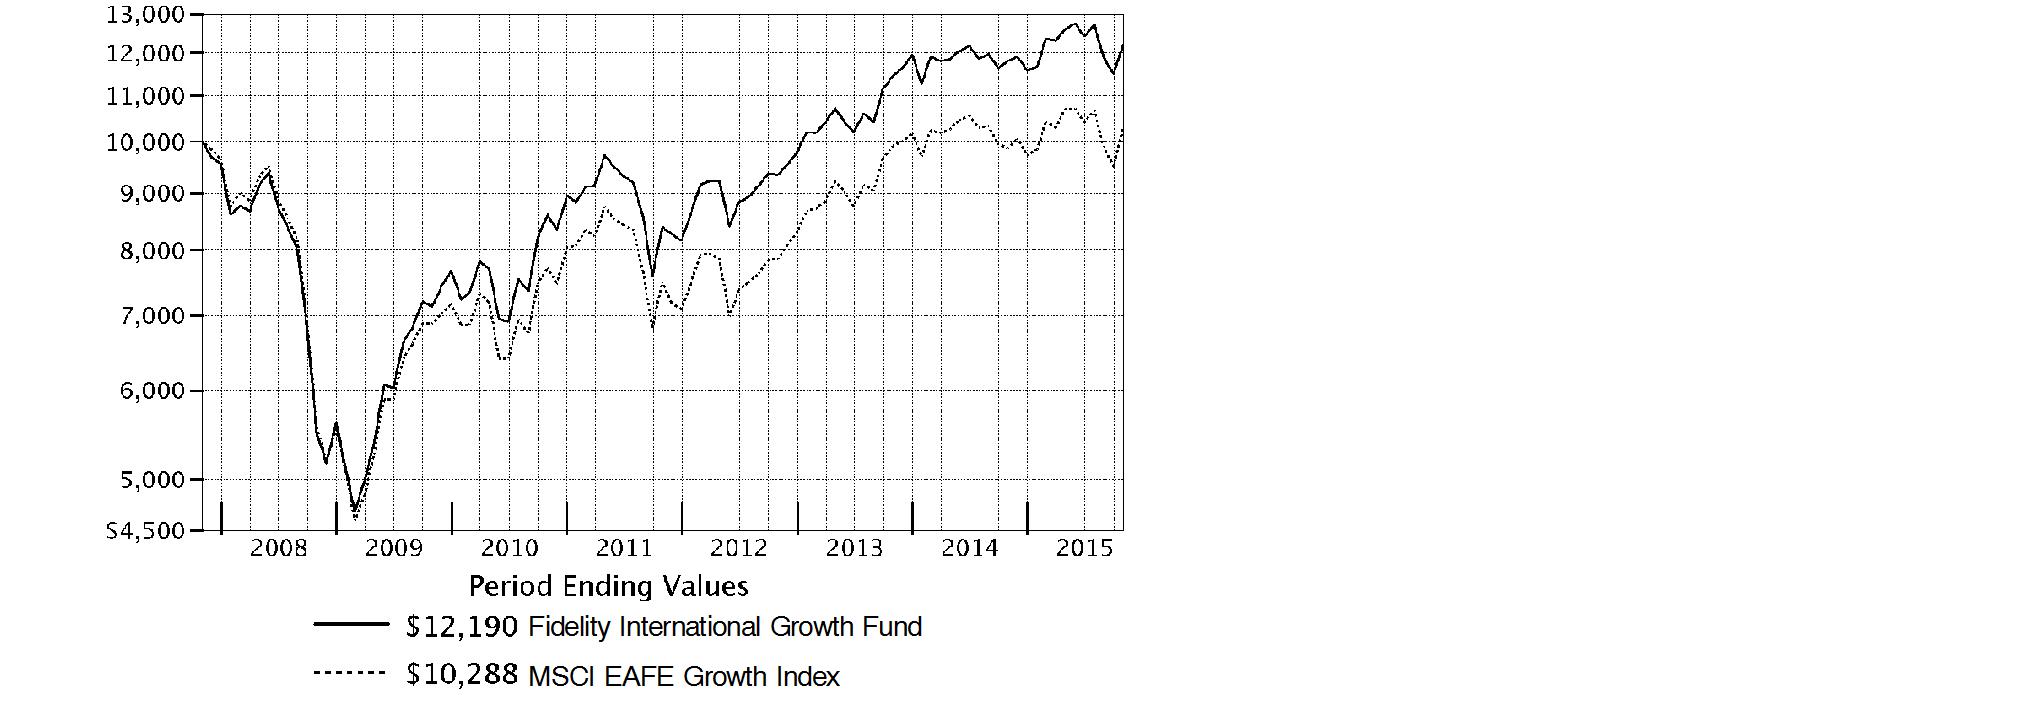
Annual Report
Market Recap: International equities suffered a moderate setback for the 12 months ending October 31, 2015, held back by a collapse in commodities prices that hurt resources-related sectors and geographies. The MSCI ACWI (All Country World Index) ex USA Index returned -4.55% for the period, affected also by concerns about global economic growth. Commodity producers remained under pressure for much of the past year, largely related to economic deceleration in China (-1%), the world's second-largest economy and a leading consumer of raw materials. This effect was exacerbated by U.S. dollar strength relative to global currencies, which weighed on commodities priced in dollars and acutely impacted equity returns within regions most exposed to resources prices. The emerging-markets group, for example, returned about -15% this period. Canada, a significant energy producer, returned roughly -17%. Net energy consumer Japan (+9%) was the best-performing region by far. Only about a quarter of the nearly 50 index countries managed a gain this period: Ireland (+19%) - the EU's fastest-growing economy - and Israel (+17%) proved top performers; Greece (-56%) and Brazil (-46%), among the worst. As for sectors, energy (-25%) and materials (-16%) declined sharply, whereas the two consumer sectors each gained about 6%.
Comments from Portfolio Manager Jed Weiss: For the year, the fund's share classes (excluding sales charges, if applicable) produced low-single-digit gains, underperforming the 4.28% result of the benchmark MSCI EAFE Growth Index. The fund underperformed the benchmark largely for idiosyncratic reasons, including a fair-value pricing adjustment and unfavorable currency movements. Security selection was helpful overall, especially in information technology, materials and financials. Conversely, picks in health care hampered our relative result. In country terms, stock picking was strong in Australia, Spain and Switzerland, but weak in Hong Kong and Germany. Two of the fund's biggest individual detractors were Wynn Macau and Sands China, owners of casino properties in Macau. These stocks struggled for various reasons, and I eliminated the fund's stake in both. Another negative was Turkey-based Coca-Cola Icecek Sanayi. I sold the fund's stake in this owner of the Coca-Cola bottling franchise in various emerging markets and reinvested the proceeds in other stocks I thought offered a better risk/reward balance. In contrast, our biggest contributor was BGF Retail, a South Korean convenience-store retailer, while Visa and Mastercard, two U.S.-based payment processors, also contributed. Of all the stocks I mentioned, only Wynn and Sands were in our benchmark.
The views expressed above reflect those of the portfolio manager(s) only through the end of the period as stated on the cover of this report and do not necessarily represent the views of Fidelity or any other person in the Fidelity organization. Any such views are subject to change at any time based upon market or other conditions and Fidelity disclaims any responsibility to update such views. These views may not be relied on as investment advice and, because investment decisions for a Fidelity fund are based on numerous factors, may not be relied on as an indication of trading intent on behalf of any Fidelity fund.
Annual Report
Shareholder Expense Example
As a shareholder of the Fund, you incur two types of costs: (1) transaction costs, including sales charges (loads) on purchase payments or redemption proceeds, redemption fees and (2) ongoing costs, including management fees, distribution and/or service (12b-1) fees and other Fund expenses. This Example is intended to help you understand your ongoing costs (in dollars) of investing in the Fund and to compare these costs with the ongoing costs of investing in other mutual funds.
The Example is based on an investment of $1,000 invested at the beginning of the period and held for the entire period (May 1, 2015 to October 31, 2015).
Actual Expenses
The first line of the accompanying table for each class of the Fund provides information about actual account values and actual expenses. You may use the information in this line, together with the amount you invested, to estimate the expenses that you paid over the period. Simply divide your account value by $1,000.00 (for example, an $8,600 account value divided by $1,000.00 = 8.6), then multiply the result by the number in the first line for a class of the Fund under the heading entitled "Expenses Paid During Period" to estimate the expenses you paid on your account during this period. A small balance maintenance fee of $12.00 that is charged once a year may apply for certain accounts with a value of less than $2,000. This fee is not included in the table below. If it was, the estimate of expenses you paid during the period would be higher, and your ending account value lower, by this amount. In addition, the Fund, as a shareholder in the underlying Fidelity Central Funds, will indirectly bear its pro-rata share of the fees and expenses incurred by the underlying Fidelity Central Funds. These fees and expenses are not included in the Fund's annualized expense ratio used to calculate the expense estimate in the table below.
Hypothetical Example for Comparison Purposes
The second line of the accompanying table for each class of the Fund provides information about hypothetical account values and hypothetical expenses based on a Class' actual expense ratio and an assumed rate of return of 5% per year before expenses, which is not the Class' actual return. The hypothetical account values and expenses may not be used to estimate the actual ending account balance or expenses you paid for the period. You may use this information to compare the ongoing costs of investing in the Fund and other funds. To do so, compare this 5% hypothetical example with the 5% hypothetical examples that appear in the shareholder reports of the other funds. A small balance maintenance fee of $12.00 that is charged once a year may apply for certain accounts with a value of less than $2,000. This fee is not included in the table below. If it was, the estimate of expenses you paid during the period would be higher, and your ending account value lower, by this amount. In addition, the Fund, as a shareholder in the underlying Fidelity Central Funds, will indirectly bear its pro-rata share of the fees and expenses incurred by the underlying Fidelity Central Funds. These fees and expenses are not included in the Fund's annualized expense ratio used to calculate the expense estimate in the table below.
Please note that the expenses shown in the table are meant to highlight your ongoing costs only and do not reflect any transaction costs. Therefore, the second line of the table is useful in comparing ongoing costs only, and will not help you determine the relative total costs of owning different funds. In addition, if these transactional costs were included, your costs would have been higher.
Annual Report
Shareholder Expense Example - continued
| Annualized
Expense RatioB | Beginning
Account Value
May 1, 2015 | Ending
Account Value
October 31, 2015 | Expenses Paid
During PeriodC
May 1, 2015
to October 31, 2015 |
Class A | 1.25% | | | |
Actual | | $ 1,000.00 | $ 967.50 | $ 6.20 |
HypotheticalA | | $ 1,000.00 | $ 1,018.90 | $ 6.36 |
Class T | 1.56% | | | |
Actual | | $ 1,000.00 | $ 965.70 | $ 7.73 |
HypotheticalA | | $ 1,000.00 | $ 1,017.34 | $ 7.93 |
Class B | 2.05% | | | |
Actual | | $ 1,000.00 | $ 963.70 | $ 10.15 |
HypotheticalA | | $ 1,000.00 | $ 1,014.87 | $ 10.41 |
Class C | 2.05% | | | |
Actual | | $ 1,000.00 | $ 963.60 | $ 10.15 |
HypotheticalA | | $ 1,000.00 | $ 1,014.87 | $ 10.41 |
International Growth | .95% | | | |
Actual | | $ 1,000.00 | $ 968.50 | $ 4.71 |
HypotheticalA | | $ 1,000.00 | $ 1,020.42 | $ 4.84 |
Class I | .97% | | | |
Actual | | $ 1,000.00 | $ 968.50 | $ 4.81 |
HypotheticalA | | $ 1,000.00 | $ 1,020.32 | $ 4.94 |
Class Z | .84% | | | |
Actual | | $ 1,000.00 | $ 968.50 | $ 4.17 |
HypotheticalA | | $ 1,000.00 | $ 1,020.97 | $ 4.28 |
A 5% return per year before expenses
B Annualized expense ratio reflects expenses net of applicable fee waivers.
C Expenses are equal to each Class' annualized expense ratio, multiplied by the average account value over the period, multiplied by 184/365 (to reflect the one-half year period).
Annual Report
Investment Changes (Unaudited)
Annual Report
Investment Changes (Unaudited) - continued
Asset Allocation as of October 31, 2015 |
| % of fund's
net assets | % of fund's net assets
6 months ago |
Stocks | 97.7 | 98.1 |
Short-Term Investments and Net Other Assets (Liabilities) | 2.3 | 1.9 |
Top Ten Stocks as of October 31, 2015 |
| % of fund's
net assets | % of fund's net assets
6 months ago |
Novartis AG (Switzerland, Pharmaceuticals) | 3.7 | 3.9 |
Roche Holding AG (participation certificate) (Switzerland, Pharmaceuticals) | 3.6 | 3.8 |
Nestle SA (Switzerland, Food Products) | 3.0 | 3.6 |
Reckitt Benckiser Group PLC (United Kingdom, Household Products) | 2.8 | 2.2 |
Inditex SA (Spain, Specialty Retail) | 2.8 | 2.0 |
Anheuser-Busch InBev SA NV (Belgium, Beverages) | 2.6 | 2.9 |
Novo Nordisk A/S Series B sponsored ADR (Denmark, Pharmaceuticals) | 2.5 | 2.3 |
CSL Ltd. (Australia, Biotechnology) | 2.2 | 2.1 |
Visa, Inc. Class A (United States of America, IT Services) | 2.2 | 1.6 |
ASSA ABLOY AB (B Shares) (Sweden, Building Products) | 2.2 | 1.8 |
| 27.6 | |
Market Sectors as of October 31, 2015 |
| % of fund's
net assets | % of fund's net assets
6 months ago |
Health Care | 18.5 | 17.5 |
Financials | 18.1 | 16.6 |
Consumer Staples | 15.3 | 15.0 |
Consumer Discretionary | 15.1 | 15.2 |
Industrials | 12.5 | 14.9 |
Information Technology | 11.7 | 10.5 |
Materials | 6.0 | 5.9 |
Energy | 0.3 | 1.5 |
Telecommunication Services | 0.2 | 1.0 |
Annual Report
Investments October 31, 2015
Showing Percentage of Net Assets
Common Stocks - 97.7% |
| Shares | | Value |
Australia - 3.4% |
CSL Ltd. | 486,892 | | $ 32,363,861 |
Sydney Airport unit | 1,681,347 | | 7,683,937 |
Transurban Group unit | 1,384,277 | | 10,257,556 |
TOTAL AUSTRALIA | | 50,305,354 |
Austria - 0.9% |
Andritz AG | 251,621 | | 12,672,632 |
Bailiwick of Jersey - 1.3% |
Shire PLC | 259,100 | | 19,621,870 |
Belgium - 4.2% |
Anheuser-Busch InBev SA NV | 323,891 | | 38,648,165 |
KBC Groep NV | 391,998 | | 23,880,757 |
TOTAL BELGIUM | | 62,528,922 |
Canada - 0.3% |
Pason Systems, Inc. | 334,300 | | 4,918,883 |
Cayman Islands - 1.0% |
58.com, Inc. ADR (a)(d) | 79,700 | | 4,183,453 |
Alibaba Group Holding Ltd. sponsored ADR (a) | 127,500 | | 10,688,325 |
TOTAL CAYMAN ISLANDS | | 14,871,778 |
Denmark - 3.3% |
Jyske Bank A/S (Reg.) (a) | 224,900 | | 10,979,143 |
Novo Nordisk A/S Series B sponsored ADR | 698,800 | | 37,162,184 |
TOTAL DENMARK | | 48,141,327 |
Finland - 0.3% |
Tikkurila Oyj | 211,000 | | 3,872,516 |
France - 1.0% |
Safran SA | 194,500 | | 14,773,065 |
Germany - 3.1% |
Bayer AG | 164,100 | | 21,897,919 |
Linde AG | 134,277 | | 23,293,003 |
TOTAL GERMANY | | 45,190,922 |
Hong Kong - 1.8% |
AIA Group Ltd. | 4,403,400 | | 25,818,593 |
India - 0.7% |
Housing Development Finance Corp. Ltd. | 570,836 | | 10,934,415 |
Ireland - 2.7% |
CRH PLC sponsored ADR | 688,966 | | 18,850,110 |
Common Stocks - continued |
| Shares | | Value |
Ireland - continued |
James Hardie Industries PLC: | | | |
CDI | 978,142 | | $ 12,662,146 |
sponsored ADR (d) | 651,500 | | 8,567,225 |
TOTAL IRELAND | | 40,079,481 |
Israel - 0.3% |
Azrieli Group | 99,200 | | 3,886,828 |
Italy - 0.7% |
Azimut Holding SpA | 161,600 | | 3,889,928 |
Interpump Group SpA | 470,251 | | 6,929,294 |
TOTAL ITALY | | 10,819,222 |
Japan - 14.0% |
Astellas Pharma, Inc. | 1,867,900 | | 27,111,597 |
Coca-Cola Central Japan Co. Ltd. | 240,700 | | 3,382,888 |
DENSO Corp. | 642,300 | | 29,945,752 |
East Japan Railway Co. | 127,000 | | 12,074,600 |
Fast Retailing Co. Ltd. | 30,800 | | 11,250,698 |
Hoya Corp. | 336,800 | | 13,898,651 |
Japan Tobacco, Inc. | 333,200 | | 11,532,648 |
Keyence Corp. | 32,962 | | 17,160,297 |
Mitsui Fudosan Co. Ltd. | 645,000 | | 17,552,806 |
Nintendo Co. Ltd. | 46,900 | | 7,497,744 |
OSG Corp. | 185,500 | | 3,489,287 |
Seven Bank Ltd. | 2,950,000 | | 13,441,839 |
Shinsei Bank Ltd. | 4,579,000 | | 9,601,125 |
SHO-BOND Holdings Co. Ltd. | 182,600 | | 7,251,960 |
USS Co. Ltd. | 1,222,400 | | 21,580,109 |
TOTAL JAPAN | | 206,772,001 |
Kenya - 0.2% |
Safaricom Ltd. | 23,504,000 | | 3,305,070 |
Korea (South) - 0.9% |
BGFretail Co. Ltd. | 43,338 | | 6,452,666 |
NAVER Corp. | 13,427 | | 7,055,887 |
TOTAL KOREA (SOUTH) | | 13,508,553 |
Mexico - 0.6% |
Fomento Economico Mexicano S.A.B. de CV sponsored ADR | 83,555 | | 8,279,465 |
Netherlands - 1.0% |
ING Groep NV (Certificaten Van Aandelen) | 997,564 | | 14,518,414 |
Common Stocks - continued |
| Shares | | Value |
South Africa - 1.1% |
Clicks Group Ltd. | 524,756 | | $ 3,833,574 |
Naspers Ltd. Class N | 85,400 | | 12,508,548 |
TOTAL SOUTH AFRICA | | 16,342,122 |
Spain - 4.5% |
Amadeus IT Holding SA Class A | 344,400 | | 14,679,166 |
Hispania Activos Inmobiliarios SA (a) | 215,259 | | 3,242,921 |
Inditex SA (d) | 1,094,531 | | 41,048,812 |
Merlin Properties Socimi SA | 328,600 | | 4,213,283 |
Prosegur Compania de Seguridad SA (Reg.) | 725,749 | | 3,232,183 |
TOTAL SPAIN | | 66,416,365 |
Sweden - 6.1% |
ASSA ABLOY AB (B Shares) | 1,602,483 | | 31,878,324 |
Atlas Copco AB (A Shares) (d) | 460,909 | | 12,030,445 |
Fagerhult AB | 347,753 | | 5,942,721 |
H&M Hennes & Mauritz AB (B Shares) | 401,483 | | 15,615,617 |
Intrum Justitia AB | 189,300 | | 6,802,219 |
Svenska Handelsbanken AB (A Shares) | 1,283,620 | | 17,433,460 |
TOTAL SWEDEN | | 89,702,786 |
Switzerland - 13.6% |
Credit Suisse Group AG (e)(f) | 199,196 | | 4,584,662 |
Nestle SA | 575,034 | | 43,917,645 |
Novartis AG | 605,045 | | 54,810,263 |
Roche Holding AG (participation certificate) | 194,838 | | 52,898,295 |
Schindler Holding AG: | | | |
(participation certificate) | 87,617 | | 14,235,713 |
(Reg.) | 10,980 | | 1,786,215 |
UBS Group AG | 1,398,461 | | 28,011,174 |
TOTAL SWITZERLAND | | 200,243,967 |
Taiwan - 0.9% |
Taiwan Semiconductor Manufacturing Co. Ltd. | 3,093,000 | | 13,032,276 |
United Kingdom - 14.4% |
Associated British Foods PLC | 311,000 | | 16,564,569 |
Babcock International Group PLC | 627,284 | | 9,322,083 |
BAE Systems PLC | 1,392,900 | | 9,422,262 |
Berendsen PLC | 523,573 | | 8,273,186 |
Informa PLC | 1,098,226 | | 9,616,383 |
InterContinental Hotel Group PLC ADR | 754,296 | | 30,081,324 |
Johnson Matthey PLC | 188,977 | | 7,530,801 |
Common Stocks - continued |
| Shares | | Value |
United Kingdom - continued |
Lloyds Banking Group PLC | 10,251,500 | | $ 11,635,578 |
Prudential PLC | 1,005,426 | | 23,483,228 |
Reckitt Benckiser Group PLC | 429,145 | | 41,880,483 |
Rightmove PLC | 65,000 | | 3,846,832 |
Rolls-Royce Group PLC | 518,537 | | 5,483,278 |
SABMiller PLC | 446,166 | | 27,477,990 |
Shaftesbury PLC | 277,333 | | 4,020,981 |
Unite Group PLC | 413,776 | | 4,241,883 |
TOTAL UNITED KINGDOM | | 212,880,861 |
United States of America - 15.4% |
Alphabet, Inc. Class A (a) | 26,336 | | 19,419,903 |
Autoliv, Inc. (d) | 156,569 | | 18,982,426 |
Berkshire Hathaway, Inc. Class B (a) | 96,184 | | 13,082,948 |
BorgWarner, Inc. | 184,492 | | 7,899,947 |
China Biologic Products, Inc. (a) | 63,166 | | 7,197,134 |
Domino's Pizza, Inc. | 33,790 | | 3,604,379 |
Martin Marietta Materials, Inc. | 52,600 | | 8,160,890 |
MasterCard, Inc. Class A | 303,000 | | 29,993,970 |
McGraw Hill Financial, Inc. | 92,100 | | 8,532,144 |
Mohawk Industries, Inc. (a) | 97,900 | | 19,139,450 |
Moody's Corp. | 69,100 | | 6,644,656 |
Philip Morris International, Inc. | 206,108 | | 18,219,947 |
PriceSmart, Inc. | 73,800 | | 6,345,324 |
ResMed, Inc. | 128,000 | | 7,374,080 |
Sherwin-Williams Co. | 15,000 | | 4,002,450 |
SS&C Technologies Holdings, Inc. | 210,300 | | 15,593,745 |
Visa, Inc. Class A | 415,800 | | 32,257,764 |
TOTAL UNITED STATES OF AMERICA | | 226,451,157 |
TOTAL COMMON STOCKS (Cost $1,309,769,980) |
1,439,888,845
|
Nonconvertible Preferred Stocks - 0.0% |
| | | |
United Kingdom - 0.0% |
Rolls-Royce Group PLC
(Cost $73,994) | 48,068,379 | |
74,102
|
Money Market Funds - 7.4% |
| Shares | | Value |
Fidelity Cash Central Fund, 0.18% (b) | 35,048,921 | | $ 35,048,921 |
Fidelity Securities Lending Cash Central Fund, 0.19% (b)(c) | 73,928,962 | | 73,928,962 |
TOTAL MONEY MARKET FUNDS (Cost $108,977,883) |
108,977,883
|
TOTAL INVESTMENT PORTFOLIO - 105.1% (Cost $1,418,821,857) | | 1,548,940,830 |
NET OTHER ASSETS (LIABILITIES) - (5.1)% | | (75,061,785) |
NET ASSETS - 100% | $ 1,473,879,045 |
Legend |
(a) Non-income producing |
(b) Affiliated fund that is generally available only to investment companies and other accounts managed by Fidelity Investments. The rate quoted is the annualized seven-day yield of the fund at period end. A complete unaudited listing of the fund's holdings as of its most recent quarter end is available upon request. In addition, each Fidelity Central Fund's financial statements, which are not covered by the Fund's Report of Independent Registered Public Accounting Firm, are available on the SEC's website or upon request. |
(c) Investment made with cash collateral received from securities on loan. |
(d) Security or a portion of the security is on loan at period end. |
(e) Security or a portion of the security purchased on a delayed delivery or when-issued basis. Interest rate to be determined at settlement date. |
(f) Restricted securities - Investment in securities not registered under the Securities Act of 1933 (excluding 144A issues). At the end of the period, the value of restricted securities (excluding 144A issues) amounted to $4,584,662 or 0.3% of net assets. |
Additional information on each restricted holding is as follows: |
Security | Acquisition Date | Acquisition Cost |
Credit Suisse Group AG | 10/21/15 | $ 4,723,236 |
Affiliated Central Funds |
Information regarding fiscal year to date income earned by the Fund from investments in Fidelity Central Funds is as follows: |
Fund | Income earned |
Fidelity Cash Central Fund | $ 49,088 |
Fidelity Securities Lending Cash Central Fund | 197,556 |
Total | $ 246,644 |
Other Information |
Categorizations in the Schedule of Investments are based on country or territory of incorporation. |
The following is a summary of the inputs used, as of October 31, 2015, involving the Fund's assets and liabilities carried at fair value. The inputs or methodology used for valuing securities may not be an indication of the risk associated with investing in those securities. For more information on valuation inputs, and their aggregation into the levels used in the tables below, please refer to the Investment Valuation section in the accompanying Notes to Financial Statements. |
Valuation Inputs at Reporting Date: |
Description | Total | Level 1 | Level 2 | Level 3 |
Investments in Securities: | | | | |
Equities: | | | | |
Consumer Discretionary | $ 225,120,277 | $ 162,343,718 | $ 62,776,559 | $ - |
Consumer Staples | 226,535,364 | 87,173,535 | 139,361,829 | - |
Energy | 4,918,883 | 4,918,883 | - | - |
Financials | 263,630,766 | 129,145,060 | 134,485,706 | - |
Health Care | 274,335,854 | 73,631,317 | 200,704,537 | - |
Industrials | 183,615,062 | 81,300,793 | 102,314,269 | - |
Information Technology | 171,562,530 | 133,872,213 | 37,690,317 | - |
Materials | 86,939,141 | 74,276,995 | 12,662,146 | - |
Telecommunication Services | 3,305,070 | 3,305,070 | - | - |
Money Market Funds | 108,977,883 | 108,977,883 | - | - |
Total Investments in Securities: | $ 1,548,940,830 | $ 858,945,467 | $ 689,995,363 | $ - |
The following is a summary of transfers between Level 1 and Level 2 for the period ended October 31, 2015. Transfers are assumed to have occurred at the beginning of the period, and are primarily attributable to the valuation techniques used for foreign equity securities, as discussed in the accompanying Notes to Financial Statements: |
Transfers | Total |
Level 1 to Level 2 | $ 68,602,068 |
Level 2 to Level 1 | $ 15,033,001 |
See accompanying notes which are an integral part of the financial statements.
Annual Report
Statement of Assets and Liabilities
| | October 31, 2015 |
| | |
Assets | | |
Investment in securities, at value (including securities loaned of $71,231,511) - See accompanying schedule: Unaffiliated issuers (cost $1,309,843,974) | $ 1,439,962,947 | |
Fidelity Central Funds (cost $108,977,883) | 108,977,883 | |
Total Investments (cost $1,418,821,857) | | $ 1,548,940,830 |
Receivable for fund shares sold | | 2,613,468 |
Dividends receivable | | 3,193,478 |
Distributions receivable from Fidelity Central Funds | | 26,736 |
Prepaid expenses | | 3,605 |
Other receivables | | 11,410 |
Total assets | | 1,554,789,527 |
| | |
Liabilities | | |
Payable to custodian bank | $ 669 | |
Payable for investments purchased | | |
Regular delivery | 74,296 | |
Delayed delivery | 4,723,236 | |
Payable for fund shares redeemed | 878,160 | |
Accrued management fee | 840,888 | |
Distribution and service plan fees payable | 92,259 | |
Other affiliated payables | 269,569 | |
Other payables and accrued expenses | 102,443 | |
Collateral on securities loaned, at value | 73,928,962 | |
Total liabilities | | 80,910,482 |
| | |
Net Assets | | $ 1,473,879,045 |
Net Assets consist of: | | |
Paid in capital | | $ 1,371,308,764 |
Undistributed net investment income | | 9,047,261 |
Accumulated undistributed net realized gain (loss) on investments and foreign currency transactions | | (36,661,663) |
Net unrealized appreciation (depreciation) on investments and assets and liabilities in foreign currencies | | 130,184,683 |
Net Assets | | $ 1,473,879,045 |
See accompanying notes which are an integral part of the financial statements.
Annual Report
Financial Statements - continued
Statement of Assets and Liabilities - continued
| | October 31, 2015 |
Calculation of Maximum Offering Price | | |
Class A: | | |
Net Asset Value and redemption price per share ($184,878,255 ÷ 16,367,440 shares) | | $ 11.30 |
| | |
Maximum offering price per share (100/94.25 of $11.30) | | $ 11.99 |
Class T: | | |
Net Asset Value and redemption price per share ($28,832,624 ÷ 2,560,965 shares) | | $ 11.26 |
| | |
Maximum offering price per share (100/96.50 of $11.26) | | $ 11.67 |
Class B: | | |
Net Asset Value and offering price per share ($799,594 ÷ 71,668 shares)A | | $ 11.16 |
| | |
Class C: | | |
Net Asset Value and offering price per share ($52,378,157 ÷ 4,709,671 shares)A | | $ 11.12 |
| | |
International Growth: | | |
Net Asset Value, offering price and redemption price per share ($938,347,837 ÷ 82,424,899 shares) | | $ 11.38 |
| | |
Class I: | | |
Net Asset Value, offering price and redemption price per share ($267,745,321 ÷ 23,560,669 shares) | | $ 11.36 |
| | |
Class Z: | | |
Net Asset Value, offering price and redemption price per share ($897,257 ÷ 78,813 shares) | | $ 11.38 |
A Redemption price per share is equal to net asset value less any applicable contingent deferred sales charge.
See accompanying notes which are an integral part of the financial statements.
Annual Report
Statement of Operations
| Year ended October 31, 2015 |
Investment Income | | |
Dividends | | $ 24,663,808 |
Income from Fidelity Central Funds | | 246,644 |
Income before foreign taxes withheld | | 24,910,452 |
Less foreign taxes withheld | | (2,081,814) |
Total income | | 22,828,638 |
| | |
Expenses | | |
Management fee | | |
Basic fee | $ 8,327,944 | |
Performance adjustment | 167,926 | |
Transfer agent fees | 2,302,155 | |
Distribution and service plan fees | 939,382 | |
Accounting and security lending fees | 550,149 | |
Custodian fees and expenses | 146,301 | |
Independent trustees' compensation | 4,871 | |
Registration fees | 185,556 | |
Audit | 69,990 | |
Legal | 2,556 | |
Miscellaneous | 14,108 | |
Total expenses before reductions | 12,710,938 | |
Expense reductions | (87,519) | 12,623,419 |
Net investment income (loss) | | 10,205,219 |
Realized and Unrealized Gain (Loss) | | |
Net realized gain (loss) on: | | |
Investment securities: | | |
Unaffiliated issuers (net of foreign taxes of $16,052) | (27,244,971) | |
Foreign currency transactions | (218,206) | |
Total net realized gain (loss) | | (27,463,177) |
Change in net unrealized appreciation (depreciation) on: Investment securities (net of increase in deferred foreign taxes of $6,961) | 41,313,127 | |
Assets and liabilities in foreign currencies | 137,123 | |
Total change in net unrealized appreciation (depreciation) | | 41,450,250 |
Net gain (loss) | | 13,987,073 |
Net increase (decrease) in net assets resulting from operations | | $ 24,192,292 |
See accompanying notes which are an integral part of the financial statements.
Annual Report
Financial Statements - continued
Statement of Changes in Net Assets
| Year ended
October 31,
2015 | Year ended
October 31,
2014 |
Increase (Decrease) in Net Assets | | |
Operations | | |
Net investment income (loss) | $ 10,205,219 | $ 8,064,649 |
Net realized gain (loss) | (27,463,177) | (8,929,624) |
Change in net unrealized appreciation (depreciation) | 41,450,250 | 17,872,842 |
Net increase (decrease) in net assets resulting from operations | 24,192,292 | 17,007,867 |
Distributions to shareholders from net investment income | (7,019,924) | (2,592,643) |
Distributions to shareholders from net realized gain | - | (513,441) |
Total distributions | (7,019,924) | (3,106,084) |
Share transactions - net increase (decrease) | 519,861,476 | 336,569,228 |
Redemption fees | 54,094 | 42,228 |
Total increase (decrease) in net assets | 537,087,938 | 350,513,239 |
| | |
Net Assets | | |
Beginning of period | 936,791,107 | 586,277,868 |
End of period (including undistributed net investment income of $9,047,261 and undistributed net investment income of $6,829,762, respectively) | $ 1,473,879,045 | $ 936,791,107 |
See accompanying notes which are an integral part of the financial statements.
Annual Report
Financial Highlights - Fidelity International Growth Fund Class A
Years ended October 31, | 2015 | 2014 | 2013 | 2012 | 2011 |
Selected Per-Share Data | | | | | |
Net asset value, beginning of period | $ 11.01 | $ 10.78 | $ 8.91 | $ 8.09 | $ 8.38 |
Income from Investment Operations | | | | |
Net investment income (loss) C | .07 | .09 | .08 | .08 | .08 |
Net realized and unrealized gain (loss) | .28 | .18 | 1.88 | .81 | (.31) |
Total from investment operations | .35 | .27 | 1.96 | .89 | (.23) |
Distributions from net investment income | (.06) | (.03) | (.08) | (.06) | (.05) |
Distributions from net realized gain | - | (.01) | (.01) | (.01) | (.01) |
Total distributions | (.06) | (.04) | (.09) | (.07) | (.06) |
Redemption fees added to paid in capitalC, G | - | - | - | - | - |
Net asset value, end of period | $ 11.30 | $ 11.01 | $ 10.78 | $ 8.91 | $ 8.09 |
Total ReturnA, B | 3.20% | 2.54% | 22.18% | 11.10% | (2.76)% |
Ratios to Average Net AssetsD, F | | | | | |
Expenses before reductions | 1.26% | 1.35% | 1.44% | 1.58% | 1.77% |
Expenses net of fee waivers, if any | 1.26% | 1.35% | 1.43% | 1.45% | 1.45% |
Expenses net of all reductions | 1.25% | 1.34% | 1.42% | 1.44% | 1.43% |
Net investment income (loss) | .66% | .84% | .80% | .99% | .92% |
Supplemental Data | | | | | |
Net assets, end of period (000 omitted) | $ 184,878 | $ 119,017 | $ 74,595 | $ 21,874 | $ 6,352 |
Portfolio turnover rateE | 26% | 27% | 32% | 32% | 68% |
A Total returns would have been lower if certain expenses had not been reduced during the applicable periods shown.
B Total returns do not include the effect of the sales charges.
C Calculated based on average shares outstanding during the period.
D Fees and expenses of any underlying Fidelity Central Funds are not included in the Fund's expense ratio. The Fund indirectly bears its proportionate share of the expenses of any underlying Fidelity Central Funds.
E Amount does not include the portfolio activity of any underlying Fidelity Central Funds.
F Expense ratios reflect operating expenses of the class. Expenses before reductions do not reflect amounts reimbursed by the investment adviser or reductions from brokerage service arrangements or reductions from other expense offset arrangements and do not represent the amount paid by the class during periods when reimbursements or reductions occur. Expenses net of fee waivers reflect expenses after reimbursement by the investment adviser but prior to reductions from brokerage service arrangements or other expense offset arrangements. Expenses net of all reductions represent the net expenses paid by the class.
G Amount represents less than $.005 per share.
See accompanying notes which are an integral part of the financial statements.
Annual Report
Financial Highlights - Fidelity International Growth Fund Class T
Years ended October 31, | 2015 | 2014 | 2013 | 2012 | 2011 |
Selected Per-Share Data | | | | | |
Net asset value, beginning of period | $ 10.96 | $ 10.75 | $ 8.89 | $ 8.08 | $ 8.38 |
Income from Investment Operations | | | | |
Net investment income (loss) C | .04 | .06 | .05 | .06 | .06 |
Net realized and unrealized gain (loss) | .27 | .18 | 1.88 | .81 | (.31) |
Total from investment operations | .31 | .24 | 1.93 | .87 | (.25) |
Distributions from net investment income | (.01) | (.02) | (.07) | (.05) | (.04) |
Distributions from net realized gain | - | (.01) | (.01) | (.01) | (.01) |
Total distributions | (.01) | (.03) | (.07) H | (.06) | (.05) |
Redemption fees added to paid in capitalC, G | - | - | - | - | - |
Net asset value, end of period | $ 11.26 | $ 10.96 | $ 10.75 | $ 8.89 | $ 8.08 |
Total ReturnA, B | 2.85% | 2.21% | 21.91% | 10.82% | (3.03)% |
Ratios to Average Net AssetsD, F | | | | | |
Expenses before reductions | 1.58% | 1.65% | 1.69% | 1.85% | 2.03% |
Expenses net of fee waivers, if any | 1.58% | 1.65% | 1.69% | 1.70% | 1.70% |
Expenses net of all reductions | 1.58% | 1.65% | 1.68% | 1.69% | 1.68% |
Net investment income (loss) | .33% | .53% | .54% | .74% | .67% |
Supplemental Data | | | | | |
Net assets, end of period (000 omitted) | $ 28,833 | $ 26,369 | $ 23,118 | $ 10,690 | $ 2,917 |
Portfolio turnover rateE | 26% | 27% | 32% | 32% | 68% |
A Total returns would have been lower if certain expenses had not been reduced during the applicable periods shown.
B Total returns do not include the effect of the sales charges.
C Calculated based on average shares outstanding during the period.
D Fees and expenses of any underlying Fidelity Central Funds are not included in the Fund's expense ratio. The Fund indirectly bears its proportionate share of the expenses of any underlying Fidelity Central Funds.
E Amount does not include the portfolio activity of any underlying Fidelity Central Funds.
F Expense ratios reflect operating expenses of the class. Expenses before reductions do not reflect amounts reimbursed by the investment adviser or reductions from brokerage service arrangements or reductions from other expense offset arrangements and do not represent the amount paid by the class during periods when reimbursements or reductions occur. Expenses net of fee waivers reflect expenses after reimbursement by the investment adviser but prior to reductions from brokerage service arrangements or other expense offset arrangements. Expenses net of all reductions represent the net expenses paid by the class.
G Amount represents less than $.005 per share.
H Total distributions of $.07 per share is comprised of distributions from net investment income of $0.69 and distributions from net realized gain of $.005 per share.
See accompanying notes which are an integral part of the financial statements.
Annual Report
Financial Highlights - Fidelity International Growth Fund Class B
Years ended October 31, | 2015 | 2014 | 2013 | 2012 | 2011 |
Selected Per-Share Data | | | | | |
Net asset value, beginning of period | $ 10.91 | $ 10.73 | $ 8.88 | $ 8.06 | $ 8.36 |
Income from Investment Operations | | | | |
Net investment income (loss) C | (.02) | - G | - G | .02 | .01 |
Net realized and unrealized gain (loss) | .27 | .19 | 1.89 | .80 | (.30) |
Total from investment operations | .25 | .19 | 1.89 | .82 | (.29) |
Distributions from net investment income | - | - | (.03) | - | (.01) |
Distributions from net realized gain | - | (.01) | (.01) | - | - G |
Total distributions | - | (.01) | (.04) | - | (.01) |
Redemption fees added to paid in capitalC, G | - | - | - | - | - |
Net asset value, end of period | $ 11.16 | $ 10.91 | $ 10.73 | $ 8.88 | $ 8.06 |
Total ReturnA, B | 2.29% | 1.76% | 21.35% | 10.17% | (3.47)% |
Ratios to Average Net AssetsD, F | | | | | |
Expenses before reductions | 2.07% | 2.14% | 2.19% | 2.35% | 2.55% |
Expenses net of fee waivers, if any | 2.07% | 2.14% | 2.18% | 2.20% | 2.20% |
Expenses net of all reductions | 2.06% | 2.14% | 2.17% | 2.19% | 2.18% |
Net investment income (loss) | (.15)% | .04% | .05% | .24% | .17% |
Supplemental Data | | | | | |
Net assets, end of period (000 omitted) | $ 800 | $ 1,404 | $ 1,579 | $ 1,116 | $ 473 |
Portfolio turnover rateE | 26% | 27% | 32% | 32% | 68% |
A Total returns would have been lower if certain expenses had not been reduced during the applicable periods shown.
B Total returns do not include the effect of the contingent deferred sales charge.
C Calculated based on average shares outstanding during the period.
D Fees and expenses of any underlying Fidelity Central Funds are not included in the Fund's expense ratio. The Fund indirectly bears its proportionate share of the expenses of any underlying Fidelity Central Funds.
E Amount does not include the portfolio activity of any underlying Fidelity Central Funds.
F Expense ratios reflect operating expenses of the class. Expenses before reductions do not reflect amounts reimbursed by the investment adviser or reductions from brokerage service arrangements or reductions from other expense offset arrangements and do not represent the amount paid by the class during periods when reimbursements or reductions occur. Expenses net of fee waivers reflect expenses after reimbursement by the investment adviser but prior to reductions from brokerage service arrangements or other expense offset arrangements. Expenses net of all reductions represent the net expenses paid by the class.
G Amount represents less than $.005 per share.
See accompanying notes which are an integral part of the financial statements.
Annual Report
Financial Highlights - Fidelity International Growth Fund Class C
Years ended October 31, | 2015 | 2014 | 2013 | 2012 | 2011 |
Selected Per-Share Data | | | | | |
Net asset value, beginning of period | $ 10.87 | $ 10.69 | $ 8.84 | $ 8.03 | $ 8.34 |
Income from Investment Operations | | | | |
Net investment income (loss) C | (.02) | .01 | .01 | .02 | .01 |
Net realized and unrealized gain (loss) | .27 | .18 | 1.87 | .80 | (.31) |
Total from investment operations | .25 | .19 | 1.88 | .82 | (.30) |
Distributions from net investment income | - | - | (.02) | (.01) | (.01) |
Distributions from net realized gain | - | (.01) | (.01) | (.01) | (.01) |
Total distributions | - | (.01) | (.03) | (.01) I | (.01) H |
Redemption fees added to paid in capitalC, G | - | - | - | - | - |
Net asset value, end of period | $ 11.12 | $ 10.87 | $ 10.69 | $ 8.84 | $ 8.03 |
Total ReturnA, B | 2.30% | 1.77% | 21.29% | 10.27% | (3.57)% |
Ratios to Average Net AssetsD, F | | | | | |
Expenses before reductions | 2.06% | 2.12% | 2.19% | 2.33% | 2.52% |
Expenses net of fee waivers, if any | 2.06% | 2.12% | 2.18% | 2.20% | 2.20% |
Expenses net of all reductions | 2.05% | 2.12% | 2.17% | 2.19% | 2.18% |
Net investment income (loss) | (.15)% | .06% | .05% | .24% | .17% |
Supplemental Data | | | | | |
Net assets, end of period (000 omitted) | $ 52,378 | $ 32,737 | $ 17,196 | $ 5,648 | $ 2,767 |
Portfolio turnover rateE | 26% | 27% | 32% | 32% | 68% |
A Total returns would have been lower if certain expenses had not been reduced during the applicable periods shown.
B Total returns do not include the effect of the contingent deferred sales charge.
C Calculated based on average shares outstanding during the period.
D Fees and expenses of any underlying Fidelity Central Funds are not included in the Fund's expense ratio. The Fund indirectly bears its proportionate share of the expenses of any underlying Fidelity Central Funds.
E Amount does not include the portfolio activity of any underlying Fidelity Central Funds.
F Expense ratios reflect operating expenses of the class. Expenses before reductions do not reflect amounts reimbursed by the investment adviser or reductions from brokerage service arrangements or reductions from other expense offset arrangements and do not represent the amount paid by the class during periods when reimbursements or reductions occur. Expenses net of fee waivers reflect expenses after reimbursement by the investment adviser but prior to reductions from brokerage service arrangements or other expense offset arrangements. Expenses net of all reductions represent the net expenses paid by the class.
G Amount represents less than $.005 per share.
H Total distributions of $.01 per share is comprised of distributions from net investment income of $.008 and distributions from net realized gain of $.005 per share.
I Total distributions of $.01 per share is comprised of distributions from net investment income of $.007 and distributions from net realized gain of $.006 per share.
See accompanying notes which are an integral part of the financial statements.
Annual Report
Financial Highlights - Fidelity International Growth Fund
Years ended October 31, | 2015 | 2014 | 2013 | 2012 | 2011 |
Selected Per-Share Data | | | | | |
Net asset value, beginning of period | $ 11.10 | $ 10.84 | $ 8.95 | $ 8.12 | $ 8.40 |
Income from Investment Operations | | | | |
Net investment income (loss) B | .11 | .13 | .11 | .11 | .10 |
Net realized and unrealized gain (loss) | .26 | .19 | 1.88 | .81 | (.30) |
Total from investment operations | .37 | .32 | 1.99 | .92 | (.20) |
Distributions from net investment income | (.09) | (.05) | (.10) | (.08) | (.07) |
Distributions from net realized gain | - | (.01) | (.01) | (.01) | (.01) |
Total distributions | (.09) | (.06) | (.10) G | (.09) | (.08) |
Redemption fees added to paid in capitalB, F | - | - | - | - | - |
Net asset value, end of period | $ 11.38 | $ 11.10 | $ 10.84 | $ 8.95 | $ 8.12 |
Total ReturnA | 3.36% | 2.96% | 22.48% | 11.41% | (2.47)% |
Ratios to Average Net AssetsC, E | | | | | |
Expenses before reductions | .97% | 1.04% | 1.13% | 1.28% | 1.52% |
Expenses net of fee waivers, if any | .97% | 1.04% | 1.13% | 1.20% | 1.20% |
Expenses net of all reductions | .96% | 1.04% | 1.11% | 1.19% | 1.18% |
Net investment income (loss) | .94% | 1.14% | 1.11% | 1.24% | 1.17% |
Supplemental Data | | | | | |
Net assets, end of period (000 omitted) | $ 938,348 | $ 635,607 | $ 430,914 | $ 149,526 | $ 53,437 |
Portfolio turnover rateD | 26% | 27% | 32% | 32% | 68% |
A Total returns would have been lower if certain expenses had not been reduced during the applicable periods shown.
B Calculated based on average shares outstanding during the period.
C Fees and expenses of any underlying Fidelity Central Funds are not included in the Fund's expense ratio. The Fund indirectly bears its proportionate share of the expenses of any underlying Fidelity Central Funds.
D Amount does not include the portfolio activity of any underlying Fidelity Central Funds.
E Expense ratios reflect operating expenses of the class. Expenses before reductions do not reflect amounts reimbursed by the investment adviser or reductions from brokerage service arrangements or reductions from other expense offset arrangements and do not represent the amount paid by the class during periods when reimbursements or reductions occur. Expenses net of fee waivers reflect expenses after reimbursement by the investment adviser but prior to reductions from brokerage service arrangements or other expense offset arrangements. Expenses net of all reductions represent the net expenses paid by the class.
F Amount represents less than $.005 per share.
G Total distributions of $.10 per share is comprised of distributions from net investment income of $.097 and distributions from net realized gain of $.005 per share.
See accompanying notes which are an integral part of the financial statements.
Annual Report
Financial Highlights - Fidelity International Growth Fund Class I
Years ended October 31, | 2015 | 2014 | 2013 | 2012 | 2011 |
Selected Per-Share Data | | | | | |
Net asset value, beginning of period | $ 11.08 | $ 10.84 | $ 8.94 | $ 8.12 | $ 8.40 |
Income from Investment Operations | | | | |
Net investment income (loss) B | .11 | .13 | .11 | .10 | .10 |
Net realized and unrealized gain (loss) | .27 | .18 | 1.90 | .81 | (.30) |
Total from investment operations | .38 | .31 | 2.01 | .91 | (.20) |
Distributions from net investment income | (.10) | (.06) | (.10) | (.08) | (.07) |
Distributions from net realized gain | - | (.01) | (.01) | (.01) | (.01) |
Total distributions | (.10) | (.07) | (.11) | (.09) | (.08) |
Redemption fees added to paid in capitalB, F | - | - | - | - | - |
Net asset value, end of period | $ 11.36 | $ 11.08 | $ 10.84 | $ 8.94 | $ 8.12 |
Total ReturnA | 3.41% | 2.84% | 22.66% | 11.28% | (2.47)% |
Ratios to Average Net AssetsC, E | | | | | |
Expenses before reductions | .98% | 1.04% | 1.11% | 1.27% | 1.50% |
Expenses net of fee waivers, if any | .98% | 1.04% | 1.11% | 1.20% | 1.20% |
Expenses net of all reductions | .97% | 1.04% | 1.09% | 1.19% | 1.18% |
Net investment income (loss) | .94% | 1.14% | 1.13% | 1.24% | 1.17% |
Supplemental Data | | | | | |
Net assets, end of period (000 omitted) | $ 267,745 | $ 121,554 | $ 38,771 | $ 3,992 | $ 493 |
Portfolio turnover rateD | 26% | 27% | 32% | 32% | 68% |
A Total returns would have been lower if certain expenses had not been reduced during the applicable periods shown.
B Calculated based on average shares outstanding during the period.
C Fees and expenses of any underlying Fidelity Central Funds are not included in the Fund's expense ratio. The Fund indirectly bears its proportionate share of the expenses of any underlying Fidelity Central Funds.
D Amount does not include the portfolio activity of any underlying Fidelity Central Funds.
E Expense ratios reflect operating expenses of the class. Expenses before reductions do not reflect amounts reimbursed by the investment adviser or reductions from brokerage service arrangements or reductions from other expense offset arrangements and do not represent the amount paid by the class during periods when reimbursements or reductions occur. Expenses net of fee waivers reflect expenses after reimbursement by the investment adviser but prior to reductions from brokerage service arrangements or other expense offset arrangements. Expenses net of all reductions represent the net expenses paid by the class.
F Amount represents less than $.005 per share.
See accompanying notes which are an integral part of the financial statements.
Annual Report
Financial Highlights - Fidelity International Growth Fund Class Z
Years ended October 31, | 2015 | 2014 | 2013 G |
Selected Per-Share Data | | | |
Net asset value, beginning of period | $ 11.10 | $ 10.84 | $ 10.26 |
Income from Investment Operations | | | |
Net investment income (loss) D | .12 | .14 | .02 |
Net realized and unrealized gain (loss) | .27 | .19 | .56 |
Total from investment operations | .39 | .33 | .58 |
Distributions from net investment income | (.11) | (.06) | - |
Distributions from net realized gain | - | (.01) | - |
Total distributions | (.11) | (.07) | - |
Redemption fees added to paid in capitalD, I | - | - | - |
Net asset value, end of period | $ 11.38 | $ 11.10 | $ 10.84 |
Total ReturnB, C | 3.52% | 3.07% | 5.65% |
Ratios to Average Net AssetsE, H | | | |
Expenses before reductions | .84% | .88% | .94%A |
Expenses net of fee waivers, if any | .84% | .88% | .94%A |
Expenses net of all reductions | .83% | .88% | .93%A |
Net investment income (loss) | 1.07% | 1.30% | .65%A |
Supplemental Data | | | |
Net assets, end of period (000 omitted) | $ 897 | $ 104 | $ 106 |
Portfolio turnover rateF | 26% | 27% | 32% |
A Annualized
B Total returns for periods of less than one year are not annualized.
C Total returns would have been lower if certain expenses had not been reduced during the applicable periods shown.
D Calculated based on average shares outstanding during the period.
E Fees and expenses of any underlying Fidelity Central Funds are not included in the Fund's expense ratio. The Fund indirectly bears its proportionate share of the expenses of any underlying Fidelity Central Funds.
F Amount does not include the portfolio activity of any underlying Fidelity Central Funds.
G For the period August 13, 2013 (commencement of sale of shares) to October 31, 2013.
H Expense ratios reflect operating expenses of the class. Expenses before reductions do not reflect amounts reimbursed by the investment adviser or reductions from brokerage service arrangements or reductions from other expense offset arrangements and do not represent the amount paid by the class during periods when reimbursements or reductions occur. Expenses net of fee waivers reflect expenses after reimbursement by the investment adviser but prior to reductions from brokerage service arrangements or other expense offset arrangements. Expenses net of all reductions represent the net expenses paid by the class.
I Amount represents less than $.005 per share.
See accompanying notes which are an integral part of the financial statements.
Annual Report
For the period ended October 31, 2015
1. Organization.
Fidelity International Growth Fund (the Fund) is a fund of Fidelity Investment Trust (the Trust) and is authorized to issue an unlimited number of shares. The Trust is registered under the Investment Company Act of 1940, as amended (the 1940 Act), as an open-end management investment company organized as a Massachusetts business trust. The Fund offers Class A, Class T, Class C, International Growth, Class I (formerly Institutional Class) and Class Z shares, each of which, along with Class B shares, has equal rights as to assets and voting privileges. Class B shares are closed to new accounts and additional purchases, except for exchanges and reinvestments. Each class has exclusive voting rights with respect to matters that affect that class. Class B shares will automatically convert to Class A shares after a holding period of seven years from the initial date of purchase.
2. Investments in Fidelity Central Funds.
The Fund invests in Fidelity Central Funds, which are open-end investment companies generally available only to other investment companies and accounts managed by the investment adviser and its affiliates. The Fund's Schedule of Investments lists each of the Fidelity Central Funds held as of period end, if any, as an investment of the Fund, but does not include the underlying holdings of each Fidelity Central Fund. As an Investing Fund, the Fund indirectly bears its proportionate share of the expenses of the underlying Fidelity Central Funds.
The Money Market Central Funds seek preservation of capital and current income and are managed by Fidelity Investments Money Management, Inc. (FIMM), an affiliate of the investment adviser. Annualized expenses of the Money Market Central Funds as of their most recent shareholder report date are less than .005%.
A complete unaudited list of holdings for each Fidelity Central Fund is available upon request or at the Securities and Exchange Commission (the SEC) website at www.sec.gov. In addition, the financial statements of the Fidelity Central Funds, which are not covered by the Fund's Report of Independent Registered Public Accounting Firm, are available on the SEC website or upon request.
3. Significant Accounting Policies.
The financial statements have been prepared in conformity with accounting principles generally accepted in the United States of America (GAAP), which require management to make certain estimates and assumptions at the date of the financial statements. Actual results could differ from those estimates. Subsequent events, if any, through the
Annual Report
Notes to Financial Statements - continued
3. Significant Accounting Policies - continued
date that the financial statements were issued have been evaluated in the preparation of the financial statements. The following summarizes the significant accounting policies of the Fund:
Investment Valuation. Investments are valued as of 4:00 p.m. Eastern time on the last calendar day of the period. The Board of Trustees (the Board) has delegated the day to day responsibility for the valuation of the Fund's investments to the Fidelity Management & Research Company (FMR) Fair Value Committee (the Committee). In accordance with valuation policies and procedures approved by the Board, the Fund attempts to obtain prices from one or more third party pricing vendors or brokers to value its investments. When current market prices, quotations or currency exchange rates are not readily available or reliable, investments will be fair valued in good faith by the Committee, in accordance with procedures adopted by the Board. Factors used in determining fair value vary by investment type and may include market or investment specific events. The frequency with which these procedures are used cannot be predicted and they may be utilized to a significant extent. The Committee oversees the Fund's valuation policies and procedures and reports to the Board on the Committee's activities and fair value determinations. The Board monitors the appropriateness of the procedures used in valuing the Fund's investments and ratifies the fair value determinations of the Committee.
The Fund categorizes the inputs to valuation techniques used to value its investments into a disclosure hierarchy consisting of three levels as shown below:
Level 1 - quoted prices in active markets for identical investments
Level 2 - other significant observable inputs (including quoted prices for similar investments, interest rates, prepayment speeds, etc.)
Level 3 - unobservable inputs (including the Fund's own assumptions based on the best information available)
Valuation techniques used to value the Fund's investments by major category are as follows:
Equity securities, including restricted securities, for which market quotations are readily available, are valued at the last reported sale price or official closing price as reported by a third party pricing vendor on the primary market or exchange on which they are traded and are categorized as Level 1 in the hierarchy. In the event there were no sales during the day or closing prices are not available, securities are valued at the last quoted bid price or may be valued using the last available price and are generally categorized as
Annual Report
3. Significant Accounting Policies - continued
Investment Valuation - continued
Level 2 in the hierarchy. For foreign equity securities, when market or security specific events arise, comparisons to the valuation of American Depositary Receipts (ADRs), futures contracts, Exchange-Traded Funds (ETFs) and certain indexes as well as quoted prices for similar securities may be used and would be categorized as Level 2 in the hierarchy. Utilizing these techniques may result in transfers between Level 1 and Level 2. For equity securities, including restricted securities, where observable inputs are limited, assumptions about market activity and risk are used and these securities may be categorized as Level 3 in the hierarchy.
Investments in open-end mutual funds, including the Fidelity Central Funds, are valued at their closing net asset value (NAV) each business day and are categorized as Level 1 in the hierarchy.
Changes in valuation techniques may result in transfers in or out of an assigned level within the disclosure hierarchy. The aggregate value of investments by input level as of October 31, 2015, including information on transfers between Levels 1 and 2, is included at the end of the Fund's Schedule of Investments.
Foreign Currency. The Fund may use foreign currency contracts to facilitate transactions in foreign-denominated securities. Gains and losses from these transactions may arise from changes in the value of the foreign currency or if the counterparties do not perform under the contracts' terms.
Foreign-denominated assets, including investment securities, and liabilities are translated into U.S. dollars at the exchange rates at period end. Purchases and sales of investment securities, income and dividends received and expenses denominated in foreign currencies are translated into U.S. dollars at the exchange rate in effect on the transaction date.
The effects of exchange rate fluctuations on investments are included with the net realized and unrealized gain (loss) on investment securities. Other foreign currency transactions resulting in realized and unrealized gain (loss) are disclosed separately.
Investment Transactions and Income. For financial reporting purposes, the Fund's investment holdings and NAV include trades executed through the end of the last business day of the period. The NAV per share for processing shareholder transactions is calculated as of the close of business of the New York Stock Exchange (NYSE), normally 4:00 p.m. Eastern time and includes trades executed through the end of the prior business day. Gains and losses on securities sold are determined on the basis of identified cost and may include proceeds received from litigation. Dividend income is recorded on
Annual Report
Notes to Financial Statements - continued
3. Significant Accounting Policies - continued
Investment Transactions and Income - continued
the ex-dividend date, except for certain dividends from foreign securities where the ex-dividend date may have passed, which are recorded as soon as the Fund is informed of the ex-dividend date. Non-cash dividends included in dividend income, if any, are recorded at the fair market value of the securities received. Income and capital gain distributions from Fidelity Central Funds, if any, are recorded on the ex-dividend date. Distributions received on securities that represent a return of capital or capital gain are recorded as a reduction of cost of investments and/or as a realized gain. Subsequent to ex-dividend date the Fund determines the components of these distributions, based upon receipt of tax filings or other correspondence relating to the underlying investment. Interest income is accrued as earned and includes coupon interest and amortization of premium and accretion of discount on debt securities as applicable. Investment income is recorded net of foreign taxes withheld where recovery of such taxes is uncertain.
Class Allocations and Expenses. Investment income, realized and unrealized capital gains and losses, common expenses of the Fund, and certain fund-level expense reductions, if any, are allocated daily on a pro-rata basis to each class based on the relative net assets of each class to the total net assets of the Fund. Each class differs with respect to transfer agent and distribution and service plan fees incurred. Certain expense reductions may also differ by class. For the reporting period, the allocated portion of income and expenses to each class as a percent of its average net assets may vary due to the timing of recording these transactions in relation to fluctuating net assets of the classes. Expenses directly attributable to a fund are charged to that fund. Expenses attributable to more than one fund are allocated among the respective funds on the basis of relative net assets or other appropriate methods. Expense estimates are accrued in the period to which they relate and adjustments are made when actual amounts are known.
Income Tax Information and Distributions to Shareholders. Each year, the Fund intends to qualify as a regulated investment company under Subchapter M of the Internal Revenue Code, including distributing substantially all of its taxable income and realized gains. As a result, no provision for U.S. Federal income taxes is required. As of October 31, 2015, the Fund did not have any unrecognized tax benefits in the financial statements; nor is the Fund aware of any tax positions for which it is reasonably possible that the total amounts of unrecognized tax benefits will significantly change in the next twelve months. The Fund files a U.S. federal tax return, in addition to state and local tax returns as required. The Fund's federal income tax returns are subject to examination by the Internal Revenue Service (IRS) for a period of three fiscal years after they are filed. State and local tax returns may be subject to examination for an additional fiscal year depending on the jurisdiction. Foreign taxes are provided for based on the Fund's understanding of the tax rules and rates that exist in the foreign markets in which it
Annual Report
3. Significant Accounting Policies - continued
Income Tax Information and Distributions to Shareholders - continued
invests. The Fund is subject to a tax imposed on capital gains by certain countries in which it invests. An estimated deferred tax liability for net unrealized appreciation on the applicable securities is included in Other payables and accrued expenses on the Statement of Assets & Liabilities.
Distributions are declared and recorded on the ex-dividend date. Income dividends and capital gain distributions are declared separately for each class. Income and capital gain distributions are determined in accordance with income tax regulations, which may differ from GAAP. In addition, the Fund claimed a portion of the payment made to redeeming shareholders as a distribution for income tax purposes.
Capital accounts within the financial statements are adjusted for permanent book-tax differences. These adjustments have no impact on net assets or the results of operations. Capital accounts are not adjusted for temporary book-tax differences which will reverse in a subsequent period.
Book-tax differences are primarily due to foreign currency transactions, certain foreign taxes, passive foreign investment companies (PFIC), partnerships, capital loss carryforwards, and losses deferred due to wash sales.
The federal tax cost of investment securities and unrealized appreciation (depreciation) as of period end were as follows:
Gross unrealized appreciation | $ 171,926,225 |
Gross unrealized depreciation | (45,542,097) |
Net unrealized appreciation (depreciation) on securities | $ 126,384,128 |
Tax Cost | $ 1,422,556,702 |
The tax-based components of distributable earnings as of period end were as follows:
Undistributed ordinary income | $ 9,875,277 |
Capital loss carryforward | $ (33,754,835) |
Net unrealized appreciation (depreciation) on securities and other investments | $ 126,454,576 |
Capital loss carryforwards are only available to offset future capital gains of the Fund to the extent provided by regulations and may be limited. Under the Regulated Investment Company Modernization Act of 2010 (the Act), the Fund is permitted to carry forward capital losses incurred in taxable years beginning after December 22, 2010 for an unlimited period and such capital losses are required to be used prior to any losses that expire.
Annual Report
Notes to Financial Statements - continued
3. Significant Accounting Policies - continued
Income Tax Information and Distributions to Shareholders - continued
The capital loss carryforward information presented below, including any applicable limitation, is estimated as of fiscal period end and is subject to adjustment.
No expiration | |
Short-term | (26,434,969) |
Long-term | (7,319,866) |
Total no expiration | (33,754,835) |
The tax character of distributions paid was as follows:
| October 31, 2015 | October 31, 2014 |
Ordinary Income | $ 7,019,924 | $ 2,592,642 |
Long-term Capital Gains | - | 513,442 |
Total | $ 7,019,924 | $ 3,106,084 |
Short-Term Trading (Redemption) Fees. Shares held by investors in the Fund less than 30 days may have been subject to a redemption fee equal to 1.00% of the NAV of shares redeemed. All redemption fees, which reduce the proceeds of the shareholder redemption, are retained by the Fund and accounted for as an addition to paid in capital.
Delayed Delivery Transactions and When-Issued Securities. During the period, the Fund transacted in securities on a delayed delivery or when-issued basis. Payment and delivery may take place after the customary settlement period for that security. The price of the underlying securities and the date when the securities will be delivered and paid for are fixed at the time the transaction is negotiated. The securities purchased on a delayed delivery or when-issued basis are identified as such in the Fund's Schedule of Investments. With respect to purchase commitments, the Fund identifies securities as segregated in its records with a value at least equal to the amount of the commitment. Losses may arise due to changes in the value of the underlying securities or if the counterparty does not perform under the contract's terms, or if the issuer does not issue the securities due to political, economic, or other factors.
Restricted Securities. The Fund may invest in securities that are subject to legal or contractual restrictions on resale. These securities generally may be resold in transactions exempt from registration or to the public if the securities are registered. Disposal of these securities may involve time-consuming negotiations and expense, and prompt sale at an acceptable price may be difficult. Information regarding restricted securities is included at the end of the Fund's Schedule of Investments.
Annual Report
4. Purchases and Sales of Investments.
Purchases and sales of securities, other than short-term securities, aggregated $817,391,288 and $297,421,341, respectively.
5. Fees and Other Transactions with Affiliates.
Management Fee. Fidelity Management & Research Company (the investment adviser) and its affiliates provide the Fund with investment management related services for which the Fund pays a monthly management fee. The management fee is the sum of an individual fund fee rate that is based on an annual rate of .45% of the Fund's average net assets and an annualized group fee rate that averaged .25% during the period. The group fee rate is based upon the average net assets of all the mutual funds advised by the investment adviser, including any mutual funds previously advised by the investment adviser that are currently advised by Fidelity SelectCo, LLC, an affiliate of the investment adviser. The group fee rate decreases as assets under management increase and increases as assets under management decrease. In addition, the management fee is subject to a performance adjustment (up to a maximum of ± .20% of the Fund's average net assets over a 36 month performance period). The upward or downward adjustment to the management fee is based on the relative investment performance of International Growth as compared to its benchmark index, the MSCI EAFE Growth Index, over the same 36 month performance period. For the reporting period, the total annual management fee rate, including the performance adjustment, was .71% of the Fund's average net assets. The performance adjustment included in the management fee rate may be higher or lower than the maximum performance adjustment rate due to the difference between the average net assets for the reporting and performance periods.
Distribution and Service Plan Fees. In accordance with Rule 12b-1 of the 1940 Act, the Fund has adopted separate Distribution and Service Plans for each class of shares. Certain classes pay Fidelity Distributors Corporation (FDC), an affiliate of the investment adviser, separate Distribution and Service Fees, each of which is based on an annual percentage of each class' average net assets. In addition, FDC may pay financial intermediaries for selling shares of the Fund and providing shareholder support services. For the period, the Distribution and Service Fee rates, total fees and amounts retained by FDC were as follows:
| Distribution
Fee | Service
Fee | Total Fees | Retained
by FDC |
Class A | -% | .25% | $ 372,877 | $ 7,701 |
Class T | .25% | .25% | 136,338 | 179 |
Class B | .75% | .25% | 10,860 | 8,157 |
Class C | .75% | .25% | 419,307 | 145,878 |
| | | $ 939,382 | $ 161,915 |
Annual Report
Notes to Financial Statements - continued
5. Fees and Other Transactions with Affiliates - continued
Sales Load. FDC may receive a front-end sales charge of up to 5.75% for selling Class A shares and 3.50% for selling Class T shares, some of which is paid to financial intermediaries for selling shares of the Fund. Depending on the holding period, FDC may receive contingent deferred sales charges levied on Class A, Class T, Class B, and Class C redemptions. The deferred sales charges range from 5.00% to 1.00% for Class B shares, 1.00% for Class C shares, 1.00% for certain purchases of Class A shares and .25% for certain purchases of Class T shares.
For the period, sales charge amounts retained by FDC were as follows:
| Retained
by FDC |
Class A | $ 94,764 |
Class T | 15,334 |
Class BA | 413 |
Class CA | 7,496 |
| $ 118,007 |
A When Class B and Class C shares are initially sold, FDC pays commissions from its own resources to financial intermediaries through which the sales are made.
Transfer Agent Fees. Fidelity Investments Institutional Operations Company, Inc., (FIIOC), an affiliate of the investment adviser, is the transfer, dividend disbursing and shareholder servicing agent for each class of the Fund. FIIOC receives account fees and asset-based fees that vary according to the account size and type of account of the shareholders of the respective classes of the Fund, except for Class Z. FIIOC receives an asset-based fee of Class Z's average net assets. FIIOC pays for typesetting, printing and mailing of shareholder reports, except proxy statements.
For the period, transfer agent fees for each class were as follows:
| Amount | % of
Class-Level Average
Net Assets |
Class A | $ 327,480 | .22 |
Class T | 80,017 | .29 |
Class B | 2,930 | .27 |
Class C | 115,354 | .27 |
International Growth | 1,419,079 | .18 |
Class I | 357,209 | .19 |
Class Z | 86 | .05 |
| $ 2,302,155 | |
Annual Report
5. Fees and Other Transactions with Affiliates - continued
Accounting and Security Lending Fees. Fidelity Service Company, Inc. (FSC), an affiliate of the investment adviser, maintains the Fund's accounting records. The accounting fee is based on the level of average net assets for each month. Under a separate contract, FSC administers the security lending program. The security lending fee is based on the number and duration of lending transactions.
Brokerage Commissions. The Fund placed a portion of its portfolio transactions with brokerage firms which are affiliates of the investment adviser. Brokerage commissions are included in net realized gain (loss) and change in net unrealized appreciation (depreciation) in the Statement of Operations. The commissions paid to these affiliated firms were $1,335 for the period.
6. Committed Line of Credit.
The Fund participates with other funds managed by the investment adviser or an affiliate in a $4.25 billion credit facility (the "line of credit") to be utilized for temporary or emergency purposes to fund shareholder redemptions or for other short-term liquidity purposes. The Fund has agreed to pay commitment fees on its pro-rata portion of the line of credit, which amounted to $1,622 and is reflected in Miscellaneous expenses on the Statement of Operations. During the period, the Fund did not borrow on this line of credit.
7. Security Lending.
The Fund lends portfolio securities through a lending agent from time to time in order to earn additional income. For equity securities, a lending agent is used and may loan securities to certain qualified borrowers, including Fidelity Capital Markets (FCM), a broker-dealer affiliated with the Fund. On the settlement date of the loan, the Fund receives collateral (in the form of U.S. Treasury obligations, letters of credit and/or cash) against the loaned securities and maintains collateral in an amount not less than 100% of the market value of the loaned securities during the period of the loan. The market value of the loaned securities is determined at the close of business of the Fund and any additional required collateral is delivered to the Fund on the next business day. The Fund or borrower may terminate the loan at any time, and if the borrower defaults on its obligation to return the securities loaned because of insolvency or other reasons, the Fund may apply collateral received from the borrower against the obligation. The Fund may experience delays and costs in recovering the securities loaned. Any cash collateral received is invested in the Fidelity Securities Lending Cash Central Fund. The value of loaned securities and cash collateral at period end are disclosed on the Fund's Statement of Assets and Liabilities. The value of securities loaned to FCM at period end was $2,824,892. Security lending income represents the income earned on investing cash
Annual Report
Notes to Financial Statements - continued
7. Security Lending - continued
collateral, less rebates paid to borrowers and any lending agent fees associated with the loan, plus any premium payments received for lending certain types of securities. Security lending income is presented in the Statement of Operations as a component of income from Fidelity Central Funds. Total security lending income during the period amounted to $197,556, including $7,864 from securities loaned to FCM.
8. Expense Reductions.
Commissions paid to certain brokers with whom the investment adviser, or its affiliates, places trades on behalf of the Fund include an amount in addition to trade execution, which may be rebated back to the Fund to offset certain expenses. This amount totaled $66,064 for the period. In addition, through arrangements with the Fund's custodian, credits realized as a result of certain uninvested cash balances were used to reduce the Fund's expenses. During the period, these credits reduced the Fund's custody expenses by $39.
In addition, during the period the investment adviser reimbursed and/or waived a portion of fund-level operating expenses in the amount of $5,134 and a portion of class-level operating expenses as follows:
| Amount |
Class A | $ 1,835 |
Class T | 148 |
Class B | 6 |
Class C | 454 |
International Growth | 11,998 |
Class I | 1,841 |
| $ 16,282 |
9. Distributions to Shareholders.
Distributions to shareholders of each class were as follows:
Years ended October 31, | 2015 | 2014 |
From net investment income | | |
Class A | $ 684,914 | $ 253,092 |
Class T | 29,128 | 40,595 |
International Growth | 5,239,951 | 2,051,403 |
Class I | 1,064,923 | 246,949 |
Class Z | 1,008 | 604 |
Total | $ 7,019,924 | $ 2,592,643 |
Annual Report
9. Distributions to Shareholders - continued
Years ended October 31, | 2015 | 2014 |
From net realized gain | | |
Class A | $ - | $ 66,995 |
Class T | - | 20,298 |
Class B | - | 1,337 |
Class C | - | 16,479 |
International Growth | - | 369,252 |
Class I | - | 38,992 |
Class Z | - | 88 |
Total | $ - | $ 513,441 |
10. Share Transactions.
Share transactions for each class were as follows and may contain automatic conversions between classes or exchanges between funds:
| Shares | Dollars |
Years ended October 31, | 2015 | 2014 | 2015 | 2014 |
Class A | | | | |
Shares sold | 9,298,452 | 6,584,484 | $ 105,707,223 | $ 72,326,606 |
Reinvestment of distributions | 60,570 | 27,068 | 669,298 | 291,793 |
Shares redeemed | (3,798,128) | (2,724,911) | (42,982,992) | (30,099,985) |
Net increase (decrease) | 5,560,894 | 3,886,641 | $ 63,393,529 | $ 42,518,414 |
Class T | | | | |
Shares sold | 1,158,910 | 834,072 | $ 13,286,739 | $ 9,114,198 |
Reinvestment of distributions | 2,593 | 5,459 | 28,654 | 58,733 |
Shares redeemed | (1,005,399) | (585,464) | (11,627,373) | (6,459,248) |
Net increase (decrease) | 156,104 | 254,067 | $ 1,688,020 | $ 2,713,683 |
Class B | | | | |
Shares sold | 30,282 | 35,020 | $ 347,009 | $ 380,789 |
Reinvestment of distributions | - | 123 | - | 1,323 |
Shares redeemed | (87,349) | (53,583) | (994,341) | (587,919) |
Net increase (decrease) | (57,067) | (18,440) | $ (647,332) | $ (205,807) |
Class C | | | | |
Shares sold | 2,689,800 | 1,827,859 | $ 30,433,427 | $ 19,884,401 |
Reinvestment of distributions | - | 1,498 | - | 16,049 |
Shares redeemed | (991,400) | (426,678) | (10,978,888) | (4,637,384) |
Net increase (decrease) | 1,698,400 | 1,402,679 | $ 19,454,539 | $ 15,263,066 |
International Growth | | | | |
Shares sold | 39,705,804 | 27,835,093 | $ 456,131,993 | $ 307,440,711 |
Reinvestment of distributions | 387,169 | 197,948 | 4,301,448 | 2,143,781 |
Shares redeemed | (14,942,156) | (10,494,762) | (169,380,325) | (115,997,211) |
Net increase (decrease) | 25,150,817 | 17,538,279 | $ 291,053,116 | $ 193,587,281 |
Annual Report
Notes to Financial Statements - continued
10. Share Transactions - continued
| Shares | Dollars |
Years ended October 31, | 2015 | 2014 | 2015 | 2014 |
Class I | | | | |
Shares sold | 17,728,493 | 10,292,704 | $ 201,877,753 | $ 113,864,505 |
Reinvestment of distributions | 92,582 | 24,180 | 1,026,733 | 261,623 |
Shares redeemed | (5,227,430) | (2,927,192) | (58,733,231) | (31,428,962) |
Net increase (decrease) | 12,593,645 | 7,389,692 | $ 144,171,255 | $ 82,697,166 |
Class Z | | | | |
Shares sold | 88,007 | - | $ 956,120 | $ - |
Reinvestment of distributions | 91 | 64 | 1,008 | 692 |
Shares redeemed | (18,621) | (475) | (208,779) | (5,267) |
Net increase (decrease) | 69,477 | (411) | $ 748,349 | $ (4,575) |
11. Other.
The Fund's organizational documents provide former and current trustees and officers with a limited indemnification against liabilities arising in connection with the performance of their duties to the Fund. In the normal course of business, the Fund may also enter into contracts that provide general indemnifications. The Fund's maximum exposure under these arrangements is unknown as this would be dependent on future claims that may be made against the Fund. The risk of material loss from such claims is considered remote.
Annual Report
To the Trustees of Fidelity Investment Trust and the Shareholders of Fidelity International Growth Fund:
In our opinion, the accompanying statement of assets and liabilities, including the schedule of investments, and the related statements of operations and of changes in net assets and the financial highlights present fairly, in all material respects, the financial position of Fidelity International Growth Fund (a fund of Fidelity Investment Trust) at October 31, 2015, the results of its operations for the year then ended, the changes in its net assets for each of the two years in the period then ended and the financial highlights for each of the periods indicated, in conformity with accounting principles generally accepted in the United States of America. These financial statements and financial highlights (hereafter referred to as "financial statements") are the responsibility of the Fidelity International Growth Fund's management. Our responsibility is to express an opinion on these financial statements based on our audits. We conducted our audits of these financial statements in accordance with the standards of the Public Company Accounting Oversight Board (United States). Those standards require that we plan and perform the audit to obtain reasonable assurance about whether the financial statements are free of material misstatement. An audit includes examining, on a test basis, evidence supporting the amounts and disclosures in the financial statements, assessing the accounting principles used and significant estimates made by management, and evaluating the overall financial statement presentation. We believe that our audits, which included confirmation of securities at October 31, 2015 by correspondence with the custodian and brokers, provide a reasonable basis for our opinion.
PricewaterhouseCoopers LLP
Boston, Massachusetts
December 16, 2015
Annual Report
The Trustees, Member of the Advisory Board, and officers of the trust and fund, as applicable, are listed below. The Board of Trustees governs the fund and is responsible for protecting the interests of shareholders. The Trustees are experienced executives who meet periodically throughout the year to oversee the fund's activities, review contractual arrangements with companies that provide services to the fund, oversee management of the risks associated with such activities and contractual arrangements, and review the fund's performance. Each of the Trustees oversees 170 funds.
The Trustees hold office without limit in time except that (a) any Trustee may resign; (b) any Trustee may be removed by written instrument, signed by at least two-thirds of the number of Trustees prior to such removal; (c) any Trustee who requests to be retired or who has become incapacitated by illness or injury may be retired by written instrument signed by a majority of the other Trustees; and (d) any Trustee may be removed at any special meeting of shareholders by a two-thirds vote of the outstanding voting securities of the trust. Each Trustee who is not an interested person (as defined in the 1940 Act) of the trust and the fund (Independent Trustee), shall retire not later than the last day of the calendar year in which his or her 75th birthday occurs. The Independent Trustees may waive this mandatory retirement age policy with respect to individual Trustees. The officers and Advisory Board Member hold office without limit in time, except that any officer and Advisory Board Member may resign or may be removed by a vote of a majority of the Trustees at any regular meeting or any special meeting of the Trustees. Except as indicated, each individual has held the office shown or other offices in the same company for the past five years.
Experience, Skills, Attributes, and Qualifications of the Fund's Trustees. The Governance and Nominating Committee has adopted a statement of policy that describes the experience, qualifications, attributes, and skills that are necessary and desirable for potential Independent Trustee candidates (Statement of Policy). The Board believes that each Trustee satisfied at the time he or she was initially elected or appointed a Trustee, and continues to satisfy, the standards contemplated by the Statement of Policy. The Governance and Nominating Committee also engages professional search firms to help identify potential Independent Trustee candidates who have the experience, qualifications, attributes, and skills consistent with the Statement of Policy. From time to time, additional criteria based on the composition and skills of the current Independent Trustees, as well as experience or skills that may be appropriate in light of future changes to board composition, business conditions, and regulatory or other developments, have also been considered by the professional search firms and the Governance and Nominating Committee. In addition, the Board takes into account the Trustees' commitment and participation in Board and committee meetings, as well as their leadership of standing and ad hoc committees throughout their tenure.
In determining that a particular Trustee was and continues to be qualified to serve as a Trustee, the Board has considered a variety of criteria, none of which, in isolation, was controlling. The Board believes that, collectively, the Trustees have balanced and diverse experience, qualifications, attributes, and skills, which allow the Board to operate effectively in governing the fund and protecting the interests of shareholders. Information about the specific experience, skills, attributes, and qualifications of each Trustee, which in each case led to the Board's conclusion that the Trustee should serve (or continue to serve) as a trustee of the fund, is provided below.
Annual Report
Trustees and Officers - continued
Board Structure and Oversight Function. James C. Curvey is an interested person (as defined in the 1940 Act) and currently serves as Chairman. The Trustees have determined that an interested Chairman is appropriate and benefits shareholders because an interested Chairman has a personal and professional stake in the quality and continuity of services provided to the fund. Independent Trustees exercise their informed business judgment to appoint an individual of their choosing to serve as Chairman, regardless of whether the Trustee happens to be independent or a member of management. The Independent Trustees have determined that they can act independently and effectively without having an Independent Trustee serve as Chairman and that a key structural component for assuring that they are in a position to do so is for the Independent Trustees to constitute a substantial majority for the Board. The Independent Trustees also regularly meet in executive session. Ned C. Lautenbach serves as Chairman of the Independent Trustees and as such (i) acts as a liaison between the Independent Trustees and management with respect to matters important to the Independent Trustees and (ii) with management prepares agendas for Board meetings.
Fidelity funds are overseen by different Boards of Trustees. The fund's Board oversees Fidelity's high income and certain equity funds, and other Boards oversee Fidelity's investment-grade bond, money market, asset allocation, and sector funds. The asset allocation funds may invest in Fidelity funds overseen by the fund's Board. The use of separate Boards, each with its own committee structure, allows the Trustees of each group of Fidelity funds to focus on the unique issues of the funds they oversee, including common research, investment, and operational issues. On occasion, the separate Boards establish joint committees to address issues of overlapping consequences for the Fidelity funds overseen by each Board.
The Trustees operate using a system of committees to facilitate the timely and efficient consideration of all matters of importance to the Trustees, the fund, and fund shareholders and to facilitate compliance with legal and regulatory requirements and oversight of the fund's activities and associated risks. The Board, acting through its committees, has charged FMR and its affiliates with (i) identifying events or circumstances the occurrence of which could have demonstrably adverse effects on the fund's business and/or reputation; (ii) implementing processes and controls to lessen the possibility that such events or circumstances occur or to mitigate the effects of such events or circumstances if they do occur; and (iii) creating and maintaining a system designed to evaluate continuously business and market conditions in order to facilitate the identification and implementation processes described in (i) and (ii) above. Because the day-to-day operations and activities of the fund are carried out by or through FMR, its affiliates and other service providers, the fund's exposure to risks is mitigated but not eliminated by the processes overseen by the Trustees. While each of the Board's committees has responsibility for overseeing different aspects of the fund's activities, oversight is exercised primarily through the Operations, Audit, and Compliance Committees. In addition, the Independent Trustees have worked with FMR to enhance the Board's oversight of investment and financial risks, legal and regulatory risks, technology risks, and operational risks, including the development of additional risk reporting to the Board. For example, a working group comprised of Independent Trustees and FMR has worked and continues to work to review the Fidelity funds' valuation-related activities, reporting and risk management. Appropriate personnel, including but not limited to the fund's Chief Compliance Officer (CCO), FMR's internal auditor, the independent accountants, the fund's Treasurer and portfolio management personnel, make periodic reports to the Board's committees, as appropriate, including an annual review of Fidelity's risk management program for the Fidelity funds. The responsibilities of each standing committee, including their oversight responsibilities, are described further under "Standing Committees of the Fund's Trustees."
Annual Report
The fund's Statement of Additional Information (SAI) includes more information about the Trustees. To request a free copy, call Fidelity at 1-800-544-8544.
Interested Trustees*:
Correspondence intended for each Trustee who is an interested person may be sent to Fidelity Investments, 245 Summer Street, Boston, Massachusetts 02210.
Name, Year of Birth; Principal Occupations and Other Relevant Experience+ |
James C. Curvey (1935) |
Year of Election or Appointment: 2007 Trustee Chairman of the Board of Trustees |
| Mr. Curvey also serves as Trustee of other Fidelity funds. Mr. Curvey is a Director of Fidelity Research & Analysis Co. (investment adviser firm, 2009-present), and Vice Chairman (2007-present) and Director of FMR LLC (diversified financial services company). In addition, Mr. Curvey serves as an Overseer for the Boston Symphony Orchestra and a member of the board of Artis-Naples, Naples, Florida, and as a Trustee for Brewster Academy, Wolfeboro, New Hampshire. Previously, Mr. Curvey served as a Director of Fidelity Investments Money Management, Inc. (investment adviser firm, 2009-2014) and a Director of FMR and FMR Co., Inc. (investment adviser firms, 2007-2014). |
Charles S. Morrison (1960) |
Year of Election or Appointment: 2014 Trustee |
| Mr. Morrison also serves as Trustee of other funds. He serves as a Director of Fidelity Investments Money Management, Inc. (FIMM) (investment adviser firm, 2014-present), Director of Fidelity SelectCo, LLC (investment adviser firm, 2014-present), President, Asset Management (2014-present), and is an employee of Fidelity Investments. Previously, Mr. Morrison served as Vice President of Fidelity's Fixed Income and Asset Allocation Funds (2012-2014), President, Fixed Income (2011-2014), Vice President of Fidelity's Money Market Funds (2005-2009), President, Money Market Group Leader of FMR (investment adviser firm, 2009), and Senior Vice President, Money Market Group of FMR (2004-2009). Mr. Morrison also served as Vice President of Fidelity's Bond Funds (2002-2005), certain Balanced Funds (2002-2005), and certain Asset Allocation Funds (2002-2007), and as Senior Vice President (2002-2005) of Fidelity's Bond Division. |
* Trustees have been determined to be "Interested Trustees" by virtue of, among other things, their affiliation with the trust or various entities under common control with FMR.
+ The information above includes each Trustee's principal occupation during the last five years and other information relating to the experience, attributes, and skills relevant to each Trustee's qualifications to serve as a Trustee, which led to the conclusion that each Trustee should serve as a Trustee for the fund.
Annual Report
Independent Trustees:
Correspondence intended for each Independent Trustee (that is, the Trustees other than the Interested Trustees) may be sent to Fidelity Investments, P.O. Box 55235, Boston, Massachusetts 02205-5235.
Name, Year of Birth; Principal Occupations and Other Relevant Experience+ |
Dennis J. Dirks (1948) |
Year of Election or Appointment: 2005 Trustee |
| Mr. Dirks also serves as Trustee of other Fidelity funds. Prior to his retirement in May 2003, Mr. Dirks was Chief Operating Officer and a member of the Board of The Depository Trust & Clearing Corporation (DTCC). He also served as President, Chief Operating Officer, and Board member of The Depository Trust Company (DTC) and President and Board member of the National Securities Clearing Corporation (NSCC). In addition, Mr. Dirks served as Chief Executive Officer and Board member of the Government Securities Clearing Corporation, Chief Executive Officer and Board member of the Mortgage-Backed Securities Clearing Corporation, as a Trustee and a member of the Finance Committee of Manhattan College (2005-2008), as a Trustee and a member of the Finance Committee of AHRC of Nassau County (2006-2008), and as a member of the Independent Directors Council (IDC) Governing Council (2010-2015). Mr. Dirks is a member of the Board of Directors for The Brookville Center for Children's Services, Inc. (2009-present). |
Alan J. Lacy (1953) |
Year of Election or Appointment: 2008 Trustee |
| Mr. Lacy also serves as Trustee of other Fidelity funds. Mr. Lacy serves as a member of the Board of Directors of Dave & Buster's Entertainment, Inc. (restaurant and entertainment complexes, 2010-present) and Bristol-Myers Squibb Company (global pharmaceuticals, 2008-present). In addition, Mr. Lacy served as Senior Adviser (2007-2014) of Oak Hill Capital Partners, L.P. (private equity) and also served as Chief Executive Officer (2000-2005) and Vice Chairman (2005-2006) of Sears Holdings Corporation and Sears, Roebuck and Co. (retail). Mr. Lacy is a member of the Board of Trustees of The National Parks Conservation Association (2006-present). Previously, Mr. Lacy served as Chairman of the Board of Trustees of the National Parks Conservation Association (2008-2011) and as a member of the Board of Directors for The Western Union Company (global money transfer, 2006-2011), The Hillman Companies, Inc. (hardware wholesalers, 2010-2014), and Earth Fare, Inc. (retail grocery, 2010-2014). |
Ned C. Lautenbach (1944) |
Year of Election or Appointment: 2000 Trustee Chairman of the Independent Trustees |
| Mr. Lautenbach also serves as Trustee of other Fidelity funds. Mr. Lautenbach currently serves as the Lead Director of the Eaton Corporation Board of Directors (diversified industrial, 1997-present). Mr. Lautenbach is Chairman of the Board of Directors of Artis-Naples in Naples, Florida (2012-present), a member of the Council on Foreign Relations (1994-present), and a member of the Board of Governors, State University System of Florida (2013-present). Previously, Mr. Lautenbach was a Partner/Advisory Partner at Clayton, Dubilier & Rice, LLC (private equity investment, 1998-2010), as well as a Director of Sony Corporation (2006-2007). |
Joseph Mauriello (1944) |
Year of Election or Appointment: 2008 Trustee |
| Mr. Mauriello also serves as Trustee of other Fidelity funds. Prior to his retirement in January 2006, Mr. Mauriello served in numerous senior management positions including Deputy Chairman and Chief Operating Officer (2004-2005), and Vice Chairman of Financial Services (2002-2004) of KPMG LLP US (professional services, 1965-2005). Mr. Mauriello currently serves as a member of the Board of Directors of XL Group plc. (global insurance and re-insurance, 2006-present) and the Independent Directors Council (IDC) Governing Council (2015-present). Previously, Mr. Mauriello served as a Director of the Hamilton Funds of the Bank of New York (2006-2007) and of Arcadia Resources Inc. (health care services and products, 2007-2012). |
Robert W. Selander (1950) |
Year of Election or Appointment: 2011 Trustee |
| Mr. Selander also serves as Trustee of other Fidelity funds. Mr. Selander serves as a Director of The Western Union Company (global money transfer, 2014-present). Previously, Mr. Selander served as a Member of the Advisory Board of other Fidelity funds (2011), and Executive Vice Chairman (2010), Chief Executive Officer (2009-2010), and President and Chief Executive Officer (1997-2009) of Mastercard, Inc. |
Cornelia M. Small (1944) |
Year of Election or Appointment: 2005 Trustee |
| Ms. Small also serves as Trustee of other Fidelity funds. Ms. Small is a member of the Board of Directors (2009-present) and Chair of the Investment Committee (2010-present) of the Teagle Foundation. Ms. Small also serves on the Investment Committee of the Berkshire Taconic Community Foundation (2008-present). Previously, Ms. Small served as Chairperson (2002-2008) and a member of the Investment Committee and Chairperson (2008-2012) and a member of the Board of Trustees of Smith College. In addition, Ms. Small served as Chief Investment Officer, Director of Global Equity Investments, and a member of the Board of Directors of Scudder, Stevens & Clark and Scudder Kemper Investments. |
William S. Stavropoulos (1939) |
Year of Election or Appointment: 2001 Trustee Vice Chairman of the Independent Trustees |
| Mr. Stavropoulos also serves as Trustee of other Fidelity funds. Mr. Stavropoulos serves as President and Founder of the Michigan Baseball Foundation, the Great Lakes Loons (2007-present). Mr. Stavropoulos is Chairman Emeritus of the Board of Directors of The Dow Chemical Company, where he previously served in numerous senior management positions, including President, CEO (1995-2000; 2002-2004), Chairman of the Executive Committee (2000-2006), and as a member of the Board of Directors (1990-2006). Currently, Mr. Stavropoulos is Chairman of the Board of Directors of Univar Inc. (global distributor of commodity and specialty chemicals), a Director of Teradata Corporation (data warehousing and technology solutions), and Maersk Inc. (industrial conglomerate), and a member of the Advisory Board for Metalmark Capital LLC (private equity investment, 2005-present). Mr. Stavropoulos is an operating advisor to Clayton, Dubilier & Rice, LLC (private equity investment). In addition, Mr. Stavropoulos is a member of the University of Notre Dame Advisory Council for the College of Science, a Trustee of the Rollin L. Gerstacker Foundation, and a Director of the Naples Philharmonic Center for the Arts. Previously, Mr. Stavropoulos served as a Director of Chemical Financial Corporation (bank holding company, 1993-2012) and Tyco International, Ltd. (multinational manufacturing and services, 2007-2012). |
David M. Thomas (1949) |
Year of Election or Appointment: 2008 Trustee |
| Mr. Thomas also serves as Trustee of other Fidelity funds. Mr. Thomas serves as Non-Executive Chairman of the Board of Directors of Fortune Brands Home and Security (home and security products, 2011-present), as a member of the Board of Directors (2004-present) and Presiding Director (2013-present) of Interpublic Group of Companies, Inc. (marketing communication), and as a member of the Board of Trustees of the University of Florida (2013-present). Previously, Mr. Thomas served as Executive Chairman (2005-2006) and Chairman and Chief Executive Officer (2000-2005) of IMS Health, Inc. (pharmaceutical and healthcare information solutions), and a Director of Fortune Brands, Inc. (consumer products, 2000-2011). |
+ The information above includes each Trustee's principal occupation during the last five years and other information relating to the experience, attributes, and skills relevant to each Trustee's qualifications to serve as a Trustee, which led to the conclusion that each Trustee should serve as a Trustee for the fund.
Advisory Board Member and Officers:
Correspondence intended for each officer and Peter S. Lynch may be sent to Fidelity Investments, 245 Summer Street, Boston, Massachusetts 02210. Officers appear below in alphabetical order.
Name, Year of Birth; Principal Occupation |
Peter S. Lynch (1944) |
Year of Election or Appointment: 2003 Member of the Advisory Board |
| Mr. Lynch also serves as Member of the Advisory Board of other Fidelity funds. Mr. Lynch is Vice Chairman and a Director of FMR (investment adviser firm) and FMR Co., Inc. (investment adviser firm). In addition, Mr. Lynch serves as a Trustee of Boston College and as the Chairman of the Inner-City Scholarship Fund. Previously, Mr. Lynch served on the Special Olympics International Board of Directors (1997-2006). |
Elizabeth Paige Baumann (1968) |
Year of Election or Appointment: 2012 Anti-Money Laundering (AML) Officer |
| Ms. Baumann also serves as AML Officer of other funds. She is Chief AML Officer of FMR LLC (diversified financial services company, 2012-present) and is an employee of Fidelity Investments. Previously, Ms. Baumann served as Vice President and Deputy Anti-Money Laundering Officer (2007-2012). |
Marc R. Bryant (1966) |
Year of Election or Appointment: 2015 Secretary and Chief Legal Officer (CLO) |
| Mr. Bryant also serves as Secretary and CLO of other funds. Mr. Bryant serves as CLO, Secretary, and Senior Vice President of Fidelity Management & Research Company (investment adviser firm, 2015-present) and FMR Co., Inc. (investment adviser firm, 2015-present); Secretary of Fidelity SelectCo, LLC (investment adviser firm, 2015-present) and Fidelity Investments Money Management, Inc. (investment adviser firm, 2015-present); and CLO of Fidelity Management & Research (Hong Kong) Limited (investment adviser firm, 2015-present). He is Senior Vice President and Deputy General Counsel of FMR LLC (diversified financial services company). Previously, Mr. Bryant served as Secretary and Chief Legal Officer of Fidelity Rutland Square Trust II (2010-2014) and Assistant Secretary of Fidelity's Fixed Income and Asset Allocation Funds (2013-2015). Prior to joining Fidelity Investments, Mr. Bryant served as a Senior Vice President and the Head of Global Retail Legal for AllianceBernstein L.P. (2006-2010), and as the General Counsel for ProFund Advisors LLC (2001-2006). |
William C. Coffey (1969) |
Year of Election or Appointment: 2009 Assistant Secretary |
| Mr. Coffey also serves as Assistant Secretary of other funds. He is Senior Vice President and Deputy General Counsel of FMR LLC (diversified financial services company, 2010-present), and is an employee of Fidelity Investments. Previously, Mr. Coffey served as Vice President and Associate General Counsel of FMR LLC (2005-2009). |
Timothy M. Cohen (1969) |
Year of Election or Appointment: 2014 Vice President of certain Equity Funds |
| Mr. Cohen also serves as Vice President of other funds. Mr. Cohen serves as Chief Compliance Officer of FMR Investment Management (U.K.) Limited (investment adviser firm, 2013-present) and is an employee of Fidelity Investments. Previously, Mr. Cohen served as a Director of FMR Investment Management (U.K.) Limited (2013-2015). |
Jonathan Davis (1968) |
Year of Election or Appointment: 2010 Assistant Treasurer |
| Mr. Davis also serves as Assistant Treasurer of other funds, and is an employee of Fidelity Investments. Previously, Mr. Davis served as Vice President and Associate General Counsel of FMR LLC (diversified financial services company, 2003-2010). |
Adrien E. Deberghes (1967) |
Year of Election or Appointment: 2008 Deputy Treasurer |
| Mr. Deberghes also serves as an officer of other funds. He is an employee of Fidelity Investments (2008-present). Prior to joining Fidelity Investments, Mr. Deberghes was Senior Vice President of Mutual Fund Administration at State Street Corporation (2007-2008), Senior Director of Mutual Fund Administration at Investors Bank & Trust (2005-2007), and Director of Finance for Dunkin' Brands (2000-2005). |
Stephanie J. Dorsey (1969) |
Year of Election or Appointment: 2010 Assistant Treasurer |
| Ms. Dorsey also serves as an officer of other funds. She is an employee of Fidelity Investments (2008-present) and has served in other fund officer roles. Prior to joining Fidelity Investments, Ms. Dorsey served as Treasurer (2004-2008) of the JPMorgan Mutual Funds and Vice President (2004-2008) of JPMorgan Chase Bank. |
Howard J. Galligan III (1966) |
Year of Election or Appointment: 2014 Chief Financial Officer |
| Mr. Galligan also serves as Chief Financial Officer of other funds. Mr. Galligan serves as President of Fidelity Pricing and Cash Management Services (FPCMS) (2014-present) and as a Director of Strategic Advisers, Inc. (investment adviser firm, 2008-present). Previously, Mr. Galligan served as Chief Administrative Officer of Asset Management (2011-2014) and Chief Operating Officer and Senior Vice President of Investment Support for Strategic Advisers, Inc. (2003-2011). |
Scott C. Goebel (1968) |
Year of Election or Appointment: 2015 Vice President |
| Mr. Goebel serves as Vice President of other funds and is an employee of Fidelity Investments (2001-present). Previously, Mr. Goebel served as Secretary of Fidelity SelectCo, LLC (investment adviser firm, 2013-2015), Fidelity Investments Money Management, Inc. (FIMM) (investment adviser firm, 2010-2015), and Fidelity Research and Analysis Company (FRAC) (investment adviser firm, 2010-2015); General Counsel, Secretary, and Senior Vice President of Fidelity Management & Research Company (investment adviser firm, 2008-2015) and FMR Co., Inc. (investment adviser firm, 2008-2015); Assistant Secretary of Fidelity Management & Research (Japan) Limited (investment adviser firm, 2008-2015) and FMR Investment Management (U.K.) Limited (investment adviser firm, 2008-2015); Chief Legal Officer (CLO) of Fidelity Management & Research (Hong Kong) Limited (investment adviser firm, 2008-2015); Secretary and CLO of certain Fidelity funds (2008-2015); Assistant Secretary of FIMM (2008-2010), FRAC (2008-2010), and certain funds (2007-2008); and as Vice President and Secretary of Fidelity Distributors Corporation (FDC) (2005-2007). |
Brian B. Hogan (1964) |
Year of Election or Appointment: 2009 Vice President |
| Mr. Hogan also serves as Trustee or Vice President of other funds. Mr. Hogan serves as a Director of Fidelity SelectCo, LLC (investment adviser firm, 2014-present) and President of the Equity Division of FMR (investment adviser firm, 2009-present). Previously, Mr. Hogan served as Senior Vice President, Equity Research of FMR (2006-2009) and as a portfolio manager. |
Chris Maher (1972) |
Year of Election or Appointment: 2013 Assistant Treasurer |
| Mr. Maher serves as Assistant Treasurer of other funds. Mr. Maher is Vice President of Valuation Oversight and is an employee of Fidelity Investments. Previously, Mr. Maher served as Vice President of Asset Management Compliance (2013), Vice President of the Program Management Group of FMR (investment adviser firm, 2010-2013), and Vice President of Valuation Oversight (2008-2010). |
Kenneth B. Robins (1969) |
Year of Election or Appointment: 2008 President and Treasurer |
| Mr. Robins also serves as an officer of other funds. Mr. Robins serves as Executive Vice President of Fidelity Investments Money Management, Inc. (FIMM) (investment adviser firm, 2013-present) and is an employee of Fidelity Investments (2004-present). Previously, Mr. Robins served in other fund officer roles. |
Stacie M. Smith (1974) |
Year of Election or Appointment: 2013 Deputy Treasurer |
| Ms. Smith also serves as an officer of other funds. She is an employee of Fidelity Investments (2009-present) and has served in other fund officer roles. Prior to joining Fidelity Investments, Ms. Smith served as Senior Audit Manager of Ernst & Young LLP (1996-2009). |
Renee Stagnone (1975) |
Year of Election or Appointment: 2013 Deputy Treasurer |
| Ms. Stagnone also serves as Deputy Treasurer of other funds. Ms. Stagnone is an employee of Fidelity Investments (1997-present). |
Linda J. Wondrack (1964) |
Year of Election or Appointment: 2014 Chief Compliance Officer |
| Ms. Wondrack also serves as Chief Compliance Officer of other funds. Ms. Wondrack is Executive Vice President and head of the Ethics Office and Asset Management Compliance for Fidelity Investments (2012-present). Ms. Wondrack also serves as Chief Compliance Officer of Fidelity SelectCo, LLC (investment adviser firm, 2014-present); Chief Compliance Officer of Impresa Management LLC (2013-present); and Chief Compliance Officer of FMR Co., Inc. (investment adviser firm), Fidelity Investments Money Management, Inc. (investment adviser firm), Fidelity Management & Research (Japan) Limited (investment adviser firm), FMR Investment Management (U.K.) Limited (investment adviser firm), Fidelity Management & Research (Hong Kong) (investment adviser firm), Fidelity Management & Research Company (investment adviser firm), FIAM LLC (investment adviser firm), and Strategic Advisers, Inc. (investment adviser firm), Ballyrock Investment Advisors LLC, and Northern Neck Investors LLC (2012-present). Previously, Ms. Wondrack served as Senior Vice President and Chief Compliance Officer for Columbia Management Investment Advisers, LLC (2005-2012); Chief Compliance Officer for certain funds within the Columbia Family of Funds (2007-2012); and Senior Vice President of Compliance Risk Management at Bank of America (2005-2010). |
Joseph F. Zambello (1957) |
Year of Election or Appointment: 2011 Deputy Treasurer |
| Mr. Zambello also serves as Deputy Treasurer of other funds. Mr. Zambello is an employee of Fidelity Investments (1991-present). Previously, Mr. Zambello served as Vice President of the Program Management Group of FMR (investment adviser firm, 2009-2011) and Vice President of the Transfer Agent Oversight Group (2005-2009). |
Annual Report
The Board of Trustees of Fidelity International Growth Fund voted to pay on December 7, 2015, to shareholders of record at the opening of business on December 4, 2015, a distribution of $0.008 per share derived from capital gains realized from sales of portfolio securities and a dividend of $0.078 per share from net investment income.
The fund designates 14% of the dividends distributed during the fiscal year as qualifying for the dividends-received deduction for corporate shareholders.
The fund designates 100% of the dividends distributed during the fiscal year as amounts which may be taken into account as a dividend for the purposes of the maximum rate under section 1(h)(11) of the Internal Revenue Code.
The amounts per share which represent income derived from sources within, and taxes paid to, foreign countries or possessions of the United States are as follows:
| Pay Date | Income | Taxes |
International Growth Fund | 12/08/2014 | $0.1008 | $0.0098 |
The fund will notify shareholders in January 2016 of amounts for use in preparing 2015 income tax returns.
Annual Report
Fidelity International Growth Fund
Each year, the Board of Trustees, including the Independent Trustees (together, the Board), votes on the renewal of the management contract with Fidelity Management & Research Company (FMR) and the sub-advisory agreements (together, the Advisory Contracts) for the fund. The Board, assisted by the advice of fund counsel and Independent Trustees' counsel, requests and considers a broad range of information relevant to the renewal of the Advisory Contracts throughout the year.
The Board meets regularly and, at each of its meetings, covers an extensive agenda of topics and materials and considers factors that are relevant to its annual consideration of the renewal of the fund's Advisory Contracts, including the services and support provided to the fund and its shareholders. The Board has established various standing committees (Committees), each composed of and chaired by Independent Trustees with varying backgrounds, to which the Board has assigned specific subject matter responsibilities in order to enhance effective decision-making by the Board. The Board, acting directly and through its Committees, requests and receives information concerning the annual consideration of the renewal of the fund's Advisory Contracts. The Board also meets as needed to consider matters specifically related to the Board's annual consideration of the renewal of the Advisory Contracts. Members of the Board may also meet with trustees of other Fidelity funds through ad hoc joint committees to discuss certain matters relevant to all of the Fidelity funds.
At its July 2015 meeting, the Board unanimously determined to renew the fund's Advisory Contracts. In reaching its determination, the Board considered all factors it believed relevant, including (i) the nature, extent, and quality of the services to be provided to the fund and its shareholders (including the investment performance of the fund); (ii) the competitiveness of the fund's management fee and total expense ratio relative to peer funds; (iii) the total costs of the services to be provided by and the profits to be realized by Fidelity from its relationship with the fund; and (iv) the extent to which (if any) economies of scale exist and would be realized as the fund grows, and whether any economies of scale are appropriately shared with fund shareholders.
In considering whether to renew the Advisory Contracts for the fund, the Board reached a determination, with the assistance of fund counsel and Independent Trustees' counsel and through the exercise of its business judgment, that the renewal of the Advisory Contracts was in the best interests of the fund and its shareholders and that the compensation payable under the Advisory Contracts was fair and reasonable. The Board's decision to renew the Advisory Contracts was not based on any single factor, but rather was based on a comprehensive consideration of all the information provided to the Board at its meetings throughout the year. The Board, in reaching its determination to renew the Advisory Contracts, was aware that shareholders of the fund have a broad range of investment choices available to them, including a wide choice among funds offered by Fidelity's competitors, and that the fund's shareholders, who have the opportunity to review and weigh the disclosure provided by the fund in its prospectus and other public disclosures, have chosen to invest in this fund, which is part of the Fidelity family of funds.
Annual Report
Board Approval of Investment Advisory Contracts and
Management Fees - continued
Nature, Extent, and Quality of Services Provided. The Board considered Fidelity's staffing as it relates to the fund, including the backgrounds of investment personnel of Fidelity, and also considered the fund's investment objective, strategies, and related investment philosophy. The Independent Trustees also had discussions with senior management of Fidelity's investment operations and investment groups. The Board considered the structure of the portfolio manager compensation program and whether this structure provides appropriate incentives to act in the best interests of the fund. Additionally, the Board considered the portfolio managers' investments, if any, in the funds that they manage.
Resources Dedicated to Investment Management and Support Services. The Board and the Fund Oversight and Research Committees reviewed the general qualifications and capabilities of Fidelity's investment staff, including its size, education, experience, and resources, as well as Fidelity's approach to recruiting, training, managing, and compensating investment personnel. The Board noted that Fidelity has continued to increase the resources devoted to non-U.S. offices, including expansion of Fidelity's global investment organization. The Board also noted that Fidelity's analysts have extensive resources, tools and capabilities that allow them to conduct sophisticated quantitative and fundamental analysis, as well as credit analysis of issuers, counterparties and guarantors. Further, the Board considered that Fidelity's investment professionals have sufficient access to global information and data so as to provide competitive investment results over time, and that those professionals also have access to sophisticated tools that permit them to assess portfolio construction and risk and performance attribution characteristics continuously, as well as to transmit new information and research conclusions rapidly around the world. Additionally, in its deliberations, the Board considered Fidelity's trading, risk management, and compliance capabilities and resources, which are integral parts of the investment management process.
Shareholder and Administrative Services. The Board considered (i) the nature, extent, quality, and cost of advisory, administrative, and shareholder services performed by FMR, the sub-advisers (together with FMR, the Investment Advisers), and their affiliates under the Advisory Contracts and under separate agreements covering transfer agency, pricing and bookkeeping, and securities lending services for the fund; (ii) the nature and extent of the supervision of third party service providers, principally custodians and subcustodians; and (iii) the resources devoted to, and the record of compliance with, the fund's compliance policies and procedures. The Board also reviewed the allocation of fund brokerage, including allocations to brokers affiliated with the Investment Advisers, the use of brokerage commissions to pay fund expenses, and the use of "soft" commission dollars to pay for research services.
Annual Report
The Board noted that the growth of fund assets over time across the complex allows Fidelity to reinvest in the development of services designed to enhance the value or convenience of the Fidelity funds as investment vehicles. These services include 24-hour access to account information and market information through telephone representatives and over the Internet, investor education materials and asset allocation tools, and the expanded availability of Fidelity Investor Centers.
In 2014, the Board formed an ad hoc Committee on Transfer Agency Fees to review the variety of transfer agency fee structures throughout the industry and Fidelity's competitive positioning with respect to industry participants.
Investment in a Large Fund Family. The Board considered the benefits to shareholders of investing in a Fidelity fund, including the benefits of investing in a fund that is part of a large family of funds offering a variety of investment disciplines and providing a large variety of mutual fund investor services. The Board noted that Fidelity had taken, or had made recommendations that resulted in the Fidelity funds taking, a number of actions over the previous year that benefited particular funds, including (i) continuing to dedicate additional resources to investment research and to the support of the senior management team that oversees asset management; (ii) continuing efforts to enhance Fidelity's global research capabilities; (iii) launching new funds and making other enhancements to meet client needs; (iv) reducing management fees and total expenses for certain index funds and diversified international funds; (v) continuing to launch dedicated lower cost underlying funds to meet portfolio construction needs related to expanding underlying fund options for Fidelity funds of funds, specifically for the Freedom Fund product lines; (vi) rationalizing product lines and gaining increased efficiencies through fund mergers; (vii) launching active fixed-income exchange-traded funds; (viii) continuing to develop, acquire and implement systems and technology to improve services to the funds and information security and to increase efficiency; (ix) implementing investment enhancements to further strengthen Fidelity's target date product line to increase investors' probability of success in achieving their goals; (x) modifying the eligibility criteria for certain share classes to accommodate roll-over assets from employer-sponsored retirement plans; (xi) launching a new Class W of the Freedom Index Funds to attract and retain Fidelity record-kept retirement plan assets; and (xii) implementing changes to Fidelity's money market product line in response to recent money market regulatory reforms.
Investment Performance. The Board considered whether the fund has operated in accordance with its investment objective, as well as its record of compliance with its investment restrictions and its performance history.
Annual Report
Board Approval of Investment Advisory Contracts and
Management Fees - continued
The Board took into account discussions with representatives of the Investment Advisers about fund investment performance that occur at Board meetings throughout the year. In this regard the Board noted that as part of regularly scheduled fund reviews and other reports to the Board on fund performance, the Board considers annualized return information for the fund, for different time periods, measured against a securities market index ("benchmark index") and a peer group of funds with similar objectives ("peer group"), if any. In its evaluation of fund investment performance, the Board gave particular attention to information indicating changes in performance of certain Fidelity funds for specific time periods and discussed with the Investment Advisers the reasons for any overperformance or underperformance.
In addition to reviewing absolute and relative fund performance, the Independent Trustees periodically consider the appropriateness of fund performance metrics in evaluating the results achieved. In general, the Independent Trustees believe that fund performance should be evaluated based on net performance (after fees and expenses) of both the highest performing and lowest performing fund share classes, where applicable, compared to appropriate benchmark indices, over appropriate time periods that may include full market cycles, and compared to peer groups, as applicable, over the same periods, taking into account relevant factors including the following: general market conditions; issuer-specific information; and fund cash flows and other factors.
The Independent Trustees recognize that shareholders evaluate performance on a net basis over their own holding periods, for which one-, three-, and five-year periods are often used as a proxy. For this reason, the performance information reviewed by the Board also included net cumulative calendar year total return information for the fund and an appropriate benchmark index and peer group for the most recent one-, three-, and five-year periods, as shown below. Returns are shown compared to the 25th percentile (top of box, 75% beaten) and 75th percentile (bottom of box, 25% beaten) of the peer universe. Returns of the benchmark index are "net MA," i.e., adjusted for tax withholding rates applicable to U.S.-based funds organized as Massachusetts business trusts.
Annual Report
Fidelity International Growth Fund
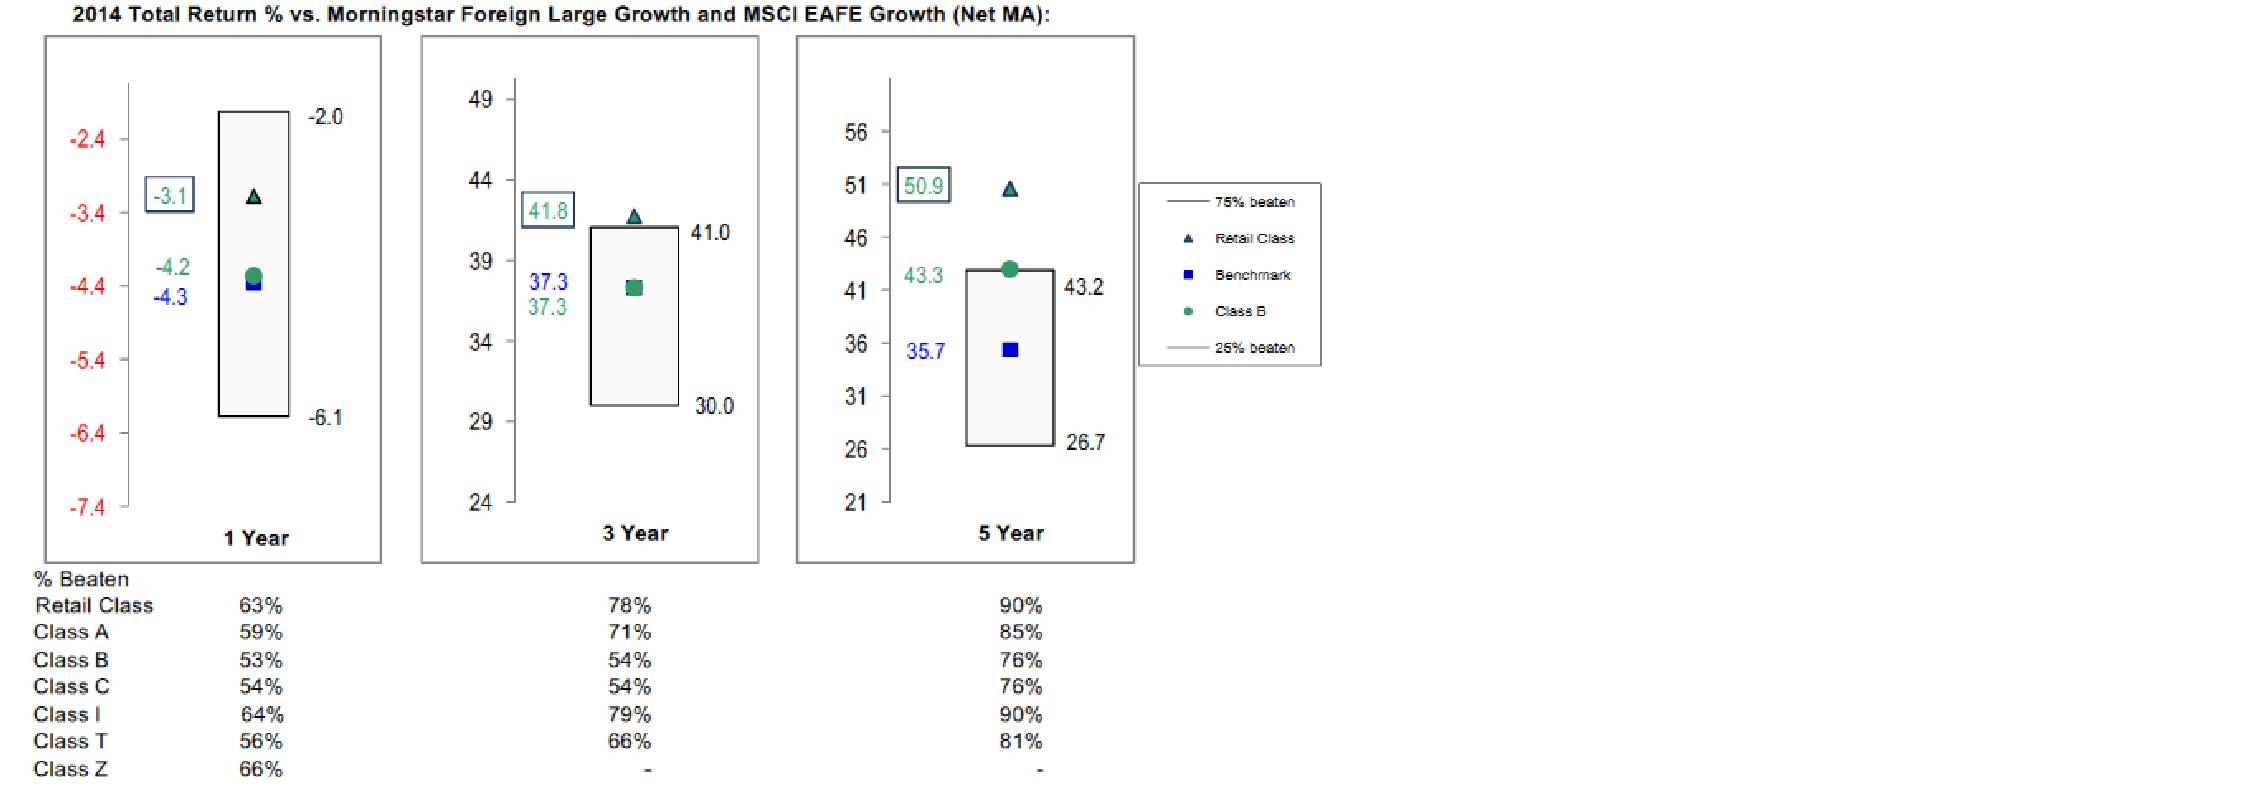
The Board also considered that the fund's management fee is subject to upward or downward adjustment depending upon whether, and to what extent, the fund's investment performance for the performance period exceeds, or is exceeded by, a securities index, thus leading to a performance adjustment for the same period. The Board noted that the performance adjustment provides FMR with a strong economic incentive to seek to achieve superior performance for the fund's shareholders and helps to more closely align the interests of FMR and the shareholders of the fund.
Based on its review, the Board concluded that the nature, extent, and quality of services provided to the fund under the Advisory Contracts should benefit the shareholders of the fund.
Competitiveness of Management Fee and Total Expense Ratio. The Board considered the fund's management fee and total expense ratio compared to "mapped groups" of competitive funds and classes created for the purpose of facilitating the Trustees' competitive analysis of management fees and total expenses. Fidelity creates "mapped groups" by combining similar Lipper investment objective categories that have comparable investment mandates. Combining Lipper investment objective categories aids the Board's management fee and total expense ratio comparisons by broadening the competitive group used for comparison.
Management Fee. The Board considered two proprietary management fee comparisons for the 12-month periods shown in basis points (BP) in the chart below. The group of Lipper funds used by the Board for management fee comparisons is referred to below as the "Total Mapped Group." The Total Mapped Group comparison focuses on a fund's standing in terms of gross management fees before expense reimbursements or caps, and without giving effect to the fund's performance adjustment, relative to the total universe of funds with comparable investment mandates, regardless of whether their management fee structures also are comparable. Funds with comparable investment mandates offer exposure to similar types of securities. Funds with comparable management fee structures have similar management fee contractual arrangements (e.g., flat rate charged for advisory services, all-inclusive fee rate, etc.). "TMG %" represents the percentage of funds in the Total Mapped Group that had management fees that were lower than the fund's. For example, a hypothetical TMG % of 20% would mean that 80% of the funds in the Total Mapped Group had higher, and 20% had lower, management fees than the fund. The fund's actual TMG %s and the number of funds in the Total Mapped Group are in the chart below. The "Asset-Size Peer Group" (ASPG) comparison focuses on a fund's standing relative to a subset of non-Fidelity funds within the Total Mapped Group that are similar in size and management fee structure without taking into account performance adjustments, if any. For example, if a fund is in the first quartile of the ASPG, the fund's management fee ranks in the least expensive or lowest 25% of funds in the ASPG. The ASPG represents at least 15% of the funds in the Total Mapped Group with comparable asset size and management fee structures, subject to a minimum of 50 funds (or all funds in the Total Mapped Group if fewer than 50). Additional information, such as the ASPG quartile in which the fund's management fee rate ranked and the impact of the fund's performance adjustment, is also included in the chart and considered by the Board.
Annual Report
Board Approval of Investment Advisory Contracts and
Management Fees - continued
Fidelity International Growth Fund

Annual Report
The Board noted that the fund's management fee rate ranked below the median of its Total Mapped Group and below the median of its ASPG for 2014. The Board also noted the effect of the fund's performance adjustment, if any, on the fund's management fee ranking.
The Board noted that, in 2014, the ad hoc Committee on Group Fee was formed by it and other Fidelity fund boards to conduct an in-depth review of the "group fee" component of the management fee of funds with such management fee structures. Committee focus included the mechanics of the group fee, the competitive landscape of group fee structures, Fidelity funds with no group fee component and investment products not included in group fee assets. The Board also considered that, for funds subject to the group fee, FMR agreed to voluntarily waive fees over a specified period of time in amounts designed to account for assets converted from certain funds to certain collective investment trusts.
The Board also noted that, in 2013, the ad hoc Committee on Management Fees was formed to conduct an in-depth review of the management fee rates of Fidelity's active equity mutual funds. The Committee focused on the following areas: (i) standard fee structures; (ii) research consumption and trading evolution; (iii) management fee competitiveness/profitability by category; and (iv) factors that drive institutional pricing.
Based on its review, the Board concluded that the fund's management fee is fair and reasonable in light of the services that the fund receives and the other factors considered.
Total Expense Ratio. In its review of each class's total expense ratio, the Board considered the fund's management fee as well as other fund or class expenses, as applicable, such as transfer agent fees, pricing and bookkeeping fees, fund-paid 12b-1 fees, and custodial, legal, and audit fees. The Board noted the impact of the fund's performance adjustment. The Board also noted that Fidelity may agree to waive fees and expenses from time to time, and the extent to which, if any, it has done so for the fund. As part of its review, the Board also considered the current and historical total expense ratios of each class of the fund compared to competitive fund median expenses. Each class of the fund is compared to those funds and classes in the Total Mapped Group (used by the Board for management fee comparisons) that have a similar sales load structure.
The Board noted that the total expense ratio of each of Class A, Class I, Class Z, and the retail class ranked below its competitive median for 2014 and the total expense ratio of each of Class T, Class B, and Class C ranked above its competitive median for 2014. The Board considered that, in general, various factors can affect total expense ratios. The Board noted that the total expense ratio of Class T was above the competitive median primarily because of higher 12b-1 fees on Class T as compared to most competitor funds. Class T has a higher 12b-1 fee, but a lower front-end sales charge, than traditionally priced front-end sales charge classes. The Board considered that Class T is primarily sold load-waived in the retirement plan market where its 0.50% 12b-1 fee is comparable to competing no-load, higher 12b-1 fee classes designed specifically for retirement plans. The Board noted that the fund offers multiple classes, each of which has a different sales load and 12b-1 fee structure, and that the multiple structures are intended to offer a range of pricing options for the intermediary market. The Board also noted that the total expense ratios of the classes vary primarily by the level of their 12b-1 fees, although differences in transfer agent fees may also cause expenses to vary from class to class.
Annual Report
Board Approval of Investment Advisory Contracts and
Management Fees - continued
The Board further considered that FMR contractually agreed to reimburse Class A, Class T, Class B, Class C, Class I, Class Z, and the retail class of the fund to the extent that total operating expenses (excluding interest, certain taxes, certain securities lending costs, brokerage commissions, extraordinary expenses, and acquired fund fees and expenses, if any), as a percentage of their respective average net assets, exceed 1.45%, 1.70%, 2.20%, 2.20%, 1.20%, 1.05%, and 1.20% through December 31, 2015.
Fees Charged to Other Fidelity Clients. The Board also considered Fidelity fee structures and other information with respect to clients of Fidelity, such as other funds advised or subadvised by Fidelity, pension plan clients, and other institutional clients with similar mandates. The Board noted the findings of the 2013 ad hoc joint committee (created with the board of other Fidelity funds), which reviewed and compared Fidelity's institutional investment advisory business with its business of providing services to the Fidelity funds, including the differences in services provided, fees charged, and costs incurred, as well as competition in their respective marketplaces.
Based on its review of total expense ratios and fees charged to other Fidelity clients, the Board concluded that, although in some cases above the median of the universe presented for comparison, the total expense ratio of each class of the fund was reasonable in light of the services that the fund and its shareholders receive and the other factors considered.
Costs of the Services and Profitability. The Board considered the revenues earned and the expenses incurred by Fidelity in conducting the business of developing, marketing, distributing, managing, administering and servicing the fund and servicing the fund's shareholders. The Board also considered the level of Fidelity's profits in respect of all the Fidelity funds.
On an annual basis, Fidelity presents to the Board information about the profitability of its relationship with the fund. Fidelity calculates profitability information for each fund, as well as aggregate profitability information for groups of Fidelity funds and all Fidelity funds, using a series of detailed revenue and cost allocation methodologies which originate with the books and records of Fidelity on which Fidelity's audited financial statements are based. The Audit Committee of the Board reviews any significant changes from the prior year's methodologies.
Annual Report
PricewaterhouseCoopers LLP (PwC), independent registered public accounting firm and auditor to Fidelity and certain Fidelity funds, has been engaged annually by the Board as part of the Board's assessment of Fidelity's profitability analysis. PwC's engagement includes the review and assessment of the methodologies used by Fidelity in determining the revenues and expenses attributable to Fidelity's mutual fund business, and completion of agreed-upon procedures in respect of the mathematical accuracy of fund profitability and its conformity to established allocation methodologies. After considering PwC's reports issued under the engagement and information provided by Fidelity, the Board concluded that while other allocation methods may also be reasonable, Fidelity's profitability methodologies are reasonable in all material respects.
The Board also reviewed Fidelity's non-fund businesses and fall-out benefits related to the mutual fund business as well as cases where Fidelity's affiliates may benefit from or be related to the fund's business.
The Board considered the costs of the services provided by and the profits realized by Fidelity in connection with the operation of the fund and was satisfied that the profitability was not excessive.
Economies of Scale. The Board considered whether there have been economies of scale in respect of the management of the Fidelity funds, whether the Fidelity funds (including the fund) have appropriately benefited from any such economies of scale, and whether there is potential for realization of any further economies of scale. The Board considered the extent to which the fund will benefit from economies of scale as assets grow through increased services to the fund, through waivers or reimbursements, or through fee or expense ratio reductions. The Board also noted that in 2013, it and the boards of other Fidelity funds created an ad hoc committee (the Economies of Scale Committee) to analyze whether Fidelity attains economies of scale in respect of the management and servicing of the Fidelity funds, whether the Fidelity funds have appropriately benefited from such economies of scale, and whether there is potential for realization of any further economies of scale.
The Board recognized that the fund's management contract incorporates a "group fee" structure, which provides for lower group fee rates as total group assets increase, and for higher group fee rates as total group assets decrease (with "group assets" defined to include fund assets under FMR's management plus sector fund assets previously under FMR's management and currently managed by Fidelity SelectCo, LLC). FMR calculates the group fee rates based on a tiered asset "breakpoint" schedule that varies based on asset class. The Board considered that the group fee is designed to deliver the benefits of economies of scale to fund shareholders when total Fidelity fund assets increase, even if assets of any particular fund are unchanged or have declined, because some portion of Fidelity's costs are attributable to services provided to all Fidelity funds, and all funds benefit if those costs can be allocated among more assets. The Board concluded that, given the group fee structure, fund shareholders will benefit from lower management fees as group assets increase at the fund complex level, regardless of whether Fidelity achieves any such economies of scale.
Annual Report
Board Approval of Investment Advisory Contracts and
Management Fees - continued
The Board concluded, taking into account the analysis of the Economies of Scale Committee, that economies of scale, if any, are being appropriately shared between fund shareholders and Fidelity.
Additional Information Requested by the Board. In order to develop fully the factual basis for consideration of the Fidelity funds' Advisory Contracts, the Board requested and received additional information on certain topics, including: (i) fund performance trends and Fidelity's long-term strategies for certain funds; (ii) the various share classes employed by Fidelity and the attributes of each class, together with similar information on the distribution and servicing payments made by Fidelity or the funds to third-party participants in the distribution channels; (iii) fund profitability, and fund performance in relation to fund profitability; (iv) the methodology with respect to evaluating competitive fund data and peer group classifications and fee comparisons; (v) annual fund profitability margins, with particular focus on certain funds with negative margins; (vi) the realization of fall-out benefits in certain Fidelity business units; (vii) economies of scale and the way in which they are shared with fund shareholders; (viii) Fidelity's group fee structures, including the group fee schedule of breakpoints; (ix) the impact of cost containment measures on the funds; and (x) the transfer agent fee structure.
Based on its evaluation of all of the conclusions noted above, and after considering all factors it believed relevant, the Board concluded that the advisory fee structures are fair and reasonable, and that the fund's Advisory Contracts should be renewed.
Annual Report
Investment Adviser
Fidelity Management & Research Company
Boston, MA
Investment Sub-Advisers
FMR Co., Inc.
FMR Investment Management
(U.K.) Limited
Fidelity Management & Research
(Hong Kong) Limited
Fidelity Management & Research
(Japan) Limited
FIL Investment Advisors
FIL Investments (Japan) Limited
FIL Investment Advisors
(UK) Limited
General Distributor
Fidelity Distributors Corporation
Smithfield, RI
Transfer and Service Agent
Fidelity Investments Institutional
Operations Company, Inc.
Boston, MA
Fidelity Service Company, Inc.
Boston, MA
Custodian
State Street Bank and Trust Company
Quincy, MA
The Fidelity Telephone Connection
Mutual Fund 24-Hour Service
Exchanges/Redemptions
and Account Assistance 1-800-544-6666
Product Information 1-800-544-8888
Retirement Accounts 1-800-544-4774
(8 a.m. - 9 p.m.)
TDD Service 1-800-544-0118
for the deaf and hearing impaired
(9 a.m. - 9 p.m. Eastern time)
Fidelity Automated Service
Telephone (FAST®)
1-800-544-5555

Automated line for quickest service
(Fidelity Investment logo)(registered trademark)
Corporate Headquarters
245 Summer St., Boston, MA 02210
www.fidelity.com
IGF-UANN-1215
1.912349.105
ContentsPerformance: The Bottom LineManagement's Discussion of Fund PerformanceShareholder Expense ExampleInvestment Changes (Unaudited)Investments October 31, 2015Financial StatementsNotes to Financial StatementsReport of Independent Registered Public Accounting FirmTrustees and OfficersDistributions (Unaudited)Board Approval of Investment Advisory Contracts and Management Fees
(Fidelity Investment logo)(registered trademark)
Fidelity Advisor®
International Discovery
Fund - Class A, Class T, Class B
and Class C
Annual Report
October 31, 2015
(Fidelity Cover Art)
Class A, Class T, Class B, and Class C are classes of Fidelity® International Discovery Fund
Contents
Performance | (Click Here) | How the fund has done over time. |
Management's Discussion of Fund Performance | (Click Here) | The Portfolio Manager's review of fund performance and strategy. |
Shareholder Expense Example | (Click Here) | An example of shareholder expenses. |
Investment Changes | (Click Here) | A summary of major shifts in the fund's investments over the past six months. |
Investments | (Click Here) | A complete list of the fund's investments with their market values. |
Financial Statements | (Click Here) | Statements of assets and liabilities, operations, and changes in net assets, as well as financial highlights. |
Notes | (Click Here) | Notes to financial statements. |
Report of Independent Registered Public Accounting Firm | (Click Here) | |
Trustees and Officers | (Click Here) | |
Distributions | (Click Here) | |
Board Approval of Investment Advisory Contracts and Management Fees | (Click Here) | |
To view a fund's proxy voting guidelines and proxy voting record for the 12-month period ended June 30, visit http://www.fidelity.com/proxyvotingresults or visit the Securities and Exchange Commission's (SEC) web site at http://www.sec.gov. You may also call 1-877-208-0098 to request a free copy of the proxy voting guidelines.
Standard & Poor's, S&P and S&P 500 are registered service marks of The McGraw-Hill Companies, Inc. and have been licensed for use by Fidelity Distributors Corporation.
Other third-party marks appearing herein are the property of their respective owners.
All other marks appearing herein are registered or unregistered trademarks or service marks of FMR LLC or an affiliated company. © 2015 FMR LLC. All rights reserved.
Annual Report
This report and the financial statements contained herein are submitted for the general information of the shareholders of the fund. This report is not authorized for distribution to prospective investors in the fund unless preceded or accompanied by an effective prospectus.
A fund files its complete schedule of portfolio holdings with the SEC for the first and third quarters of each fiscal year on Form N-Q. Forms N-Q are available on the SEC's web site at http://www.sec.gov. A fund's Forms N-Q may be reviewed and copied at the SEC's Public Reference Room in Washington, DC. Information regarding the operation of the SEC's Public Reference Room may be obtained by calling 1-800-SEC-0330. For a complete list of a fund's portfolio holdings, view the most recent holdings listing, semiannual report, or annual report on Fidelity's web site at http://www.fidelity.com, http://www.advisor.fidelity.com, or http://www.401k.com, as applicable.
NOT FDIC INSURED • MAY LOSE VALUE • NO BANK GUARANTEE
Neither the fund nor Fidelity Distributors Corporation is a bank.
Annual Report
Average annual total return reflects the change in the value of an investment, assuming reinvestment of the class' distributions from dividend income and capital gains (the profits earned upon the sale of securities that have grown in value, if any) and assuming a constant rate of performance each year. The $10,000 table and the fund's returns do not reflect the deduction of taxes that a shareholder would pay on fund distributions or the redemption of fund shares. During periods of reimbursement by Fidelity, a fund's total return will be greater than it would be had the reimbursement not occurred. How a fund did yesterday is no guarantee of how it will do tomorrow. Returns reflect the conversion of Class B shares to Class A shares after a maximum of seven years.
Average Annual Total Returns
Periods ended October 31, 2015 | Past 1
year | Past 5
years | Past 10
years |
Class A (incl. 5.75% sales charge) | -2.84% | 4.44% | 4.33% |
Class T (incl. 3.50% sales charge) | -0.74% | 4.68% | 4.28% |
Class B (incl. contingent deferred sales charge) A | -2.70% | 4.55% | 4.35% |
Class C (incl. contingent deferred sales charge) B | 1.33% | 4.90% | 4.13% |
A Class B shares' contingent deferred sales charges included in the past one year, past five year, and past 10 year total return figures are 5%, 2%, and 0% respectively.
B Class C shares' contingent deferred sales charges included in the past one year, past five year, and past 10 year total return figures are 1%, 0%, and 0% respectively.
Annual Report
$10,000 Over 10 Years
Let's say hypothetically that $10,000 was invested in Fidelity Advisor® International Discovery Fund - Class A on October 31, 2005 and the current 5.75% sales charge was paid. The chart shows how the value of your investment would have changed, and also shows how the MSCI EAFE Index performed over the same period.
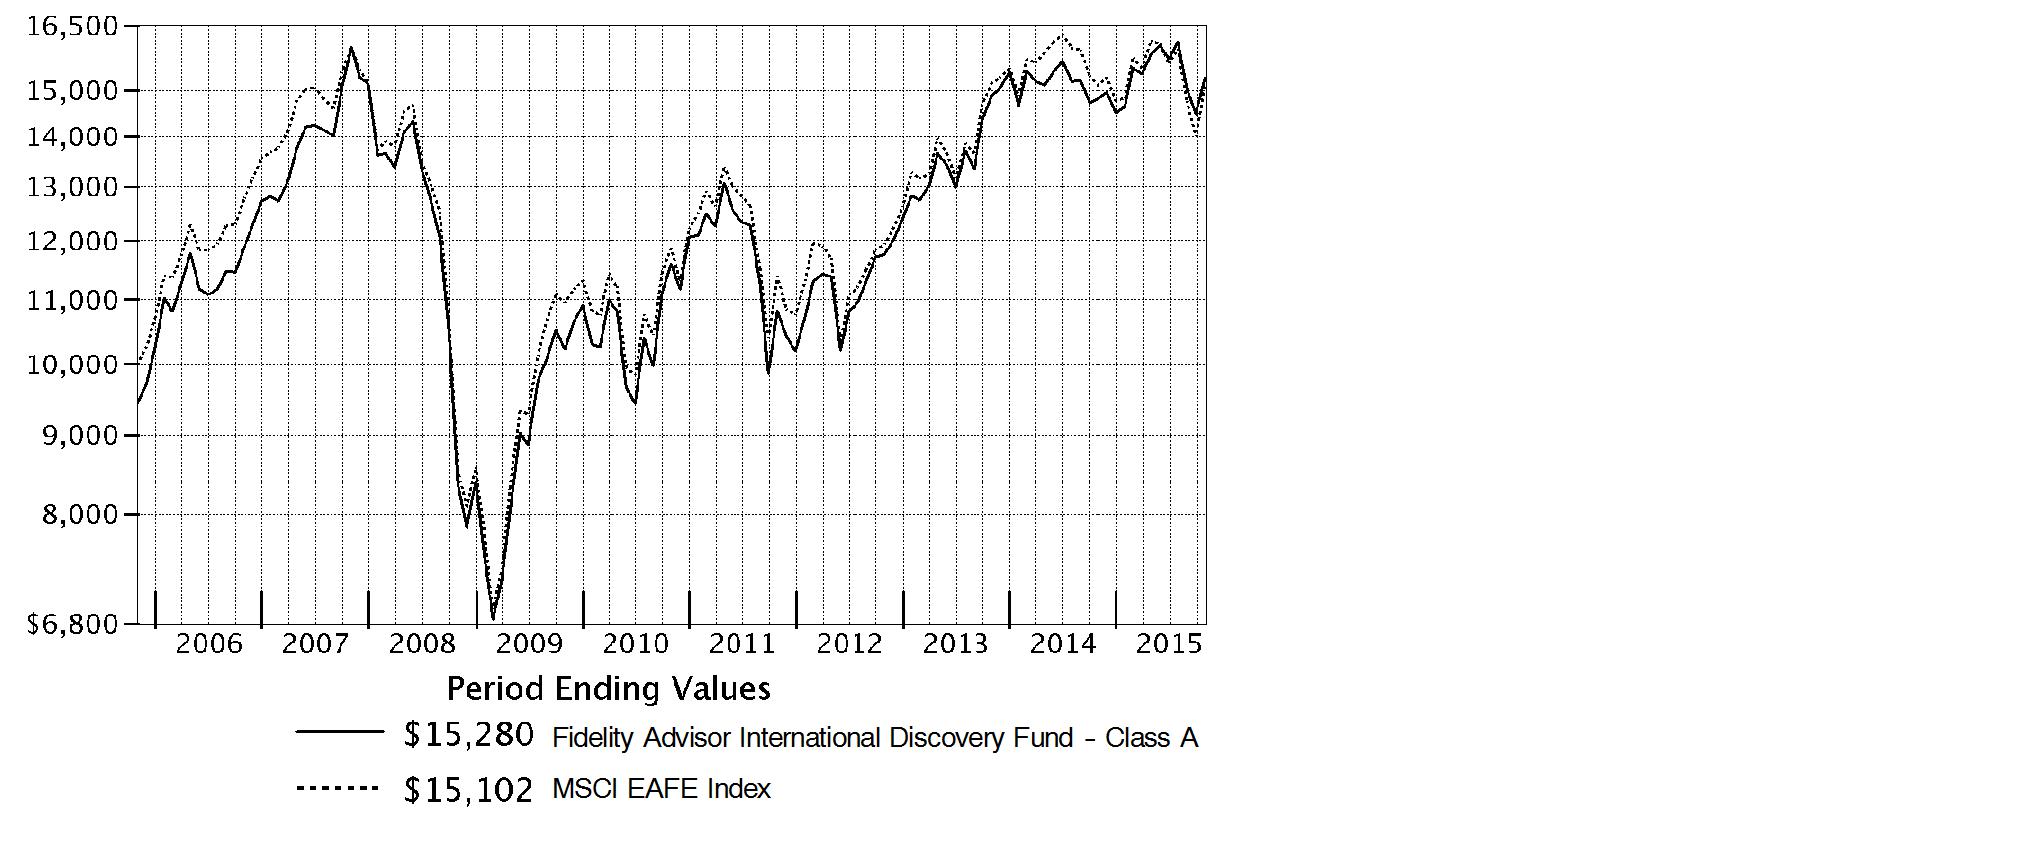
Annual Report
Market Recap: International equities suffered a moderate setback for the 12 months ending October 31, 2015, held back by a collapse in commodities prices that hurt resources-related sectors and geographies. The MSCI ACWI (All Country World Index) ex USA Index returned -4.55% for the period, affected also by concerns about global economic growth. Commodity producers remained under pressure for much of the past year, largely related to economic deceleration in China (-1%), the world's second-largest economy and a leading consumer of raw materials. This effect was exacerbated by U.S. dollar strength relative to global currencies, which weighed on commodities priced in dollars and acutely impacted equity returns within regions most exposed to resources prices. The emerging-markets group, for example, returned about -15% this period. Canada, a significant energy producer, returned roughly -17%. Net energy consumer Japan (+9%) was the best-performing region by far. Only about a quarter of the nearly 50 index countries managed a gain this period: Ireland (+19%) - the EU's fastest-growing economy - and Israel (+17%) proved top performers; Greece (-56%) and Brazil (-46%), among the worst. As for sectors, energy (-25%) and materials (-16%) declined sharply, whereas the two consumer sectors each gained about 6%.
Comments from Portfolio Manager William Kennedy: For the year, the fund's share classes (excluding sales charges, if applicable) outpaced the 0.08% return of the benchmark MSCI EAFE Index. Most of the fund's outperformance came from security selection in the financials and consumer discretionary sectors, favorable positioning in continental Europe and Asia Pacific ex Japan and stock picks in the United Kingdom. Sector allocations gave an added boost. In terms of top individual contributors, an average underweighting in U.K.-listed oil and gas company Royal Dutch Shell helped, as plunging oil prices caused the stock to decline. An out-of-index stake in Constellation Software returned roughly 55%, as the Canadian company's track record of smart acquisitions drove better-than-expected earnings growth. Another winner was Luxembourg-based media company Altice, which saw its entrepreneurial management team and appetite for acquisitions drive a huge gain. By contrast, the fund's underweighting in Japan modestly hindered relative performance. In terms of individual detractors, an overweighting in France-based exploration and production company Total hurt as oil prices slid. A tiny out-of-index stake in Australia-based online fashion retailer MySale Group detracted when a profit warning sank the stock. Altice and MySale were not in the portfolio at period end.
The views expressed above reflect those of the portfolio manager(s) only through the end of the period as stated on the cover of this report and do not necessarily represent the views of Fidelity or any other person in the Fidelity organization. Any such views are subject to change at any time based upon market or other conditions and Fidelity disclaims any responsibility to update such views. These views may not be relied on as investment advice and, because investment decisions for a Fidelity fund are based on numerous factors, may not be relied on as an indication of trading intent on behalf of any Fidelity fund.
Annual Report
Shareholder Expense Example
As a shareholder of the Fund, you incur two types of costs: (1) transaction costs, including sales charges (loads) on purchase payments or redemption proceeds, redemption fees and (2) ongoing costs, including management fees, distribution and/or service (12b-1) fees and other Fund expenses. This Example is intended to help you understand your ongoing costs (in dollars) of investing in the Fund and to compare these costs with the ongoing costs of investing in other mutual funds.
The Example is based on an investment of $1,000 invested at the beginning of the period and held for the entire period (May 1, 2015 to October 31, 2015).
Actual Expenses
The first line of the accompanying table for each class of the Fund provides information about actual account values and actual expenses. You may use the information in this line, together with the amount you invested, to estimate the expenses that you paid over the period. Simply divide your account value by $1,000.00 (for example, an $8,600 account value divided by $1,000.00 = 8.6), then multiply the result by the number in the first line for a class of the Fund under the heading entitled "Expenses Paid During Period" to estimate the expenses you paid on your account during this period. A small balance maintenance fee of $12.00 that is charged once a year may apply for certain accounts with a value of less than $2,000. This fee is not included in the table below. If it was, the estimate of expenses you paid during the period would be higher, and your ending account value lower, by this amount. In addition, the Fund, as a shareholder in the underlying Fidelity Central Funds, will indirectly bear its pro-rata share of the fees and expenses incurred by the underlying Fidelity Central Funds. These fees and expenses are not included in the Fund's annualized expense ratio used to calculate the expense estimate in the table below.
Hypothetical Example for Comparison Purposes
The second line of the accompanying table for each class of the Fund provides information about hypothetical account values and hypothetical expenses based on a Class' actual expense ratio and an assumed rate of return of 5% per year before expenses, which is not the Class' actual return. The hypothetical account values and expenses may not be used to estimate the actual ending account balance or expenses you paid for the period. You may use this information to compare the ongoing costs of investing in the Fund and other funds. To do so, compare this 5% hypothetical example with the 5% hypothetical examples that appear in the shareholder reports of the other funds. A small balance maintenance fee of $12.00 that is charged once a year may apply for certain accounts with a value of less than $2,000. This fee is not included in the table below. If it was, the estimate of expenses you paid during the period would be higher, and your ending account value lower, by this amount. In addition, the Fund, as a shareholder in the underlying Fidelity Central Funds, will indirectly bear its pro-rata share of the fees and expenses incurred by the underlying Fidelity Central Funds. These fees and expenses are not included in the Fund's annualized expense ratio used to calculate the expense estimate in the table below.
Please note that the expenses shown in the table are meant to highlight your ongoing costs only and do not reflect any transaction costs. Therefore, the second line of the table is useful in comparing ongoing costs only, and will not help you determine the relative total costs of owning different funds. In addition, if these transactional costs were included, your costs would have been higher.
Annual Report
| Annualized
Expense RatioB | Beginning
Account Value
May 1, 2015 | Ending
Account Value
October 31, 2015 | Expenses Paid
During PeriodC
May 1, 2015 to
October 31, 2015 |
Class A | 1.33% | | | |
Actual | | $ 1,000.00 | $ 965.80 | $ 6.59 |
HypotheticalA | | $ 1,000.00 | $ 1,018.50 | $ 6.77 |
Class T | 1.57% | | | |
Actual | | $ 1,000.00 | $ 964.80 | $ 7.78 |
HypotheticalA | | $ 1,000.00 | $ 1,017.29 | $ 7.98 |
Class B | 2.11% | | | |
Actual | | $ 1,000.00 | $ 962.00 | $ 10.43 |
HypotheticalA | | $ 1,000.00 | $ 1,014.57 | $ 10.71 |
Class C | 2.09% | | | |
Actual | | $ 1,000.00 | $ 962.10 | $ 10.34 |
HypotheticalA | | $ 1,000.00 | $ 1,014.67 | $ 10.61 |
International Discovery | .99% | | | |
Actual | | $ 1,000.00 | $ 967.70 | $ 4.91 |
HypotheticalA | | $ 1,000.00 | $ 1,020.21 | $ 5.04 |
Class K | .86% | | | |
Actual | | $ 1,000.00 | $ 968.10 | $ 4.27 |
HypotheticalA | | $ 1,000.00 | $ 1,020.87 | $ 4.38 |
Class I | 1.00% | | | |
Actual | | $ 1,000.00 | $ 967.40 | $ 4.96 |
HypotheticalA | | $ 1,000.00 | $ 1,020.16 | $ 5.09 |
Class Z | .87% | | | |
Actual | | $ 1,000.00 | $ 968.10 | $ 4.32 |
HypotheticalA | | $ 1,000.00 | $ 1,020.82 | $ 4.43 |
A 5% return per year before expenses
B Annualized expense ratio reflects expenses net of applicable fee waivers.
C Expenses are equal to each Class' annualized expense ratio, multiplied by the average account value over the period, multiplied by 184/365 (to reflect the one-half year period).
Annual Report
Investment Changes (Unaudited)
Annual Report
Asset Allocation as of October 31, 2015 |
| % of fund's
net assets | % of fund's net assets
6 months ago |
Stocks and Equity Futures | 97.5 | 99.1 |
Other Investments | 0.1 | 0.1 |
Short-Term Investments and Net Other Assets (Liabilities) | 2.4 | 0.8 |
Top Ten Stocks as of October 31, 2015 |
| % of fund's
net assets | % of fund's net assets
6 months ago |
Total SA (France, Oil, Gas & Consumable Fuels) | 2.0 | 1.8 |
Novartis AG (Switzerland, Pharmaceuticals) | 1.8 | 1.7 |
Unilever NV (Certificaten Van Aandelen) (Bearer) (Netherlands, Personal Products) | 1.6 | 1.5 |
Anheuser-Busch InBev SA NV (Belgium, Beverages) | 1.4 | 1.6 |
AIA Group Ltd. (Hong Kong, Insurance) | 1.3 | 1.3 |
Techtronic Industries Co. Ltd. (Hong Kong, Household Durables) | 1.3 | 1.2 |
Housing Development Finance Corp. Ltd. (India, Thrifts & Mortgage Finance) | 1.3 | 1.2 |
Mitsubishi UFJ Financial Group, Inc. (Japan, Banks) | 1.3 | 1.2 |
Novo Nordisk A/S Series B (Denmark, Pharmaceuticals) | 1.2 | 1.1 |
KDDI Corp. (Japan, Wireless Telecommunication Services) | 1.1 | 1.1 |
| 14.3 | |
Market Sectors as of October 31, 2015 |
| % of fund's
net assets | % of fund's net assets
6 months ago |
Financials | 24.2 | 24.6 |
Consumer Discretionary | 17.4 | 16.9 |
Health Care | 12.8 | 13.2 |
Consumer Staples | 11.9 | 9.5 |
Industrials | 10.5 | 10.9 |
Information Technology | 7.5 | 9.7 |
Telecommunication Services | 4.9 | 4.7 |
Energy | 4.3 | 5.0 |
Materials | 2.3 | 3.0 |
Annual Report
Investments October 31, 2015
Showing Percentage of Net Assets
Common Stocks - 95.5% |
| Shares | | Value (000s) |
Australia - 1.7% |
1-Page Ltd. (a) | 2,546,348 | | $ 8,566 |
Ansell Ltd. | 1,597,592 | | 22,734 |
Australia & New Zealand Banking Group Ltd. | 3,558,240 | | 68,817 |
Flight Centre Travel Group Ltd. (d) | 485,418 | | 13,059 |
Mantra Group Ltd. | 7,839,732 | | 22,935 |
Ramsay Health Care Ltd. | 1,171,082 | | 51,478 |
TOTAL AUSTRALIA | | 187,589 |
Austria - 0.3% |
Andritz AG | 447,100 | | 22,518 |
Erste Group Bank AG (a) | 456,800 | | 13,397 |
TOTAL AUSTRIA | | 35,915 |
Bailiwick of Jersey - 1.7% |
Integrated Diagnostics Holdings PLC (a) | 4,961,400 | | 27,337 |
Regus PLC | 11,120,488 | | 57,362 |
Shire PLC | 588,700 | | 44,583 |
Wolseley PLC | 1,048,393 | | 61,553 |
TOTAL BAILIWICK OF JERSEY | | 190,835 |
Belgium - 1.9% |
Anheuser-Busch InBev SA NV | 1,256,127 | | 149,887 |
KBC Groep NV | 955,745 | | 58,225 |
TOTAL BELGIUM | | 208,112 |
Bermuda - 0.5% |
PAX Global Technology Ltd. | 43,428,000 | | 56,789 |
Canada - 2.2% |
Alimentation Couche-Tard, Inc. Class B (sub. vtg.) | 786,100 | | 33,816 |
Constellation Software, Inc. | 230,700 | | 99,683 |
Entertainment One Ltd. | 3,283,077 | | 11,119 |
Imperial Oil Ltd. | 1,249,100 | | 41,563 |
PrairieSky Royalty Ltd. (d) | 1,502,800 | | 29,571 |
Suncor Energy, Inc. | 680,200 | | 20,241 |
TOTAL CANADA | | 235,993 |
Cayman Islands - 1.3% |
Alibaba Group Holding Ltd. sponsored ADR (a) | 385,500 | | 32,316 |
CK Hutchison Holdings Ltd. | 1,264,716 | | 17,318 |
Ctrip.com International Ltd. sponsored ADR (a) | 148,100 | | 13,769 |
Lee's Pharmaceutical Holdings Ltd. | 6,774,164 | | 8,746 |
Qunar Cayman Islands Ltd. sponsored ADR (a) | 515,900 | | 25,042 |
Common Stocks - continued |
| Shares | | Value (000s) |
Cayman Islands - continued |
Regina Miracle International Holdings Ltd. | 15,269,891 | | $ 13,845 |
WuXi PharmaTech Cayman, Inc. sponsored ADR (a) | 826,200 | | 36,931 |
TOTAL CAYMAN ISLANDS | | 147,967 |
China - 0.5% |
Jiangsu Hengrui Medicine Co. Ltd. | 4,183,623 | | 34,711 |
Kweichow Moutai Co. Ltd. | 663,582 | | 22,405 |
Yantai Changyu Pioneer Wine Co. Ltd. (B Shares) | 697,195 | | 2,215 |
TOTAL CHINA | | 59,331 |
Cyprus - 0.0% |
SPDI Secure Property Development & Investment PLC (a) | 520,230 | | 229 |
Denmark - 1.2% |
Novo Nordisk A/S Series B | 2,385,545 | | 126,681 |
Finland - 0.7% |
Sampo Oyj (A Shares) | 1,663,200 | | 81,351 |
France - 9.6% |
Accor SA | 1,694,818 | | 84,314 |
Air Liquide SA | 429,100 | | 55,632 |
ALTEN | 88,659 | | 4,602 |
Atos Origin SA | 441,674 | | 35,237 |
AXA SA | 3,834,100 | | 102,325 |
Capgemini SA | 860,800 | | 76,701 |
Cegedim SA (a) | 539,590 | | 19,136 |
Havas SA | 4,843,944 | | 42,027 |
Numericable Group SA (a) | 340,324 | | 15,419 |
Rexel SA | 1,265,582 | | 17,299 |
Safran SA | 614,700 | | 46,689 |
Sanofi SA | 992,072 | | 100,076 |
Sodexo SA | 433,700 | | 38,616 |
SR Teleperformance SA | 291,800 | | 22,936 |
Total SA (d) | 4,569,799 | | 220,991 |
Unibail-Rodamco | 157,400 | | 43,981 |
VINCI SA | 1,425,100 | | 96,189 |
Vivendi SA | 1,148,200 | | 27,622 |
TOTAL FRANCE | | 1,049,792 |
Germany - 5.5% |
Aareal Bank AG | 1,026,009 | | 39,094 |
Axel Springer Verlag AG | 526,702 | | 29,620 |
Beiersdorf AG | 244,300 | | 23,219 |
Continental AG | 299,300 | | 71,980 |
Common Stocks - continued |
| Shares | | Value (000s) |
Germany - continued |
Deutsche Boerse AG | 529,594 | | $ 48,773 |
Deutsche Telekom AG | 3,260,600 | | 61,076 |
Fresenius SE & Co. KGaA | 471,500 | | 34,647 |
GEA Group AG | 884,110 | | 35,452 |
KION Group AG | 1,377,249 | | 62,109 |
LEG Immobilien AG | 254,661 | | 20,317 |
OSRAM Licht AG | 1,016,232 | | 59,797 |
ProSiebenSat.1 Media AG | 1,176,900 | | 63,661 |
Rational AG | 84,000 | | 33,350 |
United Internet AG | 433,247 | | 22,513 |
TOTAL GERMANY | | 605,608 |
Hong Kong - 3.0% |
AIA Group Ltd. | 24,849,200 | | 145,699 |
China Resources Beer Holdings Co. Ltd. | 21,482,000 | | 40,562 |
Techtronic Industries Co. Ltd. | 38,670,000 | | 141,365 |
TOTAL HONG KONG | | 327,626 |
India - 3.0% |
Bharti Infratel Ltd. (a) | 12,647,734 | | 75,119 |
HDFC Bank Ltd. sponsored ADR | 1,298,584 | | 79,395 |
Housing Development Finance Corp. Ltd. | 7,355,732 | | 140,900 |
Lupin Ltd. | 452,781 | | 13,331 |
Sun Pharmaceutical Industries Ltd. | 347,397 | | 4,721 |
Titan Co. Ltd. (a) | 2,186,522 | | 11,862 |
TOTAL INDIA | | 325,328 |
Ireland - 1.4% |
Bank of Ireland (a) | 62,440,800 | | 23,002 |
Dalata Hotel Group PLC (a) | 388,200 | | 1,930 |
Glanbia PLC | 2,527,500 | | 49,028 |
Kerry Group PLC Class A | 989,500 | | 80,465 |
TOTAL IRELAND | | 154,425 |
Isle of Man - 0.7% |
Optimal Payments PLC (a) | 11,615,044 | | 54,433 |
Playtech Ltd. | 1,395,092 | | 18,410 |
TOTAL ISLE OF MAN | | 72,843 |
Israel - 1.3% |
Frutarom Industries Ltd. | 1,038,100 | | 44,860 |
Common Stocks - continued |
| Shares | | Value (000s) |
Israel - continued |
Partner Communications Co. Ltd. (a) | 1,755,983 | | $ 7,969 |
Teva Pharmaceutical Industries Ltd. sponsored ADR | 1,558,300 | | 92,236 |
TOTAL ISRAEL | | 145,065 |
Italy - 2.9% |
De Longhi SpA | 2,630,100 | | 64,438 |
Intesa Sanpaolo SpA | 25,324,300 | | 88,222 |
Mediaset SpA | 17,602,100 | | 89,425 |
Telecom Italia SpA (a) | 50,788,000 | | 70,853 |
TOTAL ITALY | | 312,938 |
Japan - 15.9% |
ACOM Co. Ltd. (a)(d) | 5,223,800 | | 28,599 |
Aozora Bank Ltd. | 11,048,000 | | 40,381 |
Asahi Group Holdings | 1,240,200 | | 38,255 |
Astellas Pharma, Inc. | 6,994,600 | | 101,523 |
Coca-Cola Central Japan Co. Ltd. | 536,400 | | 7,539 |
Dentsu, Inc. | 1,281,800 | | 72,060 |
Don Quijote Holdings Co. Ltd. | 1,346,000 | | 49,444 |
Hitachi Ltd. | 10,000 | | 58 |
Hoya Corp. | 2,994,400 | | 123,569 |
Japan Exchange Group, Inc. | 1,932,000 | | 31,088 |
Japan Tobacco, Inc. | 1,302,700 | | 45,089 |
KDDI Corp. | 5,167,900 | | 125,055 |
Keyence Corp. | 147,360 | | 76,717 |
Misumi Group, Inc. | 3,200,000 | | 41,671 |
Mitsubishi UFJ Financial Group, Inc. | 21,656,100 | | 140,062 |
Monex Group, Inc. | 12,212,749 | | 34,330 |
NEC Corp. | 25,011,000 | | 77,159 |
Nidec Corp. | 701,900 | | 52,892 |
Olympus Corp. | 1,784,400 | | 60,190 |
ORIX Corp. | 6,891,200 | | 100,638 |
Sanken Electric Co. Ltd. | 1,393,000 | | 4,841 |
Seven & i Holdings Co. Ltd. | 931,900 | | 42,331 |
Seven Bank Ltd. | 12,110,400 | | 55,182 |
Shinsei Bank Ltd. | 32,483,000 | | 68,109 |
SoftBank Corp. | 724,300 | | 40,581 |
Sony Corp. | 2,320,500 | | 65,961 |
Sundrug Co. Ltd. | 626,200 | | 32,988 |
Tsuruha Holdings, Inc. | 1,040,400 | | 82,425 |
United Arrows Ltd. | 847,000 | | 36,490 |
Common Stocks - continued |
| Shares | | Value (000s) |
Japan - continued |
VT Holdings Co. Ltd. | 3,895,300 | | $ 24,089 |
Welcia Holdings Co. Ltd. | 964,000 | | 47,511 |
TOTAL JAPAN | | 1,746,827 |
Luxembourg - 0.8% |
Eurofins Scientific SA | 83,911 | | 30,381 |
Grand City Properties SA | 3,000,560 | | 59,920 |
TOTAL LUXEMBOURG | | 90,301 |
Marshall Islands - 0.1% |
Hoegh LNG Partners LP (e) | 715,655 | | 11,465 |
Netherlands - 4.0% |
AerCap Holdings NV (a) | 2,303,100 | | 95,579 |
Arcadis NV | 1,205,000 | | 30,411 |
IMCD Group BV | 1,938,100 | | 72,505 |
ING Groep NV (Certificaten Van Aandelen) | 4,566,600 | | 66,462 |
Unilever NV (Certificaten Van Aandelen) (Bearer) | 3,836,500 | | 173,477 |
TOTAL NETHERLANDS | | 438,434 |
New Zealand - 0.6% |
EBOS Group Ltd. | 3,173,554 | | 29,333 |
Ryman Healthcare Group Ltd. | 7,179,412 | | 38,358 |
TOTAL NEW ZEALAND | | 67,691 |
Philippines - 0.3% |
SM Investments Corp. | 1,651,390 | | 30,830 |
Portugal - 0.3% |
NOS SGPS SA | 3,466,500 | | 28,814 |
South Africa - 1.1% |
EOH Holdings Ltd. | 2,871,867 | | 31,751 |
Naspers Ltd. Class N | 593,000 | | 86,857 |
TOTAL SOUTH AFRICA | | 118,608 |
Spain - 2.5% |
Amadeus IT Holding SA Class A | 1,727,200 | | 73,617 |
Atresmedia Corporacion de Medios de Comunicacion SA | 2,218,100 | | 28,465 |
Hispania Activos Inmobiliarios SA (a) | 1,091,600 | | 16,445 |
Inditex SA | 2,302,339 | | 86,346 |
Mediaset Espana Comunicacion SA | 3,431,200 | | 41,712 |
Merlin Properties Socimi SA | 2,497,700 | | 32,025 |
TOTAL SPAIN | | 278,610 |
Common Stocks - continued |
| Shares | | Value (000s) |
Sweden - 3.1% |
ASSA ABLOY AB (B Shares) | 2,977,200 | | $ 59,226 |
Getinge AB (B Shares) | 2,702,600 | | 67,663 |
HEXPOL AB (B Shares) | 2,985,000 | | 29,069 |
Nordea Bank AB | 5,783,000 | | 63,966 |
Sandvik AB | 3,361,100 | | 31,433 |
Svenska Cellulosa AB (SCA) (B Shares) | 1,545,100 | | 45,509 |
Svenska Handelsbanken AB (A Shares) | 2,990,700 | | 40,618 |
TOTAL SWEDEN | | 337,484 |
Switzerland - 5.1% |
Credit Suisse Group AG (h)(k) | 3,643,900 | | 83,867 |
EFG International | 1,747,368 | | 17,554 |
GAM Holding Ltd. | 1,413,451 | | 25,882 |
Julius Baer Group Ltd. | 955,230 | | 47,363 |
Novartis AG | 2,126,476 | | 192,635 |
Partners Group Holding AG | 225,896 | | 81,816 |
Schindler Holding AG (participation certificate) | 182,339 | | 29,626 |
Syngenta AG (Switzerland) | 101,678 | | 34,161 |
UBS Group AG | 2,453,481 | | 49,097 |
TOTAL SWITZERLAND | | 562,001 |
Taiwan - 0.1% |
JHL Biotech, Inc. (a) | 4,995,560 | | 11,141 |
Turkey - 0.0% |
Logo Yazilim Sanayi Ve Ticar | 2 | | 0 |
United Kingdom - 19.1% |
AA PLC | 3,853,399 | | 16,449 |
Aberdeen Asset Management PLC | 4,206,932 | | 22,485 |
Al Noor Hospitals Group PLC | 2,335,318 | | 42,337 |
Associated British Foods PLC | 776,700 | | 41,369 |
Aviva PLC | 6,618,100 | | 49,461 |
B&M European Value Retail S.A. | 8,573,709 | | 44,066 |
Barclays PLC | 16,052,760 | | 57,192 |
BCA Marketplace PLC | 7,808,000 | | 21,275 |
BG Group PLC | 2,346,020 | | 37,064 |
BT Group PLC | 6,169,700 | | 44,061 |
BTG PLC (a) | 1,727,000 | | 14,696 |
Bunzl PLC | 2,087,500 | | 59,824 |
Compass Group PLC | 2,024,800 | | 34,808 |
Diploma PLC | 2,326,200 | | 23,005 |
Essentra PLC | 2,145,000 | | 27,843 |
Hikma Pharmaceuticals PLC | 2,598,333 | | 86,681 |
Common Stocks - continued |
| Shares | | Value (000s) |
United Kingdom - continued |
Howden Joinery Group PLC | 10,977,300 | | $ 78,453 |
HSBC Holdings PLC (United Kingdom) | 10,446,000 | | 81,614 |
Imperial Tobacco Group PLC | 2,092,292 | | 112,859 |
ITV PLC | 21,873,900 | | 85,111 |
JUST EAT Ltd. (a) | 595,900 | | 3,913 |
Liberty Global PLC Class A (a) | 665,500 | | 29,628 |
Lloyds Banking Group PLC | 69,588,800 | | 78,984 |
London Stock Exchange Group PLC | 2,190,936 | | 85,959 |
Melrose PLC | 10,942,678 | | 44,906 |
Micro Focus International PLC | 3,266,700 | | 63,251 |
Next PLC | 760,844 | | 93,833 |
Persimmon PLC | 1,478,400 | | 45,445 |
Poundland Group PLC | 6,866,990 | | 29,112 |
Reckitt Benckiser Group PLC | 759,700 | | 74,140 |
Rex Bionics PLC (a)(e) | 1,304,916 | | 976 |
Rio Tinto PLC | 1,353,600 | | 49,332 |
Royal Dutch Shell PLC Class A (United Kingdom) | 1,108,500 | | 28,940 |
SABMiller PLC | 723,500 | | 44,558 |
Schroders PLC | 598,200 | | 27,509 |
Shawbrook Group Ltd. | 9,004,300 | | 47,098 |
Spirax-Sarco Engineering PLC | 542,700 | | 25,442 |
St. James's Place Capital PLC | 5,426,000 | | 80,678 |
Taylor Wimpey PLC | 11,785,800 | | 35,975 |
The Restaurant Group PLC | 1,956,100 | | 21,621 |
Virgin Money Holdings Uk PLC | 5,909,100 | | 35,327 |
Vodafone Group PLC | 31,387,896 | | 103,296 |
Whitbread PLC | 700,994 | | 53,665 |
Workspace Group PLC | 652,800 | | 9,636 |
TOTAL UNITED KINGDOM | | 2,093,877 |
United States of America - 3.1% |
Chevron Corp. | 854,400 | | 77,648 |
Constellation Brands, Inc. Class A (sub. vtg.) | 626,700 | | 84,479 |
McGraw Hill Financial, Inc. | 686,300 | | 63,579 |
Monster Beverage Corp. (a) | 168,900 | | 23,024 |
Visa, Inc. Class A | 1,154,500 | | 89,566 |
TOTAL UNITED STATES OF AMERICA | | 338,296 |
TOTAL COMMON STOCKS (Cost $9,171,863) |
10,478,796
|
Nonconvertible Preferred Stocks - 0.2% |
| Shares | | Value (000s) |
Cayman Islands - 0.2% |
China Internet Plus Holdings Ltd. (k) | 5,958,244 | | $ 22,999 |
Germany - 0.0% |
Henkel AG & Co. KGaA | 476 | | 52 |
TOTAL NONCONVERTIBLE PREFERRED STOCKS (Cost $18,888) |
23,051
|
Government Obligations - 0.0% |
| Principal
Amount (000s) (j) | | |
United States of America - 0.0% |
U.S. Treasury Bills, yield at date of purchase 0.03% to 0.06% 12/3/15 to 12/17/15 (i)
(Cost $1,930) | | $ 1,930 | |
1,930
|
Preferred Securities - 0.1% |
|
Ireland - 0.1% |
Baggot Securities Ltd. 10.24% (f)(g)
(Cost $13,883) | EUR | 9,040 | |
10,747
|
Money Market Funds - 5.3% |
| Shares | | |
Fidelity Cash Central Fund, 0.18% (b) | 529,294,097 | | 529,294 |
Fidelity Securities Lending Cash Central Fund, 0.19% (b)(c) | 46,206,017 | | 46,206 |
TOTAL MONEY MARKET FUNDS (Cost $575,500) |
575,500
|
TOTAL INVESTMENT PORTFOLIO - 101.1% (Cost $9,782,064) | | 11,090,024 |
NET OTHER ASSETS (LIABILITIES) - (1.1)% | | (122,851) |
NET ASSETS - 100% | $ 10,967,173 |
Futures Contracts |
| Expiration Date | | Underlying Face Amount at Value (000s) | | Unrealized Appreciation/
(Depreciation)
(000s) |
Purchased |
Equity Index Contracts |
2,033 CME Nikkei 225 Index Contracts (United States) | Dec. 2015 | | $ 192,271 | | $ 9,203 |
The face value of futures purchased as a percentage of net assets is 1.8% |
For the period, the average monthly underlying face amount at value for futures contracts in the aggregate was $226,950,000. |
Currency Abbreviations |
EUR | - | European Monetary Unit |
Legend |
(a) Non-income producing |
(b) Affiliated fund that is generally available only to investment companies and other accounts managed by Fidelity Investments. The rate quoted is the annualized seven-day yield of the fund at period end. A complete unaudited listing of the fund's holdings as of its most recent quarter end is available upon request. In addition, each Fidelity Central Fund's financial statements, which are not covered by the Fund's Report of Independent Registered Public Accounting Firm, are available on the SEC's website or upon request. |
(c) Investment made with cash collateral received from securities on loan. |
(d) Security or a portion of the security is on loan at period end. |
(e) Affiliated company |
(f) Security exempt from registration under Rule 144A of the Securities Act of 1933. These securities may be resold in transactions exempt from registration, normally to qualified institutional buyers. At the end of the period, the value of these securities amounted to $10,747,000 or 0.1% of net assets. |
(g) Security is perpetual in nature with no stated maturity date. |
(h) Security or a portion of the security purchased on a delayed delivery or when-issued basis. |
(i) Security or a portion of the security was pledged to cover margin requirements for futures contracts. At period end, the value of securities pledged amounted to $1,930,000. |
(j) Amount is stated in United States dollars unless otherwise noted. |
(k) Restricted securities - Investment in securities not registered under the Securities Act of 1933 (excluding 144A issues). At the end of the period, the value of restricted securities (excluding 144A issues) amounted to $106,866,000 or 1.0% of net assets. |
Additional information on each restricted holding is as follows: |
Security | Acquisition Date | Acquisition Cost (000s) |
China Internet Plus Holdings Ltd. | 1/26/15 | $ 18,833 |
Credit Suisse Group AG | 10/21/15 | $ 86,402 |
Affiliated Central Funds |
Information regarding fiscal year to date income earned by the Fund from investments in Fidelity Central Funds is as follows: |
Fund | Income earned
(Amounts in thousands) |
Fidelity Cash Central Fund | $ 655 |
Fidelity Securities Lending Cash Central Fund | 3,281 |
Total | $ 3,936 |
Other Affiliated Issuers |
An affiliated company is a company in which the Fund has ownership of at least 5% of the voting securities. Fiscal year to date transactions with companies which are or were affiliates are as follows: |
Affiliate
(Amounts in thousands) | Value, beginning of period | Purchases | Sales Proceeds* | Dividend Income | Value,
end of
period |
Hoegh LNG Partners LP | $ 12,426 | $ 2,837 | $ 275 | $ 729 | $ 11,465 |
MySale Group PLC | 26,053 | - | 5,920 | - | - |
PAX Global Technology Ltd. | 71,203 | 795 | 36,965 | 112 | - |
Rex Bionics PLC | 3,518 | - | 24 | - | 976 |
Total | $ 113,200 | $ 3,632 | $ 43,184 | $ 841 | $ 12,441 |
* Includes the value of securities delivered through in-kind transactions, if applicable.
See accompanying notes which are an integral part of the financial statements.
Annual Report
Other Information |
Categorizations in the Schedule of Investments are based on country or territory of incorporation. |
The following is a summary of the inputs used, as of October 31, 2015, involving the Fund's assets and liabilities carried at fair value. The inputs or methodology used for valuing securities may not be an indication of the risk associated with investing in those securities. For more information on valuation inputs, and their aggregation into the levels used in the tables below, please refer to the Investment Valuation section in the accompanying Notes to Financial Statements. |
Valuation Inputs at Reporting Date: |
Description
(Amounts in thousands) | Total | Level 1 | Level 2 | Level 3 |
Investments in Securities: | | | | |
Equities: | | | | |
Consumer Discretionary | $ 1,898,277 | $ 1,361,738 | $ 513,540 | $ 22,999 |
Consumer Staples | 1,297,202 | 666,346 | 630,856 | - |
Energy | 467,483 | 180,488 | 286,995 | - |
Financials | 2,676,653 | 1,281,424 | 1,395,229 | - |
Health Care | 1,416,831 | 497,206 | 919,625 | - |
Industrials | 1,146,371 | 836,192 | 310,179 | - |
Information Technology | 830,123 | 605,993 | 224,130 | - |
Materials | 240,897 | 157,404 | 83,493 | - |
Telecommunication Services | 528,010 | 7,969 | 520,041 | - |
Government Obligations | 1,930 | - | 1,930 | - |
Preferred Securities | 10,747 | - | 10,747 | - |
Money Market Funds | 575,500 | 575,500 | - | - |
Total Investments in Securities: | $ 11,090,024 | $ 6,170,260 | $ 4,896,765 | $ 22,999 |
Derivative Instruments: | | | | |
Assets | | | | |
Futures Contracts | $ 9,203 | $ 9,203 | $ - | $ - |
The following is a summary of transfers between Level 1 and Level 2 for the period ended October 31, 2015. Transfers are assumed to have occurred at the beginning of the period, and are primarily attributable to the valuation techniques used for foreign equity securities, as discussed in the accompanying Notes to Financial Statements: |
Transfers | Total (000s) |
Level 1 to Level 2 | $ 381,182 |
Level 2 to Level 1 | $ 79,997 |
Value of Derivative Instruments |
The following table is a summary of the Fund's value of derivative instruments by primary risk exposure as of October 31, 2015. For additional information on derivative instruments, please refer to the Derivative Instruments section in the accompanying Notes to Financial Statements. |
Primary Risk Exposure /
Derivative Type | Value (000s) |
| Asset | Liability |
Equity Risk | | |
Futures Contracts (a) | $ 9,203 | $ - |
Total Value of Derivatives | $ 9,203 | $ - |
(a) Reflects gross cumulative appreciation (depreciation) on futures contracts as presented in the Schedule of Investments. Only the period end receivable or payable for daily variation margin and net unrealized appreciation (depreciation) are presented in the Statement of Assets and Liabilities. |
See accompanying notes which are an integral part of the financial statements.
Annual Report
Statement of Assets and Liabilities
Amounts in thousands (except per-share amounts) | | October 31, 2015 |
| | |
Assets | | |
Investment in securities, at value (including securities loaned of $44,670) - See accompanying schedule: Unaffiliated issuers (cost $9,188,061) | $ 10,502,083 | |
Fidelity Central Funds (cost $575,500) | 575,500 | |
Other affiliated issuers (cost $18,503) | 12,441 | |
Total Investments (cost $9,782,064) | | $ 11,090,024 |
Segregated cash with brokers for derivative instruments | | 9,348 |
Cash | | 172 |
Foreign currency held at value (cost $21,001) | | 21,001 |
Receivable for investments sold | | 28,370 |
Receivable for fund shares sold | | 12,338 |
Dividends receivable | | 24,068 |
Distributions receivable from Fidelity Central Funds | | 111 |
Prepaid expenses | | 30 |
Other receivables | | 3,575 |
Total assets | | 11,189,037 |
| | |
Liabilities | | |
Payable for investments purchased | | |
Regular delivery | $ 75,392 | |
Delayed delivery | 83,867 | |
Payable for fund shares redeemed | 5,982 | |
Accrued management fee | 7,145 | |
Distribution and service plan fees payable | 104 | |
Payable for daily variation margin for derivative instruments | 1,067 | |
Other affiliated payables | 1,508 | |
Other payables and accrued expenses | 593 | |
Collateral on securities loaned, at value | 46,206 | |
Total liabilities | | 221,864 |
| | |
Net Assets | | $ 10,967,173 |
Net Assets consist of: | | |
Paid in capital | | $ 9,614,122 |
Undistributed net investment income | | 108,769 |
Accumulated undistributed net realized gain (loss) on investments and foreign currency transactions | | (73,154) |
Net unrealized appreciation (depreciation) on investments and assets and liabilities in foreign currencies | | 1,317,436 |
Net Assets | | $ 10,967,173 |
See accompanying notes which are an integral part of the financial statements.
Annual Report
Statement of Assets and Liabilities - continued
Amounts in thousands (except per-share amounts) | | October 31, 2015 |
| | |
Calculation of Maximum Offering Price | | |
Class A:
Net Asset Value and redemption price per share ($282,714 ÷ 7,106.131 shares) | | $ 39.78 |
| | |
Maximum offering price per share (100/94.25 of $39.78) | | $ 42.21 |
Class T:
Net Asset Value and redemption price per share ($42,965 ÷ 1,087.491 shares) | | $ 39.51 |
| | |
Maximum offering price per share (100/96.50 of $39.51) | | $ 40.94 |
Class B:
Net Asset Value and offering price per share ($2,249 ÷ 57.378 shares)A | | $ 39.20 |
| | |
Class C:
Net Asset Value and offering price per share ($31,737 ÷ 810.917 shares)A | | $ 39.14 |
| | |
International Discovery:
Net Asset Value, offering price and redemption price per share ($7,208,744 ÷ 179,698.201 shares) | | $ 40.12 |
| | |
Class K:
Net Asset Value, offering price and redemption price per share ($2,307,850 ÷ 57,614.604 shares) | | $ 40.06 |
| | |
Class I:
Net Asset Value, offering price and redemption price per share ($1,060,821 ÷ 26,500.627 shares) | | $ 40.03 |
| | |
Class Z:
Net Asset Value, offering price and redemption price per share ($30,093 ÷ 751.671 shares) | | $ 40.03 |
A Redemption price per share is equal to net asset value less any applicable contingent deferred sales charge.
See accompanying notes which are an integral part of the financial statements.
Annual Report
Financial Statements - continued
Statement of Operations
Amounts in thousands | Year ended October 31, 2015 |
| | |
Investment Income | | |
Dividends (including $841 earned from other affiliated issuers) | | $ 237,713 |
Special dividends | | 34,094 |
Interest | | 101 |
Income from Fidelity Central Funds | | 3,936 |
Income before foreign taxes withheld | | 275,844 |
Less foreign taxes withheld | | (19,005) |
Total income | | 256,839 |
| | |
Expenses | | |
Management fee | | |
Basic fee | $ 74,535 | |
Performance adjustment | 11,730 | |
Transfer agent fees | 16,773 | |
Distribution and service plan fees | 1,337 | |
Accounting and security lending fees | 1,839 | |
Custodian fees and expenses | 1,612 | |
Independent trustees' compensation | 47 | |
Registration fees | 226 | |
Audit | 124 | |
Legal | 30 | |
Miscellaneous | 101 | |
Total expenses before reductions | 108,354 | |
Expense reductions | (1,353) | 107,001 |
Net investment income (loss) | | 149,838 |
Realized and Unrealized Gain (Loss) | | |
Net realized gain (loss) on: | | |
Investment securities: | | |
Unaffiliated issuers (net of foreign taxes of $606) | 220,061 | |
Other affiliated issuers | (3,654) | |
Foreign currency transactions | (3,878) | |
Futures contracts | 33,241 | |
Total net realized gain (loss) | | 245,770 |
Change in net unrealized appreciation (depreciation) on: Investment securities (net of decrease in deferred foreign taxes of $7,503) | 13,737 | |
Assets and liabilities in foreign currencies | 2,313 | |
Futures contracts | (15,395) | |
Total change in net unrealized appreciation (depreciation) | | 655 |
Net gain (loss) | | 246,425 |
Net increase (decrease) in net assets resulting from operations | | $ 396,263 |
See accompanying notes which are an integral part of the financial statements.
Annual Report
Statement of Changes in Net Assets
Amounts in thousands | Year ended
October 31,
2015 | Year ended
October 31,
2014 |
Increase (Decrease) in Net Assets | | |
Operations | | |
Net investment income (loss) | $ 149,838 | $ 199,098 |
Net realized gain (loss) | 245,770 | 758,004 |
Change in net unrealized appreciation (depreciation) | 655 | (958,756) |
Net increase (decrease) in net assets resulting from operations | 396,263 | (1,654) |
Distributions to shareholders from net investment income | (74,589) | (136,326) |
Distributions to shareholders from net realized gain | - | (88,586) |
Total distributions | (74,589) | (224,912) |
Share transactions - net increase (decrease) | (353,147) | (69,908) |
Redemption fees | 95 | 139 |
Total increase (decrease) in net assets | (31,378) | (296,335) |
| | |
Net Assets | | |
Beginning of period | 10,998,551 | 11,294,886 |
End of period (including undistributed net investment income of $108,769 and undistributed net investment income of $68,609, respectively) | $ 10,967,173 | $ 10,998,551 |
See accompanying notes which are an integral part of the financial statements.
Annual Report
Financial Highlights - Fidelity International Discovery Fund Class A
Years ended October 31, | 2015 | 2014 | 2013 | 2012 | 2011 |
Selected Per-Share Data | | | | | |
Net asset value, beginning of period | $ 38.70 | $ 39.49 | $ 31.66 | $ 29.43 | $ 32.07 |
Income from Investment Operations | | | | | |
Net investment income (loss) C | .40F | .53G | .34 | .41 | .42 |
Net realized and unrealized gain (loss) | .79 | (.67) | 7.97 | 2.11 | (2.52) |
Total from investment operations | 1.19 | (.14) | 8.31 | 2.52 | (2.10) |
Distributions from net investment income | (.11) | (.33) | (.45) | (.29) | (.38) |
Distributions from net realized gain | - | (.31) | (.03) | - | (.16) |
Total distributions | (.11) | (.65) K | (.48) | (.29) | (.54) |
Redemption fees added to paid in capitalC, I | - | - | - | - | - |
Net asset value, end of period | $ 39.78 | $ 38.70 | $ 39.49 | $ 31.66 | $ 29.43 |
Total ReturnA, B | 3.09% | (.36)% | 26.59% | 8.70% | (6.71)% |
Ratios to Average Net AssetsD, H | | | | |
Expenses before reductions | 1.33% | 1.28% | 1.35% | 1.34% | 1.30% |
Expenses net of fee waivers, if any | 1.33% | 1.28% | 1.35% | 1.34% | 1.29% |
Expenses net of all reductions | 1.32% | 1.28% | 1.33% | 1.31% | 1.25% |
Net investment income (loss) | 1.00%F | 1.35%G | .97% | 1.41% | 1.31% |
Supplemental Data | | | | | |
Net assets, end of period (in millions) | $ 283 | $ 297 | $ 347 | $ 299 | $ 320 |
Portfolio turnover rateE | 60%J | 57% | 65% | 68% | 75% |
A Total returns would have been lower if certain expenses had not been reduced during the applicable periods shown.
B Total returns do not include the effect of the sales charges.
C Calculated based on average shares outstanding during the period.
D Fees and expenses of any underlying Fidelity Central Funds are not included in the Fund's expense ratio. The Fund indirectly bears its proportionate share of the expenses of any underlying Fidelity Central Funds.
E Amount does not include the portfolio activity of any underlying Fidelity Central Funds.
F Investment income per share reflects a large, non-recurring dividend which amounted to $.12 per share. Excluding this non-recurring dividend, the ratio of net investment income (loss) to average net assets would have been .69%.
G Investment income per share reflects a large, non-recurring dividend which amounted to $.22 per share. Excluding this non-recurring dividend, the ratio of net investment income (loss) to average net assets would have been .80%.
H Expense ratios reflect operating expenses of the class. Expenses before reductions do not reflect amounts reimbursed by the investment adviser or reductions from brokerage service arrangements or reductions from other expense offset arrangements and do not represent the amount paid by the class during periods when reimbursements or reductions occur. Expenses net of fee waivers reflect expenses after reimbursement by the investment adviser but prior to reductions from brokerage service arrangements or other expense offset arrangements. Expenses net of all reductions represent the net expenses paid by the class.
I Amount represents less than $.005 per share.
J Portfolio turnover rate excludes securities received or delivered in-kind.
K Total distributions of $.65 per share is comprised of distributions from net investment income of $.334 and distributions from net realized gain of $.311 per share.
See accompanying notes which are an integral part of the financial statements.
Annual Report
Financial Highlights - Fidelity International Discovery Fund Class T
Years ended October 31, | 2015 | 2014 | 2013 | 2012 | 2011 |
Selected Per-Share Data | | | | | |
Net asset value, beginning of period | $ 38.43 | $ 39.23 | $ 31.42 | $ 29.18 | $ 31.81 |
Income from Investment Operations | | | | | |
Net investment income (loss) C | .30F | .44G | .26 | .34 | .34 |
Net realized and unrealized gain (loss) | .80 | (.68) | 7.92 | 2.09 | (2.51) |
Total from investment operations | 1.10 | (.24) | 8.18 | 2.43 | (2.17) |
Distributions from net investment income | (.02) | (.25) | (.34) | (.19) | (.30) |
Distributions from net realized gain | - | (.31) | (.03) | - | (.16) |
Total distributions | (.02) | (.56) | (.37) | (.19) | (.46) |
Redemption fees added to paid in capitalC, I | - | - | - | - | - |
Net asset value, end of period | $ 39.51 | $ 38.43 | $ 39.23 | $ 31.42 | $ 29.18 |
Total ReturnA, B | 2.86% | (.60)% | 26.31% | 8.41% | (6.96)% |
Ratios to Average Net AssetsD, H | | | | | |
Expenses before reductions | 1.57% | 1.51% | 1.59% | 1.59% | 1.56% |
Expenses net of fee waivers, if any | 1.57% | 1.51% | 1.59% | 1.59% | 1.55% |
Expenses net of all reductions | 1.56% | 1.51% | 1.57% | 1.56% | 1.51% |
Net investment income (loss) | .76%F | 1.11%G | .73% | 1.16% | 1.05% |
Supplemental Data | | | | | |
Net assets, end of period (in millions) | $ 43 | $ 49 | $ 53 | $ 46 | $ 61 |
Portfolio turnover rateE | 60%J | 57% | 65% | 68% | 75% |
A Total returns would have been lower if certain expenses had not been reduced during the applicable periods shown.
B Total returns do not include the effect of the sales charges.
C Calculated based on average shares outstanding during the period.
D Fees and expenses of any underlying Fidelity Central Funds are not included in the Fund's expense ratio. The Fund indirectly bears its proportionate share of the expenses of any underlying Fidelity Central Funds.
E Amount does not include the portfolio activity of any underlying Fidelity Central Funds.
F Investment income per share reflects a large, non-recurring dividend which amounted to $.12 per share. Excluding this non-recurring dividend, the ratio of net investment income (loss) to average net assets would have been .45%.
G Investment income per share reflects a large, non-recurring dividend which amounted to $.21 per share. Excluding this non-recurring dividend, the ratio of net investment income (loss) to average net assets would have been .56%.
H Expense ratios reflect operating expenses of the class. Expenses before reductions do not reflect amounts reimbursed by the investment adviser or reductions from brokerage service arrangements or reductions from other expense offset arrangements and do not represent the amount paid by the class during periods when reimbursements or reductions occur. Expenses net of fee waivers reflect expenses after reimbursement by the investment adviser but prior to reductions from brokerage service arrangements or other expense offset arrangements. Expenses net of all reductions represent the net expenses paid by the class.
I Amount represents less than $.005 per share.
J Portfolio turnover rate excludes securities received or delivered in-kind.
See accompanying notes which are an integral part of the financial statements.
Annual Report
Financial Highlights - Fidelity International Discovery Fund Class B
Years ended October 31, | 2015 | 2014 | 2013 | 2012 | 2011 |
Selected Per-Share Data | | | | | |
Net asset value, beginning of period | $ 38.32 | $ 39.08 | $ 31.28 | $ 29.02 | $ 31.60 |
Income from Investment Operations | | | | | |
Net investment income (loss) C | .08F | .22G | .08 | .19 | .17 |
Net realized and unrealized gain (loss) | .80 | (.66) | 7.90 | 2.09 | (2.48) |
Total from investment operations | .88 | (.44) | 7.98 | 2.28 | (2.31) |
Distributions from net investment income | - | (.01) | (.15) | (.02) | (.12) |
Distributions from net realized gain | - | (.31) | (.03) | - | (.16) |
Total distributions | - | (.32) | (.18) | (.02) | (.27) K |
Redemption fees added to paid in capitalC, I | - | - | - | - | - |
Net asset value, end of period | $ 39.20 | $ 38.32 | $ 39.08 | $ 31.28 | $ 29.02 |
Total ReturnA, B | 2.30% | (1.12)% | 25.64% | 7.85% | (7.39)% |
Ratios to Average Net AssetsD, H | | | | |
Expenses before reductions | 2.12% | 2.06% | 2.10% | 2.09% | 2.06% |
Expenses net of fee waivers, if any | 2.12% | 2.06% | 2.10% | 2.09% | 2.06% |
Expenses net of all reductions | 2.11% | 2.05% | 2.08% | 2.06% | 2.02% |
Net investment income (loss) | .21%F | .57%G | .22% | .66% | .54% |
Supplemental Data | | | | | |
Net assets, end of period (in millions) | $ 2 | $ 5 | $ 7 | $ 8 | $ 10 |
Portfolio turnover rateE | 60%J | 57% | 65% | 68% | 75% |
A Total returns would have been lower if certain expenses had not been reduced during the applicable periods shown.
B Total returns do not include the effect of the contingent deferred sales charge.
C Calculated based on average shares outstanding during the period.
D Fees and expenses of any underlying Fidelity Central Funds are not included in the Fund's expense ratio. The Fund indirectly bears its proportionate share of the expenses of any underlying Fidelity Central Funds.
E Amount does not include the portfolio activity of any underlying Fidelity Central Funds.
F Investment income per share reflects a large, non-recurring dividend which amounted to $.12 per share. Excluding this non-recurring dividend, the ratio of net investment income (loss) to average net assets would have been (.10)%.
G Investment income per share reflects a large, non-recurring dividend which amounted to $.21 per share. Excluding this non-recurring dividend, the ratio of net investment income (loss) to average net assets would have been .02%.
H Expense ratios reflect operating expenses of the class. Expenses before reductions do not reflect amounts reimbursed by the investment adviser or reductions from brokerage service arrangements or reductions from other expense offset arrangements and do not represent the amount paid by the class during periods when reimbursements or reductions occur. Expenses net of fee waivers reflect expenses after reimbursement by the investment adviser but prior to reductions from brokerage service arrangements or other expense offset arrangements. Expenses net of all reductions represent the net expenses paid by the class.
I Amount represents less than $.005 per share.
J Portfolio turnover rate excludes securities received or delivered in-kind.
K Total distributions of $.27 per share is comprised of distributions from net investment income of $.115 and distributions from net realized gain of $.155 per share.
See accompanying notes which are an integral part of the financial statements.
Annual Report
Financial Highlights - Fidelity International Discovery Fund Class C
Years ended October 31, | 2015 | 2014 | 2013 | 2012 | 2011 |
Selected Per-Share Data | | | | | |
Net asset value, beginning of period | $ 38.25 | $ 39.07 | $ 31.32 | $ 29.08 | $ 31.68 |
Income from Investment Operations | | | | | |
Net investment income (loss) C | .10F | .23G | .08 | .19 | .18 |
Net realized and unrealized gain (loss) | .79 | (.66) | 7.90 | 2.09 | (2.49) |
Total from investment operations | .89 | (.43) | 7.98 | 2.28 | (2.31) |
Distributions from net investment income | - | (.08) | (.20) | (.04) | (.14) |
Distributions from net realized gain | - | (.31) | (.03) | - | (.16) |
Total distributions | - | (.39) | (.23) | (.04) | (.29) K |
Redemption fees added to paid in capitalC, I | - | - | - | - | - |
Net asset value, end of period | $ 39.14 | $ 38.25 | $ 39.07 | $ 31.32 | $ 29.08 |
Total ReturnA, B | 2.33% | (1.10)% | 25.65% | 7.86% | (7.37)% |
Ratios to Average Net AssetsD, H | | | | | |
Expenses before reductions | 2.09% | 2.03% | 2.10% | 2.09% | 2.05% |
Expenses net of fee waivers, if any | 2.09% | 2.03% | 2.09% | 2.09% | 2.04% |
Expenses net of all reductions | 2.08% | 2.02% | 2.07% | 2.06% | 2.00% |
Net investment income (loss) | .24%F | .60%G | .23% | .66% | .56% |
Supplemental Data | | | | | |
Net assets, end of period (in millions) | $ 32 | $ 35 | $ 36 | $ 30 | $ 33 |
Portfolio turnover rateE | 60%J | 57% | 65% | 68% | 75% |
A Total returns would have been lower if certain expenses had not been reduced during the applicable periods shown.
B Total returns do not include the effect of the contingent deferred sales charge.
C Calculated based on average shares outstanding during the period.
D Fees and expenses of any underlying Fidelity Central Funds are not included in the Fund's expense ratio. The Fund indirectly bears its proportionate share of the expenses of any underlying Fidelity Central Funds.
E Amount does not include the portfolio activity of any underlying Fidelity Central Funds.
F Investment income per share reflects a large, non-recurring dividend which amounted to $.12 per share. Excluding this non-recurring dividend, the ratio of net investment income (loss) to average net assets would have been (.06)%.
G Investment income per share reflects a large, non-recurring dividend which amounted to $.21 per share. Excluding this non-recurring dividend, the ratio of net investment income (loss) to average net assets would have been .05%.
H Expense ratios reflect operating expenses of the class. Expenses before reductions do not reflect amounts reimbursed by the investment adviser or reductions from brokerage service arrangements or reductions from other expense offset arrangements and do not represent the amount paid by the class during periods when reimbursements or reductions occur. Expenses net of fee waivers reflect expenses after reimbursement by the investment adviser but prior to reductions from brokerage service arrangements or other expense offset arrangements. Expenses net of all reductions represent the net expenses paid by the class.
I Amount represents less than $.005 per share.
J Portfolio turnover rate excludes securities received or delivered in-kind.
K Total distributions of $.29 per share is comprised of distributions from net investment income of $.137 and distributions from net realized gain of $.155 per share.
See accompanying notes which are an integral part of the financial statements.
Annual Report
Financial Highlights - Fidelity International Discovery Fund
Years ended October 31, | 2015 | 2014 | 2013 | 2012 | 2011 |
Selected Per-Share Data | | | | | |
Net asset value, beginning of period | $ 39.03 | $ 39.82 | $ 31.91 | $ 29.69 | $ 32.34 |
Income from Investment Operations | | | | | |
Net investment income (loss) B | .54E | .67F | .47 | .51 | .53 |
Net realized and unrealized gain (loss) | .81 | (.68) | 8.02 | 2.12 | (2.54) |
Total from investment operations | 1.35 | (.01) | 8.49 | 2.63 | (2.01) |
Distributions from net investment income | (.26) | (.47) | (.55) | (.41) | (.48) |
Distributions from net realized gain | - | (.31) | (.03) | - | (.16) |
Total distributions | (.26) | (.78) | (.58) | (.41) | (.64) |
Redemption fees added to paid in capitalB, H | - | - | - | - | - |
Net asset value, end of period | $ 40.12 | $ 39.03 | $ 39.82 | $ 31.91 | $ 29.69 |
Total ReturnA | 3.47% | (.01)% | 27.03% | 9.03% | (6.39)% |
Ratios to Average Net AssetsC, G | | | | | |
Expenses before reductions | .99% | .93% | 1.00% | 1.01% | .97% |
Expenses net of fee waivers, if any | .99% | .93% | 1.00% | 1.01% | .96% |
Expenses net of all reductions | .98% | .93% | .98% | .98% | .92% |
Net investment income (loss) | 1.34%E | 1.69%F | 1.32% | 1.73% | 1.64% |
Supplemental Data | | | | | |
Net assets, end of period (in millions) | $ 7,209 | $ 7,464 | $ 7,800 | $ 5,965 | $ 6,806 |
Portfolio turnover rateD | 60%I | 57% | 65% | 68% | 75% |
A Total returns would have been lower if certain expenses had not been reduced during the applicable periods shown.
B Calculated based on average shares outstanding during the period.
C Fees and expenses of any underlying Fidelity Central Funds are not included in the Fund's expense ratio. The Fund indirectly bears its proportionate share of the expenses of any underlying Fidelity Central Funds.
D Amount does not include the portfolio activity of any underlying Fidelity Central Funds.
E Investment income per share reflects a large, non-recurring dividend which amounted to $.12 per share. Excluding this non-recurring dividend, the ratio of net investment income (loss) to average net assets would have been 1.03%.
F Investment income per share reflects a large, non-recurring dividend which amounted to $.22 per share. Excluding this non-recurring dividend, the ratio of net investment income (loss) to average net assets would have been 1.15%.
G Expense ratios reflect operating expenses of the class. Expenses before reductions do not reflect amounts reimbursed by the investment adviser or reductions from brokerage service arrangements or reductions from other expense offset arrangements and do not represent the amount paid by the class during periods when reimbursements or reductions occur. Expenses net of fee waivers reflect expenses after reimbursement by the investment adviser but prior to reductions from brokerage service arrangements or other expense offset arrangements. Expenses net of all reductions represent the net expenses paid by the class.
H Amount represents less than $.005 per share.
I Portfolio turnover rate excludes securities received or delivered in-kind.
See accompanying notes which are an integral part of the financial statements.
Annual Report
Financial Highlights - Fidelity International Discovery Fund Class K
Years ended October 31, | 2015 | 2014 | 2013 | 2012 | 2011 |
Selected Per-Share Data | | | | | |
Net asset value, beginning of period | $ 38.97 | $ 39.76 | $ 31.87 | $ 29.66 | $ 32.32 |
Income from Investment Operations | | | | | |
Net investment income (loss) B | .59E | .72F | .52 | .57 | .58 |
Net realized and unrealized gain (loss) | .81 | (.67) | 8.01 | 2.11 | (2.54) |
Total from investment operations | 1.40 | .05 | 8.53 | 2.68 | (1.96) |
Distributions from net investment income | (.31) | (.53) | (.61) | (.47) | (.55) |
Distributions from net realized gain | - | (.31) | (.03) | - | (.16) |
Total distributions | (.31) | (.84) | (.64) | (.47) | (.70) J |
Redemption fees added to paid in capitalB, H | - | - | - | - | - |
Net asset value, end of period | $ 40.06 | $ 38.97 | $ 39.76 | $ 31.87 | $ 29.66 |
Total ReturnA | 3.61% | .13% | 27.23% | 9.24% | (6.24)% |
Ratios to Average Net AssetsC, G | | | | |
Expenses before reductions | .86% | .80% | .85% | .83% | .80% |
Expenses net of fee waivers, if any | .86% | .80% | .85% | .83% | .79% |
Expenses net of all reductions | .85% | .79% | .83% | .80% | .75% |
Net investment income (loss) | 1.47%E | 1.83%F | 1.47% | 1.91% | 1.81% |
Supplemental Data | | | | | |
Net assets, end of period (in millions) | $ 2,308 | $ 2,464 | $ 2,576 | $ 1,776 | $ 1,245 |
Portfolio turnover rateD | 60%I | 57% | 65% | 68% | 75% |
A Total returns would have been lower if certain expenses had not been reduced during the applicable periods shown.
B Calculated based on average shares outstanding during the period.
C Fees and expenses of any underlying Fidelity Central Funds are not included in the Fund's expense ratio. The Fund indirectly bears its proportionate share of the expenses of any underlying Fidelity Central Funds.
D Amount does not include the portfolio activity of any underlying Fidelity Central Funds.
E Investment income per share reflects a large, non-recurring dividend which amounted to $.12 per share. Excluding this non-recurring dividend, the ratio of net investment income (loss) to average net assets would have been 1.16%.
F Investment income per share reflects a large, non-recurring dividend which amounted to $.22 per share. Excluding this non-recurring dividend, the ratio of net investment income (loss) to average net assets would have been 1.28%.
G Expense ratios reflect operating expenses of the class. Expenses before reductions do not reflect amounts reimbursed by the investment adviser or reductions from brokerage service arrangements or reductions from other expense offset arrangements and do not represent the amount paid by the class during periods when reimbursements or reductions occur. Expenses net of fee waivers reflect expenses after reimbursement by the investment adviser but prior to reductions from brokerage service arrangements or other expense offset arrangements. Expenses net of all reductions represent the net expenses paid by the class.
H Amount represents less than $.005 per share.
I Portfolio turnover rate excludes securities received or delivered in-kind.
J Total distributions of $.70 per share is comprised of distributions from net investment income of $.548 and distributions from net realized gain of $.155 per share.
See accompanying notes which are an integral part of the financial statements.
Annual Report
Financial Highlights - Fidelity International Discovery Fund Class I
Years ended October 31, | 2015 | 2014 | 2013 | 2012 | 2011 |
Selected Per-Share Data | | | | | |
Net asset value, beginning of period | $ 38.96 | $ 39.76 | $ 31.87 | $ 29.65 | $ 32.31 |
Income from Investment Operations | | | | | |
Net investment income (loss) B | .53E | .67F | .47 | .52 | .54 |
Net realized and unrealized gain (loss) | .80 | (.68) | 8.01 | 2.11 | (2.55) |
Total from investment operations | 1.33 | (.01) | 8.48 | 2.63 | (2.01) |
Distributions from net investment income | (.26) | (.48) | (.56) | (.41) | (.50) |
Distributions from net realized gain | - | (.31) | (.03) | - | (.16) |
Total distributions | (.26) | (.79) | (.59) | (.41) | (.65) J |
Redemption fees added to paid in capitalB, H | - | - | - | - | - |
Net asset value, end of period | $ 40.03 | $ 38.96 | $ 39.76 | $ 31.87 | $ 29.65 |
Total ReturnA | 3.44% | (.01)% | 27.03% | 9.07% | (6.39)% |
Ratios to Average Net AssetsC, G | | | | | |
Expenses before reductions | 1.00% | .93% | 1.00% | 1.00% | .95% |
Expenses net of fee waivers, if any | .99% | .93% | 1.00% | 1.00% | .94% |
Expenses net of all reductions | .98% | .93% | .97% | .97% | .90% |
Net investment income (loss) | 1.33%E | 1.69%F | 1.33% | 1.75% | 1.66% |
Supplemental Data | | | | | |
Net assets, end of period (in millions) | $ 1,061 | $ 650 | $ 476 | $ 294 | $ 278 |
Portfolio turnover rateD | 60%I | 57% | 65% | 68% | 75% |
A Total returns would have been lower if certain expenses had not been reduced during the applicable periods shown.
B Calculated based on average shares outstanding during the period.
C Fees and expenses of any underlying Fidelity Central Funds are not included in the Fund's expense ratio. The Fund indirectly bears its proportionate share of the expenses of any underlying Fidelity Central Funds.
D Amount does not include the portfolio activity of any underlying Fidelity Central Funds.
E Investment income per share reflects a large, non-recurring dividend which amounted to $.12 per share. Excluding this non-recurring dividend, the ratio of net investment income (loss) to average net assets would have been 1.03%.
F Investment income per share reflects a large, non-recurring dividend which amounted to $.22 per share. Excluding this non-recurring dividend, the ratio of net investment income (loss) to average net assets would have been 1.14%.
G Expense ratios reflect operating expenses of the class. Expenses before reductions do not reflect amounts reimbursed by the investment adviser or reductions from brokerage service arrangements or reductions from other expense offset arrangements and do not represent the amount paid by the class during periods when reimbursements or reductions occur. Expenses net of fee waivers reflect expenses after reimbursement by the investment adviser but prior to reductions from brokerage service arrangements or other expense offset arrangements. Expenses net of all reductions represent the net expenses paid by the class.
H Amount represents less than $.005 per share.
I Portfolio turnover rate excludes securities received or delivered in-kind.
J Total distributions of $.65 per share is comprised of distributions from net investment income of $.497 and distributions from net realized gain of $.155 per share.
See accompanying notes which are an integral part of the financial statements.
Annual Report
Financial Highlights - Fidelity International Discovery Fund Class Z
Years ended October 31, | 2015 | 2014 | 2013 I |
Selected Per-Share Data | | | |
Net asset value, beginning of period | $ 38.96 | $ 39.77 | $ 37.22 |
Income from Investment Operations | | | |
Net investment income (loss)D | .59G | .72H | .07 |
Net realized and unrealized gain (loss) | .80 | (.68) | 2.48 |
Total from investment operations | 1.39 | .04 | 2.55 |
Distributions from net investment income | (.32) | (.54) | - |
Distributions from net realized gain | - | (.31) | - |
Total distributions | (.32) | (.85) | - |
Redemption fees added to paid in capitalD, K | - | - | - |
Net asset value, end of period | $ 40.03 | $ 38.96 | $ 39.77 |
Total ReturnB, C | 3.58% | .12% | 6.85% |
Ratios to Average Net AssetsE, J | | | |
Expenses before reductions | .86% | .80% | .85%A |
Expenses net of fee waivers, if any | .86% | .80% | .85%A |
Expenses net of all reductions | .85% | .79% | .83%A |
Net investment income (loss) | 1.47%G | 1.83%H | .76%A |
Supplemental Data | | | |
Net assets, end of period (000 omitted) | $ 30,093 | $ 35,125 | $ 107 |
Portfolio turnover rateF | 60%L | 57% | 65% |
A Annualized
B Total returns for periods of less than one year are not annualized.
C Total returns would have been lower if certain expenses had not been reduced during the applicable periods shown.
D Calculated based on average shares outstanding during the period.
E Fees and expenses of any underlying Fidelity Central Funds are not included in the Fund's expense ratio. The Fund indirectly bears its proportionate share of the expenses of any underlying Fidelity Central Funds.
F Amount does not include the portfolio activity of any underlying Fidelity Central Funds.
G Investment income per share reflects a large, non-recurring dividend which amounted to $.12 per share. Excluding this non-recurring dividend, the ratio of net investment income (loss) to average net assets would have been 1.16%.
H Investment income per share reflects a large, non-recurring dividend which amounted to $.21 per share. Excluding this non-recurring dividend, the ratio of net investment income (loss) to average net assets would have been 1.28%.
I For the period August 13, 2013 (commencement of sale of shares) to October 31, 2013.
J Expense ratios reflect operating expenses of the class. Expenses before reductions do not reflect amounts reimbursed by the investment adviser or reductions from brokerage service arrangements or reductions from other expense offset arrangements and do not represent the amount paid by the class during periods when reimbursements or reductions occur. Expense ratios before reductions for start-up periods may not be representative of larger-term operating periods. Expenses net of fee waivers reflect expenses after reimbursement by the investment adviser but prior to reductions from brokerage service arrangements or other expense offset arrangements. Expenses net of all reductions represent the net expenses paid by the class.
K Amount represents less than $.005 per share.
L Portfolio turnover rate excludes securities received or delivered in-kind.
See accompanying notes which are an integral part of the financial statements.
Annual Report
For the period ended October 31, 2015
(Amounts in thousands except percentages)
1. Organization.
Fidelity International Discovery Fund (the Fund) is a fund of Fidelity Investment Trust (the Trust) and is authorized to issue an unlimited number of shares. The Trust is registered under the Investment Company Act of 1940, as amended (the 1940 Act), as an open-end management investment company organized as a Massachusetts business trust. The Fund offers Class A, Class T, Class C, International Discovery, Class K, Class I (formerly Institutional Class) and Class Z shares, each of which, along with Class B shares, has equal rights as to assets and voting privileges. Class B shares are closed to new accounts and additional purchases, except for exchanges and reinvestments. Each class has exclusive voting rights with respect to matters that affect that class. Class B shares will automatically convert to Class A shares after a holding period of seven years from the initial date of purchase.
2. Investments in Fidelity Central Funds.
The Fund invests in Fidelity Central Funds, which are open-end investment companies generally available only to other investment companies and accounts managed by the investment adviser and its affiliates. The Fund's Schedule of Investments lists each of the Fidelity Central Funds held as of period end, if any, as an investment of the Fund, but does not include the underlying holdings of each Fidelity Central Fund. As an Investing Fund, the Fund indirectly bears its proportionate share of the expenses of the underlying Fidelity Central Funds.
The Money Market Central Funds seek preservation of capital and current income and are managed by Fidelity Investments Money Management, Inc. (FIMM), an affiliate of the investment adviser. Annualized expenses of the Money Market Central Funds as of their most recent shareholder report date are less than .005%.
A complete unaudited list of holdings for each Fidelity Central Fund is available upon request or at the Securities and Exchange Commission (the SEC) website at www.sec.gov. In addition, the financial statements of the Fidelity Central Funds, which are not covered by the Fund's Report of Independent Registered Public Accounting Firm, are available on the SEC website or upon request.
3. Significant Accounting Policies.
The financial statements have been prepared in conformity with accounting principles generally accepted in the United States of America (GAAP), which require management to make certain estimates and assumptions at the date of the financial statements. Actual results could differ from those estimates. Subsequent events, if any, through the date that the financial statements were issued have been evaluated in the preparation of
Annual Report
Notes to Financial Statements - continued
(Amounts in thousands except percentages)
3. Significant Accounting Policies - continued
the financial statements. The following summarizes the significant accounting policies of the Fund:
Investment Valuation. Investments are valued as of 4:00 p.m. Eastern time on the last calendar day of the period. The Board of Trustees (the Board) has delegated the day to day responsibility for the valuation of the Fund's investments to the Fidelity Management & Research Company (FMR) Fair Value Committee (the Committee). In accordance with valuation policies and procedures approved by the Board, the Fund attempts to obtain prices from one or more third party pricing vendors or brokers to value its investments. When current market prices, quotations or currency exchange rates are not readily available or reliable, investments will be fair valued in good faith by the Committee, in accordance with procedures adopted by the Board. Factors used in determining fair value vary by investment type and may include market or investment specific events, changes in interest rates and credit quality. The frequency with which these procedures are used cannot be predicted and they may be utilized to a significant extent. The Committee oversees the Fund's valuation policies and procedures and reports to the Board on the Committee's activities and fair value determinations. The Board monitors the appropriateness of the procedures used in valuing the Fund's investments and ratifies the fair value determinations of the Committee.
The Fund categorizes the inputs to valuation techniques used to value its investments into a disclosure hierarchy consisting of three levels as shown below:
Level 1 - quoted prices in active markets for identical investments
Level 2 - other significant observable inputs (including quoted prices for similar investments, interest rates, prepayment speeds, etc.)
Level 3 - unobservable inputs (including the Fund's own assumptions based on the best information available)
Valuation techniques used to value the Fund's investments by major category are as follows:
Equity securities, including restricted securities, for which market quotations are readily available, are valued at the last reported sale price or official closing price as reported by a third party pricing vendor on the primary market or exchange on which they are traded and are categorized as Level 1 in the hierarchy. In the event there were no sales during the day or closing prices are not available, securities are valued at the last quoted bid price or may be valued using the last available price and are generally categorized as Level 2 in the hierarchy. For foreign equity securities, when market or security specific events arise, comparisons to the valuation of American Depositary Receipts (ADRs), futures contracts, Exchange-Traded Funds (ETFs) and certain indexes as well as quoted
Annual Report
3. Significant Accounting Policies - continued
Investment Valuation - continued
prices for similar securities may be used and would be categorized as Level 2 in the hierarchy. Utilizing these techniques may result in transfers between Level 1 and Level 2. For equity securities, including restricted securities, where observable inputs are limited, assumptions about market activity and risk are used and these securities may be categorized as Level 3 in the hierarchy.
Debt securities, including restricted securities, are valued based on evaluated prices received from third party pricing vendors or from brokers who make markets in such securities. Preferred securities and U.S. government and government agency obligations are valued by pricing vendors who utilize matrix pricing which considers yield or price of bonds of comparable quality, coupon, maturity and type or by broker-supplied prices. When independent prices are unavailable or unreliable, debt securities may be valued utilizing pricing methodologies which consider similar factors that would be used by third party pricing vendors. Debt securities are generally categorized as Level 2 in the hierarchy but may be Level 3 depending on the circumstances.
Futures contracts are valued at the settlement price established each day by the board of trade or exchange on which they are traded and are categorized as Level 1 in the hierarchy. Investments in open-end mutual funds, including the Fidelity Central Funds, are valued at their closing net asset value (NAV) each business day and are categorized as Level 1 in the hierarchy.
Changes in valuation techniques may result in transfers in or out of an assigned level within the disclosure hierarchy. The aggregate value of investments by input level as of October 31, 2015, including information on transfers between Levels 1 and 2 is included at the end of the Fund's Schedule of Investments.
Foreign Currency. The Fund may use foreign currency contracts to facilitate transactions in foreign-denominated securities. Gains and losses from these transactions may arise from changes in the value of the foreign currency or if the counterparties do not perform under the contracts' terms.
Foreign-denominated assets, including investment securities, and liabilities are translated into U.S. dollars at the exchange rates at period end. Purchases and sales of investment securities, income and dividends received and expenses denominated in foreign currencies are translated into U.S. dollars at the exchange rate in effect on the transaction date.
The effects of exchange rate fluctuations on investments are included with the net realized and unrealized gain (loss) on investment securities. Other foreign currency transactions resulting in realized and unrealized gain (loss) are disclosed separately.
Annual Report
Notes to Financial Statements - continued
(Amounts in thousands except percentages)
3. Significant Accounting Policies - continued
Investment Transactions and Income. For financial reporting purposes, the Fund's investment holdings and NAV include trades executed through the end of the last business day of the period. The NAV per share for processing shareholder transactions is calculated as of the close of business of the New York Stock Exchange (NYSE), normally 4:00 p.m. Eastern time and includes trades executed through the end of the prior business day. Gains and losses on securities sold are determined on the basis of identified cost and may include proceeds received from litigation. Dividend income is recorded on the ex-dividend date, except for certain dividends from foreign securities where the ex-dividend date may have passed, which are recorded as soon as the Fund is informed of the ex-dividend date. Non-cash dividends included in dividend income, if any, are recorded at the fair market value of the securities received. Income and capital gain distributions from Fidelity Central Funds, if any, are recorded on the ex-dividend date. Distributions received on securities that represent a return of capital or capital gain are recorded as a reduction of cost of investments and/or as a realized gain. Subsequent to ex-dividend date the Fund determines the components of these distributions, based upon receipt of tax filings or other correspondence relating to the underlying investment. Large, non-recurring dividends recognized by the Fund are presented separately on the Statement of Operations as "Special Dividends" and the impact of these dividends is presented in the Financial Highlights. Interest income is accrued as earned and includes coupon interest and amortization of premium and accretion of discount on debt securities as applicable. Investment income is recorded net of foreign taxes withheld where recovery of such taxes is uncertain.
Class Allocations and Expenses. Investment income, realized and unrealized capital gains and losses, common expenses of the Fund, and certain fund-level expense reductions, if any, are allocated daily on a pro-rata basis to each class based on the relative net assets of each class to the total net assets of the Fund. Each class differs with respect to transfer agent and distribution and service plan fees incurred. Certain expense reductions may also differ by class. For the reporting period, the allocated portion of income and expenses to each class as a percent of its average net assets may vary due to the timing of recording these transactions in relation to fluctuating net assets of the classes. Expenses directly attributable to a fund are charged to that fund. Expenses attributable to more than one fund are allocated among the respective funds on the basis of relative net assets or other appropriate methods. Expense estimates are accrued in the period to which they relate and adjustments are made when actual amounts are known.
Deferred Trustee Compensation. Under a Deferred Compensation Plan (the Plan), independent Trustees may elect to defer receipt of a portion of their annual compensation. Deferred amounts are invested in a cross-section of Fidelity funds, are marked-to-market and remain in the Fund until distributed in accordance with the Plan. The
Annual Report
3. Significant Accounting Policies - continued
Deferred Trustee Compensation - continued
investment of deferred amounts and the offsetting payable to the Trustees are included in the accompanying Statement of Assets and Liabilities.
Income Tax Information and Distributions to Shareholders. Each year, the Fund intends to qualify as a regulated investment company under Subchapter M of the Internal Revenue Code, including distributing substantially all of its taxable income and realized gains. As a result, no provision for U.S. Federal income taxes is required. As of October 31, 2015, the Fund did not have any unrecognized tax benefits in the financial statements; nor is the Fund aware of any tax positions for which it is reasonably possible that the total amounts of unrecognized tax benefits will significantly change in the next twelve months. The Fund files a U.S. federal tax return, in addition to state and local tax returns as required. The Fund's federal income tax returns are subject to examination by the Internal Revenue Service (IRS) for a period of three fiscal years after they are filed. State and local tax returns may be subject to examination for an additional fiscal year depending on the jurisdiction. Foreign taxes are provided for based on the Fund's understanding of the tax rules and rates that exist in the foreign markets in which it invests. The Fund is subject to a tax imposed on capital gains by certain countries in which it invests.
Distributions are declared and recorded on the ex-dividend date. Income dividends and capital gain distributions are declared separately for each class. Income and capital gain distributions are determined in accordance with income tax regulations, which may differ from GAAP. In addition, the Fund claimed a portion of the payment made to redeeming shareholders as a distribution for income tax purposes.
Capital accounts within the financial statements are adjusted for permanent book-tax differences. These adjustments have no impact on net assets or the results of operations. Capital accounts are not adjusted for temporary book-tax differences which will reverse in a subsequent period.
Book-tax differences are primarily due to futures contracts, foreign currency transactions, passive foreign investment companies (PFIC), market discount, certain foreign taxes, redemptions in-kind, deferred trustees compensation, capital loss carryforwards and losses deferred due to wash sales.
The federal tax cost of investment securities and unrealized appreciation (depreciation) as of period end were as follows:
Gross unrealized appreciation | $ 1,751,994 |
Gross unrealized depreciation | (459,470) |
Net unrealized appreciation (depreciation) on securities | $ 1,292,524 |
Tax Cost | $ 9,797,500 |
Annual Report
Notes to Financial Statements - continued
(Amounts in thousands except percentages)
3. Significant Accounting Policies - continued
Income Tax Information and Distributions to Shareholders - continued
The tax-based components of distributable earnings as of period end were as follows:
Undistributed ordinary income | $ 109,669 |
Capital loss carryforward | $ (49,248) |
Net unrealized appreciation (depreciation) on securities and other investments | $ 1,292,925 |
Capital loss carryforwards are only available to offset future capital gains of the Fund to the extent provided by regulations and may be limited. Under the Regulated Investment Company Modernization Act of 2010 (the Act), the Fund is permitted to carry forward capital losses incurred in taxable years beginning after December 22, 2010 for an unlimited period and such capital losses are required to be used prior to any losses that expire. The capital loss carryforward information presented below, including any applicable limitation, is estimated as of fiscal period end and is subject to adjustment.
Fiscal year of expiration | |
2017 | $ (49,248) |
The tax character of distributions paid was as follows:
| October 31, 2015 | October 31, 2014 |
Ordinary Income | $ 74,589 | $ 224,912 |
Short-Term Trading (Redemption) Fees. Shares held by investors in the Fund less than 30 days may have been subject to a redemption fee equal to 1.00% of the NAV of shares redeemed. All redemption fees, which reduce the proceeds of the shareholder redemption, are retained by the Fund and accounted for as an addition to paid in capital.
Delayed Delivery Transactions and When-Issued Securities. During the period, the Fund transacted in securities on a delayed delivery or when-issued basis. Payment and delivery may take place after the customary settlement period for that security. The price of the underlying securities and the date when the securities will be delivered and paid for are fixed at the time the transaction is negotiated. The securities purchased on a delayed delivery or when-issued basis are identified as such in the Fund's Schedule of Investments. The Fund may receive compensation for interest forgone in the purchase of a delayed delivery or when-issued security. With respect to purchase commitments, the Fund identifies securities as segregated in its records with a value at least equal to the amount of the commitment. Losses may arise due to changes in the value of the underlying securities or if the counterparty does not perform under the contract's terms, or if the issuer does not issue the securities due to political, economic, or other factors.
Annual Report
3. Significant Accounting Policies - continued
Restricted Securities. The Fund may invest in securities that are subject to legal or contractual restrictions on resale. These securities generally may be resold in transactions exempt from registration or to the public if the securities are registered. Disposal of these securities may involve time-consuming negotiations and expense, and prompt sale at an acceptable price may be difficult. Information regarding restricted securities is included at the end of the Fund's Schedule of Investments.
4. Derivative Instruments.
Risk Exposures and the Use of Derivative Instruments. The Fund's investment objective allows the Fund to enter into various types of derivative contracts, including futures contracts. Derivatives are investments whose value is primarily derived from underlying assets, indices or reference rates and may be transacted on an exchange or over-the-counter (OTC). Derivatives may involve a future commitment to buy or sell a specified asset based on specified terms, to exchange future cash flows at periodic intervals based on a notional principal amount, or for one party to make one or more payments upon the occurrence of specified events in exchange for periodic payments from the other party.
The Fund used derivatives to increase returns and to manage exposure to certain risks as defined below. The success of any strategy involving derivatives depends on analysis of numerous economic factors, and if the strategies for investment do not work as intended, the Fund may not achieve its objectives.
The Fund's use of derivatives increased or decreased its exposure to the following risk:
Equity Risk | Equity risk relates to the fluctuations in the value of financial instruments as a result of changes in market prices (other than those arising from interest rate risk or foreign exchange risk), whether caused by factors specific to an individual investment, its issuer, or all factors affecting all instruments traded in a market or market segment. |
The Fund is also exposed to additional risks from investing in derivatives, such as liquidity risk and counterparty credit risk. Liquidity risk is the risk that the Fund will be unable to close out the derivative in the open market in a timely manner. Counterparty credit risk is the risk that the counterparty will not be able to fulfill its obligation to the Fund. Counterparty credit risk related to exchange-traded futures contracts may be mitigated by the protection provided by the exchange on which they trade.
Investing in derivatives may involve greater risks than investing in the underlying assets directly and, to varying degrees, may involve risk of loss in excess of any initial investment and collateral received and amounts recognized in the Statement of Assets and Liabilities. In addition, there may be the risk that the change in value of the derivative contract does not correspond to the change in value of the underlying instrument.
Annual Report
Notes to Financial Statements - continued
(Amounts in thousands except percentages)
4. Derivative Instruments - continued
Futures Contracts. A futures contract is an agreement between two parties to buy or sell a specified underlying instrument for a fixed price at a specified future date. The Fund used futures contracts to manage its exposure to the stock market.
Upon entering into a futures contract, a fund is required to deposit either cash or securities (initial margin) with a clearing broker in an amount equal to a certain percentage of the face value of the contract. Futures contracts are marked-to-market daily and subsequent daily payments (variation margin) are made or received by a fund depending on the daily fluctuations in the value of the futures contracts and are recorded as unrealized appreciation or (depreciation). This receivable and/or payable, if any, is included in daily variation margin for derivative instruments in the Statement of Assets and Liabilities. Realized gain or (loss) is recorded upon the expiration or closing of a futures contract.
Any open futures contracts at period end are presented in the Schedule of Investments under the caption "Futures Contracts." The underlying face amount at value reflects each contract's exposure to the underlying instrument or index at period end. Securities deposited to meet initial margin requirements are identified in the Schedule of Investments. Cash deposited to meet initial margin requirements is presented as segregated cash with brokers for derivative instruments in the Statement of Assets and Liabilities.
During the period the Fund recognized net realized gain (loss) of $33,241 and a change in net unrealized appreciation (depreciation) of $(15,395) related to its investment in futures contracts. These amounts are included in the Statement of Operations.
5. Purchases and Sales of Investments.
Purchases and sales of securities, other than short-term securities and in-kind transactions, aggregated $6,392,387 and $6,317,742, respectively.
Redemptions In-Kind. During the period, 4,932 shares of the Fund held by unaffiliated entities were redeemed for cash and investments, including accrued interest with a value of $197,848. The net realized gain of $41,387 on investments delivered through in-kind redemptions is included in the accompanying Statement of Operations. The amount of in-kind redemptions is included in share transactions in the accompanying Statement of Changes in Net Assets as well as Note 11: Share Transactions. The Fund recognized no gain or loss for federal income tax purposes.
6. Fees and Other Transactions with Affiliates.
Management Fee. Fidelity Management & Research Company (the investment adviser) and its affiliates provide the Fund with investment management related services for which the Fund pays a monthly management fee. The management fee is the
Annual Report
6. Fees and Other Transactions with Affiliates - continued
Management Fee - continued
sum of an individual fund fee rate that is based on an annual rate of .424% of the Fund's average net assets and an annualized group fee rate that averaged .25% during the period. The group fee rate is based upon the average net assets of all the mutual funds advised by the investment adviser, including any mutual funds previously advised by the investment adviser that are currently advised by Fidelity SelectCo, LLC, an affiliate of the investment adviser. The group fee rate decreases as assets under management increase and increases as assets under management decrease. In addition, the management fee is subject to a performance adjustment (up to a maximum of ± .20% of the Fund's average net assets over a 36 month performance period). The upward or downward adjustment to the management fee is based on the relative investment performance of International Discovery as compared to its benchmark index, the MSCI EAFE Index, over the same 36 month performance period. For the reporting period, the total annual management fee rate, including the performance adjustment, was .78% of the Fund's average net assets. The performance adjustment included in the management fee rate may be higher or lower than the maximum performance adjustment rate due to the difference between the average net assets for the reporting and performance periods.
Distribution and Service Plan Fees. In accordance with Rule 12b-1 of the 1940 Act, the Fund has adopted separate Distribution and Service Plans for each class of shares. Certain classes pay Fidelity Distributors Corporation (FDC), an affiliate of the investment adviser, separate Distribution and Service Fees, each of which is based on an annual percentage of each class' average net assets. In addition, FDC may pay financial intermediaries for selling shares of the Fund and providing shareholder support services.
For the period, the Distribution and Service Fee rates, total fees and amounts retained by FDC were as follows:
| Distribution
Fee | Service
Fee | Total Fees | Retained
by FDC |
Class A | -% | .25% | $ 731 | $ 4 |
Class T | .25% | .25% | 229 | 1 |
Class B | .75% | .25% | 34 | 25 |
Class C | .75% | .25% | 343 | 37 |
| | | $ 1,337 | $ 67 |
Sales Load. FDC may receive a front-end sales charge of up to 5.75% for selling Class A shares and 3.50% for selling Class T shares, some of which is paid to financial intermediaries for selling shares of the Fund. Depending on the holding period, FDC may receive contingent deferred sales charges levied on Class A, Class T, Class B, and Class C redemptions. The deferred sales charges range from 5.00% to 1.00% for Class B shares, 1.00% for Class C shares, 1.00% for certain purchases of Class A shares and .25% for certain purchases of Class T shares.
Annual Report
Notes to Financial Statements - continued
(Amounts in thousands except percentages)
6. Fees and Other Transactions with Affiliates - continued
Sales Load - continued
For the period, sales charge amounts retained by FDC were as follows:
| Retained
by FDC |
Class A | $ 62 |
Class T | 7 |
Class B A | 1 |
Class C A | 3 |
| $ 73 |
A When Class B and Class C shares are initially sold, FDC pays commissions from its own resources to financial intermediaries through which the sales are made.
Transfer Agent Fees. Fidelity Investments Institutional Operations Company, Inc., (FIIOC), an affiliate of the investment adviser, is the transfer, dividend disbursing and shareholder servicing agent for each class of the Fund. FIIOC receives account fees and asset-based fees that vary according to the account size and type of account of the shareholders of the respective classes of the Fund, except for Class K and Class Z. FIIOC receives an asset-based fee of Class K's and Class Z's average net assets. FIIOC pays for typesetting, printing and mailing of shareholder reports, except proxy statements.
For the period, transfer agent fees for each class were as follows:
| Amount | % of
Class-Level Average
Net Assets |
Class A | $ 788 | .27 |
Class T | 117 | .26 |
Class B | 10 | .30 |
Class C | 93 | .27 |
International Discovery | 13,037 | .18 |
Class K | 1,135 | .05 |
Class I | 1,576 | .18 |
Class Z | 17 | .05 |
| $ 16,773 | |
Accounting and Security Lending Fees. Fidelity Service Company, Inc. (FSC), an affiliate of the investment adviser, maintains the Fund's accounting records. The accounting fee is based on the level of average net assets for each month. Under a separate contract, FSC administers the security lending program. The security lending fee is based on the number and duration of lending transactions.
Annual Report
6. Fees and Other Transactions with Affiliates - continued
Brokerage Commissions. The Fund placed a portion of its portfolio transactions with brokerage firms which are affiliates of the investment adviser. Brokerage commissions are included in net realized gain (loss) and change in net unrealized appreciation (depreciation) in the Statement of Operations. The commissions paid to these affiliated firms were $6 for the period.
Other. During the period, the investment adviser reimbursed the Fund for certain losses in the amount of $46
7. Committed Line of Credit.
The Fund participates with other funds managed by the investment adviser or an affiliate in a $4.25 billion credit facility (the "line of credit") to be utilized for temporary or emergency purposes to fund shareholder redemptions or for other short-term liquidity purposes. The Fund has agreed to pay commitment fees on its pro-rata portion of the line of credit, which amounted to $16 and is reflected in Miscellaneous expenses on the Statement of Operations. During the period, the Fund did not borrow on this line of credit.
8. Security Lending.
The Fund lends portfolio securities through a lending agent from time to time in order to earn additional income. For equity securities, a lending agent is used and may loan securities to certain qualified borrowers, including Fidelity Capital Markets (FCM), a broker-dealer affiliated with the Fund. On the settlement date of the loan, the Fund receives collateral (in the form of U.S. Treasury obligations, letters of credit and/or cash) against the loaned securities and maintains collateral in an amount not less than 100% of the market value of the loaned securities during the period of the loan. The market value of the loaned securities is determined at the close of business of the Fund and any additional required collateral is delivered to the Fund on the next business day. The Fund or borrower may terminate the loan at any time, and if the borrower defaults on its obligation to return the securities loaned because of insolvency or other reasons, the Fund may apply collateral received from the borrower against the obligation. The Fund may experience delays and costs in recovering the securities loaned. Any cash collateral received is invested in the Fidelity Securities Lending Cash Central Fund. The value of loaned securities and cash collateral at period end are disclosed on the Fund's Statement of Assets and Liabilities. Security lending income represents the income earned on investing cash collateral, less rebates paid to borrowers and any lending agent fees associated with the loan, plus any premium payments received for lending certain types of securities. Security lending income is presented in the Statement of Operations as a component of income from Fidelity Central Funds. Total security lending income during the period amounted to $3,281. During the period, there were no securities loaned to FCM.
Annual Report
Notes to Financial Statements - continued
(Amounts in thousands except percentages)
9. Expense Reductions.
Commissions paid to certain brokers with whom the investment adviser, or its affiliates, places trades on behalf of the Fund include an amount in addition to trade execution, which may be rebated back to the Fund to offset certain expenses. This amount totaled $1,110 for the period.
In addition, during the period the investment adviser reimbursed and/or waived a portion of fund-level operating expenses in the amount of $45 and a portion of class-level operating expenses as follows:
| Amount |
Class A | $ 6 |
Class T | 1 |
Class B | -* |
Class C | 1 |
International Discovery | 177 |
Class I | 13 |
| $ 198 |
* In the amount of less than five hundred dollars.
10. Distributions to Shareholders.
Distributions to shareholders of each class were as follows:
Years ended October 31, | 2015 | 2014 |
From net investment income | | |
Class A | $ 864 | $ 2,857 |
Class T | 23 | 344 |
Class B | - | 2 |
Class C | - | 79 |
International Discovery | 49,040 | 93,065 |
Class K | 19,835 | 33,983 |
Class I | 4,544 | 5,936 |
Class Z | 283 | 60 |
Total | $ 74,589 | $ 136,326 |
From net realized gain | | |
Class A | $ - | $ 2,660 |
Class T | - | 423 |
Class B | - | 52 |
Class C | - | 295 |
International Discovery | - | 61,190 |
Class K | - | 20,093 |
Class I | - | 3,838 |
Class Z | - | 35 |
Total | $ - | $ 88,586 |
Annual Report
11. Share Transactions.
Share transactions for each class were as follows and may contain automatic conversions between classes or exchanges between funds:
| Shares | Dollars |
Years ended October 31, | 2015 | 2014 | 2015 | 2014 |
Class A | | | | |
Shares sold | 1,331 | 1,382 | $ 53,289 | $ 54,489 |
Reinvestment of distributions | 22 | 137 | 843 | 5,280 |
Shares redeemed | (1,915) | (2,632) | (76,178) | (104,067) |
Net increase (decrease) | (562) | (1,113) | $ (22,046) | $ (44,298) |
Class T | | | | |
Shares sold | 178 | 200 | $ 7,105 | $ 7,804 |
Reinvestment of distributions | 1 | 19 | 23 | 736 |
Shares redeemed | (355) | (311) | (13,954) | (12,118) |
Net increase (decrease) | (176) | (92) | $ (6,826) | $ (3,578) |
Class B | | | | |
Shares sold | 1 | 6 | $ 53 | $ 233 |
Reinvestment of distributions | - | 1 | - | 51 |
Shares redeemed | (64) | (58) | (2,536) | (2,266) |
Net increase (decrease) | (63) | (51) | $ (2,483) | $ (1,982) |
Class C | | | | |
Shares sold | 201 | 232 | $ 7,918 | $ 9,059 |
Reinvestment of distributions | - | 9 | - | 337 |
Shares redeemed | (314) | (250) | (12,486) | (9,726) |
Net increase (decrease) | (113) | (9) | $ (4,568) | $ (330) |
International Discovery | | | | |
Shares sold | 20,827 | 28,809 | $ 832,233 | $ 1,144,588 |
Reinvestment of distributions | 1,199 | 3,813 | 46,913 | 148,138 |
Shares redeemed | (33,573) | (37,231) | (1,345,593) | (1,476,965) |
Net increase (decrease) | (11,547) | (4,609) | $ (466,447) | $ (184,239) |
Class K | | | | |
Shares sold | 15,372 | 15,775 | $ 613,737 | $ 628,261 |
Reinvestment of distributions | 508 | 1,396 | 19,835 | 54,076 |
Shares redeemed | (21,494) A | (18,729) | (860,632) A | (741,205) |
Net increase (decrease) | (5,614) | (1,558) | $ (227,060) | $ (58,868) |
Class I | | | | |
Shares sold | 15,392 | 10,468 | $ 602,134 | $ 410,346 |
Reinvestment of distributions | 33 | 91 | 1,286 | 3,529 |
Shares redeemed | (5,606) | (5,852) | (221,504) | (225,868) |
Net increase (decrease) | 9,819 | 4,707 | $ 381,916 | $ 188,007 |
Class Z | | | | |
Shares sold | 402 | 993 | $ 16,312 | $ 39,070 |
Reinvestment of distributions | 7 | 2 | 283 | 95 |
Shares redeemed | (559) | (96) | (22,228) | (3,785) |
Net increase (decrease) | (150) | 899 | $ (5,633) | $ 35,380 |
A Amount includes in-kind redemptions (see Note 5: Redemptions In-Kind).
Annual Report
Notes to Financial Statements - continued
(Amounts in thousands except percentages)
12. Other.
The Fund's organizational documents provide former and current trustees and officers with a limited indemnification against liabilities arising in connection with the performance of their duties to the Fund. In the normal course of business, the Fund may also enter into contracts that provide general indemnifications. The Fund's maximum exposure under these arrangements is unknown as this would be dependent on future claims that may be made against the Fund. The risk of material loss from such claims is considered remote.
At the end of the period, Strategic Advisers International Fund was the owner of record of approximately 13% of the total outstanding shares of the Fund.
Annual Report
To the Trustees of Fidelity Investment Trust and the Shareholders of Fidelity International Discovery Fund:
In our opinion, the accompanying statement of assets and liabilities, including the schedule of investments, and the related statements of operations and of changes in net assets and the financial highlights present fairly, in all material respects, the financial position of Fidelity International Discovery Fund (a fund of Fidelity Investment Trust) at October 31, 2015, the results of its operations for the year then ended, the changes in its net assets for each of the two years in the period then ended and the financial highlights for each of the five years in the period then ended, in conformity with accounting principles generally accepted in the United States of America. These financial statements and financial highlights (hereafter referred to as "financial statements") are the responsibility of the Fidelity International Discovery Fund's management. Our responsibility is to express an opinion on these financial statements based on our audits. We conducted our audits of these financial statements in accordance with the standards of the Public Company Accounting Oversight Board (United States). Those standards require that we plan and perform the audit to obtain reasonable assurance about whether the financial statements are free of material misstatement. An audit includes examining, on a test basis, evidence supporting the amounts and disclosures in the financial statements, assessing the accounting principles used and significant estimates made by management, and evaluating the overall financial statement presentation. We believe that our audits, which included confirmation of securities at October 31, 2015 by correspondence with the custodian and brokers, provide a reasonable basis for our opinion.
PricewaterhouseCoopers LLP
Boston, Massachusetts
December 16, 2015
Annual Report
The Trustees, Member of the Advisory Board, and officers of the trust and fund, as applicable, are listed below. The Board of Trustees governs the fund and is responsible for protecting the interests of shareholders. The Trustees are experienced executives who meet periodically throughout the year to oversee the fund's activities, review contractual arrangements with companies that provide services to the fund, oversee management of the risks associated with such activities and contractual arrangements, and review the fund's performance. Each of the Trustees oversees 170 funds.
The Trustees hold office without limit in time except that (a) any Trustee may resign; (b) any Trustee may be removed by written instrument, signed by at least two-thirds of the number of Trustees prior to such removal; (c) any Trustee who requests to be retired or who has become incapacitated by illness or injury may be retired by written instrument signed by a majority of the other Trustees; and (d) any Trustee may be removed at any special meeting of shareholders by a two-thirds vote of the outstanding voting securities of the trust. Each Trustee who is not an interested person (as defined in the 1940 Act) of the trust and the fund (Independent Trustee), shall retire not later than the last day of the calendar year in which his or her 75th birthday occurs. The Independent Trustees may waive this mandatory retirement age policy with respect to individual Trustees. The officers and Advisory Board Member hold office without limit in time, except that any officer and Advisory Board Member may resign or may be removed by a vote of a majority of the Trustees at any regular meeting or any special meeting of the Trustees. Except as indicated, each individual has held the office shown or other offices in the same company for the past five years.
Experience, Skills, Attributes, and Qualifications of the Fund's Trustees. The Governance and Nominating Committee has adopted a statement of policy that describes the experience, qualifications, attributes, and skills that are necessary and desirable for potential Independent Trustee candidates (Statement of Policy). The Board believes that each Trustee satisfied at the time he or she was initially elected or appointed a Trustee, and continues to satisfy, the standards contemplated by the Statement of Policy. The Governance and Nominating Committee also engages professional search firms to help identify potential Independent Trustee candidates who have the experience, qualifications, attributes, and skills consistent with the Statement of Policy. From time to time, additional criteria based on the composition and skills of the current Independent Trustees, as well as experience or skills that may be appropriate in light of future changes to board composition, business conditions, and regulatory or other developments, have also been considered by the professional search firms and the Governance and Nominating Committee. In addition, the Board takes into account the Trustees' commitment and participation in Board and committee meetings, as well as their leadership of standing and ad hoc committees throughout their tenure.
In determining that a particular Trustee was and continues to be qualified to serve as a Trustee, the Board has considered a variety of criteria, none of which, in isolation, was controlling. The Board believes that, collectively, the Trustees have balanced and diverse experience, qualifications, attributes, and skills, which allow the Board to operate effectively in governing the fund and protecting the interests of shareholders. Information about the specific experience, skills, attributes, and qualifications of each Trustee, which in each case led to the Board's conclusion that the Trustee should serve (or continue to serve) as a trustee of the fund, is provided below.
Annual Report
Board Structure and Oversight Function. James C. Curvey is an interested person (as defined in the 1940 Act) and currently serves as Chairman. The Trustees have determined that an interested Chairman is appropriate and benefits shareholders because an interested Chairman has a personal and professional stake in the quality and continuity of services provided to the fund. Independent Trustees exercise their informed business judgment to appoint an individual of their choosing to serve as Chairman, regardless of whether the Trustee happens to be independent or a member of management. The Independent Trustees have determined that they can act independently and effectively without having an Independent Trustee serve as Chairman and that a key structural component for assuring that they are in a position to do so is for the Independent Trustees to constitute a substantial majority for the Board. The Independent Trustees also regularly meet in executive session. Ned C. Lautenbach serves as Chairman of the Independent Trustees and as such (i) acts as a liaison between the Independent Trustees and management with respect to matters important to the Independent Trustees and (ii) with management prepares agendas for Board meetings.
Fidelity funds are overseen by different Boards of Trustees. The fund's Board oversees Fidelity's high income and certain equity funds, and other Boards oversee Fidelity's investment-grade bond, money market, asset allocation, and sector funds. The asset allocation funds may invest in Fidelity funds overseen by the fund's Board. The use of separate Boards, each with its own committee structure, allows the Trustees of each group of Fidelity funds to focus on the unique issues of the funds they oversee, including common research, investment, and operational issues. On occasion, the separate Boards establish joint committees to address issues of overlapping consequences for the Fidelity funds overseen by each Board.
The Trustees operate using a system of committees to facilitate the timely and efficient consideration of all matters of importance to the Trustees, the fund, and fund shareholders and to facilitate compliance with legal and regulatory requirements and oversight of the fund's activities and associated risks. The Board, acting through its committees, has charged FMR and its affiliates with (i) identifying events or circumstances the occurrence of which could have demonstrably adverse effects on the fund's business and/or reputation; (ii) implementing processes and controls to lessen the possibility that such events or circumstances occur or to mitigate the effects of such events or circumstances if they do occur; and (iii) creating and maintaining a system designed to evaluate continuously business and market conditions in order to facilitate the identification and implementation processes described in (i) and (ii) above. Because the day-to-day operations and activities of the fund are carried out by or through FMR, its affiliates and other service providers, the fund's exposure to risks is mitigated but not eliminated by the processes overseen by the Trustees. While each of the Board's committees has responsibility for overseeing different aspects of the fund's activities, oversight is exercised primarily through the Operations, Audit, and Compliance Committees. In addition, the Independent Trustees have worked with FMR to enhance the Board's oversight of investment and financial risks, legal and regulatory risks, technology risks, and operational risks, including the development of additional risk reporting to the Board. For example, a working group comprised of Independent Trustees and FMR has worked and continues to work to review the Fidelity funds' valuation-related activities, reporting and risk management. Appropriate personnel, including but not limited to the fund's Chief Compliance Officer (CCO), FMR's internal auditor, the independent accountants, the fund's Treasurer and portfolio management personnel, make periodic reports to the Board's committees, as appropriate, including an annual review of Fidelity's risk management program for the Fidelity funds. The responsibilities of each standing committee, including their oversight responsibilities, are described further under "Standing Committees of the Fund's Trustees."
Annual Report
Trustees and Officers - continued
The fund's Statement of Additional Information (SAI) includes more information about the Trustees. To request a free copy, call Fidelity at 1-877-208-0098.
Interested Trustees*:
Correspondence intended for each Trustee who is an interested person may be sent to Fidelity Investments, 245 Summer Street, Boston, Massachusetts 02210.
Name, Year of Birth; Principal Occupations and Other Relevant Experience+ |
James C. Curvey (1935) |
Year of Election or Appointment: 2007 Trustee Chairman of the Board of Trustees |
| Mr. Curvey also serves as Trustee of other Fidelity funds. Mr. Curvey is a Director of Fidelity Research & Analysis Co. (investment adviser firm, 2009-present), and Vice Chairman (2007-present) and Director of FMR LLC (diversified financial services company). In addition, Mr. Curvey serves as an Overseer for the Boston Symphony Orchestra and a member of the board of Artis-Naples, Naples, Florida, and as a Trustee for Brewster Academy, Wolfeboro, New Hampshire. Previously, Mr. Curvey served as a Director of Fidelity Investments Money Management, Inc. (investment adviser firm, 2009-2014) and a Director of FMR and FMR Co., Inc. (investment adviser firms, 2007-2014). |
Charles S. Morrison (1960) |
Year of Election or Appointment: 2014 Trustee |
| Mr. Morrison also serves as Trustee of other funds. He serves as a Director of Fidelity Investments Money Management, Inc. (FIMM) (investment adviser firm, 2014-present), Director of Fidelity SelectCo, LLC (investment adviser firm, 2014-present), President, Asset Management (2014-present), and is an employee of Fidelity Investments. Previously, Mr. Morrison served as Vice President of Fidelity's Fixed Income and Asset Allocation Funds (2012-2014), President, Fixed Income (2011-2014), Vice President of Fidelity's Money Market Funds (2005-2009), President, Money Market Group Leader of FMR (investment adviser firm, 2009), and Senior Vice President, Money Market Group of FMR (2004-2009). Mr. Morrison also served as Vice President of Fidelity's Bond Funds (2002-2005), certain Balanced Funds (2002-2005), and certain Asset Allocation Funds (2002-2007), and as Senior Vice President (2002-2005) of Fidelity's Bond Division. |
* Trustees have been determined to be "Interested Trustees" by virtue of, among other things, their affiliation with the trust or various entities under common control with FMR.
+ The information above includes each Trustee's principal occupation during the last five years and other information relating to the experience, attributes, and skills relevant to each Trustee's qualifications to serve as a Trustee, which led to the conclusion that each Trustee should serve as a Trustee for the fund.
Annual Report
Trustees and Officers - continued
Independent Trustees:
Correspondence intended for each Independent Trustee (that is, the Trustees other than the Interested Trustees) may be sent to Fidelity Investments, P.O. Box 55235, Boston, Massachusetts 02205-5235.
Name, Year of Birth; Principal Occupations and Other Relevant Experience+ |
Dennis J. Dirks (1948) |
Year of Election or Appointment: 2005 Trustee |
| Mr. Dirks also serves as Trustee of other Fidelity funds. Prior to his retirement in May 2003, Mr. Dirks was Chief Operating Officer and a member of the Board of The Depository Trust & Clearing Corporation (DTCC). He also served as President, Chief Operating Officer, and Board member of The Depository Trust Company (DTC) and President and Board member of the National Securities Clearing Corporation (NSCC). In addition, Mr. Dirks served as Chief Executive Officer and Board member of the Government Securities Clearing Corporation, Chief Executive Officer and Board member of the Mortgage-Backed Securities Clearing Corporation, as a Trustee and a member of the Finance Committee of Manhattan College (2005-2008), as a Trustee and a member of the Finance Committee of AHRC of Nassau County (2006-2008), and as a member of the Independent Directors Council (IDC) Governing Council (2010-2015). Mr. Dirks is a member of the Board of Directors for The Brookville Center for Children's Services, Inc. (2009-present). |
Alan J. Lacy (1953) |
Year of Election or Appointment: 2008 Trustee |
| Mr. Lacy also serves as Trustee of other Fidelity funds. Mr. Lacy serves as a member of the Board of Directors of Dave & Buster's Entertainment, Inc. (restaurant and entertainment complexes, 2010-present) and Bristol-Myers Squibb Company (global pharmaceuticals, 2008-present). In addition, Mr. Lacy served as Senior Adviser (2007-2014) of Oak Hill Capital Partners, L.P. (private equity) and also served as Chief Executive Officer (2000-2005) and Vice Chairman (2005-2006) of Sears Holdings Corporation and Sears, Roebuck and Co. (retail). Mr. Lacy is a member of the Board of Trustees of The National Parks Conservation Association (2006-present). Previously, Mr. Lacy served as Chairman of the Board of Trustees of the National Parks Conservation Association (2008-2011) and as a member of the Board of Directors for The Western Union Company (global money transfer, 2006-2011), The Hillman Companies, Inc. (hardware wholesalers, 2010-2014), and Earth Fare, Inc. (retail grocery, 2010-2014). |
Ned C. Lautenbach (1944) |
Year of Election or Appointment: 2000 Trustee Chairman of the Independent Trustees |
| Mr. Lautenbach also serves as Trustee of other Fidelity funds. Mr. Lautenbach currently serves as the Lead Director of the Eaton Corporation Board of Directors (diversified industrial, 1997-present). Mr. Lautenbach is Chairman of the Board of Directors of Artis-Naples in Naples, Florida (2012-present), a member of the Council on Foreign Relations (1994-present), and a member of the Board of Governors, State University System of Florida (2013-present). Previously, Mr. Lautenbach was a Partner/Advisory Partner at Clayton, Dubilier & Rice, LLC (private equity investment, 1998-2010), as well as a Director of Sony Corporation (2006-2007). |
Joseph Mauriello (1944) |
Year of Election or Appointment: 2008 Trustee |
| Mr. Mauriello also serves as Trustee of other Fidelity funds. Prior to his retirement in January 2006, Mr. Mauriello served in numerous senior management positions including Deputy Chairman and Chief Operating Officer (2004-2005), and Vice Chairman of Financial Services (2002-2004) of KPMG LLP US (professional services, 1965-2005). Mr. Mauriello currently serves as a member of the Board of Directors of XL Group plc. (global insurance and re-insurance, 2006-present) and the Independent Directors Council (IDC) Governing Council (2015-present). Previously, Mr. Mauriello served as a Director of the Hamilton Funds of the Bank of New York (2006-2007) and of Arcadia Resources Inc. (health care services and products, 2007-2012). |
Robert W. Selander (1950) |
Year of Election or Appointment: 2011 Trustee |
| Mr. Selander also serves as Trustee of other Fidelity funds. Mr. Selander serves as a Director of The Western Union Company (global money transfer, 2014-present). Previously, Mr. Selander served as a Member of the Advisory Board of other Fidelity funds (2011), and Executive Vice Chairman (2010), Chief Executive Officer (2009-2010), and President and Chief Executive Officer (1997-2009) of Mastercard, Inc. |
Cornelia M. Small (1944) |
Year of Election or Appointment: 2005 Trustee |
| Ms. Small also serves as Trustee of other Fidelity funds. Ms. Small is a member of the Board of Directors (2009-present) and Chair of the Investment Committee (2010-present) of the Teagle Foundation. Ms. Small also serves on the Investment Committee of the Berkshire Taconic Community Foundation (2008-present). Previously, Ms. Small served as Chairperson (2002-2008) and a member of the Investment Committee and Chairperson (2008-2012) and a member of the Board of Trustees of Smith College. In addition, Ms. Small served as Chief Investment Officer, Director of Global Equity Investments, and a member of the Board of Directors of Scudder, Stevens & Clark and Scudder Kemper Investments. |
William S. Stavropoulos (1939) |
Year of Election or Appointment: 2001 Trustee Vice Chairman of the Independent Trustees |
| Mr. Stavropoulos also serves as Trustee of other Fidelity funds. Mr. Stavropoulos serves as President and Founder of the Michigan Baseball Foundation, the Great Lakes Loons (2007-present). Mr. Stavropoulos is Chairman Emeritus of the Board of Directors of The Dow Chemical Company, where he previously served in numerous senior management positions, including President, CEO (1995-2000; 2002-2004), Chairman of the Executive Committee (2000-2006), and as a member of the Board of Directors (1990-2006). Currently, Mr. Stavropoulos is Chairman of the Board of Directors of Univar Inc. (global distributor of commodity and specialty chemicals), a Director of Teradata Corporation (data warehousing and technology solutions), and Maersk Inc. (industrial conglomerate), and a member of the Advisory Board for Metalmark Capital LLC (private equity investment, 2005-present). Mr. Stavropoulos is an operating advisor to Clayton, Dubilier & Rice, LLC (private equity investment). In addition, Mr. Stavropoulos is a member of the University of Notre Dame Advisory Council for the College of Science, a Trustee of the Rollin L. Gerstacker Foundation, and a Director of the Naples Philharmonic Center for the Arts. Previously, Mr. Stavropoulos served as a Director of Chemical Financial Corporation (bank holding company, 1993-2012) and Tyco International, Ltd. (multinational manufacturing and services, 2007-2012). |
David M. Thomas (1949) |
Year of Election or Appointment: 2008 Trustee |
| Mr. Thomas also serves as Trustee of other Fidelity funds. Mr. Thomas serves as Non-Executive Chairman of the Board of Directors of Fortune Brands Home and Security (home and security products, 2011-present), as a member of the Board of Directors (2004-present) and Presiding Director (2013-present) of Interpublic Group of Companies, Inc. (marketing communication), and as a member of the Board of Trustees of the University of Florida (2013-present). Previously, Mr. Thomas served as Executive Chairman (2005-2006) and Chairman and Chief Executive Officer (2000-2005) of IMS Health, Inc. (pharmaceutical and healthcare information solutions), and a Director of Fortune Brands, Inc. (consumer products, 2000-2011). |
+ The information above includes each Trustee's principal occupation during the last five years and other information relating to the experience, attributes, and skills relevant to each Trustee's qualifications to serve as a Trustee, which led to the conclusion that each Trustee should serve as a Trustee for the fund.
Advisory Board Member and Officers:
Correspondence intended for each officer and Peter S. Lynch may be sent to Fidelity Investments, 245 Summer Street, Boston, Massachusetts 02210. Officers appear below in alphabetical order.
Name, Year of Birth; Principal Occupation |
Peter S. Lynch (1944) |
Year of Election or Appointment: 2003 Member of the Advisory Board |
| Mr. Lynch also serves as Member of the Advisory Board of other Fidelity funds. Mr. Lynch is Vice Chairman and a Director of FMR (investment adviser firm) and FMR Co., Inc. (investment adviser firm). In addition, Mr. Lynch serves as a Trustee of Boston College and as the Chairman of the Inner-City Scholarship Fund. Previously, Mr. Lynch served on the Special Olympics International Board of Directors (1997-2006). |
Elizabeth Paige Baumann (1968) |
Year of Election or Appointment: 2012 Anti-Money Laundering (AML) Officer |
| Ms. Baumann also serves as AML Officer of other funds. She is Chief AML Officer of FMR LLC (diversified financial services company, 2012-present) and is an employee of Fidelity Investments. Previously, Ms. Baumann served as Vice President and Deputy Anti-Money Laundering Officer (2007-2012). |
Marc R. Bryant (1966) |
Year of Election or Appointment: 2015 Secretary and Chief Legal Officer (CLO) |
| Mr. Bryant also serves as Secretary and CLO of other funds. Mr. Bryant serves as CLO, Secretary, and Senior Vice President of Fidelity Management & Research Company (investment adviser firm, 2015-present) and FMR Co., Inc. (investment adviser firm, 2015-present); Secretary of Fidelity SelectCo, LLC (investment adviser firm, 2015-present) and Fidelity Investments Money Management, Inc. (investment adviser firm, 2015-present); and CLO of Fidelity Management & Research (Hong Kong) Limited (investment adviser firm, 2015-present). He is Senior Vice President and Deputy General Counsel of FMR LLC (diversified financial services company). Previously, Mr. Bryant served as Secretary and Chief Legal Officer of Fidelity Rutland Square Trust II (2010-2014) and Assistant Secretary of Fidelity's Fixed Income and Asset Allocation Funds (2013-2015). Prior to joining Fidelity Investments, Mr. Bryant served as a Senior Vice President and the Head of Global Retail Legal for AllianceBernstein L.P. (2006-2010), and as the General Counsel for ProFund Advisors LLC (2001-2006). |
William C. Coffey (1969) |
Year of Election or Appointment: 2009 Assistant Secretary |
| Mr. Coffey also serves as Assistant Secretary of other funds. He is Senior Vice President and Deputy General Counsel of FMR LLC (diversified financial services company, 2010-present), and is an employee of Fidelity Investments. Previously, Mr. Coffey served as Vice President and Associate General Counsel of FMR LLC (2005-2009). |
Timothy M. Cohen (1969) |
Year of Election or Appointment: 2014 Vice President of certain Equity Funds |
| Mr. Cohen also serves as Vice President of other funds. Mr. Cohen serves as Chief Compliance Officer of FMR Investment Management (U.K.) Limited (investment adviser firm, 2013-present) and is an employee of Fidelity Investments. Previously, Mr. Cohen served as a Director of FMR Investment Management (U.K.) Limited (2013-2015). |
Jonathan Davis (1968) |
Year of Election or Appointment: 2010 Assistant Treasurer |
| Mr. Davis also serves as Assistant Treasurer of other funds, and is an employee of Fidelity Investments. Previously, Mr. Davis served as Vice President and Associate General Counsel of FMR LLC (diversified financial services company, 2003-2010). |
Adrien E. Deberghes (1967) |
Year of Election or Appointment: 2008 Deputy Treasurer |
| Mr. Deberghes also serves as an officer of other funds. He is an employee of Fidelity Investments (2008-present). Prior to joining Fidelity Investments, Mr. Deberghes was Senior Vice President of Mutual Fund Administration at State Street Corporation (2007-2008), Senior Director of Mutual Fund Administration at Investors Bank & Trust (2005-2007), and Director of Finance for Dunkin' Brands (2000-2005). |
Stephanie J. Dorsey (1969) |
Year of Election or Appointment: 2010 Assistant Treasurer |
| Ms. Dorsey also serves as an officer of other funds. She is an employee of Fidelity Investments (2008-present) and has served in other fund officer roles. Prior to joining Fidelity Investments, Ms. Dorsey served as Treasurer (2004-2008) of the JPMorgan Mutual Funds and Vice President (2004-2008) of JPMorgan Chase Bank. |
Howard J. Galligan III (1966) |
Year of Election or Appointment: 2014 Chief Financial Officer |
| Mr. Galligan also serves as Chief Financial Officer of other funds. Mr. Galligan serves as President of Fidelity Pricing and Cash Management Services (FPCMS) (2014-present) and as a Director of Strategic Advisers, Inc. (investment adviser firm, 2008-present). Previously, Mr. Galligan served as Chief Administrative Officer of Asset Management (2011-2014) and Chief Operating Officer and Senior Vice President of Investment Support for Strategic Advisers, Inc. (2003-2011). |
Scott C. Goebel (1968) |
Year of Election or Appointment: 2015 Vice President |
| Mr. Goebel serves as Vice President of other funds and is an employee of Fidelity Investments (2001-present). Previously, Mr. Goebel served as Secretary of Fidelity SelectCo, LLC (investment adviser firm, 2013-2015), Fidelity Investments Money Management, Inc. (FIMM) (investment adviser firm, 2010-2015), and Fidelity Research and Analysis Company (FRAC) (investment adviser firm, 2010-2015); General Counsel, Secretary, and Senior Vice President of Fidelity Management & Research Company (investment adviser firm, 2008-2015) and FMR Co., Inc. (investment adviser firm, 2008-2015); Assistant Secretary of Fidelity Management & Research (Japan) Limited (investment adviser firm, 2008-2015) and FMR Investment Management (U.K.) Limited (investment adviser firm, 2008-2015); Chief Legal Officer (CLO) of Fidelity Management & Research (Hong Kong) Limited (investment adviser firm, 2008-2015); Secretary and CLO of certain Fidelity funds (2008-2015); Assistant Secretary of FIMM (2008-2010), FRAC (2008-2010), and certain funds (2007-2008); and as Vice President and Secretary of Fidelity Distributors Corporation (FDC) (2005-2007). |
Brian B. Hogan (1964) |
Year of Election or Appointment: 2009 Vice President |
| Mr. Hogan also serves as Trustee or Vice President of other funds. Mr. Hogan serves as a Director of Fidelity SelectCo, LLC (investment adviser firm, 2014-present) and President of the Equity Division of FMR (investment adviser firm, 2009-present). Previously, Mr. Hogan served as Senior Vice President, Equity Research of FMR (2006-2009) and as a portfolio manager. |
Chris Maher (1972) |
Year of Election or Appointment: 2013 Assistant Treasurer |
| Mr. Maher serves as Assistant Treasurer of other funds. Mr. Maher is Vice President of Valuation Oversight and is an employee of Fidelity Investments. Previously, Mr. Maher served as Vice President of Asset Management Compliance (2013), Vice President of the Program Management Group of FMR (investment adviser firm, 2010-2013), and Vice President of Valuation Oversight (2008-2010). |
Kenneth B. Robins (1969) |
Year of Election or Appointment: 2008 President and Treasurer |
| Mr. Robins also serves as an officer of other funds. Mr. Robins serves as Executive Vice President of Fidelity Investments Money Management, Inc. (FIMM) (investment adviser firm, 2013-present) and is an employee of Fidelity Investments (2004-present). Previously, Mr. Robins served in other fund officer roles. |
Stacie M. Smith (1974) |
Year of Election or Appointment: 2013 Deputy Treasurer |
| Ms. Smith also serves as an officer of other funds. She is an employee of Fidelity Investments (2009-present) and has served in other fund officer roles. Prior to joining Fidelity Investments, Ms. Smith served as Senior Audit Manager of Ernst & Young LLP (1996-2009). |
Renee Stagnone (1975) |
Year of Election or Appointment: 2013 Deputy Treasurer |
| Ms. Stagnone also serves as Deputy Treasurer of other funds. Ms. Stagnone is an employee of Fidelity Investments (1997-present). |
Linda J. Wondrack (1964) |
Year of Election or Appointment: 2014 Chief Compliance Officer |
| Ms. Wondrack also serves as Chief Compliance Officer of other funds. Ms. Wondrack is Executive Vice President and head of the Ethics Office and Asset Management Compliance for Fidelity Investments (2012-present). Ms. Wondrack also serves as Chief Compliance Officer of Fidelity SelectCo, LLC (investment adviser firm, 2014-present); Chief Compliance Officer of Impresa Management LLC (2013-present); and Chief Compliance Officer of FMR Co., Inc. (investment adviser firm), Fidelity Investments Money Management, Inc. (investment adviser firm), Fidelity Management & Research (Japan) Limited (investment adviser firm), FMR Investment Management (U.K.) Limited (investment adviser firm), Fidelity Management & Research (Hong Kong) (investment adviser firm), Fidelity Management & Research Company (investment adviser firm), FIAM LLC (investment adviser firm), and Strategic Advisers, Inc. (investment adviser firm), Ballyrock Investment Advisors LLC, and Northern Neck Investors LLC (2012-present). Previously, Ms. Wondrack served as Senior Vice President and Chief Compliance Officer for Columbia Management Investment Advisers, LLC (2005-2012); Chief Compliance Officer for certain funds within the Columbia Family of Funds (2007-2012); and Senior Vice President of Compliance Risk Management at Bank of America (2005-2010). |
Joseph F. Zambello (1957) |
Year of Election or Appointment: 2011 Deputy Treasurer |
| Mr. Zambello also serves as Deputy Treasurer of other funds. Mr. Zambello is an employee of Fidelity Investments (1991-present). Previously, Mr. Zambello served as Vice President of the Program Management Group of FMR (investment adviser firm, 2009-2011) and Vice President of the Transfer Agent Oversight Group (2005-2009). |
Annual Report
The Board of Trustees of Advisor International Discovery Fund voted to pay to shareholders of record at the opening of business on record date, the following distributions per share derived from capital gains realized from sales of portfolio securities, and dividends derived from net investment income:
| Pay Date | Record Date | Dividends | Capital Gains |
Class A | 12/07/15 | 12/04/15 | $0.269 | $0.005 |
Class T | 12/07/15 | 12/04/15 | $0.170 | $0.005 |
Class B | 12/07/15 | 12/04/15 | $0.000 | $0.000 |
Class C | 12/07/14 | 12/04/15 | $0.000 | $0.000 |
Class A designates 12%; Class T designates 28%; Class B designates 0%; and Class C designates 0%; of the dividends distributed in during the fiscal year as qualifying for the dividends-received deduction for corporate shareholders.
Class A designates 100%; Class T designates 100%; Class B designates 0%; and Class C designates 0%; of dividends distributed in during the fiscal year as amounts which may be taken into account as a dividend for purposes of the maximum rate under section 1(h)(11) of the Internal Revenue Code.
The amounts per share which represent income derived from sources within, and taxes paid to, foreign countries or possessions of the United States are as follows:
| Pay Date | Income | Taxes |
Class A | 12/08/14 | $0.1616 | $0.0486 |
Class T | 12/08/14 | $0.0676 | $0.0486 |
Class B | 12/08/14 | $0.0000 | $0.0000 |
Class C | 12/08/14 | $0.0000 | $0.0000 |
The fund will notify shareholders in January 2016 of amounts for use in preparing 2015 income tax returns.
Annual Report
Fidelity International Discovery Fund
Each year, the Board of Trustees, including the Independent Trustees (together, the Board), votes on the renewal of the management contract with Fidelity Management & Research Company (FMR) and the sub-advisory agreements (together, the Advisory Contracts) for the fund. The Board, assisted by the advice of fund counsel and Independent Trustees' counsel, requests and considers a broad range of information relevant to the renewal of the Advisory Contracts throughout the year.
The Board meets regularly and, at each of its meetings, covers an extensive agenda of topics and materials and considers factors that are relevant to its annual consideration of the renewal of the fund's Advisory Contracts, including the services and support provided to the fund and its shareholders. The Board has established various standing committees (Committees), each composed of and chaired by Independent Trustees with varying backgrounds, to which the Board has assigned specific subject matter responsibilities in order to enhance effective decision-making by the Board. The Board, acting directly and through its Committees, requests and receives information concerning the annual consideration of the renewal of the fund's Advisory Contracts. The Board also meets as needed to consider matters specifically related to the Board's annual consideration of the renewal of the Advisory Contracts. Members of the Board may also meet with trustees of other Fidelity funds through ad hoc joint committees to discuss certain matters relevant to all of the Fidelity funds.
At its July 2015 meeting, the Board unanimously determined to renew the fund's Advisory Contracts. In reaching its determination, the Board considered all factors it believed relevant, including (i) the nature, extent, and quality of the services to be provided to the fund and its shareholders (including the investment performance of the fund); (ii) the competitiveness of the fund's management fee and total expense ratio relative to peer funds; (iii) the total costs of the services to be provided by and the profits to be realized by Fidelity from its relationship with the fund; and (iv) the extent to which (if any) economies of scale exist and would be realized as the fund grows, and whether any economies of scale are appropriately shared with fund shareholders.
In considering whether to renew the Advisory Contracts for the fund, the Board reached a determination, with the assistance of fund counsel and Independent Trustees' counsel and through the exercise of its business judgment, that the renewal of the Advisory Contracts was in the best interests of the fund and its shareholders and that the compensation payable under the Advisory Contracts was fair and reasonable. The Board's decision to renew the Advisory Contracts was not based on any single factor, but rather was based on a comprehensive consideration of all the information provided to the Board at its meetings throughout the year. The Board, in reaching its determination to renew the Advisory Contracts, was aware that shareholders of the fund have a broad range of investment choices available to them, including a wide choice among funds offered by Fidelity's competitors, and that the fund's shareholders, who have the opportunity to review and weigh the disclosure provided by the fund in its prospectus and other public disclosures, have chosen to invest in this fund, which is part of the Fidelity family of funds.
Annual Report
Nature, Extent, and Quality of Services Provided. The Board considered Fidelity's staffing as it relates to the fund, including the backgrounds of investment personnel of Fidelity, and also considered the fund's investment objective, strategies, and related investment philosophy. The Independent Trustees also had discussions with senior management of Fidelity's investment operations and investment groups. The Board considered the structure of the portfolio manager compensation program and whether this structure provides appropriate incentives to act in the best interests of the fund. Additionally, the Board considered the portfolio managers' investments, if any, in the funds that they manage.
Resources Dedicated to Investment Management and Support Services. The Board and the Fund Oversight and Research Committees reviewed the general qualifications and capabilities of Fidelity's investment staff, including its size, education, experience, and resources, as well as Fidelity's approach to recruiting, training, managing, and compensating investment personnel. The Board noted that Fidelity has continued to increase the resources devoted to non-U.S. offices, including expansion of Fidelity's global investment organization. The Board also noted that Fidelity's analysts have extensive resources, tools and capabilities that allow them to conduct sophisticated quantitative and fundamental analysis, as well as credit analysis of issuers, counterparties and guarantors. Further, the Board considered that Fidelity's investment professionals have sufficient access to global information and data so as to provide competitive investment results over time, and that those professionals also have access to sophisticated tools that permit them to assess portfolio construction and risk and performance attribution characteristics continuously, as well as to transmit new information and research conclusions rapidly around the world. Additionally, in its deliberations, the Board considered Fidelity's trading, risk management, and compliance capabilities and resources, which are integral parts of the investment management process.
Shareholder and Administrative Services. The Board considered (i) the nature, extent, quality, and cost of advisory, administrative, and shareholder services performed by FMR, the sub-advisers (together with FMR, the Investment Advisers), and their affiliates under the Advisory Contracts and under separate agreements covering transfer agency, pricing and bookkeeping, and securities lending services for the fund; (ii) the nature and extent of the supervision of third party service providers, principally custodians and subcustodians; and (iii) the resources devoted to, and the record of compliance with, the fund's compliance policies and procedures. The Board also reviewed the allocation of fund brokerage, including allocations to brokers affiliated with the Investment Advisers, the use of brokerage commissions to pay fund expenses, and the use of "soft" commission dollars to pay for research services.
Annual Report
Board Approval of Investment Advisory Contracts and
Management Fees - continued
The Board noted that the growth of fund assets over time across the complex allows Fidelity to reinvest in the development of services designed to enhance the value or convenience of the Fidelity funds as investment vehicles. These services include 24-hour access to account information and market information through telephone representatives and over the Internet, investor education materials and asset allocation tools, and the expanded availability of Fidelity Investor Centers.
In 2014, the Board formed an ad hoc Committee on Transfer Agency Fees to review the variety of transfer agency fee structures throughout the industry and Fidelity's competitive positioning with respect to industry participants.
Investment in a Large Fund Family. The Board considered the benefits to shareholders of investing in a Fidelity fund, including the benefits of investing in a fund that is part of a large family of funds offering a variety of investment disciplines and providing a large variety of mutual fund investor services. The Board noted that Fidelity had taken, or had made recommendations that resulted in the Fidelity funds taking, a number of actions over the previous year that benefited particular funds, including (i) continuing to dedicate additional resources to investment research and to the support of the senior management team that oversees asset management; (ii) continuing efforts to enhance Fidelity's global research capabilities; (iii) launching new funds and making other enhancements to meet client needs; (iv) reducing management fees and total expenses for certain index funds and diversified international funds; (v) continuing to launch dedicated lower cost underlying funds to meet portfolio construction needs related to expanding underlying fund options for Fidelity funds of funds, specifically for the Freedom Fund product lines; (vi) rationalizing product lines and gaining increased efficiencies through fund mergers; (vii) launching active fixed-income exchange-traded funds; (viii) continuing to develop, acquire and implement systems and technology to improve services to the funds and information security and to increase efficiency; (ix) implementing investment enhancements to further strengthen Fidelity's target date product line to increase investors' probability of success in achieving their goals; (x) modifying the eligibility criteria for certain share classes to accommodate roll-over assets from employer-sponsored retirement plans; (xi) launching a new Class W of the Freedom Index Funds to attract and retain Fidelity record-kept retirement plan assets; and (xii) implementing changes to Fidelity's money market product line in response to recent money market regulatory reforms.
Investment Performance. The Board considered whether the fund has operated in accordance with its investment objective, as well as its record of compliance with its investment restrictions and its performance history.
Annual Report
The Board took into account discussions with representatives of the Investment Advisers about fund investment performance that occur at Board meetings throughout the year. In this regard the Board noted that as part of regularly scheduled fund reviews and other reports to the Board on fund performance, the Board considers annualized return information for the fund, for different time periods, measured against a securities market index ("benchmark index") and a peer group of funds with similar objectives ("peer group"), if any. In its evaluation of fund investment performance, the Board gave particular attention to information indicating changes in performance of certain Fidelity funds for specific time periods and discussed with the Investment Advisers the reasons for any overperformance or underperformance.
In addition to reviewing absolute and relative fund performance, the Independent Trustees periodically consider the appropriateness of fund performance metrics in evaluating the results achieved. In general, the Independent Trustees believe that fund performance should be evaluated based on net performance (after fees and expenses) of both the highest performing and lowest performing fund share classes, where applicable, compared to appropriate benchmark indices, over appropriate time periods that may include full market cycles, and compared to peer groups, as applicable, over the same periods, taking into account relevant factors including the following: general market conditions; issuer-specific information; and fund cash flows and other factors.
The Independent Trustees recognize that shareholders evaluate performance on a net basis over their own holding periods, for which one-, three-, and five-year periods are often used as a proxy. For this reason, the performance information reviewed by the Board also included net cumulative calendar year total return information for the fund and an appropriate benchmark index and peer group for the most recent one-, three-, and five-year periods, as shown below. Returns are shown compared to the 25th percentile (top of box, 75% beaten) and 75th percentile (bottom of box, 25% beaten) of the peer universe. Returns of the benchmark index are "net MA," i.e., adjusted for tax withholding rates applicable to U.S.-based funds organized as Massachusetts business trusts.
Annual Report
Board Approval of Investment Advisory Contracts and
Management Fees - continued
Fidelity International Discovery Fund
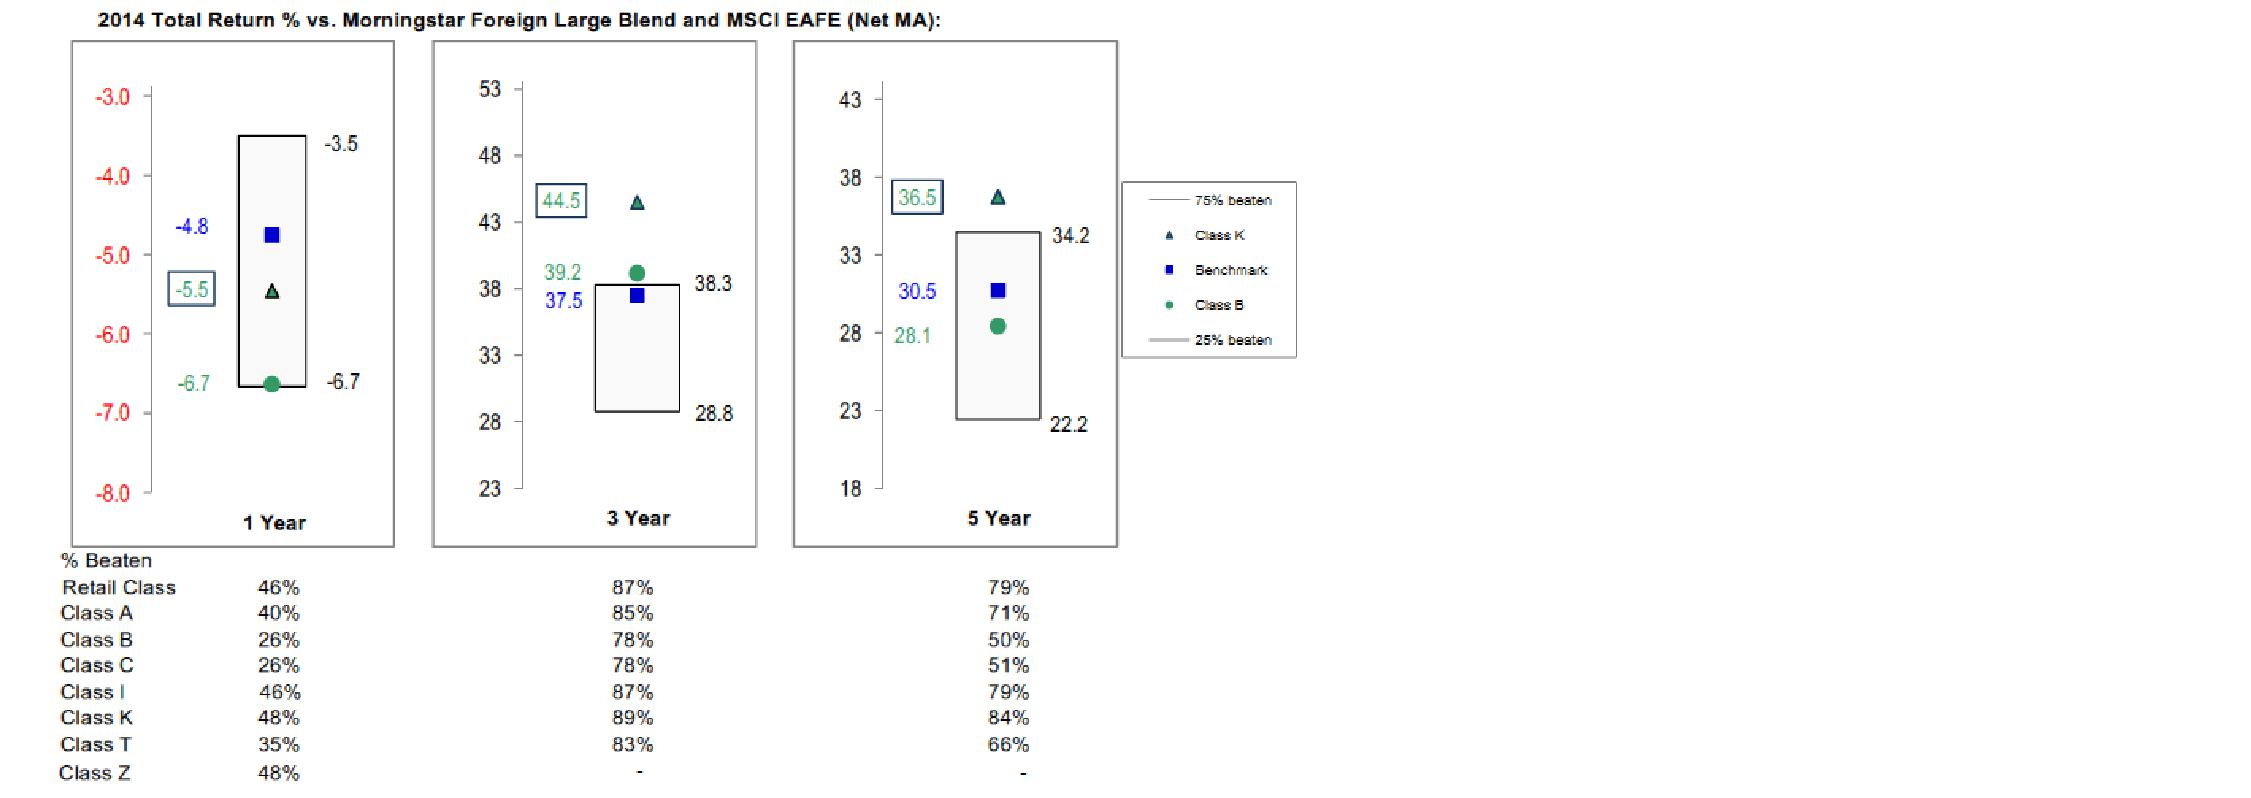
The Board also considered that the fund's management fee is subject to upward or downward adjustment depending upon whether, and to what extent, the fund's investment performance for the performance period exceeds, or is exceeded by, a securities index, thus leading to a performance adjustment for the same period. The Board noted that the performance adjustment provides FMR with a strong economic incentive to seek to achieve superior performance for the fund's shareholders and helps to more closely align the interests of FMR and the shareholders of the fund.
Based on its review, the Board concluded that the nature, extent, and quality of services provided to the fund under the Advisory Contracts should benefit the shareholders of the fund.
Competitiveness of Management Fee and Total Expense Ratio. The Board considered the fund's management fee and total expense ratio compared to "mapped groups" of competitive funds and classes created for the purpose of facilitating the Trustees' competitive analysis of management fees and total expenses. Fidelity creates "mapped groups" by combining similar Lipper investment objective categories that have comparable investment mandates. Combining Lipper investment objective categories aids the Board's management fee and total expense ratio comparisons by broadening the competitive group used for comparison.
Management Fee. The Board considered two proprietary management fee comparisons for the 12-month periods shown in basis points (BP) in the chart below. The group of Lipper funds used by the Board for management fee comparisons is referred to below as the "Total Mapped Group." The Total Mapped Group comparison focuses on a fund's standing in terms of gross management fees before expense reimbursements or caps, and without giving effect to the fund's performance adjustment, relative to the total universe of funds with comparable investment mandates, regardless of whether their management fee structures also are comparable. Funds with comparable investment mandates offer exposure to similar types of securities. Funds with comparable management fee structures have similar management fee contractual arrangements (e.g., flat rate charged for advisory services, all-inclusive fee rate, etc.). "TMG %" represents the percentage of funds in the Total Mapped Group that had management fees that were lower than the fund's. For example, a hypothetical TMG % of 20% would mean that 80% of the funds in the Total Mapped Group had higher, and 20% had lower, management fees than the fund. The fund's actual TMG %s and the number of funds in the Total Mapped Group are in the chart below. The "Asset-Size Peer Group" (ASPG) comparison focuses on a fund's standing relative to a subset of non-Fidelity funds within the Total Mapped Group that are similar in size and management fee structure without taking into account performance adjustments, if any. For example, if a fund is in the first quartile of the ASPG, the fund's management fee ranks in the least expensive or lowest 25% of funds in the ASPG. The ASPG represents at least 15% of the funds in the Total Mapped Group with comparable asset size and management fee structures, subject to a minimum of 50 funds (or all funds in the Total Mapped Group if fewer than 50). Additional information, such as the ASPG quartile in which the fund's management fee rate ranked and the impact of the fund's performance adjustment, is also included in the chart and considered by the Board.
Annual Report
Fidelity International Discovery Fund

Annual Report
Board Approval of Investment Advisory Contracts and
Management Fees - continued
The Board noted that the fund's management fee rate ranked below the median of its Total Mapped Group and below the median of its ASPG for 2014. The Board also noted the effect of the fund's performance adjustment, if any, on the fund's management fee ranking.
Furthermore, the Board considered that it had approved a reduction (effective August 1, 2014) in the individual fund fee rate component of the management fee rate for the fund from 0.450% to 0.424%. The Board considered that the chart reflects the fund's lower management fee for 2014, as if the lower fee were in effect for the entire year.
The Board noted that, in 2014, the ad hoc Committee on Group Fee was formed by it and other Fidelity fund boards to conduct an in-depth review of the "group fee" component of the management fee of funds with such management fee structures. Committee focus included the mechanics of the group fee, the competitive landscape of group fee structures, Fidelity funds with no group fee component and investment products not included in group fee assets. The Board also considered that, for funds subject to the group fee, FMR agreed to voluntarily waive fees over a specified period of time in amounts designed to account for assets converted from certain funds to certain collective investment trusts.
The Board also noted that, in 2013, the ad hoc Committee on Management Fees was formed to conduct an in-depth review of the management fee rates of Fidelity's active equity mutual funds. The Committee focused on the following areas: (i) standard fee structures; (ii) research consumption and trading evolution; (iii) management fee competitiveness/profitability by category; and (iv) factors that drive institutional pricing.
Based on its review, the Board concluded that the fund's management fee is fair and reasonable in light of the services that the fund receives and the other factors considered.
Total Expense Ratio. In its review of each class's total expense ratio, the Board considered the fund's management fee as well as other fund or class expenses, as applicable, such as transfer agent fees, pricing and bookkeeping fees, fund-paid 12b-1 fees, and custodial, legal, and audit fees. The Board noted the impact of the fund's performance adjustment. The Board also noted that Fidelity may agree to waive fees and expenses from time to time, and the extent to which, if any, it has done so for the fund. As part of its review, the Board also considered the current and historical total expense ratios of each class of the fund compared to competitive fund median expenses. Each class of the fund is compared to those funds and classes in the Total Mapped Group (used by the Board for management fee comparisons) that have a similar sales load structure.
The Board noted that the total expense ratio of each of Class A, Class B, Class C, Class I, Class Z, the retail class, and Class K ranked below its competitive median for 2014 and the total expense ratio of Class T ranked above its competitive median for 2014. The Board considered that, in general, various factors can affect total expense ratios. The Board noted that the total expense ratio of Class T was above the competitive median primarily because of higher 12b-1 fees on Class T as compared to most competitor funds. Class T has a higher 12b-1 fee, but a lower front-end sales charge, than traditionally priced front-end sales charge classes. The Board considered that Class T is primarily sold load-waived in the retirement plan market where its 0.50% 12b-1 fee is comparable to competing no-load, higher 12b-1 fee classes designed specifically for retirement plans. The Board noted that the fund offers multiple classes, each of which has a different sales load and 12b-1 fee structure, and that the multiple structures are intended to offer a range of pricing options for the intermediary market. The Board also noted that the total expense ratios of the classes vary primarily by the level of their 12b-1 fees, although differences in transfer agent fees may also cause expenses to vary from class to class.
Annual Report
Fees Charged to Other Fidelity Clients. The Board also considered Fidelity fee structures and other information with respect to clients of Fidelity, such as other funds advised or subadvised by Fidelity, pension plan clients, and other institutional clients with similar mandates. The Board noted the findings of the 2013 ad hoc joint committee (created with the board of other Fidelity funds), which reviewed and compared Fidelity's institutional investment advisory business with its business of providing services to the Fidelity funds, including the differences in services provided, fees charged, and costs incurred, as well as competition in their respective marketplaces.
Based on its review of total expense ratios and fees charged to other Fidelity clients, the Board concluded that, although Class T was above the median of the universe presented for comparison, the total expense ratio of each class of the fund was reasonable in light of the services that the fund and its shareholders receive and the other factors considered.
Costs of the Services and Profitability. The Board considered the revenues earned and the expenses incurred by Fidelity in conducting the business of developing, marketing, distributing, managing, administering and servicing the fund and servicing the fund's shareholders. The Board also considered the level of Fidelity's profits in respect of all the Fidelity funds.
On an annual basis, Fidelity presents to the Board information about the profitability of its relationship with the fund. Fidelity calculates profitability information for each fund, as well as aggregate profitability information for groups of Fidelity funds and all Fidelity funds, using a series of detailed revenue and cost allocation methodologies which originate with the books and records of Fidelity on which Fidelity's audited financial statements are based. The Audit Committee of the Board reviews any significant changes from the prior year's methodologies.
PricewaterhouseCoopers LLP (PwC), independent registered public accounting firm and auditor to Fidelity and certain Fidelity funds, has been engaged annually by the Board as part of the Board's assessment of Fidelity's profitability analysis. PwC's engagement includes the review and assessment of the methodologies used by Fidelity in determining the revenues and expenses attributable to Fidelity's mutual fund business, and completion of agreed-upon procedures in respect of the mathematical accuracy of fund profitability and its conformity to established allocation methodologies. After considering PwC's reports issued under the engagement and information provided by Fidelity, the Board concluded that while other allocation methods may also be reasonable, Fidelity's profitability methodologies are reasonable in all material respects.
Annual Report
Board Approval of Investment Advisory Contracts and
Management Fees - continued
The Board also reviewed Fidelity's non-fund businesses and fall-out benefits related to the mutual fund business as well as cases where Fidelity's affiliates may benefit from or be related to the fund's business.
The Board considered the costs of the services provided by and the profits realized by Fidelity in connection with the operation of the fund and was satisfied that the profitability was not excessive.
Economies of Scale. The Board considered whether there have been economies of scale in respect of the management of the Fidelity funds, whether the Fidelity funds (including the fund) have appropriately benefited from any such economies of scale, and whether there is potential for realization of any further economies of scale. The Board considered the extent to which the fund will benefit from economies of scale as assets grow through increased services to the fund, through waivers or reimbursements, or through fee or expense ratio reductions. The Board also noted that in 2013, it and the boards of other Fidelity funds created an ad hoc committee (the Economies of Scale Committee) to analyze whether Fidelity attains economies of scale in respect of the management and servicing of the Fidelity funds, whether the Fidelity funds have appropriately benefited from such economies of scale, and whether there is potential for realization of any further economies of scale.
The Board recognized that the fund's management contract incorporates a "group fee" structure, which provides for lower group fee rates as total group assets increase, and for higher group fee rates as total group assets decrease (with "group assets" defined to include fund assets under FMR's management plus sector fund assets previously under FMR's management and currently managed by Fidelity SelectCo, LLC). FMR calculates the group fee rates based on a tiered asset "breakpoint" schedule that varies based on asset class. The Board considered that the group fee is designed to deliver the benefits of economies of scale to fund shareholders when total Fidelity fund assets increase, even if assets of any particular fund are unchanged or have declined, because some portion of Fidelity's costs are attributable to services provided to all Fidelity funds, and all funds benefit if those costs can be allocated among more assets. The Board concluded that, given the group fee structure, fund shareholders will benefit from lower management fees as group assets increase at the fund complex level, regardless of whether Fidelity achieves any such economies of scale.
Annual Report
The Board concluded, taking into account the analysis of the Economies of Scale Committee, that economies of scale, if any, are being appropriately shared between fund shareholders and Fidelity.
Additional Information Requested by the Board. In order to develop fully the factual basis for consideration of the Fidelity funds' Advisory Contracts, the Board requested and received additional information on certain topics, including: (i) fund performance trends and Fidelity's long-term strategies for certain funds; (ii) the various share classes employed by Fidelity and the attributes of each class, together with similar information on the distribution and servicing payments made by Fidelity or the funds to third-party participants in the distribution channels; (iii) fund profitability, and fund performance in relation to fund profitability; (iv) the methodology with respect to evaluating competitive fund data and peer group classifications and fee comparisons; (v) annual fund profitability margins, with particular focus on certain funds with negative margins; (vi) the realization of fall-out benefits in certain Fidelity business units; (vii) economies of scale and the way in which they are shared with fund shareholders; (viii) Fidelity's group fee structures, including the group fee schedule of breakpoints; (ix) the impact of cost containment measures on the funds; and (x) the transfer agent fee structure.
Based on its evaluation of all of the conclusions noted above, and after considering all factors it believed relevant, the Board concluded that the advisory fee structures are fair and reasonable, and that the fund's Advisory Contracts should be renewed.
Annual Report
Investment Adviser
Fidelity Management & Research Company
Boston, MA
Investment Sub-Advisers
FMR Co., Inc.
FMR Investment Management
(U.K.) Limited
FIL Investment Advisors
FIL Investments (Japan) Limited
FIL Investment Advisors (UK) Limited
Fidelity Management & Research
(Hong Kong) Limited
Fidelity Management & Research
(Japan) Limited
General Distributor
Fidelity Distributors Corporation
Smithfield, RI
Transfer and Service Agents
Fidelity Investments Institutional Operations Company, Inc.
Boston, MA
Fidelity Service Company, Inc.
Boston, MA
Custodian
The Northern Trust Company
Chicago, IL
(Fidelity Investment logo)(registered trademark)
AID-UANN-1215
1.806656.110
ContentsPerformance: The Bottom LineManagement's Discussion of Fund PerformanceShareholder Expense ExampleInvestment Changes (Unaudited)Investments October 31, 2015Financial StatementsNotes to Financial StatementsReport of Independent Registered Public Accounting FirmTrustees and OfficersDistributions (Unaudited)Board Approval of Investment Advisory Contracts and Management Fees
(Fidelity Investment logo)(registered trademark)
Fidelity Advisor®
International Discovery
Fund - Class I
(formerly Institutional Class)
Annual Report
October 31, 2015
(Fidelity Cover Art)
Class I is
a class of Fidelity®
International Discovery Fund
Contents
Performance | (Click Here) | How the fund has done over time. |
Management's Discussion of Fund Performance | (Click Here) | The Portfolio Manager's review of fund performance and strategy. |
Shareholder Expense Example | (Click Here) | An example of shareholder expenses. |
Investment Changes | (Click Here) | A summary of major shifts in the fund's investments over the past six months. |
Investments | (Click Here) | A complete list of the fund's investments with their market values. |
Financial Statements | (Click Here) | Statements of assets and liabilities, operations, and changes in net assets, as well as financial highlights. |
Notes | (Click Here) | Notes to financial statements. |
Report of Independent Registered Public Accounting Firm | (Click Here) | |
Trustees and Officers | (Click Here) | |
Distributions | (Click Here) | |
Board Approval of Investment Advisory Contracts and Management Fees | (Click Here) | |
To view a fund's proxy voting guidelines and proxy voting record for the 12-month period ended June 30, visit http://www.fidelity.com/proxyvotingresults or visit the Securities and Exchange Commission's (SEC) web site at http://www.sec.gov. You may also call 1-877-208-0098 to request a free copy of the proxy voting guidelines.
Standard & Poor's, S&P and S&P 500 are registered service marks of The McGraw-Hill Companies, Inc. and have been licensed for use by Fidelity Distributors Corporation.
Other third-party marks appearing herein are the property of their respective owners.
All other marks appearing herein are registered or unregistered trademarks or service marks of FMR LLC or an affiliated company. © 2015 FMR LLC. All rights reserved.
Annual Report
This report and the financial statements contained herein are submitted for the general information of the shareholders of the fund. This report is not authorized for distribution to prospective investors in the fund unless preceded or accompanied by an effective prospectus.
A fund files its complete schedule of portfolio holdings with the SEC for the first and third quarters of each fiscal year on Form N-Q. Forms N-Q are available on the SEC's web site at http://www.sec.gov. A fund's Forms N-Q may be reviewed and copied at the SEC's Public Reference Room in Washington, DC. Information regarding the operation of the SEC's Public Reference Room may be obtained by calling 1-800-SEC-0330. For a complete list of a fund's portfolio holdings, view the most recent holdings listing, semiannual report, or annual report on Fidelity's web site at http://www.fidelity.com, http://www.advisor.fidelity.com, or http://www.401k.com, as applicable.
NOT FDIC INSURED • MAY LOSE VALUE • NO BANK GUARANTEE
Neither the fund nor Fidelity Distributors Corporation is a bank.
Annual Report
Average annual total return reflects the change in the value of an investment, assuming reinvestment of the class' distributions from dividend income and capital gains (the profits earned upon the sale of securities that have grown in value, if any) and assuming a constant rate of performance each year. The $10,000 table and the fund's returns do not reflect the deduction of taxes that a shareholder would pay on fund distributions or the redemption of fund shares. During periods of reimbursement by Fidelity, a fund's total return will be greater than it would be had the reimbursement not occurred. How a fund did yesterday is no guarantee of how it will do tomorrow.
Average Annual Total Returns
Periods ended October 31, 2015 | Past 1
year | Past 5
years | Past 10
years |
Class I | 3.44% | 6.05% | 5.30% |
$10,000 Over 10 Years
Let's say hypothetically that $10,000 was invested in Fidelity Advisor® International Discovery Fund - Class I on October 31, 2005. The chart shows how the value of your investment would have changed, and also shows how the MSCI EAFE Index performed over the same period.
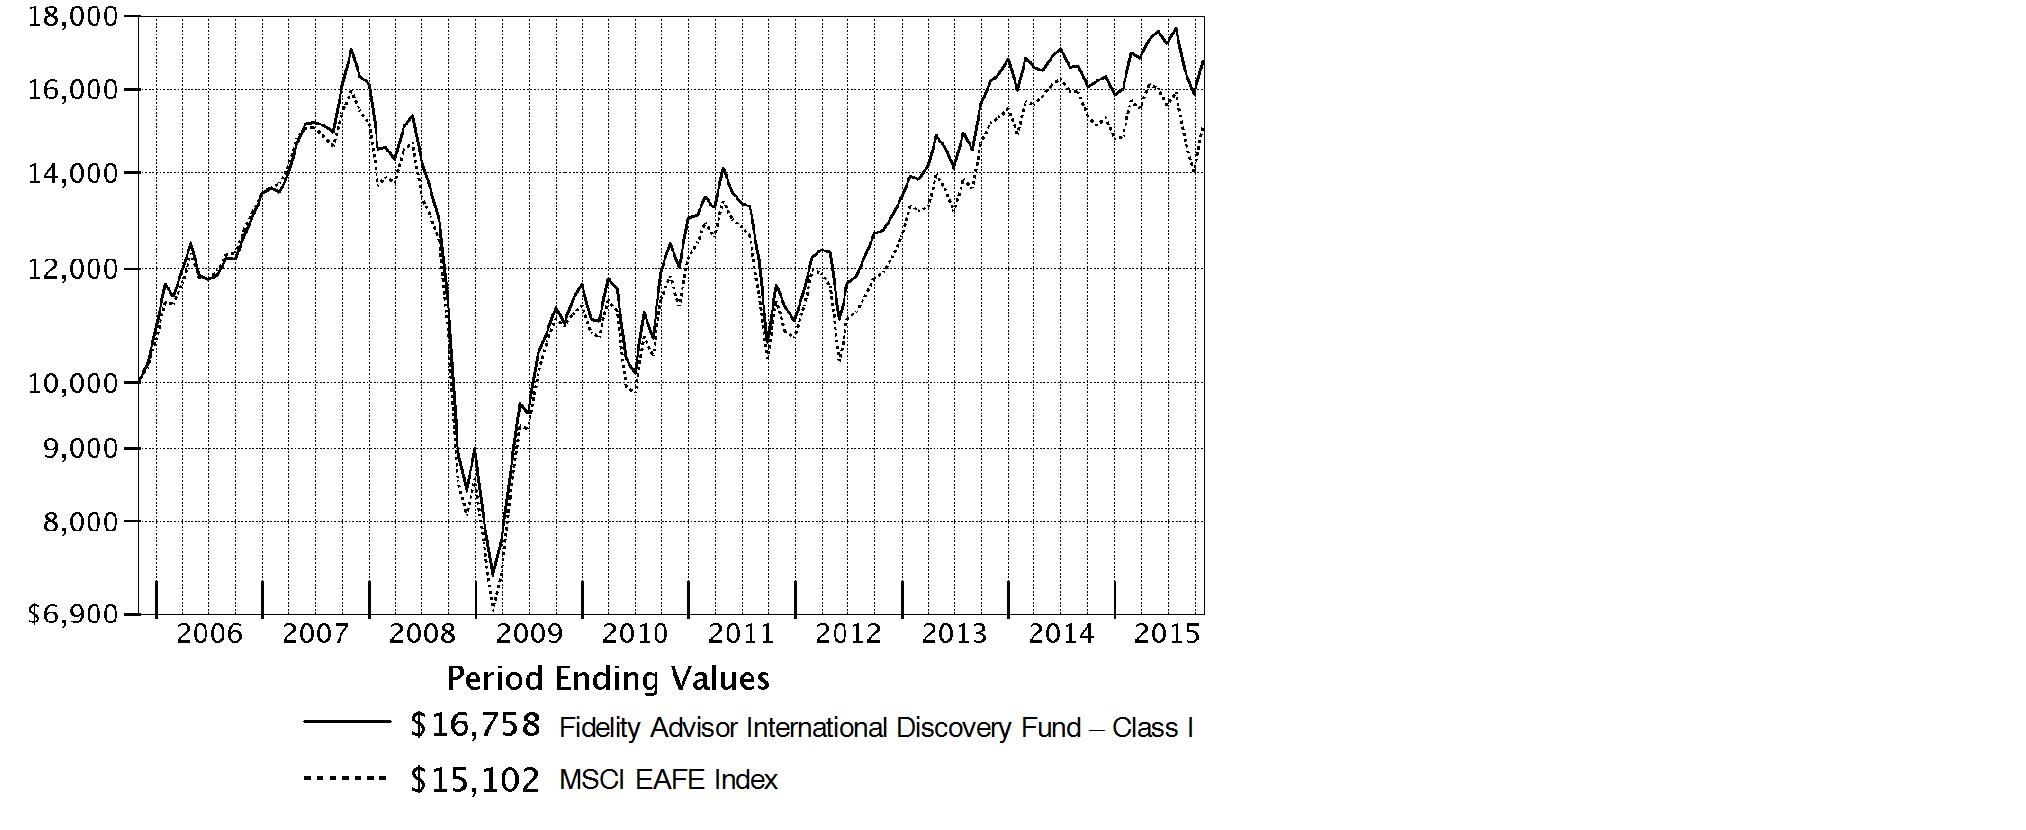
Annual Report
Market Recap: International equities suffered a moderate setback for the 12 months ending October 31, 2015, held back by a collapse in commodities prices that hurt resources-related sectors and geographies. The MSCI ACWI (All Country World Index) ex USA Index returned -4.55% for the period, affected also by concerns about global economic growth. Commodity producers remained under pressure for much of the past year, largely related to economic deceleration in China (-1%), the world's second-largest economy and a leading consumer of raw materials. This effect was exacerbated by U.S. dollar strength relative to global currencies, which weighed on commodities priced in dollars and acutely impacted equity returns within regions most exposed to resources prices. The emerging-markets group, for example, returned about -15% this period. Canada, a significant energy producer, returned roughly -17%. Net energy consumer Japan (+9%) was the best-performing region by far. Only about a quarter of the nearly 50 index countries managed a gain this period: Ireland (+19%) - the EU's fastest-growing economy - and Israel (+17%) proved top performers; Greece (-56%) and Brazil (-46%), among the worst. As for sectors, energy (-25%) and materials (-16%) declined sharply, whereas the two consumer sectors each gained about 6%.
Comments from Portfolio Manager William Kennedy: For the year, the fund's share classes (excluding sales charges, if applicable) outpaced the 0.08% return of the benchmark MSCI EAFE Index. Most of the fund's outperformance came from security selection in the financials and consumer discretionary sectors, favorable positioning in continental Europe and Asia Pacific ex Japan and stock picks in the United Kingdom. Sector allocations gave an added boost. In terms of top individual contributors, an average underweighting in U.K.-listed oil and gas company Royal Dutch Shell helped, as plunging oil prices caused the stock to decline. An out-of-index stake in Constellation Software returned roughly 55%, as the Canadian company's track record of smart acquisitions drove better-than-expected earnings growth. Another winner was Luxembourg-based media company Altice, which saw its entrepreneurial management team and appetite for acquisitions drive a huge gain. By contrast, the fund's underweighting in Japan modestly hindered relative performance. In terms of individual detractors, an overweighting in France-based exploration and production company Total hurt as oil prices slid. A tiny out-of-index stake in Australia-based online fashion retailer MySale Group detracted when a profit warning sank the stock. Altice and MySale were not in the portfolio at period end.
The views expressed above reflect those of the portfolio manager(s) only through the end of the period as stated on the cover of this report and do not necessarily represent the views of Fidelity or any other person in the Fidelity organization. Any such views are subject to change at any time based upon market or other conditions and Fidelity disclaims any responsibility to update such views. These views may not be relied on as investment advice and, because investment decisions for a Fidelity fund are based on numerous factors, may not be relied on as an indication of trading intent on behalf of any Fidelity fund.
Annual Report
Shareholder Expense Example
As a shareholder of the Fund, you incur two types of costs: (1) transaction costs, including sales charges (loads) on purchase payments or redemption proceeds, redemption fees and (2) ongoing costs, including management fees, distribution and/or service (12b-1) fees and other Fund expenses. This Example is intended to help you understand your ongoing costs (in dollars) of investing in the Fund and to compare these costs with the ongoing costs of investing in other mutual funds.
The Example is based on an investment of $1,000 invested at the beginning of the period and held for the entire period (May 1, 2015 to October 31, 2015).
Actual Expenses
The first line of the accompanying table for each class of the Fund provides information about actual account values and actual expenses. You may use the information in this line, together with the amount you invested, to estimate the expenses that you paid over the period. Simply divide your account value by $1,000.00 (for example, an $8,600 account value divided by $1,000.00 = 8.6), then multiply the result by the number in the first line for a class of the Fund under the heading entitled "Expenses Paid During Period" to estimate the expenses you paid on your account during this period. A small balance maintenance fee of $12.00 that is charged once a year may apply for certain accounts with a value of less than $2,000. This fee is not included in the table below. If it was, the estimate of expenses you paid during the period would be higher, and your ending account value lower, by this amount. In addition, the Fund, as a shareholder in the underlying Fidelity Central Funds, will indirectly bear its pro-rata share of the fees and expenses incurred by the underlying Fidelity Central Funds. These fees and expenses are not included in the Fund's annualized expense ratio used to calculate the expense estimate in the table below.
Hypothetical Example for Comparison Purposes
The second line of the accompanying table for each class of the Fund provides information about hypothetical account values and hypothetical expenses based on a Class' actual expense ratio and an assumed rate of return of 5% per year before expenses, which is not the Class' actual return. The hypothetical account values and expenses may not be used to estimate the actual ending account balance or expenses you paid for the period. You may use this information to compare the ongoing costs of investing in the Fund and other funds. To do so, compare this 5% hypothetical example with the 5% hypothetical examples that appear in the shareholder reports of the other funds. A small balance maintenance fee of $12.00 that is charged once a year may apply for certain accounts with a value of less than $2,000. This fee is not included in the table below. If it was, the estimate of expenses you paid during the period would be higher, and your ending account value lower, by this amount. In addition, the Fund, as a shareholder in the underlying Fidelity Central Funds, will indirectly bear its pro-rata share of the fees and expenses incurred by the underlying Fidelity Central Funds. These fees and expenses are not included in the Fund's annualized expense ratio used to calculate the expense estimate in the table below.
Please note that the expenses shown in the table are meant to highlight your ongoing costs only and do not reflect any transaction costs. Therefore, the second line of the table is useful in comparing ongoing costs only, and will not help you determine the relative total costs of owning different funds. In addition, if these transactional costs were included, your costs would have been higher.
Annual Report
Shareholder Expense Example - continued
| Annualized
Expense RatioB | Beginning
Account Value
May 1, 2015 | Ending
Account Value
October 31, 2015 | Expenses Paid
During PeriodC
May 1, 2015 to
October 31, 2015 |
Class A | 1.33% | | | |
Actual | | $ 1,000.00 | $ 965.80 | $ 6.59 |
HypotheticalA | | $ 1,000.00 | $ 1,018.50 | $ 6.77 |
Class T | 1.57% | | | |
Actual | | $ 1,000.00 | $ 964.80 | $ 7.78 |
HypotheticalA | | $ 1,000.00 | $ 1,017.29 | $ 7.98 |
Class B | 2.11% | | | |
Actual | | $ 1,000.00 | $ 962.00 | $ 10.43 |
HypotheticalA | | $ 1,000.00 | $ 1,014.57 | $ 10.71 |
Class C | 2.09% | | | |
Actual | | $ 1,000.00 | $ 962.10 | $ 10.34 |
HypotheticalA | | $ 1,000.00 | $ 1,014.67 | $ 10.61 |
International Discovery | .99% | | | |
Actual | | $ 1,000.00 | $ 967.70 | $ 4.91 |
HypotheticalA | | $ 1,000.00 | $ 1,020.21 | $ 5.04 |
Class K | .86% | | | |
Actual | | $ 1,000.00 | $ 968.10 | $ 4.27 |
HypotheticalA | | $ 1,000.00 | $ 1,020.87 | $ 4.38 |
Class I | 1.00% | | | |
Actual | | $ 1,000.00 | $ 967.40 | $ 4.96 |
HypotheticalA | | $ 1,000.00 | $ 1,020.16 | $ 5.09 |
Class Z | .87% | | | |
Actual | | $ 1,000.00 | $ 968.10 | $ 4.32 |
HypotheticalA | | $ 1,000.00 | $ 1,020.82 | $ 4.43 |
A 5% return per year before expenses
B Annualized expense ratio reflects expenses net of applicable fee waivers.
C Expenses are equal to each Class' annualized expense ratio, multiplied by the average account value over the period, multiplied by 184/365 (to reflect the one-half year period).
Annual Report
Investment Changes (Unaudited)
Annual Report
Asset Allocation as of October 31, 2015 |
| % of fund's
net assets | % of fund's net assets
6 months ago |
Stocks and Equity Futures | 97.5 | 99.1 |
Other Investments | 0.1 | 0.1 |
Short-Term Investments and Net Other Assets (Liabilities) | 2.4 | 0.8 |
Top Ten Stocks as of October 31, 2015 |
| % of fund's
net assets | % of fund's net assets
6 months ago |
Total SA (France, Oil, Gas & Consumable Fuels) | 2.0 | 1.8 |
Novartis AG (Switzerland, Pharmaceuticals) | 1.8 | 1.7 |
Unilever NV (Certificaten Van Aandelen) (Bearer) (Netherlands, Personal Products) | 1.6 | 1.5 |
Anheuser-Busch InBev SA NV (Belgium, Beverages) | 1.4 | 1.6 |
AIA Group Ltd. (Hong Kong, Insurance) | 1.3 | 1.3 |
Techtronic Industries Co. Ltd. (Hong Kong, Household Durables) | 1.3 | 1.2 |
Housing Development Finance Corp. Ltd. (India, Thrifts & Mortgage Finance) | 1.3 | 1.2 |
Mitsubishi UFJ Financial Group, Inc. (Japan, Banks) | 1.3 | 1.2 |
Novo Nordisk A/S Series B (Denmark, Pharmaceuticals) | 1.2 | 1.1 |
KDDI Corp. (Japan, Wireless Telecommunication Services) | 1.1 | 1.1 |
| 14.3 | |
Market Sectors as of October 31, 2015 |
| % of fund's
net assets | % of fund's net assets
6 months ago |
Financials | 24.2 | 24.6 |
Consumer Discretionary | 17.4 | 16.9 |
Health Care | 12.8 | 13.2 |
Consumer Staples | 11.9 | 9.5 |
Industrials | 10.5 | 10.9 |
Information Technology | 7.5 | 9.7 |
Telecommunication Services | 4.9 | 4.7 |
Energy | 4.3 | 5.0 |
Materials | 2.3 | 3.0 |
Annual Report
Investments October 31, 2015
Showing Percentage of Net Assets
Common Stocks - 95.5% |
| Shares | | Value (000s) |
Australia - 1.7% |
1-Page Ltd. (a) | 2,546,348 | | $ 8,566 |
Ansell Ltd. | 1,597,592 | | 22,734 |
Australia & New Zealand Banking Group Ltd. | 3,558,240 | | 68,817 |
Flight Centre Travel Group Ltd. (d) | 485,418 | | 13,059 |
Mantra Group Ltd. | 7,839,732 | | 22,935 |
Ramsay Health Care Ltd. | 1,171,082 | | 51,478 |
TOTAL AUSTRALIA | | 187,589 |
Austria - 0.3% |
Andritz AG | 447,100 | | 22,518 |
Erste Group Bank AG (a) | 456,800 | | 13,397 |
TOTAL AUSTRIA | | 35,915 |
Bailiwick of Jersey - 1.7% |
Integrated Diagnostics Holdings PLC (a) | 4,961,400 | | 27,337 |
Regus PLC | 11,120,488 | | 57,362 |
Shire PLC | 588,700 | | 44,583 |
Wolseley PLC | 1,048,393 | | 61,553 |
TOTAL BAILIWICK OF JERSEY | | 190,835 |
Belgium - 1.9% |
Anheuser-Busch InBev SA NV | 1,256,127 | | 149,887 |
KBC Groep NV | 955,745 | | 58,225 |
TOTAL BELGIUM | | 208,112 |
Bermuda - 0.5% |
PAX Global Technology Ltd. | 43,428,000 | | 56,789 |
Canada - 2.2% |
Alimentation Couche-Tard, Inc. Class B (sub. vtg.) | 786,100 | | 33,816 |
Constellation Software, Inc. | 230,700 | | 99,683 |
Entertainment One Ltd. | 3,283,077 | | 11,119 |
Imperial Oil Ltd. | 1,249,100 | | 41,563 |
PrairieSky Royalty Ltd. (d) | 1,502,800 | | 29,571 |
Suncor Energy, Inc. | 680,200 | | 20,241 |
TOTAL CANADA | | 235,993 |
Cayman Islands - 1.3% |
Alibaba Group Holding Ltd. sponsored ADR (a) | 385,500 | | 32,316 |
CK Hutchison Holdings Ltd. | 1,264,716 | | 17,318 |
Ctrip.com International Ltd. sponsored ADR (a) | 148,100 | | 13,769 |
Lee's Pharmaceutical Holdings Ltd. | 6,774,164 | | 8,746 |
Qunar Cayman Islands Ltd. sponsored ADR (a) | 515,900 | | 25,042 |
Common Stocks - continued |
| Shares | | Value (000s) |
Cayman Islands - continued |
Regina Miracle International Holdings Ltd. | 15,269,891 | | $ 13,845 |
WuXi PharmaTech Cayman, Inc. sponsored ADR (a) | 826,200 | | 36,931 |
TOTAL CAYMAN ISLANDS | | 147,967 |
China - 0.5% |
Jiangsu Hengrui Medicine Co. Ltd. | 4,183,623 | | 34,711 |
Kweichow Moutai Co. Ltd. | 663,582 | | 22,405 |
Yantai Changyu Pioneer Wine Co. Ltd. (B Shares) | 697,195 | | 2,215 |
TOTAL CHINA | | 59,331 |
Cyprus - 0.0% |
SPDI Secure Property Development & Investment PLC (a) | 520,230 | | 229 |
Denmark - 1.2% |
Novo Nordisk A/S Series B | 2,385,545 | | 126,681 |
Finland - 0.7% |
Sampo Oyj (A Shares) | 1,663,200 | | 81,351 |
France - 9.6% |
Accor SA | 1,694,818 | | 84,314 |
Air Liquide SA | 429,100 | | 55,632 |
ALTEN | 88,659 | | 4,602 |
Atos Origin SA | 441,674 | | 35,237 |
AXA SA | 3,834,100 | | 102,325 |
Capgemini SA | 860,800 | | 76,701 |
Cegedim SA (a) | 539,590 | | 19,136 |
Havas SA | 4,843,944 | | 42,027 |
Numericable Group SA (a) | 340,324 | | 15,419 |
Rexel SA | 1,265,582 | | 17,299 |
Safran SA | 614,700 | | 46,689 |
Sanofi SA | 992,072 | | 100,076 |
Sodexo SA | 433,700 | | 38,616 |
SR Teleperformance SA | 291,800 | | 22,936 |
Total SA (d) | 4,569,799 | | 220,991 |
Unibail-Rodamco | 157,400 | | 43,981 |
VINCI SA | 1,425,100 | | 96,189 |
Vivendi SA | 1,148,200 | | 27,622 |
TOTAL FRANCE | | 1,049,792 |
Germany - 5.5% |
Aareal Bank AG | 1,026,009 | | 39,094 |
Axel Springer Verlag AG | 526,702 | | 29,620 |
Beiersdorf AG | 244,300 | | 23,219 |
Continental AG | 299,300 | | 71,980 |
Common Stocks - continued |
| Shares | | Value (000s) |
Germany - continued |
Deutsche Boerse AG | 529,594 | | $ 48,773 |
Deutsche Telekom AG | 3,260,600 | | 61,076 |
Fresenius SE & Co. KGaA | 471,500 | | 34,647 |
GEA Group AG | 884,110 | | 35,452 |
KION Group AG | 1,377,249 | | 62,109 |
LEG Immobilien AG | 254,661 | | 20,317 |
OSRAM Licht AG | 1,016,232 | | 59,797 |
ProSiebenSat.1 Media AG | 1,176,900 | | 63,661 |
Rational AG | 84,000 | | 33,350 |
United Internet AG | 433,247 | | 22,513 |
TOTAL GERMANY | | 605,608 |
Hong Kong - 3.0% |
AIA Group Ltd. | 24,849,200 | | 145,699 |
China Resources Beer Holdings Co. Ltd. | 21,482,000 | | 40,562 |
Techtronic Industries Co. Ltd. | 38,670,000 | | 141,365 |
TOTAL HONG KONG | | 327,626 |
India - 3.0% |
Bharti Infratel Ltd. (a) | 12,647,734 | | 75,119 |
HDFC Bank Ltd. sponsored ADR | 1,298,584 | | 79,395 |
Housing Development Finance Corp. Ltd. | 7,355,732 | | 140,900 |
Lupin Ltd. | 452,781 | | 13,331 |
Sun Pharmaceutical Industries Ltd. | 347,397 | | 4,721 |
Titan Co. Ltd. (a) | 2,186,522 | | 11,862 |
TOTAL INDIA | | 325,328 |
Ireland - 1.4% |
Bank of Ireland (a) | 62,440,800 | | 23,002 |
Dalata Hotel Group PLC (a) | 388,200 | | 1,930 |
Glanbia PLC | 2,527,500 | | 49,028 |
Kerry Group PLC Class A | 989,500 | | 80,465 |
TOTAL IRELAND | | 154,425 |
Isle of Man - 0.7% |
Optimal Payments PLC (a) | 11,615,044 | | 54,433 |
Playtech Ltd. | 1,395,092 | | 18,410 |
TOTAL ISLE OF MAN | | 72,843 |
Israel - 1.3% |
Frutarom Industries Ltd. | 1,038,100 | | 44,860 |
Common Stocks - continued |
| Shares | | Value (000s) |
Israel - continued |
Partner Communications Co. Ltd. (a) | 1,755,983 | | $ 7,969 |
Teva Pharmaceutical Industries Ltd. sponsored ADR | 1,558,300 | | 92,236 |
TOTAL ISRAEL | | 145,065 |
Italy - 2.9% |
De Longhi SpA | 2,630,100 | | 64,438 |
Intesa Sanpaolo SpA | 25,324,300 | | 88,222 |
Mediaset SpA | 17,602,100 | | 89,425 |
Telecom Italia SpA (a) | 50,788,000 | | 70,853 |
TOTAL ITALY | | 312,938 |
Japan - 15.9% |
ACOM Co. Ltd. (a)(d) | 5,223,800 | | 28,599 |
Aozora Bank Ltd. | 11,048,000 | | 40,381 |
Asahi Group Holdings | 1,240,200 | | 38,255 |
Astellas Pharma, Inc. | 6,994,600 | | 101,523 |
Coca-Cola Central Japan Co. Ltd. | 536,400 | | 7,539 |
Dentsu, Inc. | 1,281,800 | | 72,060 |
Don Quijote Holdings Co. Ltd. | 1,346,000 | | 49,444 |
Hitachi Ltd. | 10,000 | | 58 |
Hoya Corp. | 2,994,400 | | 123,569 |
Japan Exchange Group, Inc. | 1,932,000 | | 31,088 |
Japan Tobacco, Inc. | 1,302,700 | | 45,089 |
KDDI Corp. | 5,167,900 | | 125,055 |
Keyence Corp. | 147,360 | | 76,717 |
Misumi Group, Inc. | 3,200,000 | | 41,671 |
Mitsubishi UFJ Financial Group, Inc. | 21,656,100 | | 140,062 |
Monex Group, Inc. | 12,212,749 | | 34,330 |
NEC Corp. | 25,011,000 | | 77,159 |
Nidec Corp. | 701,900 | | 52,892 |
Olympus Corp. | 1,784,400 | | 60,190 |
ORIX Corp. | 6,891,200 | | 100,638 |
Sanken Electric Co. Ltd. | 1,393,000 | | 4,841 |
Seven & i Holdings Co. Ltd. | 931,900 | | 42,331 |
Seven Bank Ltd. | 12,110,400 | | 55,182 |
Shinsei Bank Ltd. | 32,483,000 | | 68,109 |
SoftBank Corp. | 724,300 | | 40,581 |
Sony Corp. | 2,320,500 | | 65,961 |
Sundrug Co. Ltd. | 626,200 | | 32,988 |
Tsuruha Holdings, Inc. | 1,040,400 | | 82,425 |
United Arrows Ltd. | 847,000 | | 36,490 |
Common Stocks - continued |
| Shares | | Value (000s) |
Japan - continued |
VT Holdings Co. Ltd. | 3,895,300 | | $ 24,089 |
Welcia Holdings Co. Ltd. | 964,000 | | 47,511 |
TOTAL JAPAN | | 1,746,827 |
Luxembourg - 0.8% |
Eurofins Scientific SA | 83,911 | | 30,381 |
Grand City Properties SA | 3,000,560 | | 59,920 |
TOTAL LUXEMBOURG | | 90,301 |
Marshall Islands - 0.1% |
Hoegh LNG Partners LP (e) | 715,655 | | 11,465 |
Netherlands - 4.0% |
AerCap Holdings NV (a) | 2,303,100 | | 95,579 |
Arcadis NV | 1,205,000 | | 30,411 |
IMCD Group BV | 1,938,100 | | 72,505 |
ING Groep NV (Certificaten Van Aandelen) | 4,566,600 | | 66,462 |
Unilever NV (Certificaten Van Aandelen) (Bearer) | 3,836,500 | | 173,477 |
TOTAL NETHERLANDS | | 438,434 |
New Zealand - 0.6% |
EBOS Group Ltd. | 3,173,554 | | 29,333 |
Ryman Healthcare Group Ltd. | 7,179,412 | | 38,358 |
TOTAL NEW ZEALAND | | 67,691 |
Philippines - 0.3% |
SM Investments Corp. | 1,651,390 | | 30,830 |
Portugal - 0.3% |
NOS SGPS SA | 3,466,500 | | 28,814 |
South Africa - 1.1% |
EOH Holdings Ltd. | 2,871,867 | | 31,751 |
Naspers Ltd. Class N | 593,000 | | 86,857 |
TOTAL SOUTH AFRICA | | 118,608 |
Spain - 2.5% |
Amadeus IT Holding SA Class A | 1,727,200 | | 73,617 |
Atresmedia Corporacion de Medios de Comunicacion SA | 2,218,100 | | 28,465 |
Hispania Activos Inmobiliarios SA (a) | 1,091,600 | | 16,445 |
Inditex SA | 2,302,339 | | 86,346 |
Mediaset Espana Comunicacion SA | 3,431,200 | | 41,712 |
Merlin Properties Socimi SA | 2,497,700 | | 32,025 |
TOTAL SPAIN | | 278,610 |
Common Stocks - continued |
| Shares | | Value (000s) |
Sweden - 3.1% |
ASSA ABLOY AB (B Shares) | 2,977,200 | | $ 59,226 |
Getinge AB (B Shares) | 2,702,600 | | 67,663 |
HEXPOL AB (B Shares) | 2,985,000 | | 29,069 |
Nordea Bank AB | 5,783,000 | | 63,966 |
Sandvik AB | 3,361,100 | | 31,433 |
Svenska Cellulosa AB (SCA) (B Shares) | 1,545,100 | | 45,509 |
Svenska Handelsbanken AB (A Shares) | 2,990,700 | | 40,618 |
TOTAL SWEDEN | | 337,484 |
Switzerland - 5.1% |
Credit Suisse Group AG (h)(k) | 3,643,900 | | 83,867 |
EFG International | 1,747,368 | | 17,554 |
GAM Holding Ltd. | 1,413,451 | | 25,882 |
Julius Baer Group Ltd. | 955,230 | | 47,363 |
Novartis AG | 2,126,476 | | 192,635 |
Partners Group Holding AG | 225,896 | | 81,816 |
Schindler Holding AG (participation certificate) | 182,339 | | 29,626 |
Syngenta AG (Switzerland) | 101,678 | | 34,161 |
UBS Group AG | 2,453,481 | | 49,097 |
TOTAL SWITZERLAND | | 562,001 |
Taiwan - 0.1% |
JHL Biotech, Inc. (a) | 4,995,560 | | 11,141 |
Turkey - 0.0% |
Logo Yazilim Sanayi Ve Ticar | 2 | | 0 |
United Kingdom - 19.1% |
AA PLC | 3,853,399 | | 16,449 |
Aberdeen Asset Management PLC | 4,206,932 | | 22,485 |
Al Noor Hospitals Group PLC | 2,335,318 | | 42,337 |
Associated British Foods PLC | 776,700 | | 41,369 |
Aviva PLC | 6,618,100 | | 49,461 |
B&M European Value Retail S.A. | 8,573,709 | | 44,066 |
Barclays PLC | 16,052,760 | | 57,192 |
BCA Marketplace PLC | 7,808,000 | | 21,275 |
BG Group PLC | 2,346,020 | | 37,064 |
BT Group PLC | 6,169,700 | | 44,061 |
BTG PLC (a) | 1,727,000 | | 14,696 |
Bunzl PLC | 2,087,500 | | 59,824 |
Compass Group PLC | 2,024,800 | | 34,808 |
Diploma PLC | 2,326,200 | | 23,005 |
Essentra PLC | 2,145,000 | | 27,843 |
Hikma Pharmaceuticals PLC | 2,598,333 | | 86,681 |
Common Stocks - continued |
| Shares | | Value (000s) |
United Kingdom - continued |
Howden Joinery Group PLC | 10,977,300 | | $ 78,453 |
HSBC Holdings PLC (United Kingdom) | 10,446,000 | | 81,614 |
Imperial Tobacco Group PLC | 2,092,292 | | 112,859 |
ITV PLC | 21,873,900 | | 85,111 |
JUST EAT Ltd. (a) | 595,900 | | 3,913 |
Liberty Global PLC Class A (a) | 665,500 | | 29,628 |
Lloyds Banking Group PLC | 69,588,800 | | 78,984 |
London Stock Exchange Group PLC | 2,190,936 | | 85,959 |
Melrose PLC | 10,942,678 | | 44,906 |
Micro Focus International PLC | 3,266,700 | | 63,251 |
Next PLC | 760,844 | | 93,833 |
Persimmon PLC | 1,478,400 | | 45,445 |
Poundland Group PLC | 6,866,990 | | 29,112 |
Reckitt Benckiser Group PLC | 759,700 | | 74,140 |
Rex Bionics PLC (a)(e) | 1,304,916 | | 976 |
Rio Tinto PLC | 1,353,600 | | 49,332 |
Royal Dutch Shell PLC Class A (United Kingdom) | 1,108,500 | | 28,940 |
SABMiller PLC | 723,500 | | 44,558 |
Schroders PLC | 598,200 | | 27,509 |
Shawbrook Group Ltd. | 9,004,300 | | 47,098 |
Spirax-Sarco Engineering PLC | 542,700 | | 25,442 |
St. James's Place Capital PLC | 5,426,000 | | 80,678 |
Taylor Wimpey PLC | 11,785,800 | | 35,975 |
The Restaurant Group PLC | 1,956,100 | | 21,621 |
Virgin Money Holdings Uk PLC | 5,909,100 | | 35,327 |
Vodafone Group PLC | 31,387,896 | | 103,296 |
Whitbread PLC | 700,994 | | 53,665 |
Workspace Group PLC | 652,800 | | 9,636 |
TOTAL UNITED KINGDOM | | 2,093,877 |
United States of America - 3.1% |
Chevron Corp. | 854,400 | | 77,648 |
Constellation Brands, Inc. Class A (sub. vtg.) | 626,700 | | 84,479 |
McGraw Hill Financial, Inc. | 686,300 | | 63,579 |
Monster Beverage Corp. (a) | 168,900 | | 23,024 |
Visa, Inc. Class A | 1,154,500 | | 89,566 |
TOTAL UNITED STATES OF AMERICA | | 338,296 |
TOTAL COMMON STOCKS (Cost $9,171,863) |
10,478,796
|
Nonconvertible Preferred Stocks - 0.2% |
| Shares | | Value (000s) |
Cayman Islands - 0.2% |
China Internet Plus Holdings Ltd. (k) | 5,958,244 | | $ 22,999 |
Germany - 0.0% |
Henkel AG & Co. KGaA | 476 | | 52 |
TOTAL NONCONVERTIBLE PREFERRED STOCKS (Cost $18,888) |
23,051
|
Government Obligations - 0.0% |
| Principal
Amount (000s) (j) | | |
United States of America - 0.0% |
U.S. Treasury Bills, yield at date of purchase 0.03% to 0.06% 12/3/15 to 12/17/15 (i)
(Cost $1,930) | | $ 1,930 | |
1,930
|
Preferred Securities - 0.1% |
|
Ireland - 0.1% |
Baggot Securities Ltd. 10.24% (f)(g)
(Cost $13,883) | EUR | 9,040 | |
10,747
|
Money Market Funds - 5.3% |
| Shares | | |
Fidelity Cash Central Fund, 0.18% (b) | 529,294,097 | | 529,294 |
Fidelity Securities Lending Cash Central Fund, 0.19% (b)(c) | 46,206,017 | | 46,206 |
TOTAL MONEY MARKET FUNDS (Cost $575,500) |
575,500
|
TOTAL INVESTMENT PORTFOLIO - 101.1% (Cost $9,782,064) | | 11,090,024 |
NET OTHER ASSETS (LIABILITIES) - (1.1)% | | (122,851) |
NET ASSETS - 100% | $ 10,967,173 |
Futures Contracts |
| Expiration Date | | Underlying Face Amount at Value (000s) | | Unrealized Appreciation/
(Depreciation)
(000s) |
Purchased |
Equity Index Contracts |
2,033 CME Nikkei 225 Index Contracts (United States) | Dec. 2015 | | $ 192,271 | | $ 9,203 |
The face value of futures purchased as a percentage of net assets is 1.8% |
For the period, the average monthly underlying face amount at value for futures contracts in the aggregate was $226,950,000. |
Currency Abbreviations |
EUR | - | European Monetary Unit |
Legend |
(a) Non-income producing |
(b) Affiliated fund that is generally available only to investment companies and other accounts managed by Fidelity Investments. The rate quoted is the annualized seven-day yield of the fund at period end. A complete unaudited listing of the fund's holdings as of its most recent quarter end is available upon request. In addition, each Fidelity Central Fund's financial statements, which are not covered by the Fund's Report of Independent Registered Public Accounting Firm, are available on the SEC's website or upon request. |
(c) Investment made with cash collateral received from securities on loan. |
(d) Security or a portion of the security is on loan at period end. |
(e) Affiliated company |
(f) Security exempt from registration under Rule 144A of the Securities Act of 1933. These securities may be resold in transactions exempt from registration, normally to qualified institutional buyers. At the end of the period, the value of these securities amounted to $10,747,000 or 0.1% of net assets. |
(g) Security is perpetual in nature with no stated maturity date. |
(h) Security or a portion of the security purchased on a delayed delivery or when-issued basis. |
(i) Security or a portion of the security was pledged to cover margin requirements for futures contracts. At period end, the value of securities pledged amounted to $1,930,000. |
(j) Amount is stated in United States dollars unless otherwise noted. |
(k) Restricted securities - Investment in securities not registered under the Securities Act of 1933 (excluding 144A issues). At the end of the period, the value of restricted securities (excluding 144A issues) amounted to $106,866,000 or 1.0% of net assets. |
Additional information on each restricted holding is as follows: |
Security | Acquisition Date | Acquisition Cost (000s) |
China Internet Plus Holdings Ltd. | 1/26/15 | $ 18,833 |
Credit Suisse Group AG | 10/21/15 | $ 86,402 |
Affiliated Central Funds |
Information regarding fiscal year to date income earned by the Fund from investments in Fidelity Central Funds is as follows: |
Fund | Income earned
(Amounts in thousands) |
Fidelity Cash Central Fund | $ 655 |
Fidelity Securities Lending Cash Central Fund | 3,281 |
Total | $ 3,936 |
Other Affiliated Issuers |
An affiliated company is a company in which the Fund has ownership of at least 5% of the voting securities. Fiscal year to date transactions with companies which are or were affiliates are as follows: |
Affiliate
(Amounts in thousands) | Value, beginning of period | Purchases | Sales Proceeds* | Dividend Income | Value,
end of
period |
Hoegh LNG Partners LP | $ 12,426 | $ 2,837 | $ 275 | $ 729 | $ 11,465 |
MySale Group PLC | 26,053 | - | 5,920 | - | - |
PAX Global Technology Ltd. | 71,203 | 795 | 36,965 | 112 | - |
Rex Bionics PLC | 3,518 | - | 24 | - | 976 |
Total | $ 113,200 | $ 3,632 | $ 43,184 | $ 841 | $ 12,441 |
* Includes the value of securities delivered through in-kind transactions, if applicable.
See accompanying notes which are an integral part of the financial statements.
Annual Report
Other Information |
Categorizations in the Schedule of Investments are based on country or territory of incorporation. |
The following is a summary of the inputs used, as of October 31, 2015, involving the Fund's assets and liabilities carried at fair value. The inputs or methodology used for valuing securities may not be an indication of the risk associated with investing in those securities. For more information on valuation inputs, and their aggregation into the levels used in the tables below, please refer to the Investment Valuation section in the accompanying Notes to Financial Statements. |
Valuation Inputs at Reporting Date: |
Description
(Amounts in thousands) | Total | Level 1 | Level 2 | Level 3 |
Investments in Securities: | | | | |
Equities: | | | | |
Consumer Discretionary | $ 1,898,277 | $ 1,361,738 | $ 513,540 | $ 22,999 |
Consumer Staples | 1,297,202 | 666,346 | 630,856 | - |
Energy | 467,483 | 180,488 | 286,995 | - |
Financials | 2,676,653 | 1,281,424 | 1,395,229 | - |
Health Care | 1,416,831 | 497,206 | 919,625 | - |
Industrials | 1,146,371 | 836,192 | 310,179 | - |
Information Technology | 830,123 | 605,993 | 224,130 | - |
Materials | 240,897 | 157,404 | 83,493 | - |
Telecommunication Services | 528,010 | 7,969 | 520,041 | - |
Government Obligations | 1,930 | - | 1,930 | - |
Preferred Securities | 10,747 | - | 10,747 | - |
Money Market Funds | 575,500 | 575,500 | - | - |
Total Investments in Securities: | $ 11,090,024 | $ 6,170,260 | $ 4,896,765 | $ 22,999 |
Derivative Instruments: | | | | |
Assets | | | | |
Futures Contracts | $ 9,203 | $ 9,203 | $ - | $ - |
The following is a summary of transfers between Level 1 and Level 2 for the period ended October 31, 2015. Transfers are assumed to have occurred at the beginning of the period, and are primarily attributable to the valuation techniques used for foreign equity securities, as discussed in the accompanying Notes to Financial Statements: |
Transfers | Total (000s) |
Level 1 to Level 2 | $ 381,182 |
Level 2 to Level 1 | $ 79,997 |
Value of Derivative Instruments |
The following table is a summary of the Fund's value of derivative instruments by primary risk exposure as of October 31, 2015. For additional information on derivative instruments, please refer to the Derivative Instruments section in the accompanying Notes to Financial Statements. |
Primary Risk Exposure /
Derivative Type | Value (000s) |
| Asset | Liability |
Equity Risk | | |
Futures Contracts (a) | $ 9,203 | $ - |
Total Value of Derivatives | $ 9,203 | $ - |
(a) Reflects gross cumulative appreciation (depreciation) on futures contracts as presented in the Schedule of Investments. Only the period end receivable or payable for daily variation margin and net unrealized appreciation (depreciation) are presented in the Statement of Assets and Liabilities. |
See accompanying notes which are an integral part of the financial statements.
Annual Report
Statement of Assets and Liabilities
Amounts in thousands (except per-share amounts) | | October 31, 2015 |
| | |
Assets | | |
Investment in securities, at value (including securities loaned of $44,670) - See accompanying schedule: Unaffiliated issuers (cost $9,188,061) | $ 10,502,083 | |
Fidelity Central Funds (cost $575,500) | 575,500 | |
Other affiliated issuers (cost $18,503) | 12,441 | |
Total Investments (cost $9,782,064) | | $ 11,090,024 |
Segregated cash with brokers for derivative instruments | | 9,348 |
Cash | | 172 |
Foreign currency held at value (cost $21,001) | | 21,001 |
Receivable for investments sold | | 28,370 |
Receivable for fund shares sold | | 12,338 |
Dividends receivable | | 24,068 |
Distributions receivable from Fidelity Central Funds | | 111 |
Prepaid expenses | | 30 |
Other receivables | | 3,575 |
Total assets | | 11,189,037 |
| | |
Liabilities | | |
Payable for investments purchased | | |
Regular delivery | $ 75,392 | |
Delayed delivery | 83,867 | |
Payable for fund shares redeemed | 5,982 | |
Accrued management fee | 7,145 | |
Distribution and service plan fees payable | 104 | |
Payable for daily variation margin for derivative instruments | 1,067 | |
Other affiliated payables | 1,508 | |
Other payables and accrued expenses | 593 | |
Collateral on securities loaned, at value | 46,206 | |
Total liabilities | | 221,864 |
| | |
Net Assets | | $ 10,967,173 |
Net Assets consist of: | | |
Paid in capital | | $ 9,614,122 |
Undistributed net investment income | | 108,769 |
Accumulated undistributed net realized gain (loss) on investments and foreign currency transactions | | (73,154) |
Net unrealized appreciation (depreciation) on investments and assets and liabilities in foreign currencies | | 1,317,436 |
Net Assets | | $ 10,967,173 |
See accompanying notes which are an integral part of the financial statements.
Annual Report
Statement of Assets and Liabilities - continued
Amounts in thousands (except per-share amounts) | | October 31, 2015 |
| | |
Calculation of Maximum Offering Price | | |
Class A:
Net Asset Value and redemption price per share ($282,714 ÷ 7,106.131 shares) | | $ 39.78 |
| | |
Maximum offering price per share (100/94.25 of $39.78) | | $ 42.21 |
Class T:
Net Asset Value and redemption price per share ($42,965 ÷ 1,087.491 shares) | | $ 39.51 |
| | |
Maximum offering price per share (100/96.50 of $39.51) | | $ 40.94 |
Class B:
Net Asset Value and offering price per share ($2,249 ÷ 57.378 shares)A | | $ 39.20 |
| | |
Class C:
Net Asset Value and offering price per share ($31,737 ÷ 810.917 shares)A | | $ 39.14 |
| | |
International Discovery:
Net Asset Value, offering price and redemption price per share ($7,208,744 ÷ 179,698.201 shares) | | $ 40.12 |
| | |
Class K:
Net Asset Value, offering price and redemption price per share ($2,307,850 ÷ 57,614.604 shares) | | $ 40.06 |
| | |
Class I:
Net Asset Value, offering price and redemption price per share ($1,060,821 ÷ 26,500.627 shares) | | $ 40.03 |
| | |
Class Z:
Net Asset Value, offering price and redemption price per share ($30,093 ÷ 751.671 shares) | | $ 40.03 |
A Redemption price per share is equal to net asset value less any applicable contingent deferred sales charge.
See accompanying notes which are an integral part of the financial statements.
Annual Report
Financial Statements - continued
Statement of Operations
Amounts in thousands | Year ended October 31, 2015 |
| | |
Investment Income | | |
Dividends (including $841 earned from other affiliated issuers) | | $ 237,713 |
Special dividends | | 34,094 |
Interest | | 101 |
Income from Fidelity Central Funds | | 3,936 |
Income before foreign taxes withheld | | 275,844 |
Less foreign taxes withheld | | (19,005) |
Total income | | 256,839 |
| | |
Expenses | | |
Management fee | | |
Basic fee | $ 74,535 | |
Performance adjustment | 11,730 | |
Transfer agent fees | 16,773 | |
Distribution and service plan fees | 1,337 | |
Accounting and security lending fees | 1,839 | |
Custodian fees and expenses | 1,612 | |
Independent trustees' compensation | 47 | |
Registration fees | 226 | |
Audit | 124 | |
Legal | 30 | |
Miscellaneous | 101 | |
Total expenses before reductions | 108,354 | |
Expense reductions | (1,353) | 107,001 |
Net investment income (loss) | | 149,838 |
Realized and Unrealized Gain (Loss) | | |
Net realized gain (loss) on: | | |
Investment securities: | | |
Unaffiliated issuers (net of foreign taxes of $606) | 220,061 | |
Other affiliated issuers | (3,654) | |
Foreign currency transactions | (3,878) | |
Futures contracts | 33,241 | |
Total net realized gain (loss) | | 245,770 |
Change in net unrealized appreciation (depreciation) on: Investment securities (net of decrease in deferred foreign taxes of $7,503) | 13,737 | |
Assets and liabilities in foreign currencies | 2,313 | |
Futures contracts | (15,395) | |
Total change in net unrealized appreciation (depreciation) | | 655 |
Net gain (loss) | | 246,425 |
Net increase (decrease) in net assets resulting from operations | | $ 396,263 |
See accompanying notes which are an integral part of the financial statements.
Annual Report
Statement of Changes in Net Assets
Amounts in thousands | Year ended
October 31,
2015 | Year ended
October 31,
2014 |
Increase (Decrease) in Net Assets | | |
Operations | | |
Net investment income (loss) | $ 149,838 | $ 199,098 |
Net realized gain (loss) | 245,770 | 758,004 |
Change in net unrealized appreciation (depreciation) | 655 | (958,756) |
Net increase (decrease) in net assets resulting from operations | 396,263 | (1,654) |
Distributions to shareholders from net investment income | (74,589) | (136,326) |
Distributions to shareholders from net realized gain | - | (88,586) |
Total distributions | (74,589) | (224,912) |
Share transactions - net increase (decrease) | (353,147) | (69,908) |
Redemption fees | 95 | 139 |
Total increase (decrease) in net assets | (31,378) | (296,335) |
| | |
Net Assets | | |
Beginning of period | 10,998,551 | 11,294,886 |
End of period (including undistributed net investment income of $108,769 and undistributed net investment income of $68,609, respectively) | $ 10,967,173 | $ 10,998,551 |
See accompanying notes which are an integral part of the financial statements.
Annual Report
Financial Highlights - Fidelity International Discovery Fund Class A
Years ended October 31, | 2015 | 2014 | 2013 | 2012 | 2011 |
Selected Per-Share Data | | | | | |
Net asset value, beginning of period | $ 38.70 | $ 39.49 | $ 31.66 | $ 29.43 | $ 32.07 |
Income from Investment Operations | | | | | |
Net investment income (loss) C | .40F | .53G | .34 | .41 | .42 |
Net realized and unrealized gain (loss) | .79 | (.67) | 7.97 | 2.11 | (2.52) |
Total from investment operations | 1.19 | (.14) | 8.31 | 2.52 | (2.10) |
Distributions from net investment income | (.11) | (.33) | (.45) | (.29) | (.38) |
Distributions from net realized gain | - | (.31) | (.03) | - | (.16) |
Total distributions | (.11) | (.65) K | (.48) | (.29) | (.54) |
Redemption fees added to paid in capitalC, I | - | - | - | - | - |
Net asset value, end of period | $ 39.78 | $ 38.70 | $ 39.49 | $ 31.66 | $ 29.43 |
Total ReturnA, B | 3.09% | (.36)% | 26.59% | 8.70% | (6.71)% |
Ratios to Average Net AssetsD, H | | | | |
Expenses before reductions | 1.33% | 1.28% | 1.35% | 1.34% | 1.30% |
Expenses net of fee waivers, if any | 1.33% | 1.28% | 1.35% | 1.34% | 1.29% |
Expenses net of all reductions | 1.32% | 1.28% | 1.33% | 1.31% | 1.25% |
Net investment income (loss) | 1.00%F | 1.35%G | .97% | 1.41% | 1.31% |
Supplemental Data | | | | | |
Net assets, end of period (in millions) | $ 283 | $ 297 | $ 347 | $ 299 | $ 320 |
Portfolio turnover rateE | 60%J | 57% | 65% | 68% | 75% |
A Total returns would have been lower if certain expenses had not been reduced during the applicable periods shown.
B Total returns do not include the effect of the sales charges.
C Calculated based on average shares outstanding during the period.
D Fees and expenses of any underlying Fidelity Central Funds are not included in the Fund's expense ratio. The Fund indirectly bears its proportionate share of the expenses of any underlying Fidelity Central Funds.
E Amount does not include the portfolio activity of any underlying Fidelity Central Funds.
F Investment income per share reflects a large, non-recurring dividend which amounted to $.12 per share. Excluding this non-recurring dividend, the ratio of net investment income (loss) to average net assets would have been .69%.
G Investment income per share reflects a large, non-recurring dividend which amounted to $.22 per share. Excluding this non-recurring dividend, the ratio of net investment income (loss) to average net assets would have been .80%.
H Expense ratios reflect operating expenses of the class. Expenses before reductions do not reflect amounts reimbursed by the investment adviser or reductions from brokerage service arrangements or reductions from other expense offset arrangements and do not represent the amount paid by the class during periods when reimbursements or reductions occur. Expenses net of fee waivers reflect expenses after reimbursement by the investment adviser but prior to reductions from brokerage service arrangements or other expense offset arrangements. Expenses net of all reductions represent the net expenses paid by the class.
I Amount represents less than $.005 per share.
J Portfolio turnover rate excludes securities received or delivered in-kind.
K Total distributions of $.65 per share is comprised of distributions from net investment income of $.334 and distributions from net realized gain of $.311 per share.
See accompanying notes which are an integral part of the financial statements.
Annual Report
Financial Highlights - Fidelity International Discovery Fund Class T
Years ended October 31, | 2015 | 2014 | 2013 | 2012 | 2011 |
Selected Per-Share Data | | | | | |
Net asset value, beginning of period | $ 38.43 | $ 39.23 | $ 31.42 | $ 29.18 | $ 31.81 |
Income from Investment Operations | | | | | |
Net investment income (loss) C | .30F | .44G | .26 | .34 | .34 |
Net realized and unrealized gain (loss) | .80 | (.68) | 7.92 | 2.09 | (2.51) |
Total from investment operations | 1.10 | (.24) | 8.18 | 2.43 | (2.17) |
Distributions from net investment income | (.02) | (.25) | (.34) | (.19) | (.30) |
Distributions from net realized gain | - | (.31) | (.03) | - | (.16) |
Total distributions | (.02) | (.56) | (.37) | (.19) | (.46) |
Redemption fees added to paid in capitalC, I | - | - | - | - | - |
Net asset value, end of period | $ 39.51 | $ 38.43 | $ 39.23 | $ 31.42 | $ 29.18 |
Total ReturnA, B | 2.86% | (.60)% | 26.31% | 8.41% | (6.96)% |
Ratios to Average Net AssetsD, H | | | | | |
Expenses before reductions | 1.57% | 1.51% | 1.59% | 1.59% | 1.56% |
Expenses net of fee waivers, if any | 1.57% | 1.51% | 1.59% | 1.59% | 1.55% |
Expenses net of all reductions | 1.56% | 1.51% | 1.57% | 1.56% | 1.51% |
Net investment income (loss) | .76%F | 1.11%G | .73% | 1.16% | 1.05% |
Supplemental Data | | | | | |
Net assets, end of period (in millions) | $ 43 | $ 49 | $ 53 | $ 46 | $ 61 |
Portfolio turnover rateE | 60%J | 57% | 65% | 68% | 75% |
A Total returns would have been lower if certain expenses had not been reduced during the applicable periods shown.
B Total returns do not include the effect of the sales charges.
C Calculated based on average shares outstanding during the period.
D Fees and expenses of any underlying Fidelity Central Funds are not included in the Fund's expense ratio. The Fund indirectly bears its proportionate share of the expenses of any underlying Fidelity Central Funds.
E Amount does not include the portfolio activity of any underlying Fidelity Central Funds.
F Investment income per share reflects a large, non-recurring dividend which amounted to $.12 per share. Excluding this non-recurring dividend, the ratio of net investment income (loss) to average net assets would have been .45%.
G Investment income per share reflects a large, non-recurring dividend which amounted to $.21 per share. Excluding this non-recurring dividend, the ratio of net investment income (loss) to average net assets would have been .56%.
H Expense ratios reflect operating expenses of the class. Expenses before reductions do not reflect amounts reimbursed by the investment adviser or reductions from brokerage service arrangements or reductions from other expense offset arrangements and do not represent the amount paid by the class during periods when reimbursements or reductions occur. Expenses net of fee waivers reflect expenses after reimbursement by the investment adviser but prior to reductions from brokerage service arrangements or other expense offset arrangements. Expenses net of all reductions represent the net expenses paid by the class.
I Amount represents less than $.005 per share.
J Portfolio turnover rate excludes securities received or delivered in-kind.
See accompanying notes which are an integral part of the financial statements.
Annual Report
Financial Highlights - Fidelity International Discovery Fund Class B
Years ended October 31, | 2015 | 2014 | 2013 | 2012 | 2011 |
Selected Per-Share Data | | | | | |
Net asset value, beginning of period | $ 38.32 | $ 39.08 | $ 31.28 | $ 29.02 | $ 31.60 |
Income from Investment Operations | | | | | |
Net investment income (loss) C | .08F | .22G | .08 | .19 | .17 |
Net realized and unrealized gain (loss) | .80 | (.66) | 7.90 | 2.09 | (2.48) |
Total from investment operations | .88 | (.44) | 7.98 | 2.28 | (2.31) |
Distributions from net investment income | - | (.01) | (.15) | (.02) | (.12) |
Distributions from net realized gain | - | (.31) | (.03) | - | (.16) |
Total distributions | - | (.32) | (.18) | (.02) | (.27) K |
Redemption fees added to paid in capitalC, I | - | - | - | - | - |
Net asset value, end of period | $ 39.20 | $ 38.32 | $ 39.08 | $ 31.28 | $ 29.02 |
Total ReturnA, B | 2.30% | (1.12)% | 25.64% | 7.85% | (7.39)% |
Ratios to Average Net AssetsD, H | | | | |
Expenses before reductions | 2.12% | 2.06% | 2.10% | 2.09% | 2.06% |
Expenses net of fee waivers, if any | 2.12% | 2.06% | 2.10% | 2.09% | 2.06% |
Expenses net of all reductions | 2.11% | 2.05% | 2.08% | 2.06% | 2.02% |
Net investment income (loss) | .21%F | .57%G | .22% | .66% | .54% |
Supplemental Data | | | | | |
Net assets, end of period (in millions) | $ 2 | $ 5 | $ 7 | $ 8 | $ 10 |
Portfolio turnover rateE | 60%J | 57% | 65% | 68% | 75% |
A Total returns would have been lower if certain expenses had not been reduced during the applicable periods shown.
B Total returns do not include the effect of the contingent deferred sales charge.
C Calculated based on average shares outstanding during the period.
D Fees and expenses of any underlying Fidelity Central Funds are not included in the Fund's expense ratio. The Fund indirectly bears its proportionate share of the expenses of any underlying Fidelity Central Funds.
E Amount does not include the portfolio activity of any underlying Fidelity Central Funds.
F Investment income per share reflects a large, non-recurring dividend which amounted to $.12 per share. Excluding this non-recurring dividend, the ratio of net investment income (loss) to average net assets would have been (.10)%.
G Investment income per share reflects a large, non-recurring dividend which amounted to $.21 per share. Excluding this non-recurring dividend, the ratio of net investment income (loss) to average net assets would have been .02%.
H Expense ratios reflect operating expenses of the class. Expenses before reductions do not reflect amounts reimbursed by the investment adviser or reductions from brokerage service arrangements or reductions from other expense offset arrangements and do not represent the amount paid by the class during periods when reimbursements or reductions occur. Expenses net of fee waivers reflect expenses after reimbursement by the investment adviser but prior to reductions from brokerage service arrangements or other expense offset arrangements. Expenses net of all reductions represent the net expenses paid by the class.
I Amount represents less than $.005 per share.
J Portfolio turnover rate excludes securities received or delivered in-kind.
K Total distributions of $.27 per share is comprised of distributions from net investment income of $.115 and distributions from net realized gain of $.155 per share.
See accompanying notes which are an integral part of the financial statements.
Annual Report
Financial Highlights - Fidelity International Discovery Fund Class C
Years ended October 31, | 2015 | 2014 | 2013 | 2012 | 2011 |
Selected Per-Share Data | | | | | |
Net asset value, beginning of period | $ 38.25 | $ 39.07 | $ 31.32 | $ 29.08 | $ 31.68 |
Income from Investment Operations | | | | | |
Net investment income (loss) C | .10F | .23G | .08 | .19 | .18 |
Net realized and unrealized gain (loss) | .79 | (.66) | 7.90 | 2.09 | (2.49) |
Total from investment operations | .89 | (.43) | 7.98 | 2.28 | (2.31) |
Distributions from net investment income | - | (.08) | (.20) | (.04) | (.14) |
Distributions from net realized gain | - | (.31) | (.03) | - | (.16) |
Total distributions | - | (.39) | (.23) | (.04) | (.29) K |
Redemption fees added to paid in capitalC, I | - | - | - | - | - |
Net asset value, end of period | $ 39.14 | $ 38.25 | $ 39.07 | $ 31.32 | $ 29.08 |
Total ReturnA, B | 2.33% | (1.10)% | 25.65% | 7.86% | (7.37)% |
Ratios to Average Net AssetsD, H | | | | | |
Expenses before reductions | 2.09% | 2.03% | 2.10% | 2.09% | 2.05% |
Expenses net of fee waivers, if any | 2.09% | 2.03% | 2.09% | 2.09% | 2.04% |
Expenses net of all reductions | 2.08% | 2.02% | 2.07% | 2.06% | 2.00% |
Net investment income (loss) | .24%F | .60%G | .23% | .66% | .56% |
Supplemental Data | | | | | |
Net assets, end of period (in millions) | $ 32 | $ 35 | $ 36 | $ 30 | $ 33 |
Portfolio turnover rateE | 60%J | 57% | 65% | 68% | 75% |
A Total returns would have been lower if certain expenses had not been reduced during the applicable periods shown.
B Total returns do not include the effect of the contingent deferred sales charge.
C Calculated based on average shares outstanding during the period.
D Fees and expenses of any underlying Fidelity Central Funds are not included in the Fund's expense ratio. The Fund indirectly bears its proportionate share of the expenses of any underlying Fidelity Central Funds.
E Amount does not include the portfolio activity of any underlying Fidelity Central Funds.
F Investment income per share reflects a large, non-recurring dividend which amounted to $.12 per share. Excluding this non-recurring dividend, the ratio of net investment income (loss) to average net assets would have been (.06)%.
G Investment income per share reflects a large, non-recurring dividend which amounted to $.21 per share. Excluding this non-recurring dividend, the ratio of net investment income (loss) to average net assets would have been .05%.
H Expense ratios reflect operating expenses of the class. Expenses before reductions do not reflect amounts reimbursed by the investment adviser or reductions from brokerage service arrangements or reductions from other expense offset arrangements and do not represent the amount paid by the class during periods when reimbursements or reductions occur. Expenses net of fee waivers reflect expenses after reimbursement by the investment adviser but prior to reductions from brokerage service arrangements or other expense offset arrangements. Expenses net of all reductions represent the net expenses paid by the class.
I Amount represents less than $.005 per share.
J Portfolio turnover rate excludes securities received or delivered in-kind.
K Total distributions of $.29 per share is comprised of distributions from net investment income of $.137 and distributions from net realized gain of $.155 per share.
See accompanying notes which are an integral part of the financial statements.
Annual Report
Financial Highlights - Fidelity International Discovery Fund
Years ended October 31, | 2015 | 2014 | 2013 | 2012 | 2011 |
Selected Per-Share Data | | | | | |
Net asset value, beginning of period | $ 39.03 | $ 39.82 | $ 31.91 | $ 29.69 | $ 32.34 |
Income from Investment Operations | | | | | |
Net investment income (loss) B | .54E | .67F | .47 | .51 | .53 |
Net realized and unrealized gain (loss) | .81 | (.68) | 8.02 | 2.12 | (2.54) |
Total from investment operations | 1.35 | (.01) | 8.49 | 2.63 | (2.01) |
Distributions from net investment income | (.26) | (.47) | (.55) | (.41) | (.48) |
Distributions from net realized gain | - | (.31) | (.03) | - | (.16) |
Total distributions | (.26) | (.78) | (.58) | (.41) | (.64) |
Redemption fees added to paid in capitalB, H | - | - | - | - | - |
Net asset value, end of period | $ 40.12 | $ 39.03 | $ 39.82 | $ 31.91 | $ 29.69 |
Total ReturnA | 3.47% | (.01)% | 27.03% | 9.03% | (6.39)% |
Ratios to Average Net AssetsC, G | | | | | |
Expenses before reductions | .99% | .93% | 1.00% | 1.01% | .97% |
Expenses net of fee waivers, if any | .99% | .93% | 1.00% | 1.01% | .96% |
Expenses net of all reductions | .98% | .93% | .98% | .98% | .92% |
Net investment income (loss) | 1.34%E | 1.69%F | 1.32% | 1.73% | 1.64% |
Supplemental Data | | | | | |
Net assets, end of period (in millions) | $ 7,209 | $ 7,464 | $ 7,800 | $ 5,965 | $ 6,806 |
Portfolio turnover rateD | 60%I | 57% | 65% | 68% | 75% |
A Total returns would have been lower if certain expenses had not been reduced during the applicable periods shown.
B Calculated based on average shares outstanding during the period.
C Fees and expenses of any underlying Fidelity Central Funds are not included in the Fund's expense ratio. The Fund indirectly bears its proportionate share of the expenses of any underlying Fidelity Central Funds.
D Amount does not include the portfolio activity of any underlying Fidelity Central Funds.
E Investment income per share reflects a large, non-recurring dividend which amounted to $.12 per share. Excluding this non-recurring dividend, the ratio of net investment income (loss) to average net assets would have been 1.03%.
F Investment income per share reflects a large, non-recurring dividend which amounted to $.22 per share. Excluding this non-recurring dividend, the ratio of net investment income (loss) to average net assets would have been 1.15%.
G Expense ratios reflect operating expenses of the class. Expenses before reductions do not reflect amounts reimbursed by the investment adviser or reductions from brokerage service arrangements or reductions from other expense offset arrangements and do not represent the amount paid by the class during periods when reimbursements or reductions occur. Expenses net of fee waivers reflect expenses after reimbursement by the investment adviser but prior to reductions from brokerage service arrangements or other expense offset arrangements. Expenses net of all reductions represent the net expenses paid by the class.
H Amount represents less than $.005 per share.
I Portfolio turnover rate excludes securities received or delivered in-kind.
See accompanying notes which are an integral part of the financial statements.
Annual Report
Financial Highlights - Fidelity International Discovery Fund Class K
Years ended October 31, | 2015 | 2014 | 2013 | 2012 | 2011 |
Selected Per-Share Data | | | | | |
Net asset value, beginning of period | $ 38.97 | $ 39.76 | $ 31.87 | $ 29.66 | $ 32.32 |
Income from Investment Operations | | | | | |
Net investment income (loss) B | .59E | .72F | .52 | .57 | .58 |
Net realized and unrealized gain (loss) | .81 | (.67) | 8.01 | 2.11 | (2.54) |
Total from investment operations | 1.40 | .05 | 8.53 | 2.68 | (1.96) |
Distributions from net investment income | (.31) | (.53) | (.61) | (.47) | (.55) |
Distributions from net realized gain | - | (.31) | (.03) | - | (.16) |
Total distributions | (.31) | (.84) | (.64) | (.47) | (.70) J |
Redemption fees added to paid in capitalB, H | - | - | - | - | - |
Net asset value, end of period | $ 40.06 | $ 38.97 | $ 39.76 | $ 31.87 | $ 29.66 |
Total ReturnA | 3.61% | .13% | 27.23% | 9.24% | (6.24)% |
Ratios to Average Net AssetsC, G | | | | |
Expenses before reductions | .86% | .80% | .85% | .83% | .80% |
Expenses net of fee waivers, if any | .86% | .80% | .85% | .83% | .79% |
Expenses net of all reductions | .85% | .79% | .83% | .80% | .75% |
Net investment income (loss) | 1.47%E | 1.83%F | 1.47% | 1.91% | 1.81% |
Supplemental Data | | | | | |
Net assets, end of period (in millions) | $ 2,308 | $ 2,464 | $ 2,576 | $ 1,776 | $ 1,245 |
Portfolio turnover rateD | 60%I | 57% | 65% | 68% | 75% |
A Total returns would have been lower if certain expenses had not been reduced during the applicable periods shown.
B Calculated based on average shares outstanding during the period.
C Fees and expenses of any underlying Fidelity Central Funds are not included in the Fund's expense ratio. The Fund indirectly bears its proportionate share of the expenses of any underlying Fidelity Central Funds.
D Amount does not include the portfolio activity of any underlying Fidelity Central Funds.
E Investment income per share reflects a large, non-recurring dividend which amounted to $.12 per share. Excluding this non-recurring dividend, the ratio of net investment income (loss) to average net assets would have been 1.16%.
F Investment income per share reflects a large, non-recurring dividend which amounted to $.22 per share. Excluding this non-recurring dividend, the ratio of net investment income (loss) to average net assets would have been 1.28%.
G Expense ratios reflect operating expenses of the class. Expenses before reductions do not reflect amounts reimbursed by the investment adviser or reductions from brokerage service arrangements or reductions from other expense offset arrangements and do not represent the amount paid by the class during periods when reimbursements or reductions occur. Expenses net of fee waivers reflect expenses after reimbursement by the investment adviser but prior to reductions from brokerage service arrangements or other expense offset arrangements. Expenses net of all reductions represent the net expenses paid by the class.
H Amount represents less than $.005 per share.
I Portfolio turnover rate excludes securities received or delivered in-kind.
J Total distributions of $.70 per share is comprised of distributions from net investment income of $.548 and distributions from net realized gain of $.155 per share.
See accompanying notes which are an integral part of the financial statements.
Annual Report
Financial Highlights - Fidelity International Discovery Fund Class I
Years ended October 31, | 2015 | 2014 | 2013 | 2012 | 2011 |
Selected Per-Share Data | | | | | |
Net asset value, beginning of period | $ 38.96 | $ 39.76 | $ 31.87 | $ 29.65 | $ 32.31 |
Income from Investment Operations | | | | | |
Net investment income (loss) B | .53E | .67F | .47 | .52 | .54 |
Net realized and unrealized gain (loss) | .80 | (.68) | 8.01 | 2.11 | (2.55) |
Total from investment operations | 1.33 | (.01) | 8.48 | 2.63 | (2.01) |
Distributions from net investment income | (.26) | (.48) | (.56) | (.41) | (.50) |
Distributions from net realized gain | - | (.31) | (.03) | - | (.16) |
Total distributions | (.26) | (.79) | (.59) | (.41) | (.65) J |
Redemption fees added to paid in capitalB, H | - | - | - | - | - |
Net asset value, end of period | $ 40.03 | $ 38.96 | $ 39.76 | $ 31.87 | $ 29.65 |
Total ReturnA | 3.44% | (.01)% | 27.03% | 9.07% | (6.39)% |
Ratios to Average Net AssetsC, G | | | | | |
Expenses before reductions | 1.00% | .93% | 1.00% | 1.00% | .95% |
Expenses net of fee waivers, if any | .99% | .93% | 1.00% | 1.00% | .94% |
Expenses net of all reductions | .98% | .93% | .97% | .97% | .90% |
Net investment income (loss) | 1.33%E | 1.69%F | 1.33% | 1.75% | 1.66% |
Supplemental Data | | | | | |
Net assets, end of period (in millions) | $ 1,061 | $ 650 | $ 476 | $ 294 | $ 278 |
Portfolio turnover rateD | 60%I | 57% | 65% | 68% | 75% |
A Total returns would have been lower if certain expenses had not been reduced during the applicable periods shown.
B Calculated based on average shares outstanding during the period.
C Fees and expenses of any underlying Fidelity Central Funds are not included in the Fund's expense ratio. The Fund indirectly bears its proportionate share of the expenses of any underlying Fidelity Central Funds.
D Amount does not include the portfolio activity of any underlying Fidelity Central Funds.
E Investment income per share reflects a large, non-recurring dividend which amounted to $.12 per share. Excluding this non-recurring dividend, the ratio of net investment income (loss) to average net assets would have been 1.03%.
F Investment income per share reflects a large, non-recurring dividend which amounted to $.22 per share. Excluding this non-recurring dividend, the ratio of net investment income (loss) to average net assets would have been 1.14%.
G Expense ratios reflect operating expenses of the class. Expenses before reductions do not reflect amounts reimbursed by the investment adviser or reductions from brokerage service arrangements or reductions from other expense offset arrangements and do not represent the amount paid by the class during periods when reimbursements or reductions occur. Expenses net of fee waivers reflect expenses after reimbursement by the investment adviser but prior to reductions from brokerage service arrangements or other expense offset arrangements. Expenses net of all reductions represent the net expenses paid by the class.
H Amount represents less than $.005 per share.
I Portfolio turnover rate excludes securities received or delivered in-kind.
J Total distributions of $.65 per share is comprised of distributions from net investment income of $.497 and distributions from net realized gain of $.155 per share.
See accompanying notes which are an integral part of the financial statements.
Annual Report
Financial Highlights - Fidelity International Discovery Fund Class Z
Years ended October 31, | 2015 | 2014 | 2013 I |
Selected Per-Share Data | | | |
Net asset value, beginning of period | $ 38.96 | $ 39.77 | $ 37.22 |
Income from Investment Operations | | | |
Net investment income (loss)D | .59G | .72H | .07 |
Net realized and unrealized gain (loss) | .80 | (.68) | 2.48 |
Total from investment operations | 1.39 | .04 | 2.55 |
Distributions from net investment income | (.32) | (.54) | - |
Distributions from net realized gain | - | (.31) | - |
Total distributions | (.32) | (.85) | - |
Redemption fees added to paid in capitalD, K | - | - | - |
Net asset value, end of period | $ 40.03 | $ 38.96 | $ 39.77 |
Total ReturnB, C | 3.58% | .12% | 6.85% |
Ratios to Average Net AssetsE, J | | | |
Expenses before reductions | .86% | .80% | .85%A |
Expenses net of fee waivers, if any | .86% | .80% | .85%A |
Expenses net of all reductions | .85% | .79% | .83%A |
Net investment income (loss) | 1.47%G | 1.83%H | .76%A |
Supplemental Data | | | |
Net assets, end of period (000 omitted) | $ 30,093 | $ 35,125 | $ 107 |
Portfolio turnover rateF | 60%L | 57% | 65% |
A Annualized
B Total returns for periods of less than one year are not annualized.
C Total returns would have been lower if certain expenses had not been reduced during the applicable periods shown.
D Calculated based on average shares outstanding during the period.
E Fees and expenses of any underlying Fidelity Central Funds are not included in the Fund's expense ratio. The Fund indirectly bears its proportionate share of the expenses of any underlying Fidelity Central Funds.
F Amount does not include the portfolio activity of any underlying Fidelity Central Funds.
G Investment income per share reflects a large, non-recurring dividend which amounted to $.12 per share. Excluding this non-recurring dividend, the ratio of net investment income (loss) to average net assets would have been 1.16%.
H Investment income per share reflects a large, non-recurring dividend which amounted to $.21 per share. Excluding this non-recurring dividend, the ratio of net investment income (loss) to average net assets would have been 1.28%.
I For the period August 13, 2013 (commencement of sale of shares) to October 31, 2013.
J Expense ratios reflect operating expenses of the class. Expenses before reductions do not reflect amounts reimbursed by the investment adviser or reductions from brokerage service arrangements or reductions from other expense offset arrangements and do not represent the amount paid by the class during periods when reimbursements or reductions occur. Expense ratios before reductions for start-up periods may not be representative of larger-term operating periods. Expenses net of fee waivers reflect expenses after reimbursement by the investment adviser but prior to reductions from brokerage service arrangements or other expense offset arrangements. Expenses net of all reductions represent the net expenses paid by the class.
K Amount represents less than $.005 per share.
L Portfolio turnover rate excludes securities received or delivered in-kind.
See accompanying notes which are an integral part of the financial statements.
Annual Report
For the period ended October 31, 2015
(Amounts in thousands except percentages)
1. Organization.
Fidelity International Discovery Fund (the Fund) is a fund of Fidelity Investment Trust (the Trust) and is authorized to issue an unlimited number of shares. The Trust is registered under the Investment Company Act of 1940, as amended (the 1940 Act), as an open-end management investment company organized as a Massachusetts business trust. The Fund offers Class A, Class T, Class C, International Discovery, Class K, Class I (formerly Institutional Class) and Class Z shares, each of which, along with Class B shares, has equal rights as to assets and voting privileges. Class B shares are closed to new accounts and additional purchases, except for exchanges and reinvestments. Each class has exclusive voting rights with respect to matters that affect that class. Class B shares will automatically convert to Class A shares after a holding period of seven years from the initial date of purchase.
2. Investments in Fidelity Central Funds.
The Fund invests in Fidelity Central Funds, which are open-end investment companies generally available only to other investment companies and accounts managed by the investment adviser and its affiliates. The Fund's Schedule of Investments lists each of the Fidelity Central Funds held as of period end, if any, as an investment of the Fund, but does not include the underlying holdings of each Fidelity Central Fund. As an Investing Fund, the Fund indirectly bears its proportionate share of the expenses of the underlying Fidelity Central Funds.
The Money Market Central Funds seek preservation of capital and current income and are managed by Fidelity Investments Money Management, Inc. (FIMM), an affiliate of the investment adviser. Annualized expenses of the Money Market Central Funds as of their most recent shareholder report date are less than .005%.
A complete unaudited list of holdings for each Fidelity Central Fund is available upon request or at the Securities and Exchange Commission (the SEC) website at www.sec.gov. In addition, the financial statements of the Fidelity Central Funds, which are not covered by the Fund's Report of Independent Registered Public Accounting Firm, are available on the SEC website or upon request.
3. Significant Accounting Policies.
The financial statements have been prepared in conformity with accounting principles generally accepted in the United States of America (GAAP), which require management to make certain estimates and assumptions at the date of the financial statements. Actual results could differ from those estimates. Subsequent events, if any, through the date that the financial statements were issued have been evaluated in the preparation of
Annual Report
Notes to Financial Statements - continued
(Amounts in thousands except percentages)
3. Significant Accounting Policies - continued
the financial statements. The following summarizes the significant accounting policies of the Fund:
Investment Valuation. Investments are valued as of 4:00 p.m. Eastern time on the last calendar day of the period. The Board of Trustees (the Board) has delegated the day to day responsibility for the valuation of the Fund's investments to the Fidelity Management & Research Company (FMR) Fair Value Committee (the Committee). In accordance with valuation policies and procedures approved by the Board, the Fund attempts to obtain prices from one or more third party pricing vendors or brokers to value its investments. When current market prices, quotations or currency exchange rates are not readily available or reliable, investments will be fair valued in good faith by the Committee, in accordance with procedures adopted by the Board. Factors used in determining fair value vary by investment type and may include market or investment specific events, changes in interest rates and credit quality. The frequency with which these procedures are used cannot be predicted and they may be utilized to a significant extent. The Committee oversees the Fund's valuation policies and procedures and reports to the Board on the Committee's activities and fair value determinations. The Board monitors the appropriateness of the procedures used in valuing the Fund's investments and ratifies the fair value determinations of the Committee.
The Fund categorizes the inputs to valuation techniques used to value its investments into a disclosure hierarchy consisting of three levels as shown below:
Level 1 - quoted prices in active markets for identical investments
Level 2 - other significant observable inputs (including quoted prices for similar investments, interest rates, prepayment speeds, etc.)
Level 3 - unobservable inputs (including the Fund's own assumptions based on the best information available)
Valuation techniques used to value the Fund's investments by major category are as follows:
Equity securities, including restricted securities, for which market quotations are readily available, are valued at the last reported sale price or official closing price as reported by a third party pricing vendor on the primary market or exchange on which they are traded and are categorized as Level 1 in the hierarchy. In the event there were no sales during the day or closing prices are not available, securities are valued at the last quoted bid price or may be valued using the last available price and are generally categorized as Level 2 in the hierarchy. For foreign equity securities, when market or security specific events arise, comparisons to the valuation of American Depositary Receipts (ADRs), futures contracts, Exchange-Traded Funds (ETFs) and certain indexes as well as quoted
Annual Report
3. Significant Accounting Policies - continued
Investment Valuation - continued
prices for similar securities may be used and would be categorized as Level 2 in the hierarchy. Utilizing these techniques may result in transfers between Level 1 and Level 2. For equity securities, including restricted securities, where observable inputs are limited, assumptions about market activity and risk are used and these securities may be categorized as Level 3 in the hierarchy.
Debt securities, including restricted securities, are valued based on evaluated prices received from third party pricing vendors or from brokers who make markets in such securities. Preferred securities and U.S. government and government agency obligations are valued by pricing vendors who utilize matrix pricing which considers yield or price of bonds of comparable quality, coupon, maturity and type or by broker-supplied prices. When independent prices are unavailable or unreliable, debt securities may be valued utilizing pricing methodologies which consider similar factors that would be used by third party pricing vendors. Debt securities are generally categorized as Level 2 in the hierarchy but may be Level 3 depending on the circumstances.
Futures contracts are valued at the settlement price established each day by the board of trade or exchange on which they are traded and are categorized as Level 1 in the hierarchy. Investments in open-end mutual funds, including the Fidelity Central Funds, are valued at their closing net asset value (NAV) each business day and are categorized as Level 1 in the hierarchy.
Changes in valuation techniques may result in transfers in or out of an assigned level within the disclosure hierarchy. The aggregate value of investments by input level as of October 31, 2015, including information on transfers between Levels 1 and 2 is included at the end of the Fund's Schedule of Investments.
Foreign Currency. The Fund may use foreign currency contracts to facilitate transactions in foreign-denominated securities. Gains and losses from these transactions may arise from changes in the value of the foreign currency or if the counterparties do not perform under the contracts' terms.
Foreign-denominated assets, including investment securities, and liabilities are translated into U.S. dollars at the exchange rates at period end. Purchases and sales of investment securities, income and dividends received and expenses denominated in foreign currencies are translated into U.S. dollars at the exchange rate in effect on the transaction date.
The effects of exchange rate fluctuations on investments are included with the net realized and unrealized gain (loss) on investment securities. Other foreign currency transactions resulting in realized and unrealized gain (loss) are disclosed separately.
Annual Report
Notes to Financial Statements - continued
(Amounts in thousands except percentages)
3. Significant Accounting Policies - continued
Investment Transactions and Income. For financial reporting purposes, the Fund's investment holdings and NAV include trades executed through the end of the last business day of the period. The NAV per share for processing shareholder transactions is calculated as of the close of business of the New York Stock Exchange (NYSE), normally 4:00 p.m. Eastern time and includes trades executed through the end of the prior business day. Gains and losses on securities sold are determined on the basis of identified cost and may include proceeds received from litigation. Dividend income is recorded on the ex-dividend date, except for certain dividends from foreign securities where the ex-dividend date may have passed, which are recorded as soon as the Fund is informed of the ex-dividend date. Non-cash dividends included in dividend income, if any, are recorded at the fair market value of the securities received. Income and capital gain distributions from Fidelity Central Funds, if any, are recorded on the ex-dividend date. Distributions received on securities that represent a return of capital or capital gain are recorded as a reduction of cost of investments and/or as a realized gain. Subsequent to ex-dividend date the Fund determines the components of these distributions, based upon receipt of tax filings or other correspondence relating to the underlying investment. Large, non-recurring dividends recognized by the Fund are presented separately on the Statement of Operations as "Special Dividends" and the impact of these dividends is presented in the Financial Highlights. Interest income is accrued as earned and includes coupon interest and amortization of premium and accretion of discount on debt securities as applicable. Investment income is recorded net of foreign taxes withheld where recovery of such taxes is uncertain.
Class Allocations and Expenses. Investment income, realized and unrealized capital gains and losses, common expenses of the Fund, and certain fund-level expense reductions, if any, are allocated daily on a pro-rata basis to each class based on the relative net assets of each class to the total net assets of the Fund. Each class differs with respect to transfer agent and distribution and service plan fees incurred. Certain expense reductions may also differ by class. For the reporting period, the allocated portion of income and expenses to each class as a percent of its average net assets may vary due to the timing of recording these transactions in relation to fluctuating net assets of the classes. Expenses directly attributable to a fund are charged to that fund. Expenses attributable to more than one fund are allocated among the respective funds on the basis of relative net assets or other appropriate methods. Expense estimates are accrued in the period to which they relate and adjustments are made when actual amounts are known.
Deferred Trustee Compensation. Under a Deferred Compensation Plan (the Plan), independent Trustees may elect to defer receipt of a portion of their annual compensation. Deferred amounts are invested in a cross-section of Fidelity funds, are marked-to-market and remain in the Fund until distributed in accordance with the Plan. The
Annual Report
3. Significant Accounting Policies - continued
Deferred Trustee Compensation - continued
investment of deferred amounts and the offsetting payable to the Trustees are included in the accompanying Statement of Assets and Liabilities.
Income Tax Information and Distributions to Shareholders. Each year, the Fund intends to qualify as a regulated investment company under Subchapter M of the Internal Revenue Code, including distributing substantially all of its taxable income and realized gains. As a result, no provision for U.S. Federal income taxes is required. As of October 31, 2015, the Fund did not have any unrecognized tax benefits in the financial statements; nor is the Fund aware of any tax positions for which it is reasonably possible that the total amounts of unrecognized tax benefits will significantly change in the next twelve months. The Fund files a U.S. federal tax return, in addition to state and local tax returns as required. The Fund's federal income tax returns are subject to examination by the Internal Revenue Service (IRS) for a period of three fiscal years after they are filed. State and local tax returns may be subject to examination for an additional fiscal year depending on the jurisdiction. Foreign taxes are provided for based on the Fund's understanding of the tax rules and rates that exist in the foreign markets in which it invests. The Fund is subject to a tax imposed on capital gains by certain countries in which it invests.
Distributions are declared and recorded on the ex-dividend date. Income dividends and capital gain distributions are declared separately for each class. Income and capital gain distributions are determined in accordance with income tax regulations, which may differ from GAAP. In addition, the Fund claimed a portion of the payment made to redeeming shareholders as a distribution for income tax purposes.
Capital accounts within the financial statements are adjusted for permanent book-tax differences. These adjustments have no impact on net assets or the results of operations. Capital accounts are not adjusted for temporary book-tax differences which will reverse in a subsequent period.
Book-tax differences are primarily due to futures contracts, foreign currency transactions, passive foreign investment companies (PFIC), market discount, certain foreign taxes, redemptions in-kind, deferred trustees compensation, capital loss carryforwards and losses deferred due to wash sales.
The federal tax cost of investment securities and unrealized appreciation (depreciation) as of period end were as follows:
Gross unrealized appreciation | $ 1,751,994 |
Gross unrealized depreciation | (459,470) |
Net unrealized appreciation (depreciation) on securities | $ 1,292,524 |
Tax Cost | $ 9,797,500 |
Annual Report
Notes to Financial Statements - continued
(Amounts in thousands except percentages)
3. Significant Accounting Policies - continued
Income Tax Information and Distributions to Shareholders - continued
The tax-based components of distributable earnings as of period end were as follows:
Undistributed ordinary income | $ 109,669 |
Capital loss carryforward | $ (49,248) |
Net unrealized appreciation (depreciation) on securities and other investments | $ 1,292,925 |
Capital loss carryforwards are only available to offset future capital gains of the Fund to the extent provided by regulations and may be limited. Under the Regulated Investment Company Modernization Act of 2010 (the Act), the Fund is permitted to carry forward capital losses incurred in taxable years beginning after December 22, 2010 for an unlimited period and such capital losses are required to be used prior to any losses that expire. The capital loss carryforward information presented below, including any applicable limitation, is estimated as of fiscal period end and is subject to adjustment.
Fiscal year of expiration | |
2017 | $ (49,248) |
The tax character of distributions paid was as follows:
| October 31, 2015 | October 31, 2014 |
Ordinary Income | $ 74,589 | $ 224,912 |
Short-Term Trading (Redemption) Fees. Shares held by investors in the Fund less than 30 days may have been subject to a redemption fee equal to 1.00% of the NAV of shares redeemed. All redemption fees, which reduce the proceeds of the shareholder redemption, are retained by the Fund and accounted for as an addition to paid in capital.
Delayed Delivery Transactions and When-Issued Securities. During the period, the Fund transacted in securities on a delayed delivery or when-issued basis. Payment and delivery may take place after the customary settlement period for that security. The price of the underlying securities and the date when the securities will be delivered and paid for are fixed at the time the transaction is negotiated. The securities purchased on a delayed delivery or when-issued basis are identified as such in the Fund's Schedule of Investments. The Fund may receive compensation for interest forgone in the purchase of a delayed delivery or when-issued security. With respect to purchase commitments, the Fund identifies securities as segregated in its records with a value at least equal to the amount of the commitment. Losses may arise due to changes in the value of the underlying securities or if the counterparty does not perform under the contract's terms, or if the issuer does not issue the securities due to political, economic, or other factors.
Annual Report
3. Significant Accounting Policies - continued
Restricted Securities. The Fund may invest in securities that are subject to legal or contractual restrictions on resale. These securities generally may be resold in transactions exempt from registration or to the public if the securities are registered. Disposal of these securities may involve time-consuming negotiations and expense, and prompt sale at an acceptable price may be difficult. Information regarding restricted securities is included at the end of the Fund's Schedule of Investments.
4. Derivative Instruments.
Risk Exposures and the Use of Derivative Instruments. The Fund's investment objective allows the Fund to enter into various types of derivative contracts, including futures contracts. Derivatives are investments whose value is primarily derived from underlying assets, indices or reference rates and may be transacted on an exchange or over-the-counter (OTC). Derivatives may involve a future commitment to buy or sell a specified asset based on specified terms, to exchange future cash flows at periodic intervals based on a notional principal amount, or for one party to make one or more payments upon the occurrence of specified events in exchange for periodic payments from the other party.
The Fund used derivatives to increase returns and to manage exposure to certain risks as defined below. The success of any strategy involving derivatives depends on analysis of numerous economic factors, and if the strategies for investment do not work as intended, the Fund may not achieve its objectives.
The Fund's use of derivatives increased or decreased its exposure to the following risk:
Equity Risk | Equity risk relates to the fluctuations in the value of financial instruments as a result of changes in market prices (other than those arising from interest rate risk or foreign exchange risk), whether caused by factors specific to an individual investment, its issuer, or all factors affecting all instruments traded in a market or market segment. |
The Fund is also exposed to additional risks from investing in derivatives, such as liquidity risk and counterparty credit risk. Liquidity risk is the risk that the Fund will be unable to close out the derivative in the open market in a timely manner. Counterparty credit risk is the risk that the counterparty will not be able to fulfill its obligation to the Fund. Counterparty credit risk related to exchange-traded futures contracts may be mitigated by the protection provided by the exchange on which they trade.
Investing in derivatives may involve greater risks than investing in the underlying assets directly and, to varying degrees, may involve risk of loss in excess of any initial investment and collateral received and amounts recognized in the Statement of Assets and Liabilities. In addition, there may be the risk that the change in value of the derivative contract does not correspond to the change in value of the underlying instrument.
Annual Report
Notes to Financial Statements - continued
(Amounts in thousands except percentages)
4. Derivative Instruments - continued
Futures Contracts. A futures contract is an agreement between two parties to buy or sell a specified underlying instrument for a fixed price at a specified future date. The Fund used futures contracts to manage its exposure to the stock market.
Upon entering into a futures contract, a fund is required to deposit either cash or securities (initial margin) with a clearing broker in an amount equal to a certain percentage of the face value of the contract. Futures contracts are marked-to-market daily and subsequent daily payments (variation margin) are made or received by a fund depending on the daily fluctuations in the value of the futures contracts and are recorded as unrealized appreciation or (depreciation). This receivable and/or payable, if any, is included in daily variation margin for derivative instruments in the Statement of Assets and Liabilities. Realized gain or (loss) is recorded upon the expiration or closing of a futures contract.
Any open futures contracts at period end are presented in the Schedule of Investments under the caption "Futures Contracts." The underlying face amount at value reflects each contract's exposure to the underlying instrument or index at period end. Securities deposited to meet initial margin requirements are identified in the Schedule of Investments. Cash deposited to meet initial margin requirements is presented as segregated cash with brokers for derivative instruments in the Statement of Assets and Liabilities.
During the period the Fund recognized net realized gain (loss) of $33,241 and a change in net unrealized appreciation (depreciation) of $(15,395) related to its investment in futures contracts. These amounts are included in the Statement of Operations.
5. Purchases and Sales of Investments.
Purchases and sales of securities, other than short-term securities and in-kind transactions, aggregated $6,392,387 and $6,317,742, respectively.
Redemptions In-Kind. During the period, 4,932 shares of the Fund held by unaffiliated entities were redeemed for cash and investments, including accrued interest with a value of $197,848. The net realized gain of $41,387 on investments delivered through in-kind redemptions is included in the accompanying Statement of Operations. The amount of in-kind redemptions is included in share transactions in the accompanying Statement of Changes in Net Assets as well as Note 11: Share Transactions. The Fund recognized no gain or loss for federal income tax purposes.
6. Fees and Other Transactions with Affiliates.
Management Fee. Fidelity Management & Research Company (the investment adviser) and its affiliates provide the Fund with investment management related services for which the Fund pays a monthly management fee. The management fee is the
Annual Report
6. Fees and Other Transactions with Affiliates - continued
Management Fee - continued
sum of an individual fund fee rate that is based on an annual rate of .424% of the Fund's average net assets and an annualized group fee rate that averaged .25% during the period. The group fee rate is based upon the average net assets of all the mutual funds advised by the investment adviser, including any mutual funds previously advised by the investment adviser that are currently advised by Fidelity SelectCo, LLC, an affiliate of the investment adviser. The group fee rate decreases as assets under management increase and increases as assets under management decrease. In addition, the management fee is subject to a performance adjustment (up to a maximum of ± .20% of the Fund's average net assets over a 36 month performance period). The upward or downward adjustment to the management fee is based on the relative investment performance of International Discovery as compared to its benchmark index, the MSCI EAFE Index, over the same 36 month performance period. For the reporting period, the total annual management fee rate, including the performance adjustment, was .78% of the Fund's average net assets. The performance adjustment included in the management fee rate may be higher or lower than the maximum performance adjustment rate due to the difference between the average net assets for the reporting and performance periods.
Distribution and Service Plan Fees. In accordance with Rule 12b-1 of the 1940 Act, the Fund has adopted separate Distribution and Service Plans for each class of shares. Certain classes pay Fidelity Distributors Corporation (FDC), an affiliate of the investment adviser, separate Distribution and Service Fees, each of which is based on an annual percentage of each class' average net assets. In addition, FDC may pay financial intermediaries for selling shares of the Fund and providing shareholder support services.
For the period, the Distribution and Service Fee rates, total fees and amounts retained by FDC were as follows:
| Distribution
Fee | Service
Fee | Total Fees | Retained
by FDC |
Class A | -% | .25% | $ 731 | $ 4 |
Class T | .25% | .25% | 229 | 1 |
Class B | .75% | .25% | 34 | 25 |
Class C | .75% | .25% | 343 | 37 |
| | | $ 1,337 | $ 67 |
Sales Load. FDC may receive a front-end sales charge of up to 5.75% for selling Class A shares and 3.50% for selling Class T shares, some of which is paid to financial intermediaries for selling shares of the Fund. Depending on the holding period, FDC may receive contingent deferred sales charges levied on Class A, Class T, Class B, and Class C redemptions. The deferred sales charges range from 5.00% to 1.00% for Class B shares, 1.00% for Class C shares, 1.00% for certain purchases of Class A shares and .25% for certain purchases of Class T shares.
Annual Report
Notes to Financial Statements - continued
(Amounts in thousands except percentages)
6. Fees and Other Transactions with Affiliates - continued
Sales Load - continued
For the period, sales charge amounts retained by FDC were as follows:
| Retained
by FDC |
Class A | $ 62 |
Class T | 7 |
Class B A | 1 |
Class C A | 3 |
| $ 73 |
A When Class B and Class C shares are initially sold, FDC pays commissions from its own resources to financial intermediaries through which the sales are made.
Transfer Agent Fees. Fidelity Investments Institutional Operations Company, Inc., (FIIOC), an affiliate of the investment adviser, is the transfer, dividend disbursing and shareholder servicing agent for each class of the Fund. FIIOC receives account fees and asset-based fees that vary according to the account size and type of account of the shareholders of the respective classes of the Fund, except for Class K and Class Z. FIIOC receives an asset-based fee of Class K's and Class Z's average net assets. FIIOC pays for typesetting, printing and mailing of shareholder reports, except proxy statements.
For the period, transfer agent fees for each class were as follows:
| Amount | % of
Class-Level Average
Net Assets |
Class A | $ 788 | .27 |
Class T | 117 | .26 |
Class B | 10 | .30 |
Class C | 93 | .27 |
International Discovery | 13,037 | .18 |
Class K | 1,135 | .05 |
Class I | 1,576 | .18 |
Class Z | 17 | .05 |
| $ 16,773 | |
Accounting and Security Lending Fees. Fidelity Service Company, Inc. (FSC), an affiliate of the investment adviser, maintains the Fund's accounting records. The accounting fee is based on the level of average net assets for each month. Under a separate contract, FSC administers the security lending program. The security lending fee is based on the number and duration of lending transactions.
Annual Report
6. Fees and Other Transactions with Affiliates - continued
Brokerage Commissions. The Fund placed a portion of its portfolio transactions with brokerage firms which are affiliates of the investment adviser. Brokerage commissions are included in net realized gain (loss) and change in net unrealized appreciation (depreciation) in the Statement of Operations. The commissions paid to these affiliated firms were $6 for the period.
Other. During the period, the investment adviser reimbursed the Fund for certain losses in the amount of $46
7. Committed Line of Credit.
The Fund participates with other funds managed by the investment adviser or an affiliate in a $4.25 billion credit facility (the "line of credit") to be utilized for temporary or emergency purposes to fund shareholder redemptions or for other short-term liquidity purposes. The Fund has agreed to pay commitment fees on its pro-rata portion of the line of credit, which amounted to $16 and is reflected in Miscellaneous expenses on the Statement of Operations. During the period, the Fund did not borrow on this line of credit.
8. Security Lending.
The Fund lends portfolio securities through a lending agent from time to time in order to earn additional income. For equity securities, a lending agent is used and may loan securities to certain qualified borrowers, including Fidelity Capital Markets (FCM), a broker-dealer affiliated with the Fund. On the settlement date of the loan, the Fund receives collateral (in the form of U.S. Treasury obligations, letters of credit and/or cash) against the loaned securities and maintains collateral in an amount not less than 100% of the market value of the loaned securities during the period of the loan. The market value of the loaned securities is determined at the close of business of the Fund and any additional required collateral is delivered to the Fund on the next business day. The Fund or borrower may terminate the loan at any time, and if the borrower defaults on its obligation to return the securities loaned because of insolvency or other reasons, the Fund may apply collateral received from the borrower against the obligation. The Fund may experience delays and costs in recovering the securities loaned. Any cash collateral received is invested in the Fidelity Securities Lending Cash Central Fund. The value of loaned securities and cash collateral at period end are disclosed on the Fund's Statement of Assets and Liabilities. Security lending income represents the income earned on investing cash collateral, less rebates paid to borrowers and any lending agent fees associated with the loan, plus any premium payments received for lending certain types of securities. Security lending income is presented in the Statement of Operations as a component of income from Fidelity Central Funds. Total security lending income during the period amounted to $3,281. During the period, there were no securities loaned to FCM.
Annual Report
Notes to Financial Statements - continued
(Amounts in thousands except percentages)
9. Expense Reductions.
Commissions paid to certain brokers with whom the investment adviser, or its affiliates, places trades on behalf of the Fund include an amount in addition to trade execution, which may be rebated back to the Fund to offset certain expenses. This amount totaled $1,110 for the period.
In addition, during the period the investment adviser reimbursed and/or waived a portion of fund-level operating expenses in the amount of $45 and a portion of class-level operating expenses as follows:
| Amount |
Class A | $ 6 |
Class T | 1 |
Class B | -* |
Class C | 1 |
International Discovery | 177 |
Class I | 13 |
| $ 198 |
* In the amount of less than five hundred dollars.
10. Distributions to Shareholders.
Distributions to shareholders of each class were as follows:
Years ended October 31, | 2015 | 2014 |
From net investment income | | |
Class A | $ 864 | $ 2,857 |
Class T | 23 | 344 |
Class B | - | 2 |
Class C | - | 79 |
International Discovery | 49,040 | 93,065 |
Class K | 19,835 | 33,983 |
Class I | 4,544 | 5,936 |
Class Z | 283 | 60 |
Total | $ 74,589 | $ 136,326 |
From net realized gain | | |
Class A | $ - | $ 2,660 |
Class T | - | 423 |
Class B | - | 52 |
Class C | - | 295 |
International Discovery | - | 61,190 |
Class K | - | 20,093 |
Class I | - | 3,838 |
Class Z | - | 35 |
Total | $ - | $ 88,586 |
Annual Report
11. Share Transactions.
Share transactions for each class were as follows and may contain automatic conversions between classes or exchanges between funds:
| Shares | Dollars |
Years ended October 31, | 2015 | 2014 | 2015 | 2014 |
Class A | | | | |
Shares sold | 1,331 | 1,382 | $ 53,289 | $ 54,489 |
Reinvestment of distributions | 22 | 137 | 843 | 5,280 |
Shares redeemed | (1,915) | (2,632) | (76,178) | (104,067) |
Net increase (decrease) | (562) | (1,113) | $ (22,046) | $ (44,298) |
Class T | | | | |
Shares sold | 178 | 200 | $ 7,105 | $ 7,804 |
Reinvestment of distributions | 1 | 19 | 23 | 736 |
Shares redeemed | (355) | (311) | (13,954) | (12,118) |
Net increase (decrease) | (176) | (92) | $ (6,826) | $ (3,578) |
Class B | | | | |
Shares sold | 1 | 6 | $ 53 | $ 233 |
Reinvestment of distributions | - | 1 | - | 51 |
Shares redeemed | (64) | (58) | (2,536) | (2,266) |
Net increase (decrease) | (63) | (51) | $ (2,483) | $ (1,982) |
Class C | | | | |
Shares sold | 201 | 232 | $ 7,918 | $ 9,059 |
Reinvestment of distributions | - | 9 | - | 337 |
Shares redeemed | (314) | (250) | (12,486) | (9,726) |
Net increase (decrease) | (113) | (9) | $ (4,568) | $ (330) |
International Discovery | | | | |
Shares sold | 20,827 | 28,809 | $ 832,233 | $ 1,144,588 |
Reinvestment of distributions | 1,199 | 3,813 | 46,913 | 148,138 |
Shares redeemed | (33,573) | (37,231) | (1,345,593) | (1,476,965) |
Net increase (decrease) | (11,547) | (4,609) | $ (466,447) | $ (184,239) |
Class K | | | | |
Shares sold | 15,372 | 15,775 | $ 613,737 | $ 628,261 |
Reinvestment of distributions | 508 | 1,396 | 19,835 | 54,076 |
Shares redeemed | (21,494) A | (18,729) | (860,632) A | (741,205) |
Net increase (decrease) | (5,614) | (1,558) | $ (227,060) | $ (58,868) |
Class I | | | | |
Shares sold | 15,392 | 10,468 | $ 602,134 | $ 410,346 |
Reinvestment of distributions | 33 | 91 | 1,286 | 3,529 |
Shares redeemed | (5,606) | (5,852) | (221,504) | (225,868) |
Net increase (decrease) | 9,819 | 4,707 | $ 381,916 | $ 188,007 |
Class Z | | | | |
Shares sold | 402 | 993 | $ 16,312 | $ 39,070 |
Reinvestment of distributions | 7 | 2 | 283 | 95 |
Shares redeemed | (559) | (96) | (22,228) | (3,785) |
Net increase (decrease) | (150) | 899 | $ (5,633) | $ 35,380 |
A Amount includes in-kind redemptions (see Note 5: Redemptions In-Kind).
Annual Report
Notes to Financial Statements - continued
(Amounts in thousands except percentages)
12. Other.
The Fund's organizational documents provide former and current trustees and officers with a limited indemnification against liabilities arising in connection with the performance of their duties to the Fund. In the normal course of business, the Fund may also enter into contracts that provide general indemnifications. The Fund's maximum exposure under these arrangements is unknown as this would be dependent on future claims that may be made against the Fund. The risk of material loss from such claims is considered remote.
At the end of the period, Strategic Advisers International Fund was the owner of record of approximately 13% of the total outstanding shares of the Fund.
Annual Report
To the Trustees of Fidelity Investment Trust and the Shareholders of Fidelity International Discovery Fund:
In our opinion, the accompanying statement of assets and liabilities, including the schedule of investments, and the related statements of operations and of changes in net assets and the financial highlights present fairly, in all material respects, the financial position of Fidelity International Discovery Fund (a fund of Fidelity Investment Trust) at October 31, 2015, the results of its operations for the year then ended, the changes in its net assets for each of the two years in the period then ended and the financial highlights for each of the five years in the period then ended, in conformity with accounting principles generally accepted in the United States of America. These financial statements and financial highlights (hereafter referred to as "financial statements") are the responsibility of the Fidelity International Discovery Fund's management. Our responsibility is to express an opinion on these financial statements based on our audits. We conducted our audits of these financial statements in accordance with the standards of the Public Company Accounting Oversight Board (United States). Those standards require that we plan and perform the audit to obtain reasonable assurance about whether the financial statements are free of material misstatement. An audit includes examining, on a test basis, evidence supporting the amounts and disclosures in the financial statements, assessing the accounting principles used and significant estimates made by management, and evaluating the overall financial statement presentation. We believe that our audits, which included confirmation of securities at October 31, 2015 by correspondence with the custodian and brokers, provide a reasonable basis for our opinion.
PricewaterhouseCoopers LLP
Boston, Massachusetts
December 16, 2015
Annual Report
The Trustees, Member of the Advisory Board, and officers of the trust and fund, as applicable, are listed below. The Board of Trustees governs the fund and is responsible for protecting the interests of shareholders. The Trustees are experienced executives who meet periodically throughout the year to oversee the fund's activities, review contractual arrangements with companies that provide services to the fund, oversee management of the risks associated with such activities and contractual arrangements, and review the fund's performance. Each of the Trustees oversees 170 funds.
The Trustees hold office without limit in time except that (a) any Trustee may resign; (b) any Trustee may be removed by written instrument, signed by at least two-thirds of the number of Trustees prior to such removal; (c) any Trustee who requests to be retired or who has become incapacitated by illness or injury may be retired by written instrument signed by a majority of the other Trustees; and (d) any Trustee may be removed at any special meeting of shareholders by a two-thirds vote of the outstanding voting securities of the trust. Each Trustee who is not an interested person (as defined in the 1940 Act) of the trust and the fund (Independent Trustee), shall retire not later than the last day of the calendar year in which his or her 75th birthday occurs. The Independent Trustees may waive this mandatory retirement age policy with respect to individual Trustees. The officers and Advisory Board Member hold office without limit in time, except that any officer and Advisory Board Member may resign or may be removed by a vote of a majority of the Trustees at any regular meeting or any special meeting of the Trustees. Except as indicated, each individual has held the office shown or other offices in the same company for the past five years.
Experience, Skills, Attributes, and Qualifications of the Fund's Trustees. The Governance and Nominating Committee has adopted a statement of policy that describes the experience, qualifications, attributes, and skills that are necessary and desirable for potential Independent Trustee candidates (Statement of Policy). The Board believes that each Trustee satisfied at the time he or she was initially elected or appointed a Trustee, and continues to satisfy, the standards contemplated by the Statement of Policy. The Governance and Nominating Committee also engages professional search firms to help identify potential Independent Trustee candidates who have the experience, qualifications, attributes, and skills consistent with the Statement of Policy. From time to time, additional criteria based on the composition and skills of the current Independent Trustees, as well as experience or skills that may be appropriate in light of future changes to board composition, business conditions, and regulatory or other developments, have also been considered by the professional search firms and the Governance and Nominating Committee. In addition, the Board takes into account the Trustees' commitment and participation in Board and committee meetings, as well as their leadership of standing and ad hoc committees throughout their tenure.
In determining that a particular Trustee was and continues to be qualified to serve as a Trustee, the Board has considered a variety of criteria, none of which, in isolation, was controlling. The Board believes that, collectively, the Trustees have balanced and diverse experience, qualifications, attributes, and skills, which allow the Board to operate effectively in governing the fund and protecting the interests of shareholders. Information about the specific experience, skills, attributes, and qualifications of each Trustee, which in each case led to the Board's conclusion that the Trustee should serve (or continue to serve) as a trustee of the fund, is provided below.
Annual Report
Board Structure and Oversight Function. James C. Curvey is an interested person (as defined in the 1940 Act) and currently serves as Chairman. The Trustees have determined that an interested Chairman is appropriate and benefits shareholders because an interested Chairman has a personal and professional stake in the quality and continuity of services provided to the fund. Independent Trustees exercise their informed business judgment to appoint an individual of their choosing to serve as Chairman, regardless of whether the Trustee happens to be independent or a member of management. The Independent Trustees have determined that they can act independently and effectively without having an Independent Trustee serve as Chairman and that a key structural component for assuring that they are in a position to do so is for the Independent Trustees to constitute a substantial majority for the Board. The Independent Trustees also regularly meet in executive session. Ned C. Lautenbach serves as Chairman of the Independent Trustees and as such (i) acts as a liaison between the Independent Trustees and management with respect to matters important to the Independent Trustees and (ii) with management prepares agendas for Board meetings.
Fidelity funds are overseen by different Boards of Trustees. The fund's Board oversees Fidelity's high income and certain equity funds, and other Boards oversee Fidelity's investment-grade bond, money market, asset allocation, and sector funds. The asset allocation funds may invest in Fidelity funds overseen by the fund's Board. The use of separate Boards, each with its own committee structure, allows the Trustees of each group of Fidelity funds to focus on the unique issues of the funds they oversee, including common research, investment, and operational issues. On occasion, the separate Boards establish joint committees to address issues of overlapping consequences for the Fidelity funds overseen by each Board.
The Trustees operate using a system of committees to facilitate the timely and efficient consideration of all matters of importance to the Trustees, the fund, and fund shareholders and to facilitate compliance with legal and regulatory requirements and oversight of the fund's activities and associated risks. The Board, acting through its committees, has charged FMR and its affiliates with (i) identifying events or circumstances the occurrence of which could have demonstrably adverse effects on the fund's business and/or reputation; (ii) implementing processes and controls to lessen the possibility that such events or circumstances occur or to mitigate the effects of such events or circumstances if they do occur; and (iii) creating and maintaining a system designed to evaluate continuously business and market conditions in order to facilitate the identification and implementation processes described in (i) and (ii) above. Because the day-to-day operations and activities of the fund are carried out by or through FMR, its affiliates and other service providers, the fund's exposure to risks is mitigated but not eliminated by the processes overseen by the Trustees. While each of the Board's committees has responsibility for overseeing different aspects of the fund's activities, oversight is exercised primarily through the Operations, Audit, and Compliance Committees. In addition, the Independent Trustees have worked with FMR to enhance the Board's oversight of investment and financial risks, legal and regulatory risks, technology risks, and operational risks, including the development of additional risk reporting to the Board. For example, a working group comprised of Independent Trustees and FMR has worked and continues to work to review the Fidelity funds' valuation-related activities, reporting and risk management. Appropriate personnel, including but not limited to the fund's Chief Compliance Officer (CCO), FMR's internal auditor, the independent accountants, the fund's Treasurer and portfolio management personnel, make periodic reports to the Board's committees, as appropriate, including an annual review of Fidelity's risk management program for the Fidelity funds. The responsibilities of each standing committee, including their oversight responsibilities, are described further under "Standing Committees of the Fund's Trustees."
Annual Report
Trustees and Officers - continued
The fund's Statement of Additional Information (SAI) includes more information about the Trustees. To request a free copy, call Fidelity at 1-877-208-0098.
Interested Trustees*:
Correspondence intended for each Trustee who is an interested person may be sent to Fidelity Investments, 245 Summer Street, Boston, Massachusetts 02210.
Name, Year of Birth; Principal Occupations and Other Relevant Experience+ |
James C. Curvey (1935) |
Year of Election or Appointment: 2007 Trustee Chairman of the Board of Trustees |
| Mr. Curvey also serves as Trustee of other Fidelity funds. Mr. Curvey is a Director of Fidelity Research & Analysis Co. (investment adviser firm, 2009-present), and Vice Chairman (2007-present) and Director of FMR LLC (diversified financial services company). In addition, Mr. Curvey serves as an Overseer for the Boston Symphony Orchestra and a member of the board of Artis-Naples, Naples, Florida, and as a Trustee for Brewster Academy, Wolfeboro, New Hampshire. Previously, Mr. Curvey served as a Director of Fidelity Investments Money Management, Inc. (investment adviser firm, 2009-2014) and a Director of FMR and FMR Co., Inc. (investment adviser firms, 2007-2014). |
Charles S. Morrison (1960) |
Year of Election or Appointment: 2014 Trustee |
| Mr. Morrison also serves as Trustee of other funds. He serves as a Director of Fidelity Investments Money Management, Inc. (FIMM) (investment adviser firm, 2014-present), Director of Fidelity SelectCo, LLC (investment adviser firm, 2014-present), President, Asset Management (2014-present), and is an employee of Fidelity Investments. Previously, Mr. Morrison served as Vice President of Fidelity's Fixed Income and Asset Allocation Funds (2012-2014), President, Fixed Income (2011-2014), Vice President of Fidelity's Money Market Funds (2005-2009), President, Money Market Group Leader of FMR (investment adviser firm, 2009), and Senior Vice President, Money Market Group of FMR (2004-2009). Mr. Morrison also served as Vice President of Fidelity's Bond Funds (2002-2005), certain Balanced Funds (2002-2005), and certain Asset Allocation Funds (2002-2007), and as Senior Vice President (2002-2005) of Fidelity's Bond Division. |
* Trustees have been determined to be "Interested Trustees" by virtue of, among other things, their affiliation with the trust or various entities under common control with FMR.
+ The information above includes each Trustee's principal occupation during the last five years and other information relating to the experience, attributes, and skills relevant to each Trustee's qualifications to serve as a Trustee, which led to the conclusion that each Trustee should serve as a Trustee for the fund.
Annual Report
Trustees and Officers - continued
Independent Trustees:
Correspondence intended for each Independent Trustee (that is, the Trustees other than the Interested Trustees) may be sent to Fidelity Investments, P.O. Box 55235, Boston, Massachusetts 02205-5235.
Name, Year of Birth; Principal Occupations and Other Relevant Experience+ |
Dennis J. Dirks (1948) |
Year of Election or Appointment: 2005 Trustee |
| Mr. Dirks also serves as Trustee of other Fidelity funds. Prior to his retirement in May 2003, Mr. Dirks was Chief Operating Officer and a member of the Board of The Depository Trust & Clearing Corporation (DTCC). He also served as President, Chief Operating Officer, and Board member of The Depository Trust Company (DTC) and President and Board member of the National Securities Clearing Corporation (NSCC). In addition, Mr. Dirks served as Chief Executive Officer and Board member of the Government Securities Clearing Corporation, Chief Executive Officer and Board member of the Mortgage-Backed Securities Clearing Corporation, as a Trustee and a member of the Finance Committee of Manhattan College (2005-2008), as a Trustee and a member of the Finance Committee of AHRC of Nassau County (2006-2008), and as a member of the Independent Directors Council (IDC) Governing Council (2010-2015). Mr. Dirks is a member of the Board of Directors for The Brookville Center for Children's Services, Inc. (2009-present). |
Alan J. Lacy (1953) |
Year of Election or Appointment: 2008 Trustee |
| Mr. Lacy also serves as Trustee of other Fidelity funds. Mr. Lacy serves as a member of the Board of Directors of Dave & Buster's Entertainment, Inc. (restaurant and entertainment complexes, 2010-present) and Bristol-Myers Squibb Company (global pharmaceuticals, 2008-present). In addition, Mr. Lacy served as Senior Adviser (2007-2014) of Oak Hill Capital Partners, L.P. (private equity) and also served as Chief Executive Officer (2000-2005) and Vice Chairman (2005-2006) of Sears Holdings Corporation and Sears, Roebuck and Co. (retail). Mr. Lacy is a member of the Board of Trustees of The National Parks Conservation Association (2006-present). Previously, Mr. Lacy served as Chairman of the Board of Trustees of the National Parks Conservation Association (2008-2011) and as a member of the Board of Directors for The Western Union Company (global money transfer, 2006-2011), The Hillman Companies, Inc. (hardware wholesalers, 2010-2014), and Earth Fare, Inc. (retail grocery, 2010-2014). |
Ned C. Lautenbach (1944) |
Year of Election or Appointment: 2000 Trustee Chairman of the Independent Trustees |
| Mr. Lautenbach also serves as Trustee of other Fidelity funds. Mr. Lautenbach currently serves as the Lead Director of the Eaton Corporation Board of Directors (diversified industrial, 1997-present). Mr. Lautenbach is Chairman of the Board of Directors of Artis-Naples in Naples, Florida (2012-present), a member of the Council on Foreign Relations (1994-present), and a member of the Board of Governors, State University System of Florida (2013-present). Previously, Mr. Lautenbach was a Partner/Advisory Partner at Clayton, Dubilier & Rice, LLC (private equity investment, 1998-2010), as well as a Director of Sony Corporation (2006-2007). |
Joseph Mauriello (1944) |
Year of Election or Appointment: 2008 Trustee |
| Mr. Mauriello also serves as Trustee of other Fidelity funds. Prior to his retirement in January 2006, Mr. Mauriello served in numerous senior management positions including Deputy Chairman and Chief Operating Officer (2004-2005), and Vice Chairman of Financial Services (2002-2004) of KPMG LLP US (professional services, 1965-2005). Mr. Mauriello currently serves as a member of the Board of Directors of XL Group plc. (global insurance and re-insurance, 2006-present) and the Independent Directors Council (IDC) Governing Council (2015-present). Previously, Mr. Mauriello served as a Director of the Hamilton Funds of the Bank of New York (2006-2007) and of Arcadia Resources Inc. (health care services and products, 2007-2012). |
Robert W. Selander (1950) |
Year of Election or Appointment: 2011 Trustee |
| Mr. Selander also serves as Trustee of other Fidelity funds. Mr. Selander serves as a Director of The Western Union Company (global money transfer, 2014-present). Previously, Mr. Selander served as a Member of the Advisory Board of other Fidelity funds (2011), and Executive Vice Chairman (2010), Chief Executive Officer (2009-2010), and President and Chief Executive Officer (1997-2009) of Mastercard, Inc. |
Cornelia M. Small (1944) |
Year of Election or Appointment: 2005 Trustee |
| Ms. Small also serves as Trustee of other Fidelity funds. Ms. Small is a member of the Board of Directors (2009-present) and Chair of the Investment Committee (2010-present) of the Teagle Foundation. Ms. Small also serves on the Investment Committee of the Berkshire Taconic Community Foundation (2008-present). Previously, Ms. Small served as Chairperson (2002-2008) and a member of the Investment Committee and Chairperson (2008-2012) and a member of the Board of Trustees of Smith College. In addition, Ms. Small served as Chief Investment Officer, Director of Global Equity Investments, and a member of the Board of Directors of Scudder, Stevens & Clark and Scudder Kemper Investments. |
William S. Stavropoulos (1939) |
Year of Election or Appointment: 2001 Trustee Vice Chairman of the Independent Trustees |
| Mr. Stavropoulos also serves as Trustee of other Fidelity funds. Mr. Stavropoulos serves as President and Founder of the Michigan Baseball Foundation, the Great Lakes Loons (2007-present). Mr. Stavropoulos is Chairman Emeritus of the Board of Directors of The Dow Chemical Company, where he previously served in numerous senior management positions, including President, CEO (1995-2000; 2002-2004), Chairman of the Executive Committee (2000-2006), and as a member of the Board of Directors (1990-2006). Currently, Mr. Stavropoulos is Chairman of the Board of Directors of Univar Inc. (global distributor of commodity and specialty chemicals), a Director of Teradata Corporation (data warehousing and technology solutions), and Maersk Inc. (industrial conglomerate), and a member of the Advisory Board for Metalmark Capital LLC (private equity investment, 2005-present). Mr. Stavropoulos is an operating advisor to Clayton, Dubilier & Rice, LLC (private equity investment). In addition, Mr. Stavropoulos is a member of the University of Notre Dame Advisory Council for the College of Science, a Trustee of the Rollin L. Gerstacker Foundation, and a Director of the Naples Philharmonic Center for the Arts. Previously, Mr. Stavropoulos served as a Director of Chemical Financial Corporation (bank holding company, 1993-2012) and Tyco International, Ltd. (multinational manufacturing and services, 2007-2012). |
David M. Thomas (1949) |
Year of Election or Appointment: 2008 Trustee |
| Mr. Thomas also serves as Trustee of other Fidelity funds. Mr. Thomas serves as Non-Executive Chairman of the Board of Directors of Fortune Brands Home and Security (home and security products, 2011-present), as a member of the Board of Directors (2004-present) and Presiding Director (2013-present) of Interpublic Group of Companies, Inc. (marketing communication), and as a member of the Board of Trustees of the University of Florida (2013-present). Previously, Mr. Thomas served as Executive Chairman (2005-2006) and Chairman and Chief Executive Officer (2000-2005) of IMS Health, Inc. (pharmaceutical and healthcare information solutions), and a Director of Fortune Brands, Inc. (consumer products, 2000-2011). |
+ The information above includes each Trustee's principal occupation during the last five years and other information relating to the experience, attributes, and skills relevant to each Trustee's qualifications to serve as a Trustee, which led to the conclusion that each Trustee should serve as a Trustee for the fund.
Advisory Board Member and Officers:
Correspondence intended for each officer and Peter S. Lynch may be sent to Fidelity Investments, 245 Summer Street, Boston, Massachusetts 02210. Officers appear below in alphabetical order.
Name, Year of Birth; Principal Occupation |
Peter S. Lynch (1944) |
Year of Election or Appointment: 2003 Member of the Advisory Board |
| Mr. Lynch also serves as Member of the Advisory Board of other Fidelity funds. Mr. Lynch is Vice Chairman and a Director of FMR (investment adviser firm) and FMR Co., Inc. (investment adviser firm). In addition, Mr. Lynch serves as a Trustee of Boston College and as the Chairman of the Inner-City Scholarship Fund. Previously, Mr. Lynch served on the Special Olympics International Board of Directors (1997-2006). |
Elizabeth Paige Baumann (1968) |
Year of Election or Appointment: 2012 Anti-Money Laundering (AML) Officer |
| Ms. Baumann also serves as AML Officer of other funds. She is Chief AML Officer of FMR LLC (diversified financial services company, 2012-present) and is an employee of Fidelity Investments. Previously, Ms. Baumann served as Vice President and Deputy Anti-Money Laundering Officer (2007-2012). |
Marc R. Bryant (1966) |
Year of Election or Appointment: 2015 Secretary and Chief Legal Officer (CLO) |
| Mr. Bryant also serves as Secretary and CLO of other funds. Mr. Bryant serves as CLO, Secretary, and Senior Vice President of Fidelity Management & Research Company (investment adviser firm, 2015-present) and FMR Co., Inc. (investment adviser firm, 2015-present); Secretary of Fidelity SelectCo, LLC (investment adviser firm, 2015-present) and Fidelity Investments Money Management, Inc. (investment adviser firm, 2015-present); and CLO of Fidelity Management & Research (Hong Kong) Limited (investment adviser firm, 2015-present). He is Senior Vice President and Deputy General Counsel of FMR LLC (diversified financial services company). Previously, Mr. Bryant served as Secretary and Chief Legal Officer of Fidelity Rutland Square Trust II (2010-2014) and Assistant Secretary of Fidelity's Fixed Income and Asset Allocation Funds (2013-2015). Prior to joining Fidelity Investments, Mr. Bryant served as a Senior Vice President and the Head of Global Retail Legal for AllianceBernstein L.P. (2006-2010), and as the General Counsel for ProFund Advisors LLC (2001-2006). |
William C. Coffey (1969) |
Year of Election or Appointment: 2009 Assistant Secretary |
| Mr. Coffey also serves as Assistant Secretary of other funds. He is Senior Vice President and Deputy General Counsel of FMR LLC (diversified financial services company, 2010-present), and is an employee of Fidelity Investments. Previously, Mr. Coffey served as Vice President and Associate General Counsel of FMR LLC (2005-2009). |
Timothy M. Cohen (1969) |
Year of Election or Appointment: 2014 Vice President of certain Equity Funds |
| Mr. Cohen also serves as Vice President of other funds. Mr. Cohen serves as Chief Compliance Officer of FMR Investment Management (U.K.) Limited (investment adviser firm, 2013-present) and is an employee of Fidelity Investments. Previously, Mr. Cohen served as a Director of FMR Investment Management (U.K.) Limited (2013-2015). |
Jonathan Davis (1968) |
Year of Election or Appointment: 2010 Assistant Treasurer |
| Mr. Davis also serves as Assistant Treasurer of other funds, and is an employee of Fidelity Investments. Previously, Mr. Davis served as Vice President and Associate General Counsel of FMR LLC (diversified financial services company, 2003-2010). |
Adrien E. Deberghes (1967) |
Year of Election or Appointment: 2008 Deputy Treasurer |
| Mr. Deberghes also serves as an officer of other funds. He is an employee of Fidelity Investments (2008-present). Prior to joining Fidelity Investments, Mr. Deberghes was Senior Vice President of Mutual Fund Administration at State Street Corporation (2007-2008), Senior Director of Mutual Fund Administration at Investors Bank & Trust (2005-2007), and Director of Finance for Dunkin' Brands (2000-2005). |
Stephanie J. Dorsey (1969) |
Year of Election or Appointment: 2010 Assistant Treasurer |
| Ms. Dorsey also serves as an officer of other funds. She is an employee of Fidelity Investments (2008-present) and has served in other fund officer roles. Prior to joining Fidelity Investments, Ms. Dorsey served as Treasurer (2004-2008) of the JPMorgan Mutual Funds and Vice President (2004-2008) of JPMorgan Chase Bank. |
Howard J. Galligan III (1966) |
Year of Election or Appointment: 2014 Chief Financial Officer |
| Mr. Galligan also serves as Chief Financial Officer of other funds. Mr. Galligan serves as President of Fidelity Pricing and Cash Management Services (FPCMS) (2014-present) and as a Director of Strategic Advisers, Inc. (investment adviser firm, 2008-present). Previously, Mr. Galligan served as Chief Administrative Officer of Asset Management (2011-2014) and Chief Operating Officer and Senior Vice President of Investment Support for Strategic Advisers, Inc. (2003-2011). |
Scott C. Goebel (1968) |
Year of Election or Appointment: 2015 Vice President |
| Mr. Goebel serves as Vice President of other funds and is an employee of Fidelity Investments (2001-present). Previously, Mr. Goebel served as Secretary of Fidelity SelectCo, LLC (investment adviser firm, 2013-2015), Fidelity Investments Money Management, Inc. (FIMM) (investment adviser firm, 2010-2015), and Fidelity Research and Analysis Company (FRAC) (investment adviser firm, 2010-2015); General Counsel, Secretary, and Senior Vice President of Fidelity Management & Research Company (investment adviser firm, 2008-2015) and FMR Co., Inc. (investment adviser firm, 2008-2015); Assistant Secretary of Fidelity Management & Research (Japan) Limited (investment adviser firm, 2008-2015) and FMR Investment Management (U.K.) Limited (investment adviser firm, 2008-2015); Chief Legal Officer (CLO) of Fidelity Management & Research (Hong Kong) Limited (investment adviser firm, 2008-2015); Secretary and CLO of certain Fidelity funds (2008-2015); Assistant Secretary of FIMM (2008-2010), FRAC (2008-2010), and certain funds (2007-2008); and as Vice President and Secretary of Fidelity Distributors Corporation (FDC) (2005-2007). |
Brian B. Hogan (1964) |
Year of Election or Appointment: 2009 Vice President |
| Mr. Hogan also serves as Trustee or Vice President of other funds. Mr. Hogan serves as a Director of Fidelity SelectCo, LLC (investment adviser firm, 2014-present) and President of the Equity Division of FMR (investment adviser firm, 2009-present). Previously, Mr. Hogan served as Senior Vice President, Equity Research of FMR (2006-2009) and as a portfolio manager. |
Chris Maher (1972) |
Year of Election or Appointment: 2013 Assistant Treasurer |
| Mr. Maher serves as Assistant Treasurer of other funds. Mr. Maher is Vice President of Valuation Oversight and is an employee of Fidelity Investments. Previously, Mr. Maher served as Vice President of Asset Management Compliance (2013), Vice President of the Program Management Group of FMR (investment adviser firm, 2010-2013), and Vice President of Valuation Oversight (2008-2010). |
Kenneth B. Robins (1969) |
Year of Election or Appointment: 2008 President and Treasurer |
| Mr. Robins also serves as an officer of other funds. Mr. Robins serves as Executive Vice President of Fidelity Investments Money Management, Inc. (FIMM) (investment adviser firm, 2013-present) and is an employee of Fidelity Investments (2004-present). Previously, Mr. Robins served in other fund officer roles. |
Stacie M. Smith (1974) |
Year of Election or Appointment: 2013 Deputy Treasurer |
| Ms. Smith also serves as an officer of other funds. She is an employee of Fidelity Investments (2009-present) and has served in other fund officer roles. Prior to joining Fidelity Investments, Ms. Smith served as Senior Audit Manager of Ernst & Young LLP (1996-2009). |
Renee Stagnone (1975) |
Year of Election or Appointment: 2013 Deputy Treasurer |
| Ms. Stagnone also serves as Deputy Treasurer of other funds. Ms. Stagnone is an employee of Fidelity Investments (1997-present). |
Linda J. Wondrack (1964) |
Year of Election or Appointment: 2014 Chief Compliance Officer |
| Ms. Wondrack also serves as Chief Compliance Officer of other funds. Ms. Wondrack is Executive Vice President and head of the Ethics Office and Asset Management Compliance for Fidelity Investments (2012-present). Ms. Wondrack also serves as Chief Compliance Officer of Fidelity SelectCo, LLC (investment adviser firm, 2014-present); Chief Compliance Officer of Impresa Management LLC (2013-present); and Chief Compliance Officer of FMR Co., Inc. (investment adviser firm), Fidelity Investments Money Management, Inc. (investment adviser firm), Fidelity Management & Research (Japan) Limited (investment adviser firm), FMR Investment Management (U.K.) Limited (investment adviser firm), Fidelity Management & Research (Hong Kong) (investment adviser firm), Fidelity Management & Research Company (investment adviser firm), FIAM LLC (investment adviser firm), and Strategic Advisers, Inc. (investment adviser firm), Ballyrock Investment Advisors LLC, and Northern Neck Investors LLC (2012-present). Previously, Ms. Wondrack served as Senior Vice President and Chief Compliance Officer for Columbia Management Investment Advisers, LLC (2005-2012); Chief Compliance Officer for certain funds within the Columbia Family of Funds (2007-2012); and Senior Vice President of Compliance Risk Management at Bank of America (2005-2010). |
Joseph F. Zambello (1957) |
Year of Election or Appointment: 2011 Deputy Treasurer |
| Mr. Zambello also serves as Deputy Treasurer of other funds. Mr. Zambello is an employee of Fidelity Investments (1991-present). Previously, Mr. Zambello served as Vice President of the Program Management Group of FMR (investment adviser firm, 2009-2011) and Vice President of the Transfer Agent Oversight Group (2005-2009). |
Annual Report
The Board of Trustees of Advisor International Discovery Fund voted to pay to shareholders of record at the opening of business on record date, the following distributions per share derived from capital gains realized from sales of portfolio securities, and dividends derived from net investment income:
| Pay Date | Record Date | Dividends | Capital Gains |
Class I | 12/07/15 | 12/04/15 | $0.418 | $0.005 |
Class I designates 6% of the dividends distributed in during the fiscal year as qualifying for the dividends-received deduction for corporate shareholders.
Class I designates 100% of dividends distributed during the fiscal year as amounts which may be taken into account as a dividend for purposes of the maximum rate under section 1(h)(11) of the Internal Revenue Code.
The amounts per share which represent income derived from sources within, and taxes paid to, foreign countries or possessions of the United States are as follows:
| Pay Date | Income | Taxes |
Class I | 12/08/14 | $0.3126 | $0.0486 |
The fund will notify shareholders in January 2016 of amounts for use in preparing 2015 income tax returns.
Annual Report
Fidelity International Discovery Fund
Each year, the Board of Trustees, including the Independent Trustees (together, the Board), votes on the renewal of the management contract with Fidelity Management & Research Company (FMR) and the sub-advisory agreements (together, the Advisory Contracts) for the fund. The Board, assisted by the advice of fund counsel and Independent Trustees' counsel, requests and considers a broad range of information relevant to the renewal of the Advisory Contracts throughout the year.
The Board meets regularly and, at each of its meetings, covers an extensive agenda of topics and materials and considers factors that are relevant to its annual consideration of the renewal of the fund's Advisory Contracts, including the services and support provided to the fund and its shareholders. The Board has established various standing committees (Committees), each composed of and chaired by Independent Trustees with varying backgrounds, to which the Board has assigned specific subject matter responsibilities in order to enhance effective decision-making by the Board. The Board, acting directly and through its Committees, requests and receives information concerning the annual consideration of the renewal of the fund's Advisory Contracts. The Board also meets as needed to consider matters specifically related to the Board's annual consideration of the renewal of the Advisory Contracts. Members of the Board may also meet with trustees of other Fidelity funds through ad hoc joint committees to discuss certain matters relevant to all of the Fidelity funds.
At its July 2015 meeting, the Board unanimously determined to renew the fund's Advisory Contracts. In reaching its determination, the Board considered all factors it believed relevant, including (i) the nature, extent, and quality of the services to be provided to the fund and its shareholders (including the investment performance of the fund); (ii) the competitiveness of the fund's management fee and total expense ratio relative to peer funds; (iii) the total costs of the services to be provided by and the profits to be realized by Fidelity from its relationship with the fund; and (iv) the extent to which (if any) economies of scale exist and would be realized as the fund grows, and whether any economies of scale are appropriately shared with fund shareholders.
In considering whether to renew the Advisory Contracts for the fund, the Board reached a determination, with the assistance of fund counsel and Independent Trustees' counsel and through the exercise of its business judgment, that the renewal of the Advisory Contracts was in the best interests of the fund and its shareholders and that the compensation payable under the Advisory Contracts was fair and reasonable. The Board's decision to renew the Advisory Contracts was not based on any single factor, but rather was based on a comprehensive consideration of all the information provided to the Board at its meetings throughout the year. The Board, in reaching its determination to renew the Advisory Contracts, was aware that shareholders of the fund have a broad range of investment choices available to them, including a wide choice among funds offered by Fidelity's competitors, and that the fund's shareholders, who have the opportunity to review and weigh the disclosure provided by the fund in its prospectus and other public disclosures, have chosen to invest in this fund, which is part of the Fidelity family of funds.
Annual Report
Nature, Extent, and Quality of Services Provided. The Board considered Fidelity's staffing as it relates to the fund, including the backgrounds of investment personnel of Fidelity, and also considered the fund's investment objective, strategies, and related investment philosophy. The Independent Trustees also had discussions with senior management of Fidelity's investment operations and investment groups. The Board considered the structure of the portfolio manager compensation program and whether this structure provides appropriate incentives to act in the best interests of the fund. Additionally, the Board considered the portfolio managers' investments, if any, in the funds that they manage.
Resources Dedicated to Investment Management and Support Services. The Board and the Fund Oversight and Research Committees reviewed the general qualifications and capabilities of Fidelity's investment staff, including its size, education, experience, and resources, as well as Fidelity's approach to recruiting, training, managing, and compensating investment personnel. The Board noted that Fidelity has continued to increase the resources devoted to non-U.S. offices, including expansion of Fidelity's global investment organization. The Board also noted that Fidelity's analysts have extensive resources, tools and capabilities that allow them to conduct sophisticated quantitative and fundamental analysis, as well as credit analysis of issuers, counterparties and guarantors. Further, the Board considered that Fidelity's investment professionals have sufficient access to global information and data so as to provide competitive investment results over time, and that those professionals also have access to sophisticated tools that permit them to assess portfolio construction and risk and performance attribution characteristics continuously, as well as to transmit new information and research conclusions rapidly around the world. Additionally, in its deliberations, the Board considered Fidelity's trading, risk management, and compliance capabilities and resources, which are integral parts of the investment management process.
Shareholder and Administrative Services. The Board considered (i) the nature, extent, quality, and cost of advisory, administrative, and shareholder services performed by FMR, the sub-advisers (together with FMR, the Investment Advisers), and their affiliates under the Advisory Contracts and under separate agreements covering transfer agency, pricing and bookkeeping, and securities lending services for the fund; (ii) the nature and extent of the supervision of third party service providers, principally custodians and subcustodians; and (iii) the resources devoted to, and the record of compliance with, the fund's compliance policies and procedures. The Board also reviewed the allocation of fund brokerage, including allocations to brokers affiliated with the Investment Advisers, the use of brokerage commissions to pay fund expenses, and the use of "soft" commission dollars to pay for research services.
Annual Report
Board Approval of Investment Advisory Contracts and
Management Fees - continued
The Board noted that the growth of fund assets over time across the complex allows Fidelity to reinvest in the development of services designed to enhance the value or convenience of the Fidelity funds as investment vehicles. These services include 24-hour access to account information and market information through telephone representatives and over the Internet, investor education materials and asset allocation tools, and the expanded availability of Fidelity Investor Centers.
In 2014, the Board formed an ad hoc Committee on Transfer Agency Fees to review the variety of transfer agency fee structures throughout the industry and Fidelity's competitive positioning with respect to industry participants.
Investment in a Large Fund Family. The Board considered the benefits to shareholders of investing in a Fidelity fund, including the benefits of investing in a fund that is part of a large family of funds offering a variety of investment disciplines and providing a large variety of mutual fund investor services. The Board noted that Fidelity had taken, or had made recommendations that resulted in the Fidelity funds taking, a number of actions over the previous year that benefited particular funds, including (i) continuing to dedicate additional resources to investment research and to the support of the senior management team that oversees asset management; (ii) continuing efforts to enhance Fidelity's global research capabilities; (iii) launching new funds and making other enhancements to meet client needs; (iv) reducing management fees and total expenses for certain index funds and diversified international funds; (v) continuing to launch dedicated lower cost underlying funds to meet portfolio construction needs related to expanding underlying fund options for Fidelity funds of funds, specifically for the Freedom Fund product lines; (vi) rationalizing product lines and gaining increased efficiencies through fund mergers; (vii) launching active fixed-income exchange-traded funds; (viii) continuing to develop, acquire and implement systems and technology to improve services to the funds and information security and to increase efficiency; (ix) implementing investment enhancements to further strengthen Fidelity's target date product line to increase investors' probability of success in achieving their goals; (x) modifying the eligibility criteria for certain share classes to accommodate roll-over assets from employer-sponsored retirement plans; (xi) launching a new Class W of the Freedom Index Funds to attract and retain Fidelity record-kept retirement plan assets; and (xii) implementing changes to Fidelity's money market product line in response to recent money market regulatory reforms.
Investment Performance. The Board considered whether the fund has operated in accordance with its investment objective, as well as its record of compliance with its investment restrictions and its performance history.
Annual Report
The Board took into account discussions with representatives of the Investment Advisers about fund investment performance that occur at Board meetings throughout the year. In this regard the Board noted that as part of regularly scheduled fund reviews and other reports to the Board on fund performance, the Board considers annualized return information for the fund, for different time periods, measured against a securities market index ("benchmark index") and a peer group of funds with similar objectives ("peer group"), if any. In its evaluation of fund investment performance, the Board gave particular attention to information indicating changes in performance of certain Fidelity funds for specific time periods and discussed with the Investment Advisers the reasons for any overperformance or underperformance.
In addition to reviewing absolute and relative fund performance, the Independent Trustees periodically consider the appropriateness of fund performance metrics in evaluating the results achieved. In general, the Independent Trustees believe that fund performance should be evaluated based on net performance (after fees and expenses) of both the highest performing and lowest performing fund share classes, where applicable, compared to appropriate benchmark indices, over appropriate time periods that may include full market cycles, and compared to peer groups, as applicable, over the same periods, taking into account relevant factors including the following: general market conditions; issuer-specific information; and fund cash flows and other factors.
The Independent Trustees recognize that shareholders evaluate performance on a net basis over their own holding periods, for which one-, three-, and five-year periods are often used as a proxy. For this reason, the performance information reviewed by the Board also included net cumulative calendar year total return information for the fund and an appropriate benchmark index and peer group for the most recent one-, three-, and five-year periods, as shown below. Returns are shown compared to the 25th percentile (top of box, 75% beaten) and 75th percentile (bottom of box, 25% beaten) of the peer universe. Returns of the benchmark index are "net MA," i.e., adjusted for tax withholding rates applicable to U.S.-based funds organized as Massachusetts business trusts.
Annual Report
Board Approval of Investment Advisory Contracts and
Management Fees - continued
Fidelity International Discovery Fund

The Board also considered that the fund's management fee is subject to upward or downward adjustment depending upon whether, and to what extent, the fund's investment performance for the performance period exceeds, or is exceeded by, a securities index, thus leading to a performance adjustment for the same period. The Board noted that the performance adjustment provides FMR with a strong economic incentive to seek to achieve superior performance for the fund's shareholders and helps to more closely align the interests of FMR and the shareholders of the fund.
Based on its review, the Board concluded that the nature, extent, and quality of services provided to the fund under the Advisory Contracts should benefit the shareholders of the fund.
Competitiveness of Management Fee and Total Expense Ratio. The Board considered the fund's management fee and total expense ratio compared to "mapped groups" of competitive funds and classes created for the purpose of facilitating the Trustees' competitive analysis of management fees and total expenses. Fidelity creates "mapped groups" by combining similar Lipper investment objective categories that have comparable investment mandates. Combining Lipper investment objective categories aids the Board's management fee and total expense ratio comparisons by broadening the competitive group used for comparison.
Management Fee. The Board considered two proprietary management fee comparisons for the 12-month periods shown in basis points (BP) in the chart below. The group of Lipper funds used by the Board for management fee comparisons is referred to below as the "Total Mapped Group." The Total Mapped Group comparison focuses on a fund's standing in terms of gross management fees before expense reimbursements or caps, and without giving effect to the fund's performance adjustment, relative to the total universe of funds with comparable investment mandates, regardless of whether their management fee structures also are comparable. Funds with comparable investment mandates offer exposure to similar types of securities. Funds with comparable management fee structures have similar management fee contractual arrangements (e.g., flat rate charged for advisory services, all-inclusive fee rate, etc.). "TMG %" represents the percentage of funds in the Total Mapped Group that had management fees that were lower than the fund's. For example, a hypothetical TMG % of 20% would mean that 80% of the funds in the Total Mapped Group had higher, and 20% had lower, management fees than the fund. The fund's actual TMG %s and the number of funds in the Total Mapped Group are in the chart below. The "Asset-Size Peer Group" (ASPG) comparison focuses on a fund's standing relative to a subset of non-Fidelity funds within the Total Mapped Group that are similar in size and management fee structure without taking into account performance adjustments, if any. For example, if a fund is in the first quartile of the ASPG, the fund's management fee ranks in the least expensive or lowest 25% of funds in the ASPG. The ASPG represents at least 15% of the funds in the Total Mapped Group with comparable asset size and management fee structures, subject to a minimum of 50 funds (or all funds in the Total Mapped Group if fewer than 50). Additional information, such as the ASPG quartile in which the fund's management fee rate ranked and the impact of the fund's performance adjustment, is also included in the chart and considered by the Board.
Annual Report
Fidelity International Discovery Fund

Annual Report
Board Approval of Investment Advisory Contracts and
Management Fees - continued
The Board noted that the fund's management fee rate ranked below the median of its Total Mapped Group and below the median of its ASPG for 2014. The Board also noted the effect of the fund's performance adjustment, if any, on the fund's management fee ranking.
Furthermore, the Board considered that it had approved a reduction (effective August 1, 2014) in the individual fund fee rate component of the management fee rate for the fund from 0.450% to 0.424%. The Board considered that the chart reflects the fund's lower management fee for 2014, as if the lower fee were in effect for the entire year.
The Board noted that, in 2014, the ad hoc Committee on Group Fee was formed by it and other Fidelity fund boards to conduct an in-depth review of the "group fee" component of the management fee of funds with such management fee structures. Committee focus included the mechanics of the group fee, the competitive landscape of group fee structures, Fidelity funds with no group fee component and investment products not included in group fee assets. The Board also considered that, for funds subject to the group fee, FMR agreed to voluntarily waive fees over a specified period of time in amounts designed to account for assets converted from certain funds to certain collective investment trusts.
The Board also noted that, in 2013, the ad hoc Committee on Management Fees was formed to conduct an in-depth review of the management fee rates of Fidelity's active equity mutual funds. The Committee focused on the following areas: (i) standard fee structures; (ii) research consumption and trading evolution; (iii) management fee competitiveness/profitability by category; and (iv) factors that drive institutional pricing.
Based on its review, the Board concluded that the fund's management fee is fair and reasonable in light of the services that the fund receives and the other factors considered.
Total Expense Ratio. In its review of each class's total expense ratio, the Board considered the fund's management fee as well as other fund or class expenses, as applicable, such as transfer agent fees, pricing and bookkeeping fees, fund-paid 12b-1 fees, and custodial, legal, and audit fees. The Board noted the impact of the fund's performance adjustment. The Board also noted that Fidelity may agree to waive fees and expenses from time to time, and the extent to which, if any, it has done so for the fund. As part of its review, the Board also considered the current and historical total expense ratios of each class of the fund compared to competitive fund median expenses. Each class of the fund is compared to those funds and classes in the Total Mapped Group (used by the Board for management fee comparisons) that have a similar sales load structure.
The Board noted that the total expense ratio of each of Class A, Class B, Class C, Class I, Class Z, the retail class, and Class K ranked below its competitive median for 2014 and the total expense ratio of Class T ranked above its competitive median for 2014. The Board considered that, in general, various factors can affect total expense ratios. The Board noted that the total expense ratio of Class T was above the competitive median primarily because of higher 12b-1 fees on Class T as compared to most competitor funds. Class T has a higher 12b-1 fee, but a lower front-end sales charge, than traditionally priced front-end sales charge classes. The Board considered that Class T is primarily sold load-waived in the retirement plan market where its 0.50% 12b-1 fee is comparable to competing no-load, higher 12b-1 fee classes designed specifically for retirement plans. The Board noted that the fund offers multiple classes, each of which has a different sales load and 12b-1 fee structure, and that the multiple structures are intended to offer a range of pricing options for the intermediary market. The Board also noted that the total expense ratios of the classes vary primarily by the level of their 12b-1 fees, although differences in transfer agent fees may also cause expenses to vary from class to class.
Annual Report
Fees Charged to Other Fidelity Clients. The Board also considered Fidelity fee structures and other information with respect to clients of Fidelity, such as other funds advised or subadvised by Fidelity, pension plan clients, and other institutional clients with similar mandates. The Board noted the findings of the 2013 ad hoc joint committee (created with the board of other Fidelity funds), which reviewed and compared Fidelity's institutional investment advisory business with its business of providing services to the Fidelity funds, including the differences in services provided, fees charged, and costs incurred, as well as competition in their respective marketplaces.
Based on its review of total expense ratios and fees charged to other Fidelity clients, the Board concluded that, although Class T was above the median of the universe presented for comparison, the total expense ratio of each class of the fund was reasonable in light of the services that the fund and its shareholders receive and the other factors considered.
Costs of the Services and Profitability. The Board considered the revenues earned and the expenses incurred by Fidelity in conducting the business of developing, marketing, distributing, managing, administering and servicing the fund and servicing the fund's shareholders. The Board also considered the level of Fidelity's profits in respect of all the Fidelity funds.
On an annual basis, Fidelity presents to the Board information about the profitability of its relationship with the fund. Fidelity calculates profitability information for each fund, as well as aggregate profitability information for groups of Fidelity funds and all Fidelity funds, using a series of detailed revenue and cost allocation methodologies which originate with the books and records of Fidelity on which Fidelity's audited financial statements are based. The Audit Committee of the Board reviews any significant changes from the prior year's methodologies.
PricewaterhouseCoopers LLP (PwC), independent registered public accounting firm and auditor to Fidelity and certain Fidelity funds, has been engaged annually by the Board as part of the Board's assessment of Fidelity's profitability analysis. PwC's engagement includes the review and assessment of the methodologies used by Fidelity in determining the revenues and expenses attributable to Fidelity's mutual fund business, and completion of agreed-upon procedures in respect of the mathematical accuracy of fund profitability and its conformity to established allocation methodologies. After considering PwC's reports issued under the engagement and information provided by Fidelity, the Board concluded that while other allocation methods may also be reasonable, Fidelity's profitability methodologies are reasonable in all material respects.
Annual Report
Board Approval of Investment Advisory Contracts and
Management Fees - continued
The Board also reviewed Fidelity's non-fund businesses and fall-out benefits related to the mutual fund business as well as cases where Fidelity's affiliates may benefit from or be related to the fund's business.
The Board considered the costs of the services provided by and the profits realized by Fidelity in connection with the operation of the fund and was satisfied that the profitability was not excessive.
Economies of Scale. The Board considered whether there have been economies of scale in respect of the management of the Fidelity funds, whether the Fidelity funds (including the fund) have appropriately benefited from any such economies of scale, and whether there is potential for realization of any further economies of scale. The Board considered the extent to which the fund will benefit from economies of scale as assets grow through increased services to the fund, through waivers or reimbursements, or through fee or expense ratio reductions. The Board also noted that in 2013, it and the boards of other Fidelity funds created an ad hoc committee (the Economies of Scale Committee) to analyze whether Fidelity attains economies of scale in respect of the management and servicing of the Fidelity funds, whether the Fidelity funds have appropriately benefited from such economies of scale, and whether there is potential for realization of any further economies of scale.
The Board recognized that the fund's management contract incorporates a "group fee" structure, which provides for lower group fee rates as total group assets increase, and for higher group fee rates as total group assets decrease (with "group assets" defined to include fund assets under FMR's management plus sector fund assets previously under FMR's management and currently managed by Fidelity SelectCo, LLC). FMR calculates the group fee rates based on a tiered asset "breakpoint" schedule that varies based on asset class. The Board considered that the group fee is designed to deliver the benefits of economies of scale to fund shareholders when total Fidelity fund assets increase, even if assets of any particular fund are unchanged or have declined, because some portion of Fidelity's costs are attributable to services provided to all Fidelity funds, and all funds benefit if those costs can be allocated among more assets. The Board concluded that, given the group fee structure, fund shareholders will benefit from lower management fees as group assets increase at the fund complex level, regardless of whether Fidelity achieves any such economies of scale.
Annual Report
The Board concluded, taking into account the analysis of the Economies of Scale Committee, that economies of scale, if any, are being appropriately shared between fund shareholders and Fidelity.
Additional Information Requested by the Board. In order to develop fully the factual basis for consideration of the Fidelity funds' Advisory Contracts, the Board requested and received additional information on certain topics, including: (i) fund performance trends and Fidelity's long-term strategies for certain funds; (ii) the various share classes employed by Fidelity and the attributes of each class, together with similar information on the distribution and servicing payments made by Fidelity or the funds to third-party participants in the distribution channels; (iii) fund profitability, and fund performance in relation to fund profitability; (iv) the methodology with respect to evaluating competitive fund data and peer group classifications and fee comparisons; (v) annual fund profitability margins, with particular focus on certain funds with negative margins; (vi) the realization of fall-out benefits in certain Fidelity business units; (vii) economies of scale and the way in which they are shared with fund shareholders; (viii) Fidelity's group fee structures, including the group fee schedule of breakpoints; (ix) the impact of cost containment measures on the funds; and (x) the transfer agent fee structure.
Based on its evaluation of all of the conclusions noted above, and after considering all factors it believed relevant, the Board concluded that the advisory fee structures are fair and reasonable, and that the fund's Advisory Contracts should be renewed.
Annual Report
Investment Adviser
Fidelity Management & Research Company
Boston, MA
Investment Sub-Advisers
FMR Co., Inc.
FMR Investment Management
(U.K.) Limited
FIL Investment Advisors
FIL Investments (Japan) Limited
FIL Investment Advisors (UK) Limited
Fidelity Management & Research
(Hong Kong) Limited
Fidelity Management & Research
(Japan) Limited
General Distributor
Fidelity Distributors Corporation
Smithfield, RI
Transfer and Service Agents
Fidelity Investments Institutional Operations Company, Inc.
Boston, MA
Fidelity Service Company, Inc.
Boston, MA
Custodian
The Northern Trust Company
Chicago, IL
(Fidelity Investment logo)(registered trademark)
AIDI-UANN-1215
1.806657.110
ContentsPerformance: The Bottom LineManagement's Discussion of Fund PerformanceShareholder Expense ExampleInvestment Changes (Unaudited)Investments October 31, 2015Financial StatementsNotes to Financial StatementsReport of Independent Registered Public Accounting FirmTrustees and OfficersDistributions (Unaudited)Board Approval of Investment Advisory Contracts and Management Fees
(Fidelity Investment logo)(registered trademark)
Fidelity Advisor®
International Growth
Fund - Class A, Class T, Class B
and Class C
Annual Report
October 31, 2015
(Fidelity Cover Art)
Class A, Class T,
Class B, and Class C are
classes of Fidelity®
International Growth Fund
Contents
Performance | (Click Here) | How the fund has done over time. |
Management's Discussion of Fund Performance | (Click Here) | The Portfolio Manager's review of fund performance and strategy. |
Shareholder Expense Example | (Click Here) | An example of shareholder expenses. |
Investment Changes | (Click Here) | A summary of major shifts in the fund's investments over the past six months. |
Investments | (Click Here) | A complete list of the fund's investments with their market values. |
Financial Statements | (Click Here) | Statements of assets and liabilities, operations, and changes in net assets, as well as financial highlights. |
Notes | (Click Here) | Notes to financial statements. |
Report of Independent Registered Public Accounting Firm | (Click Here) | |
Trustees and Officers | (Click Here) | |
Distributions | (Click Here) | |
Board Approval of Investment Advisory Contracts and Management Fees | (Click Here) | |
To view a fund's proxy voting guidelines and proxy voting record for the 12-month period ended June 30, visit http://www.fidelity.com/proxyvotingresults or visit the Securities and Exchange Commission's (SEC) web site at http://www.sec.gov. You may also call 1-877-208-0098 to request a free copy of the proxy voting guidelines.
Standard & Poor's, S&P and S&P 500 are registered service marks of The McGraw-Hill Companies, Inc. and have been licensed for use by Fidelity Distributors Corporation.
Other third-party marks appearing herein are the property of their respective owners.
All other marks appearing herein are registered or unregistered trademarks or service marks of FMR LLC or an affiliated company. © 2015 FMR LLC. All rights reserved.
Annual Report
This report and the financial statements contained herein are submitted for the general information of the shareholders of the fund. This report is not authorized for distribution to prospective investors in the fund unless preceded or accompanied by an effective prospectus.
A fund files its complete schedule of portfolio holdings with the SEC for the first and third quarters of each fiscal year on Form N-Q. Forms N-Q are available on the SEC's web site at http://www.sec.gov. A fund's Forms N-Q may be reviewed and copied at the SEC's Public Reference Room in Washington, DC. Information regarding the operation of the SEC's Public Reference Room may be obtained by calling 1-800-SEC-0330. For a complete list of a fund's portfolio holdings, view the most recent holdings listing, semiannual report, or annual report on Fidelity's web site at http://www.fidelity.com, http://www.advisor.fidelity.com, or http://www.401k.com, as applicable.
NOT FDIC INSURED • MAY LOSE VALUE • NO BANK GUARANTEE
Neither the fund nor Fidelity Distributors Corporation is a bank.
Annual Report
Average annual total return reflects the change in the value of an investment, assuming reinvestment of the class' distributions from dividend income and capital gains (the profits earned upon the sale of securities that have grown in value, if any) and assuming a constant rate of performance each year. The $10,000 table and the fund's returns do not reflect the deduction of taxes that a shareholder would pay on fund distributions or the redemption of fund shares. During periods of reimbursement by Fidelity, a fund's total return will be greater than it would be had the reimbursement not occurred. How a fund did yesterday is no guarantee of how it will do tomorrow. Returns reflect the conversion of Class B shares to Class A shares after a maximum of seven years.
Average Annual Total Returns
Periods ended October 31, 2015 | Past 1
year | Past 5
years | Life of
fund A |
Class A (incl. 5.75% sales charge) | -2.73% | 5.65% | 1.49% |
Class T (incl. 3.50% sales charge) | -0.75% | 5.85% | 1.51% |
Class B (incl. contingent deferred sales charge) B | -2.71% | 5.77% | 1.57% |
Class C (incl. contingent deferred sales charge) C | 1.30% | 6.07% | 1.46% |
A From November 1, 2007.
B Class B shares' contingent deferred sales charges included in the past one year, past five years, and life of fund total return figures are 5%, 2%, and 0%, respectively.
C Class C shares' contingent deferred sales charges included in the past one year, past five years, and life of fund total return figures are 1%, 0%, and 0%, respectively.
Annual Report
$10,000 Over Life of Fund
Let's say hypothetically that $10,000 was invested in Fidelity Advisor® International Growth Fund - Class A on November 1, 2007, when the fund started, and the current 5.75% sales charge was paid. The chart shows how the value of your investment would have changed, and also shows how the MSCI EAFE Growth Index performed over the same period.
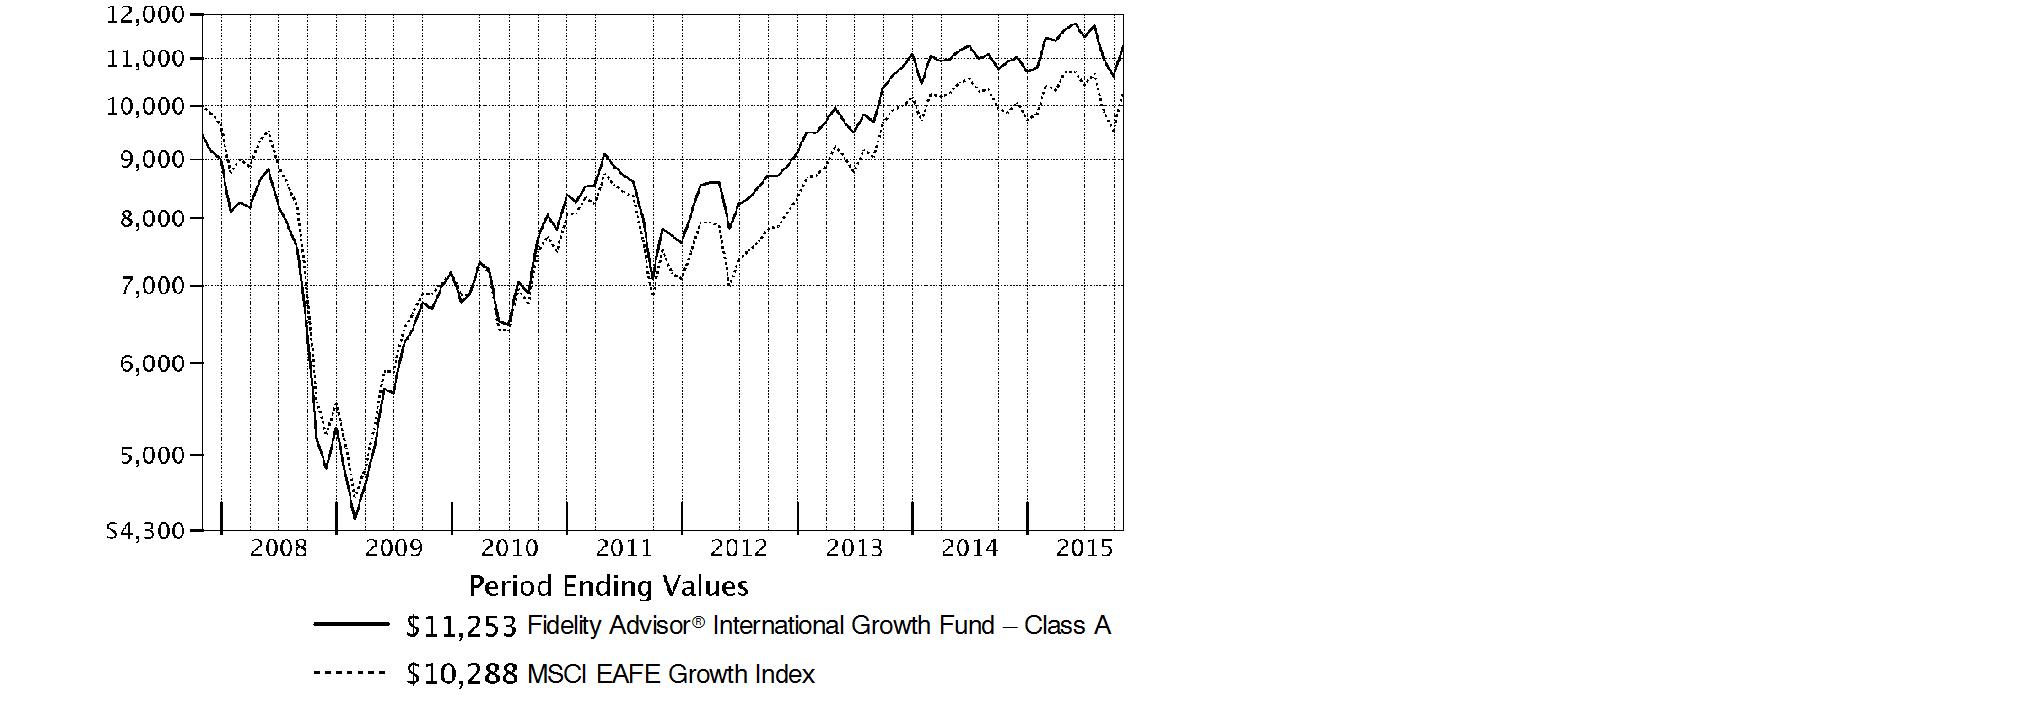
Annual Report
Market Recap: International equities suffered a moderate setback for the 12 months ending October 31, 2015, held back by a collapse in commodities prices that hurt resources-related sectors and geographies. The MSCI ACWI (All Country World Index) ex USA Index returned -4.55% for the period, affected also by concerns about global economic growth. Commodity producers remained under pressure for much of the past year, largely related to economic deceleration in China (-1%), the world's second-largest economy and a leading consumer of raw materials. This effect was exacerbated by U.S. dollar strength relative to global currencies, which weighed on commodities priced in dollars and acutely impacted equity returns within regions most exposed to resources prices. The emerging-markets group, for example, returned about -15% this period. Canada, a significant energy producer, returned roughly -17%. Net energy consumer Japan (+9%) was the best-performing region by far. Only about a quarter of the nearly 50 index countries managed a gain this period: Ireland (+19%) - the EU's fastest-growing economy - and Israel (+17%) proved top performers; Greece (-56%) and Brazil (-46%), among the worst. As for sectors, energy (-25%) and materials (-16%) declined sharply, whereas the two consumer sectors each gained about 6%.
Comments from Portfolio Manager Jed Weiss: For the year, the fund's share classes (excluding sales charges, if applicable) produced low-single-digit gains, underperforming the 4.28% result of the benchmark MSCI EAFE Growth Index. The fund underperformed the benchmark largely for idiosyncratic reasons, including a fair-value pricing adjustment and unfavorable currency movements. Security selection was helpful overall, especially in information technology, materials and financials. Conversely, picks in health care hampered our relative result. In country terms, stock picking was strong in Australia, Spain and Switzerland, but weak in Hong Kong and Germany. Two of the fund's biggest individual detractors were Wynn Macau and Sands China, owners of casino properties in Macau. These stocks struggled for various reasons, and I eliminated the fund's stake in both. Another negative was Turkey-based Coca-Cola Icecek Sanayi. I sold the fund's stake in this owner of the Coca-Cola bottling franchise in various emerging markets and reinvested the proceeds in other stocks I thought offered a better risk/reward balance. In contrast, our biggest contributor was BGF Retail, a South Korean convenience-store retailer, while Visa and Mastercard, two U.S.-based payment processors, also contributed. Of all the stocks I mentioned, only Wynn and Sands were in our benchmark.
The views expressed above reflect those of the portfolio manager(s) only through the end of the period as stated on the cover of this report and do not necessarily represent the views of Fidelity or any other person in the Fidelity organization. Any such views are subject to change at any time based upon market or other conditions and Fidelity disclaims any responsibility to update such views. These views may not be relied on as investment advice and, because investment decisions for a Fidelity fund are based on numerous factors, may not be relied on as an indication of trading intent on behalf of any Fidelity fund.
Annual Report
Shareholder Expense Example
As a shareholder of the Fund, you incur two types of costs: (1) transaction costs, including sales charges (loads) on purchase payments or redemption proceeds, redemption fees and (2) ongoing costs, including management fees, distribution and/or service (12b-1) fees and other Fund expenses. This Example is intended to help you understand your ongoing costs (in dollars) of investing in the Fund and to compare these costs with the ongoing costs of investing in other mutual funds.
The Example is based on an investment of $1,000 invested at the beginning of the period and held for the entire period (May 1, 2015 to October 31, 2015).
Actual Expenses
The first line of the accompanying table for each class of the Fund provides information about actual account values and actual expenses. You may use the information in this line, together with the amount you invested, to estimate the expenses that you paid over the period. Simply divide your account value by $1,000.00 (for example, an $8,600 account value divided by $1,000.00 = 8.6), then multiply the result by the number in the first line for a class of the Fund under the heading entitled "Expenses Paid During Period" to estimate the expenses you paid on your account during this period. A small balance maintenance fee of $12.00 that is charged once a year may apply for certain accounts with a value of less than $2,000. This fee is not included in the table below. If it was, the estimate of expenses you paid during the period would be higher, and your ending account value lower, by this amount. In addition, the Fund, as a shareholder in the underlying Fidelity Central Funds, will indirectly bear its pro-rata share of the fees and expenses incurred by the underlying Fidelity Central Funds. These fees and expenses are not included in the Fund's annualized expense ratio used to calculate the expense estimate in the table below.
Hypothetical Example for Comparison Purposes
The second line of the accompanying table for each class of the Fund provides information about hypothetical account values and hypothetical expenses based on a Class' actual expense ratio and an assumed rate of return of 5% per year before expenses, which is not the Class' actual return. The hypothetical account values and expenses may not be used to estimate the actual ending account balance or expenses you paid for the period. You may use this information to compare the ongoing costs of investing in the Fund and other funds. To do so, compare this 5% hypothetical example with the 5% hypothetical examples that appear in the shareholder reports of the other funds. A small balance maintenance fee of $12.00 that is charged once a year may apply for certain accounts with a value of less than $2,000. This fee is not included in the table below. If it was, the estimate of expenses you paid during the period would be higher, and your ending account value lower, by this amount. In addition, the Fund, as a shareholder in the underlying Fidelity Central Funds, will indirectly bear its pro-rata share of the fees and expenses incurred by the underlying Fidelity Central Funds. These fees and expenses are not included in the Fund's annualized expense ratio used to calculate the expense estimate in the table below.
Please note that the expenses shown in the table are meant to highlight your ongoing costs only and do not reflect any transaction costs. Therefore, the second line of the table is useful in comparing ongoing costs only, and will not help you determine the relative total costs of owning different funds. In addition, if these transactional costs were included, your costs would have been higher.
Annual Report
| Annualized
Expense RatioB | Beginning
Account Value
May 1, 2015 | Ending
Account Value
October 31, 2015 | Expenses Paid
During PeriodC
May 1, 2015
to October 31, 2015 |
Class A | 1.25% | | | |
Actual | | $ 1,000.00 | $ 967.50 | $ 6.20 |
HypotheticalA | | $ 1,000.00 | $ 1,018.90 | $ 6.36 |
Class T | 1.56% | | | |
Actual | | $ 1,000.00 | $ 965.70 | $ 7.73 |
HypotheticalA | | $ 1,000.00 | $ 1,017.34 | $ 7.93 |
Class B | 2.05% | | | |
Actual | | $ 1,000.00 | $ 963.70 | $ 10.15 |
HypotheticalA | | $ 1,000.00 | $ 1,014.87 | $ 10.41 |
Class C | 2.05% | | | |
Actual | | $ 1,000.00 | $ 963.60 | $ 10.15 |
HypotheticalA | | $ 1,000.00 | $ 1,014.87 | $ 10.41 |
International Growth | .95% | | | |
Actual | | $ 1,000.00 | $ 968.50 | $ 4.71 |
HypotheticalA | | $ 1,000.00 | $ 1,020.42 | $ 4.84 |
Class I | .97% | | | |
Actual | | $ 1,000.00 | $ 968.50 | $ 4.81 |
HypotheticalA | | $ 1,000.00 | $ 1,020.32 | $ 4.94 |
Class Z | .84% | | | |
Actual | | $ 1,000.00 | $ 968.50 | $ 4.17 |
HypotheticalA | | $ 1,000.00 | $ 1,020.97 | $ 4.28 |
A 5% return per year before expenses
B Annualized expense ratio reflects expenses net of applicable fee waivers.
C Expenses are equal to each Class' annualized expense ratio, multiplied by the average account value over the period, multiplied by 184/365 (to reflect the one-half year period).
Annual Report
Investment Changes (Unaudited)
Annual Report
Asset Allocation as of October 31, 2015 |
| % of fund's
net assets | % of fund's net assets
6 months ago |
Stocks | 97.7 | 98.1 |
Short-Term Investments and Net Other Assets (Liabilities) | 2.3 | 1.9 |
Top Ten Stocks as of October 31, 2015 |
| % of fund's
net assets | % of fund's net assets
6 months ago |
Novartis AG (Switzerland, Pharmaceuticals) | 3.7 | 3.9 |
Roche Holding AG (participation certificate) (Switzerland, Pharmaceuticals) | 3.6 | 3.8 |
Nestle SA (Switzerland, Food Products) | 3.0 | 3.6 |
Reckitt Benckiser Group PLC (United Kingdom, Household Products) | 2.8 | 2.2 |
Inditex SA (Spain, Specialty Retail) | 2.8 | 2.0 |
Anheuser-Busch InBev SA NV (Belgium, Beverages) | 2.6 | 2.9 |
Novo Nordisk A/S Series B sponsored ADR (Denmark, Pharmaceuticals) | 2.5 | 2.3 |
CSL Ltd. (Australia, Biotechnology) | 2.2 | 2.1 |
Visa, Inc. Class A (United States of America, IT Services) | 2.2 | 1.6 |
ASSA ABLOY AB (B Shares) (Sweden, Building Products) | 2.2 | 1.8 |
| 27.6 | |
Market Sectors as of October 31, 2015 |
| % of fund's
net assets | % of fund's net assets
6 months ago |
Health Care | 18.5 | 17.5 |
Financials | 18.1 | 16.6 |
Consumer Staples | 15.3 | 15.0 |
Consumer Discretionary | 15.1 | 15.2 |
Industrials | 12.5 | 14.9 |
Information Technology | 11.7 | 10.5 |
Materials | 6.0 | 5.9 |
Energy | 0.3 | 1.5 |
Telecommunication Services | 0.2 | 1.0 |
Annual Report
Investments October 31, 2015
Showing Percentage of Net Assets
Common Stocks - 97.7% |
| Shares | | Value |
Australia - 3.4% |
CSL Ltd. | 486,892 | | $ 32,363,861 |
Sydney Airport unit | 1,681,347 | | 7,683,937 |
Transurban Group unit | 1,384,277 | | 10,257,556 |
TOTAL AUSTRALIA | | 50,305,354 |
Austria - 0.9% |
Andritz AG | 251,621 | | 12,672,632 |
Bailiwick of Jersey - 1.3% |
Shire PLC | 259,100 | | 19,621,870 |
Belgium - 4.2% |
Anheuser-Busch InBev SA NV | 323,891 | | 38,648,165 |
KBC Groep NV | 391,998 | | 23,880,757 |
TOTAL BELGIUM | | 62,528,922 |
Canada - 0.3% |
Pason Systems, Inc. | 334,300 | | 4,918,883 |
Cayman Islands - 1.0% |
58.com, Inc. ADR (a)(d) | 79,700 | | 4,183,453 |
Alibaba Group Holding Ltd. sponsored ADR (a) | 127,500 | | 10,688,325 |
TOTAL CAYMAN ISLANDS | | 14,871,778 |
Denmark - 3.3% |
Jyske Bank A/S (Reg.) (a) | 224,900 | | 10,979,143 |
Novo Nordisk A/S Series B sponsored ADR | 698,800 | | 37,162,184 |
TOTAL DENMARK | | 48,141,327 |
Finland - 0.3% |
Tikkurila Oyj | 211,000 | | 3,872,516 |
France - 1.0% |
Safran SA | 194,500 | | 14,773,065 |
Germany - 3.1% |
Bayer AG | 164,100 | | 21,897,919 |
Linde AG | 134,277 | | 23,293,003 |
TOTAL GERMANY | | 45,190,922 |
Hong Kong - 1.8% |
AIA Group Ltd. | 4,403,400 | | 25,818,593 |
India - 0.7% |
Housing Development Finance Corp. Ltd. | 570,836 | | 10,934,415 |
Ireland - 2.7% |
CRH PLC sponsored ADR | 688,966 | | 18,850,110 |
Common Stocks - continued |
| Shares | | Value |
Ireland - continued |
James Hardie Industries PLC: | | | |
CDI | 978,142 | | $ 12,662,146 |
sponsored ADR (d) | 651,500 | | 8,567,225 |
TOTAL IRELAND | | 40,079,481 |
Israel - 0.3% |
Azrieli Group | 99,200 | | 3,886,828 |
Italy - 0.7% |
Azimut Holding SpA | 161,600 | | 3,889,928 |
Interpump Group SpA | 470,251 | | 6,929,294 |
TOTAL ITALY | | 10,819,222 |
Japan - 14.0% |
Astellas Pharma, Inc. | 1,867,900 | | 27,111,597 |
Coca-Cola Central Japan Co. Ltd. | 240,700 | | 3,382,888 |
DENSO Corp. | 642,300 | | 29,945,752 |
East Japan Railway Co. | 127,000 | | 12,074,600 |
Fast Retailing Co. Ltd. | 30,800 | | 11,250,698 |
Hoya Corp. | 336,800 | | 13,898,651 |
Japan Tobacco, Inc. | 333,200 | | 11,532,648 |
Keyence Corp. | 32,962 | | 17,160,297 |
Mitsui Fudosan Co. Ltd. | 645,000 | | 17,552,806 |
Nintendo Co. Ltd. | 46,900 | | 7,497,744 |
OSG Corp. | 185,500 | | 3,489,287 |
Seven Bank Ltd. | 2,950,000 | | 13,441,839 |
Shinsei Bank Ltd. | 4,579,000 | | 9,601,125 |
SHO-BOND Holdings Co. Ltd. | 182,600 | | 7,251,960 |
USS Co. Ltd. | 1,222,400 | | 21,580,109 |
TOTAL JAPAN | | 206,772,001 |
Kenya - 0.2% |
Safaricom Ltd. | 23,504,000 | | 3,305,070 |
Korea (South) - 0.9% |
BGFretail Co. Ltd. | 43,338 | | 6,452,666 |
NAVER Corp. | 13,427 | | 7,055,887 |
TOTAL KOREA (SOUTH) | | 13,508,553 |
Mexico - 0.6% |
Fomento Economico Mexicano S.A.B. de CV sponsored ADR | 83,555 | | 8,279,465 |
Netherlands - 1.0% |
ING Groep NV (Certificaten Van Aandelen) | 997,564 | | 14,518,414 |
Common Stocks - continued |
| Shares | | Value |
South Africa - 1.1% |
Clicks Group Ltd. | 524,756 | | $ 3,833,574 |
Naspers Ltd. Class N | 85,400 | | 12,508,548 |
TOTAL SOUTH AFRICA | | 16,342,122 |
Spain - 4.5% |
Amadeus IT Holding SA Class A | 344,400 | | 14,679,166 |
Hispania Activos Inmobiliarios SA (a) | 215,259 | | 3,242,921 |
Inditex SA (d) | 1,094,531 | | 41,048,812 |
Merlin Properties Socimi SA | 328,600 | | 4,213,283 |
Prosegur Compania de Seguridad SA (Reg.) | 725,749 | | 3,232,183 |
TOTAL SPAIN | | 66,416,365 |
Sweden - 6.1% |
ASSA ABLOY AB (B Shares) | 1,602,483 | | 31,878,324 |
Atlas Copco AB (A Shares) (d) | 460,909 | | 12,030,445 |
Fagerhult AB | 347,753 | | 5,942,721 |
H&M Hennes & Mauritz AB (B Shares) | 401,483 | | 15,615,617 |
Intrum Justitia AB | 189,300 | | 6,802,219 |
Svenska Handelsbanken AB (A Shares) | 1,283,620 | | 17,433,460 |
TOTAL SWEDEN | | 89,702,786 |
Switzerland - 13.6% |
Credit Suisse Group AG (e)(f) | 199,196 | | 4,584,662 |
Nestle SA | 575,034 | | 43,917,645 |
Novartis AG | 605,045 | | 54,810,263 |
Roche Holding AG (participation certificate) | 194,838 | | 52,898,295 |
Schindler Holding AG: | | | |
(participation certificate) | 87,617 | | 14,235,713 |
(Reg.) | 10,980 | | 1,786,215 |
UBS Group AG | 1,398,461 | | 28,011,174 |
TOTAL SWITZERLAND | | 200,243,967 |
Taiwan - 0.9% |
Taiwan Semiconductor Manufacturing Co. Ltd. | 3,093,000 | | 13,032,276 |
United Kingdom - 14.4% |
Associated British Foods PLC | 311,000 | | 16,564,569 |
Babcock International Group PLC | 627,284 | | 9,322,083 |
BAE Systems PLC | 1,392,900 | | 9,422,262 |
Berendsen PLC | 523,573 | | 8,273,186 |
Informa PLC | 1,098,226 | | 9,616,383 |
InterContinental Hotel Group PLC ADR | 754,296 | | 30,081,324 |
Johnson Matthey PLC | 188,977 | | 7,530,801 |
Common Stocks - continued |
| Shares | | Value |
United Kingdom - continued |
Lloyds Banking Group PLC | 10,251,500 | | $ 11,635,578 |
Prudential PLC | 1,005,426 | | 23,483,228 |
Reckitt Benckiser Group PLC | 429,145 | | 41,880,483 |
Rightmove PLC | 65,000 | | 3,846,832 |
Rolls-Royce Group PLC | 518,537 | | 5,483,278 |
SABMiller PLC | 446,166 | | 27,477,990 |
Shaftesbury PLC | 277,333 | | 4,020,981 |
Unite Group PLC | 413,776 | | 4,241,883 |
TOTAL UNITED KINGDOM | | 212,880,861 |
United States of America - 15.4% |
Alphabet, Inc. Class A (a) | 26,336 | | 19,419,903 |
Autoliv, Inc. (d) | 156,569 | | 18,982,426 |
Berkshire Hathaway, Inc. Class B (a) | 96,184 | | 13,082,948 |
BorgWarner, Inc. | 184,492 | | 7,899,947 |
China Biologic Products, Inc. (a) | 63,166 | | 7,197,134 |
Domino's Pizza, Inc. | 33,790 | | 3,604,379 |
Martin Marietta Materials, Inc. | 52,600 | | 8,160,890 |
MasterCard, Inc. Class A | 303,000 | | 29,993,970 |
McGraw Hill Financial, Inc. | 92,100 | | 8,532,144 |
Mohawk Industries, Inc. (a) | 97,900 | | 19,139,450 |
Moody's Corp. | 69,100 | | 6,644,656 |
Philip Morris International, Inc. | 206,108 | | 18,219,947 |
PriceSmart, Inc. | 73,800 | | 6,345,324 |
ResMed, Inc. | 128,000 | | 7,374,080 |
Sherwin-Williams Co. | 15,000 | | 4,002,450 |
SS&C Technologies Holdings, Inc. | 210,300 | | 15,593,745 |
Visa, Inc. Class A | 415,800 | | 32,257,764 |
TOTAL UNITED STATES OF AMERICA | | 226,451,157 |
TOTAL COMMON STOCKS (Cost $1,309,769,980) |
1,439,888,845
|
Nonconvertible Preferred Stocks - 0.0% |
| | | |
United Kingdom - 0.0% |
Rolls-Royce Group PLC
(Cost $73,994) | 48,068,379 | |
74,102
|
Money Market Funds - 7.4% |
| Shares | | Value |
Fidelity Cash Central Fund, 0.18% (b) | 35,048,921 | | $ 35,048,921 |
Fidelity Securities Lending Cash Central Fund, 0.19% (b)(c) | 73,928,962 | | 73,928,962 |
TOTAL MONEY MARKET FUNDS (Cost $108,977,883) |
108,977,883
|
TOTAL INVESTMENT PORTFOLIO - 105.1% (Cost $1,418,821,857) | | 1,548,940,830 |
NET OTHER ASSETS (LIABILITIES) - (5.1)% | | (75,061,785) |
NET ASSETS - 100% | $ 1,473,879,045 |
Legend |
(a) Non-income producing |
(b) Affiliated fund that is generally available only to investment companies and other accounts managed by Fidelity Investments. The rate quoted is the annualized seven-day yield of the fund at period end. A complete unaudited listing of the fund's holdings as of its most recent quarter end is available upon request. In addition, each Fidelity Central Fund's financial statements, which are not covered by the Fund's Report of Independent Registered Public Accounting Firm, are available on the SEC's website or upon request. |
(c) Investment made with cash collateral received from securities on loan. |
(d) Security or a portion of the security is on loan at period end. |
(e) Security or a portion of the security purchased on a delayed delivery or when-issued basis. Interest rate to be determined at settlement date. |
(f) Restricted securities - Investment in securities not registered under the Securities Act of 1933 (excluding 144A issues). At the end of the period, the value of restricted securities (excluding 144A issues) amounted to $4,584,662 or 0.3% of net assets. |
Additional information on each restricted holding is as follows: |
Security | Acquisition Date | Acquisition Cost |
Credit Suisse Group AG | 10/21/15 | $ 4,723,236 |
Affiliated Central Funds |
Information regarding fiscal year to date income earned by the Fund from investments in Fidelity Central Funds is as follows: |
Fund | Income earned |
Fidelity Cash Central Fund | $ 49,088 |
Fidelity Securities Lending Cash Central Fund | 197,556 |
Total | $ 246,644 |
Other Information |
Categorizations in the Schedule of Investments are based on country or territory of incorporation. |
The following is a summary of the inputs used, as of October 31, 2015, involving the Fund's assets and liabilities carried at fair value. The inputs or methodology used for valuing securities may not be an indication of the risk associated with investing in those securities. For more information on valuation inputs, and their aggregation into the levels used in the tables below, please refer to the Investment Valuation section in the accompanying Notes to Financial Statements. |
Valuation Inputs at Reporting Date: |
Description | Total | Level 1 | Level 2 | Level 3 |
Investments in Securities: | | | | |
Equities: | | | | |
Consumer Discretionary | $ 225,120,277 | $ 162,343,718 | $ 62,776,559 | $ - |
Consumer Staples | 226,535,364 | 87,173,535 | 139,361,829 | - |
Energy | 4,918,883 | 4,918,883 | - | - |
Financials | 263,630,766 | 129,145,060 | 134,485,706 | - |
Health Care | 274,335,854 | 73,631,317 | 200,704,537 | - |
Industrials | 183,615,062 | 81,300,793 | 102,314,269 | - |
Information Technology | 171,562,530 | 133,872,213 | 37,690,317 | - |
Materials | 86,939,141 | 74,276,995 | 12,662,146 | - |
Telecommunication Services | 3,305,070 | 3,305,070 | - | - |
Money Market Funds | 108,977,883 | 108,977,883 | - | - |
Total Investments in Securities: | $ 1,548,940,830 | $ 858,945,467 | $ 689,995,363 | $ - |
The following is a summary of transfers between Level 1 and Level 2 for the period ended October 31, 2015. Transfers are assumed to have occurred at the beginning of the period, and are primarily attributable to the valuation techniques used for foreign equity securities, as discussed in the accompanying Notes to Financial Statements: |
Transfers | Total |
Level 1 to Level 2 | $ 68,602,068 |
Level 2 to Level 1 | $ 15,033,001 |
See accompanying notes which are an integral part of the financial statements.
Annual Report
Statement of Assets and Liabilities
| | October 31, 2015 |
| | |
Assets | | |
Investment in securities, at value (including securities loaned of $71,231,511) - See accompanying schedule: Unaffiliated issuers (cost $1,309,843,974) | $ 1,439,962,947 | |
Fidelity Central Funds (cost $108,977,883) | 108,977,883 | |
Total Investments (cost $1,418,821,857) | | $ 1,548,940,830 |
Receivable for fund shares sold | | 2,613,468 |
Dividends receivable | | 3,193,478 |
Distributions receivable from Fidelity Central Funds | | 26,736 |
Prepaid expenses | | 3,605 |
Other receivables | | 11,410 |
Total assets | | 1,554,789,527 |
| | |
Liabilities | | |
Payable to custodian bank | $ 669 | |
Payable for investments purchased | | |
Regular delivery | 74,296 | |
Delayed delivery | 4,723,236 | |
Payable for fund shares redeemed | 878,160 | |
Accrued management fee | 840,888 | |
Distribution and service plan fees payable | 92,259 | |
Other affiliated payables | 269,569 | |
Other payables and accrued expenses | 102,443 | |
Collateral on securities loaned, at value | 73,928,962 | |
Total liabilities | | 80,910,482 |
| | |
Net Assets | | $ 1,473,879,045 |
Net Assets consist of: | | |
Paid in capital | | $ 1,371,308,764 |
Undistributed net investment income | | 9,047,261 |
Accumulated undistributed net realized gain (loss) on investments and foreign currency transactions | | (36,661,663) |
Net unrealized appreciation (depreciation) on investments and assets and liabilities in foreign currencies | | 130,184,683 |
Net Assets | | $ 1,473,879,045 |
See accompanying notes which are an integral part of the financial statements.
Annual Report
Statement of Assets and Liabilities - continued
| | October 31, 2015 |
Calculation of Maximum Offering Price | | |
Class A: | | |
Net Asset Value and redemption price per share ($184,878,255 ÷ 16,367,440 shares) | | $ 11.30 |
| | |
Maximum offering price per share (100/94.25 of $11.30) | | $ 11.99 |
Class T: | | |
Net Asset Value and redemption price per share ($28,832,624 ÷ 2,560,965 shares) | | $ 11.26 |
| | |
Maximum offering price per share (100/96.50 of $11.26) | | $ 11.67 |
Class B: | | |
Net Asset Value and offering price per share ($799,594 ÷ 71,668 shares)A | | $ 11.16 |
| | |
Class C: | | |
Net Asset Value and offering price per share ($52,378,157 ÷ 4,709,671 shares)A | | $ 11.12 |
| | |
International Growth: | | |
Net Asset Value, offering price and redemption price per share ($938,347,837 ÷ 82,424,899 shares) | | $ 11.38 |
| | |
Class I: | | |
Net Asset Value, offering price and redemption price per share ($267,745,321 ÷ 23,560,669 shares) | | $ 11.36 |
| | |
Class Z: | | |
Net Asset Value, offering price and redemption price per share ($897,257 ÷ 78,813 shares) | | $ 11.38 |
A Redemption price per share is equal to net asset value less any applicable contingent deferred sales charge.
See accompanying notes which are an integral part of the financial statements.
Annual Report
Financial Statements - continued
Statement of Operations
| Year ended October 31, 2015 |
Investment Income | | |
Dividends | | $ 24,663,808 |
Income from Fidelity Central Funds | | 246,644 |
Income before foreign taxes withheld | | 24,910,452 |
Less foreign taxes withheld | | (2,081,814) |
Total income | | 22,828,638 |
| | |
Expenses | | |
Management fee | | |
Basic fee | $ 8,327,944 | |
Performance adjustment | 167,926 | |
Transfer agent fees | 2,302,155 | |
Distribution and service plan fees | 939,382 | |
Accounting and security lending fees | 550,149 | |
Custodian fees and expenses | 146,301 | |
Independent trustees' compensation | 4,871 | |
Registration fees | 185,556 | |
Audit | 69,990 | |
Legal | 2,556 | |
Miscellaneous | 14,108 | |
Total expenses before reductions | 12,710,938 | |
Expense reductions | (87,519) | 12,623,419 |
Net investment income (loss) | | 10,205,219 |
Realized and Unrealized Gain (Loss) | | |
Net realized gain (loss) on: | | |
Investment securities: | | |
Unaffiliated issuers (net of foreign taxes of $16,052) | (27,244,971) | |
Foreign currency transactions | (218,206) | |
Total net realized gain (loss) | | (27,463,177) |
Change in net unrealized appreciation (depreciation) on: Investment securities (net of increase in deferred foreign taxes of $6,961) | 41,313,127 | |
Assets and liabilities in foreign currencies | 137,123 | |
Total change in net unrealized appreciation (depreciation) | | 41,450,250 |
Net gain (loss) | | 13,987,073 |
Net increase (decrease) in net assets resulting from operations | | $ 24,192,292 |
See accompanying notes which are an integral part of the financial statements.
Annual Report
Statement of Changes in Net Assets
| Year ended
October 31,
2015 | Year ended
October 31,
2014 |
Increase (Decrease) in Net Assets | | |
Operations | | |
Net investment income (loss) | $ 10,205,219 | $ 8,064,649 |
Net realized gain (loss) | (27,463,177) | (8,929,624) |
Change in net unrealized appreciation (depreciation) | 41,450,250 | 17,872,842 |
Net increase (decrease) in net assets resulting from operations | 24,192,292 | 17,007,867 |
Distributions to shareholders from net investment income | (7,019,924) | (2,592,643) |
Distributions to shareholders from net realized gain | - | (513,441) |
Total distributions | (7,019,924) | (3,106,084) |
Share transactions - net increase (decrease) | 519,861,476 | 336,569,228 |
Redemption fees | 54,094 | 42,228 |
Total increase (decrease) in net assets | 537,087,938 | 350,513,239 |
| | |
Net Assets | | |
Beginning of period | 936,791,107 | 586,277,868 |
End of period (including undistributed net investment income of $9,047,261 and undistributed net investment income of $6,829,762, respectively) | $ 1,473,879,045 | $ 936,791,107 |
See accompanying notes which are an integral part of the financial statements.
Annual Report
Financial Highlights - Fidelity International Growth Fund Class A
Years ended October 31, | 2015 | 2014 | 2013 | 2012 | 2011 |
Selected Per-Share Data | | | | | |
Net asset value, beginning of period | $ 11.01 | $ 10.78 | $ 8.91 | $ 8.09 | $ 8.38 |
Income from Investment Operations | | | | |
Net investment income (loss) C | .07 | .09 | .08 | .08 | .08 |
Net realized and unrealized gain (loss) | .28 | .18 | 1.88 | .81 | (.31) |
Total from investment operations | .35 | .27 | 1.96 | .89 | (.23) |
Distributions from net investment income | (.06) | (.03) | (.08) | (.06) | (.05) |
Distributions from net realized gain | - | (.01) | (.01) | (.01) | (.01) |
Total distributions | (.06) | (.04) | (.09) | (.07) | (.06) |
Redemption fees added to paid in capitalC, G | - | - | - | - | - |
Net asset value, end of period | $ 11.30 | $ 11.01 | $ 10.78 | $ 8.91 | $ 8.09 |
Total ReturnA, B | 3.20% | 2.54% | 22.18% | 11.10% | (2.76)% |
Ratios to Average Net AssetsD, F | | | | | |
Expenses before reductions | 1.26% | 1.35% | 1.44% | 1.58% | 1.77% |
Expenses net of fee waivers, if any | 1.26% | 1.35% | 1.43% | 1.45% | 1.45% |
Expenses net of all reductions | 1.25% | 1.34% | 1.42% | 1.44% | 1.43% |
Net investment income (loss) | .66% | .84% | .80% | .99% | .92% |
Supplemental Data | | | | | |
Net assets, end of period (000 omitted) | $ 184,878 | $ 119,017 | $ 74,595 | $ 21,874 | $ 6,352 |
Portfolio turnover rateE | 26% | 27% | 32% | 32% | 68% |
A Total returns would have been lower if certain expenses had not been reduced during the applicable periods shown.
B Total returns do not include the effect of the sales charges.
C Calculated based on average shares outstanding during the period.
D Fees and expenses of any underlying Fidelity Central Funds are not included in the Fund's expense ratio. The Fund indirectly bears its proportionate share of the expenses of any underlying Fidelity Central Funds.
E Amount does not include the portfolio activity of any underlying Fidelity Central Funds.
F Expense ratios reflect operating expenses of the class. Expenses before reductions do not reflect amounts reimbursed by the investment adviser or reductions from brokerage service arrangements or reductions from other expense offset arrangements and do not represent the amount paid by the class during periods when reimbursements or reductions occur. Expenses net of fee waivers reflect expenses after reimbursement by the investment adviser but prior to reductions from brokerage service arrangements or other expense offset arrangements. Expenses net of all reductions represent the net expenses paid by the class.
G Amount represents less than $.005 per share.
See accompanying notes which are an integral part of the financial statements.
Annual Report
Financial Highlights - Fidelity International Growth Fund Class T
Years ended October 31, | 2015 | 2014 | 2013 | 2012 | 2011 |
Selected Per-Share Data | | | | | |
Net asset value, beginning of period | $ 10.96 | $ 10.75 | $ 8.89 | $ 8.08 | $ 8.38 |
Income from Investment Operations | | | | |
Net investment income (loss) C | .04 | .06 | .05 | .06 | .06 |
Net realized and unrealized gain (loss) | .27 | .18 | 1.88 | .81 | (.31) |
Total from investment operations | .31 | .24 | 1.93 | .87 | (.25) |
Distributions from net investment income | (.01) | (.02) | (.07) | (.05) | (.04) |
Distributions from net realized gain | - | (.01) | (.01) | (.01) | (.01) |
Total distributions | (.01) | (.03) | (.07) H | (.06) | (.05) |
Redemption fees added to paid in capitalC, G | - | - | - | - | - |
Net asset value, end of period | $ 11.26 | $ 10.96 | $ 10.75 | $ 8.89 | $ 8.08 |
Total ReturnA, B | 2.85% | 2.21% | 21.91% | 10.82% | (3.03)% |
Ratios to Average Net AssetsD, F | | | | | |
Expenses before reductions | 1.58% | 1.65% | 1.69% | 1.85% | 2.03% |
Expenses net of fee waivers, if any | 1.58% | 1.65% | 1.69% | 1.70% | 1.70% |
Expenses net of all reductions | 1.58% | 1.65% | 1.68% | 1.69% | 1.68% |
Net investment income (loss) | .33% | .53% | .54% | .74% | .67% |
Supplemental Data | | | | | |
Net assets, end of period (000 omitted) | $ 28,833 | $ 26,369 | $ 23,118 | $ 10,690 | $ 2,917 |
Portfolio turnover rateE | 26% | 27% | 32% | 32% | 68% |
A Total returns would have been lower if certain expenses had not been reduced during the applicable periods shown.
B Total returns do not include the effect of the sales charges.
C Calculated based on average shares outstanding during the period.
D Fees and expenses of any underlying Fidelity Central Funds are not included in the Fund's expense ratio. The Fund indirectly bears its proportionate share of the expenses of any underlying Fidelity Central Funds.
E Amount does not include the portfolio activity of any underlying Fidelity Central Funds.
F Expense ratios reflect operating expenses of the class. Expenses before reductions do not reflect amounts reimbursed by the investment adviser or reductions from brokerage service arrangements or reductions from other expense offset arrangements and do not represent the amount paid by the class during periods when reimbursements or reductions occur. Expenses net of fee waivers reflect expenses after reimbursement by the investment adviser but prior to reductions from brokerage service arrangements or other expense offset arrangements. Expenses net of all reductions represent the net expenses paid by the class.
G Amount represents less than $.005 per share.
H Total distributions of $.07 per share is comprised of distributions from net investment income of $0.69 and distributions from net realized gain of $.005 per share.
See accompanying notes which are an integral part of the financial statements.
Annual Report
Financial Highlights - Fidelity International Growth Fund Class B
Years ended October 31, | 2015 | 2014 | 2013 | 2012 | 2011 |
Selected Per-Share Data | | | | | |
Net asset value, beginning of period | $ 10.91 | $ 10.73 | $ 8.88 | $ 8.06 | $ 8.36 |
Income from Investment Operations | | | | |
Net investment income (loss) C | (.02) | - G | - G | .02 | .01 |
Net realized and unrealized gain (loss) | .27 | .19 | 1.89 | .80 | (.30) |
Total from investment operations | .25 | .19 | 1.89 | .82 | (.29) |
Distributions from net investment income | - | - | (.03) | - | (.01) |
Distributions from net realized gain | - | (.01) | (.01) | - | - G |
Total distributions | - | (.01) | (.04) | - | (.01) |
Redemption fees added to paid in capitalC, G | - | - | - | - | - |
Net asset value, end of period | $ 11.16 | $ 10.91 | $ 10.73 | $ 8.88 | $ 8.06 |
Total ReturnA, B | 2.29% | 1.76% | 21.35% | 10.17% | (3.47)% |
Ratios to Average Net AssetsD, F | | | | | |
Expenses before reductions | 2.07% | 2.14% | 2.19% | 2.35% | 2.55% |
Expenses net of fee waivers, if any | 2.07% | 2.14% | 2.18% | 2.20% | 2.20% |
Expenses net of all reductions | 2.06% | 2.14% | 2.17% | 2.19% | 2.18% |
Net investment income (loss) | (.15)% | .04% | .05% | .24% | .17% |
Supplemental Data | | | | | |
Net assets, end of period (000 omitted) | $ 800 | $ 1,404 | $ 1,579 | $ 1,116 | $ 473 |
Portfolio turnover rateE | 26% | 27% | 32% | 32% | 68% |
A Total returns would have been lower if certain expenses had not been reduced during the applicable periods shown.
B Total returns do not include the effect of the contingent deferred sales charge.
C Calculated based on average shares outstanding during the period.
D Fees and expenses of any underlying Fidelity Central Funds are not included in the Fund's expense ratio. The Fund indirectly bears its proportionate share of the expenses of any underlying Fidelity Central Funds.
E Amount does not include the portfolio activity of any underlying Fidelity Central Funds.
F Expense ratios reflect operating expenses of the class. Expenses before reductions do not reflect amounts reimbursed by the investment adviser or reductions from brokerage service arrangements or reductions from other expense offset arrangements and do not represent the amount paid by the class during periods when reimbursements or reductions occur. Expenses net of fee waivers reflect expenses after reimbursement by the investment adviser but prior to reductions from brokerage service arrangements or other expense offset arrangements. Expenses net of all reductions represent the net expenses paid by the class.
G Amount represents less than $.005 per share.
See accompanying notes which are an integral part of the financial statements.
Annual Report
Financial Highlights - Fidelity International Growth Fund Class C
Years ended October 31, | 2015 | 2014 | 2013 | 2012 | 2011 |
Selected Per-Share Data | | | | | |
Net asset value, beginning of period | $ 10.87 | $ 10.69 | $ 8.84 | $ 8.03 | $ 8.34 |
Income from Investment Operations | | | | |
Net investment income (loss) C | (.02) | .01 | .01 | .02 | .01 |
Net realized and unrealized gain (loss) | .27 | .18 | 1.87 | .80 | (.31) |
Total from investment operations | .25 | .19 | 1.88 | .82 | (.30) |
Distributions from net investment income | - | - | (.02) | (.01) | (.01) |
Distributions from net realized gain | - | (.01) | (.01) | (.01) | (.01) |
Total distributions | - | (.01) | (.03) | (.01) I | (.01) H |
Redemption fees added to paid in capitalC, G | - | - | - | - | - |
Net asset value, end of period | $ 11.12 | $ 10.87 | $ 10.69 | $ 8.84 | $ 8.03 |
Total ReturnA, B | 2.30% | 1.77% | 21.29% | 10.27% | (3.57)% |
Ratios to Average Net AssetsD, F | | | | | |
Expenses before reductions | 2.06% | 2.12% | 2.19% | 2.33% | 2.52% |
Expenses net of fee waivers, if any | 2.06% | 2.12% | 2.18% | 2.20% | 2.20% |
Expenses net of all reductions | 2.05% | 2.12% | 2.17% | 2.19% | 2.18% |
Net investment income (loss) | (.15)% | .06% | .05% | .24% | .17% |
Supplemental Data | | | | | |
Net assets, end of period (000 omitted) | $ 52,378 | $ 32,737 | $ 17,196 | $ 5,648 | $ 2,767 |
Portfolio turnover rateE | 26% | 27% | 32% | 32% | 68% |
A Total returns would have been lower if certain expenses had not been reduced during the applicable periods shown.
B Total returns do not include the effect of the contingent deferred sales charge.
C Calculated based on average shares outstanding during the period.
D Fees and expenses of any underlying Fidelity Central Funds are not included in the Fund's expense ratio. The Fund indirectly bears its proportionate share of the expenses of any underlying Fidelity Central Funds.
E Amount does not include the portfolio activity of any underlying Fidelity Central Funds.
F Expense ratios reflect operating expenses of the class. Expenses before reductions do not reflect amounts reimbursed by the investment adviser or reductions from brokerage service arrangements or reductions from other expense offset arrangements and do not represent the amount paid by the class during periods when reimbursements or reductions occur. Expenses net of fee waivers reflect expenses after reimbursement by the investment adviser but prior to reductions from brokerage service arrangements or other expense offset arrangements. Expenses net of all reductions represent the net expenses paid by the class.
G Amount represents less than $.005 per share.
H Total distributions of $.01 per share is comprised of distributions from net investment income of $.008 and distributions from net realized gain of $.005 per share.
I Total distributions of $.01 per share is comprised of distributions from net investment income of $.007 and distributions from net realized gain of $.006 per share.
See accompanying notes which are an integral part of the financial statements.
Annual Report
Financial Highlights - Fidelity International Growth Fund
Years ended October 31, | 2015 | 2014 | 2013 | 2012 | 2011 |
Selected Per-Share Data | | | | | |
Net asset value, beginning of period | $ 11.10 | $ 10.84 | $ 8.95 | $ 8.12 | $ 8.40 |
Income from Investment Operations | | | | |
Net investment income (loss) B | .11 | .13 | .11 | .11 | .10 |
Net realized and unrealized gain (loss) | .26 | .19 | 1.88 | .81 | (.30) |
Total from investment operations | .37 | .32 | 1.99 | .92 | (.20) |
Distributions from net investment income | (.09) | (.05) | (.10) | (.08) | (.07) |
Distributions from net realized gain | - | (.01) | (.01) | (.01) | (.01) |
Total distributions | (.09) | (.06) | (.10) G | (.09) | (.08) |
Redemption fees added to paid in capitalB, F | - | - | - | - | - |
Net asset value, end of period | $ 11.38 | $ 11.10 | $ 10.84 | $ 8.95 | $ 8.12 |
Total ReturnA | 3.36% | 2.96% | 22.48% | 11.41% | (2.47)% |
Ratios to Average Net AssetsC, E | | | | | |
Expenses before reductions | .97% | 1.04% | 1.13% | 1.28% | 1.52% |
Expenses net of fee waivers, if any | .97% | 1.04% | 1.13% | 1.20% | 1.20% |
Expenses net of all reductions | .96% | 1.04% | 1.11% | 1.19% | 1.18% |
Net investment income (loss) | .94% | 1.14% | 1.11% | 1.24% | 1.17% |
Supplemental Data | | | | | |
Net assets, end of period (000 omitted) | $ 938,348 | $ 635,607 | $ 430,914 | $ 149,526 | $ 53,437 |
Portfolio turnover rateD | 26% | 27% | 32% | 32% | 68% |
A Total returns would have been lower if certain expenses had not been reduced during the applicable periods shown.
B Calculated based on average shares outstanding during the period.
C Fees and expenses of any underlying Fidelity Central Funds are not included in the Fund's expense ratio. The Fund indirectly bears its proportionate share of the expenses of any underlying Fidelity Central Funds.
D Amount does not include the portfolio activity of any underlying Fidelity Central Funds.
E Expense ratios reflect operating expenses of the class. Expenses before reductions do not reflect amounts reimbursed by the investment adviser or reductions from brokerage service arrangements or reductions from other expense offset arrangements and do not represent the amount paid by the class during periods when reimbursements or reductions occur. Expenses net of fee waivers reflect expenses after reimbursement by the investment adviser but prior to reductions from brokerage service arrangements or other expense offset arrangements. Expenses net of all reductions represent the net expenses paid by the class.
F Amount represents less than $.005 per share.
G Total distributions of $.10 per share is comprised of distributions from net investment income of $.097 and distributions from net realized gain of $.005 per share.
See accompanying notes which are an integral part of the financial statements.
Annual Report
Financial Highlights - Fidelity International Growth Fund Class I
Years ended October 31, | 2015 | 2014 | 2013 | 2012 | 2011 |
Selected Per-Share Data | | | | | |
Net asset value, beginning of period | $ 11.08 | $ 10.84 | $ 8.94 | $ 8.12 | $ 8.40 |
Income from Investment Operations | | | | |
Net investment income (loss) B | .11 | .13 | .11 | .10 | .10 |
Net realized and unrealized gain (loss) | .27 | .18 | 1.90 | .81 | (.30) |
Total from investment operations | .38 | .31 | 2.01 | .91 | (.20) |
Distributions from net investment income | (.10) | (.06) | (.10) | (.08) | (.07) |
Distributions from net realized gain | - | (.01) | (.01) | (.01) | (.01) |
Total distributions | (.10) | (.07) | (.11) | (.09) | (.08) |
Redemption fees added to paid in capitalB, F | - | - | - | - | - |
Net asset value, end of period | $ 11.36 | $ 11.08 | $ 10.84 | $ 8.94 | $ 8.12 |
Total ReturnA | 3.41% | 2.84% | 22.66% | 11.28% | (2.47)% |
Ratios to Average Net AssetsC, E | | | | | |
Expenses before reductions | .98% | 1.04% | 1.11% | 1.27% | 1.50% |
Expenses net of fee waivers, if any | .98% | 1.04% | 1.11% | 1.20% | 1.20% |
Expenses net of all reductions | .97% | 1.04% | 1.09% | 1.19% | 1.18% |
Net investment income (loss) | .94% | 1.14% | 1.13% | 1.24% | 1.17% |
Supplemental Data | | | | | |
Net assets, end of period (000 omitted) | $ 267,745 | $ 121,554 | $ 38,771 | $ 3,992 | $ 493 |
Portfolio turnover rateD | 26% | 27% | 32% | 32% | 68% |
A Total returns would have been lower if certain expenses had not been reduced during the applicable periods shown.
B Calculated based on average shares outstanding during the period.
C Fees and expenses of any underlying Fidelity Central Funds are not included in the Fund's expense ratio. The Fund indirectly bears its proportionate share of the expenses of any underlying Fidelity Central Funds.
D Amount does not include the portfolio activity of any underlying Fidelity Central Funds.
E Expense ratios reflect operating expenses of the class. Expenses before reductions do not reflect amounts reimbursed by the investment adviser or reductions from brokerage service arrangements or reductions from other expense offset arrangements and do not represent the amount paid by the class during periods when reimbursements or reductions occur. Expenses net of fee waivers reflect expenses after reimbursement by the investment adviser but prior to reductions from brokerage service arrangements or other expense offset arrangements. Expenses net of all reductions represent the net expenses paid by the class.
F Amount represents less than $.005 per share.
See accompanying notes which are an integral part of the financial statements.
Annual Report
Financial Highlights - Fidelity International Growth Fund Class Z
Years ended October 31, | 2015 | 2014 | 2013 G |
Selected Per-Share Data | | | |
Net asset value, beginning of period | $ 11.10 | $ 10.84 | $ 10.26 |
Income from Investment Operations | | | |
Net investment income (loss) D | .12 | .14 | .02 |
Net realized and unrealized gain (loss) | .27 | .19 | .56 |
Total from investment operations | .39 | .33 | .58 |
Distributions from net investment income | (.11) | (.06) | - |
Distributions from net realized gain | - | (.01) | - |
Total distributions | (.11) | (.07) | - |
Redemption fees added to paid in capitalD, I | - | - | - |
Net asset value, end of period | $ 11.38 | $ 11.10 | $ 10.84 |
Total ReturnB, C | 3.52% | 3.07% | 5.65% |
Ratios to Average Net AssetsE, H | | | |
Expenses before reductions | .84% | .88% | .94%A |
Expenses net of fee waivers, if any | .84% | .88% | .94%A |
Expenses net of all reductions | .83% | .88% | .93%A |
Net investment income (loss) | 1.07% | 1.30% | .65%A |
Supplemental Data | | | |
Net assets, end of period (000 omitted) | $ 897 | $ 104 | $ 106 |
Portfolio turnover rateF | 26% | 27% | 32% |
A Annualized
B Total returns for periods of less than one year are not annualized.
C Total returns would have been lower if certain expenses had not been reduced during the applicable periods shown.
D Calculated based on average shares outstanding during the period.
E Fees and expenses of any underlying Fidelity Central Funds are not included in the Fund's expense ratio. The Fund indirectly bears its proportionate share of the expenses of any underlying Fidelity Central Funds.
F Amount does not include the portfolio activity of any underlying Fidelity Central Funds.
G For the period August 13, 2013 (commencement of sale of shares) to October 31, 2013.
H Expense ratios reflect operating expenses of the class. Expenses before reductions do not reflect amounts reimbursed by the investment adviser or reductions from brokerage service arrangements or reductions from other expense offset arrangements and do not represent the amount paid by the class during periods when reimbursements or reductions occur. Expenses net of fee waivers reflect expenses after reimbursement by the investment adviser but prior to reductions from brokerage service arrangements or other expense offset arrangements. Expenses net of all reductions represent the net expenses paid by the class.
I Amount represents less than $.005 per share.
See accompanying notes which are an integral part of the financial statements.
Annual Report
For the period ended October 31, 2015
1. Organization.
Fidelity International Growth Fund (the Fund) is a fund of Fidelity Investment Trust (the Trust) and is authorized to issue an unlimited number of shares. The Trust is registered under the Investment Company Act of 1940, as amended (the 1940 Act), as an open-end management investment company organized as a Massachusetts business trust. The Fund offers Class A, Class T, Class C, International Growth, Class I (formerly Institutional Class) and Class Z shares, each of which, along with Class B shares, has equal rights as to assets and voting privileges. Class B shares are closed to new accounts and additional purchases, except for exchanges and reinvestments. Each class has exclusive voting rights with respect to matters that affect that class. Class B shares will automatically convert to Class A shares after a holding period of seven years from the initial date of purchase.
2. Investments in Fidelity Central Funds.
The Fund invests in Fidelity Central Funds, which are open-end investment companies generally available only to other investment companies and accounts managed by the investment adviser and its affiliates. The Fund's Schedule of Investments lists each of the Fidelity Central Funds held as of period end, if any, as an investment of the Fund, but does not include the underlying holdings of each Fidelity Central Fund. As an Investing Fund, the Fund indirectly bears its proportionate share of the expenses of the underlying Fidelity Central Funds.
The Money Market Central Funds seek preservation of capital and current income and are managed by Fidelity Investments Money Management, Inc. (FIMM), an affiliate of the investment adviser. Annualized expenses of the Money Market Central Funds as of their most recent shareholder report date are less than .005%.
A complete unaudited list of holdings for each Fidelity Central Fund is available upon request or at the Securities and Exchange Commission (the SEC) website at www.sec.gov. In addition, the financial statements of the Fidelity Central Funds, which are not covered by the Fund's Report of Independent Registered Public Accounting Firm, are available on the SEC website or upon request.
3. Significant Accounting Policies.
The financial statements have been prepared in conformity with accounting principles generally accepted in the United States of America (GAAP), which require management to make certain estimates and assumptions at the date of the financial statements. Actual results could differ from those estimates. Subsequent events, if any, through the
Annual Report
3. Significant Accounting Policies - continued
date that the financial statements were issued have been evaluated in the preparation of the financial statements. The following summarizes the significant accounting policies of the Fund:
Investment Valuation. Investments are valued as of 4:00 p.m. Eastern time on the last calendar day of the period. The Board of Trustees (the Board) has delegated the day to day responsibility for the valuation of the Fund's investments to the Fidelity Management & Research Company (FMR) Fair Value Committee (the Committee). In accordance with valuation policies and procedures approved by the Board, the Fund attempts to obtain prices from one or more third party pricing vendors or brokers to value its investments. When current market prices, quotations or currency exchange rates are not readily available or reliable, investments will be fair valued in good faith by the Committee, in accordance with procedures adopted by the Board. Factors used in determining fair value vary by investment type and may include market or investment specific events. The frequency with which these procedures are used cannot be predicted and they may be utilized to a significant extent. The Committee oversees the Fund's valuation policies and procedures and reports to the Board on the Committee's activities and fair value determinations. The Board monitors the appropriateness of the procedures used in valuing the Fund's investments and ratifies the fair value determinations of the Committee.
The Fund categorizes the inputs to valuation techniques used to value its investments into a disclosure hierarchy consisting of three levels as shown below:
Level 1 - quoted prices in active markets for identical investments
Level 2 - other significant observable inputs (including quoted prices for similar investments, interest rates, prepayment speeds, etc.)
Level 3 - unobservable inputs (including the Fund's own assumptions based on the best information available)
Valuation techniques used to value the Fund's investments by major category are as follows:
Equity securities, including restricted securities, for which market quotations are readily available, are valued at the last reported sale price or official closing price as reported by a third party pricing vendor on the primary market or exchange on which they are traded and are categorized as Level 1 in the hierarchy. In the event there were no sales during the day or closing prices are not available, securities are valued at the last quoted bid price or may be valued using the last available price and are generally categorized as
Annual Report
Notes to Financial Statements - continued
3. Significant Accounting Policies - continued
Investment Valuation - continued
Level 2 in the hierarchy. For foreign equity securities, when market or security specific events arise, comparisons to the valuation of American Depositary Receipts (ADRs), futures contracts, Exchange-Traded Funds (ETFs) and certain indexes as well as quoted prices for similar securities may be used and would be categorized as Level 2 in the hierarchy. Utilizing these techniques may result in transfers between Level 1 and Level 2. For equity securities, including restricted securities, where observable inputs are limited, assumptions about market activity and risk are used and these securities may be categorized as Level 3 in the hierarchy.
Investments in open-end mutual funds, including the Fidelity Central Funds, are valued at their closing net asset value (NAV) each business day and are categorized as Level 1 in the hierarchy.
Changes in valuation techniques may result in transfers in or out of an assigned level within the disclosure hierarchy. The aggregate value of investments by input level as of October 31, 2015, including information on transfers between Levels 1 and 2, is included at the end of the Fund's Schedule of Investments.
Foreign Currency. The Fund may use foreign currency contracts to facilitate transactions in foreign-denominated securities. Gains and losses from these transactions may arise from changes in the value of the foreign currency or if the counterparties do not perform under the contracts' terms.
Foreign-denominated assets, including investment securities, and liabilities are translated into U.S. dollars at the exchange rates at period end. Purchases and sales of investment securities, income and dividends received and expenses denominated in foreign currencies are translated into U.S. dollars at the exchange rate in effect on the transaction date.
The effects of exchange rate fluctuations on investments are included with the net realized and unrealized gain (loss) on investment securities. Other foreign currency transactions resulting in realized and unrealized gain (loss) are disclosed separately.
Investment Transactions and Income. For financial reporting purposes, the Fund's investment holdings and NAV include trades executed through the end of the last business day of the period. The NAV per share for processing shareholder transactions is calculated as of the close of business of the New York Stock Exchange (NYSE), normally 4:00 p.m. Eastern time and includes trades executed through the end of the prior business day. Gains and losses on securities sold are determined on the basis of identified cost and may include proceeds received from litigation. Dividend income is recorded on
Annual Report
3. Significant Accounting Policies - continued
Investment Transactions and Income - continued
the ex-dividend date, except for certain dividends from foreign securities where the ex-dividend date may have passed, which are recorded as soon as the Fund is informed of the ex-dividend date. Non-cash dividends included in dividend income, if any, are recorded at the fair market value of the securities received. Income and capital gain distributions from Fidelity Central Funds, if any, are recorded on the ex-dividend date. Distributions received on securities that represent a return of capital or capital gain are recorded as a reduction of cost of investments and/or as a realized gain. Subsequent to ex-dividend date the Fund determines the components of these distributions, based upon receipt of tax filings or other correspondence relating to the underlying investment. Interest income is accrued as earned and includes coupon interest and amortization of premium and accretion of discount on debt securities as applicable. Investment income is recorded net of foreign taxes withheld where recovery of such taxes is uncertain.
Class Allocations and Expenses. Investment income, realized and unrealized capital gains and losses, common expenses of the Fund, and certain fund-level expense reductions, if any, are allocated daily on a pro-rata basis to each class based on the relative net assets of each class to the total net assets of the Fund. Each class differs with respect to transfer agent and distribution and service plan fees incurred. Certain expense reductions may also differ by class. For the reporting period, the allocated portion of income and expenses to each class as a percent of its average net assets may vary due to the timing of recording these transactions in relation to fluctuating net assets of the classes. Expenses directly attributable to a fund are charged to that fund. Expenses attributable to more than one fund are allocated among the respective funds on the basis of relative net assets or other appropriate methods. Expense estimates are accrued in the period to which they relate and adjustments are made when actual amounts are known.
Income Tax Information and Distributions to Shareholders. Each year, the Fund intends to qualify as a regulated investment company under Subchapter M of the Internal Revenue Code, including distributing substantially all of its taxable income and realized gains. As a result, no provision for U.S. Federal income taxes is required. As of October 31, 2015, the Fund did not have any unrecognized tax benefits in the financial statements; nor is the Fund aware of any tax positions for which it is reasonably possible that the total amounts of unrecognized tax benefits will significantly change in the next twelve months. The Fund files a U.S. federal tax return, in addition to state and local tax returns as required. The Fund's federal income tax returns are subject to examination by the Internal Revenue Service (IRS) for a period of three fiscal years after they are filed. State and local tax returns may be subject to examination for an additional fiscal year depending on the jurisdiction. Foreign taxes are provided for based on the Fund's understanding of the tax rules and rates that exist in the foreign markets in which it
Annual Report
Notes to Financial Statements - continued
3. Significant Accounting Policies - continued
Income Tax Information and Distributions to Shareholders - continued
invests. The Fund is subject to a tax imposed on capital gains by certain countries in which it invests. An estimated deferred tax liability for net unrealized appreciation on the applicable securities is included in Other payables and accrued expenses on the Statement of Assets & Liabilities.
Distributions are declared and recorded on the ex-dividend date. Income dividends and capital gain distributions are declared separately for each class. Income and capital gain distributions are determined in accordance with income tax regulations, which may differ from GAAP. In addition, the Fund claimed a portion of the payment made to redeeming shareholders as a distribution for income tax purposes.
Capital accounts within the financial statements are adjusted for permanent book-tax differences. These adjustments have no impact on net assets or the results of operations. Capital accounts are not adjusted for temporary book-tax differences which will reverse in a subsequent period.
Book-tax differences are primarily due to foreign currency transactions, certain foreign taxes, passive foreign investment companies (PFIC), partnerships, capital loss carryforwards, and losses deferred due to wash sales.
The federal tax cost of investment securities and unrealized appreciation (depreciation) as of period end were as follows:
Gross unrealized appreciation | $ 171,926,225 |
Gross unrealized depreciation | (45,542,097) |
Net unrealized appreciation (depreciation) on securities | $ 126,384,128 |
Tax Cost | $ 1,422,556,702 |
The tax-based components of distributable earnings as of period end were as follows:
Undistributed ordinary income | $ 9,875,277 |
Capital loss carryforward | $ (33,754,835) |
Net unrealized appreciation (depreciation) on securities and other investments | $ 126,454,576 |
Capital loss carryforwards are only available to offset future capital gains of the Fund to the extent provided by regulations and may be limited. Under the Regulated Investment Company Modernization Act of 2010 (the Act), the Fund is permitted to carry forward capital losses incurred in taxable years beginning after December 22, 2010 for an unlimited period and such capital losses are required to be used prior to any losses that expire.
Annual Report
3. Significant Accounting Policies - continued
Income Tax Information and Distributions to Shareholders - continued
The capital loss carryforward information presented below, including any applicable limitation, is estimated as of fiscal period end and is subject to adjustment.
No expiration | |
Short-term | (26,434,969) |
Long-term | (7,319,866) |
Total no expiration | (33,754,835) |
The tax character of distributions paid was as follows:
| October 31, 2015 | October 31, 2014 |
Ordinary Income | $ 7,019,924 | $ 2,592,642 |
Long-term Capital Gains | - | 513,442 |
Total | $ 7,019,924 | $ 3,106,084 |
Short-Term Trading (Redemption) Fees. Shares held by investors in the Fund less than 30 days may have been subject to a redemption fee equal to 1.00% of the NAV of shares redeemed. All redemption fees, which reduce the proceeds of the shareholder redemption, are retained by the Fund and accounted for as an addition to paid in capital.
Delayed Delivery Transactions and When-Issued Securities. During the period, the Fund transacted in securities on a delayed delivery or when-issued basis. Payment and delivery may take place after the customary settlement period for that security. The price of the underlying securities and the date when the securities will be delivered and paid for are fixed at the time the transaction is negotiated. The securities purchased on a delayed delivery or when-issued basis are identified as such in the Fund's Schedule of Investments. With respect to purchase commitments, the Fund identifies securities as segregated in its records with a value at least equal to the amount of the commitment. Losses may arise due to changes in the value of the underlying securities or if the counterparty does not perform under the contract's terms, or if the issuer does not issue the securities due to political, economic, or other factors.
Restricted Securities. The Fund may invest in securities that are subject to legal or contractual restrictions on resale. These securities generally may be resold in transactions exempt from registration or to the public if the securities are registered. Disposal of these securities may involve time-consuming negotiations and expense, and prompt sale at an acceptable price may be difficult. Information regarding restricted securities is included at the end of the Fund's Schedule of Investments.
Annual Report
Notes to Financial Statements - continued
4. Purchases and Sales of Investments.
Purchases and sales of securities, other than short-term securities, aggregated $817,391,288 and $297,421,341, respectively.
5. Fees and Other Transactions with Affiliates.
Management Fee. Fidelity Management & Research Company (the investment adviser) and its affiliates provide the Fund with investment management related services for which the Fund pays a monthly management fee. The management fee is the sum of an individual fund fee rate that is based on an annual rate of .45% of the Fund's average net assets and an annualized group fee rate that averaged .25% during the period. The group fee rate is based upon the average net assets of all the mutual funds advised by the investment adviser, including any mutual funds previously advised by the investment adviser that are currently advised by Fidelity SelectCo, LLC, an affiliate of the investment adviser. The group fee rate decreases as assets under management increase and increases as assets under management decrease. In addition, the management fee is subject to a performance adjustment (up to a maximum of ± .20% of the Fund's average net assets over a 36 month performance period). The upward or downward adjustment to the management fee is based on the relative investment performance of International Growth as compared to its benchmark index, the MSCI EAFE Growth Index, over the same 36 month performance period. For the reporting period, the total annual management fee rate, including the performance adjustment, was .71% of the Fund's average net assets. The performance adjustment included in the management fee rate may be higher or lower than the maximum performance adjustment rate due to the difference between the average net assets for the reporting and performance periods.
Distribution and Service Plan Fees. In accordance with Rule 12b-1 of the 1940 Act, the Fund has adopted separate Distribution and Service Plans for each class of shares. Certain classes pay Fidelity Distributors Corporation (FDC), an affiliate of the investment adviser, separate Distribution and Service Fees, each of which is based on an annual percentage of each class' average net assets. In addition, FDC may pay financial intermediaries for selling shares of the Fund and providing shareholder support services. For the period, the Distribution and Service Fee rates, total fees and amounts retained by FDC were as follows:
| Distribution
Fee | Service
Fee | Total Fees | Retained
by FDC |
Class A | -% | .25% | $ 372,877 | $ 7,701 |
Class T | .25% | .25% | 136,338 | 179 |
Class B | .75% | .25% | 10,860 | 8,157 |
Class C | .75% | .25% | 419,307 | 145,878 |
| | | $ 939,382 | $ 161,915 |
Annual Report
5. Fees and Other Transactions with Affiliates - continued
Sales Load. FDC may receive a front-end sales charge of up to 5.75% for selling Class A shares and 3.50% for selling Class T shares, some of which is paid to financial intermediaries for selling shares of the Fund. Depending on the holding period, FDC may receive contingent deferred sales charges levied on Class A, Class T, Class B, and Class C redemptions. The deferred sales charges range from 5.00% to 1.00% for Class B shares, 1.00% for Class C shares, 1.00% for certain purchases of Class A shares and .25% for certain purchases of Class T shares.
For the period, sales charge amounts retained by FDC were as follows:
| Retained
by FDC |
Class A | $ 94,764 |
Class T | 15,334 |
Class BA | 413 |
Class CA | 7,496 |
| $ 118,007 |
A When Class B and Class C shares are initially sold, FDC pays commissions from its own resources to financial intermediaries through which the sales are made.
Transfer Agent Fees. Fidelity Investments Institutional Operations Company, Inc., (FIIOC), an affiliate of the investment adviser, is the transfer, dividend disbursing and shareholder servicing agent for each class of the Fund. FIIOC receives account fees and asset-based fees that vary according to the account size and type of account of the shareholders of the respective classes of the Fund, except for Class Z. FIIOC receives an asset-based fee of Class Z's average net assets. FIIOC pays for typesetting, printing and mailing of shareholder reports, except proxy statements.
For the period, transfer agent fees for each class were as follows:
| Amount | % of
Class-Level Average
Net Assets |
Class A | $ 327,480 | .22 |
Class T | 80,017 | .29 |
Class B | 2,930 | .27 |
Class C | 115,354 | .27 |
International Growth | 1,419,079 | .18 |
Class I | 357,209 | .19 |
Class Z | 86 | .05 |
| $ 2,302,155 | |
Annual Report
Notes to Financial Statements - continued
5. Fees and Other Transactions with Affiliates - continued
Accounting and Security Lending Fees. Fidelity Service Company, Inc. (FSC), an affiliate of the investment adviser, maintains the Fund's accounting records. The accounting fee is based on the level of average net assets for each month. Under a separate contract, FSC administers the security lending program. The security lending fee is based on the number and duration of lending transactions.
Brokerage Commissions. The Fund placed a portion of its portfolio transactions with brokerage firms which are affiliates of the investment adviser. Brokerage commissions are included in net realized gain (loss) and change in net unrealized appreciation (depreciation) in the Statement of Operations. The commissions paid to these affiliated firms were $1,335 for the period.
6. Committed Line of Credit.
The Fund participates with other funds managed by the investment adviser or an affiliate in a $4.25 billion credit facility (the "line of credit") to be utilized for temporary or emergency purposes to fund shareholder redemptions or for other short-term liquidity purposes. The Fund has agreed to pay commitment fees on its pro-rata portion of the line of credit, which amounted to $1,622 and is reflected in Miscellaneous expenses on the Statement of Operations. During the period, the Fund did not borrow on this line of credit.
7. Security Lending.
The Fund lends portfolio securities through a lending agent from time to time in order to earn additional income. For equity securities, a lending agent is used and may loan securities to certain qualified borrowers, including Fidelity Capital Markets (FCM), a broker-dealer affiliated with the Fund. On the settlement date of the loan, the Fund receives collateral (in the form of U.S. Treasury obligations, letters of credit and/or cash) against the loaned securities and maintains collateral in an amount not less than 100% of the market value of the loaned securities during the period of the loan. The market value of the loaned securities is determined at the close of business of the Fund and any additional required collateral is delivered to the Fund on the next business day. The Fund or borrower may terminate the loan at any time, and if the borrower defaults on its obligation to return the securities loaned because of insolvency or other reasons, the Fund may apply collateral received from the borrower against the obligation. The Fund may experience delays and costs in recovering the securities loaned. Any cash collateral received is invested in the Fidelity Securities Lending Cash Central Fund. The value of loaned securities and cash collateral at period end are disclosed on the Fund's Statement of Assets and Liabilities. The value of securities loaned to FCM at period end was $2,824,892. Security lending income represents the income earned on investing cash
Annual Report
7. Security Lending - continued
collateral, less rebates paid to borrowers and any lending agent fees associated with the loan, plus any premium payments received for lending certain types of securities. Security lending income is presented in the Statement of Operations as a component of income from Fidelity Central Funds. Total security lending income during the period amounted to $197,556, including $7,864 from securities loaned to FCM.
8. Expense Reductions.
Commissions paid to certain brokers with whom the investment adviser, or its affiliates, places trades on behalf of the Fund include an amount in addition to trade execution, which may be rebated back to the Fund to offset certain expenses. This amount totaled $66,064 for the period. In addition, through arrangements with the Fund's custodian, credits realized as a result of certain uninvested cash balances were used to reduce the Fund's expenses. During the period, these credits reduced the Fund's custody expenses by $39.
In addition, during the period the investment adviser reimbursed and/or waived a portion of fund-level operating expenses in the amount of $5,134 and a portion of class-level operating expenses as follows:
| Amount |
Class A | $ 1,835 |
Class T | 148 |
Class B | 6 |
Class C | 454 |
International Growth | 11,998 |
Class I | 1,841 |
| $ 16,282 |
9. Distributions to Shareholders.
Distributions to shareholders of each class were as follows:
Years ended October 31, | 2015 | 2014 |
From net investment income | | |
Class A | $ 684,914 | $ 253,092 |
Class T | 29,128 | 40,595 |
International Growth | 5,239,951 | 2,051,403 |
Class I | 1,064,923 | 246,949 |
Class Z | 1,008 | 604 |
Total | $ 7,019,924 | $ 2,592,643 |
Annual Report
Notes to Financial Statements - continued
9. Distributions to Shareholders - continued
Years ended October 31, | 2015 | 2014 |
From net realized gain | | |
Class A | $ - | $ 66,995 |
Class T | - | 20,298 |
Class B | - | 1,337 |
Class C | - | 16,479 |
International Growth | - | 369,252 |
Class I | - | 38,992 |
Class Z | - | 88 |
Total | $ - | $ 513,441 |
10. Share Transactions.
Share transactions for each class were as follows and may contain automatic conversions between classes or exchanges between funds:
| Shares | Dollars |
Years ended October 31, | 2015 | 2014 | 2015 | 2014 |
Class A | | | | |
Shares sold | 9,298,452 | 6,584,484 | $ 105,707,223 | $ 72,326,606 |
Reinvestment of distributions | 60,570 | 27,068 | 669,298 | 291,793 |
Shares redeemed | (3,798,128) | (2,724,911) | (42,982,992) | (30,099,985) |
Net increase (decrease) | 5,560,894 | 3,886,641 | $ 63,393,529 | $ 42,518,414 |
Class T | | | | |
Shares sold | 1,158,910 | 834,072 | $ 13,286,739 | $ 9,114,198 |
Reinvestment of distributions | 2,593 | 5,459 | 28,654 | 58,733 |
Shares redeemed | (1,005,399) | (585,464) | (11,627,373) | (6,459,248) |
Net increase (decrease) | 156,104 | 254,067 | $ 1,688,020 | $ 2,713,683 |
Class B | | | | |
Shares sold | 30,282 | 35,020 | $ 347,009 | $ 380,789 |
Reinvestment of distributions | - | 123 | - | 1,323 |
Shares redeemed | (87,349) | (53,583) | (994,341) | (587,919) |
Net increase (decrease) | (57,067) | (18,440) | $ (647,332) | $ (205,807) |
Class C | | | | |
Shares sold | 2,689,800 | 1,827,859 | $ 30,433,427 | $ 19,884,401 |
Reinvestment of distributions | - | 1,498 | - | 16,049 |
Shares redeemed | (991,400) | (426,678) | (10,978,888) | (4,637,384) |
Net increase (decrease) | 1,698,400 | 1,402,679 | $ 19,454,539 | $ 15,263,066 |
International Growth | | | | |
Shares sold | 39,705,804 | 27,835,093 | $ 456,131,993 | $ 307,440,711 |
Reinvestment of distributions | 387,169 | 197,948 | 4,301,448 | 2,143,781 |
Shares redeemed | (14,942,156) | (10,494,762) | (169,380,325) | (115,997,211) |
Net increase (decrease) | 25,150,817 | 17,538,279 | $ 291,053,116 | $ 193,587,281 |
Annual Report
10. Share Transactions - continued
| Shares | Dollars |
Years ended October 31, | 2015 | 2014 | 2015 | 2014 |
Class I | | | | |
Shares sold | 17,728,493 | 10,292,704 | $ 201,877,753 | $ 113,864,505 |
Reinvestment of distributions | 92,582 | 24,180 | 1,026,733 | 261,623 |
Shares redeemed | (5,227,430) | (2,927,192) | (58,733,231) | (31,428,962) |
Net increase (decrease) | 12,593,645 | 7,389,692 | $ 144,171,255 | $ 82,697,166 |
Class Z | | | | |
Shares sold | 88,007 | - | $ 956,120 | $ - |
Reinvestment of distributions | 91 | 64 | 1,008 | 692 |
Shares redeemed | (18,621) | (475) | (208,779) | (5,267) |
Net increase (decrease) | 69,477 | (411) | $ 748,349 | $ (4,575) |
11. Other.
The Fund's organizational documents provide former and current trustees and officers with a limited indemnification against liabilities arising in connection with the performance of their duties to the Fund. In the normal course of business, the Fund may also enter into contracts that provide general indemnifications. The Fund's maximum exposure under these arrangements is unknown as this would be dependent on future claims that may be made against the Fund. The risk of material loss from such claims is considered remote.
Annual Report
To the Trustees of Fidelity Investment Trust and the Shareholders of Fidelity International Growth Fund:
In our opinion, the accompanying statement of assets and liabilities, including the schedule of investments, and the related statements of operations and of changes in net assets and the financial highlights present fairly, in all material respects, the financial position of Fidelity International Growth Fund (a fund of Fidelity Investment Trust) at October 31, 2015, the results of its operations for the year then ended, the changes in its net assets for each of the two years in the period then ended and the financial highlights for each of the periods indicated, in conformity with accounting principles generally accepted in the United States of America. These financial statements and financial highlights (hereafter referred to as "financial statements") are the responsibility of the Fidelity International Growth Fund's management. Our responsibility is to express an opinion on these financial statements based on our audits. We conducted our audits of these financial statements in accordance with the standards of the Public Company Accounting Oversight Board (United States). Those standards require that we plan and perform the audit to obtain reasonable assurance about whether the financial statements are free of material misstatement. An audit includes examining, on a test basis, evidence supporting the amounts and disclosures in the financial statements, assessing the accounting principles used and significant estimates made by management, and evaluating the overall financial statement presentation. We believe that our audits, which included confirmation of securities at October 31, 2015 by correspondence with the custodian and brokers, provide a reasonable basis for our opinion.
PricewaterhouseCoopers LLP
Boston, Massachusetts
December 16, 2015
Annual Report
The Trustees, Member of the Advisory Board, and officers of the trust and fund, as applicable, are listed below. The Board of Trustees governs the fund and is responsible for protecting the interests of shareholders. The Trustees are experienced executives who meet periodically throughout the year to oversee the fund's activities, review contractual arrangements with companies that provide services to the fund, oversee management of the risks associated with such activities and contractual arrangements, and review the fund's performance. Each of the Trustees oversees 170 funds.
The Trustees hold office without limit in time except that (a) any Trustee may resign; (b) any Trustee may be removed by written instrument, signed by at least two-thirds of the number of Trustees prior to such removal; (c) any Trustee who requests to be retired or who has become incapacitated by illness or injury may be retired by written instrument signed by a majority of the other Trustees; and (d) any Trustee may be removed at any special meeting of shareholders by a two-thirds vote of the outstanding voting securities of the trust. Each Trustee who is not an interested person (as defined in the 1940 Act) of the trust and the fund (Independent Trustee), shall retire not later than the last day of the calendar year in which his or her 75th birthday occurs. The Independent Trustees may waive this mandatory retirement age policy with respect to individual Trustees. The officers and Advisory Board Member hold office without limit in time, except that any officer and Advisory Board Member may resign or may be removed by a vote of a majority of the Trustees at any regular meeting or any special meeting of the Trustees. Except as indicated, each individual has held the office shown or other offices in the same company for the past five years.
Experience, Skills, Attributes, and Qualifications of the Fund's Trustees. The Governance and Nominating Committee has adopted a statement of policy that describes the experience, qualifications, attributes, and skills that are necessary and desirable for potential Independent Trustee candidates (Statement of Policy). The Board believes that each Trustee satisfied at the time he or she was initially elected or appointed a Trustee, and continues to satisfy, the standards contemplated by the Statement of Policy. The Governance and Nominating Committee also engages professional search firms to help identify potential Independent Trustee candidates who have the experience, qualifications, attributes, and skills consistent with the Statement of Policy. From time to time, additional criteria based on the composition and skills of the current Independent Trustees, as well as experience or skills that may be appropriate in light of future changes to board composition, business conditions, and regulatory or other developments, have also been considered by the professional search firms and the Governance and Nominating Committee. In addition, the Board takes into account the Trustees' commitment and participation in Board and committee meetings, as well as their leadership of standing and ad hoc committees throughout their tenure.
In determining that a particular Trustee was and continues to be qualified to serve as a Trustee, the Board has considered a variety of criteria, none of which, in isolation, was controlling. The Board believes that, collectively, the Trustees have balanced and diverse experience, qualifications, attributes, and skills, which allow the Board to operate effectively in governing the fund and protecting the interests of shareholders. Information about the specific experience, skills, attributes, and qualifications of each Trustee, which in each case led to the Board's conclusion that the Trustee should serve (or continue to serve) as a trustee of the fund, is provided below.
Annual Report
Board Structure and Oversight Function. James C. Curvey is an interested person (as defined in the 1940 Act) and currently serves as Chairman. The Trustees have determined that an interested Chairman is appropriate and benefits shareholders because an interested Chairman has a personal and professional stake in the quality and continuity of services provided to the fund. Independent Trustees exercise their informed business judgment to appoint an individual of their choosing to serve as Chairman, regardless of whether the Trustee happens to be independent or a member of management. The Independent Trustees have determined that they can act independently and effectively without having an Independent Trustee serve as Chairman and that a key structural component for assuring that they are in a position to do so is for the Independent Trustees to constitute a substantial majority for the Board. The Independent Trustees also regularly meet in executive session. Ned C. Lautenbach serves as Chairman of the Independent Trustees and as such (i) acts as a liaison between the Independent Trustees and management with respect to matters important to the Independent Trustees and (ii) with management prepares agendas for Board meetings.
Fidelity funds are overseen by different Boards of Trustees. The fund's Board oversees Fidelity's high income and certain equity funds, and other Boards oversee Fidelity's investment-grade bond, money market, asset allocation, and sector funds. The asset allocation funds may invest in Fidelity funds overseen by the fund's Board. The use of separate Boards, each with its own committee structure, allows the Trustees of each group of Fidelity funds to focus on the unique issues of the funds they oversee, including common research, investment, and operational issues. On occasion, the separate Boards establish joint committees to address issues of overlapping consequences for the Fidelity funds overseen by each Board.
The Trustees operate using a system of committees to facilitate the timely and efficient consideration of all matters of importance to the Trustees, the fund, and fund shareholders and to facilitate compliance with legal and regulatory requirements and oversight of the fund's activities and associated risks. The Board, acting through its committees, has charged FMR and its affiliates with (i) identifying events or circumstances the occurrence of which could have demonstrably adverse effects on the fund's business and/or reputation; (ii) implementing processes and controls to lessen the possibility that such events or circumstances occur or to mitigate the effects of such events or circumstances if they do occur; and (iii) creating and maintaining a system designed to evaluate continuously business and market conditions in order to facilitate the identification and implementation processes described in (i) and (ii) above. Because the day-to-day operations and activities of the fund are carried out by or through FMR, its affiliates and other service providers, the fund's exposure to risks is mitigated but not eliminated by the processes overseen by the Trustees. While each of the Board's committees has responsibility for overseeing different aspects of the fund's activities, oversight is exercised primarily through the Operations, Audit, and Compliance Committees. In addition, the Independent Trustees have worked with FMR to enhance the Board's oversight of investment and financial risks, legal and regulatory risks, technology risks, and operational risks, including the development of additional risk reporting to the Board. For example, a working group comprised of Independent Trustees and FMR has worked and continues to work to review the Fidelity funds' valuation-related activities, reporting and risk management. Appropriate personnel, including but not limited to the fund's Chief Compliance Officer (CCO), FMR's internal auditor, the independent accountants, the fund's Treasurer and portfolio management personnel, make periodic reports to the Board's committees, as appropriate, including an annual review of Fidelity's risk management program for the Fidelity funds. The responsibilities of each standing committee, including their oversight responsibilities, are described further under "Standing Committees of the Fund's Trustees."
Annual Report
Trustees and Officers - continued
The fund's Statement of Additional Information (SAI) includes more information about the Trustees. To request a free copy, call Fidelity at 1-877-208-0098.
Interested Trustees*:
Correspondence intended for each Trustee who is an interested person may be sent to Fidelity Investments, 245 Summer Street, Boston, Massachusetts 02210.
Name, Year of Birth; Principal Occupations and Other Relevant Experience+ |
James C. Curvey (1935) |
Year of Election or Appointment: 2007 Trustee Chairman of the Board of Trustees |
| Mr. Curvey also serves as Trustee of other Fidelity funds. Mr. Curvey is a Director of Fidelity Research & Analysis Co. (investment adviser firm, 2009-present), and Vice Chairman (2007-present) and Director of FMR LLC (diversified financial services company). In addition, Mr. Curvey serves as an Overseer for the Boston Symphony Orchestra and a member of the board of Artis-Naples, Naples, Florida, and as a Trustee for Brewster Academy, Wolfeboro, New Hampshire. Previously, Mr. Curvey served as a Director of Fidelity Investments Money Management, Inc. (investment adviser firm, 2009-2014) and a Director of FMR and FMR Co., Inc. (investment adviser firms, 2007-2014). |
Charles S. Morrison (1960) |
Year of Election or Appointment: 2014 Trustee |
| Mr. Morrison also serves as Trustee of other funds. He serves as a Director of Fidelity Investments Money Management, Inc. (FIMM) (investment adviser firm, 2014-present), Director of Fidelity SelectCo, LLC (investment adviser firm, 2014-present), President, Asset Management (2014-present), and is an employee of Fidelity Investments. Previously, Mr. Morrison served as Vice President of Fidelity's Fixed Income and Asset Allocation Funds (2012-2014), President, Fixed Income (2011-2014), Vice President of Fidelity's Money Market Funds (2005-2009), President, Money Market Group Leader of FMR (investment adviser firm, 2009), and Senior Vice President, Money Market Group of FMR (2004-2009). Mr. Morrison also served as Vice President of Fidelity's Bond Funds (2002-2005), certain Balanced Funds (2002-2005), and certain Asset Allocation Funds (2002-2007), and as Senior Vice President (2002-2005) of Fidelity's Bond Division. |
* Trustees have been determined to be "Interested Trustees" by virtue of, among other things, their affiliation with the trust or various entities under common control with FMR.
+ The information above includes each Trustee's principal occupation during the last five years and other information relating to the experience, attributes, and skills relevant to each Trustee's qualifications to serve as a Trustee, which led to the conclusion that each Trustee should serve as a Trustee for the fund.
Annual Report
Trustees and Officers - continued
Independent Trustees:
Correspondence intended for each Independent Trustee (that is, the Trustees other than the Interested Trustees) may be sent to Fidelity Investments, P.O. Box 55235, Boston, Massachusetts 02205-5235.
Name, Year of Birth; Principal Occupations and Other Relevant Experience+ |
Dennis J. Dirks (1948) |
Year of Election or Appointment: 2005 Trustee |
| Mr. Dirks also serves as Trustee of other Fidelity funds. Prior to his retirement in May 2003, Mr. Dirks was Chief Operating Officer and a member of the Board of The Depository Trust & Clearing Corporation (DTCC). He also served as President, Chief Operating Officer, and Board member of The Depository Trust Company (DTC) and President and Board member of the National Securities Clearing Corporation (NSCC). In addition, Mr. Dirks served as Chief Executive Officer and Board member of the Government Securities Clearing Corporation, Chief Executive Officer and Board member of the Mortgage-Backed Securities Clearing Corporation, as a Trustee and a member of the Finance Committee of Manhattan College (2005-2008), as a Trustee and a member of the Finance Committee of AHRC of Nassau County (2006-2008), and as a member of the Independent Directors Council (IDC) Governing Council (2010-2015). Mr. Dirks is a member of the Board of Directors for The Brookville Center for Children's Services, Inc. (2009-present). |
Alan J. Lacy (1953) |
Year of Election or Appointment: 2008 Trustee |
| Mr. Lacy also serves as Trustee of other Fidelity funds. Mr. Lacy serves as a member of the Board of Directors of Dave & Buster's Entertainment, Inc. (restaurant and entertainment complexes, 2010-present) and Bristol-Myers Squibb Company (global pharmaceuticals, 2008-present). In addition, Mr. Lacy served as Senior Adviser (2007-2014) of Oak Hill Capital Partners, L.P. (private equity) and also served as Chief Executive Officer (2000-2005) and Vice Chairman (2005-2006) of Sears Holdings Corporation and Sears, Roebuck and Co. (retail). Mr. Lacy is a member of the Board of Trustees of The National Parks Conservation Association (2006-present). Previously, Mr. Lacy served as Chairman of the Board of Trustees of the National Parks Conservation Association (2008-2011) and as a member of the Board of Directors for The Western Union Company (global money transfer, 2006-2011), The Hillman Companies, Inc. (hardware wholesalers, 2010-2014), and Earth Fare, Inc. (retail grocery, 2010-2014). |
Ned C. Lautenbach (1944) |
Year of Election or Appointment: 2000 Trustee Chairman of the Independent Trustees |
| Mr. Lautenbach also serves as Trustee of other Fidelity funds. Mr. Lautenbach currently serves as the Lead Director of the Eaton Corporation Board of Directors (diversified industrial, 1997-present). Mr. Lautenbach is Chairman of the Board of Directors of Artis-Naples in Naples, Florida (2012-present), a member of the Council on Foreign Relations (1994-present), and a member of the Board of Governors, State University System of Florida (2013-present). Previously, Mr. Lautenbach was a Partner/Advisory Partner at Clayton, Dubilier & Rice, LLC (private equity investment, 1998-2010), as well as a Director of Sony Corporation (2006-2007). |
Joseph Mauriello (1944) |
Year of Election or Appointment: 2008 Trustee |
| Mr. Mauriello also serves as Trustee of other Fidelity funds. Prior to his retirement in January 2006, Mr. Mauriello served in numerous senior management positions including Deputy Chairman and Chief Operating Officer (2004-2005), and Vice Chairman of Financial Services (2002-2004) of KPMG LLP US (professional services, 1965-2005). Mr. Mauriello currently serves as a member of the Board of Directors of XL Group plc. (global insurance and re-insurance, 2006-present) and the Independent Directors Council (IDC) Governing Council (2015-present). Previously, Mr. Mauriello served as a Director of the Hamilton Funds of the Bank of New York (2006-2007) and of Arcadia Resources Inc. (health care services and products, 2007-2012). |
Robert W. Selander (1950) |
Year of Election or Appointment: 2011 Trustee |
| Mr. Selander also serves as Trustee of other Fidelity funds. Mr. Selander serves as a Director of The Western Union Company (global money transfer, 2014-present). Previously, Mr. Selander served as a Member of the Advisory Board of other Fidelity funds (2011), and Executive Vice Chairman (2010), Chief Executive Officer (2009-2010), and President and Chief Executive Officer (1997-2009) of Mastercard, Inc. |
Cornelia M. Small (1944) |
Year of Election or Appointment: 2005 Trustee |
| Ms. Small also serves as Trustee of other Fidelity funds. Ms. Small is a member of the Board of Directors (2009-present) and Chair of the Investment Committee (2010-present) of the Teagle Foundation. Ms. Small also serves on the Investment Committee of the Berkshire Taconic Community Foundation (2008-present). Previously, Ms. Small served as Chairperson (2002-2008) and a member of the Investment Committee and Chairperson (2008-2012) and a member of the Board of Trustees of Smith College. In addition, Ms. Small served as Chief Investment Officer, Director of Global Equity Investments, and a member of the Board of Directors of Scudder, Stevens & Clark and Scudder Kemper Investments. |
William S. Stavropoulos (1939) |
Year of Election or Appointment: 2001 Trustee Vice Chairman of the Independent Trustees |
| Mr. Stavropoulos also serves as Trustee of other Fidelity funds. Mr. Stavropoulos serves as President and Founder of the Michigan Baseball Foundation, the Great Lakes Loons (2007-present). Mr. Stavropoulos is Chairman Emeritus of the Board of Directors of The Dow Chemical Company, where he previously served in numerous senior management positions, including President, CEO (1995-2000; 2002-2004), Chairman of the Executive Committee (2000-2006), and as a member of the Board of Directors (1990-2006). Currently, Mr. Stavropoulos is Chairman of the Board of Directors of Univar Inc. (global distributor of commodity and specialty chemicals), a Director of Teradata Corporation (data warehousing and technology solutions), and Maersk Inc. (industrial conglomerate), and a member of the Advisory Board for Metalmark Capital LLC (private equity investment, 2005-present). Mr. Stavropoulos is an operating advisor to Clayton, Dubilier & Rice, LLC (private equity investment). In addition, Mr. Stavropoulos is a member of the University of Notre Dame Advisory Council for the College of Science, a Trustee of the Rollin L. Gerstacker Foundation, and a Director of the Naples Philharmonic Center for the Arts. Previously, Mr. Stavropoulos served as a Director of Chemical Financial Corporation (bank holding company, 1993-2012) and Tyco International, Ltd. (multinational manufacturing and services, 2007-2012). |
David M. Thomas (1949) |
Year of Election or Appointment: 2008 Trustee |
| Mr. Thomas also serves as Trustee of other Fidelity funds. Mr. Thomas serves as Non-Executive Chairman of the Board of Directors of Fortune Brands Home and Security (home and security products, 2011-present), as a member of the Board of Directors (2004-present) and Presiding Director (2013-present) of Interpublic Group of Companies, Inc. (marketing communication), and as a member of the Board of Trustees of the University of Florida (2013-present). Previously, Mr. Thomas served as Executive Chairman (2005-2006) and Chairman and Chief Executive Officer (2000-2005) of IMS Health, Inc. (pharmaceutical and healthcare information solutions), and a Director of Fortune Brands, Inc. (consumer products, 2000-2011). |
+ The information above includes each Trustee's principal occupation during the last five years and other information relating to the experience, attributes, and skills relevant to each Trustee's qualifications to serve as a Trustee, which led to the conclusion that each Trustee should serve as a Trustee for the fund.
Advisory Board Member and Officers:
Correspondence intended for each officer and Peter S. Lynch may be sent to Fidelity Investments, 245 Summer Street, Boston, Massachusetts 02210. Officers appear below in alphabetical order.
Name, Year of Birth; Principal Occupation |
Peter S. Lynch (1944) |
Year of Election or Appointment: 2003 Member of the Advisory Board |
| Mr. Lynch also serves as Member of the Advisory Board of other Fidelity funds. Mr. Lynch is Vice Chairman and a Director of FMR (investment adviser firm) and FMR Co., Inc. (investment adviser firm). In addition, Mr. Lynch serves as a Trustee of Boston College and as the Chairman of the Inner-City Scholarship Fund. Previously, Mr. Lynch served on the Special Olympics International Board of Directors (1997-2006). |
Elizabeth Paige Baumann (1968) |
Year of Election or Appointment: 2012 Anti-Money Laundering (AML) Officer |
| Ms. Baumann also serves as AML Officer of other funds. She is Chief AML Officer of FMR LLC (diversified financial services company, 2012-present) and is an employee of Fidelity Investments. Previously, Ms. Baumann served as Vice President and Deputy Anti-Money Laundering Officer (2007-2012). |
Marc R. Bryant (1966) |
Year of Election or Appointment: 2015 Secretary and Chief Legal Officer (CLO) |
| Mr. Bryant also serves as Secretary and CLO of other funds. Mr. Bryant serves as CLO, Secretary, and Senior Vice President of Fidelity Management & Research Company (investment adviser firm, 2015-present) and FMR Co., Inc. (investment adviser firm, 2015-present); Secretary of Fidelity SelectCo, LLC (investment adviser firm, 2015-present) and Fidelity Investments Money Management, Inc. (investment adviser firm, 2015-present); and CLO of Fidelity Management & Research (Hong Kong) Limited (investment adviser firm, 2015-present). He is Senior Vice President and Deputy General Counsel of FMR LLC (diversified financial services company). Previously, Mr. Bryant served as Secretary and Chief Legal Officer of Fidelity Rutland Square Trust II (2010-2014) and Assistant Secretary of Fidelity's Fixed Income and Asset Allocation Funds (2013-2015). Prior to joining Fidelity Investments, Mr. Bryant served as a Senior Vice President and the Head of Global Retail Legal for AllianceBernstein L.P. (2006-2010), and as the General Counsel for ProFund Advisors LLC (2001-2006). |
William C. Coffey (1969) |
Year of Election or Appointment: 2009 Assistant Secretary |
| Mr. Coffey also serves as Assistant Secretary of other funds. He is Senior Vice President and Deputy General Counsel of FMR LLC (diversified financial services company, 2010-present), and is an employee of Fidelity Investments. Previously, Mr. Coffey served as Vice President and Associate General Counsel of FMR LLC (2005-2009). |
Timothy M. Cohen (1969) |
Year of Election or Appointment: 2014 Vice President of certain Equity Funds |
| Mr. Cohen also serves as Vice President of other funds. Mr. Cohen serves as Chief Compliance Officer of FMR Investment Management (U.K.) Limited (investment adviser firm, 2013-present) and is an employee of Fidelity Investments. Previously, Mr. Cohen served as a Director of FMR Investment Management (U.K.) Limited (2013-2015). |
Jonathan Davis (1968) |
Year of Election or Appointment: 2010 Assistant Treasurer |
| Mr. Davis also serves as Assistant Treasurer of other funds, and is an employee of Fidelity Investments. Previously, Mr. Davis served as Vice President and Associate General Counsel of FMR LLC (diversified financial services company, 2003-2010). |
Adrien E. Deberghes (1967) |
Year of Election or Appointment: 2008 Deputy Treasurer |
| Mr. Deberghes also serves as an officer of other funds. He is an employee of Fidelity Investments (2008-present). Prior to joining Fidelity Investments, Mr. Deberghes was Senior Vice President of Mutual Fund Administration at State Street Corporation (2007-2008), Senior Director of Mutual Fund Administration at Investors Bank & Trust (2005-2007), and Director of Finance for Dunkin' Brands (2000-2005). |
Stephanie J. Dorsey (1969) |
Year of Election or Appointment: 2010 Assistant Treasurer |
| Ms. Dorsey also serves as an officer of other funds. She is an employee of Fidelity Investments (2008-present) and has served in other fund officer roles. Prior to joining Fidelity Investments, Ms. Dorsey served as Treasurer (2004-2008) of the JPMorgan Mutual Funds and Vice President (2004-2008) of JPMorgan Chase Bank. |
Howard J. Galligan III (1966) |
Year of Election or Appointment: 2014 Chief Financial Officer |
| Mr. Galligan also serves as Chief Financial Officer of other funds. Mr. Galligan serves as President of Fidelity Pricing and Cash Management Services (FPCMS) (2014-present) and as a Director of Strategic Advisers, Inc. (investment adviser firm, 2008-present). Previously, Mr. Galligan served as Chief Administrative Officer of Asset Management (2011-2014) and Chief Operating Officer and Senior Vice President of Investment Support for Strategic Advisers, Inc. (2003-2011). |
Scott C. Goebel (1968) |
Year of Election or Appointment: 2015 Vice President |
| Mr. Goebel serves as Vice President of other funds and is an employee of Fidelity Investments (2001-present). Previously, Mr. Goebel served as Secretary of Fidelity SelectCo, LLC (investment adviser firm, 2013-2015), Fidelity Investments Money Management, Inc. (FIMM) (investment adviser firm, 2010-2015), and Fidelity Research and Analysis Company (FRAC) (investment adviser firm, 2010-2015); General Counsel, Secretary, and Senior Vice President of Fidelity Management & Research Company (investment adviser firm, 2008-2015) and FMR Co., Inc. (investment adviser firm, 2008-2015); Assistant Secretary of Fidelity Management & Research (Japan) Limited (investment adviser firm, 2008-2015) and FMR Investment Management (U.K.) Limited (investment adviser firm, 2008-2015); Chief Legal Officer (CLO) of Fidelity Management & Research (Hong Kong) Limited (investment adviser firm, 2008-2015); Secretary and CLO of certain Fidelity funds (2008-2015); Assistant Secretary of FIMM (2008-2010), FRAC (2008-2010), and certain funds (2007-2008); and as Vice President and Secretary of Fidelity Distributors Corporation (FDC) (2005-2007). |
Brian B. Hogan (1964) |
Year of Election or Appointment: 2009 Vice President |
| Mr. Hogan also serves as Trustee or Vice President of other funds. Mr. Hogan serves as a Director of Fidelity SelectCo, LLC (investment adviser firm, 2014-present) and President of the Equity Division of FMR (investment adviser firm, 2009-present). Previously, Mr. Hogan served as Senior Vice President, Equity Research of FMR (2006-2009) and as a portfolio manager. |
Chris Maher (1972) |
Year of Election or Appointment: 2013 Assistant Treasurer |
| Mr. Maher serves as Assistant Treasurer of other funds. Mr. Maher is Vice President of Valuation Oversight and is an employee of Fidelity Investments. Previously, Mr. Maher served as Vice President of Asset Management Compliance (2013), Vice President of the Program Management Group of FMR (investment adviser firm, 2010-2013), and Vice President of Valuation Oversight (2008-2010). |
Kenneth B. Robins (1969) |
Year of Election or Appointment: 2008 President and Treasurer |
| Mr. Robins also serves as an officer of other funds. Mr. Robins serves as Executive Vice President of Fidelity Investments Money Management, Inc. (FIMM) (investment adviser firm, 2013-present) and is an employee of Fidelity Investments (2004-present). Previously, Mr. Robins served in other fund officer roles. |
Stacie M. Smith (1974) |
Year of Election or Appointment: 2013 Deputy Treasurer |
| Ms. Smith also serves as an officer of other funds. She is an employee of Fidelity Investments (2009-present) and has served in other fund officer roles. Prior to joining Fidelity Investments, Ms. Smith served as Senior Audit Manager of Ernst & Young LLP (1996-2009). |
Renee Stagnone (1975) |
Year of Election or Appointment: 2013 Deputy Treasurer |
| Ms. Stagnone also serves as Deputy Treasurer of other funds. Ms. Stagnone is an employee of Fidelity Investments (1997-present). |
Linda J. Wondrack (1964) |
Year of Election or Appointment: 2014 Chief Compliance Officer |
| Ms. Wondrack also serves as Chief Compliance Officer of other funds. Ms. Wondrack is Executive Vice President and head of the Ethics Office and Asset Management Compliance for Fidelity Investments (2012-present). Ms. Wondrack also serves as Chief Compliance Officer of Fidelity SelectCo, LLC (investment adviser firm, 2014-present); Chief Compliance Officer of Impresa Management LLC (2013-present); and Chief Compliance Officer of FMR Co., Inc. (investment adviser firm), Fidelity Investments Money Management, Inc. (investment adviser firm), Fidelity Management & Research (Japan) Limited (investment adviser firm), FMR Investment Management (U.K.) Limited (investment adviser firm), Fidelity Management & Research (Hong Kong) (investment adviser firm), Fidelity Management & Research Company (investment adviser firm), FIAM LLC (investment adviser firm), and Strategic Advisers, Inc. (investment adviser firm), Ballyrock Investment Advisors LLC, and Northern Neck Investors LLC (2012-present). Previously, Ms. Wondrack served as Senior Vice President and Chief Compliance Officer for Columbia Management Investment Advisers, LLC (2005-2012); Chief Compliance Officer for certain funds within the Columbia Family of Funds (2007-2012); and Senior Vice President of Compliance Risk Management at Bank of America (2005-2010). |
Joseph F. Zambello (1957) |
Year of Election or Appointment: 2011 Deputy Treasurer |
| Mr. Zambello also serves as Deputy Treasurer of other funds. Mr. Zambello is an employee of Fidelity Investments (1991-present). Previously, Mr. Zambello served as Vice President of the Program Management Group of FMR (investment adviser firm, 2009-2011) and Vice President of the Transfer Agent Oversight Group (2005-2009). |
Annual Report
The Board of Trustees of Fidelity International Growth Fund voted to pay to shareholders of record at the opening of business on record date, the following distributions per share derived from capital gains realized from sales of portfolio securities, and dividends derived from net investment income:
| Pay Date | Record Date | Dividends | Capital Gains |
Class A | 12/07/15 | 12/04/15 | $0.050 | $0.008 |
| | | | |
Class T | 12/07/15 | 12/04/15 | $0.010 | $0.008 |
| | | | |
Class B | 12/07/15 | 12/04/15 | $0.000 | $0.008 |
| | | | |
Class C | 12/07/15 | 12/04/15 | $0.000 | $0.008 |
Class A designates 20%, Class T designates 64% of the dividends distributed during the fiscal year as qualifying for the dividends received deduction for corporate shareholders.
Class A and Class T designates 100% of the dividends distributed during the fiscal year as amounts which may be taken into account as a dividend for purposes of the maximum rate under section 1(h)(11) of the Internal Revenue Code.
The amounts per share which represent income derived from sources within, and taxes paid to, foreign countries or possessions of the United States are as follows:
| Pay Date | Income | Taxes |
Class A | 12/08/2014 | $0.0708 | $0.0098 |
| | | |
Class T | 12/08/2014 | $0.0218 | $0.0098 |
| | | |
Class B | 12/08/2014 | $0.0000 | $0.0000 |
| | | |
Class C | 12/08/2014 | $0.0000 | $0.0000 |
The fund will notify shareholders in January 2016 of amounts for use in preparing 2015 income tax returns.
Annual Report
Fidelity International Growth Fund
Each year, the Board of Trustees, including the Independent Trustees (together, the Board), votes on the renewal of the management contract with Fidelity Management & Research Company (FMR) and the sub-advisory agreements (together, the Advisory Contracts) for the fund. The Board, assisted by the advice of fund counsel and Independent Trustees' counsel, requests and considers a broad range of information relevant to the renewal of the Advisory Contracts throughout the year.
The Board meets regularly and, at each of its meetings, covers an extensive agenda of topics and materials and considers factors that are relevant to its annual consideration of the renewal of the fund's Advisory Contracts, including the services and support provided to the fund and its shareholders. The Board has established various standing committees (Committees), each composed of and chaired by Independent Trustees with varying backgrounds, to which the Board has assigned specific subject matter responsibilities in order to enhance effective decision-making by the Board. The Board, acting directly and through its Committees, requests and receives information concerning the annual consideration of the renewal of the fund's Advisory Contracts. The Board also meets as needed to consider matters specifically related to the Board's annual consideration of the renewal of the Advisory Contracts. Members of the Board may also meet with trustees of other Fidelity funds through ad hoc joint committees to discuss certain matters relevant to all of the Fidelity funds.
At its July 2015 meeting, the Board unanimously determined to renew the fund's Advisory Contracts. In reaching its determination, the Board considered all factors it believed relevant, including (i) the nature, extent, and quality of the services to be provided to the fund and its shareholders (including the investment performance of the fund); (ii) the competitiveness of the fund's management fee and total expense ratio relative to peer funds; (iii) the total costs of the services to be provided by and the profits to be realized by Fidelity from its relationship with the fund; and (iv) the extent to which (if any) economies of scale exist and would be realized as the fund grows, and whether any economies of scale are appropriately shared with fund shareholders.
In considering whether to renew the Advisory Contracts for the fund, the Board reached a determination, with the assistance of fund counsel and Independent Trustees' counsel and through the exercise of its business judgment, that the renewal of the Advisory Contracts was in the best interests of the fund and its shareholders and that the compensation payable under the Advisory Contracts was fair and reasonable. The Board's decision to renew the Advisory Contracts was not based on any single factor, but rather was based on a comprehensive consideration of all the information provided to the Board at its meetings throughout the year. The Board, in reaching its determination to renew the Advisory Contracts, was aware that shareholders of the fund have a broad range of investment choices available to them, including a wide choice among funds offered by Fidelity's competitors, and that the fund's shareholders, who have the opportunity to review and weigh the disclosure provided by the fund in its prospectus and other public disclosures, have chosen to invest in this fund, which is part of the Fidelity family of funds.
Annual Report
Nature, Extent, and Quality of Services Provided. The Board considered Fidelity's staffing as it relates to the fund, including the backgrounds of investment personnel of Fidelity, and also considered the fund's investment objective, strategies, and related investment philosophy. The Independent Trustees also had discussions with senior management of Fidelity's investment operations and investment groups. The Board considered the structure of the portfolio manager compensation program and whether this structure provides appropriate incentives to act in the best interests of the fund. Additionally, the Board considered the portfolio managers' investments, if any, in the funds that they manage.
Resources Dedicated to Investment Management and Support Services. The Board and the Fund Oversight and Research Committees reviewed the general qualifications and capabilities of Fidelity's investment staff, including its size, education, experience, and resources, as well as Fidelity's approach to recruiting, training, managing, and compensating investment personnel. The Board noted that Fidelity has continued to increase the resources devoted to non-U.S. offices, including expansion of Fidelity's global investment organization. The Board also noted that Fidelity's analysts have extensive resources, tools and capabilities that allow them to conduct sophisticated quantitative and fundamental analysis, as well as credit analysis of issuers, counterparties and guarantors. Further, the Board considered that Fidelity's investment professionals have sufficient access to global information and data so as to provide competitive investment results over time, and that those professionals also have access to sophisticated tools that permit them to assess portfolio construction and risk and performance attribution characteristics continuously, as well as to transmit new information and research conclusions rapidly around the world. Additionally, in its deliberations, the Board considered Fidelity's trading, risk management, and compliance capabilities and resources, which are integral parts of the investment management process.
Shareholder and Administrative Services. The Board considered (i) the nature, extent, quality, and cost of advisory, administrative, and shareholder services performed by FMR, the sub-advisers (together with FMR, the Investment Advisers), and their affiliates under the Advisory Contracts and under separate agreements covering transfer agency, pricing and bookkeeping, and securities lending services for the fund; (ii) the nature and extent of the supervision of third party service providers, principally custodians and subcustodians; and (iii) the resources devoted to, and the record of compliance with, the fund's compliance policies and procedures. The Board also reviewed the allocation of fund brokerage, including allocations to brokers affiliated with the Investment Advisers, the use of brokerage commissions to pay fund expenses, and the use of "soft" commission dollars to pay for research services.
Annual Report
Board Approval of Investment Advisory Contracts and
Management Fees - continued
The Board noted that the growth of fund assets over time across the complex allows Fidelity to reinvest in the development of services designed to enhance the value or convenience of the Fidelity funds as investment vehicles. These services include 24-hour access to account information and market information through telephone representatives and over the Internet, investor education materials and asset allocation tools, and the expanded availability of Fidelity Investor Centers.
In 2014, the Board formed an ad hoc Committee on Transfer Agency Fees to review the variety of transfer agency fee structures throughout the industry and Fidelity's competitive positioning with respect to industry participants.
Investment in a Large Fund Family. The Board considered the benefits to shareholders of investing in a Fidelity fund, including the benefits of investing in a fund that is part of a large family of funds offering a variety of investment disciplines and providing a large variety of mutual fund investor services. The Board noted that Fidelity had taken, or had made recommendations that resulted in the Fidelity funds taking, a number of actions over the previous year that benefited particular funds, including (i) continuing to dedicate additional resources to investment research and to the support of the senior management team that oversees asset management; (ii) continuing efforts to enhance Fidelity's global research capabilities; (iii) launching new funds and making other enhancements to meet client needs; (iv) reducing management fees and total expenses for certain index funds and diversified international funds; (v) continuing to launch dedicated lower cost underlying funds to meet portfolio construction needs related to expanding underlying fund options for Fidelity funds of funds, specifically for the Freedom Fund product lines; (vi) rationalizing product lines and gaining increased efficiencies through fund mergers; (vii) launching active fixed-income exchange-traded funds; (viii) continuing to develop, acquire and implement systems and technology to improve services to the funds and information security and to increase efficiency; (ix) implementing investment enhancements to further strengthen Fidelity's target date product line to increase investors' probability of success in achieving their goals; (x) modifying the eligibility criteria for certain share classes to accommodate roll-over assets from employer-sponsored retirement plans; (xi) launching a new Class W of the Freedom Index Funds to attract and retain Fidelity record-kept retirement plan assets; and (xii) implementing changes to Fidelity's money market product line in response to recent money market regulatory reforms.
Investment Performance. The Board considered whether the fund has operated in accordance with its investment objective, as well as its record of compliance with its investment restrictions and its performance history.
Annual Report
The Board took into account discussions with representatives of the Investment Advisers about fund investment performance that occur at Board meetings throughout the year. In this regard the Board noted that as part of regularly scheduled fund reviews and other reports to the Board on fund performance, the Board considers annualized return information for the fund, for different time periods, measured against a securities market index ("benchmark index") and a peer group of funds with similar objectives ("peer group"), if any. In its evaluation of fund investment performance, the Board gave particular attention to information indicating changes in performance of certain Fidelity funds for specific time periods and discussed with the Investment Advisers the reasons for any overperformance or underperformance.
In addition to reviewing absolute and relative fund performance, the Independent Trustees periodically consider the appropriateness of fund performance metrics in evaluating the results achieved. In general, the Independent Trustees believe that fund performance should be evaluated based on net performance (after fees and expenses) of both the highest performing and lowest performing fund share classes, where applicable, compared to appropriate benchmark indices, over appropriate time periods that may include full market cycles, and compared to peer groups, as applicable, over the same periods, taking into account relevant factors including the following: general market conditions; issuer-specific information; and fund cash flows and other factors.
The Independent Trustees recognize that shareholders evaluate performance on a net basis over their own holding periods, for which one-, three-, and five-year periods are often used as a proxy. For this reason, the performance information reviewed by the Board also included net cumulative calendar year total return information for the fund and an appropriate benchmark index and peer group for the most recent one-, three-, and five-year periods, as shown below. Returns are shown compared to the 25th percentile (top of box, 75% beaten) and 75th percentile (bottom of box, 25% beaten) of the peer universe. Returns of the benchmark index are "net MA," i.e., adjusted for tax withholding rates applicable to U.S.-based funds organized as Massachusetts business trusts.
Annual Report
Board Approval of Investment Advisory Contracts and
Management Fees - continued
Fidelity International Growth Fund

The Board also considered that the fund's management fee is subject to upward or downward adjustment depending upon whether, and to what extent, the fund's investment performance for the performance period exceeds, or is exceeded by, a securities index, thus leading to a performance adjustment for the same period. The Board noted that the performance adjustment provides FMR with a strong economic incentive to seek to achieve superior performance for the fund's shareholders and helps to more closely align the interests of FMR and the shareholders of the fund.
Based on its review, the Board concluded that the nature, extent, and quality of services provided to the fund under the Advisory Contracts should benefit the shareholders of the fund.
Competitiveness of Management Fee and Total Expense Ratio. The Board considered the fund's management fee and total expense ratio compared to "mapped groups" of competitive funds and classes created for the purpose of facilitating the Trustees' competitive analysis of management fees and total expenses. Fidelity creates "mapped groups" by combining similar Lipper investment objective categories that have comparable investment mandates. Combining Lipper investment objective categories aids the Board's management fee and total expense ratio comparisons by broadening the competitive group used for comparison.
Management Fee. The Board considered two proprietary management fee comparisons for the 12-month periods shown in basis points (BP) in the chart below. The group of Lipper funds used by the Board for management fee comparisons is referred to below as the "Total Mapped Group." The Total Mapped Group comparison focuses on a fund's standing in terms of gross management fees before expense reimbursements or caps, and without giving effect to the fund's performance adjustment, relative to the total universe of funds with comparable investment mandates, regardless of whether their management fee structures also are comparable. Funds with comparable investment mandates offer exposure to similar types of securities. Funds with comparable management fee structures have similar management fee contractual arrangements (e.g., flat rate charged for advisory services, all-inclusive fee rate, etc.). "TMG %" represents the percentage of funds in the Total Mapped Group that had management fees that were lower than the fund's. For example, a hypothetical TMG % of 20% would mean that 80% of the funds in the Total Mapped Group had higher, and 20% had lower, management fees than the fund. The fund's actual TMG %s and the number of funds in the Total Mapped Group are in the chart below. The "Asset-Size Peer Group" (ASPG) comparison focuses on a fund's standing relative to a subset of non-Fidelity funds within the Total Mapped Group that are similar in size and management fee structure without taking into account performance adjustments, if any. For example, if a fund is in the first quartile of the ASPG, the fund's management fee ranks in the least expensive or lowest 25% of funds in the ASPG. The ASPG represents at least 15% of the funds in the Total Mapped Group with comparable asset size and management fee structures, subject to a minimum of 50 funds (or all funds in the Total Mapped Group if fewer than 50). Additional information, such as the ASPG quartile in which the fund's management fee rate ranked and the impact of the fund's performance adjustment, is also included in the chart and considered by the Board.
Annual Report
Fidelity International Growth Fund

Annual Report
Board Approval of Investment Advisory Contracts and
Management Fees - continued
The Board noted that the fund's management fee rate ranked below the median of its Total Mapped Group and below the median of its ASPG for 2014. The Board also noted the effect of the fund's performance adjustment, if any, on the fund's management fee ranking.
The Board noted that, in 2014, the ad hoc Committee on Group Fee was formed by it and other Fidelity fund boards to conduct an in-depth review of the "group fee" component of the management fee of funds with such management fee structures. Committee focus included the mechanics of the group fee, the competitive landscape of group fee structures, Fidelity funds with no group fee component and investment products not included in group fee assets. The Board also considered that, for funds subject to the group fee, FMR agreed to voluntarily waive fees over a specified period of time in amounts designed to account for assets converted from certain funds to certain collective investment trusts.
The Board also noted that, in 2013, the ad hoc Committee on Management Fees was formed to conduct an in-depth review of the management fee rates of Fidelity's active equity mutual funds. The Committee focused on the following areas: (i) standard fee structures; (ii) research consumption and trading evolution; (iii) management fee competitiveness/profitability by category; and (iv) factors that drive institutional pricing.
Based on its review, the Board concluded that the fund's management fee is fair and reasonable in light of the services that the fund receives and the other factors considered.
Total Expense Ratio. In its review of each class's total expense ratio, the Board considered the fund's management fee as well as other fund or class expenses, as applicable, such as transfer agent fees, pricing and bookkeeping fees, fund-paid 12b-1 fees, and custodial, legal, and audit fees. The Board noted the impact of the fund's performance adjustment. The Board also noted that Fidelity may agree to waive fees and expenses from time to time, and the extent to which, if any, it has done so for the fund. As part of its review, the Board also considered the current and historical total expense ratios of each class of the fund compared to competitive fund median expenses. Each class of the fund is compared to those funds and classes in the Total Mapped Group (used by the Board for management fee comparisons) that have a similar sales load structure.
The Board noted that the total expense ratio of each of Class A, Class I, Class Z, and the retail class ranked below its competitive median for 2014 and the total expense ratio of each of Class T, Class B, and Class C ranked above its competitive median for 2014. The Board considered that, in general, various factors can affect total expense ratios. The Board noted that the total expense ratio of Class T was above the competitive median primarily because of higher 12b-1 fees on Class T as compared to most competitor funds. Class T has a higher 12b-1 fee, but a lower front-end sales charge, than traditionally priced front-end sales charge classes. The Board considered that Class T is primarily sold load-waived in the retirement plan market where its 0.50% 12b-1 fee is comparable to competing no-load, higher 12b-1 fee classes designed specifically for retirement plans. The Board noted that the fund offers multiple classes, each of which has a different sales load and 12b-1 fee structure, and that the multiple structures are intended to offer a range of pricing options for the intermediary market. The Board also noted that the total expense ratios of the classes vary primarily by the level of their 12b-1 fees, although differences in transfer agent fees may also cause expenses to vary from class to class.
Annual Report
The Board further considered that FMR contractually agreed to reimburse Class A, Class T, Class B, Class C, Class I, Class Z, and the retail class of the fund to the extent that total operating expenses (excluding interest, certain taxes, certain securities lending costs, brokerage commissions, extraordinary expenses, and acquired fund fees and expenses, if any), as a percentage of their respective average net assets, exceed 1.45%, 1.70%, 2.20%, 2.20%, 1.20%, 1.05%, and 1.20% through December 31, 2015.
Fees Charged to Other Fidelity Clients. The Board also considered Fidelity fee structures and other information with respect to clients of Fidelity, such as other funds advised or subadvised by Fidelity, pension plan clients, and other institutional clients with similar mandates. The Board noted the findings of the 2013 ad hoc joint committee (created with the board of other Fidelity funds), which reviewed and compared Fidelity's institutional investment advisory business with its business of providing services to the Fidelity funds, including the differences in services provided, fees charged, and costs incurred, as well as competition in their respective marketplaces.
Based on its review of total expense ratios and fees charged to other Fidelity clients, the Board concluded that, although in some cases above the median of the universe presented for comparison, the total expense ratio of each class of the fund was reasonable in light of the services that the fund and its shareholders receive and the other factors considered.
Costs of the Services and Profitability. The Board considered the revenues earned and the expenses incurred by Fidelity in conducting the business of developing, marketing, distributing, managing, administering and servicing the fund and servicing the fund's shareholders. The Board also considered the level of Fidelity's profits in respect of all the Fidelity funds.
On an annual basis, Fidelity presents to the Board information about the profitability of its relationship with the fund. Fidelity calculates profitability information for each fund, as well as aggregate profitability information for groups of Fidelity funds and all Fidelity funds, using a series of detailed revenue and cost allocation methodologies which originate with the books and records of Fidelity on which Fidelity's audited financial statements are based. The Audit Committee of the Board reviews any significant changes from the prior year's methodologies.
Annual Report
Board Approval of Investment Advisory Contracts and
Management Fees - continued
PricewaterhouseCoopers LLP (PwC), independent registered public accounting firm and auditor to Fidelity and certain Fidelity funds, has been engaged annually by the Board as part of the Board's assessment of Fidelity's profitability analysis. PwC's engagement includes the review and assessment of the methodologies used by Fidelity in determining the revenues and expenses attributable to Fidelity's mutual fund business, and completion of agreed-upon procedures in respect of the mathematical accuracy of fund profitability and its conformity to established allocation methodologies. After considering PwC's reports issued under the engagement and information provided by Fidelity, the Board concluded that while other allocation methods may also be reasonable, Fidelity's profitability methodologies are reasonable in all material respects.
The Board also reviewed Fidelity's non-fund businesses and fall-out benefits related to the mutual fund business as well as cases where Fidelity's affiliates may benefit from or be related to the fund's business.
The Board considered the costs of the services provided by and the profits realized by Fidelity in connection with the operation of the fund and was satisfied that the profitability was not excessive.
Economies of Scale. The Board considered whether there have been economies of scale in respect of the management of the Fidelity funds, whether the Fidelity funds (including the fund) have appropriately benefited from any such economies of scale, and whether there is potential for realization of any further economies of scale. The Board considered the extent to which the fund will benefit from economies of scale as assets grow through increased services to the fund, through waivers or reimbursements, or through fee or expense ratio reductions. The Board also noted that in 2013, it and the boards of other Fidelity funds created an ad hoc committee (the Economies of Scale Committee) to analyze whether Fidelity attains economies of scale in respect of the management and servicing of the Fidelity funds, whether the Fidelity funds have appropriately benefited from such economies of scale, and whether there is potential for realization of any further economies of scale.
The Board recognized that the fund's management contract incorporates a "group fee" structure, which provides for lower group fee rates as total group assets increase, and for higher group fee rates as total group assets decrease (with "group assets" defined to include fund assets under FMR's management plus sector fund assets previously under FMR's management and currently managed by Fidelity SelectCo, LLC). FMR calculates the group fee rates based on a tiered asset "breakpoint" schedule that varies based on asset class. The Board considered that the group fee is designed to deliver the benefits of economies of scale to fund shareholders when total Fidelity fund assets increase, even if assets of any particular fund are unchanged or have declined, because some portion of Fidelity's costs are attributable to services provided to all Fidelity funds, and all funds benefit if those costs can be allocated among more assets. The Board concluded that, given the group fee structure, fund shareholders will benefit from lower management fees as group assets increase at the fund complex level, regardless of whether Fidelity achieves any such economies of scale.
Annual Report
The Board concluded, taking into account the analysis of the Economies of Scale Committee, that economies of scale, if any, are being appropriately shared between fund shareholders and Fidelity.
Additional Information Requested by the Board. In order to develop fully the factual basis for consideration of the Fidelity funds' Advisory Contracts, the Board requested and received additional information on certain topics, including: (i) fund performance trends and Fidelity's long-term strategies for certain funds; (ii) the various share classes employed by Fidelity and the attributes of each class, together with similar information on the distribution and servicing payments made by Fidelity or the funds to third-party participants in the distribution channels; (iii) fund profitability, and fund performance in relation to fund profitability; (iv) the methodology with respect to evaluating competitive fund data and peer group classifications and fee comparisons; (v) annual fund profitability margins, with particular focus on certain funds with negative margins; (vi) the realization of fall-out benefits in certain Fidelity business units; (vii) economies of scale and the way in which they are shared with fund shareholders; (viii) Fidelity's group fee structures, including the group fee schedule of breakpoints; (ix) the impact of cost containment measures on the funds; and (x) the transfer agent fee structure.
Based on its evaluation of all of the conclusions noted above, and after considering all factors it believed relevant, the Board concluded that the advisory fee structures are fair and reasonable, and that the fund's Advisory Contracts should be renewed.
Annual Report
Investment Adviser
Fidelity Management & Research Company
Boston, MA
Investment Sub-Advisers
FMR Co., Inc.
FMR Investment Management
(U.K.) Limited
Fidelity Management & Research
(Hong Kong) Limited
Fidelity Management & Research
(Japan) Limited
FIL Investment Advisors
FIL Investments (Japan) Limited
FIL Investment Advisors (UK) Limited
General Distributor
Fidelity Distributors Corporation
Smithfield, RI
Transfer and Service Agents
Fidelity Investments Institutional Operations Company, Inc.
Boston, MA
Fidelity Service Company, Inc.
Boston, MA
Custodian
State Street Bank and Trust Company
Quincy, MA
(Fidelity Investment logo)(registered trademark)
AIGF-UANN-1215
1.853348.107
ContentsPerformance: The Bottom LineManagement's Discussion of Fund PerformanceShareholder Expense ExampleInvestment Changes (Unaudited)Investments October 31, 2015Financial StatementsNotes to Financial StatementsReport of Independent Registered Public Accounting FirmTrustees and OfficersDistributions (Unaudited)Board Approval of Investment Advisory Contracts and Management FeesContentsPerformance: The Bottom LineManagement's Discussion of Fund PerformanceShareholder Expense ExampleInvestment Changes (Unaudited)Investments October 31, 2015Financial StatementsNotes to Financial StatementsReport of Independent Registered Public Accounting FirmTrustees and OfficersDistributions (Unaudited)Board Approval of Investment Advisory Contracts and Management FeesContentsPerformance: The Bottom LineManagement's Discussion of Fund PerformanceShareholder Expense ExampleInvestment Changes (Unaudited)Investments October 31, 2015Financial StatementsNotes to Financial StatementsReport of Independent Registered Public Accounting FirmTrustees and OfficersDistributions (Unaudited)Board Approval of Investment Advisory Contracts and Management Fees
(Fidelity Investment logo)(registered trademark)
Fidelity Advisor®
Emerging Europe,
Middle East, Africa (EMEA)
Fund - Class A, Class T, Class B
and Class C
Annual Report
October 31, 2015
(Fidelity Cover Art)
Class A, Class T, Class B, and Class C are classes of Fidelity® Emerging Europe,
Middle East, Africa (EMEA) Fund
Contents
Performance | (Click Here) | How the fund has done over time. |
Management's Discussion of Fund Performance | (Click Here) | The Portfolio Manager's review of fund performance and strategy. |
Shareholder Expense Example | (Click Here) | An example of shareholder expenses. |
Investment Changes | (Click Here) | A summary of major shifts in the fund's investments over the past six months. |
Investments | (Click Here) | A complete list of the fund's investments with their market values. |
Financial Statements | (Click Here) | Statements of assets and liabilities, operations, and changes in net assets, as well as financial highlights. |
Notes | (Click Here) | Notes to the financial statements. |
Report of Independent Registered Public Accounting Firm | (Click Here) | |
Trustees and Officers | (Click Here) | |
Distributions | (Click Here) | |
Board Approval of Investment Advisory Contracts and Management Fees | (Click Here) | |
To view a fund's proxy voting guidelines and proxy voting record for the 12-month period ended June 30, visit http://www.fidelity.com/proxyvotingresults or visit the Securities and Exchange Commission's (SEC) web site at http://www.sec.gov. You may also call 1-877-208-0098 to request a free copy of the proxy voting guidelines.
Standard & Poor's, S&P and S&P 500 are registered service marks of The McGraw-Hill Companies, Inc. and have been licensed for use by Fidelity Distributors Corporation.
Other third-party marks appearing herein are the property of their respective owners.
All other marks appearing herein are registered or unregistered trademarks or service marks of FMR LLC or an affiliated company. © 2015 FMR LLC. All rights reserved.
Annual Report
This report and the financial statements contained herein are submitted for the general information of the shareholders of the fund. This report is not authorized for distribution to prospective investors in the fund unless preceded or accompanied by an effective prospectus.
A fund files its complete schedule of portfolio holdings with the SEC for the first and third quarters of each fiscal year on Form N-Q. Forms N-Q are available on the SEC's web site at http://www.sec.gov. A fund's Forms N-Q may be reviewed and copied at the SEC's Public Reference Room in Washington, DC. Information regarding the operation of the SEC's Public Reference Room may be obtained by calling 1-800-SEC-0330. For a complete list of a fund's portfolio holdings, view the most recent holdings listing, semiannual report, or annual report on Fidelity's web site at http://www.fidelity.com, http://www.advisor.fidelity.com, or http://www.401k.com, as applicable.
NOT FDIC INSURED • MAY LOSE VALUE • NO BANK GUARANTEE
Neither the fund nor Fidelity Distributors Corporation is a bank.
Annual Report
Average annual total return reflects the change in the value of an investment, assuming reinvestment of the class' distributions from dividend income and capital gains (the profits earned upon the sale of securities that have grown in value, if any) and assuming a constant rate of performance each year. The $10,000 table and the fund's returns do not reflect the deduction of taxes that a shareholder would pay on fund distributions or the redemption of fund shares. During periods of reimbursement by Fidelity, a fund's total return will be greater than it would be had the reimbursement not occurred. How a fund did yesterday is no guarantee of how it will do tomorrow. Returns reflect the conversion of Class B shares to Class A shares after a maximum of seven years.
Average Annual Total Returns
Periods ended October 31, 2015 | Past 1
year | Past 5
years | Life of
fundA |
Class A (incl. 5.75% sales charge) | -20.28% | -2.99% | -3.22% |
Class T (incl. 3.50% sales charge) | -18.74% | -2.83% | -3.19% |
Class B (incl. contingent deferred sales charge) B | -20.31% | -2.99% | -3.15% |
Class C (incl. contingent deferred sales charge) C | -16.90% | -2.58% | -3.20% |
A From May 8, 2008.
B Class B shares' contingent deferred sales charges included in the past one year, past five years, and life of fund total return figures are 5%, 2% and 0%, respectively.
C Class C shares' contingent deferred sales charges included the past one year, past five years, and life of fund total return figures are 1%, 0%, and 0%, respectively.
Annual Report
$10,000 Over Life of Fund
Let's say hypothetically that $10,000 was invested in Fidelity Advisor® Emerging Europe, Middle East, Africa (EMEA) Fund - Class A on May 8, 2008, when the fund started, and the current 5.75% sales charge was paid. The chart shows how the value of your investment would have changed, and also shows how the MSCI EM (Emerging Markets) Europe, Middle East and Africa Index performed over the same period.
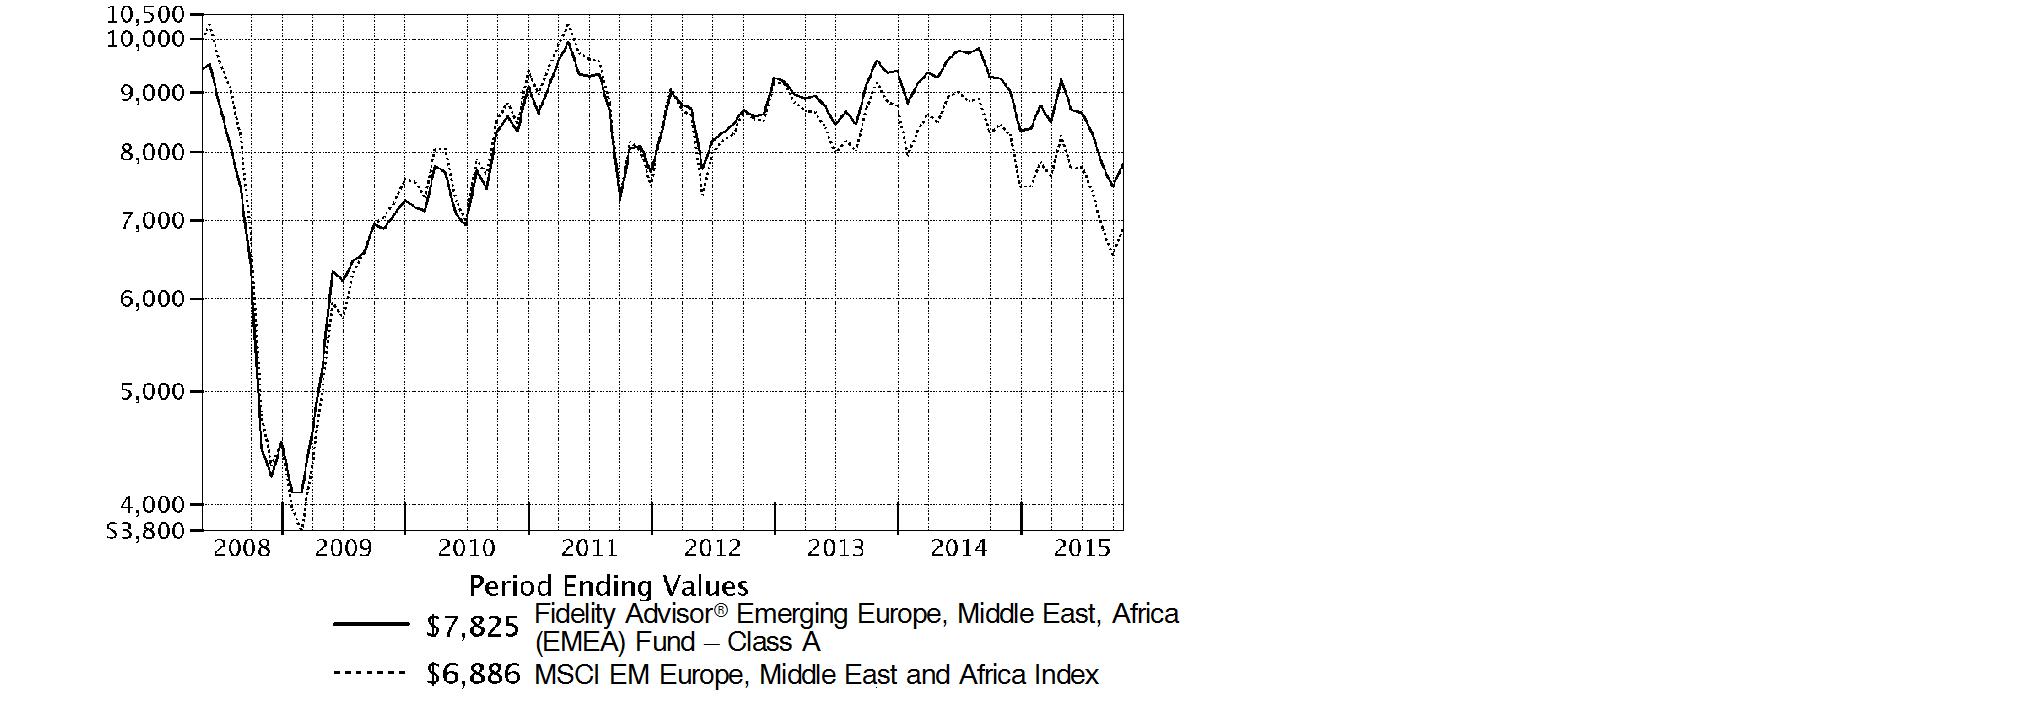
Annual Report
Market Recap: International equities suffered a moderate setback for the 12 months ending October 31, 2015, held back by a collapse in commodities prices that hurt resources-related sectors and geographies. The MSCI ACWI (All Country World Index) ex USA Index returned -4.55% for the period, affected also by concerns about global economic growth. Commodity producers remained under pressure for much of the past year, largely related to economic deceleration in China (-1%), the world's second-largest economy and a leading consumer of raw materials. This effect was exacerbated by U.S. dollar strength relative to global currencies, which weighed on commodities priced in dollars and acutely impacted equity returns within regions most exposed to resources prices. The emerging-markets group, for example, returned about -15% this period. Canada, a significant energy producer, returned roughly -17%. Net energy consumer Japan (+9%) was the best-performing region by far. Only about a quarter of the nearly 50 index countries managed a gain this period: Ireland (+19%) - the EU's fastest-growing economy - and Israel (+17%) proved top performers; Greece (-56%) and Brazil (-46%), among the worst. As for sectors, energy (-25%) and materials (-16%) declined sharply, whereas the two consumer sectors each gained about 6%.
Comments from Portfolio Manager Adam Kutas: For the year, the fund's share classes (excluding sales charges, if applicable) delivered double-digit negative results, but solidly outpaced the -18.36% return of the MSCI EM (Emerging Markets) Europe, Middle East and Africa Index. The past 12 months posed challenges for emerging EMEA markets, as the commodities collapse weighed heavily on commodity-rich nations, especially Russia. For the period, the fund derived most of its advantage versus the benchmark from stock selection. Our picks among banks had the biggest impact. Here, Romanian bank Banca Transilvania, a non-benchmark holding, performed well, as the Romanian economy began improving. Russia's government-owned Sberbank also helped. With the Russian economy under pressure as oil fell sharply in the fourth quarter of 2014, I was able to establish a position in Sberbank, making it one of the fund's largest overweightings by period end. The stock rose steadily through the end of October. Conversely, the fund's positioning in energy detracted. The fund's most significant detractor was untimely ownership of South African private equity investor Steinhoff International Holdings.
The views expressed above reflect those of the portfolio manager(s) only through the end of the period as stated on the cover of this report and do not necessarily represent the views of Fidelity or any other person in the Fidelity organization. Any such views are subject to change at any time based upon market or other conditions and Fidelity disclaims any responsibility to update such views. These views may not be relied on as investment advice and, because investment decisions for a Fidelity fund are based on numerous factors, may not be relied on as an indication of trading intent on behalf of any Fidelity fund.
Annual Report
Shareholder Expense Example
As a shareholder of the Fund, you incur two types of costs: (1) transaction costs, including sales charges (loads) on purchase payments or redemption proceeds, redemption fees and (2) ongoing costs, including management fees, distribution and/or service (12b-1) fees and other Fund expenses. This Example is intended to help you understand your ongoing costs (in dollars) of investing in the Fund and to compare these costs with the ongoing costs of investing in other mutual funds.
The Example is based on an investment of $1,000 invested at the beginning of the period and held for the entire period (May 1, 2015 to October 31, 2015).
Actual Expenses
The first line of the accompanying table for each class of the Fund provides information about actual account values and actual expenses. You may use the information in this line, together with the amount you invested, to estimate the expenses that you paid over the period. Simply divide your account value by $1,000.00 (for example, an $8,600 account value divided by $1,000.00 = 8.6), then multiply the result by the number in the first line for a class of the Fund under the heading entitled "Expenses Paid During Period" to estimate the expenses you paid on your account during this period. A small balance maintenance fee of $12.00 that is charged once a year may apply for certain accounts with a value of less than $2,000. This fee is not included in the table below. If it was, the estimate of expenses you paid during the period would be higher, and your ending account value lower, by this amount. In addition, the Fund, as a shareholder in the underlying Fidelity Central Funds, will indirectly bear its pro-rata share of the fees and expenses incurred by the underlying Fidelity Central Funds. These fees and expenses are not included in the Fund's annualized expense ratio used to calculate the expense estimate in the table below.
Hypothetical Example for Comparison Purposes
The second line of the accompanying table for each class of the Fund provides information about hypothetical account values and hypothetical expenses based on a Class' actual expense ratio and an assumed rate of return of 5% per year before expenses, which is not the Class' actual return. The hypothetical account values and expenses may not be used to estimate the actual ending account balance or expenses you paid for the period. You may use this information to compare the ongoing costs of investing in the Fund and other funds. To do so, compare this 5% hypothetical example with the 5% hypothetical examples that appear in the shareholder reports of the other funds. A small balance maintenance fee of $12.00 that is charged once a year may apply for certain accounts with a value of less than $2,000. This fee is not included in the table below. If it was, the estimate of expenses you paid during the period would be higher, and your ending account value lower, by this amount. In addition, the Fund, as a shareholder in the underlying Fidelity Central Funds, will indirectly bear its pro-rata share of the fees and expenses incurred by the underlying Fidelity Central Funds. These fees and expenses are not included in the Fund's annualized expense ratio used to calculate the expense estimate in the table below.
Please note that the expenses shown in the table are meant to highlight your ongoing costs only and do not reflect any transaction costs. Therefore, the second line of the table is useful in comparing ongoing costs only, and will not help you determine the relative total costs of owning different funds. In addition, if these transactional costs were included, your costs would have been higher.
Annual Report
| Annualized
Expense Ratio B | Beginning
Account Value
May 1, 2015 | Ending
Account Value
October 31, 2015 | Expenses Paid
During Period C
May 1, 2015
to October 31, 2015 |
Class A | 1.57% | | | |
Actual | | $ 1,000.00 | $ 847.30 | $ 7.31 |
HypotheticalA | | $ 1,000.00 | $ 1,017.29 | $ 7.98 |
Class T | 1.90% | | | |
Actual | | $ 1,000.00 | $ 845.50 | $ 8.84 |
HypotheticalA | | $ 1,000.00 | $ 1,015.63 | $ 9.65 |
Class B | 2.40% | | | |
Actual | | $ 1,000.00 | $ 843.60 | $ 11.15 |
HypotheticalA | | $ 1,000.00 | $ 1,013.11 | $ 12.18 |
Class C | 2.40% | | | |
Actual | | $ 1,000.00 | $ 844.60 | $ 11.16 |
HypotheticalA | | $ 1,000.00 | $ 1,013.11 | $ 12.18 |
Emerging Europe, Middle East, Africa (EMEA) | 1.36% | | | |
Actual | | $ 1,000.00 | $ 847.50 | $ 6.33 |
HypotheticalA | | $ 1,000.00 | $ 1,018.35 | $ 6.92 |
Class I | 1.19% | | | |
Actual | | $ 1,000.00 | $ 848.40 | $ 5.54 |
HypotheticalA | | $ 1,000.00 | $ 1,019.21 | $ 6.06 |
A 5% return per year before expenses
B Annualized expense ratio reflects expenses net of applicable fee waivers.
C Expenses are equal to each Class' annualized expense ratio, multiplied by the average account value over the period, multiplied by 184/365 (to reflect the one-half year period).
Annual Report
Investment Changes (Unaudited)
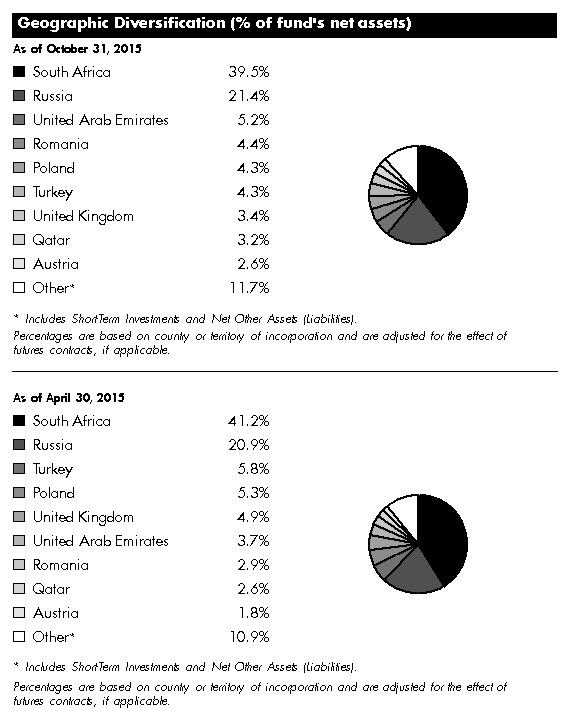
Asset Allocation as of October 31, 2015 |
| % of fund's
net assets | % of fund's net assets
6 months ago |
Stocks | 100.0 | 99.9 |
Short-Term Investments and Net Other Assets (Liabilities) | 0.0 | 0.1 |
Top Ten Stocks as of October 31, 2015 |
| % of fund's
net assets | % of fund's net assets
6 months ago |
Naspers Ltd. Class N (South Africa, Media) | 8.0 | 7.3 |
Sberbank of Russia (Russia, Banks) | 4.7 | 4.1 |
Lukoil PJSC (Russia, Oil, Gas & Consumable Fuels) | 3.9 | 5.5 |
Gazprom OAO (Russia, Oil, Gas & Consumable Fuels) | 3.7 | 4.9 |
MTN Group Ltd. (South Africa, Wireless Telecommunication Services) | 3.1 | 5.4 |
Remgro Ltd. (South Africa, Diversified Financial Services) | 2.6 | 2.4 |
FirstRand Ltd. (South Africa, Diversified Financial Services) | 2.6 | 2.9 |
Steinhoff International Holdings Ltd. (South Africa, Household Durables) | 2.4 | 0.1 |
Sasol Ltd. (South Africa, Oil, Gas & Consumable Fuels) | 2.2 | 2.4 |
Surgutneftegas OJSC (Russia, Oil, Gas & Consumable Fuels) | 2.1 | 1.7 |
| 35.3 | |
Market Sectors as of October 31, 2015 |
| % of fund's
net assets | % of fund's net assets
6 months ago |
Financials | 39.3 | 35.9 |
Consumer Discretionary | 18.0 | 16.3 |
Energy | 14.9 | 16.6 |
Consumer Staples | 11.8 | 9.3 |
Materials | 5.2 | 5.9 |
Telecommunication Services | 4.2 | 8.1 |
Health Care | 3.5 | 4.3 |
Industrials | 3.1 | 3.1 |
Information Technology | 0.0 | 0.4 |
Market Sectors may include more than one industry category. |
The fund may invest up to 35% of its total assets in any industry that represents more than 20% of the emerging Europe, Middle East and Africa markets. As of October 31, 2015, the fund did not have more than 25% of its total assets invested in any one industry. |
Percentages shown as 0.0% may reflect amounts less than 0.05%. |
Annual Report
Investments October 31, 2015
Showing Percentage of Net Assets
Common Stocks - 96.4% |
| Shares | | Value |
Austria - 2.6% |
CA Immobilien Anlagen AG | 39,100 | | $ 766,839 |
Erste Group Bank AG (a) | 29,100 | | 853,435 |
Wienerberger AG | 31,000 | | 571,505 |
TOTAL AUSTRIA | | 2,191,779 |
Bailiwick of Jersey - 0.5% |
Wizz Air Holdings PLC | 13,888 | | 405,715 |
Bermuda - 0.2% |
Aquarius Platinum Ltd. (a) | 937,700 | | 165,329 |
Botswana - 0.4% |
First National Bank of Botswana Ltd. | 964,358 | | 344,843 |
British Virgin Islands - 0.4% |
Lenta Ltd. GDR (a) | 49,000 | | 367,990 |
Croatia - 0.5% |
Ledo d.d. | 282 | | 388,137 |
Czech Republic - 1.3% |
Komercni Banka A/S | 5,049 | | 1,044,981 |
Estonia - 0.6% |
Tallinna Kaubamaja AS | 70,900 | | 498,977 |
Greece - 0.7% |
Jumbo SA | 26,536 | | 256,787 |
Sarantis SA | 37,800 | | 305,516 |
TOTAL GREECE | | 562,303 |
Hungary - 1.4% |
OTP Bank PLC | 62,000 | | 1,201,442 |
Israel - 0.6% |
Delta Galil Industries Ltd. | 5,500 | | 173,139 |
Osem Investment Ltd. | 13,800 | | 266,966 |
Rami Levi Chain Stores Hashikma Marketing 2006 Ltd. | 2,000 | | 94,078 |
TOTAL ISRAEL | | 534,183 |
Kenya - 0.9% |
British American Tobacco Kenya Ltd. | 31,700 | | 238,565 |
Kenya Commercial Bank Ltd. | 756,500 | | 298,375 |
Safaricom Ltd. | 1,516,544 | | 213,252 |
TOTAL KENYA | | 750,192 |
Lithuania - 0.6% |
Apranga AB (a) | 163,766 | | 466,421 |
Common Stocks - continued |
| Shares | | Value |
Luxembourg - 0.5% |
Pegas NONWOVENS SA | 13,700 | | $ 428,155 |
Malta - 0.7% |
Brait SA | 48,000 | | 550,861 |
Netherlands - 0.4% |
AmRest Holdings NV (a) | 6,600 | | 308,536 |
Nigeria - 0.7% |
Zenith Bank PLC | 6,384,656 | | 564,531 |
Pakistan - 0.7% |
Millat Tractors Ltd. | 45,000 | | 248,649 |
United Bank Ltd. | 190,000 | | 295,544 |
TOTAL PAKISTAN | | 544,193 |
Poland - 4.3% |
Bank Handlowy w Warszawie SA | 21,000 | | 427,624 |
Bank Polska Kasa Opieki SA | 19,500 | | 758,181 |
Inter Cars SA | 3,700 | | 226,537 |
Kruk SA | 10,000 | | 476,018 |
NG2 SA | 11,800 | | 516,051 |
Orbis SA | 50,200 | | 766,442 |
Quercus TFI SA | 250,000 | | 423,098 |
TOTAL POLAND | | 3,593,951 |
Qatar - 3.2% |
Al Meera Consumer Goods Co. (a) | 6,496 | | 418,285 |
Qatar Insurance Co. (a) | 22,691 | | 579,703 |
Qatar National Bank SAQ (a) | 32,850 | | 1,646,899 |
TOTAL QATAR | | 2,644,887 |
Romania - 4.4% |
Banca Transilvania SA (a) | 2,204,397 | | 1,385,897 |
BRD-Groupe Societe Generale (a) | 453,129 | | 1,314,834 |
Bursa de Valori Bucuresti | 73,404 | | 553,422 |
Fondul Propietatea SA GDR | 39,000 | | 401,700 |
TOTAL ROMANIA | | 3,655,853 |
Russia - 17.8% |
Gazprom OAO (a) | 1,463,600 | | 3,110,360 |
Lukoil PJSC (a) | 8,100 | | 294,372 |
Lukoil PJSC sponsored ADR | 81,195 | | 2,947,379 |
Magnit OJSC (a) | 8,592 | | 1,498,814 |
Megafon OJSC GDR | 60,800 | | 787,360 |
Moscow Exchange MICEX-RTS OAO (a) | 755,000 | | 1,062,529 |
Common Stocks - continued |
| Shares | | Value |
Russia - continued |
NOVATEK OAO (a) | 130,000 | | $ 1,189,881 |
Sberbank of Russia (a) | 2,760,970 | | 3,914,623 |
TOTAL RUSSIA | | 14,805,318 |
Slovenia - 0.6% |
Krka dd Novo mesto | 6,700 | | 478,898 |
South Africa - 39.5% |
AngloGold Ashanti Ltd. (a) | 106,400 | | 897,795 |
Aspen Pharmacare Holdings Ltd. | 43,300 | | 972,474 |
Cashbuild Ltd. | 18,300 | | 437,037 |
Clicks Group Ltd. | 137,552 | | 1,004,878 |
DRDGOLD Ltd. | 4,469,214 | | 724,152 |
FirstRand Ltd. | 586,600 | | 2,152,859 |
Holdsport Ltd. | 171,700 | | 782,259 |
Hulamin Ltd. | 996,200 | | 480,140 |
Liberty Holdings Ltd. | 51,400 | | 503,415 |
MTN Group Ltd. | 228,850 | | 2,605,369 |
Nampak Ltd. | 467,100 | | 757,067 |
Naspers Ltd. Class N | 45,500 | | 6,664,393 |
Netcare Ltd. | 310,000 | | 882,802 |
Peregrine Holdings Ltd. | 125,000 | | 278,109 |
Pioneer Foods Ltd. | 68,000 | | 975,359 |
PSG Konsult Ltd. | 96,618 | | 56,900 |
Remgro Ltd. | 109,800 | | 2,199,808 |
RMB Holdings Ltd. | 164,600 | | 802,602 |
Sasol Ltd. | 57,500 | | 1,842,397 |
Shoprite Holdings Ltd. | 120,100 | | 1,249,686 |
Spar Group Ltd. | 89,200 | | 1,281,634 |
Spur Corp. Ltd. | 85,000 | | 206,680 |
Standard Bank Group Ltd. | 169,763 | | 1,765,589 |
Steinhoff International Holdings Ltd. | 321,700 | | 1,969,160 |
Taste Holdings Ltd. | 900,000 | | 210,059 |
Truworths International Ltd. | 164,000 | | 1,110,991 |
TOTAL SOUTH AFRICA | | 32,813,614 |
Turkey - 4.3% |
Aselsan A/S | 105,000 | | 502,418 |
Gubre Fabrikalari TAS | 338,000 | | 764,019 |
Koc Holding A/S | 188,850 | | 852,918 |
Soda Sanayii AS | 283,622 | | 468,909 |
Common Stocks - continued |
| Shares | | Value |
Turkey - continued |
Turk Tuborg Bira ve Malt Sanayii A/S (a) | 80,000 | | $ 172,052 |
Turkiye Garanti Bankasi A/S | 321,000 | | 831,207 |
TOTAL TURKEY | | 3,591,523 |
United Arab Emirates - 5.2% |
Agthia Group PJSC | 340,000 | | 708,140 |
Aldar Properties PJSC (a) | 1,109,585 | | 688,770 |
Dubai Islamic Bank Pakistan Ltd. (a) | 425,219 | | 749,024 |
Emaar Malls Group PJSC (a) | 590,000 | | 502,777 |
First Gulf Bank PJSC | 286,313 | | 962,691 |
SHUAA Capital PSC (a) | 5,249,942 | | 721,813 |
TOTAL UNITED ARAB EMIRATES | | 4,333,215 |
United Kingdom - 3.4% |
Abdullah Al Othaim Markets Co. ELS (HSBC Warrant Program) warrants 7/31/17 (a)(b) | 17,836 | | 439,944 |
Al Noor Hospitals Group PLC | 11,100 | | 201,234 |
Alabama Khaleej Training & Education ELS (HSBC Bank Warrant Program) warrants 7/18/16 (a)(b) | 37,010 | | 424,719 |
NMC Health PLC | 23,900 | | 280,753 |
Saudi Dairy & Foodstuff Co. ELS (HSBC Warrant Program) warrants 6/4/18 (b) | 14,000 | | 496,467 |
Savola Group ELS (HSBC Warrant Program) warrants 2/6/17 (b) | 39,200 | | 549,040 |
United International Transportation Co. ELS (HSBC Warrant Program) warrants 7/31/17 (b) | 33,634 | | 439,426 |
TOTAL UNITED KINGDOM | | 2,831,583 |
TOTAL COMMON STOCKS (Cost $77,454,944) |
80,067,410
|
Nonconvertible Preferred Stocks - 3.6% |
| Shares | | Value |
Russia - 3.6% |
Surgutneftegas OJSC (a) | 2,598,600 | | $ 1,771,368 |
Tatneft OAO (a) | 433,800 | | 1,229,284 |
TOTAL NONCONVERTIBLE PREFERRED STOCKS (Cost $2,739,936) |
3,000,652
|
TOTAL INVESTMENT PORTFOLIO - 100.0% (Cost $80,194,880) | | 83,068,062 |
NET OTHER ASSETS (LIABILITIES) - 0.0% | | 7,373 |
NET ASSETS - 100% | $ 83,075,435 |
Security Type Abbreviations |
ELS | - | Equity-Linked Security |
Legend |
(a) Non-income producing |
(b) Security exempt from registration under Rule 144A of the Securities Act of 1933. These securities may be resold in transactions exempt from registration, normally to qualified institutional buyers. At the end of the period, the value of these securities amounted to $2,349,596 or 2.8% of net assets. |
Affiliated Central Funds |
Information regarding fiscal year to date income earned by the Fund from investments in Fidelity Central Funds is as follows: |
Fund | Income earned |
Fidelity Cash Central Fund | $ 1,100 |
Fidelity Securities Lending Cash Central Fund | 999 |
Total | $ 2,099 |
Other Information |
Categorizations in the Schedule of Investments are based on country or territory of incorporation. |
The following is a summary of the inputs used, as of October 31, 2015, involving the Fund's assets and liabilities carried at fair value. The inputs or methodology used for valuing securities may not be an indication of the risk associated with investing in those securities. For more information on valuation inputs, and their aggregation into the levels used in the tables below, please refer to the Investment Valuation section in the accompanying Notes to Financial Statements. |
Valuation Inputs at Reporting Date: |
Description | Total | Level 1 | Level 2 | Level 3 |
Investments in Securities: | | | | |
Equities: | | | | |
Consumer Discretionary | $ 14,947,366 | $ 14,522,647 | $ 424,719 | $ - |
Consumer Staples | 9,909,021 | 9,469,077 | 439,944 | - |
Energy | 12,385,041 | 5,660,916 | 6,724,125 | - |
Financials | 32,565,876 | 26,335,113 | 6,230,763 | - |
Health Care | 2,816,161 | 2,816,161 | - | - |
Industrials | 2,581,205 | 1,728,287 | 852,918 | - |
Materials | 4,257,411 | 2,635,464 | 1,621,947 | - |
Telecommunication Services | 3,605,981 | 1,000,612 | 2,605,369 | - |
Total Investments in Securities: | $ 83,068,062 | $ 64,168,277 | $ 18,899,785 | $ - |
The following is a summary of transfers between Level 1 and Level 2 for the period ended October 31, 2015. Transfers are assumed to have occurred at the beginning of the period, and are primarily attributable to the valuation techniques used for foreign equity securities, as discussed in the accompanying Notes to Financial Statements: |
Transfers | Total |
Level 1 to Level 2 | $ 10,300,566 |
Level 2 to Level 1 | $ 0 |
Valuation Inputs at Reporting Date: |
The following is a reconciliation of Investments in Securities for which Level 3 inputs were used in determining value: |
Investments in Securities: | |
Consumer Discretionary | |
Beginning Balance | $ 1,010,924 |
Net Realized Gain (Loss) on Investment Securities | 3,818 |
Net Unrealized Gain (Loss) on Investment Securities | (167,185) |
Cost of Purchases | - |
Proceeds of Sales | (847,557) |
Amortization/Accretion | - |
Transfers into Level 3 | - |
Transfers out of Level 3 | - |
Ending Balance | $ - |
The change in unrealized gain (loss) for the period attributable to Level 3 securities held at October 31, 2015 | $ - |
The information used in the above reconciliation represents fiscal year to date activity for any Investments in Securities identified as using Level 3 inputs at either the beginning or the end of the current fiscal period. Transfers in or out of Level 3 represent the beginning value of any Security or Instrument where a change in the pricing level occurred from the beginning to the end of the period. The cost of purchases and the proceeds of sales may include securities received or delivered through corporate actions or exchanges. Realized and unrealized gains (losses) disclosed in the reconciliation are included in Net Gain (Loss) on the Fund's Statement of Operations. |
See accompanying notes which are an integral part of the financial statements.
Annual Report
Statement of Assets and Liabilities
| | October 31, 2015 |
| | |
Assets | | |
Investment in securities, at value - See accompanying schedule: Unaffiliated issuers (cost $80,194,880) | | $ 83,068,062 |
Cash | | 33,662 |
Foreign currency held at value (cost $14,630) | | 14,728 |
Receivable for investments sold | | 436,674 |
Receivable for fund shares sold | | 73,284 |
Dividends receivable | | 34,799 |
Distributions receivable from Fidelity Central Funds | | 243 |
Prepaid expenses | | 257 |
Other receivables | | 381 |
Total assets | | 83,662,090 |
| | |
Liabilities | | |
Payable for investments purchased | $ 223,400 | |
Payable for fund shares redeemed | 153,637 | |
Accrued management fee | 56,683 | |
Distribution and service plan fees payable | 5,768 | |
Other affiliated payables | 23,539 | |
Other payables and accrued expenses | 123,628 | |
Total liabilities | | 586,655 |
| | |
Net Assets | | $ 83,075,435 |
Net Assets consist of: | | |
Paid in capital | | $ 96,799,934 |
Undistributed net investment income | | 1,236,658 |
Accumulated undistributed net realized gain (loss) on investments and foreign currency transactions | | (17,821,503) |
Net unrealized appreciation (depreciation) on investments and assets and liabilities in foreign currencies | | 2,860,346 |
Net Assets | | $ 83,075,435 |
See accompanying notes which are an integral part of the financial statements.
Annual Report
Statement of Assets and Liabilities - continued
| | October 31, 2015 |
Calculation of Maximum Offering Price | | |
Class A:
Net Asset Value and redemption price per share ($5,788,153 ÷ 773,249 shares) | | $ 7.49 |
| | |
Maximum offering price per share (100/94.25 of $7.49) | | $ 7.95 |
Class T:
Net Asset Value and redemption price per share ($2,002,928 ÷ 269,128 shares) | | $ 7.44 |
| | |
Maximum offering price per share (100/96.50 of $7.44) | | $ 7.71 |
Class B:
Net Asset Value and offering price per share ($180,830 ÷ 24,112 shares)A | | $ 7.50 |
| | |
Class C:
Net Asset Value and offering price per share ($4,104,439 ÷ 555,749 shares)A | | $ 7.39 |
| | |
Emerging Europe, Middle East, Africa (EMEA):
Net Asset Value, offering price and redemption price per share ($67,521,348 ÷ 8,999,614 shares) | | $ 7.50 |
| | |
Class I:
Net Asset Value, offering price and redemption price per share ($3,477,737 ÷ 463,553 shares) | | $ 7.50 |
A Redemption price per share is equal to net asset value less any applicable contingent deferred sales charge.
See accompanying notes which are an integral part of the financial statements.
Annual Report
Financial Statements - continued
Statement of Operations
| Year ended October 31, 2015 |
| | |
Investment Income | | |
Dividends | | $ 3,458,483 |
Income from Fidelity Central Funds | | 2,099 |
Income before foreign taxes withheld | | 3,460,582 |
Less foreign taxes withheld | | (395,582) |
Total income | | 3,065,000 |
| | |
Expenses | | |
Management fee | $ 788,345 | |
Transfer agent fees | 274,869 | |
Distribution and service plan fees | 85,027 | |
Accounting and security lending fees | 51,130 | |
Custodian fees and expenses | 104,573 | |
Independent trustees' compensation | 432 | |
Registration fees | 73,266 | |
Audit | 64,345 | |
Legal | 280 | |
Miscellaneous | 945 | |
Total expenses before reductions | 1,443,212 | |
Expense reductions | (11,325) | 1,431,887 |
Net investment income (loss) | | 1,633,113 |
Realized and Unrealized Gain (Loss) | | |
Net realized gain (loss) on: | | |
Investment securities: | | |
Unaffiliated issuers (net of foreign taxes of $141,196) | (10,743,685) | |
Foreign currency transactions | (36,996) | |
Total net realized gain (loss) | | (10,780,681) |
Change in net unrealized appreciation (depreciation) on: Investment securities (net of decrease in deferred foreign taxes of $49,419) | (7,779,317) | |
Assets and liabilities in foreign currencies | 361 | |
Total change in net unrealized appreciation (depreciation) | | (7,778,956) |
Net gain (loss) | | (18,559,637) |
Net increase (decrease) in net assets resulting from operations | | $ (16,926,524) |
See accompanying notes which are an integral part of the financial statements.
Annual Report
Statement of Changes in Net Assets
| Year ended
October 31,
2015 | Year ended
October 31,
2014 |
Increase (Decrease) in Net Assets | | |
Operations | | |
Net investment income (loss) | $ 1,633,113 | $ 2,097,602 |
Net realized gain (loss) | (10,780,681) | (4,234,408) |
Change in net unrealized appreciation (depreciation) | (7,778,956) | (2,810,920) |
Net increase (decrease) in net assets resulting from operations | (16,926,524) | (4,947,726) |
Distributions to shareholders from net investment income | (2,091,570) | (1,921,556) |
Distributions to shareholders from net realized gain | (504,771) | - |
Total distributions | (2,596,341) | (1,921,556) |
Share transactions - net increase (decrease) | (17,106,646) | (15,497,892) |
Redemption fees | 15,219 | 42,040 |
Total increase (decrease) in net assets | (36,614,292) | (22,325,134) |
| | |
Net Assets | | |
Beginning of period | 119,689,727 | 142,014,861 |
End of period (including undistributed net investment income of $1,236,658 and undistributed net investment income of $1,899,047, respectively) | $ 83,075,435 | $ 119,689,727 |
See accompanying notes which are an integral part of the financial statements.
Annual Report
Financial Highlights - Fidelity Emerging Europe, Middle East, Africa (EMEA) Fund Class A
Years ended October 31, | 2015 | 2014 | 2013 | 2012 | 2011 |
Selected Per-Share Data | | | | | |
Net asset value, beginning of period | $ 9.04 | $ 9.49 | $ 8.71 | $ 8.34 | $ 8.97 |
Income from Investment Operations | | | | | |
Net investment income (loss) C | .12 | .13 | .16 | .18 | .16F |
Net realized and unrealized gain (loss) | (1.50) | (.46) | .85 | .34 | (.70) |
Total from investment operations | (1.38) | (.33) | 1.01 | .52 | (.54) |
Distributions from net investment income | (.14) | (.12) | (.15) | (.15) | (.08) |
Distributions from net realized gain | (.04) | - | (.07) | - | (.02) |
Total distributions | (.17) J | (.12) | (.23) I | (.15) | (.10) |
Redemption fees added to paid in capitalC | -H | -H | -H | -H | .01 |
Net asset value, end of period | $ 7.49 | $ 9.04 | $ 9.49 | $ 8.71 | $ 8.34 |
Total ReturnA, B | (15.42)% | (3.48)% | 11.75% | 6.38% | (6.05)% |
Ratios to Average Net AssetsD, G | | | | | |
Expenses before reductions | 1.61% | 1.60% | 1.64% | 1.62% | 1.60% |
Expenses net of fee waivers, if any | 1.61% | 1.60% | 1.63% | 1.62% | 1.56% |
Expenses net of all reductions | 1.60% | 1.60% | 1.62% | 1.60% | 1.51% |
Net investment income (loss) | 1.51% | 1.45% | 1.82% | 2.09% | 1.70%F |
Supplemental Data | | | | | |
Net assets, end of period (000 omitted) | $ 5,788 | $ 7,889 | $ 10,883 | $ 8,934 | $ 10,260 |
Portfolio turnover rateE | 50% | 38% | 64% | 30% | 53% |
A Total returns would have been lower if certain expenses had not been reduced during the applicable periods shown.
B Total returns do not include the effect of the sales charges.
C Calculated based on average shares outstanding during the period.
D Fees and expenses of any underlying Fidelity Central Funds are not included in the Fund's expense ratio. The Fund indirectly bears its proportionate share of the expenses of any underlying Fidelity Central Funds.
E Amount does not include the portfolio activity of any underlying Fidelity Central Funds.
F Investment income per share reflects a large, non-recurring dividend which amounted to $.04 per share. Excluding this non-recurring dividend, the ratio of net investment income (loss) to average net assets would have been 1.25%.
G Expense ratios reflect operating expenses of the class. Expenses before reductions do not reflect amounts reimbursed by the investment adviser or reductions from brokerage service arrangements or reductions from other expense offset arrangements and do not represent the amount paid by the class during periods when reimbursements or reductions occur. Expenses net of fee waivers reflect expenses after reimbursement by the investment adviser but prior to reductions from brokerage service arrangements or other expense offset arrangements. Expenses net of all reductions represent the net expenses paid by the class.
H Amount represents less than $.005 per share.
I Total distributions of $.23 per share is comprised of distributions from net investment income of $.151 and distributions from net realized gain of $.074 per share.
J Total distributions of $.17 per share is comprised of distributions from net investment income of $.135 and distributions from net realized gain of $.039 per share.
See accompanying notes which are an integral part of the financial statements.
Annual Report
Financial Highlights - Fidelity Emerging Europe, Middle East, Africa (EMEA) Fund Class T
Years ended October 31, | 2015 | 2014 | 2013 | 2012 | 2011 |
Selected Per-Share Data | | | | | |
Net asset value, beginning of period | $ 9.01 | $ 9.46 | $ 8.68 | $ 8.31 | $ 8.96 |
Income from Investment Operations | | | | | |
Net investment income (loss) C | .10 | .11 | .14 | .15 | .13F |
Net realized and unrealized gain (loss) | (1.51) | (.46) | .84 | .35 | (.71) |
Total from investment operations | (1.41) | (.35) | .98 | .50 | (.58) |
Distributions from net investment income | (.13) | (.10) | (.12) | (.13) | (.07) |
Distributions from net realized gain | (.04) | - | (.07) | - | (.02) |
Total distributions | (.16) K | (.10) | (.20) J | (.13) | (.08) I |
Redemption fees added to paid in capitalC | -H | -H | -H | -H | .01 |
Net asset value, end of period | $ 7.44 | $ 9.01 | $ 9.46 | $ 8.68 | $ 8.31 |
Total ReturnA, B | (15.80)% | (3.67)% | 11.42% | 6.14% | (6.42)% |
Ratios to Average Net AssetsD, G | | | | | |
Expenses before reductions | 1.92% | 1.92% | 1.93% | 1.89% | 1.87% |
Expenses net of fee waivers, if any | 1.90% | 1.90% | 1.90% | 1.89% | 1.84% |
Expenses net of all reductions | 1.89% | 1.90% | 1.88% | 1.86% | 1.78% |
Net investment income (loss) | 1.22% | 1.15% | 1.55% | 1.82% | 1.42%F |
Supplemental Data | | | | | |
Net assets, end of period (000 omitted) | $ 2,003 | $ 2,465 | $ 3,465 | $ 3,336 | $ 3,502 |
Portfolio turnover rateE | 50% | 38% | 64% | 30% | 53% |
A Total returns would have been lower if certain expenses had not been reduced during the applicable periods shown.
B Total returns do not include the effect of the sales charges.
C Calculated based on average shares outstanding during the period.
D Fees and expenses of any underlying Fidelity Central Funds are not included in the Fund's expense ratio. The Fund indirectly bears its proportionate share of the expenses of any underlying Fidelity Central Funds.
E Amount does not include the portfolio activity of any underlying Fidelity Central Funds.
F Investment income per share reflects a large, non-recurring dividend which amounted to $.04 per share. Excluding this non-recurring dividend, the ratio of net investment income (loss) to average net assets would have been .98%.
G Expense ratios reflect operating expenses of the class. Expenses before reductions do not reflect amounts reimbursed by the investment adviser or reductions from brokerage service arrangements or reductions from other expense offset arrangements and do not represent the amount paid by the class during periods when reimbursements or reductions occur. Expenses net of fee waivers reflect expenses after reimbursement by the investment adviser but prior to reductions from brokerage service arrangements or other expense offset arrangements. Expenses net of all reductions represent the net expenses paid by the class.
H Amount represents less than $.005 per share.
I Total distributions of $.08 per share is comprised of distributions from net investment income of $.068 and distributions from net realized gain of $.015 per share.
J Total distributions of $.20 per share is comprised of distributions from net investment income of $.122 and distributions from net realized gain of $.074 per share.
K Total distributions of $.16 per share is comprised of distributions from net investment income of $.125 and distributions from net realized gain of $.039 per share.
See accompanying notes which are an integral part of the financial statements.
Annual Report
Financial Highlights - Fidelity Emerging Europe, Middle East, Africa (EMEA) Fund Class B
Years ended October 31, | 2015 | 2014 | 2013 | 2012 | 2011 |
Selected Per-Share Data | | | | | |
Net asset value, beginning of period | $ 9.05 | $ 9.50 | $ 8.69 | $ 8.29 | $ 8.93 |
Income from Investment Operations | | | | | |
Net investment income (loss) C | .06 | .06 | .09 | .11 | .09F |
Net realized and unrealized gain (loss) | (1.51) | (.46) | .85 | .35 | (.71) |
Total from investment operations | (1.45) | (.40) | .94 | .46 | (.62) |
Distributions from net investment income | (.06) | (.05) | (.06) | (.06) | (.02) |
Distributions from net realized gain | (.04) | - | (.07) | - | (.01) |
Total distributions | (.10) | (.05) | (.13) | (.06) | (.03) |
Redemption fees added to paid in capitalC | -H | -H | -H | -H | .01 |
Net asset value, end of period | $ 7.50 | $ 9.05 | $ 9.50 | $ 8.69 | $ 8.29 |
Total ReturnA, B | (16.16)% | (4.23)% | 10.94% | 5.56% | (6.85)% |
Ratios to Average Net AssetsD, G | | | | | |
Expenses before reductions | 2.41% | 2.40% | 2.42% | 2.38% | 2.37% |
Expenses net of fee waivers, if any | 2.40% | 2.40% | 2.40% | 2.38% | 2.33% |
Expenses net of all reductions | 2.39% | 2.40% | 2.38% | 2.35% | 2.27% |
Net investment income (loss) | .72% | .65% | 1.05% | 1.33% | .93%F |
Supplemental Data | | | | | |
Net assets, end of period (000 omitted) | $ 181 | $ 294 | $ 388 | $ 441 | $ 539 |
Portfolio turnover rateE | 50% | 38% | 64% | 30% | 53% |
A Total returns would have been lower if certain expenses had not been reduced during the applicable periods shown.
B Total returns do not include the effect of the contingent deferred sales charge.
C Calculated based on average shares outstanding during the period.
D Fees and expenses of any underlying Fidelity Central Funds are not included in the Fund's expense ratio. The Fund indirectly bears its proportionate share of the expenses of any underlying Fidelity Central Funds.
E Amount does not include the portfolio activity of any underlying Fidelity Central Funds.
F Investment income per share reflects a large, non-recurring dividend which amounted to $.04 per share. Excluding this non-recurring dividend, the ratio of net investment income (loss) to average net assets would have been .49%.
G Expense ratios reflect operating expenses of the class. Expenses before reductions do not reflect amounts reimbursed by the investment adviser or reductions from brokerage service arrangements or reductions from other expense offset arrangements and do not represent the amount paid by the class during periods when reimbursements or reductions occur. Expenses net of fee waivers reflect expenses after reimbursement by the investment adviser but prior to reductions from brokerage service arrangements or other expense offset arrangements. Expenses net of all reductions represent the net expenses paid by the class.
H Amount represents less than $.005 per share.
See accompanying notes which are an integral part of the financial statements.
Annual Report
Financial Highlights - Fidelity Emerging Europe, Middle East, Africa (EMEA) Fund Class C
Years ended October 31, | 2015 | 2014 | 2013 | 2012 | 2011 |
Selected Per-Share Data | | | | | |
Net asset value, beginning of period | $ 8.93 | $ 9.39 | $ 8.62 | $ 8.24 | $ 8.90 |
Income from Investment Operations | | | | | |
Net investment income (loss) C | .06 | .06 | .09 | .11 | .08F |
Net realized and unrealized gain (loss) | (1.48) | (.46) | .83 | .35 | (.69) |
Total from investment operations | (1.42) | (.40) | .92 | .46 | (.61) |
Distributions from net investment income | (.08) | (.06) | (.08) | (.08) | (.05) |
Distributions from net realized gain | (.04) | - | (.07) | - | (.02) |
Total distributions | (.12) | (.06) | (.15) | (.08) | (.06) I |
Redemption fees added to paid in capitalC | -H | -H | -H | -H | .01 |
Net asset value, end of period | $ 7.39 | $ 8.93 | $ 9.39 | $ 8.62 | $ 8.24 |
Total ReturnA, B | (16.08)% | (4.24)% | 10.83% | 5.68% | (6.79)% |
Ratios to Average Net AssetsD, G | | | | | |
Expenses before reductions | 2.41% | 2.40% | 2.42% | 2.37% | 2.36% |
Expenses net of fee waivers, if any | 2.40% | 2.40% | 2.40% | 2.37% | 2.33% |
Expenses net of all reductions | 2.39% | 2.40% | 2.38% | 2.35% | 2.27% |
Net investment income (loss) | .72% | .65% | 1.05% | 1.34% | .93%F |
Supplemental Data | | | | | |
Net assets, end of period (000 omitted) | $ 4,104 | $ 6,662 | $ 6,782 | $ 7,770 | $ 6,650 |
Portfolio turnover rateE | 50% | 38% | 64% | 30% | 53% |
A Total returns would have been lower if certain expenses had not been reduced during the applicable periods shown.
B Total returns do not include the effect of the contingent deferred sales charge.
C Calculated based on average shares outstanding during the period.
D Fees and expenses of any underlying Fidelity Central Funds are not included in the Fund's expense ratio. The Fund indirectly bears its proportionate share of the expenses of any underlying Fidelity Central Funds.
E Amount does not include the portfolio activity of any underlying Fidelity Central Funds.
F Investment income per share reflects a large, non-recurring dividend which amounted to $.04 per share. Excluding this non-recurring dividend, the ratio of net investment income (loss) to average net assets would have been .49%.
G Expense ratios reflect operating expenses of the class. Expenses before reductions do not reflect amounts reimbursed by the investment adviser or reductions from brokerage service arrangements or reductions from other expense offset arrangements and do not represent the amount paid by the class during periods when reimbursements or reductions occur. Expenses net of fee waivers reflect expenses after reimbursement by the investment adviser but prior to reductions from brokerage service arrangements or other expense offset arrangements. Expenses net of all reductions represent the net expenses paid by the class.
H Amount represents less than $.005 per share.
I Total distributions of $.06 per share is comprised of distributions from net investment income of $.047 and distributions from net realized gain of $.015 per share.
See accompanying notes which are an integral part of the financial statements.
Annual Report
Financial Highlights - Fidelity Emerging Europe, Middle East, Africa (EMEA) Fund
Years ended October 31, | 2015 | 2014 | 2013 | 2012 | 2011 |
Selected Per-Share Data | | | | | |
Net asset value, beginning of period | $ 9.08 | $ 9.52 | $ 8.75 | $ 8.37 | $ 9.00 |
Income from Investment Operations | | | | | |
Net investment income (loss) B | .14 | .16 | .18 | .20 | .18E |
Net realized and unrealized gain (loss) | (1.51) | (.47) | .84 | .35 | (.71) |
Total from investment operations | (1.37) | (.31) | 1.02 | .55 | (.53) |
Distributions from net investment income | (.17) | (.13) | (.18) | (.17) | (.09) |
Distributions from net realized gain | (.04) | - | (.07) | - | (.02) |
Total distributions | (.21) | (.13) | (.25) | (.17) | (.11) |
Redemption fees added to paid in capitalB | -G | -G | -G | -G | .01 |
Net asset value, end of period | $ 7.50 | $ 9.08 | $ 9.52 | $ 8.75 | $ 8.37 |
Total ReturnA | (15.33)% | (3.21)% | 11.90% | 6.81% | (5.91)% |
Ratios to Average Net AssetsC, F | | | | | |
Expenses before reductions | 1.39% | 1.37% | 1.40% | 1.37% | 1.35% |
Expenses net of fee waivers, if any | 1.38% | 1.37% | 1.40% | 1.37% | 1.31% |
Expenses net of all reductions | 1.38% | 1.37% | 1.38% | 1.34% | 1.25% |
Net investment income (loss) | 1.74% | 1.68% | 2.05% | 2.34% | 1.95%E |
Supplemental Data | | | | | |
Net assets, end of period (000 omitted) | $ 67,521 | $ 96,784 | $ 110,265 | $ 111,441 | $ 114,117 |
Portfolio turnover rateD | 50% | 38% | 64% | 30% | 53% |
A Total returns would have been lower if certain expenses had not been reduced during the applicable periods shown.
B Calculated based on average shares outstanding during the period.
C Fees and expenses of any underlying Fidelity Central Funds are not included in the Fund's expense ratio. The Fund indirectly bears its proportionate share of the expenses of any underlying Fidelity Central Funds.
D Amount does not include the portfolio activity of any underlying Fidelity Central Funds.
E Investment income per share reflects a large, non-recurring dividend which amounted to $.04 per share. Excluding this non-recurring dividend, the ratio of net investment income (loss) to average net assets would have been 1.51%.
F Expense ratios reflect operating expenses of the class. Expenses before reductions do not reflect amounts reimbursed by the investment adviser or reductions from brokerage service arrangements or reductions from other expense offset arrangements and do not represent the amount paid by the class during periods when reimbursements or reductions occur. Expenses net of fee waivers reflect expenses after reimbursement by the investment adviser but prior to reductions from brokerage service arrangements or other expense offset arrangements. Expenses net of all reductions represent the net expenses paid by the class.
G Amount represents less than $.005 per share.
See accompanying notes which are an integral part of the financial statements.
Annual Report
Financial Highlights - Fidelity Emerging Europe, Middle East, Africa (EMEA) Fund Class I
Years ended October 31, | 2015 | 2014 | 2013 | 2012 | 2011 |
Selected Per-Share Data | | | | | |
Net asset value, beginning of period | $ 9.08 | $ 9.52 | $ 8.75 | $ 8.37 | $ 9.00 |
Income from Investment Operations | | | | | |
Net investment income (loss) B | .15 | .16 | .19 | .21 | .19E |
Net realized and unrealized gain (loss) | (1.51) | (.46) | .84 | .35 | (.72) |
Total from investment operations | (1.36) | (.30) | 1.03 | .56 | (.53) |
Distributions from net investment income | (.18) | (.14) | (.19) | (.18) | (.09) |
Distributions from net realized gain | (.04) | - | (.07) | - | (.02) |
Total distributions | (.22) | (.14) | (.26) | (.18) | (.11) |
Redemption fees added to paid in capitalB | -G | -G | -G | -G | .01 |
Net asset value, end of period | $ 7.50 | $ 9.08 | $ 9.52 | $ 8.75 | $ 8.37 |
Total ReturnA | (15.23)% | (3.09)% | 12.05% | 6.93% | (5.91)% |
Ratios to Average Net AssetsC, F | | | | | |
Expenses before reductions | 1.25% | 1.26% | 1.30% | 1.28% | 1.26% |
Expenses net of fee waivers, if any | 1.25% | 1.26% | 1.30% | 1.28% | 1.24% |
Expenses net of all reductions | 1.24% | 1.26% | 1.28% | 1.25% | 1.19% |
Net investment income (loss) | 1.88% | 1.79% | 2.15% | 2.43% | 2.02%E |
Supplemental Data | | | | | |
Net assets, end of period (000 omitted) | $ 3,478 | $ 5,596 | $ 10,231 | $ 8,586 | $ 7,633 |
Portfolio turnover rateD | 50% | 38% | 64% | 30% | 53% |
A Total returns would have been lower if certain expenses had not been reduced during the applicable periods shown.
B Calculated based on average shares outstanding during the period.
C Fees and expenses of any underlying Fidelity Central Funds are not included in the Fund's expense ratio. The Fund indirectly bears its proportionate share of the expenses of any underlying Fidelity Central Funds.
D Amount does not include the portfolio activity of any underlying Fidelity Central Funds.
E Investment income per share reflects a large, non-recurring dividend which amounted to $.04 per share. Excluding this non-recurring dividend, the ratio of net investment income (loss) to average net assets would have been 1.58%.
F Expense ratios reflect operating expenses of the class. Expenses before reductions do not reflect amounts reimbursed by the investment adviser or reductions from brokerage service arrangements or reductions from other expense offset arrangements and do not represent the amount paid by the class during periods when reimbursements or reductions occur. Expenses net of fee waivers reflect expenses after reimbursement by the investment adviser but prior to reductions from brokerage service arrangements or other expense offset arrangements. Expenses net of all reductions represent the net expenses paid by the class.
G Amount represents less than $.005 per share.
See accompanying notes which are an integral part of the financial statements.
Annual Report
For the period ended October 31, 2015
1. Organization.
Fidelity Emerging Europe, Middle East, Africa (EMEA) Fund (the Fund) is a non-diversified fund of Fidelity Investment Trust (the Trust) and is authorized to issue an unlimited number of shares. The Trust is registered under the Investment Company Act of 1940, as amended (the 1940 Act), as an open-end management investment company organized as a Massachusetts business trust. The Fund offers Class A, Class T, Class C, Emerging Europe, Middle East, Africa (EMEA) and Class I (formerly Institutional Class) shares, each of which, along with Class B shares, has equal rights as to assets and voting privileges. Class B shares are closed to new accounts and additional purchases, except for exchanges and reinvestments. Each class has exclusive voting rights with respect to matters that affect that class. Class B shares will automatically convert to Class A shares after a holding period of seven years from the initial date of purchase. The Fund's investments in emerging markets can be subject to social, economic, regulatory, and political uncertainties and can be extremely volatile.
2. Investments in Fidelity Central Funds.
The Fund invests in Fidelity Central Funds, which are open-end investment companies generally available only to other investment companies and accounts managed by the investment adviser and its affiliates. The Fund's Schedule of Investments lists each of the Fidelity Central Funds held as of period end, if any, as an investment of the Fund, but does not include the underlying holdings of each Fidelity Central Fund. As an Investing Fund, the Fund indirectly bears its proportionate share of the expenses of the underlying Fidelity Central Funds.
The Money Market Central Funds seek preservation of capital and current income and are managed by Fidelity Investments Money Management, Inc. (FIMM), an affiliate of the investment adviser. Annualized expenses of the Money Market Central Funds as of their most recent shareholder report date are less than .005%.
A complete unaudited list of holdings for each Fidelity Central Fund is available upon request or at the Securities and Exchange Commission (the SEC) website at www.sec.gov. In addition, the financial statements of the Fidelity Central Funds, which are not covered by the Fund's Report of Independent Registered Public Accounting Firm, are available on the SEC website or upon request.
3. Significant Accounting Policies.
The financial statements have been prepared in conformity with accounting principles generally accepted in the United States of America (GAAP), which require management to make certain estimates and assumptions at the date of the financial statements. Actual results could differ from those estimates. Subsequent events, if any, through the date that the financial statements were issued have been evaluated in the preparation of
Annual Report
Notes to Financial Statements - continued
3. Significant Accounting Policies - continued
the financial statements. The following summarizes the significant accounting policies of the Fund:
Investment Valuation. Investments are valued as of 4:00 p.m. Eastern time on the last calendar day of the period. The Board of Trustees (the Board) has delegated the day to day responsibility for the valuation of the Fund's investments to the Fidelity Management & Research Company (FMR) Fair Value Committee (the Committee). In accordance with valuation policies and procedures approved by the Board, the Fund attempts to obtain prices from one or more third party pricing vendors or brokers to value its investments. When current market prices, quotations or currency exchange rates are not readily available or reliable, investments will be fair valued in good faith by the Committee, in accordance with procedures adopted by the Board. Factors used in determining fair value vary by investment type and may include market or investment specific events. The frequency with which these procedures are used cannot be predicted and they may be utilized to a significant extent. The Committee oversees the Fund's valuation policies and procedures and reports to the Board on the Committee's activities and fair value determinations. The Board monitors the appropriateness of the procedures used in valuing the Fund's investments and ratifies the fair value determinations of the Committee.
The Fund categorizes the inputs to valuation techniques used to value its investments into a disclosure hierarchy consisting of three levels as shown below:
Level 1 - quoted prices in active markets for identical investments
Level 2 - other significant observable inputs (including quoted prices for similar investments, interest rates, prepayment speeds, etc.)
Level 3 - unobservable inputs (including the Fund's own assumptions based on the best information available)
Valuation techniques used to value the Fund's investments by major category are as follows:
Equity securities, including restricted securities, for which market quotations are readily available, are valued at the last reported sale price or official closing price as reported by a third party pricing vendor on the primary market or exchange on which they are traded and are categorized as Level 1 in the hierarchy. In the event there were no sales during the day or closing prices are not available, securities are valued at the last quoted bid price or may be valued using the last available price and are generally categorized as Level 2 in the hierarchy. For foreign equity securities, when market or security specific events arise, comparisons to the valuation of American Depositary Receipts (ADRs),
Annual Report
3. Significant Accounting Policies - continued
Investment Valuation - continued
futures contracts, Exchange-Traded Funds (ETFs) and certain indexes as well as quoted prices for similar securities may be used and would be categorized as Level 2 in the hierarchy. Utilizing these techniques may result in transfers between Level 1 and Level 2. For equity securities, including restricted securities, where observable inputs are limited, assumptions about market activity and risk are used and these securities may be categorized as Level 3 in the hierarchy.
Investments in open-end mutual funds, including the Fidelity Central Funds, are valued at their closing net asset value (NAV) each business day and are categorized as Level 1 in the hierarchy.
Changes in valuation techniques may result in transfers in or out of an assigned level within the disclosure hierarchy. The aggregate value of investments by input level as of October 31, 2015, including information on transfers between Levels 1 and 2, as well as roll forward of Level 3 investments, is included at the end of the Fund's Schedule of Investments.
Foreign Currency. The Fund may use foreign currency contracts to facilitate transactions in foreign-denominated securities. Gains and losses from these transactions may arise from changes in the value of the foreign currency or if the counterparties do not perform under the contracts' terms.
Foreign-denominated assets, including investment securities, and liabilities are translated into U.S. dollars at the exchange rates at period end. Purchases and sales of investment securities, income and dividends received and expenses denominated in foreign currencies are translated into U.S. dollars at the exchange rate in effect on the transaction date.
The effects of exchange rate fluctuations on investments are included with the net realized and unrealized gain (loss) on investment securities. Other foreign currency transactions resulting in realized and unrealized gain (loss) are disclosed separately.
Investment Transactions and Income. For financial reporting purposes, the Fund's investment holdings and NAV include trades executed through the end of the last business day of the period. The NAV per share for processing shareholder transactions is calculated as of the close of business of the New York Stock Exchange (NYSE), normally 4:00 p.m. Eastern time and includes trades executed through the end of the prior business day. Gains and losses on securities sold are determined on the basis of identified cost. Dividend income is recorded on the ex-dividend date, except for certain dividends from foreign securities where the ex-dividend date may have passed, which are recorded as soon as the Fund is informed of the ex-dividend date. Non-cash dividends included in
Annual Report
Notes to Financial Statements - continued
3. Significant Accounting Policies - continued
Investment Transactions and Income - continued
dividend income, if any, are recorded at the fair market value of the securities received. Income and capital gain distributions from Fidelity Central Funds, if any, are recorded on the ex-dividend date. Investment income is recorded net of foreign taxes withheld where recovery of such taxes is uncertain.
Class Allocations and Expenses. Investment income, realized and unrealized capital gains and losses, common expenses of the Fund, and certain fund-level expense reductions, if any, are allocated daily on a pro-rata basis to each class based on the relative net assets of each class to the total net assets of the Fund. Each class differs with respect to transfer agent and distribution and service plan fees incurred. Certain expense reductions may also differ by class. For the reporting period, the allocated portion of income and expenses to each class as a percent of its average net assets may vary due to the timing of recording these transactions in relation to fluctuating net assets of the classes. Expenses directly attributable to a fund are charged to that fund. Expenses attributable to more than one fund are allocated among the respective funds on the basis of relative net assets or other appropriate methods. Expense estimates are accrued in the period to which they relate and adjustments are made when actual amounts are known.
Income Tax Information and Distributions to Shareholders. Each year, the Fund intends to qualify as a regulated investment company under Subchapter M of the Internal Revenue Code, including distributing substantially all of its taxable income and realized gains. As a result, no provision for U.S. Federal income taxes is required. As of October 31, 2015, the Fund did not have any unrecognized tax benefits in the financial statements; nor is the Fund aware of any tax positions for which it is reasonably possible that the total amounts of unrecognized tax benefits will significantly change in the next twelve months. The Fund files a U.S. federal tax return, in addition to state and local tax returns as required. The Fund's federal income tax returns are subject to examination by the Internal Revenue Service (IRS) for a period of three fiscal years after they are filed. State and local tax returns may be subject to examination for an additional fiscal year depending on the jurisdiction. Foreign taxes are provided for based on the Fund's understanding of the tax rules and rates that exist in the foreign markets in which it invests. The Fund is subject to a tax imposed on capital gains by certain countries in which it invests. An estimated deferred tax liability for net unrealized appreciation on the applicable securities is included in Other payables and accrued expenses on the Statement of Assets & Liabilities.
Annual Report
3. Significant Accounting Policies - continued
Income Tax Information and Distributions to Shareholders - continued
Distributions are declared and recorded on the ex-dividend date. Income dividends and capital gain distributions are declared separately for each class. Income and capital gain distributions are determined in accordance with income tax regulations, which may differ from GAAP. In addition, the Fund claimed a portion of the payment made to redeeming shareholders as a distribution for income tax purposes.
Capital accounts within the financial statements are adjusted for permanent book-tax differences. These adjustments have no impact on net assets or the results of operations. Capital accounts are not adjusted for temporary book-tax differences which will reverse in a subsequent period.
Book-tax differences are primarily due to foreign currency transactions, certain foreign taxes, passive foreign investment companies (PFIC), capital loss carryforwards and losses deferred due to wash sales.
The federal tax cost of investment securities and unrealized appreciation (depreciation) as of period end were as follows:
Gross unrealized appreciation | $ 12,373,817 |
Gross unrealized depreciation | (10,435,038) |
Net unrealized appreciation (depreciation) on securities | $ 1,938,779 |
Tax Cost | $ 81,129,283 |
The tax-based components of distributable earnings as of period end were as follows:
Undistributed ordinary income | $ 1,238,276 |
Capital loss carryforward | $ (16,887,100) |
Net unrealized appreciation (depreciation) on securities and other investments | $ 1,937,274 |
Capital loss carryforwards are only available to offset future capital gains of the Fund to the extent provided by regulations and may be limited. Under the Regulated Investment Company Modernization Act of 2010 (the Act), the Fund is permitted to carry forward capital losses incurred in taxable years beginning after December 22, 2010 for an unlimited period and such capital losses are required to be used prior to any losses that expire.
Annual Report
Notes to Financial Statements - continued
3. Significant Accounting Policies - continued
Income Tax Information and Distributions to Shareholders - continued
The capital loss carryforward information presented below, including any applicable limitation, is estimated as of fiscal period end and is subject to adjustment.
Fiscal year of expiration | |
2018 | $ (1,624,705) |
No expiration | |
Short-term | (3,290,678) |
Long-term | (11,971,717) |
Total no expiration | (15,262,395) |
Total capital loss carryforward | $ (16,887,100) |
The tax character of distributions paid was as follows:
| October 31, 2015 | October 31, 2014 |
Ordinary Income | $ 2,596,341 | $ 1,921,556 |
Short-Term Trading (Redemption) Fees. Shares held by investors in the Fund less than 90 days may have been subject to a redemption fee equal to 1.50% of the NAV of shares redeemed. All redemption fees, which reduce the proceeds of the shareholder redemption, are retained by the Fund and accounted for as an addition to paid in capital.
Restricted Securities. The Fund may invest in securities that are subject to legal or contractual restrictions on resale. These securities generally may be resold in transactions exempt from registration or to the public if the securities are registered. Disposal of these securities may involve time-consuming negotiations and expense, and prompt sale at an acceptable price may be difficult. Information regarding restricted securities is included at the end of the Fund's Schedule of Investments.
4. Purchases and Sales of Investments.
Purchases and sales of securities, other than short-term securities, aggregated $49,108,378 and $66,560,422, respectively.
5. Fees and Other Transactions with Affiliates.
Management Fee. Fidelity Management & Research Company (the investment adviser) and its affiliates provide the Fund with investment management related services for which the Fund pays a monthly management fee. The management fee is the sum of an individual fund fee rate that is based on an annual rate of .55% of the Fund's average net assets and an annualized group fee rate that averaged .25% during the period. The group fee rate is based upon the average net assets of all the mutual funds
Annual Report
5. Fees and Other Transactions with Affiliates - continued
Management Fee - continued
advised by the investment adviser, including any mutual funds previously advised by the investment adviser that are currently advised by Fidelity SelectCo, LLC, an affiliate of the investment adviser. The group fee rate decreases as assets under management increase and increases as assets under management decrease. For the reporting period, the total annual management fee rate was .80% of the Fund's average net assets.
Distribution and Service Plan Fees. In accordance with Rule 12b-1 of the 1940 Act, the Fund has adopted separate Distribution and Service Plans for each class of shares. Certain classes pay Fidelity Distributors Corporation (FDC), an affiliate of the investment adviser, separate Distribution and Service Fees, each of which is based on an annual percentage of each class' average net assets. In addition, FDC may pay financial intermediaries for selling shares of the Fund and providing shareholder support services. For the period, the Distribution and Service Fee rates, total fees and amounts retained by FDC were as follows:
| Distribution
Fee | Service
Fee | Total Fees | Retained
by FDC |
Class A | -% | .25% | $ 16,778 | $ 327 |
Class T | .25% | .25% | 11,598 | 13 |
Class B | .75% | .25% | 2,284 | 1,713 |
Class C | .75% | .25% | 54,367 | 9,171 |
| | | $ 85,027 | $ 11,224 |
Sales Load. FDC may receive a front-end sales charge of up to 5.75% for selling Class A shares and 3.50% for selling Class T shares, some of which is paid to financial intermediaries for selling shares of the Fund. Depending on the holding period, FDC may receive contingent deferred sales charges levied on Class A, Class T, Class B, and Class C redemptions. The deferred sales charges range from 5.00% to 1.00% for Class B shares, 1.00% for Class C shares, 1.00% for certain purchases of Class A shares and .25% for certain purchases of Class T shares.
For the period, sales charge amounts retained by FDC were as follows:
| Retained
by FDC |
Class A | $ 2,682 |
Class T | 1,164 |
Class BA | 50 |
Class CA | 1,357 |
| $ 5,253 |
A When Class B and Class C shares are initially sold, FDC pays commissions from its own resources to financial intermediaries through which the sales are made.
Annual Report
Notes to Financial Statements - continued
5. Fees and Other Transactions with Affiliates - continued
Transfer Agent Fees. Fidelity Investments Institutional Operations Company, Inc., (FIIOC), an affiliate of the investment adviser, is the transfer, dividend disbursing and shareholder servicing agent for each class of the Fund. FIIOC receives account fees and asset-based fees that vary according to the account size and type of account of the shareholders of the respective classes of the Fund. FIIOC pays for typesetting, printing and mailing of shareholder reports, except proxy statements.
For the period, transfer agent fees for each class were as follows:
| Amount | % of
Class-Level Average
Net Assets |
Class A | $ 17,582 | .26 |
Class T | 7,386 | .32 |
Class B | 680 | .30 |
Class C | 16,171 | .30 |
Emerging Europe, Middle East, Africa (EMEA) | 226,627 | .29 |
Class I | 6,423 | .15 |
| $ 274,869 | |
Accounting and Security Lending Fees. Fidelity Service Company, Inc. (FSC), an affiliate of the investment adviser, maintains the Fund's accounting records. The accounting fee is based on the level of average net assets for each month. Under a separate contract, FSC administers the security lending program. The security lending fee is based on the number and duration of lending transactions.
6. Committed Line of Credit.
The Fund participates with other funds managed by the investment adviser or an affiliate in a $4.25 billion credit facility (the "line of credit") to be utilized for temporary or emergency purposes to fund shareholder redemptions or for other short-term liquidity purposes. The Fund has agreed to pay commitment fees on its pro-rata portion of the line of credit, which amounted to $147 and is reflected in Miscellaneous expenses on the Statement of Operations. During the period, the Fund did not borrow on this line of credit.
7. Security Lending.
The Fund lends portfolio securities through a lending agent from time to time in order to earn additional income. For equity securities, a lending agent is used and may loan securities to certain qualified borrowers, including Fidelity Capital Markets (FCM), a broker-dealer affiliated with the Fund. On the settlement date of the loan, the Fund
Annual Report
7. Security Lending - continued
receives collateral (in the form of U.S. Treasury obligations, letters of credit and/or cash) against the loaned securities and maintains collateral in an amount not less than 100% of the market value of the loaned securities during the period of the loan. The market value of the loaned securities is determined at the close of business of the Fund and any additional required collateral is delivered to the Fund on the next business day. The Fund or borrower may terminate the loan at any time, and if the borrower defaults on its obligation to return the securities loaned because of insolvency or other reasons, the Fund may apply collateral received from the borrower against the obligation. The Fund may experience delays and costs in recovering the securities loaned. Any cash collateral received is invested in the Fidelity Securities Lending Cash Central Fund. At period end, there were no security loans outstanding. Security lending income represents the income earned on investing cash collateral, less rebates paid to borrowers and any lending agent fees associated with the loan, plus any premium payments received for lending certain types of securities. Security lending income is presented in the Statement of Operations as a component of income from Fidelity Central Funds. Total security lending income during the period amounted to $999. During the period, there were no securities loaned to FCM.
8. Expense Reductions.
The investment adviser voluntarily agreed to reimburse each class to the extent annual operating expenses exceeded certain levels of average net assets as noted in the table below. Some expenses, for example interest expense, including commitment fees, are excluded from this reimbursement.
The following classes were in reimbursement during the period:
| Expense
Limitations | Reimbursement |
Class T | 1.90% | $ 400 |
Class B | 2.40% | 7 |
Class C | 2.40% | 589 |
| | $ 996 |
Commissions paid to certain brokers with whom the investment adviser, or its affiliates, places trades on behalf of the Fund include an amount in addition to trade execution, which may be rebated back to the Fund to offset certain expenses. This amount totaled $6,765 for the period.
Annual Report
Notes to Financial Statements - continued
8. Expense Reductions - continued
In addition, during the period the investment adviser reimbursed and/or waived a portion of the fund-level operating expenses in the amount of $384 and portion of class-level operating expenses as follows:
| Amount |
Class A | $ 212 |
Class T | 4 |
Class B | 1 |
Class C | 36 |
Emerging Europe, Middle East, Africa (EMEA) | 2,766 |
Class I | 161 |
| $ 3,180 |
9. Distributions to Shareholders.
Distributions to shareholders of each class were as follows:
Years ended October 31, | 2015 | 2014 |
From net investment income | | |
Class A | $ 113,464 | $ 138,741 |
Class T | 35,916 | 39,254 |
Class B | 1,835 | 1,980 |
Class C | 58,320 | 46,648 |
Emerging Europe, Middle East, Africa (EMEA) | 1,776,301 | 1,537,065 |
Class I | 105,734 | 157,868 |
Total | $ 2,091,570 | $ 1,921,556 |
From net realized gain | | |
Class A | $ 32,778 | $ - |
Class T | 11,206 | - |
Class B | 1,213 | - |
Class C | 29,160 | - |
Emerging Europe, Middle East, Africa (EMEA) | 407,505 | - |
Class I | 22,909 | - |
Total | $ 504,771 | $ - |
Annual Report
10. Share Transactions.
Share transactions for each class were as follows and may contain automatic conversions between classes or exchanges between funds:
| Shares | Dollars |
Years ended October 31, | 2015 | 2014 | 2015 | 2014 |
Class A | | | | |
Shares sold | 200,433 | 315,373 | $ 1,636,757 | $ 2,918,425 |
Reinvestment of distributions | 16,251 | 11,698 | 135,531 | 104,929 |
Shares redeemed | (315,855) | (601,453) | (2,546,115) | (5,463,762) |
Net increase (decrease) | (99,171) | (274,382) | $ (773,827) | $ (2,440,408) |
Class T | | | | |
Shares sold | 86,058 | 101,639 | $ 721,254 | $ 928,488 |
Reinvestment of distributions | 5,631 | 4,323 | 46,793 | 38,736 |
Shares redeemed | (96,309) | (198,384) | (767,911) | (1,797,181) |
Net increase (decrease) | (4,620) | (92,422) | $ 136 | $ (829,957) |
Class B | | | | |
Shares sold | 3,390 | 4,359 | $ 28,032 | $ 39,785 |
Reinvestment of distributions | 349 | 219 | 2,936 | 1,980 |
Shares redeemed | (12,164) | (12,911) | (100,803) | (117,435) |
Net increase (decrease) | (8,425) | (8,333) | $ (69,835) | $ (75,670) |
Class C | | | | |
Shares sold | 210,315 | 241,646 | $ 1,702,630 | $ 2,211,783 |
Reinvestment of distributions | 8,117 | 3,905 | 67,210 | 34,875 |
Shares redeemed | (408,507) | (221,913) | (3,365,409) | (2,006,697) |
Net increase (decrease) | (190,075) | 23,638 | $ (1,595,569) | $ 239,961 |
Emerging Europe, Middle East, Africa (EMEA) | | | | |
Shares sold | 1,440,703 | 2,719,041 | $ 11,732,025 | $ 24,959,563 |
Reinvestment of distributions | 247,446 | 162,803 | 2,063,699 | 1,463,600 |
Shares redeemed | (3,348,545) | (3,802,325) | (27,229,428) | (34,854,232) |
Net increase (decrease) | (1,660,396) | (920,481) | $ (13,433,704) | $ (8,431,069) |
Class I | | | | |
Shares sold | 131,915 | 374,756 | $ 1,069,757 | $ 3,428,841 |
Reinvestment of distributions | 12,912 | 8,639 | 107,558 | 77,579 |
Shares redeemed | (297,795) | (841,493) | (2,411,162) | (7,467,169) |
Net increase (decrease) | (152,968) | (458,098) | $ (1,233,847) | $ (3,960,749) |
Annual Report
Notes to Financial Statements - continued
11. Other.
The Fund's organizational documents provide former and current trustees and officers with a limited indemnification against liabilities arising in connection with the performance of their duties to the Fund. In the normal course of business, the Fund may also enter into contracts that provide general indemnifications. The Fund's maximum exposure under these arrangements is unknown as this would be dependent on future claims that may be made against the Fund. The risk of material loss from such claims is considered remote.
Annual Report
To the Trustees of Fidelity Investment Trust and Shareholders of Fidelity Emerging Europe, Middle East, Africa (EMEA) Fund:
We have audited the accompanying statement of assets and liabilities of Fidelity Emerging Europe, Middle East, Africa (EMEA) Fund (the Fund), a fund of Fidelity Investment Trust, including the schedule of investments, as of October 31, 2015, and the related statement of operations for the year then ended, the statement of changes in net assets for each of the two years in the period then ended, and the financial highlights for each of the five years in the period then ended. These financial statements and financial highlights are the responsibility of the Fund's management. Our responsibility is to express an opinion on these financial statements and financial highlights based on our audits.
We conducted our audits in accordance with the standards of the Public Company Accounting Oversight Board (United States). Those standards require that we plan and perform the audit to obtain reasonable assurance about whether the financial statements and financial highlights are free of material misstatement. The Fund is not required to have, nor were we engaged to perform, an audit of its internal control over financial reporting. Our audits included consideration of internal control over financial reporting as a basis for designing audit procedures that are appropriate in the circumstances, but not for the purpose of expressing an opinion on the effectiveness of the Fund's internal control over financial reporting. Accordingly, we express no such opinion. An audit also includes examining, on a test basis, evidence supporting the amounts and disclosures in the financial statements, assessing the accounting principles used and significant estimates made by management, as well as evaluating the overall financial statement presentation. Our procedures included confirmation of securities owned as of October 31, 2015, by correspondence with the custodians and brokers; when replies were not received from brokers, we performed other auditing procedures. We believe that our audits provide a reasonable basis for our opinion.
In our opinion, such financial statements and financial highlights referred to above present fairly, in all material respects, the financial position of Fidelity Emerging Europe, Middle East, Africa (EMEA) Fund as of October 31, 2015, the results of its operations for the year then ended, the changes in its net assets for each of the two years in the period then ended, and the financial highlights for each of the five years in the period then ended, in conformity with accounting principles generally accepted in the United States of America.
DELOITTE & TOUCHE LLP
Boston, Massachusetts
December 18, 2015
Annual Report
The Trustees, Member of the Advisory Board, and officers of the trust and fund, as applicable, are listed below. The Board of Trustees governs the fund and is responsible for protecting the interests of shareholders. The Trustees are experienced executives who meet periodically throughout the year to oversee the fund's activities, review contractual arrangements with companies that provide services to the fund, oversee management of the risks associated with such activities and contractual arrangements, and review the fund's performance. Each of the Trustees oversees 170 funds.
The Trustees hold office without limit in time except that (a) any Trustee may resign; (b) any Trustee may be removed by written instrument, signed by at least two-thirds of the number of Trustees prior to such removal; (c) any Trustee who requests to be retired or who has become incapacitated by illness or injury may be retired by written instrument signed by a majority of the other Trustees; and (d) any Trustee may be removed at any special meeting of shareholders by a two-thirds vote of the outstanding voting securities of the trust. Each Trustee who is not an interested person (as defined in the 1940 Act) of the trust and the fund (Independent Trustee), shall retire not later than the last day of the calendar year in which his or her 75th birthday occurs. The Independent Trustees may waive this mandatory retirement age policy with respect to individual Trustees. The officers and Advisory Board Member hold office without limit in time, except that any officer and Advisory Board Member may resign or may be removed by a vote of a majority of the Trustees at any regular meeting or any special meeting of the Trustees. Except as indicated, each individual has held the office shown or other offices in the same company for the past five years.
Experience, Skills, Attributes, and Qualifications of the Fund's Trustees. The Governance and Nominating Committee has adopted a statement of policy that describes the experience, qualifications, attributes, and skills that are necessary and desirable for potential Independent Trustee candidates (Statement of Policy). The Board believes that each Trustee satisfied at the time he or she was initially elected or appointed a Trustee, and continues to satisfy, the standards contemplated by the Statement of Policy. The Governance and Nominating Committee also engages professional search firms to help identify potential Independent Trustee candidates who have the experience, qualifications, attributes, and skills consistent with the Statement of Policy. From time to time, additional criteria based on the composition and skills of the current Independent Trustees, as well as experience or skills that may be appropriate in light of future changes to board composition, business conditions, and regulatory or other developments, have also been considered by the professional search firms and the Governance and Nominating Committee. In addition, the Board takes into account the Trustees' commitment and participation in Board and committee meetings, as well as their leadership of standing and ad hoc committees throughout their tenure.
In determining that a particular Trustee was and continues to be qualified to serve as a Trustee, the Board has considered a variety of criteria, none of which, in isolation, was controlling. The Board believes that, collectively, the Trustees have balanced and diverse experience, qualifications, attributes, and skills, which allow the Board to operate effectively in governing the fund and protecting the interests of shareholders. Information about the specific experience, skills, attributes, and qualifications of each Trustee, which in each case led to the Board's conclusion that the Trustee should serve (or continue to serve) as a trustee of the fund, is provided below.
Annual Report
Board Structure and Oversight Function. James C. Curvey is an interested person (as defined in the 1940 Act) and currently serves as Chairman. The Trustees have determined that an interested Chairman is appropriate and benefits shareholders because an interested Chairman has a personal and professional stake in the quality and continuity of services provided to the fund. Independent Trustees exercise their informed business judgment to appoint an individual of their choosing to serve as Chairman, regardless of whether the Trustee happens to be independent or a member of management. The Independent Trustees have determined that they can act independently and effectively without having an Independent Trustee serve as Chairman and that a key structural component for assuring that they are in a position to do so is for the Independent Trustees to constitute a substantial majority for the Board. The Independent Trustees also regularly meet in executive session. Ned C. Lautenbach serves as Chairman of the Independent Trustees and as such (i) acts as a liaison between the Independent Trustees and management with respect to matters important to the Independent Trustees and (ii) with management prepares agendas for Board meetings.
Fidelity funds are overseen by different Boards of Trustees. The fund's Board oversees Fidelity's high income and certain equity funds, and other Boards oversee Fidelity's investment-grade bond, money market, asset allocation, and sector funds. The asset allocation funds may invest in Fidelity funds overseen by the fund's Board. The use of separate Boards, each with its own committee structure, allows the Trustees of each group of Fidelity funds to focus on the unique issues of the funds they oversee, including common research, investment, and operational issues. On occasion, the separate Boards establish joint committees to address issues of overlapping consequences for the Fidelity funds overseen by each Board.
The Trustees operate using a system of committees to facilitate the timely and efficient consideration of all matters of importance to the Trustees, the fund, and fund shareholders and to facilitate compliance with legal and regulatory requirements and oversight of the fund's activities and associated risks. The Board, acting through its committees, has charged FMR and its affiliates with (i) identifying events or circumstances the occurrence of which could have demonstrably adverse effects on the fund's business and/or reputation; (ii) implementing processes and controls to lessen the possibility that such events or circumstances occur or to mitigate the effects of such events or circumstances if they do occur; and (iii) creating and maintaining a system designed to evaluate continuously business and market conditions in order to facilitate the identification and implementation processes described in (i) and (ii) above. Because the day-to-day operations and activities of the fund are carried out by or through FMR, its affiliates and other service providers, the fund's exposure to risks is mitigated but not eliminated by the processes overseen by the Trustees. While each of the Board's committees has responsibility for overseeing different aspects of the fund's activities, oversight is exercised primarily through the Operations, Audit, and Compliance Committees. In addition, the Independent Trustees have worked with FMR to enhance the Board's oversight of investment and financial risks, legal and regulatory risks, technology risks, and operational risks, including the development of additional risk reporting to the Board. For example, a working group comprised of Independent Trustees and FMR has worked and continues to work to review the Fidelity funds' valuation-related activities, reporting and risk management. Appropriate personnel, including but not limited to the fund's Chief Compliance Officer (CCO), FMR's internal auditor, the independent accountants, the fund's Treasurer and portfolio management personnel, make periodic reports to the Board's committees, as appropriate, including an annual review of Fidelity's risk management program for the Fidelity funds. The responsibilities of each standing committee, including their oversight responsibilities, are described further under "Standing Committees of the Fund's Trustees."
Annual Report
Trustees and Officers - continued
The fund's Statement of Additional Information (SAI) includes more information about the Trustees. To request a free copy, call Fidelity at 1-877-208-0098.
Interested Trustees*:
Correspondence intended for each Trustee who is an interested person may be sent to Fidelity Investments, 245 Summer Street, Boston, Massachusetts 02210.
Name, Year of Birth; Principal Occupations and Other Relevant Experience+ |
James C. Curvey (1935) |
Year of Election or Appointment: 2007 Trustee Chairman of the Board of Trustees |
| Mr. Curvey also serves as Trustee of other Fidelity funds. Mr. Curvey is a Director of Fidelity Research & Analysis Co. (investment adviser firm, 2009-present), and Vice Chairman (2007-present) and Director of FMR LLC (diversified financial services company). In addition, Mr. Curvey serves as an Overseer for the Boston Symphony Orchestra and a member of the board of Artis-Naples, Naples, Florida, and as a Trustee for Brewster Academy, Wolfeboro, New Hampshire. Previously, Mr. Curvey served as a Director of Fidelity Investments Money Management, Inc. (investment adviser firm, 2009-2014) and a Director of FMR and FMR Co., Inc. (investment adviser firms, 2007-2014). |
Charles S. Morrison (1960) |
Year of Election or Appointment: 2014 Trustee |
| Mr. Morrison also serves as Trustee of other funds. He serves as a Director of Fidelity Investments Money Management, Inc. (FIMM) (investment adviser firm, 2014-present), Director of Fidelity SelectCo, LLC (investment adviser firm, 2014-present), President, Asset Management (2014-present), and is an employee of Fidelity Investments. Previously, Mr. Morrison served as Vice President of Fidelity's Fixed Income and Asset Allocation Funds (2012-2014), President, Fixed Income (2011-2014), Vice President of Fidelity's Money Market Funds (2005-2009), President, Money Market Group Leader of FMR (investment adviser firm, 2009), and Senior Vice President, Money Market Group of FMR (2004-2009). Mr. Morrison also served as Vice President of Fidelity's Bond Funds (2002-2005), certain Balanced Funds (2002-2005), and certain Asset Allocation Funds (2002-2007), and as Senior Vice President (2002-2005) of Fidelity's Bond Division. |
* Trustees have been determined to be "Interested Trustees" by virtue of, among other things, their affiliation with the trust or various entities under common control with FMR.
+ The information above includes each Trustee's principal occupation during the last five years and other information relating to the experience, attributes, and skills relevant to each Trustee's qualifications to serve as a Trustee, which led to the conclusion that each Trustee should serve as a Trustee for the fund.
Annual Report
Trustees and Officers - continued
Independent Trustees:
Correspondence intended for each Independent Trustee (that is, the Trustees other than the Interested Trustees) may be sent to Fidelity Investments, P.O. Box 55235, Boston, Massachusetts 02205-5235.
Name, Year of Birth; Principal Occupations and Other Relevant Experience+ |
Dennis J. Dirks (1948) |
Year of Election or Appointment: 2005 Trustee |
| Mr. Dirks also serves as Trustee of other Fidelity funds. Prior to his retirement in May 2003, Mr. Dirks was Chief Operating Officer and a member of the Board of The Depository Trust & Clearing Corporation (DTCC). He also served as President, Chief Operating Officer, and Board member of The Depository Trust Company (DTC) and President and Board member of the National Securities Clearing Corporation (NSCC). In addition, Mr. Dirks served as Chief Executive Officer and Board member of the Government Securities Clearing Corporation, Chief Executive Officer and Board member of the Mortgage-Backed Securities Clearing Corporation, as a Trustee and a member of the Finance Committee of Manhattan College (2005-2008), as a Trustee and a member of the Finance Committee of AHRC of Nassau County (2006-2008), and as a member of the Independent Directors Council (IDC) Governing Council (2010-2015). Mr. Dirks is a member of the Board of Directors for The Brookville Center for Children's Services, Inc. (2009-present). |
Alan J. Lacy (1953) |
Year of Election or Appointment: 2008 Trustee |
| Mr. Lacy also serves as Trustee of other Fidelity funds. Mr. Lacy serves as a member of the Board of Directors of Dave & Buster's Entertainment, Inc. (restaurant and entertainment complexes, 2010-present) and Bristol-Myers Squibb Company (global pharmaceuticals, 2008-present). In addition, Mr. Lacy served as Senior Adviser (2007-2014) of Oak Hill Capital Partners, L.P. (private equity) and also served as Chief Executive Officer (2000-2005) and Vice Chairman (2005-2006) of Sears Holdings Corporation and Sears, Roebuck and Co. (retail). Mr. Lacy is a member of the Board of Trustees of The National Parks Conservation Association (2006-present). Previously, Mr. Lacy served as Chairman of the Board of Trustees of the National Parks Conservation Association (2008-2011) and as a member of the Board of Directors for The Western Union Company (global money transfer, 2006-2011), The Hillman Companies, Inc. (hardware wholesalers, 2010-2014), and Earth Fare, Inc. (retail grocery, 2010-2014). |
Ned C. Lautenbach (1944) |
Year of Election or Appointment: 2000 Trustee Chairman of the Independent Trustees |
| Mr. Lautenbach also serves as Trustee of other Fidelity funds. Mr. Lautenbach currently serves as the Lead Director of the Eaton Corporation Board of Directors (diversified industrial, 1997-present). Mr. Lautenbach is Chairman of the Board of Directors of Artis-Naples in Naples, Florida (2012-present), a member of the Council on Foreign Relations (1994-present), and a member of the Board of Governors, State University System of Florida (2013-present). Previously, Mr. Lautenbach was a Partner/Advisory Partner at Clayton, Dubilier & Rice, LLC (private equity investment, 1998-2010), as well as a Director of Sony Corporation (2006-2007). |
Joseph Mauriello (1944) |
Year of Election or Appointment: 2008 Trustee |
| Mr. Mauriello also serves as Trustee of other Fidelity funds. Prior to his retirement in January 2006, Mr. Mauriello served in numerous senior management positions including Deputy Chairman and Chief Operating Officer (2004-2005), and Vice Chairman of Financial Services (2002-2004) of KPMG LLP US (professional services, 1965-2005). Mr. Mauriello currently serves as a member of the Board of Directors of XL Group plc. (global insurance and re-insurance, 2006-present) and the Independent Directors Council (IDC) Governing Council (2015-present). Previously, Mr. Mauriello served as a Director of the Hamilton Funds of the Bank of New York (2006-2007) and of Arcadia Resources Inc. (health care services and products, 2007-2012). |
Robert W. Selander (1950) |
Year of Election or Appointment: 2011 Trustee |
| Mr. Selander also serves as Trustee of other Fidelity funds. Mr. Selander serves as a Director of The Western Union Company (global money transfer, 2014-present). Previously, Mr. Selander served as a Member of the Advisory Board of other Fidelity funds (2011), and Executive Vice Chairman (2010), Chief Executive Officer (2009-2010), and President and Chief Executive Officer (1997-2009) of Mastercard, Inc. |
Cornelia M. Small (1944) |
Year of Election or Appointment: 2005 Trustee |
| Ms. Small also serves as Trustee of other Fidelity funds. Ms. Small is a member of the Board of Directors (2009-present) and Chair of the Investment Committee (2010-present) of the Teagle Foundation. Ms. Small also serves on the Investment Committee of the Berkshire Taconic Community Foundation (2008-present). Previously, Ms. Small served as Chairperson (2002-2008) and a member of the Investment Committee and Chairperson (2008-2012) and a member of the Board of Trustees of Smith College. In addition, Ms. Small served as Chief Investment Officer, Director of Global Equity Investments, and a member of the Board of Directors of Scudder, Stevens & Clark and Scudder Kemper Investments. |
William S. Stavropoulos (1939) |
Year of Election or Appointment: 2001 Trustee Vice Chairman of the Independent Trustees |
| Mr. Stavropoulos also serves as Trustee of other Fidelity funds. Mr. Stavropoulos serves as President and Founder of the Michigan Baseball Foundation, the Great Lakes Loons (2007-present). Mr. Stavropoulos is Chairman Emeritus of the Board of Directors of The Dow Chemical Company, where he previously served in numerous senior management positions, including President, CEO (1995-2000; 2002-2004), Chairman of the Executive Committee (2000-2006), and as a member of the Board of Directors (1990-2006). Currently, Mr. Stavropoulos is Chairman of the Board of Directors of Univar Inc. (global distributor of commodity and specialty chemicals), a Director of Teradata Corporation (data warehousing and technology solutions), and Maersk Inc. (industrial conglomerate), and a member of the Advisory Board for Metalmark Capital LLC (private equity investment, 2005-present). Mr. Stavropoulos is an operating advisor to Clayton, Dubilier & Rice, LLC (private equity investment). In addition, Mr. Stavropoulos is a member of the University of Notre Dame Advisory Council for the College of Science, a Trustee of the Rollin L. Gerstacker Foundation, and a Director of the Naples Philharmonic Center for the Arts. Previously, Mr. Stavropoulos served as a Director of Chemical Financial Corporation (bank holding company, 1993-2012) and Tyco International, Ltd. (multinational manufacturing and services, 2007-2012). |
David M. Thomas (1949) |
Year of Election or Appointment: 2008 Trustee |
| Mr. Thomas also serves as Trustee of other Fidelity funds. Mr. Thomas serves as Non-Executive Chairman of the Board of Directors of Fortune Brands Home and Security (home and security products, 2011-present), as a member of the Board of Directors (2004-present) and Presiding Director (2013-present) of Interpublic Group of Companies, Inc. (marketing communication), and as a member of the Board of Trustees of the University of Florida (2013-present). Previously, Mr. Thomas served as Executive Chairman (2005-2006) and Chairman and Chief Executive Officer (2000-2005) of IMS Health, Inc. (pharmaceutical and healthcare information solutions), and a Director of Fortune Brands, Inc. (consumer products, 2000-2011). |
+ The information above includes each Trustee's principal occupation during the last five years and other information relating to the experience, attributes, and skills relevant to each Trustee's qualifications to serve as a Trustee, which led to the conclusion that each Trustee should serve as a Trustee for the fund.
Advisory Board Member and Officers:
Correspondence intended for each officer and Peter S. Lynch may be sent to Fidelity Investments, 245 Summer Street, Boston, Massachusetts 02210. Officers appear below in alphabetical order.
Name, Year of Birth; Principal Occupation |
Peter S. Lynch (1944) |
Year of Election or Appointment: 2003 Member of the Advisory Board |
| Mr. Lynch also serves as Member of the Advisory Board of other Fidelity funds. Mr. Lynch is Vice Chairman and a Director of FMR (investment adviser firm) and FMR Co., Inc. (investment adviser firm). In addition, Mr. Lynch serves as a Trustee of Boston College and as the Chairman of the Inner-City Scholarship Fund. Previously, Mr. Lynch served on the Special Olympics International Board of Directors (1997-2006). |
Elizabeth Paige Baumann (1968) |
Year of Election or Appointment: 2012 Anti-Money Laundering (AML) Officer |
| Ms. Baumann also serves as AML Officer of other funds. She is Chief AML Officer of FMR LLC (diversified financial services company, 2012-present) and is an employee of Fidelity Investments. Previously, Ms. Baumann served as Vice President and Deputy Anti-Money Laundering Officer (2007-2012). |
Marc R. Bryant (1966) |
Year of Election or Appointment: 2015 Secretary and Chief Legal Officer (CLO) |
| Mr. Bryant also serves as Secretary and CLO of other funds. Mr. Bryant serves as CLO, Secretary, and Senior Vice President of Fidelity Management & Research Company (investment adviser firm, 2015-present) and FMR Co., Inc. (investment adviser firm, 2015-present); Secretary of Fidelity SelectCo, LLC (investment adviser firm, 2015-present) and Fidelity Investments Money Management, Inc. (investment adviser firm, 2015-present); and CLO of Fidelity Management & Research (Hong Kong) Limited (investment adviser firm, 2015-present). He is Senior Vice President and Deputy General Counsel of FMR LLC (diversified financial services company). Previously, Mr. Bryant served as Secretary and Chief Legal Officer of Fidelity Rutland Square Trust II (2010-2014) and Assistant Secretary of Fidelity's Fixed Income and Asset Allocation Funds (2013-2015). Prior to joining Fidelity Investments, Mr. Bryant served as a Senior Vice President and the Head of Global Retail Legal for AllianceBernstein L.P. (2006-2010), and as the General Counsel for ProFund Advisors LLC (2001-2006). |
William C. Coffey (1969) |
Year of Election or Appointment: 2009 Assistant Secretary |
| Mr. Coffey also serves as Assistant Secretary of other funds. He is Senior Vice President and Deputy General Counsel of FMR LLC (diversified financial services company, 2010-present), and is an employee of Fidelity Investments. Previously, Mr. Coffey served as Vice President and Associate General Counsel of FMR LLC (2005-2009). |
Timothy M. Cohen (1969) |
Year of Election or Appointment: 2014 Vice President of certain Equity Funds |
| Mr. Cohen also serves as Vice President of other funds. Mr. Cohen serves as Chief Compliance Officer of FMR Investment Management (U.K.) Limited (investment adviser firm, 2013-present) and is an employee of Fidelity Investments. Previously, Mr. Cohen served as a Director of FMR Investment Management (U.K.) Limited (2013-2015). |
Jonathan Davis (1968) |
Year of Election or Appointment: 2010 Assistant Treasurer |
| Mr. Davis also serves as Assistant Treasurer of other funds, and is an employee of Fidelity Investments. Previously, Mr. Davis served as Vice President and Associate General Counsel of FMR LLC (diversified financial services company, 2003-2010). |
Adrien E. Deberghes (1967) |
Year of Election or Appointment: 2008 Deputy Treasurer |
| Mr. Deberghes also serves as an officer of other funds. He is an employee of Fidelity Investments (2008-present). Prior to joining Fidelity Investments, Mr. Deberghes was Senior Vice President of Mutual Fund Administration at State Street Corporation (2007-2008), Senior Director of Mutual Fund Administration at Investors Bank & Trust (2005-2007), and Director of Finance for Dunkin' Brands (2000-2005). |
Stephanie J. Dorsey (1969) |
Year of Election or Appointment: 2010 Assistant Treasurer |
| Ms. Dorsey also serves as an officer of other funds. She is an employee of Fidelity Investments (2008-present) and has served in other fund officer roles. Prior to joining Fidelity Investments, Ms. Dorsey served as Treasurer (2004-2008) of the JPMorgan Mutual Funds and Vice President (2004-2008) of JPMorgan Chase Bank. |
Howard J. Galligan III (1966) |
Year of Election or Appointment: 2014 Chief Financial Officer |
| Mr. Galligan also serves as Chief Financial Officer of other funds. Mr. Galligan serves as President of Fidelity Pricing and Cash Management Services (FPCMS) (2014-present) and as a Director of Strategic Advisers, Inc. (investment adviser firm, 2008-present). Previously, Mr. Galligan served as Chief Administrative Officer of Asset Management (2011-2014) and Chief Operating Officer and Senior Vice President of Investment Support for Strategic Advisers, Inc. (2003-2011). |
Scott C. Goebel (1968) |
Year of Election or Appointment: 2015 Vice President |
| Mr. Goebel serves as Vice President of other funds and is an employee of Fidelity Investments (2001-present). Previously, Mr. Goebel served as Secretary of Fidelity SelectCo, LLC (investment adviser firm, 2013-2015), Fidelity Investments Money Management, Inc. (FIMM) (investment adviser firm, 2010-2015), and Fidelity Research and Analysis Company (FRAC) (investment adviser firm, 2010-2015); General Counsel, Secretary, and Senior Vice President of Fidelity Management & Research Company (investment adviser firm, 2008-2015) and FMR Co., Inc. (investment adviser firm, 2008-2015); Assistant Secretary of Fidelity Management & Research (Japan) Limited (investment adviser firm, 2008-2015) and FMR Investment Management (U.K.) Limited (investment adviser firm, 2008-2015); Chief Legal Officer (CLO) of Fidelity Management & Research (Hong Kong) Limited (investment adviser firm, 2008-2015); Secretary and CLO of certain Fidelity funds (2008-2015); Assistant Secretary of FIMM (2008-2010), FRAC (2008-2010), and certain funds (2007-2008); and as Vice President and Secretary of Fidelity Distributors Corporation (FDC) (2005-2007). |
Brian B. Hogan (1964) |
Year of Election or Appointment: 2009 Vice President |
| Mr. Hogan also serves as Trustee or Vice President of other funds. Mr. Hogan serves as a Director of Fidelity SelectCo, LLC (investment adviser firm, 2014-present) and President of the Equity Division of FMR (investment adviser firm, 2009-present). Previously, Mr. Hogan served as Senior Vice President, Equity Research of FMR (2006-2009) and as a portfolio manager. |
Chris Maher (1972) |
Year of Election or Appointment: 2013 Assistant Treasurer |
| Mr. Maher serves as Assistant Treasurer of other funds. Mr. Maher is Vice President of Valuation Oversight and is an employee of Fidelity Investments. Previously, Mr. Maher served as Vice President of Asset Management Compliance (2013), Vice President of the Program Management Group of FMR (investment adviser firm, 2010-2013), and Vice President of Valuation Oversight (2008-2010). |
Kenneth B. Robins (1969) |
Year of Election or Appointment: 2008 President and Treasurer |
| Mr. Robins also serves as an officer of other funds. Mr. Robins serves as Executive Vice President of Fidelity Investments Money Management, Inc. (FIMM) (investment adviser firm, 2013-present) and is an employee of Fidelity Investments (2004-present). Previously, Mr. Robins served in other fund officer roles. |
Stacie M. Smith (1974) |
Year of Election or Appointment: 2013 Deputy Treasurer |
| Ms. Smith also serves as an officer of other funds. She is an employee of Fidelity Investments (2009-present) and has served in other fund officer roles. Prior to joining Fidelity Investments, Ms. Smith served as Senior Audit Manager of Ernst & Young LLP (1996-2009). |
Renee Stagnone (1975) |
Year of Election or Appointment: 2013 Deputy Treasurer |
| Ms. Stagnone also serves as Deputy Treasurer of other funds. Ms. Stagnone is an employee of Fidelity Investments (1997-present). |
Linda J. Wondrack (1964) |
Year of Election or Appointment: 2014 Chief Compliance Officer |
| Ms. Wondrack also serves as Chief Compliance Officer of other funds. Ms. Wondrack is Executive Vice President and head of the Ethics Office and Asset Management Compliance for Fidelity Investments (2012-present). Ms. Wondrack also serves as Chief Compliance Officer of Fidelity SelectCo, LLC (investment adviser firm, 2014-present); Chief Compliance Officer of Impresa Management LLC (2013-present); and Chief Compliance Officer of FMR Co., Inc. (investment adviser firm), Fidelity Investments Money Management, Inc. (investment adviser firm), Fidelity Management & Research (Japan) Limited (investment adviser firm), FMR Investment Management (U.K.) Limited (investment adviser firm), Fidelity Management & Research (Hong Kong) (investment adviser firm), Fidelity Management & Research Company (investment adviser firm), FIAM LLC (investment adviser firm), and Strategic Advisers, Inc. (investment adviser firm), Ballyrock Investment Advisors LLC, and Northern Neck Investors LLC (2012-present). Previously, Ms. Wondrack served as Senior Vice President and Chief Compliance Officer for Columbia Management Investment Advisers, LLC (2005-2012); Chief Compliance Officer for certain funds within the Columbia Family of Funds (2007-2012); and Senior Vice President of Compliance Risk Management at Bank of America (2005-2010). |
Joseph F. Zambello (1957) |
Year of Election or Appointment: 2011 Deputy Treasurer |
| Mr. Zambello also serves as Deputy Treasurer of other funds. Mr. Zambello is an employee of Fidelity Investments (1991-present). Previously, Mr. Zambello served as Vice President of the Program Management Group of FMR (investment adviser firm, 2009-2011) and Vice President of the Transfer Agent Oversight Group (2005-2009). |
Annual Report
Class A, T, B and C designate 100% of the dividend distributed during the fiscal year, as amounts which may be taken into account as a dividend for purposes of the maximum rate under section 1(h)(11) of the Internal Revenue Code.
The amounts per share which represent income derived from sources within, and taxes paid to, foreign countries or possessions of the United States are as follows:
| Pay Date | Income | Taxes |
Class A | 12/08/14 | $0.2207 | $0.467 |
Class T | 12/08/14 | $0.2107 | $0.467 |
Class B | 12/08/14 | $0.1447 | $0.467 |
Class C | 12/08/14 | $0.1637 | $0.467 |
The fund will notify shareholders in January 2016 of amounts for use in preparing 2015 income tax returns.
Annual Report
Fidelity Emerging Europe, Middle East, Africa (EMEA) Fund
Each year, the Board of Trustees, including the Independent Trustees (together, the Board), votes on the renewal of the management contract with Fidelity Management & Research Company (FMR) and the sub-advisory agreements (together, the Advisory Contracts) for the fund. The Board, assisted by the advice of fund counsel and Independent Trustees' counsel, requests and considers a broad range of information relevant to the renewal of the Advisory Contracts throughout the year.
The Board meets regularly and, at each of its meetings, covers an extensive agenda of topics and materials and considers factors that are relevant to its annual consideration of the renewal of the fund's Advisory Contracts, including the services and support provided to the fund and its shareholders. The Board has established various standing committees (Committees), each composed of and chaired by Independent Trustees with varying backgrounds, to which the Board has assigned specific subject matter responsibilities in order to enhance effective decision-making by the Board. The Board, acting directly and through its Committees, requests and receives information concerning the annual consideration of the renewal of the fund's Advisory Contracts. The Board also meets as needed to consider matters specifically related to the Board's annual consideration of the renewal of the Advisory Contracts. Members of the Board may also meet with trustees of other Fidelity funds through ad hoc joint committees to discuss certain matters relevant to all of the Fidelity funds.
At its July 2015 meeting, the Board unanimously determined to renew the fund's Advisory Contracts. In reaching its determination, the Board considered all factors it believed relevant, including (i) the nature, extent, and quality of the services to be provided to the fund and its shareholders (including the investment performance of the fund); (ii) the competitiveness of the fund's management fee and total expense ratio relative to peer funds; (iii) the total costs of the services to be provided by and the profits to be realized by Fidelity from its relationship with the fund; and (iv) the extent to which (if any) economies of scale exist and would be realized as the fund grows, and whether any economies of scale are appropriately shared with fund shareholders.
In considering whether to renew the Advisory Contracts for the fund, the Board reached a determination, with the assistance of fund counsel and Independent Trustees' counsel and through the exercise of its business judgment, that the renewal of the Advisory Contracts was in the best interests of the fund and its shareholders and that the compensation payable under the Advisory Contracts was fair and reasonable. The Board's decision to renew the Advisory Contracts was not based on any single factor, but rather was based on a comprehensive consideration of all the information provided to the Board at its meetings throughout the year. The Board, in reaching its determination to renew the Advisory Contracts, was aware that shareholders of the fund have a broad range of investment choices available to them, including a wide choice among funds offered by Fidelity's competitors, and that the fund's shareholders, who have the opportunity to review and weigh the disclosure provided by the fund in its prospectus and other public disclosures, have chosen to invest in this fund, which is part of the Fidelity family of funds.
Annual Report
Nature, Extent, and Quality of Services Provided. The Board considered Fidelity's staffing as it relates to the fund, including the backgrounds of investment personnel of Fidelity, and also considered the fund's investment objective, strategies, and related investment philosophy. The Independent Trustees also had discussions with senior management of Fidelity's investment operations and investment groups. The Board considered the structure of the portfolio manager compensation program and whether this structure provides appropriate incentives to act in the best interests of the fund. Additionally, the Board considered the portfolio managers' investments, if any, in the funds that they manage.
Resources Dedicated to Investment Management and Support Services. The Board and the Fund Oversight and Research Committees reviewed the general qualifications and capabilities of Fidelity's investment staff, including its size, education, experience, and resources, as well as Fidelity's approach to recruiting, training, managing, and compensating investment personnel. The Board noted that Fidelity has continued to increase the resources devoted to non-U.S. offices, including expansion of Fidelity's global investment organization. The Board also noted that Fidelity's analysts have extensive resources, tools and capabilities that allow them to conduct sophisticated quantitative and fundamental analysis, as well as credit analysis of issuers, counterparties and guarantors. Further, the Board considered that Fidelity's investment professionals have sufficient access to global information and data so as to provide competitive investment results over time, and that those professionals also have access to sophisticated tools that permit them to assess portfolio construction and risk and performance attribution characteristics continuously, as well as to transmit new information and research conclusions rapidly around the world. Additionally, in its deliberations, the Board considered Fidelity's trading, risk management, and compliance capabilities and resources, which are integral parts of the investment management process.
Shareholder and Administrative Services. The Board considered (i) the nature, extent, quality, and cost of advisory, administrative, and shareholder services performed by FMR, the sub-advisers (together with FMR, the Investment Advisers), and their affiliates under the Advisory Contracts and under separate agreements covering transfer agency, pricing and bookkeeping, and securities lending services for the fund; (ii) the nature and extent of the supervision of third party service providers, principally custodians and subcustodians; and (iii) the resources devoted to, and the record of compliance with, the fund's compliance policies and procedures. The Board also reviewed the allocation of fund brokerage, including allocations to brokers affiliated with the Investment Advisers, the use of brokerage commissions to pay fund expenses, and the use of "soft" commission dollars to pay for research services.
Annual Report
Board Approval of Investment Advisory Contracts and
Management Fees - continued
The Board noted that the growth of fund assets over time across the complex allows Fidelity to reinvest in the development of services designed to enhance the value or convenience of the Fidelity funds as investment vehicles. These services include 24-hour access to account information and market information through telephone representatives and over the Internet, investor education materials and asset allocation tools, and the expanded availability of Fidelity Investor Centers.
In 2014, the Board formed an ad hoc Committee on Transfer Agency Fees to review the variety of transfer agency fee structures throughout the industry and Fidelity's competitive positioning with respect to industry participants.
Investment in a Large Fund Family. The Board considered the benefits to shareholders of investing in a Fidelity fund, including the benefits of investing in a fund that is part of a large family of funds offering a variety of investment disciplines and providing a large variety of mutual fund investor services. The Board noted that Fidelity had taken, or had made recommendations that resulted in the Fidelity funds taking, a number of actions over the previous year that benefited particular funds, including (i) continuing to dedicate additional resources to investment research and to the support of the senior management team that oversees asset management; (ii) continuing efforts to enhance Fidelity's global research capabilities; (iii) launching new funds and making other enhancements to meet client needs; (iv) reducing management fees and total expenses for certain index funds and diversified international funds; (v) continuing to launch dedicated lower cost underlying funds to meet portfolio construction needs related to expanding underlying fund options for Fidelity funds of funds, specifically for the Freedom Fund product lines; (vi) rationalizing product lines and gaining increased efficiencies through fund mergers; (vii) launching active fixed-income exchange-traded funds; (viii) continuing to develop, acquire and implement systems and technology to improve services to the funds and information security and to increase efficiency; (ix) implementing investment enhancements to further strengthen Fidelity's target date product line to increase investors' probability of success in achieving their goals; (x) modifying the eligibility criteria for certain share classes to accommodate roll-over assets from employer-sponsored retirement plans; (xi) launching a new Class W of the Freedom Index Funds to attract and retain Fidelity record-kept retirement plan assets; and (xii) implementing changes to Fidelity's money market product line in response to recent money market regulatory reforms.
Investment Performance. The Board considered whether the fund has operated in accordance with its investment objective, as well as its record of compliance with its investment restrictions and its performance history.
Annual Report
The Board took into account discussions with representatives of the Investment Advisers about fund investment performance that occur at Board meetings throughout the year. In this regard the Board noted that as part of regularly scheduled fund reviews and other reports to the Board on fund performance, the Board considers annualized return information for the fund, for different time periods, measured against a securities market index ("benchmark index") and a peer group of funds with similar objectives ("peer group"), if any. In its evaluation of fund investment performance, the Board gave particular attention to information indicating changes in performance of certain Fidelity funds for specific time periods and discussed with the Investment Advisers the reasons for any overperformance or underperformance.
In addition to reviewing absolute and relative fund performance, the Independent Trustees periodically consider the appropriateness of fund performance metrics in evaluating the results achieved. In general, the Independent Trustees believe that fund performance should be evaluated based on net performance (after fees and expenses) of both the highest performing and lowest performing fund share classes, where applicable, compared to appropriate benchmark indices, over appropriate time periods that may include full market cycles, and compared to peer groups, as applicable, over the same periods, taking into account relevant factors including the following: general market conditions; issuer-specific information; and fund cash flows and other factors.
The Independent Trustees recognize that shareholders evaluate performance on a net basis over their own holding periods, for which one-, three-, and five-year periods are often used as a proxy. For this reason, the performance information reviewed by the Board also included net cumulative calendar year total return information for the fund and an appropriate benchmark index for the most recent one-, three-, and five-year periods, as shown below. A peer group is not shown below because the fund does not generally utilize a peer group for performance comparison purposes.
Annual Report
Board Approval of Investment Advisory Contracts and
Management Fees - continued
Fidelity Emerging Europe, Middle East, Africa (EMEA) Fund
Based on its review, the Board concluded that the nature, extent, and quality of services provided to the fund under the Advisory Contracts should benefit the shareholders of the fund.
Competitiveness of Management Fee and Total Expense Ratio. The Board considered the fund's management fee and total expense ratio compared to "mapped groups" of competitive funds and classes created for the purpose of facilitating the Trustees' competitive analysis of management fees and total expenses. Fidelity creates "mapped groups" by combining similar Lipper investment objective categories that have comparable investment mandates. Combining Lipper investment objective categories aids the Board's management fee and total expense ratio comparisons by broadening the competitive group used for comparison.
Management Fee. The Board considered two proprietary management fee comparisons for the 12-month periods shown in basis points (BP) in the chart below. The group of Lipper funds used by the Board for management fee comparisons is referred to below as the "Total Mapped Group." The Total Mapped Group comparison focuses on a fund's standing in terms of gross management fees before expense reimbursements or caps relative to the total universe of funds with comparable investment mandates, regardless of whether their management fee structures also are comparable. Funds with comparable investment mandates offer exposure to similar types of securities. Funds with comparable management fee structures have similar management fee contractual arrangements (e.g., flat rate charged for advisory services, all-inclusive fee rate, etc.). "TMG %" represents the percentage of funds in the Total Mapped Group that had management fees that were lower than the fund's. For example, a hypothetical TMG % of 20% would mean that 80% of the funds in the Total Mapped Group had higher, and 20% had lower, management fees than the fund. The fund's actual TMG %s and the number of funds in the Total Mapped Group are in the chart below. The "Asset-Size Peer Group" (ASPG) comparison focuses on a fund's standing relative to a subset of non-Fidelity funds within the Total Mapped Group that are similar in size and management fee structure without taking into account performance adjustments, if any. For example, if a fund is in the first quartile of the ASPG, the fund's management fee ranks in the least expensive or lowest 25% of funds in the ASPG. The ASPG represents at least 15% of the funds in the Total Mapped Group with comparable asset size and management fee structures, subject to a minimum of 50 funds (or all funds in the Total Mapped Group if fewer than 50). Additional information, such as the ASPG quartile in which the fund's management fee rate ranked, is also included in the chart and considered by the Board.
Annual Report
Fidelity Emerging Europe, Middle East, Africa (EMEA) Fund

The Board noted that the fund's management fee rate ranked below the median of its Total Mapped Group and below the median of its ASPG for 2014.
The Board noted that, in 2014, the ad hoc Committee on Group Fee was formed by it and other Fidelity fund boards to conduct an in-depth review of the "group fee" component of the management fee of funds with such management fee structures. Committee focus included the mechanics of the group fee, the competitive landscape of group fee structures, Fidelity funds with no group fee component and investment products not included in group fee assets. The Board also considered that, for funds subject to the group fee, FMR agreed to voluntarily waive fees over a specified period of time in amounts designed to account for assets converted from certain funds to certain collective investment trusts.
Annual Report
Board Approval of Investment Advisory Contracts and
Management Fees - continued
The Board also noted that, in 2013, the ad hoc Committee on Management Fees was formed to conduct an in-depth review of the management fee rates of Fidelity's active equity mutual funds. The Committee focused on the following areas: (i) standard fee structures; (ii) research consumption and trading evolution; (iii) management fee competitiveness/profitability by category; and (iv) factors that drive institutional pricing.
Based on its review, the Board concluded that the fund's management fee is fair and reasonable in light of the services that the fund receives and the other factors considered.
Total Expense Ratio. In its review of each class's total expense ratio, the Board considered the fund's management fee as well as other fund or class expenses, as applicable, such as transfer agent fees, pricing and bookkeeping fees, fund-paid 12b-1 fees, and custodial, legal, and audit fees. The Board also noted that Fidelity may agree to waive fees and expenses from time to time, and the extent to which, if any, it has done so for the fund. As part of its review, the Board also considered the current and historical total expense ratios of each class of the fund compared to competitive fund median expenses. Each class of the fund is compared to those funds and classes in the Total Mapped Group (used by the Board for management fee comparisons) that have a similar sales load structure.
The Board noted that the total expense ratio of each of Class A, Class I, and the retail class ranked below its competitive median for 2014 and the total expense ratio of each of Class T, Class B, and Class C ranked above its competitive median for 2014. The Board considered that, in general, various factors can affect total expense ratios. The Board noted that the total expense ratio of Class T was above the competitive median primarily because of higher 12b-1 fees on Class T as compared to most competitor funds. Class T has a higher 12b-1 fee, but a lower front-end sales charge, than traditionally priced front-end sales charge classes. The Board considered that Class T is primarily sold load-waived in the retirement plan market where its 0.50% 12b-1 fee is comparable to competing no-load, higher 12b-1 fee classes designed specifically for retirement plans. The Board noted that the fund offers multiple classes, each of which has a different sales load and 12b-1 fee structure, and that the multiple structures are intended to offer a range of pricing options for the intermediary market. The Board also noted that the total expense ratios of the classes vary primarily by the level of their 12b-1 fees, although differences in transfer agent fees may also cause expenses to vary from class to class.
Fees Charged to Other Fidelity Clients. The Board also considered Fidelity fee structures and other information with respect to clients of Fidelity, such as other funds advised or subadvised by Fidelity, pension plan clients, and other institutional clients with similar mandates. The Board noted the findings of the 2013 ad hoc joint committee (created with the board of other Fidelity funds), which reviewed and compared Fidelity's institutional investment advisory business with its business of providing services to the Fidelity funds, including the differences in services provided, fees charged, and costs incurred, as well as competition in their respective marketplaces.
Annual Report
Based on its review of total expense ratios and fees charged to other Fidelity clients, the Board concluded that, although in some cases above the median of the universe presented for comparison, the total expense ratio of each class of the fund was reasonable in light of the services that the fund and its shareholders receive and the other factors considered.
Costs of the Services and Profitability. The Board considered the revenues earned and the expenses incurred by Fidelity in conducting the business of developing, marketing, distributing, managing, administering and servicing the fund and servicing the fund's shareholders. The Board also considered the level of Fidelity's profits in respect of all the Fidelity funds.
On an annual basis, Fidelity presents to the Board information about the profitability of its relationship with the fund. Fidelity calculates profitability information for each fund, as well as aggregate profitability information for groups of Fidelity funds and all Fidelity funds, using a series of detailed revenue and cost allocation methodologies which originate with the books and records of Fidelity on which Fidelity's audited financial statements are based. The Audit Committee of the Board reviews any significant changes from the prior year's methodologies.
PricewaterhouseCoopers LLP (PwC), independent registered public accounting firm and auditor to Fidelity and certain Fidelity funds, has been engaged annually by the Board as part of the Board's assessment of Fidelity's profitability analysis. PwC's engagement includes the review and assessment of the methodologies used by Fidelity in determining the revenues and expenses attributable to Fidelity's mutual fund business, and completion of agreed-upon procedures in respect of the mathematical accuracy of fund profitability and its conformity to established allocation methodologies. After considering PwC's reports issued under the engagement and information provided by Fidelity, the Board concluded that while other allocation methods may also be reasonable, Fidelity's profitability methodologies are reasonable in all material respects.
The Board also reviewed Fidelity's non-fund businesses and fall-out benefits related to the mutual fund business as well as cases where Fidelity's affiliates may benefit from or be related to the fund's business.
The Board considered the costs of the services provided by and the profits realized by Fidelity in connection with the operation of the fund and was satisfied that the profitability was not excessive.
Annual Report
Board Approval of Investment Advisory Contracts and
Management Fees - continued
Economies of Scale. The Board considered whether there have been economies of scale in respect of the management of the Fidelity funds, whether the Fidelity funds (including the fund) have appropriately benefited from any such economies of scale, and whether there is potential for realization of any further economies of scale. The Board considered the extent to which the fund will benefit from economies of scale as assets grow through increased services to the fund, through waivers or reimbursements, or through fee or expense ratio reductions. The Board also noted that in 2013, it and the boards of other Fidelity funds created an ad hoc committee (the Economies of Scale Committee) to analyze whether Fidelity attains economies of scale in respect of the management and servicing of the Fidelity funds, whether the Fidelity funds have appropriately benefited from such economies of scale, and whether there is potential for realization of any further economies of scale.
The Board recognized that the fund's management contract incorporates a "group fee" structure, which provides for lower group fee rates as total group assets increase, and for higher group fee rates as total group assets decrease (with "group assets" defined to include fund assets under FMR's management plus sector fund assets previously under FMR's management and currently managed by Fidelity SelectCo, LLC). FMR calculates the group fee rates based on a tiered asset "breakpoint" schedule that varies based on asset class. The Board considered that the group fee is designed to deliver the benefits of economies of scale to fund shareholders when total Fidelity fund assets increase, even if assets of any particular fund are unchanged or have declined, because some portion of Fidelity's costs are attributable to services provided to all Fidelity funds, and all funds benefit if those costs can be allocated among more assets. The Board concluded that, given the group fee structure, fund shareholders will benefit from lower management fees as group assets increase at the fund complex level, regardless of whether Fidelity achieves any such economies of scale.
The Board concluded, taking into account the analysis of the Economies of Scale Committee, that economies of scale, if any, are being appropriately shared between fund shareholders and Fidelity.
Additional Information Requested by the Board. In order to develop fully the factual basis for consideration of the Fidelity funds' Advisory Contracts, the Board requested and received additional information on certain topics, including: (i) fund performance trends and Fidelity's long-term strategies for certain funds; (ii) the various share classes employed by Fidelity and the attributes of each class, together with similar information on the distribution and servicing payments made by Fidelity or the funds to third-party participants in the distribution channels; (iii) fund profitability, and fund performance in relation to fund profitability; (iv) the methodology with respect to evaluating competitive fund data and peer group classifications and fee comparisons; (v) annual fund profitability margins, with particular focus on certain funds with negative margins; (vi) the realization of fall-out benefits in certain Fidelity business units; (vii) economies of scale and the way in which they are shared with fund shareholders; (viii) Fidelity's group fee structures, including the group fee schedule of breakpoints; (ix) the impact of cost containment measures on the funds; and (x) the transfer agent fee structure.
Annual Report
Based on its evaluation of all of the conclusions noted above, and after considering all factors it believed relevant, the Board concluded that the advisory fee structures are fair and reasonable, and that the fund's Advisory Contracts should be renewed.
Annual Report
Investment Adviser
Fidelity Management & Research Company
Boston, MA
Investment Sub-Advisers
FMR Co., Inc.
FMR Investment Management
(U.K.) Limited
FIL Investments (Japan) Limited
FIL Investment Advisors
FIL Investment Advisors
(UK) Limited
Fidelity Management & Research
(Hong Kong) Limited
Fidelity Management & Research
(Japan) Limited
General Distributor
Fidelity Distributors Corporation
Smithfield, RI
Transfer and Service Agents
Fidelity Investments Institutional
Operations Company, Inc.
Boston, MA
Fidelity Service Company, Inc.
Boston, MA
Custodian
State Street Bank & Trust Company
Quincy, MA
(Fidelity Investment logo)(registered trademark)
AEME-UANN-1215
1.861988.107
(Fidelity Investment logo)(registered trademark)
Fidelity Advisor®
Emerging Europe,
Middle East, Africa (EMEA)
Fund - Class I
(formerly Institutional Class)
Annual Report
October 31, 2015
(Fidelity Cover Art)
Class I is a
class of Fidelity® Emerging Europe, Middle East, Africa (EMEA) Fund
Contents
Performance | (Click Here) | How the fund has done over time. |
Management's Discussion of Fund Performance | (Click Here) | The Portfolio Manager's review of fund performance and strategy. |
Shareholder Expense Example | (Click Here) | An example of shareholder expenses. |
Investment Changes | (Click Here) | A summary of major shifts in the fund's investments over the past six months. |
Investments | (Click Here) | A complete list of the fund's investments with their market values. |
Financial Statements | (Click Here) | Statements of assets and liabilities, operations, and changes in net assets, as well as financial highlights. |
Notes | (Click Here) | Notes to the financial statements. |
Report of Independent Registered Public Accounting Firm | (Click Here) | |
Trustees and Officers | (Click Here) | |
Distributions | (Click Here) | |
Board Approval of Investment Advisory Contracts and Management Fees | (Click Here) | |
To view a fund's proxy voting guidelines and proxy voting record for the 12-month period ended June 30, visit http://www.fidelity.com/proxyvotingresults or visit the Securities and Exchange Commission's (SEC) web site at http://www.sec.gov. You may also call 1-877-208-0098 to request a free copy of the proxy voting guidelines.
Standard & Poor's, S&P and S&P 500 are registered service marks of The McGraw-Hill Companies, Inc. and have been licensed for use by Fidelity Distributors Corporation.
Other third-party marks appearing herein are the property of their respective owners.
All other marks appearing herein are registered or unregistered trademarks or service marks of FMR LLC or an affiliated company. © 2015 FMR LLC. All rights reserved.
Annual Report
This report and the financial statements contained herein are submitted for the general information of the shareholders of the fund. This report is not authorized for distribution to prospective investors in the fund unless preceded or accompanied by an effective prospectus.
A fund files its complete schedule of portfolio holdings with the SEC for the first and third quarters of each fiscal year on Form N-Q. Forms N-Q are available on the SEC's web site at http://www.sec.gov. A fund's Forms N-Q may be reviewed and copied at the SEC's Public Reference Room in Washington, DC. Information regarding the operation of the SEC's Public Reference Room may be obtained by calling 1-800-SEC-0330. For a complete list of a fund's portfolio holdings, view the most recent holdings listing, semiannual report, or annual report on Fidelity's web site at http://www.fidelity.com, http://www.advisor.fidelity.com, or http://www.401k.com, as applicable.
NOT FDIC INSURED • MAY LOSE VALUE • NO BANK GUARANTEE
Neither the fund nor Fidelity Distributors Corporation is a bank.
Annual Report
Average annual total return reflects the change in the value of an investment, assuming reinvestment of the class' distributions from dividend income and capital gains (the profits earned upon the sale of securities that have grown in value, if any) and assuming a constant rate of performance each year. The $10,000 table and the fund's returns do not reflect the deduction of taxes that a shareholder would pay on fund distributions or the redemption of fund shares. During periods of reimbursement by Fidelity, a fund's total return will be greater than it would be had the reimbursement not occurred. How a fund did yesterday is no guarantee of how it will do tomorrow.
Average Annual Total Returns
Periods ended October 31, 2015 | Past 1
year | Past 5
years | Life of
fund A |
Class I | -15.23% | -1.52% | -2.16% |
A From May 8, 2008.
$10,000 Over Life of Fund
Let's say hypothetically that $10,000 was invested in Fidelity Advisor® Emerging Europe, Middle East, Africa (EMEA) Fund - Class I on May 8, 2008, when the fund started. The chart shows how the value of your investment would have changed, and also shows how the MSCI EM (Emerging Markets) Europe, Middle East and Africa Index performed over the same period.
Annual Report
Market Recap: International equities suffered a moderate setback for the 12 months ending October 31, 2015, held back by a collapse in commodities prices that hurt resources-related sectors and geographies. The MSCI ACWI (All Country World Index) ex USA Index returned -4.55% for the period, affected also by concerns about global economic growth. Commodity producers remained under pressure for much of the past year, largely related to economic deceleration in China (-1%), the world's second-largest economy and a leading consumer of raw materials. This effect was exacerbated by U.S. dollar strength relative to global currencies, which weighed on commodities priced in dollars and acutely impacted equity returns within regions most exposed to resources prices. The emerging-markets group, for example, returned about -15% this period. Canada, a significant energy producer, returned roughly -17%. Net energy consumer Japan (+9%) was the best-performing region by far. Only about a quarter of the nearly 50 index countries managed a gain this period: Ireland (+19%) - the EU's fastest-growing economy - and Israel (+17%) proved top performers; Greece (-56%) and Brazil (-46%), among the worst. As for sectors, energy (-25%) and materials (-16%) declined sharply, whereas the two consumer sectors each gained about 6%.
Comments from Portfolio Manager Adam Kutas: For the year, the fund's share classes (excluding sales charges, if applicable) delivered double-digit negative results, but solidly outpaced the -18.36% return of the MSCI EM (Emerging Markets) Europe, Middle East and Africa Index. The past 12 months posed challenges for emerging EMEA markets, as the commodities collapse weighed heavily on commodity-rich nations, especially Russia. For the period, the fund derived most of its advantage versus the benchmark from stock selection. Our picks among banks had the biggest impact. Here, Romanian bank Banca Transilvania, a non-benchmark holding, performed well, as the Romanian economy began improving. Russia's government-owned Sberbank also helped. With the Russian economy under pressure as oil fell sharply in the fourth quarter of 2014, I was able to establish a position in Sberbank, making it one of the fund's largest overweightings by period end. The stock rose steadily through the end of October. Conversely, the fund's positioning in energy detracted. The fund's most significant detractor was untimely ownership of South African private equity investor Steinhoff International Holdings.
The views expressed above reflect those of the portfolio manager(s) only through the end of the period as stated on the cover of this report and do not necessarily represent the views of Fidelity or any other person in the Fidelity organization. Any such views are subject to change at any time based upon market or other conditions and Fidelity disclaims any responsibility to update such views. These views may not be relied on as investment advice and, because investment decisions for a Fidelity fund are based on numerous factors, may not be relied on as an indication of trading intent on behalf of any Fidelity fund.
Annual Report
Shareholder Expense Example
As a shareholder of the Fund, you incur two types of costs: (1) transaction costs, including sales charges (loads) on purchase payments or redemption proceeds, redemption fees and (2) ongoing costs, including management fees, distribution and/or service (12b-1) fees and other Fund expenses. This Example is intended to help you understand your ongoing costs (in dollars) of investing in the Fund and to compare these costs with the ongoing costs of investing in other mutual funds.
The Example is based on an investment of $1,000 invested at the beginning of the period and held for the entire period (May 1, 2015 to October 31, 2015).
Actual Expenses
The first line of the accompanying table for each class of the Fund provides information about actual account values and actual expenses. You may use the information in this line, together with the amount you invested, to estimate the expenses that you paid over the period. Simply divide your account value by $1,000.00 (for example, an $8,600 account value divided by $1,000.00 = 8.6), then multiply the result by the number in the first line for a class of the Fund under the heading entitled "Expenses Paid During Period" to estimate the expenses you paid on your account during this period. A small balance maintenance fee of $12.00 that is charged once a year may apply for certain accounts with a value of less than $2,000. This fee is not included in the table below. If it was, the estimate of expenses you paid during the period would be higher, and your ending account value lower, by this amount. In addition, the Fund, as a shareholder in the underlying Fidelity Central Funds, will indirectly bear its pro-rata share of the fees and expenses incurred by the underlying Fidelity Central Funds. These fees and expenses are not included in the Fund's annualized expense ratio used to calculate the expense estimate in the table below.
Hypothetical Example for Comparison Purposes
The second line of the accompanying table for each class of the Fund provides information about hypothetical account values and hypothetical expenses based on a Class' actual expense ratio and an assumed rate of return of 5% per year before expenses, which is not the Class' actual return. The hypothetical account values and expenses may not be used to estimate the actual ending account balance or expenses you paid for the period. You may use this information to compare the ongoing costs of investing in the Fund and other funds. To do so, compare this 5% hypothetical example with the 5% hypothetical examples that appear in the shareholder reports of the other funds. A small balance maintenance fee of $12.00 that is charged once a year may apply for certain accounts with a value of less than $2,000. This fee is not included in the table below. If it was, the estimate of expenses you paid during the period would be higher, and your ending account value lower, by this amount. In addition, the Fund, as a shareholder in the underlying Fidelity Central Funds, will indirectly bear its pro-rata share of the fees and expenses incurred by the underlying Fidelity Central Funds. These fees and expenses are not included in the Fund's annualized expense ratio used to calculate the expense estimate in the table below.
Please note that the expenses shown in the table are meant to highlight your ongoing costs only and do not reflect any transaction costs. Therefore, the second line of the table is useful in comparing ongoing costs only, and will not help you determine the relative total costs of owning different funds. In addition, if these transactional costs were included, your costs would have been higher.
Annual Report
| Annualized
Expense Ratio B | Beginning
Account Value
May 1, 2015 | Ending
Account Value
October 31, 2015 | Expenses Paid
During Period C
May 1, 2015
to October 31, 2015 |
Class A | 1.57% | | | |
Actual | | $ 1,000.00 | $ 847.30 | $ 7.31 |
HypotheticalA | | $ 1,000.00 | $ 1,017.29 | $ 7.98 |
Class T | 1.90% | | | |
Actual | | $ 1,000.00 | $ 845.50 | $ 8.84 |
HypotheticalA | | $ 1,000.00 | $ 1,015.63 | $ 9.65 |
Class B | 2.40% | | | |
Actual | | $ 1,000.00 | $ 843.60 | $ 11.15 |
HypotheticalA | | $ 1,000.00 | $ 1,013.11 | $ 12.18 |
Class C | 2.40% | | | |
Actual | | $ 1,000.00 | $ 844.60 | $ 11.16 |
HypotheticalA | | $ 1,000.00 | $ 1,013.11 | $ 12.18 |
Emerging Europe, Middle East, Africa (EMEA) | 1.36% | | | |
Actual | | $ 1,000.00 | $ 847.50 | $ 6.33 |
HypotheticalA | | $ 1,000.00 | $ 1,018.35 | $ 6.92 |
Class I | 1.19% | | | |
Actual | | $ 1,000.00 | $ 848.40 | $ 5.54 |
HypotheticalA | | $ 1,000.00 | $ 1,019.21 | $ 6.06 |
A 5% return per year before expenses
B Annualized expense ratio reflects expenses net of applicable fee waivers.
C Expenses are equal to each Class' annualized expense ratio, multiplied by the average account value over the period, multiplied by 184/365 (to reflect the one-half year period).
Annual Report
Investment Changes (Unaudited)
Asset Allocation as of October 31, 2015 |
| % of fund's
net assets | % of fund's net assets
6 months ago |
Stocks | 100.0 | 99.9 |
Short-Term Investments and Net Other Assets (Liabilities) | 0.0 | 0.1 |
Top Ten Stocks as of October 31, 2015 |
| % of fund's
net assets | % of fund's net assets
6 months ago |
Naspers Ltd. Class N (South Africa, Media) | 8.0 | 7.3 |
Sberbank of Russia (Russia, Banks) | 4.7 | 4.1 |
Lukoil PJSC (Russia, Oil, Gas & Consumable Fuels) | 3.9 | 5.5 |
Gazprom OAO (Russia, Oil, Gas & Consumable Fuels) | 3.7 | 4.9 |
MTN Group Ltd. (South Africa, Wireless Telecommunication Services) | 3.1 | 5.4 |
Remgro Ltd. (South Africa, Diversified Financial Services) | 2.6 | 2.4 |
FirstRand Ltd. (South Africa, Diversified Financial Services) | 2.6 | 2.9 |
Steinhoff International Holdings Ltd. (South Africa, Household Durables) | 2.4 | 0.1 |
Sasol Ltd. (South Africa, Oil, Gas & Consumable Fuels) | 2.2 | 2.4 |
Surgutneftegas OJSC (Russia, Oil, Gas & Consumable Fuels) | 2.1 | 1.7 |
| 35.3 | |
Market Sectors as of October 31, 2015 |
| % of fund's
net assets | % of fund's net assets
6 months ago |
Financials | 39.3 | 35.9 |
Consumer Discretionary | 18.0 | 16.3 |
Energy | 14.9 | 16.6 |
Consumer Staples | 11.8 | 9.3 |
Materials | 5.2 | 5.9 |
Telecommunication Services | 4.2 | 8.1 |
Health Care | 3.5 | 4.3 |
Industrials | 3.1 | 3.1 |
Information Technology | 0.0 | 0.4 |
Market Sectors may include more than one industry category. |
The fund may invest up to 35% of its total assets in any industry that represents more than 20% of the emerging Europe, Middle East and Africa markets. As of October 31, 2015, the fund did not have more than 25% of its total assets invested in any one industry. |
Percentages shown as 0.0% may reflect amounts less than 0.05%. |
Annual Report
Investments October 31, 2015
Showing Percentage of Net Assets
Common Stocks - 96.4% |
| Shares | | Value |
Austria - 2.6% |
CA Immobilien Anlagen AG | 39,100 | | $ 766,839 |
Erste Group Bank AG (a) | 29,100 | | 853,435 |
Wienerberger AG | 31,000 | | 571,505 |
TOTAL AUSTRIA | | 2,191,779 |
Bailiwick of Jersey - 0.5% |
Wizz Air Holdings PLC | 13,888 | | 405,715 |
Bermuda - 0.2% |
Aquarius Platinum Ltd. (a) | 937,700 | | 165,329 |
Botswana - 0.4% |
First National Bank of Botswana Ltd. | 964,358 | | 344,843 |
British Virgin Islands - 0.4% |
Lenta Ltd. GDR (a) | 49,000 | | 367,990 |
Croatia - 0.5% |
Ledo d.d. | 282 | | 388,137 |
Czech Republic - 1.3% |
Komercni Banka A/S | 5,049 | | 1,044,981 |
Estonia - 0.6% |
Tallinna Kaubamaja AS | 70,900 | | 498,977 |
Greece - 0.7% |
Jumbo SA | 26,536 | | 256,787 |
Sarantis SA | 37,800 | | 305,516 |
TOTAL GREECE | | 562,303 |
Hungary - 1.4% |
OTP Bank PLC | 62,000 | | 1,201,442 |
Israel - 0.6% |
Delta Galil Industries Ltd. | 5,500 | | 173,139 |
Osem Investment Ltd. | 13,800 | | 266,966 |
Rami Levi Chain Stores Hashikma Marketing 2006 Ltd. | 2,000 | | 94,078 |
TOTAL ISRAEL | | 534,183 |
Kenya - 0.9% |
British American Tobacco Kenya Ltd. | 31,700 | | 238,565 |
Kenya Commercial Bank Ltd. | 756,500 | | 298,375 |
Safaricom Ltd. | 1,516,544 | | 213,252 |
TOTAL KENYA | | 750,192 |
Lithuania - 0.6% |
Apranga AB (a) | 163,766 | | 466,421 |
Common Stocks - continued |
| Shares | | Value |
Luxembourg - 0.5% |
Pegas NONWOVENS SA | 13,700 | | $ 428,155 |
Malta - 0.7% |
Brait SA | 48,000 | | 550,861 |
Netherlands - 0.4% |
AmRest Holdings NV (a) | 6,600 | | 308,536 |
Nigeria - 0.7% |
Zenith Bank PLC | 6,384,656 | | 564,531 |
Pakistan - 0.7% |
Millat Tractors Ltd. | 45,000 | | 248,649 |
United Bank Ltd. | 190,000 | | 295,544 |
TOTAL PAKISTAN | | 544,193 |
Poland - 4.3% |
Bank Handlowy w Warszawie SA | 21,000 | | 427,624 |
Bank Polska Kasa Opieki SA | 19,500 | | 758,181 |
Inter Cars SA | 3,700 | | 226,537 |
Kruk SA | 10,000 | | 476,018 |
NG2 SA | 11,800 | | 516,051 |
Orbis SA | 50,200 | | 766,442 |
Quercus TFI SA | 250,000 | | 423,098 |
TOTAL POLAND | | 3,593,951 |
Qatar - 3.2% |
Al Meera Consumer Goods Co. (a) | 6,496 | | 418,285 |
Qatar Insurance Co. (a) | 22,691 | | 579,703 |
Qatar National Bank SAQ (a) | 32,850 | | 1,646,899 |
TOTAL QATAR | | 2,644,887 |
Romania - 4.4% |
Banca Transilvania SA (a) | 2,204,397 | | 1,385,897 |
BRD-Groupe Societe Generale (a) | 453,129 | | 1,314,834 |
Bursa de Valori Bucuresti | 73,404 | | 553,422 |
Fondul Propietatea SA GDR | 39,000 | | 401,700 |
TOTAL ROMANIA | | 3,655,853 |
Russia - 17.8% |
Gazprom OAO (a) | 1,463,600 | | 3,110,360 |
Lukoil PJSC (a) | 8,100 | | 294,372 |
Lukoil PJSC sponsored ADR | 81,195 | | 2,947,379 |
Magnit OJSC (a) | 8,592 | | 1,498,814 |
Megafon OJSC GDR | 60,800 | | 787,360 |
Moscow Exchange MICEX-RTS OAO (a) | 755,000 | | 1,062,529 |
Common Stocks - continued |
| Shares | | Value |
Russia - continued |
NOVATEK OAO (a) | 130,000 | | $ 1,189,881 |
Sberbank of Russia (a) | 2,760,970 | | 3,914,623 |
TOTAL RUSSIA | | 14,805,318 |
Slovenia - 0.6% |
Krka dd Novo mesto | 6,700 | | 478,898 |
South Africa - 39.5% |
AngloGold Ashanti Ltd. (a) | 106,400 | | 897,795 |
Aspen Pharmacare Holdings Ltd. | 43,300 | | 972,474 |
Cashbuild Ltd. | 18,300 | | 437,037 |
Clicks Group Ltd. | 137,552 | | 1,004,878 |
DRDGOLD Ltd. | 4,469,214 | | 724,152 |
FirstRand Ltd. | 586,600 | | 2,152,859 |
Holdsport Ltd. | 171,700 | | 782,259 |
Hulamin Ltd. | 996,200 | | 480,140 |
Liberty Holdings Ltd. | 51,400 | | 503,415 |
MTN Group Ltd. | 228,850 | | 2,605,369 |
Nampak Ltd. | 467,100 | | 757,067 |
Naspers Ltd. Class N | 45,500 | | 6,664,393 |
Netcare Ltd. | 310,000 | | 882,802 |
Peregrine Holdings Ltd. | 125,000 | | 278,109 |
Pioneer Foods Ltd. | 68,000 | | 975,359 |
PSG Konsult Ltd. | 96,618 | | 56,900 |
Remgro Ltd. | 109,800 | | 2,199,808 |
RMB Holdings Ltd. | 164,600 | | 802,602 |
Sasol Ltd. | 57,500 | | 1,842,397 |
Shoprite Holdings Ltd. | 120,100 | | 1,249,686 |
Spar Group Ltd. | 89,200 | | 1,281,634 |
Spur Corp. Ltd. | 85,000 | | 206,680 |
Standard Bank Group Ltd. | 169,763 | | 1,765,589 |
Steinhoff International Holdings Ltd. | 321,700 | | 1,969,160 |
Taste Holdings Ltd. | 900,000 | | 210,059 |
Truworths International Ltd. | 164,000 | | 1,110,991 |
TOTAL SOUTH AFRICA | | 32,813,614 |
Turkey - 4.3% |
Aselsan A/S | 105,000 | | 502,418 |
Gubre Fabrikalari TAS | 338,000 | | 764,019 |
Koc Holding A/S | 188,850 | | 852,918 |
Soda Sanayii AS | 283,622 | | 468,909 |
Common Stocks - continued |
| Shares | | Value |
Turkey - continued |
Turk Tuborg Bira ve Malt Sanayii A/S (a) | 80,000 | | $ 172,052 |
Turkiye Garanti Bankasi A/S | 321,000 | | 831,207 |
TOTAL TURKEY | | 3,591,523 |
United Arab Emirates - 5.2% |
Agthia Group PJSC | 340,000 | | 708,140 |
Aldar Properties PJSC (a) | 1,109,585 | | 688,770 |
Dubai Islamic Bank Pakistan Ltd. (a) | 425,219 | | 749,024 |
Emaar Malls Group PJSC (a) | 590,000 | | 502,777 |
First Gulf Bank PJSC | 286,313 | | 962,691 |
SHUAA Capital PSC (a) | 5,249,942 | | 721,813 |
TOTAL UNITED ARAB EMIRATES | | 4,333,215 |
United Kingdom - 3.4% |
Abdullah Al Othaim Markets Co. ELS (HSBC Warrant Program) warrants 7/31/17 (a)(b) | 17,836 | | 439,944 |
Al Noor Hospitals Group PLC | 11,100 | | 201,234 |
Alabama Khaleej Training & Education ELS (HSBC Bank Warrant Program) warrants 7/18/16 (a)(b) | 37,010 | | 424,719 |
NMC Health PLC | 23,900 | | 280,753 |
Saudi Dairy & Foodstuff Co. ELS (HSBC Warrant Program) warrants 6/4/18 (b) | 14,000 | | 496,467 |
Savola Group ELS (HSBC Warrant Program) warrants 2/6/17 (b) | 39,200 | | 549,040 |
United International Transportation Co. ELS (HSBC Warrant Program) warrants 7/31/17 (b) | 33,634 | | 439,426 |
TOTAL UNITED KINGDOM | | 2,831,583 |
TOTAL COMMON STOCKS (Cost $77,454,944) |
80,067,410
|
Nonconvertible Preferred Stocks - 3.6% |
| Shares | | Value |
Russia - 3.6% |
Surgutneftegas OJSC (a) | 2,598,600 | | $ 1,771,368 |
Tatneft OAO (a) | 433,800 | | 1,229,284 |
TOTAL NONCONVERTIBLE PREFERRED STOCKS (Cost $2,739,936) |
3,000,652
|
TOTAL INVESTMENT PORTFOLIO - 100.0% (Cost $80,194,880) | | 83,068,062 |
NET OTHER ASSETS (LIABILITIES) - 0.0% | | 7,373 |
NET ASSETS - 100% | $ 83,075,435 |
Security Type Abbreviations |
ELS | - | Equity-Linked Security |
Legend |
(a) Non-income producing |
(b) Security exempt from registration under Rule 144A of the Securities Act of 1933. These securities may be resold in transactions exempt from registration, normally to qualified institutional buyers. At the end of the period, the value of these securities amounted to $2,349,596 or 2.8% of net assets. |
Affiliated Central Funds |
Information regarding fiscal year to date income earned by the Fund from investments in Fidelity Central Funds is as follows: |
Fund | Income earned |
Fidelity Cash Central Fund | $ 1,100 |
Fidelity Securities Lending Cash Central Fund | 999 |
Total | $ 2,099 |
Other Information |
Categorizations in the Schedule of Investments are based on country or territory of incorporation. |
The following is a summary of the inputs used, as of October 31, 2015, involving the Fund's assets and liabilities carried at fair value. The inputs or methodology used for valuing securities may not be an indication of the risk associated with investing in those securities. For more information on valuation inputs, and their aggregation into the levels used in the tables below, please refer to the Investment Valuation section in the accompanying Notes to Financial Statements. |
Valuation Inputs at Reporting Date: |
Description | Total | Level 1 | Level 2 | Level 3 |
Investments in Securities: | | | | |
Equities: | | | | |
Consumer Discretionary | $ 14,947,366 | $ 14,522,647 | $ 424,719 | $ - |
Consumer Staples | 9,909,021 | 9,469,077 | 439,944 | - |
Energy | 12,385,041 | 5,660,916 | 6,724,125 | - |
Financials | 32,565,876 | 26,335,113 | 6,230,763 | - |
Health Care | 2,816,161 | 2,816,161 | - | - |
Industrials | 2,581,205 | 1,728,287 | 852,918 | - |
Materials | 4,257,411 | 2,635,464 | 1,621,947 | - |
Telecommunication Services | 3,605,981 | 1,000,612 | 2,605,369 | - |
Total Investments in Securities: | $ 83,068,062 | $ 64,168,277 | $ 18,899,785 | $ - |
The following is a summary of transfers between Level 1 and Level 2 for the period ended October 31, 2015. Transfers are assumed to have occurred at the beginning of the period, and are primarily attributable to the valuation techniques used for foreign equity securities, as discussed in the accompanying Notes to Financial Statements: |
Transfers | Total |
Level 1 to Level 2 | $ 10,300,566 |
Level 2 to Level 1 | $ 0 |
Valuation Inputs at Reporting Date: |
The following is a reconciliation of Investments in Securities for which Level 3 inputs were used in determining value: |
Investments in Securities: | |
Consumer Discretionary | |
Beginning Balance | $ 1,010,924 |
Net Realized Gain (Loss) on Investment Securities | 3,818 |
Net Unrealized Gain (Loss) on Investment Securities | (167,185) |
Cost of Purchases | - |
Proceeds of Sales | (847,557) |
Amortization/Accretion | - |
Transfers into Level 3 | - |
Transfers out of Level 3 | - |
Ending Balance | $ - |
The change in unrealized gain (loss) for the period attributable to Level 3 securities held at October 31, 2015 | $ - |
The information used in the above reconciliation represents fiscal year to date activity for any Investments in Securities identified as using Level 3 inputs at either the beginning or the end of the current fiscal period. Transfers in or out of Level 3 represent the beginning value of any Security or Instrument where a change in the pricing level occurred from the beginning to the end of the period. The cost of purchases and the proceeds of sales may include securities received or delivered through corporate actions or exchanges. Realized and unrealized gains (losses) disclosed in the reconciliation are included in Net Gain (Loss) on the Fund's Statement of Operations. |
See accompanying notes which are an integral part of the financial statements.
Annual Report
Statement of Assets and Liabilities
| | October 31, 2015 |
| | |
Assets | | |
Investment in securities, at value - See accompanying schedule: Unaffiliated issuers (cost $80,194,880) | | $ 83,068,062 |
Cash | | 33,662 |
Foreign currency held at value (cost $14,630) | | 14,728 |
Receivable for investments sold | | 436,674 |
Receivable for fund shares sold | | 73,284 |
Dividends receivable | | 34,799 |
Distributions receivable from Fidelity Central Funds | | 243 |
Prepaid expenses | | 257 |
Other receivables | | 381 |
Total assets | | 83,662,090 |
| | |
Liabilities | | |
Payable for investments purchased | $ 223,400 | |
Payable for fund shares redeemed | 153,637 | |
Accrued management fee | 56,683 | |
Distribution and service plan fees payable | 5,768 | |
Other affiliated payables | 23,539 | |
Other payables and accrued expenses | 123,628 | |
Total liabilities | | 586,655 |
| | |
Net Assets | | $ 83,075,435 |
Net Assets consist of: | | |
Paid in capital | | $ 96,799,934 |
Undistributed net investment income | | 1,236,658 |
Accumulated undistributed net realized gain (loss) on investments and foreign currency transactions | | (17,821,503) |
Net unrealized appreciation (depreciation) on investments and assets and liabilities in foreign currencies | | 2,860,346 |
Net Assets | | $ 83,075,435 |
See accompanying notes which are an integral part of the financial statements.
Annual Report
Statement of Assets and Liabilities - continued
| | October 31, 2015 |
Calculation of Maximum Offering Price | | |
Class A:
Net Asset Value and redemption price per share ($5,788,153 ÷ 773,249 shares) | | $ 7.49 |
| | |
Maximum offering price per share (100/94.25 of $7.49) | | $ 7.95 |
Class T:
Net Asset Value and redemption price per share ($2,002,928 ÷ 269,128 shares) | | $ 7.44 |
| | |
Maximum offering price per share (100/96.50 of $7.44) | | $ 7.71 |
Class B:
Net Asset Value and offering price per share ($180,830 ÷ 24,112 shares)A | | $ 7.50 |
| | |
Class C:
Net Asset Value and offering price per share ($4,104,439 ÷ 555,749 shares)A | | $ 7.39 |
| | |
Emerging Europe, Middle East, Africa (EMEA):
Net Asset Value, offering price and redemption price per share ($67,521,348 ÷ 8,999,614 shares) | | $ 7.50 |
| | |
Class I:
Net Asset Value, offering price and redemption price per share ($3,477,737 ÷ 463,553 shares) | | $ 7.50 |
A Redemption price per share is equal to net asset value less any applicable contingent deferred sales charge.
See accompanying notes which are an integral part of the financial statements.
Annual Report
Financial Statements - continued
Statement of Operations
| Year ended October 31, 2015 |
| | |
Investment Income | | |
Dividends | | $ 3,458,483 |
Income from Fidelity Central Funds | | 2,099 |
Income before foreign taxes withheld | | 3,460,582 |
Less foreign taxes withheld | | (395,582) |
Total income | | 3,065,000 |
| | |
Expenses | | |
Management fee | $ 788,345 | |
Transfer agent fees | 274,869 | |
Distribution and service plan fees | 85,027 | |
Accounting and security lending fees | 51,130 | |
Custodian fees and expenses | 104,573 | |
Independent trustees' compensation | 432 | |
Registration fees | 73,266 | |
Audit | 64,345 | |
Legal | 280 | |
Miscellaneous | 945 | |
Total expenses before reductions | 1,443,212 | |
Expense reductions | (11,325) | 1,431,887 |
Net investment income (loss) | | 1,633,113 |
Realized and Unrealized Gain (Loss) | | |
Net realized gain (loss) on: | | |
Investment securities: | | |
Unaffiliated issuers (net of foreign taxes of $141,196) | (10,743,685) | |
Foreign currency transactions | (36,996) | |
Total net realized gain (loss) | | (10,780,681) |
Change in net unrealized appreciation (depreciation) on: Investment securities (net of decrease in deferred foreign taxes of $49,419) | (7,779,317) | |
Assets and liabilities in foreign currencies | 361 | |
Total change in net unrealized appreciation (depreciation) | | (7,778,956) |
Net gain (loss) | | (18,559,637) |
Net increase (decrease) in net assets resulting from operations | | $ (16,926,524) |
See accompanying notes which are an integral part of the financial statements.
Annual Report
Statement of Changes in Net Assets
| Year ended
October 31,
2015 | Year ended
October 31,
2014 |
Increase (Decrease) in Net Assets | | |
Operations | | |
Net investment income (loss) | $ 1,633,113 | $ 2,097,602 |
Net realized gain (loss) | (10,780,681) | (4,234,408) |
Change in net unrealized appreciation (depreciation) | (7,778,956) | (2,810,920) |
Net increase (decrease) in net assets resulting from operations | (16,926,524) | (4,947,726) |
Distributions to shareholders from net investment income | (2,091,570) | (1,921,556) |
Distributions to shareholders from net realized gain | (504,771) | - |
Total distributions | (2,596,341) | (1,921,556) |
Share transactions - net increase (decrease) | (17,106,646) | (15,497,892) |
Redemption fees | 15,219 | 42,040 |
Total increase (decrease) in net assets | (36,614,292) | (22,325,134) |
| | |
Net Assets | | |
Beginning of period | 119,689,727 | 142,014,861 |
End of period (including undistributed net investment income of $1,236,658 and undistributed net investment income of $1,899,047, respectively) | $ 83,075,435 | $ 119,689,727 |
See accompanying notes which are an integral part of the financial statements.
Annual Report
Financial Highlights - Fidelity Emerging Europe, Middle East, Africa (EMEA) Fund Class A
Years ended October 31, | 2015 | 2014 | 2013 | 2012 | 2011 |
Selected Per-Share Data | | | | | |
Net asset value, beginning of period | $ 9.04 | $ 9.49 | $ 8.71 | $ 8.34 | $ 8.97 |
Income from Investment Operations | | | | | |
Net investment income (loss) C | .12 | .13 | .16 | .18 | .16F |
Net realized and unrealized gain (loss) | (1.50) | (.46) | .85 | .34 | (.70) |
Total from investment operations | (1.38) | (.33) | 1.01 | .52 | (.54) |
Distributions from net investment income | (.14) | (.12) | (.15) | (.15) | (.08) |
Distributions from net realized gain | (.04) | - | (.07) | - | (.02) |
Total distributions | (.17) J | (.12) | (.23) I | (.15) | (.10) |
Redemption fees added to paid in capitalC | -H | -H | -H | -H | .01 |
Net asset value, end of period | $ 7.49 | $ 9.04 | $ 9.49 | $ 8.71 | $ 8.34 |
Total ReturnA, B | (15.42)% | (3.48)% | 11.75% | 6.38% | (6.05)% |
Ratios to Average Net AssetsD, G | | | | | |
Expenses before reductions | 1.61% | 1.60% | 1.64% | 1.62% | 1.60% |
Expenses net of fee waivers, if any | 1.61% | 1.60% | 1.63% | 1.62% | 1.56% |
Expenses net of all reductions | 1.60% | 1.60% | 1.62% | 1.60% | 1.51% |
Net investment income (loss) | 1.51% | 1.45% | 1.82% | 2.09% | 1.70%F |
Supplemental Data | | | | | |
Net assets, end of period (000 omitted) | $ 5,788 | $ 7,889 | $ 10,883 | $ 8,934 | $ 10,260 |
Portfolio turnover rateE | 50% | 38% | 64% | 30% | 53% |
A Total returns would have been lower if certain expenses had not been reduced during the applicable periods shown.
B Total returns do not include the effect of the sales charges.
C Calculated based on average shares outstanding during the period.
D Fees and expenses of any underlying Fidelity Central Funds are not included in the Fund's expense ratio. The Fund indirectly bears its proportionate share of the expenses of any underlying Fidelity Central Funds.
E Amount does not include the portfolio activity of any underlying Fidelity Central Funds.
F Investment income per share reflects a large, non-recurring dividend which amounted to $.04 per share. Excluding this non-recurring dividend, the ratio of net investment income (loss) to average net assets would have been 1.25%.
G Expense ratios reflect operating expenses of the class. Expenses before reductions do not reflect amounts reimbursed by the investment adviser or reductions from brokerage service arrangements or reductions from other expense offset arrangements and do not represent the amount paid by the class during periods when reimbursements or reductions occur. Expenses net of fee waivers reflect expenses after reimbursement by the investment adviser but prior to reductions from brokerage service arrangements or other expense offset arrangements. Expenses net of all reductions represent the net expenses paid by the class.
H Amount represents less than $.005 per share.
I Total distributions of $.23 per share is comprised of distributions from net investment income of $.151 and distributions from net realized gain of $.074 per share.
J Total distributions of $.17 per share is comprised of distributions from net investment income of $.135 and distributions from net realized gain of $.039 per share.
See accompanying notes which are an integral part of the financial statements.
Annual Report
Financial Highlights - Fidelity Emerging Europe, Middle East, Africa (EMEA) Fund Class T
Years ended October 31, | 2015 | 2014 | 2013 | 2012 | 2011 |
Selected Per-Share Data | | | | | |
Net asset value, beginning of period | $ 9.01 | $ 9.46 | $ 8.68 | $ 8.31 | $ 8.96 |
Income from Investment Operations | | | | | |
Net investment income (loss) C | .10 | .11 | .14 | .15 | .13F |
Net realized and unrealized gain (loss) | (1.51) | (.46) | .84 | .35 | (.71) |
Total from investment operations | (1.41) | (.35) | .98 | .50 | (.58) |
Distributions from net investment income | (.13) | (.10) | (.12) | (.13) | (.07) |
Distributions from net realized gain | (.04) | - | (.07) | - | (.02) |
Total distributions | (.16) K | (.10) | (.20) J | (.13) | (.08) I |
Redemption fees added to paid in capitalC | -H | -H | -H | -H | .01 |
Net asset value, end of period | $ 7.44 | $ 9.01 | $ 9.46 | $ 8.68 | $ 8.31 |
Total ReturnA, B | (15.80)% | (3.67)% | 11.42% | 6.14% | (6.42)% |
Ratios to Average Net AssetsD, G | | | | | |
Expenses before reductions | 1.92% | 1.92% | 1.93% | 1.89% | 1.87% |
Expenses net of fee waivers, if any | 1.90% | 1.90% | 1.90% | 1.89% | 1.84% |
Expenses net of all reductions | 1.89% | 1.90% | 1.88% | 1.86% | 1.78% |
Net investment income (loss) | 1.22% | 1.15% | 1.55% | 1.82% | 1.42%F |
Supplemental Data | | | | | |
Net assets, end of period (000 omitted) | $ 2,003 | $ 2,465 | $ 3,465 | $ 3,336 | $ 3,502 |
Portfolio turnover rateE | 50% | 38% | 64% | 30% | 53% |
A Total returns would have been lower if certain expenses had not been reduced during the applicable periods shown.
B Total returns do not include the effect of the sales charges.
C Calculated based on average shares outstanding during the period.
D Fees and expenses of any underlying Fidelity Central Funds are not included in the Fund's expense ratio. The Fund indirectly bears its proportionate share of the expenses of any underlying Fidelity Central Funds.
E Amount does not include the portfolio activity of any underlying Fidelity Central Funds.
F Investment income per share reflects a large, non-recurring dividend which amounted to $.04 per share. Excluding this non-recurring dividend, the ratio of net investment income (loss) to average net assets would have been .98%.
G Expense ratios reflect operating expenses of the class. Expenses before reductions do not reflect amounts reimbursed by the investment adviser or reductions from brokerage service arrangements or reductions from other expense offset arrangements and do not represent the amount paid by the class during periods when reimbursements or reductions occur. Expenses net of fee waivers reflect expenses after reimbursement by the investment adviser but prior to reductions from brokerage service arrangements or other expense offset arrangements. Expenses net of all reductions represent the net expenses paid by the class.
H Amount represents less than $.005 per share.
I Total distributions of $.08 per share is comprised of distributions from net investment income of $.068 and distributions from net realized gain of $.015 per share.
J Total distributions of $.20 per share is comprised of distributions from net investment income of $.122 and distributions from net realized gain of $.074 per share.
K Total distributions of $.16 per share is comprised of distributions from net investment income of $.125 and distributions from net realized gain of $.039 per share.
See accompanying notes which are an integral part of the financial statements.
Annual Report
Financial Highlights - Fidelity Emerging Europe, Middle East, Africa (EMEA) Fund Class B
Years ended October 31, | 2015 | 2014 | 2013 | 2012 | 2011 |
Selected Per-Share Data | | | | | |
Net asset value, beginning of period | $ 9.05 | $ 9.50 | $ 8.69 | $ 8.29 | $ 8.93 |
Income from Investment Operations | | | | | |
Net investment income (loss) C | .06 | .06 | .09 | .11 | .09F |
Net realized and unrealized gain (loss) | (1.51) | (.46) | .85 | .35 | (.71) |
Total from investment operations | (1.45) | (.40) | .94 | .46 | (.62) |
Distributions from net investment income | (.06) | (.05) | (.06) | (.06) | (.02) |
Distributions from net realized gain | (.04) | - | (.07) | - | (.01) |
Total distributions | (.10) | (.05) | (.13) | (.06) | (.03) |
Redemption fees added to paid in capitalC | -H | -H | -H | -H | .01 |
Net asset value, end of period | $ 7.50 | $ 9.05 | $ 9.50 | $ 8.69 | $ 8.29 |
Total ReturnA, B | (16.16)% | (4.23)% | 10.94% | 5.56% | (6.85)% |
Ratios to Average Net AssetsD, G | | | | | |
Expenses before reductions | 2.41% | 2.40% | 2.42% | 2.38% | 2.37% |
Expenses net of fee waivers, if any | 2.40% | 2.40% | 2.40% | 2.38% | 2.33% |
Expenses net of all reductions | 2.39% | 2.40% | 2.38% | 2.35% | 2.27% |
Net investment income (loss) | .72% | .65% | 1.05% | 1.33% | .93%F |
Supplemental Data | | | | | |
Net assets, end of period (000 omitted) | $ 181 | $ 294 | $ 388 | $ 441 | $ 539 |
Portfolio turnover rateE | 50% | 38% | 64% | 30% | 53% |
A Total returns would have been lower if certain expenses had not been reduced during the applicable periods shown.
B Total returns do not include the effect of the contingent deferred sales charge.
C Calculated based on average shares outstanding during the period.
D Fees and expenses of any underlying Fidelity Central Funds are not included in the Fund's expense ratio. The Fund indirectly bears its proportionate share of the expenses of any underlying Fidelity Central Funds.
E Amount does not include the portfolio activity of any underlying Fidelity Central Funds.
F Investment income per share reflects a large, non-recurring dividend which amounted to $.04 per share. Excluding this non-recurring dividend, the ratio of net investment income (loss) to average net assets would have been .49%.
G Expense ratios reflect operating expenses of the class. Expenses before reductions do not reflect amounts reimbursed by the investment adviser or reductions from brokerage service arrangements or reductions from other expense offset arrangements and do not represent the amount paid by the class during periods when reimbursements or reductions occur. Expenses net of fee waivers reflect expenses after reimbursement by the investment adviser but prior to reductions from brokerage service arrangements or other expense offset arrangements. Expenses net of all reductions represent the net expenses paid by the class.
H Amount represents less than $.005 per share.
See accompanying notes which are an integral part of the financial statements.
Annual Report
Financial Highlights - Fidelity Emerging Europe, Middle East, Africa (EMEA) Fund Class C
Years ended October 31, | 2015 | 2014 | 2013 | 2012 | 2011 |
Selected Per-Share Data | | | | | |
Net asset value, beginning of period | $ 8.93 | $ 9.39 | $ 8.62 | $ 8.24 | $ 8.90 |
Income from Investment Operations | | | | | |
Net investment income (loss) C | .06 | .06 | .09 | .11 | .08F |
Net realized and unrealized gain (loss) | (1.48) | (.46) | .83 | .35 | (.69) |
Total from investment operations | (1.42) | (.40) | .92 | .46 | (.61) |
Distributions from net investment income | (.08) | (.06) | (.08) | (.08) | (.05) |
Distributions from net realized gain | (.04) | - | (.07) | - | (.02) |
Total distributions | (.12) | (.06) | (.15) | (.08) | (.06) I |
Redemption fees added to paid in capitalC | -H | -H | -H | -H | .01 |
Net asset value, end of period | $ 7.39 | $ 8.93 | $ 9.39 | $ 8.62 | $ 8.24 |
Total ReturnA, B | (16.08)% | (4.24)% | 10.83% | 5.68% | (6.79)% |
Ratios to Average Net AssetsD, G | | | | | |
Expenses before reductions | 2.41% | 2.40% | 2.42% | 2.37% | 2.36% |
Expenses net of fee waivers, if any | 2.40% | 2.40% | 2.40% | 2.37% | 2.33% |
Expenses net of all reductions | 2.39% | 2.40% | 2.38% | 2.35% | 2.27% |
Net investment income (loss) | .72% | .65% | 1.05% | 1.34% | .93%F |
Supplemental Data | | | | | |
Net assets, end of period (000 omitted) | $ 4,104 | $ 6,662 | $ 6,782 | $ 7,770 | $ 6,650 |
Portfolio turnover rateE | 50% | 38% | 64% | 30% | 53% |
A Total returns would have been lower if certain expenses had not been reduced during the applicable periods shown.
B Total returns do not include the effect of the contingent deferred sales charge.
C Calculated based on average shares outstanding during the period.
D Fees and expenses of any underlying Fidelity Central Funds are not included in the Fund's expense ratio. The Fund indirectly bears its proportionate share of the expenses of any underlying Fidelity Central Funds.
E Amount does not include the portfolio activity of any underlying Fidelity Central Funds.
F Investment income per share reflects a large, non-recurring dividend which amounted to $.04 per share. Excluding this non-recurring dividend, the ratio of net investment income (loss) to average net assets would have been .49%.
G Expense ratios reflect operating expenses of the class. Expenses before reductions do not reflect amounts reimbursed by the investment adviser or reductions from brokerage service arrangements or reductions from other expense offset arrangements and do not represent the amount paid by the class during periods when reimbursements or reductions occur. Expenses net of fee waivers reflect expenses after reimbursement by the investment adviser but prior to reductions from brokerage service arrangements or other expense offset arrangements. Expenses net of all reductions represent the net expenses paid by the class.
H Amount represents less than $.005 per share.
I Total distributions of $.06 per share is comprised of distributions from net investment income of $.047 and distributions from net realized gain of $.015 per share.
See accompanying notes which are an integral part of the financial statements.
Annual Report
Financial Highlights - Fidelity Emerging Europe, Middle East, Africa (EMEA) Fund
Years ended October 31, | 2015 | 2014 | 2013 | 2012 | 2011 |
Selected Per-Share Data | | | | | |
Net asset value, beginning of period | $ 9.08 | $ 9.52 | $ 8.75 | $ 8.37 | $ 9.00 |
Income from Investment Operations | | | | | |
Net investment income (loss) B | .14 | .16 | .18 | .20 | .18E |
Net realized and unrealized gain (loss) | (1.51) | (.47) | .84 | .35 | (.71) |
Total from investment operations | (1.37) | (.31) | 1.02 | .55 | (.53) |
Distributions from net investment income | (.17) | (.13) | (.18) | (.17) | (.09) |
Distributions from net realized gain | (.04) | - | (.07) | - | (.02) |
Total distributions | (.21) | (.13) | (.25) | (.17) | (.11) |
Redemption fees added to paid in capitalB | -G | -G | -G | �� -G | .01 |
Net asset value, end of period | $ 7.50 | $ 9.08 | $ 9.52 | $ 8.75 | $ 8.37 |
Total ReturnA | (15.33)% | (3.21)% | 11.90% | 6.81% | (5.91)% |
Ratios to Average Net AssetsC, F | | | | | |
Expenses before reductions | 1.39% | 1.37% | 1.40% | 1.37% | 1.35% |
Expenses net of fee waivers, if any | 1.38% | 1.37% | 1.40% | 1.37% | 1.31% |
Expenses net of all reductions | 1.38% | 1.37% | 1.38% | 1.34% | 1.25% |
Net investment income (loss) | 1.74% | 1.68% | 2.05% | 2.34% | 1.95%E |
Supplemental Data | | | | | |
Net assets, end of period (000 omitted) | $ 67,521 | $ 96,784 | $ 110,265 | $ 111,441 | $ 114,117 |
Portfolio turnover rateD | 50% | 38% | 64% | 30% | 53% |
A Total returns would have been lower if certain expenses had not been reduced during the applicable periods shown.
B Calculated based on average shares outstanding during the period.
C Fees and expenses of any underlying Fidelity Central Funds are not included in the Fund's expense ratio. The Fund indirectly bears its proportionate share of the expenses of any underlying Fidelity Central Funds.
D Amount does not include the portfolio activity of any underlying Fidelity Central Funds.
E Investment income per share reflects a large, non-recurring dividend which amounted to $.04 per share. Excluding this non-recurring dividend, the ratio of net investment income (loss) to average net assets would have been 1.51%.
F Expense ratios reflect operating expenses of the class. Expenses before reductions do not reflect amounts reimbursed by the investment adviser or reductions from brokerage service arrangements or reductions from other expense offset arrangements and do not represent the amount paid by the class during periods when reimbursements or reductions occur. Expenses net of fee waivers reflect expenses after reimbursement by the investment adviser but prior to reductions from brokerage service arrangements or other expense offset arrangements. Expenses net of all reductions represent the net expenses paid by the class.
G Amount represents less than $.005 per share.
See accompanying notes which are an integral part of the financial statements.
Annual Report
Financial Highlights - Fidelity Emerging Europe, Middle East, Africa (EMEA) Fund Class I
Years ended October 31, | 2015 | 2014 | 2013 | 2012 | 2011 |
Selected Per-Share Data | | | | | |
Net asset value, beginning of period | $ 9.08 | $ 9.52 | $ 8.75 | $ 8.37 | $ 9.00 |
Income from Investment Operations | | | | | |
Net investment income (loss) B | .15 | .16 | .19 | .21 | .19E |
Net realized and unrealized gain (loss) | (1.51) | (.46) | .84 | .35 | (.72) |
Total from investment operations | (1.36) | (.30) | 1.03 | .56 | (.53) |
Distributions from net investment income | (.18) | (.14) | (.19) | (.18) | (.09) |
Distributions from net realized gain | (.04) | - | (.07) | - | (.02) |
Total distributions | (.22) | (.14) | (.26) | (.18) | (.11) |
Redemption fees added to paid in capitalB | -G | -G | -G | -G | .01 |
Net asset value, end of period | $ 7.50 | $ 9.08 | $ 9.52 | $ 8.75 | $ 8.37 |
Total ReturnA | (15.23)% | (3.09)% | 12.05% | 6.93% | (5.91)% |
Ratios to Average Net AssetsC, F | | | | | |
Expenses before reductions | 1.25% | 1.26% | 1.30% | 1.28% | 1.26% |
Expenses net of fee waivers, if any | 1.25% | 1.26% | 1.30% | 1.28% | 1.24% |
Expenses net of all reductions | 1.24% | 1.26% | 1.28% | 1.25% | 1.19% |
Net investment income (loss) | 1.88% | 1.79% | 2.15% | 2.43% | 2.02%E |
Supplemental Data | | | | | |
Net assets, end of period (000 omitted) | $ 3,478 | $ 5,596 | $ 10,231 | $ 8,586 | $ 7,633 |
Portfolio turnover rateD | 50% | 38% | 64% | 30% | 53% |
A Total returns would have been lower if certain expenses had not been reduced during the applicable periods shown.
B Calculated based on average shares outstanding during the period.
C Fees and expenses of any underlying Fidelity Central Funds are not included in the Fund's expense ratio. The Fund indirectly bears its proportionate share of the expenses of any underlying Fidelity Central Funds.
D Amount does not include the portfolio activity of any underlying Fidelity Central Funds.
E Investment income per share reflects a large, non-recurring dividend which amounted to $.04 per share. Excluding this non-recurring dividend, the ratio of net investment income (loss) to average net assets would have been 1.58%.
F Expense ratios reflect operating expenses of the class. Expenses before reductions do not reflect amounts reimbursed by the investment adviser or reductions from brokerage service arrangements or reductions from other expense offset arrangements and do not represent the amount paid by the class during periods when reimbursements or reductions occur. Expenses net of fee waivers reflect expenses after reimbursement by the investment adviser but prior to reductions from brokerage service arrangements or other expense offset arrangements. Expenses net of all reductions represent the net expenses paid by the class.
G Amount represents less than $.005 per share.
See accompanying notes which are an integral part of the financial statements.
Annual Report
For the period ended October 31, 2015
1. Organization.
Fidelity Emerging Europe, Middle East, Africa (EMEA) Fund (the Fund) is a non-diversified fund of Fidelity Investment Trust (the Trust) and is authorized to issue an unlimited number of shares. The Trust is registered under the Investment Company Act of 1940, as amended (the 1940 Act), as an open-end management investment company organized as a Massachusetts business trust. The Fund offers Class A, Class T, Class C, Emerging Europe, Middle East, Africa (EMEA) and Class I (formerly Institutional Class) shares, each of which, along with Class B shares, has equal rights as to assets and voting privileges. Class B shares are closed to new accounts and additional purchases, except for exchanges and reinvestments. Each class has exclusive voting rights with respect to matters that affect that class. Class B shares will automatically convert to Class A shares after a holding period of seven years from the initial date of purchase. The Fund's investments in emerging markets can be subject to social, economic, regulatory, and political uncertainties and can be extremely volatile.
2. Investments in Fidelity Central Funds.
The Fund invests in Fidelity Central Funds, which are open-end investment companies generally available only to other investment companies and accounts managed by the investment adviser and its affiliates. The Fund's Schedule of Investments lists each of the Fidelity Central Funds held as of period end, if any, as an investment of the Fund, but does not include the underlying holdings of each Fidelity Central Fund. As an Investing Fund, the Fund indirectly bears its proportionate share of the expenses of the underlying Fidelity Central Funds.
The Money Market Central Funds seek preservation of capital and current income and are managed by Fidelity Investments Money Management, Inc. (FIMM), an affiliate of the investment adviser. Annualized expenses of the Money Market Central Funds as of their most recent shareholder report date are less than .005%.
A complete unaudited list of holdings for each Fidelity Central Fund is available upon request or at the Securities and Exchange Commission (the SEC) website at www.sec.gov. In addition, the financial statements of the Fidelity Central Funds, which are not covered by the Fund's Report of Independent Registered Public Accounting Firm, are available on the SEC website or upon request.
3. Significant Accounting Policies.
The financial statements have been prepared in conformity with accounting principles generally accepted in the United States of America (GAAP), which require management to make certain estimates and assumptions at the date of the financial statements. Actual results could differ from those estimates. Subsequent events, if any, through the date that the financial statements were issued have been evaluated in the preparation of
Annual Report
Notes to Financial Statements - continued
3. Significant Accounting Policies - continued
the financial statements. The following summarizes the significant accounting policies of the Fund:
Investment Valuation. Investments are valued as of 4:00 p.m. Eastern time on the last calendar day of the period. The Board of Trustees (the Board) has delegated the day to day responsibility for the valuation of the Fund's investments to the Fidelity Management & Research Company (FMR) Fair Value Committee (the Committee). In accordance with valuation policies and procedures approved by the Board, the Fund attempts to obtain prices from one or more third party pricing vendors or brokers to value its investments. When current market prices, quotations or currency exchange rates are not readily available or reliable, investments will be fair valued in good faith by the Committee, in accordance with procedures adopted by the Board. Factors used in determining fair value vary by investment type and may include market or investment specific events. The frequency with which these procedures are used cannot be predicted and they may be utilized to a significant extent. The Committee oversees the Fund's valuation policies and procedures and reports to the Board on the Committee's activities and fair value determinations. The Board monitors the appropriateness of the procedures used in valuing the Fund's investments and ratifies the fair value determinations of the Committee.
The Fund categorizes the inputs to valuation techniques used to value its investments into a disclosure hierarchy consisting of three levels as shown below:
Level 1 - quoted prices in active markets for identical investments
Level 2 - other significant observable inputs (including quoted prices for similar investments, interest rates, prepayment speeds, etc.)
Level 3 - unobservable inputs (including the Fund's own assumptions based on the best information available)
Valuation techniques used to value the Fund's investments by major category are as follows:
Equity securities, including restricted securities, for which market quotations are readily available, are valued at the last reported sale price or official closing price as reported by a third party pricing vendor on the primary market or exchange on which they are traded and are categorized as Level 1 in the hierarchy. In the event there were no sales during the day or closing prices are not available, securities are valued at the last quoted bid price or may be valued using the last available price and are generally categorized as Level 2 in the hierarchy. For foreign equity securities, when market or security specific events arise, comparisons to the valuation of American Depositary Receipts (ADRs),
Annual Report
3. Significant Accounting Policies - continued
Investment Valuation - continued
futures contracts, Exchange-Traded Funds (ETFs) and certain indexes as well as quoted prices for similar securities may be used and would be categorized as Level 2 in the hierarchy. Utilizing these techniques may result in transfers between Level 1 and Level 2. For equity securities, including restricted securities, where observable inputs are limited, assumptions about market activity and risk are used and these securities may be categorized as Level 3 in the hierarchy.
Investments in open-end mutual funds, including the Fidelity Central Funds, are valued at their closing net asset value (NAV) each business day and are categorized as Level 1 in the hierarchy.
Changes in valuation techniques may result in transfers in or out of an assigned level within the disclosure hierarchy. The aggregate value of investments by input level as of October 31, 2015, including information on transfers between Levels 1 and 2, as well as roll forward of Level 3 investments, is included at the end of the Fund's Schedule of Investments.
Foreign Currency. The Fund may use foreign currency contracts to facilitate transactions in foreign-denominated securities. Gains and losses from these transactions may arise from changes in the value of the foreign currency or if the counterparties do not perform under the contracts' terms.
Foreign-denominated assets, including investment securities, and liabilities are translated into U.S. dollars at the exchange rates at period end. Purchases and sales of investment securities, income and dividends received and expenses denominated in foreign currencies are translated into U.S. dollars at the exchange rate in effect on the transaction date.
The effects of exchange rate fluctuations on investments are included with the net realized and unrealized gain (loss) on investment securities. Other foreign currency transactions resulting in realized and unrealized gain (loss) are disclosed separately.
Investment Transactions and Income. For financial reporting purposes, the Fund's investment holdings and NAV include trades executed through the end of the last business day of the period. The NAV per share for processing shareholder transactions is calculated as of the close of business of the New York Stock Exchange (NYSE), normally 4:00 p.m. Eastern time and includes trades executed through the end of the prior business day. Gains and losses on securities sold are determined on the basis of identified cost. Dividend income is recorded on the ex-dividend date, except for certain dividends from foreign securities where the ex-dividend date may have passed, which are recorded as soon as the Fund is informed of the ex-dividend date. Non-cash dividends included in
Annual Report
Notes to Financial Statements - continued
3. Significant Accounting Policies - continued
Investment Transactions and Income - continued
dividend income, if any, are recorded at the fair market value of the securities received. Income and capital gain distributions from Fidelity Central Funds, if any, are recorded on the ex-dividend date. Investment income is recorded net of foreign taxes withheld where recovery of such taxes is uncertain.
Class Allocations and Expenses. Investment income, realized and unrealized capital gains and losses, common expenses of the Fund, and certain fund-level expense reductions, if any, are allocated daily on a pro-rata basis to each class based on the relative net assets of each class to the total net assets of the Fund. Each class differs with respect to transfer agent and distribution and service plan fees incurred. Certain expense reductions may also differ by class. For the reporting period, the allocated portion of income and expenses to each class as a percent of its average net assets may vary due to the timing of recording these transactions in relation to fluctuating net assets of the classes. Expenses directly attributable to a fund are charged to that fund. Expenses attributable to more than one fund are allocated among the respective funds on the basis of relative net assets or other appropriate methods. Expense estimates are accrued in the period to which they relate and adjustments are made when actual amounts are known.
Income Tax Information and Distributions to Shareholders. Each year, the Fund intends to qualify as a regulated investment company under Subchapter M of the Internal Revenue Code, including distributing substantially all of its taxable income and realized gains. As a result, no provision for U.S. Federal income taxes is required. As of October 31, 2015, the Fund did not have any unrecognized tax benefits in the financial statements; nor is the Fund aware of any tax positions for which it is reasonably possible that the total amounts of unrecognized tax benefits will significantly change in the next twelve months. The Fund files a U.S. federal tax return, in addition to state and local tax returns as required. The Fund's federal income tax returns are subject to examination by the Internal Revenue Service (IRS) for a period of three fiscal years after they are filed. State and local tax returns may be subject to examination for an additional fiscal year depending on the jurisdiction. Foreign taxes are provided for based on the Fund's understanding of the tax rules and rates that exist in the foreign markets in which it invests. The Fund is subject to a tax imposed on capital gains by certain countries in which it invests. An estimated deferred tax liability for net unrealized appreciation on the applicable securities is included in Other payables and accrued expenses on the Statement of Assets & Liabilities.
Annual Report
3. Significant Accounting Policies - continued
Income Tax Information and Distributions to Shareholders - continued
Distributions are declared and recorded on the ex-dividend date. Income dividends and capital gain distributions are declared separately for each class. Income and capital gain distributions are determined in accordance with income tax regulations, which may differ from GAAP. In addition, the Fund claimed a portion of the payment made to redeeming shareholders as a distribution for income tax purposes.
Capital accounts within the financial statements are adjusted for permanent book-tax differences. These adjustments have no impact on net assets or the results of operations. Capital accounts are not adjusted for temporary book-tax differences which will reverse in a subsequent period.
Book-tax differences are primarily due to foreign currency transactions, certain foreign taxes, passive foreign investment companies (PFIC), capital loss carryforwards and losses deferred due to wash sales.
The federal tax cost of investment securities and unrealized appreciation (depreciation) as of period end were as follows:
Gross unrealized appreciation | $ 12,373,817 |
Gross unrealized depreciation | (10,435,038) |
Net unrealized appreciation (depreciation) on securities | $ 1,938,779 |
Tax Cost | $ 81,129,283 |
The tax-based components of distributable earnings as of period end were as follows:
Undistributed ordinary income | $ 1,238,276 |
Capital loss carryforward | $ (16,887,100) |
Net unrealized appreciation (depreciation) on securities and other investments | $ 1,937,274 |
Capital loss carryforwards are only available to offset future capital gains of the Fund to the extent provided by regulations and may be limited. Under the Regulated Investment Company Modernization Act of 2010 (the Act), the Fund is permitted to carry forward capital losses incurred in taxable years beginning after December 22, 2010 for an unlimited period and such capital losses are required to be used prior to any losses that expire.
Annual Report
Notes to Financial Statements - continued
3. Significant Accounting Policies - continued
Income Tax Information and Distributions to Shareholders - continued
The capital loss carryforward information presented below, including any applicable limitation, is estimated as of fiscal period end and is subject to adjustment.
Fiscal year of expiration | |
2018 | $ (1,624,705) |
No expiration | |
Short-term | (3,290,678) |
Long-term | (11,971,717) |
Total no expiration | (15,262,395) |
Total capital loss carryforward | $ (16,887,100) |
The tax character of distributions paid was as follows:
| October 31, 2015 | October 31, 2014 |
Ordinary Income | $ 2,596,341 | $ 1,921,556 |
Short-Term Trading (Redemption) Fees. Shares held by investors in the Fund less than 90 days may have been subject to a redemption fee equal to 1.50% of the NAV of shares redeemed. All redemption fees, which reduce the proceeds of the shareholder redemption, are retained by the Fund and accounted for as an addition to paid in capital.
Restricted Securities. The Fund may invest in securities that are subject to legal or contractual restrictions on resale. These securities generally may be resold in transactions exempt from registration or to the public if the securities are registered. Disposal of these securities may involve time-consuming negotiations and expense, and prompt sale at an acceptable price may be difficult. Information regarding restricted securities is included at the end of the Fund's Schedule of Investments.
4. Purchases and Sales of Investments.
Purchases and sales of securities, other than short-term securities, aggregated $49,108,378 and $66,560,422, respectively.
5. Fees and Other Transactions with Affiliates.
Management Fee. Fidelity Management & Research Company (the investment adviser) and its affiliates provide the Fund with investment management related services for which the Fund pays a monthly management fee. The management fee is the sum of an individual fund fee rate that is based on an annual rate of .55% of the Fund's average net assets and an annualized group fee rate that averaged .25% during the period. The group fee rate is based upon the average net assets of all the mutual funds
Annual Report
5. Fees and Other Transactions with Affiliates - continued
Management Fee - continued
advised by the investment adviser, including any mutual funds previously advised by the investment adviser that are currently advised by Fidelity SelectCo, LLC, an affiliate of the investment adviser. The group fee rate decreases as assets under management increase and increases as assets under management decrease. For the reporting period, the total annual management fee rate was .80% of the Fund's average net assets.
Distribution and Service Plan Fees. In accordance with Rule 12b-1 of the 1940 Act, the Fund has adopted separate Distribution and Service Plans for each class of shares. Certain classes pay Fidelity Distributors Corporation (FDC), an affiliate of the investment adviser, separate Distribution and Service Fees, each of which is based on an annual percentage of each class' average net assets. In addition, FDC may pay financial intermediaries for selling shares of the Fund and providing shareholder support services. For the period, the Distribution and Service Fee rates, total fees and amounts retained by FDC were as follows:
| Distribution
Fee | Service
Fee | Total Fees | Retained
by FDC |
Class A | -% | .25% | $ 16,778 | $ 327 |
Class T | .25% | .25% | 11,598 | 13 |
Class B | .75% | .25% | 2,284 | 1,713 |
Class C | .75% | .25% | 54,367 | 9,171 |
| | | $ 85,027 | $ 11,224 |
Sales Load. FDC may receive a front-end sales charge of up to 5.75% for selling Class A shares and 3.50% for selling Class T shares, some of which is paid to financial intermediaries for selling shares of the Fund. Depending on the holding period, FDC may receive contingent deferred sales charges levied on Class A, Class T, Class B, and Class C redemptions. The deferred sales charges range from 5.00% to 1.00% for Class B shares, 1.00% for Class C shares, 1.00% for certain purchases of Class A shares and .25% for certain purchases of Class T shares.
For the period, sales charge amounts retained by FDC were as follows:
| Retained
by FDC |
Class A | $ 2,682 |
Class T | 1,164 |
Class BA | 50 |
Class CA | 1,357 |
| $ 5,253 |
A When Class B and Class C shares are initially sold, FDC pays commissions from its own resources to financial intermediaries through which the sales are made.
Annual Report
Notes to Financial Statements - continued
5. Fees and Other Transactions with Affiliates - continued
Transfer Agent Fees. Fidelity Investments Institutional Operations Company, Inc., (FIIOC), an affiliate of the investment adviser, is the transfer, dividend disbursing and shareholder servicing agent for each class of the Fund. FIIOC receives account fees and asset-based fees that vary according to the account size and type of account of the shareholders of the respective classes of the Fund. FIIOC pays for typesetting, printing and mailing of shareholder reports, except proxy statements.
For the period, transfer agent fees for each class were as follows:
| Amount | % of
Class-Level Average
Net Assets |
Class A | $ 17,582 | .26 |
Class T | 7,386 | .32 |
Class B | 680 | .30 |
Class C | 16,171 | .30 |
Emerging Europe, Middle East, Africa (EMEA) | 226,627 | .29 |
Class I | 6,423 | .15 |
| $ 274,869 | |
Accounting and Security Lending Fees. Fidelity Service Company, Inc. (FSC), an affiliate of the investment adviser, maintains the Fund's accounting records. The accounting fee is based on the level of average net assets for each month. Under a separate contract, FSC administers the security lending program. The security lending fee is based on the number and duration of lending transactions.
6. Committed Line of Credit.
The Fund participates with other funds managed by the investment adviser or an affiliate in a $4.25 billion credit facility (the "line of credit") to be utilized for temporary or emergency purposes to fund shareholder redemptions or for other short-term liquidity purposes. The Fund has agreed to pay commitment fees on its pro-rata portion of the line of credit, which amounted to $147 and is reflected in Miscellaneous expenses on the Statement of Operations. During the period, the Fund did not borrow on this line of credit.
7. Security Lending.
The Fund lends portfolio securities through a lending agent from time to time in order to earn additional income. For equity securities, a lending agent is used and may loan securities to certain qualified borrowers, including Fidelity Capital Markets (FCM), a broker-dealer affiliated with the Fund. On the settlement date of the loan, the Fund
Annual Report
7. Security Lending - continued
receives collateral (in the form of U.S. Treasury obligations, letters of credit and/or cash) against the loaned securities and maintains collateral in an amount not less than 100% of the market value of the loaned securities during the period of the loan. The market value of the loaned securities is determined at the close of business of the Fund and any additional required collateral is delivered to the Fund on the next business day. The Fund or borrower may terminate the loan at any time, and if the borrower defaults on its obligation to return the securities loaned because of insolvency or other reasons, the Fund may apply collateral received from the borrower against the obligation. The Fund may experience delays and costs in recovering the securities loaned. Any cash collateral received is invested in the Fidelity Securities Lending Cash Central Fund. At period end, there were no security loans outstanding. Security lending income represents the income earned on investing cash collateral, less rebates paid to borrowers and any lending agent fees associated with the loan, plus any premium payments received for lending certain types of securities. Security lending income is presented in the Statement of Operations as a component of income from Fidelity Central Funds. Total security lending income during the period amounted to $999. During the period, there were no securities loaned to FCM.
8. Expense Reductions.
The investment adviser voluntarily agreed to reimburse each class to the extent annual operating expenses exceeded certain levels of average net assets as noted in the table below. Some expenses, for example interest expense, including commitment fees, are excluded from this reimbursement.
The following classes were in reimbursement during the period:
| Expense
Limitations | Reimbursement |
Class T | 1.90% | $ 400 |
Class B | 2.40% | 7 |
Class C | 2.40% | 589 |
| | $ 996 |
Commissions paid to certain brokers with whom the investment adviser, or its affiliates, places trades on behalf of the Fund include an amount in addition to trade execution, which may be rebated back to the Fund to offset certain expenses. This amount totaled $6,765 for the period.
Annual Report
Notes to Financial Statements - continued
8. Expense Reductions - continued
In addition, during the period the investment adviser reimbursed and/or waived a portion of the fund-level operating expenses in the amount of $384 and portion of class-level operating expenses as follows:
| Amount |
Class A | $ 212 |
Class T | 4 |
Class B | 1 |
Class C | 36 |
Emerging Europe, Middle East, Africa (EMEA) | 2,766 |
Class I | 161 |
| $ 3,180 |
9. Distributions to Shareholders.
Distributions to shareholders of each class were as follows:
Years ended October 31, | 2015 | 2014 |
From net investment income | | |
Class A | $ 113,464 | $ 138,741 |
Class T | 35,916 | 39,254 |
Class B | 1,835 | 1,980 |
Class C | 58,320 | 46,648 |
Emerging Europe, Middle East, Africa (EMEA) | 1,776,301 | 1,537,065 |
Class I | 105,734 | 157,868 |
Total | $ 2,091,570 | $ 1,921,556 |
From net realized gain | | |
Class A | $ 32,778 | $ - |
Class T | 11,206 | - |
Class B | 1,213 | - |
Class C | 29,160 | - |
Emerging Europe, Middle East, Africa (EMEA) | 407,505 | - |
Class I | 22,909 | - |
Total | $ 504,771 | $ - |
Annual Report
10. Share Transactions.
Share transactions for each class were as follows and may contain automatic conversions between classes or exchanges between funds:
| Shares | Dollars |
Years ended October 31, | 2015 | 2014 | 2015 | 2014 |
Class A | | | | |
Shares sold | 200,433 | 315,373 | $ 1,636,757 | $ 2,918,425 |
Reinvestment of distributions | 16,251 | 11,698 | 135,531 | 104,929 |
Shares redeemed | (315,855) | (601,453) | (2,546,115) | (5,463,762) |
Net increase (decrease) | (99,171) | (274,382) | $ (773,827) | $ (2,440,408) |
Class T | | | | |
Shares sold | 86,058 | 101,639 | $ 721,254 | $ 928,488 |
Reinvestment of distributions | 5,631 | 4,323 | 46,793 | 38,736 |
Shares redeemed | (96,309) | (198,384) | (767,911) | (1,797,181) |
Net increase (decrease) | (4,620) | (92,422) | $ 136 | $ (829,957) |
Class B | | | | |
Shares sold | 3,390 | 4,359 | $ 28,032 | $ 39,785 |
Reinvestment of distributions | 349 | 219 | 2,936 | 1,980 |
Shares redeemed | (12,164) | (12,911) | (100,803) | (117,435) |
Net increase (decrease) | (8,425) | (8,333) | $ (69,835) | $ (75,670) |
Class C | | | | |
Shares sold | 210,315 | 241,646 | $ 1,702,630 | $ 2,211,783 |
Reinvestment of distributions | 8,117 | 3,905 | 67,210 | 34,875 |
Shares redeemed | (408,507) | (221,913) | (3,365,409) | (2,006,697) |
Net increase (decrease) | (190,075) | 23,638 | $ (1,595,569) | $ 239,961 |
Emerging Europe, Middle East, Africa (EMEA) | | | | |
Shares sold | 1,440,703 | 2,719,041 | $ 11,732,025 | $ 24,959,563 |
Reinvestment of distributions | 247,446 | 162,803 | 2,063,699 | 1,463,600 |
Shares redeemed | (3,348,545) | (3,802,325) | (27,229,428) | (34,854,232) |
Net increase (decrease) | (1,660,396) | (920,481) | $ (13,433,704) | $ (8,431,069) |
Class I | | | | |
Shares sold | 131,915 | 374,756 | $ 1,069,757 | $ 3,428,841 |
Reinvestment of distributions | 12,912 | 8,639 | 107,558 | 77,579 |
Shares redeemed | (297,795) | (841,493) | (2,411,162) | (7,467,169) |
Net increase (decrease) | (152,968) | (458,098) | $ (1,233,847) | $ (3,960,749) |
Annual Report
Notes to Financial Statements - continued
11. Other.
The Fund's organizational documents provide former and current trustees and officers with a limited indemnification against liabilities arising in connection with the performance of their duties to the Fund. In the normal course of business, the Fund may also enter into contracts that provide general indemnifications. The Fund's maximum exposure under these arrangements is unknown as this would be dependent on future claims that may be made against the Fund. The risk of material loss from such claims is considered remote.
Annual Report
To the Trustees of Fidelity Investment Trust and Shareholders of Fidelity Emerging Europe, Middle East, Africa (EMEA) Fund:
We have audited the accompanying statement of assets and liabilities of Fidelity Emerging Europe, Middle East, Africa (EMEA) Fund (the Fund), a fund of Fidelity Investment Trust, including the schedule of investments, as of October 31, 2015, and the related statement of operations for the year then ended, the statement of changes in net assets for each of the two years in the period then ended, and the financial highlights for each of the five years in the period then ended. These financial statements and financial highlights are the responsibility of the Fund's management. Our responsibility is to express an opinion on these financial statements and financial highlights based on our audits.
We conducted our audits in accordance with the standards of the Public Company Accounting Oversight Board (United States). Those standards require that we plan and perform the audit to obtain reasonable assurance about whether the financial statements and financial highlights are free of material misstatement. The Fund is not required to have, nor were we engaged to perform, an audit of its internal control over financial reporting. Our audits included consideration of internal control over financial reporting as a basis for designing audit procedures that are appropriate in the circumstances, but not for the purpose of expressing an opinion on the effectiveness of the Fund's internal control over financial reporting. Accordingly, we express no such opinion. An audit also includes examining, on a test basis, evidence supporting the amounts and disclosures in the financial statements, assessing the accounting principles used and significant estimates made by management, as well as evaluating the overall financial statement presentation. Our procedures included confirmation of securities owned as of October 31, 2015, by correspondence with the custodians and brokers; when replies were not received from brokers, we performed other auditing procedures. We believe that our audits provide a reasonable basis for our opinion.
In our opinion, such financial statements and financial highlights referred to above present fairly, in all material respects, the financial position of Fidelity Emerging Europe, Middle East, Africa (EMEA) Fund as of October 31, 2015, the results of its operations for the year then ended, the changes in its net assets for each of the two years in the period then ended, and the financial highlights for each of the five years in the period then ended, in conformity with accounting principles generally accepted in the United States of America.
DELOITTE & TOUCHE LLP
Boston, Massachusetts
December 18, 2015
Annual Report
The Trustees, Member of the Advisory Board, and officers of the trust and fund, as applicable, are listed below. The Board of Trustees governs the fund and is responsible for protecting the interests of shareholders. The Trustees are experienced executives who meet periodically throughout the year to oversee the fund's activities, review contractual arrangements with companies that provide services to the fund, oversee management of the risks associated with such activities and contractual arrangements, and review the fund's performance. Each of the Trustees oversees 170 funds.
The Trustees hold office without limit in time except that (a) any Trustee may resign; (b) any Trustee may be removed by written instrument, signed by at least two-thirds of the number of Trustees prior to such removal; (c) any Trustee who requests to be retired or who has become incapacitated by illness or injury may be retired by written instrument signed by a majority of the other Trustees; and (d) any Trustee may be removed at any special meeting of shareholders by a two-thirds vote of the outstanding voting securities of the trust. Each Trustee who is not an interested person (as defined in the 1940 Act) of the trust and the fund (Independent Trustee), shall retire not later than the last day of the calendar year in which his or her 75th birthday occurs. The Independent Trustees may waive this mandatory retirement age policy with respect to individual Trustees. The officers and Advisory Board Member hold office without limit in time, except that any officer and Advisory Board Member may resign or may be removed by a vote of a majority of the Trustees at any regular meeting or any special meeting of the Trustees. Except as indicated, each individual has held the office shown or other offices in the same company for the past five years.
Experience, Skills, Attributes, and Qualifications of the Fund's Trustees. The Governance and Nominating Committee has adopted a statement of policy that describes the experience, qualifications, attributes, and skills that are necessary and desirable for potential Independent Trustee candidates (Statement of Policy). The Board believes that each Trustee satisfied at the time he or she was initially elected or appointed a Trustee, and continues to satisfy, the standards contemplated by the Statement of Policy. The Governance and Nominating Committee also engages professional search firms to help identify potential Independent Trustee candidates who have the experience, qualifications, attributes, and skills consistent with the Statement of Policy. From time to time, additional criteria based on the composition and skills of the current Independent Trustees, as well as experience or skills that may be appropriate in light of future changes to board composition, business conditions, and regulatory or other developments, have also been considered by the professional search firms and the Governance and Nominating Committee. In addition, the Board takes into account the Trustees' commitment and participation in Board and committee meetings, as well as their leadership of standing and ad hoc committees throughout their tenure.
In determining that a particular Trustee was and continues to be qualified to serve as a Trustee, the Board has considered a variety of criteria, none of which, in isolation, was controlling. The Board believes that, collectively, the Trustees have balanced and diverse experience, qualifications, attributes, and skills, which allow the Board to operate effectively in governing the fund and protecting the interests of shareholders. Information about the specific experience, skills, attributes, and qualifications of each Trustee, which in each case led to the Board's conclusion that the Trustee should serve (or continue to serve) as a trustee of the fund, is provided below.
Annual Report
Board Structure and Oversight Function. James C. Curvey is an interested person (as defined in the 1940 Act) and currently serves as Chairman. The Trustees have determined that an interested Chairman is appropriate and benefits shareholders because an interested Chairman has a personal and professional stake in the quality and continuity of services provided to the fund. Independent Trustees exercise their informed business judgment to appoint an individual of their choosing to serve as Chairman, regardless of whether the Trustee happens to be independent or a member of management. The Independent Trustees have determined that they can act independently and effectively without having an Independent Trustee serve as Chairman and that a key structural component for assuring that they are in a position to do so is for the Independent Trustees to constitute a substantial majority for the Board. The Independent Trustees also regularly meet in executive session. Ned C. Lautenbach serves as Chairman of the Independent Trustees and as such (i) acts as a liaison between the Independent Trustees and management with respect to matters important to the Independent Trustees and (ii) with management prepares agendas for Board meetings.
Fidelity funds are overseen by different Boards of Trustees. The fund's Board oversees Fidelity's high income and certain equity funds, and other Boards oversee Fidelity's investment-grade bond, money market, asset allocation, and sector funds. The asset allocation funds may invest in Fidelity funds overseen by the fund's Board. The use of separate Boards, each with its own committee structure, allows the Trustees of each group of Fidelity funds to focus on the unique issues of the funds they oversee, including common research, investment, and operational issues. On occasion, the separate Boards establish joint committees to address issues of overlapping consequences for the Fidelity funds overseen by each Board.
The Trustees operate using a system of committees to facilitate the timely and efficient consideration of all matters of importance to the Trustees, the fund, and fund shareholders and to facilitate compliance with legal and regulatory requirements and oversight of the fund's activities and associated risks. The Board, acting through its committees, has charged FMR and its affiliates with (i) identifying events or circumstances the occurrence of which could have demonstrably adverse effects on the fund's business and/or reputation; (ii) implementing processes and controls to lessen the possibility that such events or circumstances occur or to mitigate the effects of such events or circumstances if they do occur; and (iii) creating and maintaining a system designed to evaluate continuously business and market conditions in order to facilitate the identification and implementation processes described in (i) and (ii) above. Because the day-to-day operations and activities of the fund are carried out by or through FMR, its affiliates and other service providers, the fund's exposure to risks is mitigated but not eliminated by the processes overseen by the Trustees. While each of the Board's committees has responsibility for overseeing different aspects of the fund's activities, oversight is exercised primarily through the Operations, Audit, and Compliance Committees. In addition, the Independent Trustees have worked with FMR to enhance the Board's oversight of investment and financial risks, legal and regulatory risks, technology risks, and operational risks, including the development of additional risk reporting to the Board. For example, a working group comprised of Independent Trustees and FMR has worked and continues to work to review the Fidelity funds' valuation-related activities, reporting and risk management. Appropriate personnel, including but not limited to the fund's Chief Compliance Officer (CCO), FMR's internal auditor, the independent accountants, the fund's Treasurer and portfolio management personnel, make periodic reports to the Board's committees, as appropriate, including an annual review of Fidelity's risk management program for the Fidelity funds. The responsibilities of each standing committee, including their oversight responsibilities, are described further under "Standing Committees of the Fund's Trustees."
Annual Report
Trustees and Officers - continued
The fund's Statement of Additional Information (SAI) includes more information about the Trustees. To request a free copy, call Fidelity at 1-877-208-0098.
Interested Trustees*:
Correspondence intended for each Trustee who is an interested person may be sent to Fidelity Investments, 245 Summer Street, Boston, Massachusetts 02210.
Name, Year of Birth; Principal Occupations and Other Relevant Experience+ |
James C. Curvey (1935) |
Year of Election or Appointment: 2007 Trustee Chairman of the Board of Trustees |
| Mr. Curvey also serves as Trustee of other Fidelity funds. Mr. Curvey is a Director of Fidelity Research & Analysis Co. (investment adviser firm, 2009-present), and Vice Chairman (2007-present) and Director of FMR LLC (diversified financial services company). In addition, Mr. Curvey serves as an Overseer for the Boston Symphony Orchestra and a member of the board of Artis-Naples, Naples, Florida, and as a Trustee for Brewster Academy, Wolfeboro, New Hampshire. Previously, Mr. Curvey served as a Director of Fidelity Investments Money Management, Inc. (investment adviser firm, 2009-2014) and a Director of FMR and FMR Co., Inc. (investment adviser firms, 2007-2014). |
Charles S. Morrison (1960) |
Year of Election or Appointment: 2014 Trustee |
| Mr. Morrison also serves as Trustee of other funds. He serves as a Director of Fidelity Investments Money Management, Inc. (FIMM) (investment adviser firm, 2014-present), Director of Fidelity SelectCo, LLC (investment adviser firm, 2014-present), President, Asset Management (2014-present), and is an employee of Fidelity Investments. Previously, Mr. Morrison served as Vice President of Fidelity's Fixed Income and Asset Allocation Funds (2012-2014), President, Fixed Income (2011-2014), Vice President of Fidelity's Money Market Funds (2005-2009), President, Money Market Group Leader of FMR (investment adviser firm, 2009), and Senior Vice President, Money Market Group of FMR (2004-2009). Mr. Morrison also served as Vice President of Fidelity's Bond Funds (2002-2005), certain Balanced Funds (2002-2005), and certain Asset Allocation Funds (2002-2007), and as Senior Vice President (2002-2005) of Fidelity's Bond Division. |
* Trustees have been determined to be "Interested Trustees" by virtue of, among other things, their affiliation with the trust or various entities under common control with FMR.
+ The information above includes each Trustee's principal occupation during the last five years and other information relating to the experience, attributes, and skills relevant to each Trustee's qualifications to serve as a Trustee, which led to the conclusion that each Trustee should serve as a Trustee for the fund.
Annual Report
Trustees and Officers - continued
Independent Trustees:
Correspondence intended for each Independent Trustee (that is, the Trustees other than the Interested Trustees) may be sent to Fidelity Investments, P.O. Box 55235, Boston, Massachusetts 02205-5235.
Name, Year of Birth; Principal Occupations and Other Relevant Experience+ |
Dennis J. Dirks (1948) |
Year of Election or Appointment: 2005 Trustee |
| Mr. Dirks also serves as Trustee of other Fidelity funds. Prior to his retirement in May 2003, Mr. Dirks was Chief Operating Officer and a member of the Board of The Depository Trust & Clearing Corporation (DTCC). He also served as President, Chief Operating Officer, and Board member of The Depository Trust Company (DTC) and President and Board member of the National Securities Clearing Corporation (NSCC). In addition, Mr. Dirks served as Chief Executive Officer and Board member of the Government Securities Clearing Corporation, Chief Executive Officer and Board member of the Mortgage-Backed Securities Clearing Corporation, as a Trustee and a member of the Finance Committee of Manhattan College (2005-2008), as a Trustee and a member of the Finance Committee of AHRC of Nassau County (2006-2008), and as a member of the Independent Directors Council (IDC) Governing Council (2010-2015). Mr. Dirks is a member of the Board of Directors for The Brookville Center for Children's Services, Inc. (2009-present). |
Alan J. Lacy (1953) |
Year of Election or Appointment: 2008 Trustee |
| Mr. Lacy also serves as Trustee of other Fidelity funds. Mr. Lacy serves as a member of the Board of Directors of Dave & Buster's Entertainment, Inc. (restaurant and entertainment complexes, 2010-present) and Bristol-Myers Squibb Company (global pharmaceuticals, 2008-present). In addition, Mr. Lacy served as Senior Adviser (2007-2014) of Oak Hill Capital Partners, L.P. (private equity) and also served as Chief Executive Officer (2000-2005) and Vice Chairman (2005-2006) of Sears Holdings Corporation and Sears, Roebuck and Co. (retail). Mr. Lacy is a member of the Board of Trustees of The National Parks Conservation Association (2006-present). Previously, Mr. Lacy served as Chairman of the Board of Trustees of the National Parks Conservation Association (2008-2011) and as a member of the Board of Directors for The Western Union Company (global money transfer, 2006-2011), The Hillman Companies, Inc. (hardware wholesalers, 2010-2014), and Earth Fare, Inc. (retail grocery, 2010-2014). |
Ned C. Lautenbach (1944) |
Year of Election or Appointment: 2000 Trustee Chairman of the Independent Trustees |
| Mr. Lautenbach also serves as Trustee of other Fidelity funds. Mr. Lautenbach currently serves as the Lead Director of the Eaton Corporation Board of Directors (diversified industrial, 1997-present). Mr. Lautenbach is Chairman of the Board of Directors of Artis-Naples in Naples, Florida (2012-present), a member of the Council on Foreign Relations (1994-present), and a member of the Board of Governors, State University System of Florida (2013-present). Previously, Mr. Lautenbach was a Partner/Advisory Partner at Clayton, Dubilier & Rice, LLC (private equity investment, 1998-2010), as well as a Director of Sony Corporation (2006-2007). |
Joseph Mauriello (1944) |
Year of Election or Appointment: 2008 Trustee |
| Mr. Mauriello also serves as Trustee of other Fidelity funds. Prior to his retirement in January 2006, Mr. Mauriello served in numerous senior management positions including Deputy Chairman and Chief Operating Officer (2004-2005), and Vice Chairman of Financial Services (2002-2004) of KPMG LLP US (professional services, 1965-2005). Mr. Mauriello currently serves as a member of the Board of Directors of XL Group plc. (global insurance and re-insurance, 2006-present) and the Independent Directors Council (IDC) Governing Council (2015-present). Previously, Mr. Mauriello served as a Director of the Hamilton Funds of the Bank of New York (2006-2007) and of Arcadia Resources Inc. (health care services and products, 2007-2012). |
Robert W. Selander (1950) |
Year of Election or Appointment: 2011 Trustee |
| Mr. Selander also serves as Trustee of other Fidelity funds. Mr. Selander serves as a Director of The Western Union Company (global money transfer, 2014-present). Previously, Mr. Selander served as a Member of the Advisory Board of other Fidelity funds (2011), and Executive Vice Chairman (2010), Chief Executive Officer (2009-2010), and President and Chief Executive Officer (1997-2009) of Mastercard, Inc. |
Cornelia M. Small (1944) |
Year of Election or Appointment: 2005 Trustee |
| Ms. Small also serves as Trustee of other Fidelity funds. Ms. Small is a member of the Board of Directors (2009-present) and Chair of the Investment Committee (2010-present) of the Teagle Foundation. Ms. Small also serves on the Investment Committee of the Berkshire Taconic Community Foundation (2008-present). Previously, Ms. Small served as Chairperson (2002-2008) and a member of the Investment Committee and Chairperson (2008-2012) and a member of the Board of Trustees of Smith College. In addition, Ms. Small served as Chief Investment Officer, Director of Global Equity Investments, and a member of the Board of Directors of Scudder, Stevens & Clark and Scudder Kemper Investments. |
William S. Stavropoulos (1939) |
Year of Election or Appointment: 2001 Trustee Vice Chairman of the Independent Trustees |
| Mr. Stavropoulos also serves as Trustee of other Fidelity funds. Mr. Stavropoulos serves as President and Founder of the Michigan Baseball Foundation, the Great Lakes Loons (2007-present). Mr. Stavropoulos is Chairman Emeritus of the Board of Directors of The Dow Chemical Company, where he previously served in numerous senior management positions, including President, CEO (1995-2000; 2002-2004), Chairman of the Executive Committee (2000-2006), and as a member of the Board of Directors (1990-2006). Currently, Mr. Stavropoulos is Chairman of the Board of Directors of Univar Inc. (global distributor of commodity and specialty chemicals), a Director of Teradata Corporation (data warehousing and technology solutions), and Maersk Inc. (industrial conglomerate), and a member of the Advisory Board for Metalmark Capital LLC (private equity investment, 2005-present). Mr. Stavropoulos is an operating advisor to Clayton, Dubilier & Rice, LLC (private equity investment). In addition, Mr. Stavropoulos is a member of the University of Notre Dame Advisory Council for the College of Science, a Trustee of the Rollin L. Gerstacker Foundation, and a Director of the Naples Philharmonic Center for the Arts. Previously, Mr. Stavropoulos served as a Director of Chemical Financial Corporation (bank holding company, 1993-2012) and Tyco International, Ltd. (multinational manufacturing and services, 2007-2012). |
David M. Thomas (1949) |
Year of Election or Appointment: 2008 Trustee |
| Mr. Thomas also serves as Trustee of other Fidelity funds. Mr. Thomas serves as Non-Executive Chairman of the Board of Directors of Fortune Brands Home and Security (home and security products, 2011-present), as a member of the Board of Directors (2004-present) and Presiding Director (2013-present) of Interpublic Group of Companies, Inc. (marketing communication), and as a member of the Board of Trustees of the University of Florida (2013-present). Previously, Mr. Thomas served as Executive Chairman (2005-2006) and Chairman and Chief Executive Officer (2000-2005) of IMS Health, Inc. (pharmaceutical and healthcare information solutions), and a Director of Fortune Brands, Inc. (consumer products, 2000-2011). |
+ The information above includes each Trustee's principal occupation during the last five years and other information relating to the experience, attributes, and skills relevant to each Trustee's qualifications to serve as a Trustee, which led to the conclusion that each Trustee should serve as a Trustee for the fund.
Advisory Board Member and Officers:
Correspondence intended for each officer and Peter S. Lynch may be sent to Fidelity Investments, 245 Summer Street, Boston, Massachusetts 02210. Officers appear below in alphabetical order.
Name, Year of Birth; Principal Occupation |
Peter S. Lynch (1944) |
Year of Election or Appointment: 2003 Member of the Advisory Board |
| Mr. Lynch also serves as Member of the Advisory Board of other Fidelity funds. Mr. Lynch is Vice Chairman and a Director of FMR (investment adviser firm) and FMR Co., Inc. (investment adviser firm). In addition, Mr. Lynch serves as a Trustee of Boston College and as the Chairman of the Inner-City Scholarship Fund. Previously, Mr. Lynch served on the Special Olympics International Board of Directors (1997-2006). |
Elizabeth Paige Baumann (1968) |
Year of Election or Appointment: 2012 Anti-Money Laundering (AML) Officer |
| Ms. Baumann also serves as AML Officer of other funds. She is Chief AML Officer of FMR LLC (diversified financial services company, 2012-present) and is an employee of Fidelity Investments. Previously, Ms. Baumann served as Vice President and Deputy Anti-Money Laundering Officer (2007-2012). |
Marc R. Bryant (1966) |
Year of Election or Appointment: 2015 Secretary and Chief Legal Officer (CLO) |
| Mr. Bryant also serves as Secretary and CLO of other funds. Mr. Bryant serves as CLO, Secretary, and Senior Vice President of Fidelity Management & Research Company (investment adviser firm, 2015-present) and FMR Co., Inc. (investment adviser firm, 2015-present); Secretary of Fidelity SelectCo, LLC (investment adviser firm, 2015-present) and Fidelity Investments Money Management, Inc. (investment adviser firm, 2015-present); and CLO of Fidelity Management & Research (Hong Kong) Limited (investment adviser firm, 2015-present). He is Senior Vice President and Deputy General Counsel of FMR LLC (diversified financial services company). Previously, Mr. Bryant served as Secretary and Chief Legal Officer of Fidelity Rutland Square Trust II (2010-2014) and Assistant Secretary of Fidelity's Fixed Income and Asset Allocation Funds (2013-2015). Prior to joining Fidelity Investments, Mr. Bryant served as a Senior Vice President and the Head of Global Retail Legal for AllianceBernstein L.P. (2006-2010), and as the General Counsel for ProFund Advisors LLC (2001-2006). |
William C. Coffey (1969) |
Year of Election or Appointment: 2009 Assistant Secretary |
| Mr. Coffey also serves as Assistant Secretary of other funds. He is Senior Vice President and Deputy General Counsel of FMR LLC (diversified financial services company, 2010-present), and is an employee of Fidelity Investments. Previously, Mr. Coffey served as Vice President and Associate General Counsel of FMR LLC (2005-2009). |
Timothy M. Cohen (1969) |
Year of Election or Appointment: 2014 Vice President of certain Equity Funds |
| Mr. Cohen also serves as Vice President of other funds. Mr. Cohen serves as Chief Compliance Officer of FMR Investment Management (U.K.) Limited (investment adviser firm, 2013-present) and is an employee of Fidelity Investments. Previously, Mr. Cohen served as a Director of FMR Investment Management (U.K.) Limited (2013-2015). |
Jonathan Davis (1968) |
Year of Election or Appointment: 2010 Assistant Treasurer |
| Mr. Davis also serves as Assistant Treasurer of other funds, and is an employee of Fidelity Investments. Previously, Mr. Davis served as Vice President and Associate General Counsel of FMR LLC (diversified financial services company, 2003-2010). |
Adrien E. Deberghes (1967) |
Year of Election or Appointment: 2008 Deputy Treasurer |
| Mr. Deberghes also serves as an officer of other funds. He is an employee of Fidelity Investments (2008-present). Prior to joining Fidelity Investments, Mr. Deberghes was Senior Vice President of Mutual Fund Administration at State Street Corporation (2007-2008), Senior Director of Mutual Fund Administration at Investors Bank & Trust (2005-2007), and Director of Finance for Dunkin' Brands (2000-2005). |
Stephanie J. Dorsey (1969) |
Year of Election or Appointment: 2010 Assistant Treasurer |
| Ms. Dorsey also serves as an officer of other funds. She is an employee of Fidelity Investments (2008-present) and has served in other fund officer roles. Prior to joining Fidelity Investments, Ms. Dorsey served as Treasurer (2004-2008) of the JPMorgan Mutual Funds and Vice President (2004-2008) of JPMorgan Chase Bank. |
Howard J. Galligan III (1966) |
Year of Election or Appointment: 2014 Chief Financial Officer |
| Mr. Galligan also serves as Chief Financial Officer of other funds. Mr. Galligan serves as President of Fidelity Pricing and Cash Management Services (FPCMS) (2014-present) and as a Director of Strategic Advisers, Inc. (investment adviser firm, 2008-present). Previously, Mr. Galligan served as Chief Administrative Officer of Asset Management (2011-2014) and Chief Operating Officer and Senior Vice President of Investment Support for Strategic Advisers, Inc. (2003-2011). |
Scott C. Goebel (1968) |
Year of Election or Appointment: 2015 Vice President |
| Mr. Goebel serves as Vice President of other funds and is an employee of Fidelity Investments (2001-present). Previously, Mr. Goebel served as Secretary of Fidelity SelectCo, LLC (investment adviser firm, 2013-2015), Fidelity Investments Money Management, Inc. (FIMM) (investment adviser firm, 2010-2015), and Fidelity Research and Analysis Company (FRAC) (investment adviser firm, 2010-2015); General Counsel, Secretary, and Senior Vice President of Fidelity Management & Research Company (investment adviser firm, 2008-2015) and FMR Co., Inc. (investment adviser firm, 2008-2015); Assistant Secretary of Fidelity Management & Research (Japan) Limited (investment adviser firm, 2008-2015) and FMR Investment Management (U.K.) Limited (investment adviser firm, 2008-2015); Chief Legal Officer (CLO) of Fidelity Management & Research (Hong Kong) Limited (investment adviser firm, 2008-2015); Secretary and CLO of certain Fidelity funds (2008-2015); Assistant Secretary of FIMM (2008-2010), FRAC (2008-2010), and certain funds (2007-2008); and as Vice President and Secretary of Fidelity Distributors Corporation (FDC) (2005-2007). |
Brian B. Hogan (1964) |
Year of Election or Appointment: 2009 Vice President |
| Mr. Hogan also serves as Trustee or Vice President of other funds. Mr. Hogan serves as a Director of Fidelity SelectCo, LLC (investment adviser firm, 2014-present) and President of the Equity Division of FMR (investment adviser firm, 2009-present). Previously, Mr. Hogan served as Senior Vice President, Equity Research of FMR (2006-2009) and as a portfolio manager. |
Chris Maher (1972) |
Year of Election or Appointment: 2013 Assistant Treasurer |
| Mr. Maher serves as Assistant Treasurer of other funds. Mr. Maher is Vice President of Valuation Oversight and is an employee of Fidelity Investments. Previously, Mr. Maher served as Vice President of Asset Management Compliance (2013), Vice President of the Program Management Group of FMR (investment adviser firm, 2010-2013), and Vice President of Valuation Oversight (2008-2010). |
Kenneth B. Robins (1969) |
Year of Election or Appointment: 2008 President and Treasurer |
| Mr. Robins also serves as an officer of other funds. Mr. Robins serves as Executive Vice President of Fidelity Investments Money Management, Inc. (FIMM) (investment adviser firm, 2013-present) and is an employee of Fidelity Investments (2004-present). Previously, Mr. Robins served in other fund officer roles. |
Stacie M. Smith (1974) |
Year of Election or Appointment: 2013 Deputy Treasurer |
| Ms. Smith also serves as an officer of other funds. She is an employee of Fidelity Investments (2009-present) and has served in other fund officer roles. Prior to joining Fidelity Investments, Ms. Smith served as Senior Audit Manager of Ernst & Young LLP (1996-2009). |
Renee Stagnone (1975) |
Year of Election or Appointment: 2013 Deputy Treasurer |
| Ms. Stagnone also serves as Deputy Treasurer of other funds. Ms. Stagnone is an employee of Fidelity Investments (1997-present). |
Linda J. Wondrack (1964) |
Year of Election or Appointment: 2014 Chief Compliance Officer |
| Ms. Wondrack also serves as Chief Compliance Officer of other funds. Ms. Wondrack is Executive Vice President and head of the Ethics Office and Asset Management Compliance for Fidelity Investments (2012-present). Ms. Wondrack also serves as Chief Compliance Officer of Fidelity SelectCo, LLC (investment adviser firm, 2014-present); Chief Compliance Officer of Impresa Management LLC (2013-present); and Chief Compliance Officer of FMR Co., Inc. (investment adviser firm), Fidelity Investments Money Management, Inc. (investment adviser firm), Fidelity Management & Research (Japan) Limited (investment adviser firm), FMR Investment Management (U.K.) Limited (investment adviser firm), Fidelity Management & Research (Hong Kong) (investment adviser firm), Fidelity Management & Research Company (investment adviser firm), FIAM LLC (investment adviser firm), and Strategic Advisers, Inc. (investment adviser firm), Ballyrock Investment Advisors LLC, and Northern Neck Investors LLC (2012-present). Previously, Ms. Wondrack served as Senior Vice President and Chief Compliance Officer for Columbia Management Investment Advisers, LLC (2005-2012); Chief Compliance Officer for certain funds within the Columbia Family of Funds (2007-2012); and Senior Vice President of Compliance Risk Management at Bank of America (2005-2010). |
Joseph F. Zambello (1957) |
Year of Election or Appointment: 2011 Deputy Treasurer |
| Mr. Zambello also serves as Deputy Treasurer of other funds. Mr. Zambello is an employee of Fidelity Investments (1991-present). Previously, Mr. Zambello served as Vice President of the Program Management Group of FMR (investment adviser firm, 2009-2011) and Vice President of the Transfer Agent Oversight Group (2005-2009). |
Annual Report
Class I designates 100% of the dividend distributed during the fiscal year, as amounts which may be taken into account as a dividend for purposes of the maximum rate under section 1(h)(11) of the Internal Revenue Code.
The amounts per share which represent income derived from sources within, and taxes paid to, foreign countries or possessions of the United States are as follows:
| Pay Date | Income | Taxes |
Class I | 12/08/2014 | $0.2657 | $0.0467 |
The fund will notify shareholders in January 2016 of amounts for use in preparing 2015 income tax returns.
Annual Report
Fidelity Emerging Europe, Middle East, Africa (EMEA) Fund
Each year, the Board of Trustees, including the Independent Trustees (together, the Board), votes on the renewal of the management contract with Fidelity Management & Research Company (FMR) and the sub-advisory agreements (together, the Advisory Contracts) for the fund. The Board, assisted by the advice of fund counsel and Independent Trustees' counsel, requests and considers a broad range of information relevant to the renewal of the Advisory Contracts throughout the year.
The Board meets regularly and, at each of its meetings, covers an extensive agenda of topics and materials and considers factors that are relevant to its annual consideration of the renewal of the fund's Advisory Contracts, including the services and support provided to the fund and its shareholders. The Board has established various standing committees (Committees), each composed of and chaired by Independent Trustees with varying backgrounds, to which the Board has assigned specific subject matter responsibilities in order to enhance effective decision-making by the Board. The Board, acting directly and through its Committees, requests and receives information concerning the annual consideration of the renewal of the fund's Advisory Contracts. The Board also meets as needed to consider matters specifically related to the Board's annual consideration of the renewal of the Advisory Contracts. Members of the Board may also meet with trustees of other Fidelity funds through ad hoc joint committees to discuss certain matters relevant to all of the Fidelity funds.
At its July 2015 meeting, the Board unanimously determined to renew the fund's Advisory Contracts. In reaching its determination, the Board considered all factors it believed relevant, including (i) the nature, extent, and quality of the services to be provided to the fund and its shareholders (including the investment performance of the fund); (ii) the competitiveness of the fund's management fee and total expense ratio relative to peer funds; (iii) the total costs of the services to be provided by and the profits to be realized by Fidelity from its relationship with the fund; and (iv) the extent to which (if any) economies of scale exist and would be realized as the fund grows, and whether any economies of scale are appropriately shared with fund shareholders.
In considering whether to renew the Advisory Contracts for the fund, the Board reached a determination, with the assistance of fund counsel and Independent Trustees' counsel and through the exercise of its business judgment, that the renewal of the Advisory Contracts was in the best interests of the fund and its shareholders and that the compensation payable under the Advisory Contracts was fair and reasonable. The Board's decision to renew the Advisory Contracts was not based on any single factor, but rather was based on a comprehensive consideration of all the information provided to the Board at its meetings throughout the year. The Board, in reaching its determination to renew the Advisory Contracts, was aware that shareholders of the fund have a broad range of investment choices available to them, including a wide choice among funds offered by Fidelity's competitors, and that the fund's shareholders, who have the opportunity to review and weigh the disclosure provided by the fund in its prospectus and other public disclosures, have chosen to invest in this fund, which is part of the Fidelity family of funds.
Annual Report
Nature, Extent, and Quality of Services Provided. The Board considered Fidelity's staffing as it relates to the fund, including the backgrounds of investment personnel of Fidelity, and also considered the fund's investment objective, strategies, and related investment philosophy. The Independent Trustees also had discussions with senior management of Fidelity's investment operations and investment groups. The Board considered the structure of the portfolio manager compensation program and whether this structure provides appropriate incentives to act in the best interests of the fund. Additionally, the Board considered the portfolio managers' investments, if any, in the funds that they manage.
Resources Dedicated to Investment Management and Support Services. The Board and the Fund Oversight and Research Committees reviewed the general qualifications and capabilities of Fidelity's investment staff, including its size, education, experience, and resources, as well as Fidelity's approach to recruiting, training, managing, and compensating investment personnel. The Board noted that Fidelity has continued to increase the resources devoted to non-U.S. offices, including expansion of Fidelity's global investment organization. The Board also noted that Fidelity's analysts have extensive resources, tools and capabilities that allow them to conduct sophisticated quantitative and fundamental analysis, as well as credit analysis of issuers, counterparties and guarantors. Further, the Board considered that Fidelity's investment professionals have sufficient access to global information and data so as to provide competitive investment results over time, and that those professionals also have access to sophisticated tools that permit them to assess portfolio construction and risk and performance attribution characteristics continuously, as well as to transmit new information and research conclusions rapidly around the world. Additionally, in its deliberations, the Board considered Fidelity's trading, risk management, and compliance capabilities and resources, which are integral parts of the investment management process.
Shareholder and Administrative Services. The Board considered (i) the nature, extent, quality, and cost of advisory, administrative, and shareholder services performed by FMR, the sub-advisers (together with FMR, the Investment Advisers), and their affiliates under the Advisory Contracts and under separate agreements covering transfer agency, pricing and bookkeeping, and securities lending services for the fund; (ii) the nature and extent of the supervision of third party service providers, principally custodians and subcustodians; and (iii) the resources devoted to, and the record of compliance with, the fund's compliance policies and procedures. The Board also reviewed the allocation of fund brokerage, including allocations to brokers affiliated with the Investment Advisers, the use of brokerage commissions to pay fund expenses, and the use of "soft" commission dollars to pay for research services.
Annual Report
Board Approval of Investment Advisory Contracts and
Management Fees - continued
The Board noted that the growth of fund assets over time across the complex allows Fidelity to reinvest in the development of services designed to enhance the value or convenience of the Fidelity funds as investment vehicles. These services include 24-hour access to account information and market information through telephone representatives and over the Internet, investor education materials and asset allocation tools, and the expanded availability of Fidelity Investor Centers.
In 2014, the Board formed an ad hoc Committee on Transfer Agency Fees to review the variety of transfer agency fee structures throughout the industry and Fidelity's competitive positioning with respect to industry participants.
Investment in a Large Fund Family. The Board considered the benefits to shareholders of investing in a Fidelity fund, including the benefits of investing in a fund that is part of a large family of funds offering a variety of investment disciplines and providing a large variety of mutual fund investor services. The Board noted that Fidelity had taken, or had made recommendations that resulted in the Fidelity funds taking, a number of actions over the previous year that benefited particular funds, including (i) continuing to dedicate additional resources to investment research and to the support of the senior management team that oversees asset management; (ii) continuing efforts to enhance Fidelity's global research capabilities; (iii) launching new funds and making other enhancements to meet client needs; (iv) reducing management fees and total expenses for certain index funds and diversified international funds; (v) continuing to launch dedicated lower cost underlying funds to meet portfolio construction needs related to expanding underlying fund options for Fidelity funds of funds, specifically for the Freedom Fund product lines; (vi) rationalizing product lines and gaining increased efficiencies through fund mergers; (vii) launching active fixed-income exchange-traded funds; (viii) continuing to develop, acquire and implement systems and technology to improve services to the funds and information security and to increase efficiency; (ix) implementing investment enhancements to further strengthen Fidelity's target date product line to increase investors' probability of success in achieving their goals; (x) modifying the eligibility criteria for certain share classes to accommodate roll-over assets from employer-sponsored retirement plans; (xi) launching a new Class W of the Freedom Index Funds to attract and retain Fidelity record-kept retirement plan assets; and (xii) implementing changes to Fidelity's money market product line in response to recent money market regulatory reforms.
Investment Performance. The Board considered whether the fund has operated in accordance with its investment objective, as well as its record of compliance with its investment restrictions and its performance history.
Annual Report
The Board took into account discussions with representatives of the Investment Advisers about fund investment performance that occur at Board meetings throughout the year. In this regard the Board noted that as part of regularly scheduled fund reviews and other reports to the Board on fund performance, the Board considers annualized return information for the fund, for different time periods, measured against a securities market index ("benchmark index") and a peer group of funds with similar objectives ("peer group"), if any. In its evaluation of fund investment performance, the Board gave particular attention to information indicating changes in performance of certain Fidelity funds for specific time periods and discussed with the Investment Advisers the reasons for any overperformance or underperformance.
In addition to reviewing absolute and relative fund performance, the Independent Trustees periodically consider the appropriateness of fund performance metrics in evaluating the results achieved. In general, the Independent Trustees believe that fund performance should be evaluated based on net performance (after fees and expenses) of both the highest performing and lowest performing fund share classes, where applicable, compared to appropriate benchmark indices, over appropriate time periods that may include full market cycles, and compared to peer groups, as applicable, over the same periods, taking into account relevant factors including the following: general market conditions; issuer-specific information; and fund cash flows and other factors.
The Independent Trustees recognize that shareholders evaluate performance on a net basis over their own holding periods, for which one-, three-, and five-year periods are often used as a proxy. For this reason, the performance information reviewed by the Board also included net cumulative calendar year total return information for the fund and an appropriate benchmark index for the most recent one-, three-, and five-year periods, as shown below. A peer group is not shown below because the fund does not generally utilize a peer group for performance comparison purposes.
Annual Report
Board Approval of Investment Advisory Contracts and
Management Fees - continued
Fidelity Emerging Europe, Middle East, Africa (EMEA) Fund

Based on its review, the Board concluded that the nature, extent, and quality of services provided to the fund under the Advisory Contracts should benefit the shareholders of the fund.
Competitiveness of Management Fee and Total Expense Ratio. The Board considered the fund's management fee and total expense ratio compared to "mapped groups" of competitive funds and classes created for the purpose of facilitating the Trustees' competitive analysis of management fees and total expenses. Fidelity creates "mapped groups" by combining similar Lipper investment objective categories that have comparable investment mandates. Combining Lipper investment objective categories aids the Board's management fee and total expense ratio comparisons by broadening the competitive group used for comparison.
Management Fee. The Board considered two proprietary management fee comparisons for the 12-month periods shown in basis points (BP) in the chart below. The group of Lipper funds used by the Board for management fee comparisons is referred to below as the "Total Mapped Group." The Total Mapped Group comparison focuses on a fund's standing in terms of gross management fees before expense reimbursements or caps relative to the total universe of funds with comparable investment mandates, regardless of whether their management fee structures also are comparable. Funds with comparable investment mandates offer exposure to similar types of securities. Funds with comparable management fee structures have similar management fee contractual arrangements (e.g., flat rate charged for advisory services, all-inclusive fee rate, etc.). "TMG %" represents the percentage of funds in the Total Mapped Group that had management fees that were lower than the fund's. For example, a hypothetical TMG % of 20% would mean that 80% of the funds in the Total Mapped Group had higher, and 20% had lower, management fees than the fund. The fund's actual TMG %s and the number of funds in the Total Mapped Group are in the chart below. The "Asset-Size Peer Group" (ASPG) comparison focuses on a fund's standing relative to a subset of non-Fidelity funds within the Total Mapped Group that are similar in size and management fee structure without taking into account performance adjustments, if any. For example, if a fund is in the first quartile of the ASPG, the fund's management fee ranks in the least expensive or lowest 25% of funds in the ASPG. The ASPG represents at least 15% of the funds in the Total Mapped Group with comparable asset size and management fee structures, subject to a minimum of 50 funds (or all funds in the Total Mapped Group if fewer than 50). Additional information, such as the ASPG quartile in which the fund's management fee rate ranked, is also included in the chart and considered by the Board.
Annual Report
Fidelity Emerging Europe, Middle East, Africa (EMEA) Fund

The Board noted that the fund's management fee rate ranked below the median of its Total Mapped Group and below the median of its ASPG for 2014.
The Board noted that, in 2014, the ad hoc Committee on Group Fee was formed by it and other Fidelity fund boards to conduct an in-depth review of the "group fee" component of the management fee of funds with such management fee structures. Committee focus included the mechanics of the group fee, the competitive landscape of group fee structures, Fidelity funds with no group fee component and investment products not included in group fee assets. The Board also considered that, for funds subject to the group fee, FMR agreed to voluntarily waive fees over a specified period of time in amounts designed to account for assets converted from certain funds to certain collective investment trusts.
Annual Report
Board Approval of Investment Advisory Contracts and
Management Fees - continued
The Board also noted that, in 2013, the ad hoc Committee on Management Fees was formed to conduct an in-depth review of the management fee rates of Fidelity's active equity mutual funds. The Committee focused on the following areas: (i) standard fee structures; (ii) research consumption and trading evolution; (iii) management fee competitiveness/profitability by category; and (iv) factors that drive institutional pricing.
Based on its review, the Board concluded that the fund's management fee is fair and reasonable in light of the services that the fund receives and the other factors considered.
Total Expense Ratio. In its review of each class's total expense ratio, the Board considered the fund's management fee as well as other fund or class expenses, as applicable, such as transfer agent fees, pricing and bookkeeping fees, fund-paid 12b-1 fees, and custodial, legal, and audit fees. The Board also noted that Fidelity may agree to waive fees and expenses from time to time, and the extent to which, if any, it has done so for the fund. As part of its review, the Board also considered the current and historical total expense ratios of each class of the fund compared to competitive fund median expenses. Each class of the fund is compared to those funds and classes in the Total Mapped Group (used by the Board for management fee comparisons) that have a similar sales load structure.
The Board noted that the total expense ratio of each of Class A, Class I, and the retail class ranked below its competitive median for 2014 and the total expense ratio of each of Class T, Class B, and Class C ranked above its competitive median for 2014. The Board considered that, in general, various factors can affect total expense ratios. The Board noted that the total expense ratio of Class T was above the competitive median primarily because of higher 12b-1 fees on Class T as compared to most competitor funds. Class T has a higher 12b-1 fee, but a lower front-end sales charge, than traditionally priced front-end sales charge classes. The Board considered that Class T is primarily sold load-waived in the retirement plan market where its 0.50% 12b-1 fee is comparable to competing no-load, higher 12b-1 fee classes designed specifically for retirement plans. The Board noted that the fund offers multiple classes, each of which has a different sales load and 12b-1 fee structure, and that the multiple structures are intended to offer a range of pricing options for the intermediary market. The Board also noted that the total expense ratios of the classes vary primarily by the level of their 12b-1 fees, although differences in transfer agent fees may also cause expenses to vary from class to class.
Fees Charged to Other Fidelity Clients. The Board also considered Fidelity fee structures and other information with respect to clients of Fidelity, such as other funds advised or subadvised by Fidelity, pension plan clients, and other institutional clients with similar mandates. The Board noted the findings of the 2013 ad hoc joint committee (created with the board of other Fidelity funds), which reviewed and compared Fidelity's institutional investment advisory business with its business of providing services to the Fidelity funds, including the differences in services provided, fees charged, and costs incurred, as well as competition in their respective marketplaces.
Annual Report
Based on its review of total expense ratios and fees charged to other Fidelity clients, the Board concluded that, although in some cases above the median of the universe presented for comparison, the total expense ratio of each class of the fund was reasonable in light of the services that the fund and its shareholders receive and the other factors considered.
Costs of the Services and Profitability. The Board considered the revenues earned and the expenses incurred by Fidelity in conducting the business of developing, marketing, distributing, managing, administering and servicing the fund and servicing the fund's shareholders. The Board also considered the level of Fidelity's profits in respect of all the Fidelity funds.
On an annual basis, Fidelity presents to the Board information about the profitability of its relationship with the fund. Fidelity calculates profitability information for each fund, as well as aggregate profitability information for groups of Fidelity funds and all Fidelity funds, using a series of detailed revenue and cost allocation methodologies which originate with the books and records of Fidelity on which Fidelity's audited financial statements are based. The Audit Committee of the Board reviews any significant changes from the prior year's methodologies.
PricewaterhouseCoopers LLP (PwC), independent registered public accounting firm and auditor to Fidelity and certain Fidelity funds, has been engaged annually by the Board as part of the Board's assessment of Fidelity's profitability analysis. PwC's engagement includes the review and assessment of the methodologies used by Fidelity in determining the revenues and expenses attributable to Fidelity's mutual fund business, and completion of agreed-upon procedures in respect of the mathematical accuracy of fund profitability and its conformity to established allocation methodologies. After considering PwC's reports issued under the engagement and information provided by Fidelity, the Board concluded that while other allocation methods may also be reasonable, Fidelity's profitability methodologies are reasonable in all material respects.
The Board also reviewed Fidelity's non-fund businesses and fall-out benefits related to the mutual fund business as well as cases where Fidelity's affiliates may benefit from or be related to the fund's business.
The Board considered the costs of the services provided by and the profits realized by Fidelity in connection with the operation of the fund and was satisfied that the profitability was not excessive.
Annual Report
Board Approval of Investment Advisory Contracts and
Management Fees - continued
Economies of Scale. The Board considered whether there have been economies of scale in respect of the management of the Fidelity funds, whether the Fidelity funds (including the fund) have appropriately benefited from any such economies of scale, and whether there is potential for realization of any further economies of scale. The Board considered the extent to which the fund will benefit from economies of scale as assets grow through increased services to the fund, through waivers or reimbursements, or through fee or expense ratio reductions. The Board also noted that in 2013, it and the boards of other Fidelity funds created an ad hoc committee (the Economies of Scale Committee) to analyze whether Fidelity attains economies of scale in respect of the management and servicing of the Fidelity funds, whether the Fidelity funds have appropriately benefited from such economies of scale, and whether there is potential for realization of any further economies of scale.
The Board recognized that the fund's management contract incorporates a "group fee" structure, which provides for lower group fee rates as total group assets increase, and for higher group fee rates as total group assets decrease (with "group assets" defined to include fund assets under FMR's management plus sector fund assets previously under FMR's management and currently managed by Fidelity SelectCo, LLC). FMR calculates the group fee rates based on a tiered asset "breakpoint" schedule that varies based on asset class. The Board considered that the group fee is designed to deliver the benefits of economies of scale to fund shareholders when total Fidelity fund assets increase, even if assets of any particular fund are unchanged or have declined, because some portion of Fidelity's costs are attributable to services provided to all Fidelity funds, and all funds benefit if those costs can be allocated among more assets. The Board concluded that, given the group fee structure, fund shareholders will benefit from lower management fees as group assets increase at the fund complex level, regardless of whether Fidelity achieves any such economies of scale.
The Board concluded, taking into account the analysis of the Economies of Scale Committee, that economies of scale, if any, are being appropriately shared between fund shareholders and Fidelity.
Additional Information Requested by the Board. In order to develop fully the factual basis for consideration of the Fidelity funds' Advisory Contracts, the Board requested and received additional information on certain topics, including: (i) fund performance trends and Fidelity's long-term strategies for certain funds; (ii) the various share classes employed by Fidelity and the attributes of each class, together with similar information on the distribution and servicing payments made by Fidelity or the funds to third-party participants in the distribution channels; (iii) fund profitability, and fund performance in relation to fund profitability; (iv) the methodology with respect to evaluating competitive fund data and peer group classifications and fee comparisons; (v) annual fund profitability margins, with particular focus on certain funds with negative margins; (vi) the realization of fall-out benefits in certain Fidelity business units; (vii) economies of scale and the way in which they are shared with fund shareholders; (viii) Fidelity's group fee structures, including the group fee schedule of breakpoints; (ix) the impact of cost containment measures on the funds; and (x) the transfer agent fee structure.
Annual Report
Based on its evaluation of all of the conclusions noted above, and after considering all factors it believed relevant, the Board concluded that the advisory fee structures are fair and reasonable, and that the fund's Advisory Contracts should be renewed.
Annual Report
Investment Adviser
Fidelity Management & Research Company
Boston, MA
Investment Sub-Advisers
FMR Co., Inc.
FMR Investment Management
(U.K.) Limited
FIL Investments (Japan) Limited
FIL Investment Advisors
FIL Investment Advisors
(UK) Limited
Fidelity Management & Research
(Hong Kong) Limited
Fidelity Management & Research
(Japan) Limited
General Distributor
Fidelity Distributors Corporation
Smithfield, RI
Transfer and Service Agents
Fidelity Investments Institutional
Operations Company, Inc.
Boston, MA
Fidelity Service Company, Inc.
Boston, MA
Custodian
State Street Bank & Trust Company
Quincy, MA
(Fidelity Investment logo)(registered trademark)
AEMEI-UANN-1215
1.861980.107
Fidelity®
Emerging Europe,
Middle East, Africa (EMEA)
Fund
Annual Report
October 31, 2015
(Fidelity Cover Art)
Contents
Performance | (Click Here) | How the fund has done over time. |
Management's Discussion of Fund Performance | (Click Here) | The Portfolio Manager's review of fund performance and strategy. |
Shareholder Expense Example | (Click Here) | An example of shareholder expenses. |
Investment Changes | (Click Here) | A summary of major shifts in the fund's investments over the past six months. |
Investments | (Click Here) | A complete list of the fund's investments with their market values. |
Financial Statements | (Click Here) | Statements of assets and liabilities, operations, and changes in net assets, as well as financial highlights. |
Notes | (Click Here) | Notes to the financial statements. |
Report of Independent Registered Public Accounting Firm | (Click Here) | |
Trustees and Officers | (Click Here) | |
Distributions | (Click Here) | |
Board Approval of Investment Advisory Contracts and Management Fees | (Click Here) | |
To view a fund's proxy voting guidelines and proxy voting record for the 12-month period ended June 30, visit http://www.fidelity.com/proxyvotingresults or visit the Securities and Exchange Commission's (SEC) web site at http://www.sec.gov. You may also call 1-800-544-8544 to request a free copy of the proxy voting guidelines.
Standard & Poor's, S&P and S&P 500 are registered service marks of The McGraw-Hill Companies, Inc. and have been licensed for use by Fidelity Distributors Corporation.
Other third-party marks appearing herein are the property of their respective owners.
All other marks appearing herein are registered or unregistered trademarks or service marks of FMR LLC or an affiliated company. © 2015 FMR LLC. All rights reserved.
Annual Report
This report and the financial statements contained herein are submitted for the general information of the shareholders of the fund. This report is not authorized for distribution to prospective investors in the fund unless preceded or accompanied by an effective prospectus.
A fund files its complete schedule of portfolio holdings with the SEC for the first and third quarters of each fiscal year on Form N-Q. Forms N-Q are available on the SEC's web site at http://www.sec.gov. A fund's Forms N-Q may be reviewed and copied at the SEC's Public Reference Room in Washington, DC. Information regarding the operation of the SEC's Public Reference Room may be obtained by calling 1-800-SEC-0330. For a complete list of a fund's portfolio holdings, view the most recent holdings listing, semiannual report, or annual report on Fidelity's web site at http://www.fidelity.com, http://www.advisor.fidelity.com, or http://www.401k.com, as applicable.
NOT FDIC INSURED • MAY LOSE VALUE • NO BANK GUARANTEE
Neither the fund nor Fidelity Distributors Corporation is a bank.
Annual Report
Average annual total return reflects the change in the value of an investment, assuming reinvestment of the class' distributions from dividend income and capital gains (the profits earned upon the sale of securities that have grown in value, if any) and assuming a constant rate of performance each year. The $10,000 table and the fund's returns do not reflect the deduction of taxes that a shareholder would pay on fund distributions or the redemption of fund shares. During periods of reimbursement by Fidelity, a fund's total return will be greater than it would be had the reimbursement not occurred. How a fund did yesterday is no guarantee of how it will do tomorrow.
Average Annual Total Returns
Periods ended October 31, 2015 | Past 1
year | Past 5
years | Life of
fund A |
Fidelity® Emerging Europe, Middle East, Africa (EMEA) Fund | -15.33% | -1.62% | -2.23% |
A From May 8, 2008.
$10,000 Over Life of Fund
Let's say hypothetically that $10,000 was invested in Fidelity® Emerging Europe, Middle East, Africa (EMEA) Fund, a class of the fund, on May 8, 2008, when the fund started. The chart shows how the value of your investment would have changed, and also shows how the MSCI EM (Emerging Markets) Europe, Middle East and Africa Index performed over the same period.
Annual Report
Market Recap: International equities suffered a moderate setback for the 12 months ending October 31, 2015, held back by a collapse in commodities prices that hurt resources-related sectors and geographies. The MSCI ACWI (All Country World Index) ex USA Index returned -4.55% for the period, affected also by concerns about global economic growth. Commodity producers remained under pressure for much of the past year, largely related to economic deceleration in China (-1%), the world's second-largest economy and a leading consumer of raw materials. This effect was exacerbated by U.S. dollar strength relative to global currencies, which weighed on commodities priced in dollars and acutely impacted equity returns within regions most exposed to resources prices. The emerging-markets group, for example, returned about -15% this period. Canada, a significant energy producer, returned roughly -17%. Net energy consumer Japan (+9%) was the best-performing region by far. Only about a quarter of the nearly 50 index countries managed a gain this period: Ireland (+19%) - the EU's fastest-growing economy - and Israel (+17%) proved top performers; Greece (-56%) and Brazil (-46%), among the worst. As for sectors, energy (-25%) and materials (-16%) declined sharply, whereas the two consumer sectors each gained about 6%.
Comments from Portfolio Manager Adam Kutas: For the year, the fund's share classes (excluding sales charges, if applicable) delivered double-digit negative results, but solidly outpaced the -18.36% return of the MSCI EM (Emerging Markets) Europe, Middle East and Africa Index. The past 12 months posed challenges for emerging EMEA markets, as the commodities collapse weighed heavily on commodity-rich nations, especially Russia. For the period, the fund derived most of its advantage versus the benchmark from stock selection. Our picks among banks had the biggest impact. Here, Romanian bank Banca Transilvania, a non-benchmark holding, performed well, as the Romanian economy began improving. Russia's government-owned Sberbank also helped. With the Russian economy under pressure as oil fell sharply in the fourth quarter of 2014, I was able to establish a position in Sberbank, making it one of the fund's largest overweightings by period end. The stock rose steadily through the end of October. Conversely, the fund's positioning in energy detracted. The fund's most significant detractor was untimely ownership of South African private equity investor Steinhoff International Holdings.
The views expressed above reflect those of the portfolio manager(s) only through the end of the period as stated on the cover of this report and do not necessarily represent the views of Fidelity or any other person in the Fidelity organization. Any such views are subject to change at any time based upon market or other conditions and Fidelity disclaims any responsibility to update such views. These views may not be relied on as investment advice and, because investment decisions for a Fidelity fund are based on numerous factors, may not be relied on as an indication of trading intent on behalf of any Fidelity fund.
Annual Report
Shareholder Expense Example
As a shareholder of the Fund, you incur two types of costs: (1) transaction costs, including sales charges (loads) on purchase payments or redemption proceeds, redemption fees and (2) ongoing costs, including management fees, distribution and/or service (12b-1) fees and other Fund expenses. This Example is intended to help you understand your ongoing costs (in dollars) of investing in the Fund and to compare these costs with the ongoing costs of investing in other mutual funds.
The Example is based on an investment of $1,000 invested at the beginning of the period and held for the entire period (May 1, 2015 to October 31, 2015).
Actual Expenses
The first line of the accompanying table for each class of the Fund provides information about actual account values and actual expenses. You may use the information in this line, together with the amount you invested, to estimate the expenses that you paid over the period. Simply divide your account value by $1,000.00 (for example, an $8,600 account value divided by $1,000.00 = 8.6), then multiply the result by the number in the first line for a class of the Fund under the heading entitled "Expenses Paid During Period" to estimate the expenses you paid on your account during this period. A small balance maintenance fee of $12.00 that is charged once a year may apply for certain accounts with a value of less than $2,000. This fee is not included in the table below. If it was, the estimate of expenses you paid during the period would be higher, and your ending account value lower, by this amount. In addition, the Fund, as a shareholder in the underlying Fidelity Central Funds, will indirectly bear its pro-rata share of the fees and expenses incurred by the underlying Fidelity Central Funds. These fees and expenses are not included in the Fund's annualized expense ratio used to calculate the expense estimate in the table below.
Hypothetical Example for Comparison Purposes
The second line of the accompanying table for each class of the Fund provides information about hypothetical account values and hypothetical expenses based on a Class' actual expense ratio and an assumed rate of return of 5% per year before expenses, which is not the Class' actual return. The hypothetical account values and expenses may not be used to estimate the actual ending account balance or expenses you paid for the period. You may use this information to compare the ongoing costs of investing in the Fund and other funds. To do so, compare this 5% hypothetical example with the 5% hypothetical examples that appear in the shareholder reports of the other funds. A small balance maintenance fee of $12.00 that is charged once a year may apply for certain accounts with a value of less than $2,000. This fee is not included in the table below. If it was, the estimate of expenses you paid during the period would be higher, and your ending account value lower, by this amount. In addition, the Fund, as a shareholder in the underlying Fidelity Central Funds, will indirectly bear its pro-rata share of the fees and expenses incurred by the underlying Fidelity Central Funds. These fees and expenses are not included in the Fund's annualized expense ratio used to calculate the expense estimate in the table below.
Please note that the expenses shown in the table are meant to highlight your ongoing costs only and do not reflect any transaction costs. Therefore, the second line of the table is useful in comparing ongoing costs only, and will not help you determine the relative total costs of owning different funds. In addition, if these transactional costs were included, your costs would have been higher.
Annual Report
Shareholder Expense Example - continued
| Annualized
Expense Ratio B | Beginning
Account Value
May 1, 2015 | Ending
Account Value
October 31, 2015 | Expenses Paid
During Period C
May 1, 2015
to October 31, 2015 |
Class A | 1.57% | | | |
Actual | | $ 1,000.00 | $ 847.30 | $ 7.31 |
HypotheticalA | | $ 1,000.00 | $ 1,017.29 | $ 7.98 |
Class T | 1.90% | | | |
Actual | | $ 1,000.00 | $ 845.50 | $ 8.84 |
HypotheticalA | | $ 1,000.00 | $ 1,015.63 | $ 9.65 |
Class B | 2.40% | | | |
Actual | | $ 1,000.00 | $ 843.60 | $ 11.15 |
HypotheticalA | | $ 1,000.00 | $ 1,013.11 | $ 12.18 |
Class C | 2.40% | | | |
Actual | | $ 1,000.00 | $ 844.60 | $ 11.16 |
HypotheticalA | | $ 1,000.00 | $ 1,013.11 | $ 12.18 |
Emerging Europe, Middle East, Africa (EMEA) | 1.36% | | | |
Actual | | $ 1,000.00 | $ 847.50 | $ 6.33 |
HypotheticalA | | $ 1,000.00 | $ 1,018.35 | $ 6.92 |
Class I | 1.19% | | | |
Actual | | $ 1,000.00 | $ 848.40 | $ 5.54 |
HypotheticalA | | $ 1,000.00 | $ 1,019.21 | $ 6.06 |
A 5% return per year before expenses
B Annualized expense ratio reflects expenses net of applicable fee waivers.
C Expenses are equal to each Class' annualized expense ratio, multiplied by the average account value over the period, multiplied by 184/365 (to reflect the one-half year period).
Annual Report
Investment Changes (Unaudited)
Asset Allocation as of October 31, 2015 |
| % of fund's
net assets | % of fund's net assets
6 months ago |
Stocks | 100.0 | 99.9 |
Short-Term Investments and Net Other Assets (Liabilities) | 0.0 | 0.1 |
Top Ten Stocks as of October 31, 2015 |
| % of fund's
net assets | % of fund's net assets
6 months ago |
Naspers Ltd. Class N (South Africa, Media) | 8.0 | 7.3 |
Sberbank of Russia (Russia, Banks) | 4.7 | 4.1 |
Lukoil PJSC (Russia, Oil, Gas & Consumable Fuels) | 3.9 | 5.5 |
Gazprom OAO (Russia, Oil, Gas & Consumable Fuels) | 3.7 | 4.9 |
MTN Group Ltd. (South Africa, Wireless Telecommunication Services) | 3.1 | 5.4 |
Remgro Ltd. (South Africa, Diversified Financial Services) | 2.6 | 2.4 |
FirstRand Ltd. (South Africa, Diversified Financial Services) | 2.6 | 2.9 |
Steinhoff International Holdings Ltd. (South Africa, Household Durables) | 2.4 | 0.1 |
Sasol Ltd. (South Africa, Oil, Gas & Consumable Fuels) | 2.2 | 2.4 |
Surgutneftegas OJSC (Russia, Oil, Gas & Consumable Fuels) | 2.1 | 1.7 |
| 35.3 | |
Market Sectors as of October 31, 2015 |
| % of fund's
net assets | % of fund's net assets
6 months ago |
Financials | 39.3 | 35.9 |
Consumer Discretionary | 18.0 | 16.3 |
Energy | 14.9 | 16.6 |
Consumer Staples | 11.8 | 9.3 |
Materials | 5.2 | 5.9 |
Telecommunication Services | 4.2 | 8.1 |
Health Care | 3.5 | 4.3 |
Industrials | 3.1 | 3.1 |
Information Technology | 0.0 | 0.4 |
Market Sectors may include more than one industry category. |
The fund may invest up to 35% of its total assets in any industry that represents more than 20% of the emerging Europe, Middle East and Africa markets. As of October 31, 2015, the fund did not have more than 25% of its total assets invested in any one industry. |
Percentages shown as 0.0% may reflect amounts less than 0.05%. |
Annual Report
Investments October 31, 2015
Showing Percentage of Net Assets
Common Stocks - 96.4% |
| Shares | | Value |
Austria - 2.6% |
CA Immobilien Anlagen AG | 39,100 | | $ 766,839 |
Erste Group Bank AG (a) | 29,100 | | 853,435 |
Wienerberger AG | 31,000 | | 571,505 |
TOTAL AUSTRIA | | 2,191,779 |
Bailiwick of Jersey - 0.5% |
Wizz Air Holdings PLC | 13,888 | | 405,715 |
Bermuda - 0.2% |
Aquarius Platinum Ltd. (a) | 937,700 | | 165,329 |
Botswana - 0.4% |
First National Bank of Botswana Ltd. | 964,358 | | 344,843 |
British Virgin Islands - 0.4% |
Lenta Ltd. GDR (a) | 49,000 | | 367,990 |
Croatia - 0.5% |
Ledo d.d. | 282 | | 388,137 |
Czech Republic - 1.3% |
Komercni Banka A/S | 5,049 | | 1,044,981 |
Estonia - 0.6% |
Tallinna Kaubamaja AS | 70,900 | | 498,977 |
Greece - 0.7% |
Jumbo SA | 26,536 | | 256,787 |
Sarantis SA | 37,800 | | 305,516 |
TOTAL GREECE | | 562,303 |
Hungary - 1.4% |
OTP Bank PLC | 62,000 | | 1,201,442 |
Israel - 0.6% |
Delta Galil Industries Ltd. | 5,500 | | 173,139 |
Osem Investment Ltd. | 13,800 | | 266,966 |
Rami Levi Chain Stores Hashikma Marketing 2006 Ltd. | 2,000 | | 94,078 |
TOTAL ISRAEL | | 534,183 |
Kenya - 0.9% |
British American Tobacco Kenya Ltd. | 31,700 | | 238,565 |
Kenya Commercial Bank Ltd. | 756,500 | | 298,375 |
Safaricom Ltd. | 1,516,544 | | 213,252 |
TOTAL KENYA | | 750,192 |
Lithuania - 0.6% |
Apranga AB (a) | 163,766 | | 466,421 |
Common Stocks - continued |
| Shares | | Value |
Luxembourg - 0.5% |
Pegas NONWOVENS SA | 13,700 | | $ 428,155 |
Malta - 0.7% |
Brait SA | 48,000 | | 550,861 |
Netherlands - 0.4% |
AmRest Holdings NV (a) | 6,600 | | 308,536 |
Nigeria - 0.7% |
Zenith Bank PLC | 6,384,656 | | 564,531 |
Pakistan - 0.7% |
Millat Tractors Ltd. | 45,000 | | 248,649 |
United Bank Ltd. | 190,000 | | 295,544 |
TOTAL PAKISTAN | | 544,193 |
Poland - 4.3% |
Bank Handlowy w Warszawie SA | 21,000 | | 427,624 |
Bank Polska Kasa Opieki SA | 19,500 | | 758,181 |
Inter Cars SA | 3,700 | | 226,537 |
Kruk SA | 10,000 | | 476,018 |
NG2 SA | 11,800 | | 516,051 |
Orbis SA | 50,200 | | 766,442 |
Quercus TFI SA | 250,000 | | 423,098 |
TOTAL POLAND | | 3,593,951 |
Qatar - 3.2% |
Al Meera Consumer Goods Co. (a) | 6,496 | | 418,285 |
Qatar Insurance Co. (a) | 22,691 | | 579,703 |
Qatar National Bank SAQ (a) | 32,850 | | 1,646,899 |
TOTAL QATAR | | 2,644,887 |
Romania - 4.4% |
Banca Transilvania SA (a) | 2,204,397 | | 1,385,897 |
BRD-Groupe Societe Generale (a) | 453,129 | | 1,314,834 |
Bursa de Valori Bucuresti | 73,404 | | 553,422 |
Fondul Propietatea SA GDR | 39,000 | | 401,700 |
TOTAL ROMANIA | | 3,655,853 |
Russia - 17.8% |
Gazprom OAO (a) | 1,463,600 | | 3,110,360 |
Lukoil PJSC (a) | 8,100 | | 294,372 |
Lukoil PJSC sponsored ADR | 81,195 | | 2,947,379 |
Magnit OJSC (a) | 8,592 | | 1,498,814 |
Megafon OJSC GDR | 60,800 | | 787,360 |
Moscow Exchange MICEX-RTS OAO (a) | 755,000 | | 1,062,529 |
Common Stocks - continued |
| Shares | | Value |
Russia - continued |
NOVATEK OAO (a) | 130,000 | | $ 1,189,881 |
Sberbank of Russia (a) | 2,760,970 | | 3,914,623 |
TOTAL RUSSIA | | 14,805,318 |
Slovenia - 0.6% |
Krka dd Novo mesto | 6,700 | | 478,898 |
South Africa - 39.5% |
AngloGold Ashanti Ltd. (a) | 106,400 | | 897,795 |
Aspen Pharmacare Holdings Ltd. | 43,300 | | 972,474 |
Cashbuild Ltd. | 18,300 | | 437,037 |
Clicks Group Ltd. | 137,552 | | 1,004,878 |
DRDGOLD Ltd. | 4,469,214 | | 724,152 |
FirstRand Ltd. | 586,600 | | 2,152,859 |
Holdsport Ltd. | 171,700 | | 782,259 |
Hulamin Ltd. | 996,200 | | 480,140 |
Liberty Holdings Ltd. | 51,400 | | 503,415 |
MTN Group Ltd. | 228,850 | | 2,605,369 |
Nampak Ltd. | 467,100 | | 757,067 |
Naspers Ltd. Class N | 45,500 | | 6,664,393 |
Netcare Ltd. | 310,000 | | 882,802 |
Peregrine Holdings Ltd. | 125,000 | | 278,109 |
Pioneer Foods Ltd. | 68,000 | | 975,359 |
PSG Konsult Ltd. | 96,618 | | 56,900 |
Remgro Ltd. | 109,800 | | 2,199,808 |
RMB Holdings Ltd. | 164,600 | | 802,602 |
Sasol Ltd. | 57,500 | | 1,842,397 |
Shoprite Holdings Ltd. | 120,100 | | 1,249,686 |
Spar Group Ltd. | 89,200 | | 1,281,634 |
Spur Corp. Ltd. | 85,000 | | 206,680 |
Standard Bank Group Ltd. | 169,763 | | 1,765,589 |
Steinhoff International Holdings Ltd. | 321,700 | | 1,969,160 |
Taste Holdings Ltd. | 900,000 | | 210,059 |
Truworths International Ltd. | 164,000 | | 1,110,991 |
TOTAL SOUTH AFRICA | | 32,813,614 |
Turkey - 4.3% |
Aselsan A/S | 105,000 | | 502,418 |
Gubre Fabrikalari TAS | 338,000 | | 764,019 |
Koc Holding A/S | 188,850 | | 852,918 |
Soda Sanayii AS | 283,622 | | 468,909 |
Common Stocks - continued |
| Shares | | Value |
Turkey - continued |
Turk Tuborg Bira ve Malt Sanayii A/S (a) | 80,000 | | $ 172,052 |
Turkiye Garanti Bankasi A/S | 321,000 | | 831,207 |
TOTAL TURKEY | | 3,591,523 |
United Arab Emirates - 5.2% |
Agthia Group PJSC | 340,000 | | 708,140 |
Aldar Properties PJSC (a) | 1,109,585 | | 688,770 |
Dubai Islamic Bank Pakistan Ltd. (a) | 425,219 | | 749,024 |
Emaar Malls Group PJSC (a) | 590,000 | | 502,777 |
First Gulf Bank PJSC | 286,313 | | 962,691 |
SHUAA Capital PSC (a) | 5,249,942 | | 721,813 |
TOTAL UNITED ARAB EMIRATES | | 4,333,215 |
United Kingdom - 3.4% |
Abdullah Al Othaim Markets Co. ELS (HSBC Warrant Program) warrants 7/31/17 (a)(b) | 17,836 | | 439,944 |
Al Noor Hospitals Group PLC | 11,100 | | 201,234 |
Alabama Khaleej Training & Education ELS (HSBC Bank Warrant Program) warrants 7/18/16 (a)(b) | 37,010 | | 424,719 |
NMC Health PLC | 23,900 | | 280,753 |
Saudi Dairy & Foodstuff Co. ELS (HSBC Warrant Program) warrants 6/4/18 (b) | 14,000 | | 496,467 |
Savola Group ELS (HSBC Warrant Program) warrants 2/6/17 (b) | 39,200 | | 549,040 |
United International Transportation Co. ELS (HSBC Warrant Program) warrants 7/31/17 (b) | 33,634 | | 439,426 |
TOTAL UNITED KINGDOM | | 2,831,583 |
TOTAL COMMON STOCKS (Cost $77,454,944) |
80,067,410
|
Nonconvertible Preferred Stocks - 3.6% |
| Shares | | Value |
Russia - 3.6% |
Surgutneftegas OJSC (a) | 2,598,600 | | $ 1,771,368 |
Tatneft OAO (a) | 433,800 | | 1,229,284 |
TOTAL NONCONVERTIBLE PREFERRED STOCKS (Cost $2,739,936) |
3,000,652
|
TOTAL INVESTMENT PORTFOLIO - 100.0% (Cost $80,194,880) | | 83,068,062 |
NET OTHER ASSETS (LIABILITIES) - 0.0% | | 7,373 |
NET ASSETS - 100% | $ 83,075,435 |
Security Type Abbreviations |
ELS | - | Equity-Linked Security |
Legend |
(a) Non-income producing |
(b) Security exempt from registration under Rule 144A of the Securities Act of 1933. These securities may be resold in transactions exempt from registration, normally to qualified institutional buyers. At the end of the period, the value of these securities amounted to $2,349,596 or 2.8% of net assets. |
Affiliated Central Funds |
Information regarding fiscal year to date income earned by the Fund from investments in Fidelity Central Funds is as follows: |
Fund | Income earned |
Fidelity Cash Central Fund | $ 1,100 |
Fidelity Securities Lending Cash Central Fund | 999 |
Total | $ 2,099 |
Other Information |
Categorizations in the Schedule of Investments are based on country or territory of incorporation. |
The following is a summary of the inputs used, as of October 31, 2015, involving the Fund's assets and liabilities carried at fair value. The inputs or methodology used for valuing securities may not be an indication of the risk associated with investing in those securities. For more information on valuation inputs, and their aggregation into the levels used in the tables below, please refer to the Investment Valuation section in the accompanying Notes to Financial Statements. |
Valuation Inputs at Reporting Date: |
Description | Total | Level 1 | Level 2 | Level 3 |
Investments in Securities: | | | | |
Equities: | | | | |
Consumer Discretionary | $ 14,947,366 | $ 14,522,647 | $ 424,719 | $ - |
Consumer Staples | 9,909,021 | 9,469,077 | 439,944 | - |
Energy | 12,385,041 | 5,660,916 | 6,724,125 | - |
Financials | 32,565,876 | 26,335,113 | 6,230,763 | - |
Health Care | 2,816,161 | 2,816,161 | - | - |
Industrials | 2,581,205 | 1,728,287 | 852,918 | - |
Materials | 4,257,411 | 2,635,464 | 1,621,947 | - |
Telecommunication Services | 3,605,981 | 1,000,612 | 2,605,369 | - |
Total Investments in Securities: | $ 83,068,062 | $ 64,168,277 | $ 18,899,785 | $ - |
The following is a summary of transfers between Level 1 and Level 2 for the period ended October 31, 2015. Transfers are assumed to have occurred at the beginning of the period, and are primarily attributable to the valuation techniques used for foreign equity securities, as discussed in the accompanying Notes to Financial Statements: |
Transfers | Total |
Level 1 to Level 2 | $ 10,300,566 |
Level 2 to Level 1 | $ 0 |
Valuation Inputs at Reporting Date: |
The following is a reconciliation of Investments in Securities for which Level 3 inputs were used in determining value: |
Investments in Securities: | |
Consumer Discretionary | |
Beginning Balance | $ 1,010,924 |
Net Realized Gain (Loss) on Investment Securities | 3,818 |
Net Unrealized Gain (Loss) on Investment Securities | (167,185) |
Cost of Purchases | - |
Proceeds of Sales | (847,557) |
Amortization/Accretion | - |
Transfers into Level 3 | - |
Transfers out of Level 3 | - |
Ending Balance | $ - |
The change in unrealized gain (loss) for the period attributable to Level 3 securities held at October 31, 2015 | $ - |
The information used in the above reconciliation represents fiscal year to date activity for any Investments in Securities identified as using Level 3 inputs at either the beginning or the end of the current fiscal period. Transfers in or out of Level 3 represent the beginning value of any Security or Instrument where a change in the pricing level occurred from the beginning to the end of the period. The cost of purchases and the proceeds of sales may include securities received or delivered through corporate actions or exchanges. Realized and unrealized gains (losses) disclosed in the reconciliation are included in Net Gain (Loss) on the Fund's Statement of Operations. |
See accompanying notes which are an integral part of the financial statements.
Annual Report
Statement of Assets and Liabilities
| | October 31, 2015 |
| | |
Assets | | |
Investment in securities, at value - See accompanying schedule: Unaffiliated issuers (cost $80,194,880) | | $ 83,068,062 |
Cash | | 33,662 |
Foreign currency held at value (cost $14,630) | | 14,728 |
Receivable for investments sold | | 436,674 |
Receivable for fund shares sold | | 73,284 |
Dividends receivable | | 34,799 |
Distributions receivable from Fidelity Central Funds | | 243 |
Prepaid expenses | | 257 |
Other receivables | | 381 |
Total assets | | 83,662,090 |
| | |
Liabilities | | |
Payable for investments purchased | $ 223,400 | |
Payable for fund shares redeemed | 153,637 | |
Accrued management fee | 56,683 | |
Distribution and service plan fees payable | 5,768 | |
Other affiliated payables | 23,539 | |
Other payables and accrued expenses | 123,628 | |
Total liabilities | | 586,655 |
| | |
Net Assets | | $ 83,075,435 |
Net Assets consist of: | | |
Paid in capital | | $ 96,799,934 |
Undistributed net investment income | | 1,236,658 |
Accumulated undistributed net realized gain (loss) on investments and foreign currency transactions | | (17,821,503) |
Net unrealized appreciation (depreciation) on investments and assets and liabilities in foreign currencies | | 2,860,346 |
Net Assets | | $ 83,075,435 |
See accompanying notes which are an integral part of the financial statements.
Annual Report
Financial Statements - continued
Statement of Assets and Liabilities - continued
| | October 31, 2015 |
Calculation of Maximum Offering Price | | |
Class A:
Net Asset Value and redemption price per share ($5,788,153 ÷ 773,249 shares) | | $ 7.49 |
| | |
Maximum offering price per share (100/94.25 of $7.49) | | $ 7.95 |
Class T:
Net Asset Value and redemption price per share ($2,002,928 ÷ 269,128 shares) | | $ 7.44 |
| | |
Maximum offering price per share (100/96.50 of $7.44) | | $ 7.71 |
Class B:
Net Asset Value and offering price per share ($180,830 ÷ 24,112 shares)A | | $ 7.50 |
| | |
Class C:
Net Asset Value and offering price per share ($4,104,439 ÷ 555,749 shares)A | | $ 7.39 |
| | |
Emerging Europe, Middle East, Africa (EMEA):
Net Asset Value, offering price and redemption price per share ($67,521,348 ÷ 8,999,614 shares) | | $ 7.50 |
| | |
Class I:
Net Asset Value, offering price and redemption price per share ($3,477,737 ÷ 463,553 shares) | | $ 7.50 |
A Redemption price per share is equal to net asset value less any applicable contingent deferred sales charge.
See accompanying notes which are an integral part of the financial statements.
Annual Report
Statement of Operations
| Year ended October 31, 2015 |
| | |
Investment Income | | |
Dividends | | $ 3,458,483 |
Income from Fidelity Central Funds | | 2,099 |
Income before foreign taxes withheld | | 3,460,582 |
Less foreign taxes withheld | | (395,582) |
Total income | | 3,065,000 |
| | |
Expenses | | |
Management fee | $ 788,345 | |
Transfer agent fees | 274,869 | |
Distribution and service plan fees | 85,027 | |
Accounting and security lending fees | 51,130 | |
Custodian fees and expenses | 104,573 | |
Independent trustees' compensation | 432 | |
Registration fees | 73,266 | |
Audit | 64,345 | |
Legal | 280 | |
Miscellaneous | 945 | |
Total expenses before reductions | 1,443,212 | |
Expense reductions | (11,325) | 1,431,887 |
Net investment income (loss) | | 1,633,113 |
Realized and Unrealized Gain (Loss) | | |
Net realized gain (loss) on: | | |
Investment securities: | | |
Unaffiliated issuers (net of foreign taxes of $141,196) | (10,743,685) | |
Foreign currency transactions | (36,996) | |
Total net realized gain (loss) | | (10,780,681) |
Change in net unrealized appreciation (depreciation) on: Investment securities (net of decrease in deferred foreign taxes of $49,419) | (7,779,317) | |
Assets and liabilities in foreign currencies | 361 | |
Total change in net unrealized appreciation (depreciation) | | (7,778,956) |
Net gain (loss) | | (18,559,637) |
Net increase (decrease) in net assets resulting from operations | | $ (16,926,524) |
See accompanying notes which are an integral part of the financial statements.
Annual Report
Financial Statements - continued
Statement of Changes in Net Assets
| Year ended
October 31,
2015 | Year ended
October 31,
2014 |
Increase (Decrease) in Net Assets | | |
Operations | | |
Net investment income (loss) | $ 1,633,113 | $ 2,097,602 |
Net realized gain (loss) | (10,780,681) | (4,234,408) |
Change in net unrealized appreciation (depreciation) | (7,778,956) | (2,810,920) |
Net increase (decrease) in net assets resulting from operations | (16,926,524) | (4,947,726) |
Distributions to shareholders from net investment income | (2,091,570) | (1,921,556) |
Distributions to shareholders from net realized gain | (504,771) | - |
Total distributions | (2,596,341) | (1,921,556) |
Share transactions - net increase (decrease) | (17,106,646) | (15,497,892) |
Redemption fees | 15,219 | 42,040 |
Total increase (decrease) in net assets | (36,614,292) | (22,325,134) |
| | |
Net Assets | | |
Beginning of period | 119,689,727 | 142,014,861 |
End of period (including undistributed net investment income of $1,236,658 and undistributed net investment income of $1,899,047, respectively) | $ 83,075,435 | $ 119,689,727 |
See accompanying notes which are an integral part of the financial statements.
Annual Report
Financial Highlights - Fidelity Emerging Europe, Middle East, Africa (EMEA) Fund Class A
Years ended October 31, | 2015 | 2014 | 2013 | 2012 | 2011 |
Selected Per-Share Data | | | | | |
Net asset value, beginning of period | $ 9.04 | $ 9.49 | $ 8.71 | $ 8.34 | $ 8.97 |
Income from Investment Operations | | | | | |
Net investment income (loss) C | .12 | .13 | .16 | .18 | .16F |
Net realized and unrealized gain (loss) | (1.50) | (.46) | .85 | .34 | (.70) |
Total from investment operations | (1.38) | (.33) | 1.01 | .52 | (.54) |
Distributions from net investment income | (.14) | (.12) | (.15) | (.15) | (.08) |
Distributions from net realized gain | (.04) | - | (.07) | - | (.02) |
Total distributions | (.17) J | (.12) | (.23) I | (.15) | (.10) |
Redemption fees added to paid in capitalC | -H | -H | -H | -H | .01 |
Net asset value, end of period | $ 7.49 | $ 9.04 | $ 9.49 | $ 8.71 | $ 8.34 |
Total ReturnA, B | (15.42)% | (3.48)% | 11.75% | 6.38% | (6.05)% |
Ratios to Average Net AssetsD, G | | | | | |
Expenses before reductions | 1.61% | 1.60% | 1.64% | 1.62% | 1.60% |
Expenses net of fee waivers, if any | 1.61% | 1.60% | 1.63% | 1.62% | 1.56% |
Expenses net of all reductions | 1.60% | 1.60% | 1.62% | 1.60% | 1.51% |
Net investment income (loss) | 1.51% | 1.45% | 1.82% | 2.09% | 1.70%F |
Supplemental Data | | | | | |
Net assets, end of period (000 omitted) | $ 5,788 | $ 7,889 | $ 10,883 | $ 8,934 | $ 10,260 |
Portfolio turnover rateE | 50% | 38% | 64% | 30% | 53% |
A Total returns would have been lower if certain expenses had not been reduced during the applicable periods shown.
B Total returns do not include the effect of the sales charges.
C Calculated based on average shares outstanding during the period.
D Fees and expenses of any underlying Fidelity Central Funds are not included in the Fund's expense ratio. The Fund indirectly bears its proportionate share of the expenses of any underlying Fidelity Central Funds.
E Amount does not include the portfolio activity of any underlying Fidelity Central Funds.
F Investment income per share reflects a large, non-recurring dividend which amounted to $.04 per share. Excluding this non-recurring dividend, the ratio of net investment income (loss) to average net assets would have been 1.25%.
G Expense ratios reflect operating expenses of the class. Expenses before reductions do not reflect amounts reimbursed by the investment adviser or reductions from brokerage service arrangements or reductions from other expense offset arrangements and do not represent the amount paid by the class during periods when reimbursements or reductions occur. Expenses net of fee waivers reflect expenses after reimbursement by the investment adviser but prior to reductions from brokerage service arrangements or other expense offset arrangements. Expenses net of all reductions represent the net expenses paid by the class.
H Amount represents less than $.005 per share.
I Total distributions of $.23 per share is comprised of distributions from net investment income of $.151 and distributions from net realized gain of $.074 per share.
J Total distributions of $.17 per share is comprised of distributions from net investment income of $.135 and distributions from net realized gain of $.039 per share.
See accompanying notes which are an integral part of the financial statements.
Annual Report
Financial Highlights - Fidelity Emerging Europe, Middle East, Africa (EMEA) Fund Class T
Years ended October 31, | 2015 | 2014 | 2013 | 2012 | 2011 |
Selected Per-Share Data | | | | | |
Net asset value, beginning of period | $ 9.01 | $ 9.46 | $ 8.68 | $ 8.31 | $ 8.96 |
Income from Investment Operations | | | | | |
Net investment income (loss) C | .10 | .11 | .14 | .15 | .13F |
Net realized and unrealized gain (loss) | (1.51) | (.46) | .84 | .35 | (.71) |
Total from investment operations | (1.41) | (.35) | .98 | .50 | (.58) |
Distributions from net investment income | (.13) | (.10) | (.12) | (.13) | (.07) |
Distributions from net realized gain | (.04) | - | (.07) | - | (.02) |
Total distributions | (.16) K | (.10) | (.20) J | (.13) | (.08) I |
Redemption fees added to paid in capitalC | -H | -H | -H | -H | .01 |
Net asset value, end of period | $ 7.44 | $ 9.01 | $ 9.46 | $ 8.68 | $ 8.31 |
Total ReturnA, B | (15.80)% | (3.67)% | 11.42% | 6.14% | (6.42)% |
Ratios to Average Net AssetsD, G | | | | | |
Expenses before reductions | 1.92% | 1.92% | 1.93% | 1.89% | 1.87% |
Expenses net of fee waivers, if any | 1.90% | 1.90% | 1.90% | 1.89% | 1.84% |
Expenses net of all reductions | 1.89% | 1.90% | 1.88% | 1.86% | 1.78% |
Net investment income (loss) | 1.22% | 1.15% | 1.55% | 1.82% | 1.42%F |
Supplemental Data | | | | | |
Net assets, end of period (000 omitted) | $ 2,003 | $ 2,465 | $ 3,465 | $ 3,336 | $ 3,502 |
Portfolio turnover rateE | 50% | 38% | 64% | 30% | 53% |
A Total returns would have been lower if certain expenses had not been reduced during the applicable periods shown.
B Total returns do not include the effect of the sales charges.
C Calculated based on average shares outstanding during the period.
D Fees and expenses of any underlying Fidelity Central Funds are not included in the Fund's expense ratio. The Fund indirectly bears its proportionate share of the expenses of any underlying Fidelity Central Funds.
E Amount does not include the portfolio activity of any underlying Fidelity Central Funds.
F Investment income per share reflects a large, non-recurring dividend which amounted to $.04 per share. Excluding this non-recurring dividend, the ratio of net investment income (loss) to average net assets would have been .98%.
G Expense ratios reflect operating expenses of the class. Expenses before reductions do not reflect amounts reimbursed by the investment adviser or reductions from brokerage service arrangements or reductions from other expense offset arrangements and do not represent the amount paid by the class during periods when reimbursements or reductions occur. Expenses net of fee waivers reflect expenses after reimbursement by the investment adviser but prior to reductions from brokerage service arrangements or other expense offset arrangements. Expenses net of all reductions represent the net expenses paid by the class.
H Amount represents less than $.005 per share.
I Total distributions of $.08 per share is comprised of distributions from net investment income of $.068 and distributions from net realized gain of $.015 per share.
J Total distributions of $.20 per share is comprised of distributions from net investment income of $.122 and distributions from net realized gain of $.074 per share.
K Total distributions of $.16 per share is comprised of distributions from net investment income of $.125 and distributions from net realized gain of $.039 per share.
See accompanying notes which are an integral part of the financial statements.
Annual Report
Financial Highlights - Fidelity Emerging Europe, Middle East, Africa (EMEA) Fund Class B
Years ended October 31, | 2015 | 2014 | 2013 | 2012 | 2011 |
Selected Per-Share Data | | | | | |
Net asset value, beginning of period | $ 9.05 | $ 9.50 | $ 8.69 | $ 8.29 | $ 8.93 |
Income from Investment Operations | | | | | |
Net investment income (loss) C | .06 | .06 | .09 | .11 | .09F |
Net realized and unrealized gain (loss) | (1.51) | (.46) | .85 | .35 | (.71) |
Total from investment operations | (1.45) | (.40) | .94 | .46 | (.62) |
Distributions from net investment income | (.06) | (.05) | (.06) | (.06) | (.02) |
Distributions from net realized gain | (.04) | - | (.07) | - | (.01) |
Total distributions | (.10) | (.05) | (.13) | (.06) | (.03) |
Redemption fees added to paid in capitalC | -H | -H | -H | -H | .01 |
Net asset value, end of period | $ 7.50 | $ 9.05 | $ 9.50 | $ 8.69 | $ 8.29 |
Total ReturnA, B | (16.16)% | (4.23)% | 10.94% | 5.56% | (6.85)% |
Ratios to Average Net AssetsD, G | | | | | |
Expenses before reductions | 2.41% | 2.40% | 2.42% | 2.38% | 2.37% |
Expenses net of fee waivers, if any | 2.40% | 2.40% | 2.40% | 2.38% | 2.33% |
Expenses net of all reductions | 2.39% | 2.40% | 2.38% | 2.35% | 2.27% |
Net investment income (loss) | .72% | .65% | 1.05% | 1.33% | .93%F |
Supplemental Data | | | | | |
Net assets, end of period (000 omitted) | $ 181 | $ 294 | $ 388 | $ 441 | $ 539 |
Portfolio turnover rateE | 50% | 38% | 64% | 30% | 53% |
A Total returns would have been lower if certain expenses had not been reduced during the applicable periods shown.
B Total returns do not include the effect of the contingent deferred sales charge.
C Calculated based on average shares outstanding during the period.
D Fees and expenses of any underlying Fidelity Central Funds are not included in the Fund's expense ratio. The Fund indirectly bears its proportionate share of the expenses of any underlying Fidelity Central Funds.
E Amount does not include the portfolio activity of any underlying Fidelity Central Funds.
F Investment income per share reflects a large, non-recurring dividend which amounted to $.04 per share. Excluding this non-recurring dividend, the ratio of net investment income (loss) to average net assets would have been .49%.
G Expense ratios reflect operating expenses of the class. Expenses before reductions do not reflect amounts reimbursed by the investment adviser or reductions from brokerage service arrangements or reductions from other expense offset arrangements and do not represent the amount paid by the class during periods when reimbursements or reductions occur. Expenses net of fee waivers reflect expenses after reimbursement by the investment adviser but prior to reductions from brokerage service arrangements or other expense offset arrangements. Expenses net of all reductions represent the net expenses paid by the class.
H Amount represents less than $.005 per share.
See accompanying notes which are an integral part of the financial statements.
Annual Report
Financial Highlights - Fidelity Emerging Europe, Middle East, Africa (EMEA) Fund Class C
Years ended October 31, | 2015 | 2014 | 2013 | 2012 | 2011 |
Selected Per-Share Data | | | | | |
Net asset value, beginning of period | $ 8.93 | $ 9.39 | $ 8.62 | $ 8.24 | $ 8.90 |
Income from Investment Operations | | | | | |
Net investment income (loss) C | .06 | .06 | .09 | .11 | .08F |
Net realized and unrealized gain (loss) | (1.48) | (.46) | .83 | .35 | (.69) |
Total from investment operations | (1.42) | (.40) | .92 | .46 | (.61) |
Distributions from net investment income | (.08) | (.06) | (.08) | (.08) | (.05) |
Distributions from net realized gain | (.04) | - | (.07) | - | (.02) |
Total distributions | (.12) | (.06) | (.15) | (.08) | (.06) I |
Redemption fees added to paid in capitalC | -H | -H | -H | -H | .01 |
Net asset value, end of period | $ 7.39 | $ 8.93 | $ 9.39 | $ 8.62 | $ 8.24 |
Total ReturnA, B | (16.08)% | (4.24)% | 10.83% | 5.68% | (6.79)% |
Ratios to Average Net AssetsD, G | | | | | |
Expenses before reductions | 2.41% | 2.40% | 2.42% | 2.37% | 2.36% |
Expenses net of fee waivers, if any | 2.40% | 2.40% | 2.40% | 2.37% | 2.33% |
Expenses net of all reductions | 2.39% | 2.40% | 2.38% | 2.35% | 2.27% |
Net investment income (loss) | .72% | .65% | 1.05% | 1.34% | .93%F |
Supplemental Data | | | | | |
Net assets, end of period (000 omitted) | $ 4,104 | $ 6,662 | $ 6,782 | $ 7,770 | $ 6,650 |
Portfolio turnover rateE | 50% | 38% | 64% | 30% | 53% |
A Total returns would have been lower if certain expenses had not been reduced during the applicable periods shown.
B Total returns do not include the effect of the contingent deferred sales charge.
C Calculated based on average shares outstanding during the period.
D Fees and expenses of any underlying Fidelity Central Funds are not included in the Fund's expense ratio. The Fund indirectly bears its proportionate share of the expenses of any underlying Fidelity Central Funds.
E Amount does not include the portfolio activity of any underlying Fidelity Central Funds.
F Investment income per share reflects a large, non-recurring dividend which amounted to $.04 per share. Excluding this non-recurring dividend, the ratio of net investment income (loss) to average net assets would have been .49%.
G Expense ratios reflect operating expenses of the class. Expenses before reductions do not reflect amounts reimbursed by the investment adviser or reductions from brokerage service arrangements or reductions from other expense offset arrangements and do not represent the amount paid by the class during periods when reimbursements or reductions occur. Expenses net of fee waivers reflect expenses after reimbursement by the investment adviser but prior to reductions from brokerage service arrangements or other expense offset arrangements. Expenses net of all reductions represent the net expenses paid by the class.
H Amount represents less than $.005 per share.
I Total distributions of $.06 per share is comprised of distributions from net investment income of $.047 and distributions from net realized gain of $.015 per share.
See accompanying notes which are an integral part of the financial statements.
Annual Report
Financial Highlights - Fidelity Emerging Europe, Middle East, Africa (EMEA) Fund
Years ended October 31, | 2015 | 2014 | 2013 | 2012 | 2011 |
Selected Per-Share Data | | | | | |
Net asset value, beginning of period | $ 9.08 | $ 9.52 | $ 8.75 | $ 8.37 | $ 9.00 |
Income from Investment Operations | | | | | |
Net investment income (loss) B | .14 | .16 | .18 | .20 | .18E |
Net realized and unrealized gain (loss) | (1.51) | (.47) | .84 | .35 | (.71) |
Total from investment operations | (1.37) | (.31) | 1.02 | .55 | (.53) |
Distributions from net investment income | (.17) | (.13) | (.18) | (.17) | (.09) |
Distributions from net realized gain | (.04) | - | (.07) | - | (.02) |
Total distributions | (.21) | (.13) | (.25) | (.17) | (.11) |
Redemption fees added to paid in capitalB | -G | -G | -G | -G | .01 |
Net asset value, end of period | $ 7.50 | $ 9.08 | $ 9.52 | $ 8.75 | $ 8.37 |
Total ReturnA | (15.33)% | (3.21)% | 11.90% | 6.81% | (5.91)% |
Ratios to Average Net AssetsC, F | | | | | |
Expenses before reductions | 1.39% | 1.37% | 1.40% | 1.37% | 1.35% |
Expenses net of fee waivers, if any | 1.38% | 1.37% | 1.40% | 1.37% | 1.31% |
Expenses net of all reductions | 1.38% | 1.37% | 1.38% | 1.34% | 1.25% |
Net investment income (loss) | 1.74% | 1.68% | 2.05% | 2.34% | 1.95%E |
Supplemental Data | | | | | |
Net assets, end of period (000 omitted) | $ 67,521 | $ 96,784 | $ 110,265 | $ 111,441 | $ 114,117 |
Portfolio turnover rateD | 50% | 38% | 64% | 30% | 53% |
A Total returns would have been lower if certain expenses had not been reduced during the applicable periods shown.
B Calculated based on average shares outstanding during the period.
C Fees and expenses of any underlying Fidelity Central Funds are not included in the Fund's expense ratio. The Fund indirectly bears its proportionate share of the expenses of any underlying Fidelity Central Funds.
D Amount does not include the portfolio activity of any underlying Fidelity Central Funds.
E Investment income per share reflects a large, non-recurring dividend which amounted to $.04 per share. Excluding this non-recurring dividend, the ratio of net investment income (loss) to average net assets would have been 1.51%.
F Expense ratios reflect operating expenses of the class. Expenses before reductions do not reflect amounts reimbursed by the investment adviser or reductions from brokerage service arrangements or reductions from other expense offset arrangements and do not represent the amount paid by the class during periods when reimbursements or reductions occur. Expenses net of fee waivers reflect expenses after reimbursement by the investment adviser but prior to reductions from brokerage service arrangements or other expense offset arrangements. Expenses net of all reductions represent the net expenses paid by the class.
G Amount represents less than $.005 per share.
See accompanying notes which are an integral part of the financial statements.
Annual Report
Financial Highlights - Fidelity Emerging Europe, Middle East, Africa (EMEA) Fund Class I
Years ended October 31, | 2015 | 2014 | 2013 | 2012 | 2011 |
Selected Per-Share Data | | | | | |
Net asset value, beginning of period | $ 9.08 | $ 9.52 | $ 8.75 | $ 8.37 | $ 9.00 |
Income from Investment Operations | | | | | |
Net investment income (loss) B | .15 | .16 | .19 | .21 | .19E |
Net realized and unrealized gain (loss) | (1.51) | (.46) | .84 | .35 | (.72) |
Total from investment operations | (1.36) | (.30) | 1.03 | .56 | (.53) |
Distributions from net investment income | (.18) | (.14) | (.19) | (.18) | (.09) |
Distributions from net realized gain | (.04) | - | (.07) | - | (.02) |
Total distributions | (.22) | (.14) | (.26) | (.18) | (.11) |
Redemption fees added to paid in capitalB | -G | -G | -G | -G | .01 |
Net asset value, end of period | $ 7.50 | $ 9.08 | $ 9.52 | $ 8.75 | $ 8.37 |
Total ReturnA | (15.23)% | (3.09)% | 12.05% | 6.93% | (5.91)% |
Ratios to Average Net AssetsC, F | | | | | |
Expenses before reductions | 1.25% | 1.26% | 1.30% | 1.28% | 1.26% |
Expenses net of fee waivers, if any | 1.25% | 1.26% | 1.30% | 1.28% | 1.24% |
Expenses net of all reductions | 1.24% | 1.26% | 1.28% | 1.25% | 1.19% |
Net investment income (loss) | 1.88% | 1.79% | 2.15% | 2.43% | 2.02%E |
Supplemental Data | | | | | |
Net assets, end of period (000 omitted) | $ 3,478 | $ 5,596 | $ 10,231 | $ 8,586 | $ 7,633 |
Portfolio turnover rateD | 50% | 38% | 64% | 30% | 53% |
A Total returns would have been lower if certain expenses had not been reduced during the applicable periods shown.
B Calculated based on average shares outstanding during the period.
C Fees and expenses of any underlying Fidelity Central Funds are not included in the Fund's expense ratio. The Fund indirectly bears its proportionate share of the expenses of any underlying Fidelity Central Funds.
D Amount does not include the portfolio activity of any underlying Fidelity Central Funds.
E Investment income per share reflects a large, non-recurring dividend which amounted to $.04 per share. Excluding this non-recurring dividend, the ratio of net investment income (loss) to average net assets would have been 1.58%.
F Expense ratios reflect operating expenses of the class. Expenses before reductions do not reflect amounts reimbursed by the investment adviser or reductions from brokerage service arrangements or reductions from other expense offset arrangements and do not represent the amount paid by the class during periods when reimbursements or reductions occur. Expenses net of fee waivers reflect expenses after reimbursement by the investment adviser but prior to reductions from brokerage service arrangements or other expense offset arrangements. Expenses net of all reductions represent the net expenses paid by the class.
G Amount represents less than $.005 per share.
See accompanying notes which are an integral part of the financial statements.
Annual Report
For the period ended October 31, 2015
1. Organization.
Fidelity Emerging Europe, Middle East, Africa (EMEA) Fund (the Fund) is a non-diversified fund of Fidelity Investment Trust (the Trust) and is authorized to issue an unlimited number of shares. The Trust is registered under the Investment Company Act of 1940, as amended (the 1940 Act), as an open-end management investment company organized as a Massachusetts business trust. The Fund offers Class A, Class T, Class C, Emerging Europe, Middle East, Africa (EMEA) and Class I (formerly Institutional Class) shares, each of which, along with Class B shares, has equal rights as to assets and voting privileges. Class B shares are closed to new accounts and additional purchases, except for exchanges and reinvestments. Each class has exclusive voting rights with respect to matters that affect that class. Class B shares will automatically convert to Class A shares after a holding period of seven years from the initial date of purchase. The Fund's investments in emerging markets can be subject to social, economic, regulatory, and political uncertainties and can be extremely volatile.
2. Investments in Fidelity Central Funds.
The Fund invests in Fidelity Central Funds, which are open-end investment companies generally available only to other investment companies and accounts managed by the investment adviser and its affiliates. The Fund's Schedule of Investments lists each of the Fidelity Central Funds held as of period end, if any, as an investment of the Fund, but does not include the underlying holdings of each Fidelity Central Fund. As an Investing Fund, the Fund indirectly bears its proportionate share of the expenses of the underlying Fidelity Central Funds.
The Money Market Central Funds seek preservation of capital and current income and are managed by Fidelity Investments Money Management, Inc. (FIMM), an affiliate of the investment adviser. Annualized expenses of the Money Market Central Funds as of their most recent shareholder report date are less than .005%.
A complete unaudited list of holdings for each Fidelity Central Fund is available upon request or at the Securities and Exchange Commission (the SEC) website at www.sec.gov. In addition, the financial statements of the Fidelity Central Funds, which are not covered by the Fund's Report of Independent Registered Public Accounting Firm, are available on the SEC website or upon request.
3. Significant Accounting Policies.
The financial statements have been prepared in conformity with accounting principles generally accepted in the United States of America (GAAP), which require management to make certain estimates and assumptions at the date of the financial statements. Actual results could differ from those estimates. Subsequent events, if any, through the date that the financial statements were issued have been evaluated in the preparation of
Annual Report
3. Significant Accounting Policies - continued
the financial statements. The following summarizes the significant accounting policies of the Fund:
Investment Valuation. Investments are valued as of 4:00 p.m. Eastern time on the last calendar day of the period. The Board of Trustees (the Board) has delegated the day to day responsibility for the valuation of the Fund's investments to the Fidelity Management & Research Company (FMR) Fair Value Committee (the Committee). In accordance with valuation policies and procedures approved by the Board, the Fund attempts to obtain prices from one or more third party pricing vendors or brokers to value its investments. When current market prices, quotations or currency exchange rates are not readily available or reliable, investments will be fair valued in good faith by the Committee, in accordance with procedures adopted by the Board. Factors used in determining fair value vary by investment type and may include market or investment specific events. The frequency with which these procedures are used cannot be predicted and they may be utilized to a significant extent. The Committee oversees the Fund's valuation policies and procedures and reports to the Board on the Committee's activities and fair value determinations. The Board monitors the appropriateness of the procedures used in valuing the Fund's investments and ratifies the fair value determinations of the Committee.
The Fund categorizes the inputs to valuation techniques used to value its investments into a disclosure hierarchy consisting of three levels as shown below:
Level 1 - quoted prices in active markets for identical investments
Level 2 - other significant observable inputs (including quoted prices for similar investments, interest rates, prepayment speeds, etc.)
Level 3 - unobservable inputs (including the Fund's own assumptions based on the best information available)
Valuation techniques used to value the Fund's investments by major category are as follows:
Equity securities, including restricted securities, for which market quotations are readily available, are valued at the last reported sale price or official closing price as reported by a third party pricing vendor on the primary market or exchange on which they are traded and are categorized as Level 1 in the hierarchy. In the event there were no sales during the day or closing prices are not available, securities are valued at the last quoted bid price or may be valued using the last available price and are generally categorized as Level 2 in the hierarchy. For foreign equity securities, when market or security specific events arise, comparisons to the valuation of American Depositary Receipts (ADRs),
Annual Report
Notes to Financial Statements - continued
3. Significant Accounting Policies - continued
Investment Valuation - continued
futures contracts, Exchange-Traded Funds (ETFs) and certain indexes as well as quoted prices for similar securities may be used and would be categorized as Level 2 in the hierarchy. Utilizing these techniques may result in transfers between Level 1 and Level 2. For equity securities, including restricted securities, where observable inputs are limited, assumptions about market activity and risk are used and these securities may be categorized as Level 3 in the hierarchy.
Investments in open-end mutual funds, including the Fidelity Central Funds, are valued at their closing net asset value (NAV) each business day and are categorized as Level 1 in the hierarchy.
Changes in valuation techniques may result in transfers in or out of an assigned level within the disclosure hierarchy. The aggregate value of investments by input level as of October 31, 2015, including information on transfers between Levels 1 and 2, as well as roll forward of Level 3 investments, is included at the end of the Fund's Schedule of Investments.
Foreign Currency. The Fund may use foreign currency contracts to facilitate transactions in foreign-denominated securities. Gains and losses from these transactions may arise from changes in the value of the foreign currency or if the counterparties do not perform under the contracts' terms.
Foreign-denominated assets, including investment securities, and liabilities are translated into U.S. dollars at the exchange rates at period end. Purchases and sales of investment securities, income and dividends received and expenses denominated in foreign currencies are translated into U.S. dollars at the exchange rate in effect on the transaction date.
The effects of exchange rate fluctuations on investments are included with the net realized and unrealized gain (loss) on investment securities. Other foreign currency transactions resulting in realized and unrealized gain (loss) are disclosed separately.
Investment Transactions and Income. For financial reporting purposes, the Fund's investment holdings and NAV include trades executed through the end of the last business day of the period. The NAV per share for processing shareholder transactions is calculated as of the close of business of the New York Stock Exchange (NYSE), normally 4:00 p.m. Eastern time and includes trades executed through the end of the prior business day. Gains and losses on securities sold are determined on the basis of identified cost. Dividend income is recorded on the ex-dividend date, except for certain dividends from foreign securities where the ex-dividend date may have passed, which are recorded as soon as the Fund is informed of the ex-dividend date. Non-cash dividends included in
Annual Report
3. Significant Accounting Policies - continued
Investment Transactions and Income - continued
dividend income, if any, are recorded at the fair market value of the securities received. Income and capital gain distributions from Fidelity Central Funds, if any, are recorded on the ex-dividend date. Investment income is recorded net of foreign taxes withheld where recovery of such taxes is uncertain.
Class Allocations and Expenses. Investment income, realized and unrealized capital gains and losses, common expenses of the Fund, and certain fund-level expense reductions, if any, are allocated daily on a pro-rata basis to each class based on the relative net assets of each class to the total net assets of the Fund. Each class differs with respect to transfer agent and distribution and service plan fees incurred. Certain expense reductions may also differ by class. For the reporting period, the allocated portion of income and expenses to each class as a percent of its average net assets may vary due to the timing of recording these transactions in relation to fluctuating net assets of the classes. Expenses directly attributable to a fund are charged to that fund. Expenses attributable to more than one fund are allocated among the respective funds on the basis of relative net assets or other appropriate methods. Expense estimates are accrued in the period to which they relate and adjustments are made when actual amounts are known.
Income Tax Information and Distributions to Shareholders. Each year, the Fund intends to qualify as a regulated investment company under Subchapter M of the Internal Revenue Code, including distributing substantially all of its taxable income and realized gains. As a result, no provision for U.S. Federal income taxes is required. As of October 31, 2015, the Fund did not have any unrecognized tax benefits in the financial statements; nor is the Fund aware of any tax positions for which it is reasonably possible that the total amounts of unrecognized tax benefits will significantly change in the next twelve months. The Fund files a U.S. federal tax return, in addition to state and local tax returns as required. The Fund's federal income tax returns are subject to examination by the Internal Revenue Service (IRS) for a period of three fiscal years after they are filed. State and local tax returns may be subject to examination for an additional fiscal year depending on the jurisdiction. Foreign taxes are provided for based on the Fund's understanding of the tax rules and rates that exist in the foreign markets in which it invests. The Fund is subject to a tax imposed on capital gains by certain countries in which it invests. An estimated deferred tax liability for net unrealized appreciation on the applicable securities is included in Other payables and accrued expenses on the Statement of Assets & Liabilities.
Annual Report
Notes to Financial Statements - continued
3. Significant Accounting Policies - continued
Income Tax Information and Distributions to Shareholders - continued
Distributions are declared and recorded on the ex-dividend date. Income dividends and capital gain distributions are declared separately for each class. Income and capital gain distributions are determined in accordance with income tax regulations, which may differ from GAAP. In addition, the Fund claimed a portion of the payment made to redeeming shareholders as a distribution for income tax purposes.
Capital accounts within the financial statements are adjusted for permanent book-tax differences. These adjustments have no impact on net assets or the results of operations. Capital accounts are not adjusted for temporary book-tax differences which will reverse in a subsequent period.
Book-tax differences are primarily due to foreign currency transactions, certain foreign taxes, passive foreign investment companies (PFIC), capital loss carryforwards and losses deferred due to wash sales.
The federal tax cost of investment securities and unrealized appreciation (depreciation) as of period end were as follows:
Gross unrealized appreciation | $ 12,373,817 |
Gross unrealized depreciation | (10,435,038) |
Net unrealized appreciation (depreciation) on securities | $ 1,938,779 |
Tax Cost | $ 81,129,283 |
The tax-based components of distributable earnings as of period end were as follows:
Undistributed ordinary income | $ 1,238,276 |
Capital loss carryforward | $ (16,887,100) |
Net unrealized appreciation (depreciation) on securities and other investments | $ 1,937,274 |
Capital loss carryforwards are only available to offset future capital gains of the Fund to the extent provided by regulations and may be limited. Under the Regulated Investment Company Modernization Act of 2010 (the Act), the Fund is permitted to carry forward capital losses incurred in taxable years beginning after December 22, 2010 for an unlimited period and such capital losses are required to be used prior to any losses that expire.
Annual Report
3. Significant Accounting Policies - continued
Income Tax Information and Distributions to Shareholders - continued
The capital loss carryforward information presented below, including any applicable limitation, is estimated as of fiscal period end and is subject to adjustment.
Fiscal year of expiration | |
2018 | $ (1,624,705) |
No expiration | |
Short-term | (3,290,678) |
Long-term | (11,971,717) |
Total no expiration | (15,262,395) |
Total capital loss carryforward | $ (16,887,100) |
The tax character of distributions paid was as follows:
| October 31, 2015 | October 31, 2014 |
Ordinary Income | $ 2,596,341 | $ 1,921,556 |
Short-Term Trading (Redemption) Fees. Shares held by investors in the Fund less than 90 days may have been subject to a redemption fee equal to 1.50% of the NAV of shares redeemed. All redemption fees, which reduce the proceeds of the shareholder redemption, are retained by the Fund and accounted for as an addition to paid in capital.
Restricted Securities. The Fund may invest in securities that are subject to legal or contractual restrictions on resale. These securities generally may be resold in transactions exempt from registration or to the public if the securities are registered. Disposal of these securities may involve time-consuming negotiations and expense, and prompt sale at an acceptable price may be difficult. Information regarding restricted securities is included at the end of the Fund's Schedule of Investments.
4. Purchases and Sales of Investments.
Purchases and sales of securities, other than short-term securities, aggregated $49,108,378 and $66,560,422, respectively.
5. Fees and Other Transactions with Affiliates.
Management Fee. Fidelity Management & Research Company (the investment adviser) and its affiliates provide the Fund with investment management related services for which the Fund pays a monthly management fee. The management fee is the sum of an individual fund fee rate that is based on an annual rate of .55% of the Fund's average net assets and an annualized group fee rate that averaged .25% during the period. The group fee rate is based upon the average net assets of all the mutual funds
Annual Report
Notes to Financial Statements - continued
5. Fees and Other Transactions with Affiliates - continued
Management Fee - continued
advised by the investment adviser, including any mutual funds previously advised by the investment adviser that are currently advised by Fidelity SelectCo, LLC, an affiliate of the investment adviser. The group fee rate decreases as assets under management increase and increases as assets under management decrease. For the reporting period, the total annual management fee rate was .80% of the Fund's average net assets.
Distribution and Service Plan Fees. In accordance with Rule 12b-1 of the 1940 Act, the Fund has adopted separate Distribution and Service Plans for each class of shares. Certain classes pay Fidelity Distributors Corporation (FDC), an affiliate of the investment adviser, separate Distribution and Service Fees, each of which is based on an annual percentage of each class' average net assets. In addition, FDC may pay financial intermediaries for selling shares of the Fund and providing shareholder support services. For the period, the Distribution and Service Fee rates, total fees and amounts retained by FDC were as follows:
| Distribution
Fee | Service
Fee | Total Fees | Retained
by FDC |
Class A | -% | .25% | $ 16,778 | $ 327 |
Class T | .25% | .25% | 11,598 | 13 |
Class B | .75% | .25% | 2,284 | 1,713 |
Class C | .75% | .25% | 54,367 | 9,171 |
| | | $ 85,027 | $ 11,224 |
Sales Load. FDC may receive a front-end sales charge of up to 5.75% for selling Class A shares and 3.50% for selling Class T shares, some of which is paid to financial intermediaries for selling shares of the Fund. Depending on the holding period, FDC may receive contingent deferred sales charges levied on Class A, Class T, Class B, and Class C redemptions. The deferred sales charges range from 5.00% to 1.00% for Class B shares, 1.00% for Class C shares, 1.00% for certain purchases of Class A shares and .25% for certain purchases of Class T shares.
For the period, sales charge amounts retained by FDC were as follows:
| Retained
by FDC |
Class A | $ 2,682 |
Class T | 1,164 |
Class BA | 50 |
Class CA | 1,357 |
| $ 5,253 |
A When Class B and Class C shares are initially sold, FDC pays commissions from its own resources to financial intermediaries through which the sales are made.
Annual Report
5. Fees and Other Transactions with Affiliates - continued
Transfer Agent Fees. Fidelity Investments Institutional Operations Company, Inc., (FIIOC), an affiliate of the investment adviser, is the transfer, dividend disbursing and shareholder servicing agent for each class of the Fund. FIIOC receives account fees and asset-based fees that vary according to the account size and type of account of the shareholders of the respective classes of the Fund. FIIOC pays for typesetting, printing and mailing of shareholder reports, except proxy statements.
For the period, transfer agent fees for each class were as follows:
| Amount | % of
Class-Level Average
Net Assets |
Class A | $ 17,582 | .26 |
Class T | 7,386 | .32 |
Class B | 680 | .30 |
Class C | 16,171 | .30 |
Emerging Europe, Middle East, Africa (EMEA) | 226,627 | .29 |
Class I | 6,423 | .15 |
| $ 274,869 | |
Accounting and Security Lending Fees. Fidelity Service Company, Inc. (FSC), an affiliate of the investment adviser, maintains the Fund's accounting records. The accounting fee is based on the level of average net assets for each month. Under a separate contract, FSC administers the security lending program. The security lending fee is based on the number and duration of lending transactions.
6. Committed Line of Credit.
The Fund participates with other funds managed by the investment adviser or an affiliate in a $4.25 billion credit facility (the "line of credit") to be utilized for temporary or emergency purposes to fund shareholder redemptions or for other short-term liquidity purposes. The Fund has agreed to pay commitment fees on its pro-rata portion of the line of credit, which amounted to $147 and is reflected in Miscellaneous expenses on the Statement of Operations. During the period, the Fund did not borrow on this line of credit.
7. Security Lending.
The Fund lends portfolio securities through a lending agent from time to time in order to earn additional income. For equity securities, a lending agent is used and may loan securities to certain qualified borrowers, including Fidelity Capital Markets (FCM), a broker-dealer affiliated with the Fund. On the settlement date of the loan, the Fund
Annual Report
Notes to Financial Statements - continued
7. Security Lending - continued
receives collateral (in the form of U.S. Treasury obligations, letters of credit and/or cash) against the loaned securities and maintains collateral in an amount not less than 100% of the market value of the loaned securities during the period of the loan. The market value of the loaned securities is determined at the close of business of the Fund and any additional required collateral is delivered to the Fund on the next business day. The Fund or borrower may terminate the loan at any time, and if the borrower defaults on its obligation to return the securities loaned because of insolvency or other reasons, the Fund may apply collateral received from the borrower against the obligation. The Fund may experience delays and costs in recovering the securities loaned. Any cash collateral received is invested in the Fidelity Securities Lending Cash Central Fund. At period end, there were no security loans outstanding. Security lending income represents the income earned on investing cash collateral, less rebates paid to borrowers and any lending agent fees associated with the loan, plus any premium payments received for lending certain types of securities. Security lending income is presented in the Statement of Operations as a component of income from Fidelity Central Funds. Total security lending income during the period amounted to $999. During the period, there were no securities loaned to FCM.
8. Expense Reductions.
The investment adviser voluntarily agreed to reimburse each class to the extent annual operating expenses exceeded certain levels of average net assets as noted in the table below. Some expenses, for example interest expense, including commitment fees, are excluded from this reimbursement.
The following classes were in reimbursement during the period:
| Expense
Limitations | Reimbursement |
Class T | 1.90% | $ 400 |
Class B | 2.40% | 7 |
Class C | 2.40% | 589 |
| | $ 996 |
Commissions paid to certain brokers with whom the investment adviser, or its affiliates, places trades on behalf of the Fund include an amount in addition to trade execution, which may be rebated back to the Fund to offset certain expenses. This amount totaled $6,765 for the period.
Annual Report
8. Expense Reductions - continued
In addition, during the period the investment adviser reimbursed and/or waived a portion of the fund-level operating expenses in the amount of $384 and portion of class-level operating expenses as follows:
| Amount |
Class A | $ 212 |
Class T | 4 |
Class B | 1 |
Class C | 36 |
Emerging Europe, Middle East, Africa (EMEA) | 2,766 |
Class I | 161 |
| $ 3,180 |
9. Distributions to Shareholders.
Distributions to shareholders of each class were as follows:
Years ended October 31, | 2015 | 2014 |
From net investment income | | |
Class A | $ 113,464 | $ 138,741 |
Class T | 35,916 | 39,254 |
Class B | 1,835 | 1,980 |
Class C | 58,320 | 46,648 |
Emerging Europe, Middle East, Africa (EMEA) | 1,776,301 | 1,537,065 |
Class I | 105,734 | 157,868 |
Total | $ 2,091,570 | $ 1,921,556 |
From net realized gain | | |
Class A | $ 32,778 | $ - |
Class T | 11,206 | - |
Class B | 1,213 | - |
Class C | 29,160 | - |
Emerging Europe, Middle East, Africa (EMEA) | 407,505 | - |
Class I | 22,909 | - |
Total | $ 504,771 | $ - |
Annual Report
Notes to Financial Statements - continued
10. Share Transactions.
Share transactions for each class were as follows and may contain automatic conversions between classes or exchanges between funds:
| Shares | Dollars |
Years ended October 31, | 2015 | 2014 | 2015 | 2014 |
Class A | | | | |
Shares sold | 200,433 | 315,373 | $ 1,636,757 | $ 2,918,425 |
Reinvestment of distributions | 16,251 | 11,698 | 135,531 | 104,929 |
Shares redeemed | (315,855) | (601,453) | (2,546,115) | (5,463,762) |
Net increase (decrease) | (99,171) | (274,382) | $ (773,827) | $ (2,440,408) |
Class T | | | | |
Shares sold | 86,058 | 101,639 | $ 721,254 | $ 928,488 |
Reinvestment of distributions | 5,631 | 4,323 | 46,793 | 38,736 |
Shares redeemed | (96,309) | (198,384) | (767,911) | (1,797,181) |
Net increase (decrease) | (4,620) | (92,422) | $ 136 | $ (829,957) |
Class B | | | | |
Shares sold | 3,390 | 4,359 | $ 28,032 | $ 39,785 |
Reinvestment of distributions | 349 | 219 | 2,936 | 1,980 |
Shares redeemed | (12,164) | (12,911) | (100,803) | (117,435) |
Net increase (decrease) | (8,425) | (8,333) | $ (69,835) | $ (75,670) |
Class C | | | | |
Shares sold | 210,315 | 241,646 | $ 1,702,630 | $ 2,211,783 |
Reinvestment of distributions | 8,117 | 3,905 | 67,210 | 34,875 |
Shares redeemed | (408,507) | (221,913) | (3,365,409) | (2,006,697) |
Net increase (decrease) | (190,075) | 23,638 | $ (1,595,569) | $ 239,961 |
Emerging Europe, Middle East, Africa (EMEA) | | | | |
Shares sold | 1,440,703 | 2,719,041 | $ 11,732,025 | $ 24,959,563 |
Reinvestment of distributions | 247,446 | 162,803 | 2,063,699 | 1,463,600 |
Shares redeemed | (3,348,545) | (3,802,325) | (27,229,428) | (34,854,232) |
Net increase (decrease) | (1,660,396) | (920,481) | $ (13,433,704) | $ (8,431,069) |
Class I | | | | |
Shares sold | 131,915 | 374,756 | $ 1,069,757 | $ 3,428,841 |
Reinvestment of distributions | 12,912 | 8,639 | 107,558 | 77,579 |
Shares redeemed | (297,795) | (841,493) | (2,411,162) | (7,467,169) |
Net increase (decrease) | (152,968) | (458,098) | $ (1,233,847) | $ (3,960,749) |
Annual Report
11. Other.
The Fund's organizational documents provide former and current trustees and officers with a limited indemnification against liabilities arising in connection with the performance of their duties to the Fund. In the normal course of business, the Fund may also enter into contracts that provide general indemnifications. The Fund's maximum exposure under these arrangements is unknown as this would be dependent on future claims that may be made against the Fund. The risk of material loss from such claims is considered remote.
Annual Report
To the Trustees of Fidelity Investment Trust and Shareholders of Fidelity Emerging Europe, Middle East, Africa (EMEA) Fund:
We have audited the accompanying statement of assets and liabilities of Fidelity Emerging Europe, Middle East, Africa (EMEA) Fund (the Fund), a fund of Fidelity Investment Trust, including the schedule of investments, as of October 31, 2015, and the related statement of operations for the year then ended, the statement of changes in net assets for each of the two years in the period then ended, and the financial highlights for each of the five years in the period then ended. These financial statements and financial highlights are the responsibility of the Fund's management. Our responsibility is to express an opinion on these financial statements and financial highlights based on our audits.
We conducted our audits in accordance with the standards of the Public Company Accounting Oversight Board (United States). Those standards require that we plan and perform the audit to obtain reasonable assurance about whether the financial statements and financial highlights are free of material misstatement. The Fund is not required to have, nor were we engaged to perform, an audit of its internal control over financial reporting. Our audits included consideration of internal control over financial reporting as a basis for designing audit procedures that are appropriate in the circumstances, but not for the purpose of expressing an opinion on the effectiveness of the Fund's internal control over financial reporting. Accordingly, we express no such opinion. An audit also includes examining, on a test basis, evidence supporting the amounts and disclosures in the financial statements, assessing the accounting principles used and significant estimates made by management, as well as evaluating the overall financial statement presentation. Our procedures included confirmation of securities owned as of October 31, 2015, by correspondence with the custodians and brokers; when replies were not received from brokers, we performed other auditing procedures. We believe that our audits provide a reasonable basis for our opinion.
In our opinion, such financial statements and financial highlights referred to above present fairly, in all material respects, the financial position of Fidelity Emerging Europe, Middle East, Africa (EMEA) Fund as of October 31, 2015, the results of its operations for the year then ended, the changes in its net assets for each of the two years in the period then ended, and the financial highlights for each of the five years in the period then ended, in conformity with accounting principles generally accepted in the United States of America.
DELOITTE & TOUCHE LLP
Boston, Massachusetts
December 18, 2015
Annual Report
The Trustees, Member of the Advisory Board, and officers of the trust and fund, as applicable, are listed below. The Board of Trustees governs the fund and is responsible for protecting the interests of shareholders. The Trustees are experienced executives who meet periodically throughout the year to oversee the fund's activities, review contractual arrangements with companies that provide services to the fund, oversee management of the risks associated with such activities and contractual arrangements, and review the fund's performance. Each of the Trustees oversees 170 funds.
The Trustees hold office without limit in time except that (a) any Trustee may resign; (b) any Trustee may be removed by written instrument, signed by at least two-thirds of the number of Trustees prior to such removal; (c) any Trustee who requests to be retired or who has become incapacitated by illness or injury may be retired by written instrument signed by a majority of the other Trustees; and (d) any Trustee may be removed at any special meeting of shareholders by a two-thirds vote of the outstanding voting securities of the trust. Each Trustee who is not an interested person (as defined in the 1940 Act) of the trust and the fund (Independent Trustee), shall retire not later than the last day of the calendar year in which his or her 75th birthday occurs. The Independent Trustees may waive this mandatory retirement age policy with respect to individual Trustees. The officers and Advisory Board Member hold office without limit in time, except that any officer and Advisory Board Member may resign or may be removed by a vote of a majority of the Trustees at any regular meeting or any special meeting of the Trustees. Except as indicated, each individual has held the office shown or other offices in the same company for the past five years.
Experience, Skills, Attributes, and Qualifications of the Fund's Trustees. The Governance and Nominating Committee has adopted a statement of policy that describes the experience, qualifications, attributes, and skills that are necessary and desirable for potential Independent Trustee candidates (Statement of Policy). The Board believes that each Trustee satisfied at the time he or she was initially elected or appointed a Trustee, and continues to satisfy, the standards contemplated by the Statement of Policy. The Governance and Nominating Committee also engages professional search firms to help identify potential Independent Trustee candidates who have the experience, qualifications, attributes, and skills consistent with the Statement of Policy. From time to time, additional criteria based on the composition and skills of the current Independent Trustees, as well as experience or skills that may be appropriate in light of future changes to board composition, business conditions, and regulatory or other developments, have also been considered by the professional search firms and the Governance and Nominating Committee. In addition, the Board takes into account the Trustees' commitment and participation in Board and committee meetings, as well as their leadership of standing and ad hoc committees throughout their tenure.
In determining that a particular Trustee was and continues to be qualified to serve as a Trustee, the Board has considered a variety of criteria, none of which, in isolation, was controlling. The Board believes that, collectively, the Trustees have balanced and diverse experience, qualifications, attributes, and skills, which allow the Board to operate effectively in governing the fund and protecting the interests of shareholders. Information about the specific experience, skills, attributes, and qualifications of each Trustee, which in each case led to the Board's conclusion that the Trustee should serve (or continue to serve) as a trustee of the fund, is provided below.
Annual Report
Board Structure and Oversight Function. James C. Curvey is an interested person (as defined in the 1940 Act) and currently serves as Chairman. The Trustees have determined that an interested Chairman is appropriate and benefits shareholders because an interested Chairman has a personal and professional stake in the quality and continuity of services provided to the fund. Independent Trustees exercise their informed business judgment to appoint an individual of their choosing to serve as Chairman, regardless of whether the Trustee happens to be independent or a member of management. The Independent Trustees have determined that they can act independently and effectively without having an Independent Trustee serve as Chairman and that a key structural component for assuring that they are in a position to do so is for the Independent Trustees to constitute a substantial majority for the Board. The Independent Trustees also regularly meet in executive session. Ned C. Lautenbach serves as Chairman of the Independent Trustees and as such (i) acts as a liaison between the Independent Trustees and management with respect to matters important to the Independent Trustees and (ii) with management prepares agendas for Board meetings.
Fidelity funds are overseen by different Boards of Trustees. The fund's Board oversees Fidelity's high income and certain equity funds, and other Boards oversee Fidelity's investment-grade bond, money market, asset allocation, and sector funds. The asset allocation funds may invest in Fidelity funds overseen by the fund's Board. The use of separate Boards, each with its own committee structure, allows the Trustees of each group of Fidelity funds to focus on the unique issues of the funds they oversee, including common research, investment, and operational issues. On occasion, the separate Boards establish joint committees to address issues of overlapping consequences for the Fidelity funds overseen by each Board.
The Trustees operate using a system of committees to facilitate the timely and efficient consideration of all matters of importance to the Trustees, the fund, and fund shareholders and to facilitate compliance with legal and regulatory requirements and oversight of the fund's activities and associated risks. The Board, acting through its committees, has charged FMR and its affiliates with (i) identifying events or circumstances the occurrence of which could have demonstrably adverse effects on the fund's business and/or reputation; (ii) implementing processes and controls to lessen the possibility that such events or circumstances occur or to mitigate the effects of such events or circumstances if they do occur; and (iii) creating and maintaining a system designed to evaluate continuously business and market conditions in order to facilitate the identification and implementation processes described in (i) and (ii) above. Because the day-to-day operations and activities of the fund are carried out by or through FMR, its affiliates and other service providers, the fund's exposure to risks is mitigated but not eliminated by the processes overseen by the Trustees. While each of the Board's committees has responsibility for overseeing different aspects of the fund's activities, oversight is exercised primarily through the Operations, Audit, and Compliance Committees. In addition, the Independent Trustees have worked with FMR to enhance the Board's oversight of investment and financial risks, legal and regulatory risks, technology risks, and operational risks, including the development of additional risk reporting to the Board. For example, a working group comprised of Independent Trustees and FMR has worked and continues to work to review the Fidelity funds' valuation-related activities, reporting and risk management. Appropriate personnel, including but not limited to the fund's Chief Compliance Officer (CCO), FMR's internal auditor, the independent accountants, the fund's Treasurer and portfolio management personnel, make periodic reports to the Board's committees, as appropriate, including an annual review of Fidelity's risk management program for the Fidelity funds. The responsibilities of each standing committee, including their oversight responsibilities, are described further under "Standing Committees of the Fund's Trustees."
Annual Report
Trustees and Officers - continued
The fund's Statement of Additional Information (SAI) includes more information about the Trustees. To request a free copy, call Fidelity at 1-800-544-8544.
Interested Trustees*:
Correspondence intended for each Trustee who is an interested person may be sent to Fidelity Investments, 245 Summer Street, Boston, Massachusetts 02210.
Name, Year of Birth; Principal Occupations and Other Relevant Experience+ |
James C. Curvey (1935) |
Year of Election or Appointment: 2007 Trustee Chairman of the Board of Trustees |
| Mr. Curvey also serves as Trustee of other Fidelity funds. Mr. Curvey is a Director of Fidelity Research & Analysis Co. (investment adviser firm, 2009-present), and Vice Chairman (2007-present) and Director of FMR LLC (diversified financial services company). In addition, Mr. Curvey serves as an Overseer for the Boston Symphony Orchestra and a member of the board of Artis-Naples, Naples, Florida, and as a Trustee for Brewster Academy, Wolfeboro, New Hampshire. Previously, Mr. Curvey served as a Director of Fidelity Investments Money Management, Inc. (investment adviser firm, 2009-2014) and a Director of FMR and FMR Co., Inc. (investment adviser firms, 2007-2014). |
Charles S. Morrison (1960) |
Year of Election or Appointment: 2014 Trustee |
| Mr. Morrison also serves as Trustee of other funds. He serves as a Director of Fidelity Investments Money Management, Inc. (FIMM) (investment adviser firm, 2014-present), Director of Fidelity SelectCo, LLC (investment adviser firm, 2014-present), President, Asset Management (2014-present), and is an employee of Fidelity Investments. Previously, Mr. Morrison served as Vice President of Fidelity's Fixed Income and Asset Allocation Funds (2012-2014), President, Fixed Income (2011-2014), Vice President of Fidelity's Money Market Funds (2005-2009), President, Money Market Group Leader of FMR (investment adviser firm, 2009), and Senior Vice President, Money Market Group of FMR (2004-2009). Mr. Morrison also served as Vice President of Fidelity's Bond Funds (2002-2005), certain Balanced Funds (2002-2005), and certain Asset Allocation Funds (2002-2007), and as Senior Vice President (2002-2005) of Fidelity's Bond Division. |
* Trustees have been determined to be "Interested Trustees" by virtue of, among other things, their affiliation with the trust or various entities under common control with FMR.
+ The information above includes each Trustee's principal occupation during the last five years and other information relating to the experience, attributes, and skills relevant to each Trustee's qualifications to serve as a Trustee, which led to the conclusion that each Trustee should serve as a Trustee for the fund.
Annual Report
Trustees and Officers - continued
Independent Trustees:
Correspondence intended for each Independent Trustee (that is, the Trustees other than the Interested Trustees) may be sent to Fidelity Investments, P.O. Box 55235, Boston, Massachusetts 02205-5235.
Name, Year of Birth; Principal Occupations and Other Relevant Experience+ |
Dennis J. Dirks (1948) |
Year of Election or Appointment: 2005 Trustee |
| Mr. Dirks also serves as Trustee of other Fidelity funds. Prior to his retirement in May 2003, Mr. Dirks was Chief Operating Officer and a member of the Board of The Depository Trust & Clearing Corporation (DTCC). He also served as President, Chief Operating Officer, and Board member of The Depository Trust Company (DTC) and President and Board member of the National Securities Clearing Corporation (NSCC). In addition, Mr. Dirks served as Chief Executive Officer and Board member of the Government Securities Clearing Corporation, Chief Executive Officer and Board member of the Mortgage-Backed Securities Clearing Corporation, as a Trustee and a member of the Finance Committee of Manhattan College (2005-2008), as a Trustee and a member of the Finance Committee of AHRC of Nassau County (2006-2008), and as a member of the Independent Directors Council (IDC) Governing Council (2010-2015). Mr. Dirks is a member of the Board of Directors for The Brookville Center for Children's Services, Inc. (2009-present). |
Alan J. Lacy (1953) |
Year of Election or Appointment: 2008 Trustee |
| Mr. Lacy also serves as Trustee of other Fidelity funds. Mr. Lacy serves as a member of the Board of Directors of Dave & Buster's Entertainment, Inc. (restaurant and entertainment complexes, 2010-present) and Bristol-Myers Squibb Company (global pharmaceuticals, 2008-present). In addition, Mr. Lacy served as Senior Adviser (2007-2014) of Oak Hill Capital Partners, L.P. (private equity) and also served as Chief Executive Officer (2000-2005) and Vice Chairman (2005-2006) of Sears Holdings Corporation and Sears, Roebuck and Co. (retail). Mr. Lacy is a member of the Board of Trustees of The National Parks Conservation Association (2006-present). Previously, Mr. Lacy served as Chairman of the Board of Trustees of the National Parks Conservation Association (2008-2011) and as a member of the Board of Directors for The Western Union Company (global money transfer, 2006-2011), The Hillman Companies, Inc. (hardware wholesalers, 2010-2014), and Earth Fare, Inc. (retail grocery, 2010-2014). |
Ned C. Lautenbach (1944) |
Year of Election or Appointment: 2000 Trustee Chairman of the Independent Trustees |
| Mr. Lautenbach also serves as Trustee of other Fidelity funds. Mr. Lautenbach currently serves as the Lead Director of the Eaton Corporation Board of Directors (diversified industrial, 1997-present). Mr. Lautenbach is Chairman of the Board of Directors of Artis-Naples in Naples, Florida (2012-present), a member of the Council on Foreign Relations (1994-present), and a member of the Board of Governors, State University System of Florida (2013-present). Previously, Mr. Lautenbach was a Partner/Advisory Partner at Clayton, Dubilier & Rice, LLC (private equity investment, 1998-2010), as well as a Director of Sony Corporation (2006-2007). |
Joseph Mauriello (1944) |
Year of Election or Appointment: 2008 Trustee |
| Mr. Mauriello also serves as Trustee of other Fidelity funds. Prior to his retirement in January 2006, Mr. Mauriello served in numerous senior management positions including Deputy Chairman and Chief Operating Officer (2004-2005), and Vice Chairman of Financial Services (2002-2004) of KPMG LLP US (professional services, 1965-2005). Mr. Mauriello currently serves as a member of the Board of Directors of XL Group plc. (global insurance and re-insurance, 2006-present) and the Independent Directors Council (IDC) Governing Council (2015-present). Previously, Mr. Mauriello served as a Director of the Hamilton Funds of the Bank of New York (2006-2007) and of Arcadia Resources Inc. (health care services and products, 2007-2012). |
Robert W. Selander (1950) |
Year of Election or Appointment: 2011 Trustee |
| Mr. Selander also serves as Trustee of other Fidelity funds. Mr. Selander serves as a Director of The Western Union Company (global money transfer, 2014-present). Previously, Mr. Selander served as a Member of the Advisory Board of other Fidelity funds (2011), and Executive Vice Chairman (2010), Chief Executive Officer (2009-2010), and President and Chief Executive Officer (1997-2009) of Mastercard, Inc. |
Cornelia M. Small (1944) |
Year of Election or Appointment: 2005 Trustee |
| Ms. Small also serves as Trustee of other Fidelity funds. Ms. Small is a member of the Board of Directors (2009-present) and Chair of the Investment Committee (2010-present) of the Teagle Foundation. Ms. Small also serves on the Investment Committee of the Berkshire Taconic Community Foundation (2008-present). Previously, Ms. Small served as Chairperson (2002-2008) and a member of the Investment Committee and Chairperson (2008-2012) and a member of the Board of Trustees of Smith College. In addition, Ms. Small served as Chief Investment Officer, Director of Global Equity Investments, and a member of the Board of Directors of Scudder, Stevens & Clark and Scudder Kemper Investments. |
William S. Stavropoulos (1939) |
Year of Election or Appointment: 2001 Trustee Vice Chairman of the Independent Trustees |
| Mr. Stavropoulos also serves as Trustee of other Fidelity funds. Mr. Stavropoulos serves as President and Founder of the Michigan Baseball Foundation, the Great Lakes Loons (2007-present). Mr. Stavropoulos is Chairman Emeritus of the Board of Directors of The Dow Chemical Company, where he previously served in numerous senior management positions, including President, CEO (1995-2000; 2002-2004), Chairman of the Executive Committee (2000-2006), and as a member of the Board of Directors (1990-2006). Currently, Mr. Stavropoulos is Chairman of the Board of Directors of Univar Inc. (global distributor of commodity and specialty chemicals), a Director of Teradata Corporation (data warehousing and technology solutions), and Maersk Inc. (industrial conglomerate), and a member of the Advisory Board for Metalmark Capital LLC (private equity investment, 2005-present). Mr. Stavropoulos is an operating advisor to Clayton, Dubilier & Rice, LLC (private equity investment). In addition, Mr. Stavropoulos is a member of the University of Notre Dame Advisory Council for the College of Science, a Trustee of the Rollin L. Gerstacker Foundation, and a Director of the Naples Philharmonic Center for the Arts. Previously, Mr. Stavropoulos served as a Director of Chemical Financial Corporation (bank holding company, 1993-2012) and Tyco International, Ltd. (multinational manufacturing and services, 2007-2012). |
David M. Thomas (1949) |
Year of Election or Appointment: 2008 Trustee |
| Mr. Thomas also serves as Trustee of other Fidelity funds. Mr. Thomas serves as Non-Executive Chairman of the Board of Directors of Fortune Brands Home and Security (home and security products, 2011-present), as a member of the Board of Directors (2004-present) and Presiding Director (2013-present) of Interpublic Group of Companies, Inc. (marketing communication), and as a member of the Board of Trustees of the University of Florida (2013-present). Previously, Mr. Thomas served as Executive Chairman (2005-2006) and Chairman and Chief Executive Officer (2000-2005) of IMS Health, Inc. (pharmaceutical and healthcare information solutions), and a Director of Fortune Brands, Inc. (consumer products, 2000-2011). |
+ The information above includes each Trustee's principal occupation during the last five years and other information relating to the experience, attributes, and skills relevant to each Trustee's qualifications to serve as a Trustee, which led to the conclusion that each Trustee should serve as a Trustee for the fund.
Advisory Board Member and Officers:
Correspondence intended for each officer and Peter S. Lynch may be sent to Fidelity Investments, 245 Summer Street, Boston, Massachusetts 02210. Officers appear below in alphabetical order.
Name, Year of Birth; Principal Occupation |
Peter S. Lynch (1944) |
Year of Election or Appointment: 2003 Member of the Advisory Board |
| Mr. Lynch also serves as Member of the Advisory Board of other Fidelity funds. Mr. Lynch is Vice Chairman and a Director of FMR (investment adviser firm) and FMR Co., Inc. (investment adviser firm). In addition, Mr. Lynch serves as a Trustee of Boston College and as the Chairman of the Inner-City Scholarship Fund. Previously, Mr. Lynch served on the Special Olympics International Board of Directors (1997-2006). |
Elizabeth Paige Baumann (1968) |
Year of Election or Appointment: 2012 Anti-Money Laundering (AML) Officer |
| Ms. Baumann also serves as AML Officer of other funds. She is Chief AML Officer of FMR LLC (diversified financial services company, 2012-present) and is an employee of Fidelity Investments. Previously, Ms. Baumann served as Vice President and Deputy Anti-Money Laundering Officer (2007-2012). |
Marc R. Bryant (1966) |
Year of Election or Appointment: 2015 Secretary and Chief Legal Officer (CLO) |
| Mr. Bryant also serves as Secretary and CLO of other funds. Mr. Bryant serves as CLO, Secretary, and Senior Vice President of Fidelity Management & Research Company (investment adviser firm, 2015-present) and FMR Co., Inc. (investment adviser firm, 2015-present); Secretary of Fidelity SelectCo, LLC (investment adviser firm, 2015-present) and Fidelity Investments Money Management, Inc. (investment adviser firm, 2015-present); and CLO of Fidelity Management & Research (Hong Kong) Limited (investment adviser firm, 2015-present). He is Senior Vice President and Deputy General Counsel of FMR LLC (diversified financial services company). Previously, Mr. Bryant served as Secretary and Chief Legal Officer of Fidelity Rutland Square Trust II (2010-2014) and Assistant Secretary of Fidelity's Fixed Income and Asset Allocation Funds (2013-2015). Prior to joining Fidelity Investments, Mr. Bryant served as a Senior Vice President and the Head of Global Retail Legal for AllianceBernstein L.P. (2006-2010), and as the General Counsel for ProFund Advisors LLC (2001-2006). |
William C. Coffey (1969) |
Year of Election or Appointment: 2009 Assistant Secretary |
| Mr. Coffey also serves as Assistant Secretary of other funds. He is Senior Vice President and Deputy General Counsel of FMR LLC (diversified financial services company, 2010-present), and is an employee of Fidelity Investments. Previously, Mr. Coffey served as Vice President and Associate General Counsel of FMR LLC (2005-2009). |
Timothy M. Cohen (1969) |
Year of Election or Appointment: 2014 Vice President of certain Equity Funds |
| Mr. Cohen also serves as Vice President of other funds. Mr. Cohen serves as Chief Compliance Officer of FMR Investment Management (U.K.) Limited (investment adviser firm, 2013-present) and is an employee of Fidelity Investments. Previously, Mr. Cohen served as a Director of FMR Investment Management (U.K.) Limited (2013-2015). |
Jonathan Davis (1968) |
Year of Election or Appointment: 2010 Assistant Treasurer |
| Mr. Davis also serves as Assistant Treasurer of other funds, and is an employee of Fidelity Investments. Previously, Mr. Davis served as Vice President and Associate General Counsel of FMR LLC (diversified financial services company, 2003-2010). |
Adrien E. Deberghes (1967) |
Year of Election or Appointment: 2008 Deputy Treasurer |
| Mr. Deberghes also serves as an officer of other funds. He is an employee of Fidelity Investments (2008-present). Prior to joining Fidelity Investments, Mr. Deberghes was Senior Vice President of Mutual Fund Administration at State Street Corporation (2007-2008), Senior Director of Mutual Fund Administration at Investors Bank & Trust (2005-2007), and Director of Finance for Dunkin' Brands (2000-2005). |
Stephanie J. Dorsey (1969) |
Year of Election or Appointment: 2010 Assistant Treasurer |
| Ms. Dorsey also serves as an officer of other funds. She is an employee of Fidelity Investments (2008-present) and has served in other fund officer roles. Prior to joining Fidelity Investments, Ms. Dorsey served as Treasurer (2004-2008) of the JPMorgan Mutual Funds and Vice President (2004-2008) of JPMorgan Chase Bank. |
Howard J. Galligan III (1966) |
Year of Election or Appointment: 2014 Chief Financial Officer |
| Mr. Galligan also serves as Chief Financial Officer of other funds. Mr. Galligan serves as President of Fidelity Pricing and Cash Management Services (FPCMS) (2014-present) and as a Director of Strategic Advisers, Inc. (investment adviser firm, 2008-present). Previously, Mr. Galligan served as Chief Administrative Officer of Asset Management (2011-2014) and Chief Operating Officer and Senior Vice President of Investment Support for Strategic Advisers, Inc. (2003-2011). |
Scott C. Goebel (1968) |
Year of Election or Appointment: 2015 Vice President |
| Mr. Goebel serves as Vice President of other funds and is an employee of Fidelity Investments (2001-present). Previously, Mr. Goebel served as Secretary of Fidelity SelectCo, LLC (investment adviser firm, 2013-2015), Fidelity Investments Money Management, Inc. (FIMM) (investment adviser firm, 2010-2015), and Fidelity Research and Analysis Company (FRAC) (investment adviser firm, 2010-2015); General Counsel, Secretary, and Senior Vice President of Fidelity Management & Research Company (investment adviser firm, 2008-2015) and FMR Co., Inc. (investment adviser firm, 2008-2015); Assistant Secretary of Fidelity Management & Research (Japan) Limited (investment adviser firm, 2008-2015) and FMR Investment Management (U.K.) Limited (investment adviser firm, 2008-2015); Chief Legal Officer (CLO) of Fidelity Management & Research (Hong Kong) Limited (investment adviser firm, 2008-2015); Secretary and CLO of certain Fidelity funds (2008-2015); Assistant Secretary of FIMM (2008-2010), FRAC (2008-2010), and certain funds (2007-2008); and as Vice President and Secretary of Fidelity Distributors Corporation (FDC) (2005-2007). |
Brian B. Hogan (1964) |
Year of Election or Appointment: 2009 Vice President |
| Mr. Hogan also serves as Trustee or Vice President of other funds. Mr. Hogan serves as a Director of Fidelity SelectCo, LLC (investment adviser firm, 2014-present) and President of the Equity Division of FMR (investment adviser firm, 2009-present). Previously, Mr. Hogan served as Senior Vice President, Equity Research of FMR (2006-2009) and as a portfolio manager. |
Chris Maher (1972) |
Year of Election or Appointment: 2013 Assistant Treasurer |
| Mr. Maher serves as Assistant Treasurer of other funds. Mr. Maher is Vice President of Valuation Oversight and is an employee of Fidelity Investments. Previously, Mr. Maher served as Vice President of Asset Management Compliance (2013), Vice President of the Program Management Group of FMR (investment adviser firm, 2010-2013), and Vice President of Valuation Oversight (2008-2010). |
Kenneth B. Robins (1969) |
Year of Election or Appointment: 2008 President and Treasurer |
| Mr. Robins also serves as an officer of other funds. Mr. Robins serves as Executive Vice President of Fidelity Investments Money Management, Inc. (FIMM) (investment adviser firm, 2013-present) and is an employee of Fidelity Investments (2004-present). Previously, Mr. Robins served in other fund officer roles. |
Stacie M. Smith (1974) |
Year of Election or Appointment: 2013 Deputy Treasurer |
| Ms. Smith also serves as an officer of other funds. She is an employee of Fidelity Investments (2009-present) and has served in other fund officer roles. Prior to joining Fidelity Investments, Ms. Smith served as Senior Audit Manager of Ernst & Young LLP (1996-2009). |
Renee Stagnone (1975) |
Year of Election or Appointment: 2013 Deputy Treasurer |
| Ms. Stagnone also serves as Deputy Treasurer of other funds. Ms. Stagnone is an employee of Fidelity Investments (1997-present). |
Linda J. Wondrack (1964) |
Year of Election or Appointment: 2014 Chief Compliance Officer |
| Ms. Wondrack also serves as Chief Compliance Officer of other funds. Ms. Wondrack is Executive Vice President and head of the Ethics Office and Asset Management Compliance for Fidelity Investments (2012-present). Ms. Wondrack also serves as Chief Compliance Officer of Fidelity SelectCo, LLC (investment adviser firm, 2014-present); Chief Compliance Officer of Impresa Management LLC (2013-present); and Chief Compliance Officer of FMR Co., Inc. (investment adviser firm), Fidelity Investments Money Management, Inc. (investment adviser firm), Fidelity Management & Research (Japan) Limited (investment adviser firm), FMR Investment Management (U.K.) Limited (investment adviser firm), Fidelity Management & Research (Hong Kong) (investment adviser firm), Fidelity Management & Research Company (investment adviser firm), FIAM LLC (investment adviser firm), and Strategic Advisers, Inc. (investment adviser firm), Ballyrock Investment Advisors LLC, and Northern Neck Investors LLC (2012-present). Previously, Ms. Wondrack served as Senior Vice President and Chief Compliance Officer for Columbia Management Investment Advisers, LLC (2005-2012); Chief Compliance Officer for certain funds within the Columbia Family of Funds (2007-2012); and Senior Vice President of Compliance Risk Management at Bank of America (2005-2010). |
Joseph F. Zambello (1957) |
Year of Election or Appointment: 2011 Deputy Treasurer |
| Mr. Zambello also serves as Deputy Treasurer of other funds. Mr. Zambello is an employee of Fidelity Investments (1991-present). Previously, Mr. Zambello served as Vice President of the Program Management Group of FMR (investment adviser firm, 2009-2011) and Vice President of the Transfer Agent Oversight Group (2005-2009). |
Annual Report
Fidelity Emerging Europe, Middle East, Africa (EMEA) Fund designates 100% of the dividends distributed during the fiscal year, as amounts which may be taken into account as a dividend for purposes of the maximum rate under section 1 (h) (11) of the Internal Revenue Code.
The amounts per share which represent income derived from sources within, and taxes paid to, foreign countries or possessions of the United States are as follows:
| Pay Date | Income | Taxes |
Fidelity Emerging Europe,
Middle East, Africa (EMEA) Fund | 12/08/14 | $0.2557 | $0.0467 |
The fund will notify shareholders in January 2016 of amounts for use in preparing 2015 income tax returns.
Annual Report
Fidelity Emerging Europe, Middle East, Africa (EMEA) Fund
Each year, the Board of Trustees, including the Independent Trustees (together, the Board), votes on the renewal of the management contract with Fidelity Management & Research Company (FMR) and the sub-advisory agreements (together, the Advisory Contracts) for the fund. The Board, assisted by the advice of fund counsel and Independent Trustees' counsel, requests and considers a broad range of information relevant to the renewal of the Advisory Contracts throughout the year.
The Board meets regularly and, at each of its meetings, covers an extensive agenda of topics and materials and considers factors that are relevant to its annual consideration of the renewal of the fund's Advisory Contracts, including the services and support provided to the fund and its shareholders. The Board has established various standing committees (Committees), each composed of and chaired by Independent Trustees with varying backgrounds, to which the Board has assigned specific subject matter responsibilities in order to enhance effective decision-making by the Board. The Board, acting directly and through its Committees, requests and receives information concerning the annual consideration of the renewal of the fund's Advisory Contracts. The Board also meets as needed to consider matters specifically related to the Board's annual consideration of the renewal of the Advisory Contracts. Members of the Board may also meet with trustees of other Fidelity funds through ad hoc joint committees to discuss certain matters relevant to all of the Fidelity funds.
At its July 2015 meeting, the Board unanimously determined to renew the fund's Advisory Contracts. In reaching its determination, the Board considered all factors it believed relevant, including (i) the nature, extent, and quality of the services to be provided to the fund and its shareholders (including the investment performance of the fund); (ii) the competitiveness of the fund's management fee and total expense ratio relative to peer funds; (iii) the total costs of the services to be provided by and the profits to be realized by Fidelity from its relationship with the fund; and (iv) the extent to which (if any) economies of scale exist and would be realized as the fund grows, and whether any economies of scale are appropriately shared with fund shareholders.
In considering whether to renew the Advisory Contracts for the fund, the Board reached a determination, with the assistance of fund counsel and Independent Trustees' counsel and through the exercise of its business judgment, that the renewal of the Advisory Contracts was in the best interests of the fund and its shareholders and that the compensation payable under the Advisory Contracts was fair and reasonable. The Board's decision to renew the Advisory Contracts was not based on any single factor, but rather was based on a comprehensive consideration of all the information provided to the Board at its meetings throughout the year. The Board, in reaching its determination to renew the Advisory Contracts, was aware that shareholders of the fund have a broad range of investment choices available to them, including a wide choice among funds offered by Fidelity's competitors, and that the fund's shareholders, who have the opportunity to review and weigh the disclosure provided by the fund in its prospectus and other public disclosures, have chosen to invest in this fund, which is part of the Fidelity family of funds.
Annual Report
Nature, Extent, and Quality of Services Provided. The Board considered Fidelity's staffing as it relates to the fund, including the backgrounds of investment personnel of Fidelity, and also considered the fund's investment objective, strategies, and related investment philosophy. The Independent Trustees also had discussions with senior management of Fidelity's investment operations and investment groups. The Board considered the structure of the portfolio manager compensation program and whether this structure provides appropriate incentives to act in the best interests of the fund. Additionally, the Board considered the portfolio managers' investments, if any, in the funds that they manage.
Resources Dedicated to Investment Management and Support Services. The Board and the Fund Oversight and Research Committees reviewed the general qualifications and capabilities of Fidelity's investment staff, including its size, education, experience, and resources, as well as Fidelity's approach to recruiting, training, managing, and compensating investment personnel. The Board noted that Fidelity has continued to increase the resources devoted to non-U.S. offices, including expansion of Fidelity's global investment organization. The Board also noted that Fidelity's analysts have extensive resources, tools and capabilities that allow them to conduct sophisticated quantitative and fundamental analysis, as well as credit analysis of issuers, counterparties and guarantors. Further, the Board considered that Fidelity's investment professionals have sufficient access to global information and data so as to provide competitive investment results over time, and that those professionals also have access to sophisticated tools that permit them to assess portfolio construction and risk and performance attribution characteristics continuously, as well as to transmit new information and research conclusions rapidly around the world. Additionally, in its deliberations, the Board considered Fidelity's trading, risk management, and compliance capabilities and resources, which are integral parts of the investment management process.
Shareholder and Administrative Services. The Board considered (i) the nature, extent, quality, and cost of advisory, administrative, and shareholder services performed by FMR, the sub-advisers (together with FMR, the Investment Advisers), and their affiliates under the Advisory Contracts and under separate agreements covering transfer agency, pricing and bookkeeping, and securities lending services for the fund; (ii) the nature and extent of the supervision of third party service providers, principally custodians and subcustodians; and (iii) the resources devoted to, and the record of compliance with, the fund's compliance policies and procedures. The Board also reviewed the allocation of fund brokerage, including allocations to brokers affiliated with the Investment Advisers, the use of brokerage commissions to pay fund expenses, and the use of "soft" commission dollars to pay for research services.
Annual Report
Board Approval of Investment Advisory Contracts and
Management Fees - continued
The Board noted that the growth of fund assets over time across the complex allows Fidelity to reinvest in the development of services designed to enhance the value or convenience of the Fidelity funds as investment vehicles. These services include 24-hour access to account information and market information through telephone representatives and over the Internet, investor education materials and asset allocation tools, and the expanded availability of Fidelity Investor Centers.
In 2014, the Board formed an ad hoc Committee on Transfer Agency Fees to review the variety of transfer agency fee structures throughout the industry and Fidelity's competitive positioning with respect to industry participants.
Investment in a Large Fund Family. The Board considered the benefits to shareholders of investing in a Fidelity fund, including the benefits of investing in a fund that is part of a large family of funds offering a variety of investment disciplines and providing a large variety of mutual fund investor services. The Board noted that Fidelity had taken, or had made recommendations that resulted in the Fidelity funds taking, a number of actions over the previous year that benefited particular funds, including (i) continuing to dedicate additional resources to investment research and to the support of the senior management team that oversees asset management; (ii) continuing efforts to enhance Fidelity's global research capabilities; (iii) launching new funds and making other enhancements to meet client needs; (iv) reducing management fees and total expenses for certain index funds and diversified international funds; (v) continuing to launch dedicated lower cost underlying funds to meet portfolio construction needs related to expanding underlying fund options for Fidelity funds of funds, specifically for the Freedom Fund product lines; (vi) rationalizing product lines and gaining increased efficiencies through fund mergers; (vii) launching active fixed-income exchange-traded funds; (viii) continuing to develop, acquire and implement systems and technology to improve services to the funds and information security and to increase efficiency; (ix) implementing investment enhancements to further strengthen Fidelity's target date product line to increase investors' probability of success in achieving their goals; (x) modifying the eligibility criteria for certain share classes to accommodate roll-over assets from employer-sponsored retirement plans; (xi) launching a new Class W of the Freedom Index Funds to attract and retain Fidelity record-kept retirement plan assets; and (xii) implementing changes to Fidelity's money market product line in response to recent money market regulatory reforms.
Investment Performance. The Board considered whether the fund has operated in accordance with its investment objective, as well as its record of compliance with its investment restrictions and its performance history.
Annual Report
The Board took into account discussions with representatives of the Investment Advisers about fund investment performance that occur at Board meetings throughout the year. In this regard the Board noted that as part of regularly scheduled fund reviews and other reports to the Board on fund performance, the Board considers annualized return information for the fund, for different time periods, measured against a securities market index ("benchmark index") and a peer group of funds with similar objectives ("peer group"), if any. In its evaluation of fund investment performance, the Board gave particular attention to information indicating changes in performance of certain Fidelity funds for specific time periods and discussed with the Investment Advisers the reasons for any overperformance or underperformance.
In addition to reviewing absolute and relative fund performance, the Independent Trustees periodically consider the appropriateness of fund performance metrics in evaluating the results achieved. In general, the Independent Trustees believe that fund performance should be evaluated based on net performance (after fees and expenses) of both the highest performing and lowest performing fund share classes, where applicable, compared to appropriate benchmark indices, over appropriate time periods that may include full market cycles, and compared to peer groups, as applicable, over the same periods, taking into account relevant factors including the following: general market conditions; issuer-specific information; and fund cash flows and other factors.
The Independent Trustees recognize that shareholders evaluate performance on a net basis over their own holding periods, for which one-, three-, and five-year periods are often used as a proxy. For this reason, the performance information reviewed by the Board also included net cumulative calendar year total return information for the fund and an appropriate benchmark index for the most recent one-, three-, and five-year periods, as shown below. A peer group is not shown below because the fund does not generally utilize a peer group for performance comparison purposes.
Annual Report
Board Approval of Investment Advisory Contracts and
Management Fees - continued
Fidelity Emerging Europe, Middle East, Africa (EMEA) Fund

Based on its review, the Board concluded that the nature, extent, and quality of services provided to the fund under the Advisory Contracts should benefit the shareholders of the fund.
Competitiveness of Management Fee and Total Expense Ratio. The Board considered the fund's management fee and total expense ratio compared to "mapped groups" of competitive funds and classes created for the purpose of facilitating the Trustees' competitive analysis of management fees and total expenses. Fidelity creates "mapped groups" by combining similar Lipper investment objective categories that have comparable investment mandates. Combining Lipper investment objective categories aids the Board's management fee and total expense ratio comparisons by broadening the competitive group used for comparison.
Management Fee. The Board considered two proprietary management fee comparisons for the 12-month periods shown in basis points (BP) in the chart below. The group of Lipper funds used by the Board for management fee comparisons is referred to below as the "Total Mapped Group." The Total Mapped Group comparison focuses on a fund's standing in terms of gross management fees before expense reimbursements or caps relative to the total universe of funds with comparable investment mandates, regardless of whether their management fee structures also are comparable. Funds with comparable investment mandates offer exposure to similar types of securities. Funds with comparable management fee structures have similar management fee contractual arrangements (e.g., flat rate charged for advisory services, all-inclusive fee rate, etc.). "TMG %" represents the percentage of funds in the Total Mapped Group that had management fees that were lower than the fund's. For example, a hypothetical TMG % of 20% would mean that 80% of the funds in the Total Mapped Group had higher, and 20% had lower, management fees than the fund. The fund's actual TMG %s and the number of funds in the Total Mapped Group are in the chart below. The "Asset-Size Peer Group" (ASPG) comparison focuses on a fund's standing relative to a subset of non-Fidelity funds within the Total Mapped Group that are similar in size and management fee structure without taking into account performance adjustments, if any. For example, if a fund is in the first quartile of the ASPG, the fund's management fee ranks in the least expensive or lowest 25% of funds in the ASPG. The ASPG represents at least 15% of the funds in the Total Mapped Group with comparable asset size and management fee structures, subject to a minimum of 50 funds (or all funds in the Total Mapped Group if fewer than 50). Additional information, such as the ASPG quartile in which the fund's management fee rate ranked, is also included in the chart and considered by the Board.
Annual Report
Fidelity Emerging Europe, Middle East, Africa (EMEA) Fund
The Board noted that the fund's management fee rate ranked below the median of its Total Mapped Group and below the median of its ASPG for 2014.
The Board noted that, in 2014, the ad hoc Committee on Group Fee was formed by it and other Fidelity fund boards to conduct an in-depth review of the "group fee" component of the management fee of funds with such management fee structures. Committee focus included the mechanics of the group fee, the competitive landscape of group fee structures, Fidelity funds with no group fee component and investment products not included in group fee assets. The Board also considered that, for funds subject to the group fee, FMR agreed to voluntarily waive fees over a specified period of time in amounts designed to account for assets converted from certain funds to certain collective investment trusts.
Annual Report
Board Approval of Investment Advisory Contracts and
Management Fees - continued
The Board also noted that, in 2013, the ad hoc Committee on Management Fees was formed to conduct an in-depth review of the management fee rates of Fidelity's active equity mutual funds. The Committee focused on the following areas: (i) standard fee structures; (ii) research consumption and trading evolution; (iii) management fee competitiveness/profitability by category; and (iv) factors that drive institutional pricing.
Based on its review, the Board concluded that the fund's management fee is fair and reasonable in light of the services that the fund receives and the other factors considered.
Total Expense Ratio. In its review of each class's total expense ratio, the Board considered the fund's management fee as well as other fund or class expenses, as applicable, such as transfer agent fees, pricing and bookkeeping fees, fund-paid 12b-1 fees, and custodial, legal, and audit fees. The Board also noted that Fidelity may agree to waive fees and expenses from time to time, and the extent to which, if any, it has done so for the fund. As part of its review, the Board also considered the current and historical total expense ratios of each class of the fund compared to competitive fund median expenses. Each class of the fund is compared to those funds and classes in the Total Mapped Group (used by the Board for management fee comparisons) that have a similar sales load structure.
The Board noted that the total expense ratio of each of Class A, Class I, and the retail class ranked below its competitive median for 2014 and the total expense ratio of each of Class T, Class B, and Class C ranked above its competitive median for 2014. The Board considered that, in general, various factors can affect total expense ratios. The Board noted that the total expense ratio of Class T was above the competitive median primarily because of higher 12b-1 fees on Class T as compared to most competitor funds. Class T has a higher 12b-1 fee, but a lower front-end sales charge, than traditionally priced front-end sales charge classes. The Board considered that Class T is primarily sold load-waived in the retirement plan market where its 0.50% 12b-1 fee is comparable to competing no-load, higher 12b-1 fee classes designed specifically for retirement plans. The Board noted that the fund offers multiple classes, each of which has a different sales load and 12b-1 fee structure, and that the multiple structures are intended to offer a range of pricing options for the intermediary market. The Board also noted that the total expense ratios of the classes vary primarily by the level of their 12b-1 fees, although differences in transfer agent fees may also cause expenses to vary from class to class.
Fees Charged to Other Fidelity Clients. The Board also considered Fidelity fee structures and other information with respect to clients of Fidelity, such as other funds advised or subadvised by Fidelity, pension plan clients, and other institutional clients with similar mandates. The Board noted the findings of the 2013 ad hoc joint committee (created with the board of other Fidelity funds), which reviewed and compared Fidelity's institutional investment advisory business with its business of providing services to the Fidelity funds, including the differences in services provided, fees charged, and costs incurred, as well as competition in their respective marketplaces.
Annual Report
Based on its review of total expense ratios and fees charged to other Fidelity clients, the Board concluded that, although in some cases above the median of the universe presented for comparison, the total expense ratio of each class of the fund was reasonable in light of the services that the fund and its shareholders receive and the other factors considered.
Costs of the Services and Profitability. The Board considered the revenues earned and the expenses incurred by Fidelity in conducting the business of developing, marketing, distributing, managing, administering and servicing the fund and servicing the fund's shareholders. The Board also considered the level of Fidelity's profits in respect of all the Fidelity funds.
On an annual basis, Fidelity presents to the Board information about the profitability of its relationship with the fund. Fidelity calculates profitability information for each fund, as well as aggregate profitability information for groups of Fidelity funds and all Fidelity funds, using a series of detailed revenue and cost allocation methodologies which originate with the books and records of Fidelity on which Fidelity's audited financial statements are based. The Audit Committee of the Board reviews any significant changes from the prior year's methodologies.
PricewaterhouseCoopers LLP (PwC), independent registered public accounting firm and auditor to Fidelity and certain Fidelity funds, has been engaged annually by the Board as part of the Board's assessment of Fidelity's profitability analysis. PwC's engagement includes the review and assessment of the methodologies used by Fidelity in determining the revenues and expenses attributable to Fidelity's mutual fund business, and completion of agreed-upon procedures in respect of the mathematical accuracy of fund profitability and its conformity to established allocation methodologies. After considering PwC's reports issued under the engagement and information provided by Fidelity, the Board concluded that while other allocation methods may also be reasonable, Fidelity's profitability methodologies are reasonable in all material respects.
The Board also reviewed Fidelity's non-fund businesses and fall-out benefits related to the mutual fund business as well as cases where Fidelity's affiliates may benefit from or be related to the fund's business.
The Board considered the costs of the services provided by and the profits realized by Fidelity in connection with the operation of the fund and was satisfied that the profitability was not excessive.
Annual Report
Board Approval of Investment Advisory Contracts and
Management Fees - continued
Economies of Scale. The Board considered whether there have been economies of scale in respect of the management of the Fidelity funds, whether the Fidelity funds (including the fund) have appropriately benefited from any such economies of scale, and whether there is potential for realization of any further economies of scale. The Board considered the extent to which the fund will benefit from economies of scale as assets grow through increased services to the fund, through waivers or reimbursements, or through fee or expense ratio reductions. The Board also noted that in 2013, it and the boards of other Fidelity funds created an ad hoc committee (the Economies of Scale Committee) to analyze whether Fidelity attains economies of scale in respect of the management and servicing of the Fidelity funds, whether the Fidelity funds have appropriately benefited from such economies of scale, and whether there is potential for realization of any further economies of scale.
The Board recognized that the fund's management contract incorporates a "group fee" structure, which provides for lower group fee rates as total group assets increase, and for higher group fee rates as total group assets decrease (with "group assets" defined to include fund assets under FMR's management plus sector fund assets previously under FMR's management and currently managed by Fidelity SelectCo, LLC). FMR calculates the group fee rates based on a tiered asset "breakpoint" schedule that varies based on asset class. The Board considered that the group fee is designed to deliver the benefits of economies of scale to fund shareholders when total Fidelity fund assets increase, even if assets of any particular fund are unchanged or have declined, because some portion of Fidelity's costs are attributable to services provided to all Fidelity funds, and all funds benefit if those costs can be allocated among more assets. The Board concluded that, given the group fee structure, fund shareholders will benefit from lower management fees as group assets increase at the fund complex level, regardless of whether Fidelity achieves any such economies of scale.
The Board concluded, taking into account the analysis of the Economies of Scale Committee, that economies of scale, if any, are being appropriately shared between fund shareholders and Fidelity.
Additional Information Requested by the Board. In order to develop fully the factual basis for consideration of the Fidelity funds' Advisory Contracts, the Board requested and received additional information on certain topics, including: (i) fund performance trends and Fidelity's long-term strategies for certain funds; (ii) the various share classes employed by Fidelity and the attributes of each class, together with similar information on the distribution and servicing payments made by Fidelity or the funds to third-party participants in the distribution channels; (iii) fund profitability, and fund performance in relation to fund profitability; (iv) the methodology with respect to evaluating competitive fund data and peer group classifications and fee comparisons; (v) annual fund profitability margins, with particular focus on certain funds with negative margins; (vi) the realization of fall-out benefits in certain Fidelity business units; (vii) economies of scale and the way in which they are shared with fund shareholders; (viii) Fidelity's group fee structures, including the group fee schedule of breakpoints; (ix) the impact of cost containment measures on the funds; and (x) the transfer agent fee structure.
Annual Report
Based on its evaluation of all of the conclusions noted above, and after considering all factors it believed relevant, the Board concluded that the advisory fee structures are fair and reasonable, and that the fund's Advisory Contracts should be renewed.
Annual Report
Investment Adviser
Fidelity Management &
Research Company
Boston, MA
Investment Sub-Advisers
FMR Co., Inc.
FMR Investment Management
(U.K.) Limited
FIL Investments (Japan) Limited
FIL Investment Advisors
FIL Investment Advisors
(UK) Limited
Fidelity Management & Research
(Hong Kong) Limited
Fidelity Management & Research
(Japan) Limited
General Distributor
Fidelity Distributors Corporation
Smithfield, RI
Transfer and Service Agents
Fidelity Investments Institutional
Operations Company, Inc.
Boston, MA
Fidelity Service Company, Inc.
Boston, MA
Custodian
State Street Bank & Trust Company
Quincy, MA
The Fidelity Telephone Connection
Mutual Fund 24-Hour Service
Exchanges/Redemptions
and Account Assistance 1-800-544-6666
Product Information 1-800-544-6666
Retirement Accounts 1-800-544-4774
(8 a.m. - 9 p.m.)
TDD Service 1-800-544-0118
for the deaf and hearing impaired
(9 a.m. - 9 p.m. Eastern time)
Fidelity Automated Service
Telephone (FAST®)
1-800-544-5555

Automated line for quickest service
(Fidelity Investment logo)(registered trademark)
Corporate Headquarters
245 Summer St., Boston, MA 02210
www.fidelity.com
EME-UANN-1215
1.861971.107
ContentsPerformance: The Bottom LineManagement's Discussion of Fund PerformanceShareholder Expense ExampleInvestment Changes (Unaudited)Investments October 31, 2015Financial StatementsNotes to Financial StatementsReport of Independent Registered Public Accounting FirmTrustees and OfficersDistributions (Unaudited)Board Approval of Investment Advisory Contracts and Management FeesContentsPerformance: The Bottom LineManagement's Discussion of Fund PerformanceShareholder Expense ExampleInvestment Changes (Unaudited)Investments October 31, 2015Financial StatementsNotes to Financial StatementsReport of Independent Registered Public Accounting FirmTrustees and OfficersDistributions (Unaudited)Board Approval of Investment Advisory Contracts and Management FeesContentsPerformance: The Bottom LineManagement's Discussion of Fund PerformanceShareholder Expense ExampleInvestment Changes (Unaudited)Investments October 31, 2015Financial StatementsNotes to Financial StatementsReport of Independent Registered Public Accounting FirmTrustees and OfficersDistributions (Unaudited)Board Approval of Investment Advisory Contracts and Management Fees
Fidelity®
International Value
Fund
Annual Report
October 31, 2015
(Fidelity Cover Art)
Contents
Performance | (Click Here) | How the fund has done over time. |
Management's Discussion of Fund Performance | (Click Here) | The Portfolio Manager's review of fund performance and strategy. |
Shareholder Expense Example | (Click Here) | An example of shareholder expenses. |
Investment Changes | (Click Here) | A summary of major shifts in the fund's investments over the past six months. |
Investments | (Click Here) | A complete list of the fund's investments with their market values. |
Financial Statements | (Click Here) | Statements of assets and liabilities, operations, and changes in net assets, as well as financial highlights. |
Notes | (Click Here) | Notes to financial statements. |
Report of Independent Registered Public Accounting Firm | (Click Here) | |
Trustees and Officers | (Click Here) | |
Distributions | (Click Here) | |
Board Approval of Investment Advisory Contracts and Management Fees | (Click Here) | |
To view a fund's proxy voting guidelines and proxy voting record for the 12-month period ended June 30, visit http://www.fidelity.com/proxyvotingresults or visit the Securities and Exchange Commission's (SEC) web site at http://www.sec.gov. You may also call 1-800-544-8544 to request a free copy of the proxy voting guidelines.
Standard & Poor's, S&P and S&P 500 are registered service marks of The McGraw-Hill Companies, Inc. and have been licensed for use by Fidelity Distributors Corporation.
Other third-party marks appearing herein are the property of their respective owners.
All other marks appearing herein are registered or unregistered trademarks or service marks of FMR LLC or an affiliated company. © 2015 FMR LLC. All rights reserved.
Annual Report
This report and the financial statements contained herein are submitted for the general information of the shareholders of the fund. This report is not authorized for distribution to prospective investors in the fund unless preceded or accompanied by an effective prospectus.
A fund files its complete schedule of portfolio holdings with the SEC for the first and third quarters of each fiscal year on Form N-Q. Forms N-Q are available on the SEC's web site at http://www.sec.gov. A fund's Forms N-Q may be reviewed and copied at the SEC's Public Reference Room in Washington, DC. Information regarding the operation of the SEC's Public Reference Room may be obtained by calling 1-800-SEC-0330. For a complete list of a fund's portfolio holdings, view the most recent holdings listing, semiannual report, or annual report on Fidelity's web site at http://www.fidelity.com, http://www.advisor.fidelity.com, or http://www.401k.com, as applicable.
NOT FDIC INSURED • MAY LOSE VALUE • NO BANK GUARANTEE
Neither the fund nor Fidelity Distributors Corporation is a bank.
Annual Report
Average annual total return reflects the change in the value of an investment, assuming reinvestment of the class' distributions from dividend income and capital gains (the profits earned upon the sale of securities that have grown in value, if any) and assuming a constant rate of performance each year. The $10,000 table and the fund's returns do not reflect the deduction of taxes that a shareholder would pay on fund distributions or the redemption of fund shares. During periods of reimbursement by Fidelity, a fund's total return will be greater than it would be had the reimbursement not occurred. How a fund did yesterday is no guarantee of how it will do tomorrow.
Average Annual Total Returns
Periods ended October 31, 2015 | Past 1
year | Past 5
years | Life of
fund A |
Fidelity® International Value Fund | -0.41% | 3.48% | 0.91% |
A From May 18, 2006.
$10,000 Over Life of Fund
Let's say hypothetically that $10,000 was invested in Fidelity® International Value Fund, a class of the fund, on May 18, 2006, when the fund started. The chart shows how the value of your investment would have changed, and also shows how the MSCI EAFE Value Index performed over the same period.
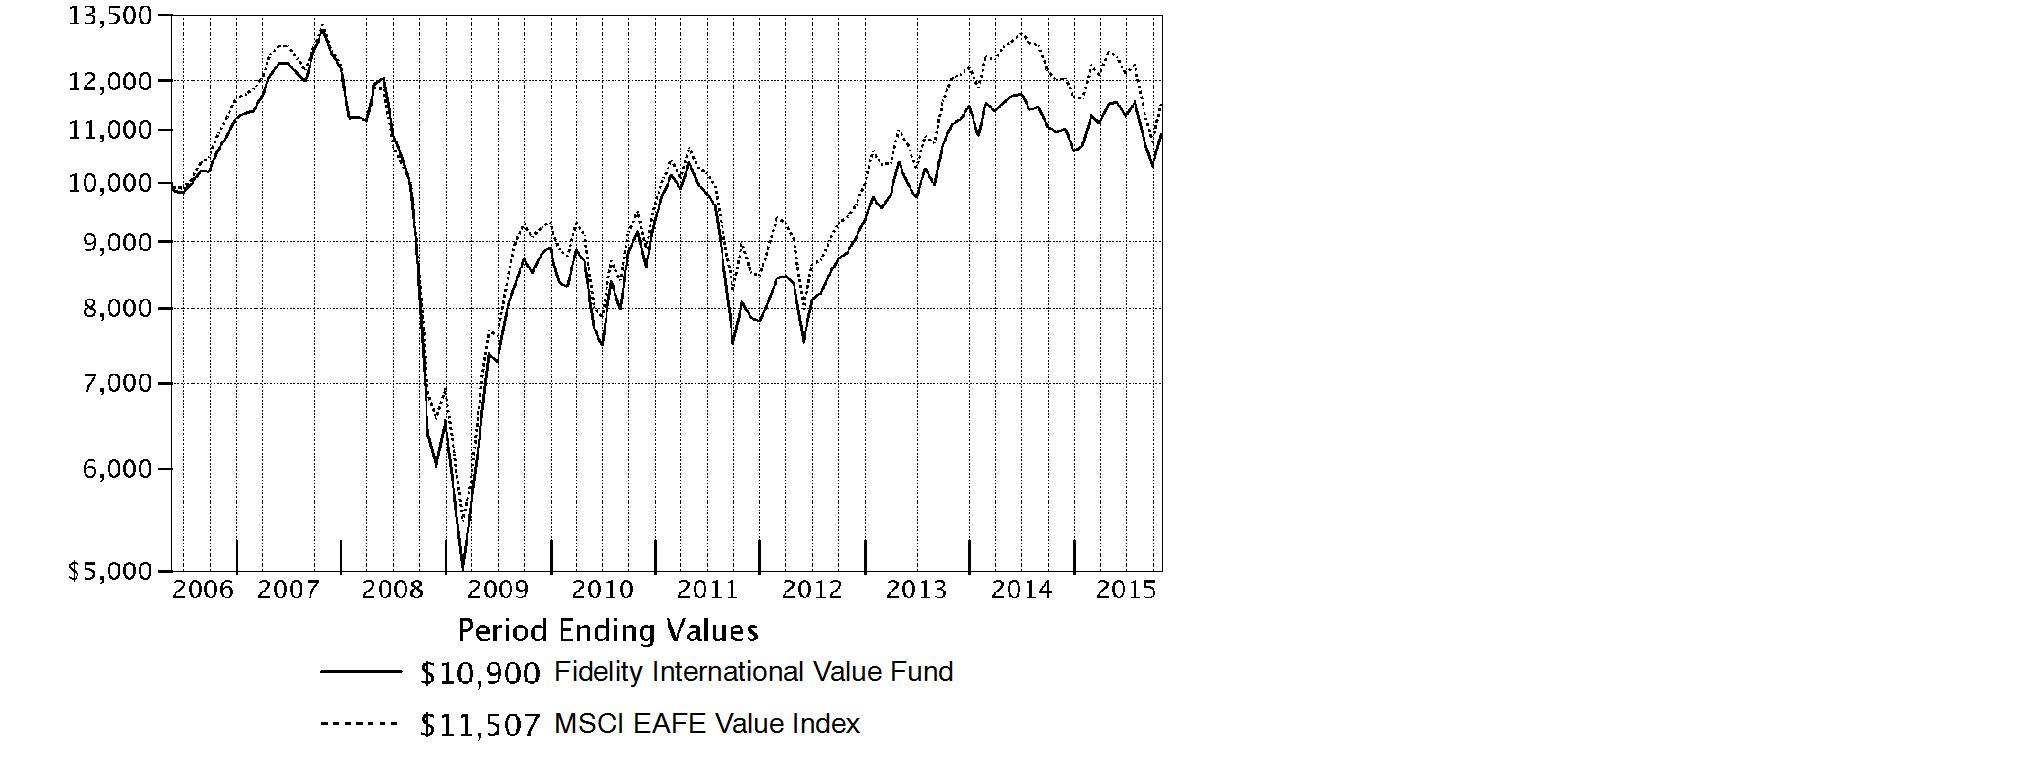
Annual Report
Market Recap: International equities suffered a moderate setback for the 12 months ending October 31, 2015, held back by a collapse in commodities prices that hurt resources-related sectors and geographies. The MSCI ACWI (All Country World Index) ex USA Index returned -4.55% for the period, affected also by concerns about global economic growth. Commodity producers remained under pressure for much of the past year, largely related to economic deceleration in China (-1%), the world's second-largest economy and a leading consumer of raw materials. This effect was exacerbated by U.S. dollar strength relative to global currencies, which weighed on commodities priced in dollars and acutely impacted equity returns within regions most exposed to resources prices. The emerging-markets group, for example, returned about -15% this period. Canada, a significant energy producer, returned roughly -17%. Net energy consumer Japan (+9%) was the best-performing region by far. Only about a quarter of the nearly 50 index countries managed a gain this period: Ireland (+19%) - the EU's fastest-growing economy - and Israel (+17%) proved top performers; Greece (-56%) and Brazil (-46%), among the worst. As for sectors, energy (-25%) and materials (-16%) declined sharply, whereas the two consumer sectors each gained about 6%.
Comments from Portfolio Manager Alex Zavratsky: For the year, the fund's share classes (excluding sales charges, if applicable) declined modestly, outperforming the -4.09% result of the benchmark MSCI EAFE Value Index. Versus the benchmark, key contributors included stock selection in various countries throughout Europe, especially France and Switzerland, as well as in the United Kingdom. Conversely, positioning in Japan detracted. Relative results also were affected by a downward fair-value pricing adjustment of 0.80 percentage points, largely related to the fund's Japan-based investments. Looking at individual stocks, largely avoiding U.K-based oil giant and index component Royal Dutch Shell helped most. The fund started the review period with an underweighted position, later eliminated. Shares of Royal Dutch Shell returned roughly -23% amid disappointing financial results, weakening oil prices and high capital expenditures, and our decisions here proved the biggest contributor to relative results this period. Avoiding Spain's Banco Santander, a benchmark constituent, also was a good call. Conversely, the fund's position in French bank BNP Paribas was the biggest relative detractor the past year. We held an underweighted position in the stock earlier in the period and sold it once the stock no longer fit our investment criteria. This stance hurt the fund because BNP outpaced the market the past year.
The views expressed above reflect those of the portfolio manager(s) only through the end of the period as stated on the cover of this report and do not necessarily represent the views of Fidelity or any other person in the Fidelity organization. Any such views are subject to change at any time based upon market or other conditions and Fidelity disclaims any responsibility to update such views. These views may not be relied on as investment advice and, because investment decisions for a Fidelity fund are based on numerous factors, may not be relied on as an indication of trading intent on behalf of any Fidelity fund.
Annual Report
Shareholder Expense Example
As a shareholder of the Fund, you incur two types of costs: (1) transaction costs, including sales charges (loads) on purchase payments or redemption proceeds, redemption fees and (2) ongoing costs, including management fees, distribution and/or service (12b-1) fees and other Fund expenses. This Example is intended to help you understand your ongoing costs (in dollars) of investing in the Fund and to compare these costs with the ongoing costs of investing in other mutual funds.
The Example is based on an investment of $1,000 invested at the beginning of the period and held for the entire period (May 1, 2015 to October 31, 2015).
Actual Expenses
The first line of the accompanying table for each class of the Fund provides information about actual account values and actual expenses. You may use the information in this line, together with the amount you invested, to estimate the expenses that you paid over the period. Simply divide your account value by $1,000.00 (for example, an $8,600 account value divided by $1,000.00 = 8.6), then multiply the result by the number in the first line for a class of the Fund under the heading entitled "Expenses Paid During Period" to estimate the expenses you paid on your account during this period. A small balance maintenance fee of $12.00 that is charged once a year may apply for certain accounts with a value of less than $2,000. This fee is not included in the table below. If it was, the estimate of expenses you paid during the period would be higher, and your ending account value lower, by this amount. In addition, the Fund, as a shareholder in the underlying Fidelity Central Funds, will indirectly bear its pro-rata share of the fees and expenses incurred by the underlying Fidelity Central Funds. These fees and expenses are not included in the Fund's annualized expense ratio used to calculate the expense estimate in the table below.
Hypothetical Example for Comparison Purposes
The second line of the accompanying table for each class of the Fund provides information about hypothetical account values and hypothetical expenses based on a Class' actual expense ratio and an assumed rate of return of 5% per year before expenses, which is not the Class' actual return. The hypothetical account values and expenses may not be used to estimate the actual ending account balance or expenses you paid for the period. You may use this information to compare the ongoing costs of investing in the Fund and other funds. To do so, compare this 5% hypothetical example with the 5% hypothetical examples that appear in the shareholder reports of the other funds. A small balance maintenance fee of $12.00 that is charged once a year may apply for certain accounts with a value of less than $2,000. This fee is not included in the table below. If it was, the estimate of expenses you paid during the period would be higher, and your ending account value lower, by this amount. In addition, the Fund, as a shareholder in the underlying Fidelity Central Funds, will indirectly bear its pro-rata share of the fees and expenses incurred by the underlying Fidelity Central Funds. These fees and expenses are not included in the Fund's annualized expense ratio used to calculate the expense estimate in the table below.
Please note that the expenses shown in the table are meant to highlight your ongoing costs only and do not reflect any transaction costs. Therefore, the second line of the table is useful in comparing ongoing costs only, and will not help you determine the relative total costs of owning different funds. In addition, if these transactional costs were included, your costs would have been higher.
Annual Report
| Annualized
Expense RatioB | Beginning
Account Value
May 1, 2015 | Ending
Account Value
October 31, 2015 | Expenses Paid
During PeriodC
May 1, 2015 to
October 31, 2015 |
Class A | 1.34% | | | |
Actual | | $ 1,000.00 | $ 944.10 | $ 6.57 |
HypotheticalA | | $ 1,000.00 | $ 1,018.45 | $ 6.82 |
Class T | 1.63% | | | |
Actual | | $ 1,000.00 | $ 942.90 | $ 7.98 |
HypotheticalA | | $ 1,000.00 | $ 1,016.99 | $ 8.29 |
Class B | 2.10% | | | |
Actual | | $ 1,000.00 | $ 941.30 | $ 10.28 |
HypotheticalA | | $ 1,000.00 | $ 1,014.62 | $ 10.66 |
Class C | 2.13% | | | |
Actual | | $ 1,000.00 | $ 940.60 | $ 10.42 |
HypotheticalA | | $ 1,000.00 | $ 1,014.47 | $ 10.82 |
International Value | .98% | | | |
Actual | | $ 1,000.00 | $ 946.30 | $ 4.81 |
HypotheticalA | | $ 1,000.00 | $ 1,020.27 | $ 4.99 |
Class I | 1.10% | | | |
Actual | | $ 1,000.00 | $ 946.30 | $ 5.40 |
HypotheticalA | | $ 1,000.00 | $ 1,019.66 | $ 5.60 |
A 5% return per year before expenses
B Annualized expense ratio reflects expenses net of applicable fee waivers.
C Expenses are equal to each Class' annualized expense ratio, multiplied by the average account value over the period, multiplied by 184/365 (to reflect the one-half year period).
Annual Report
Investment Changes (Unaudited)
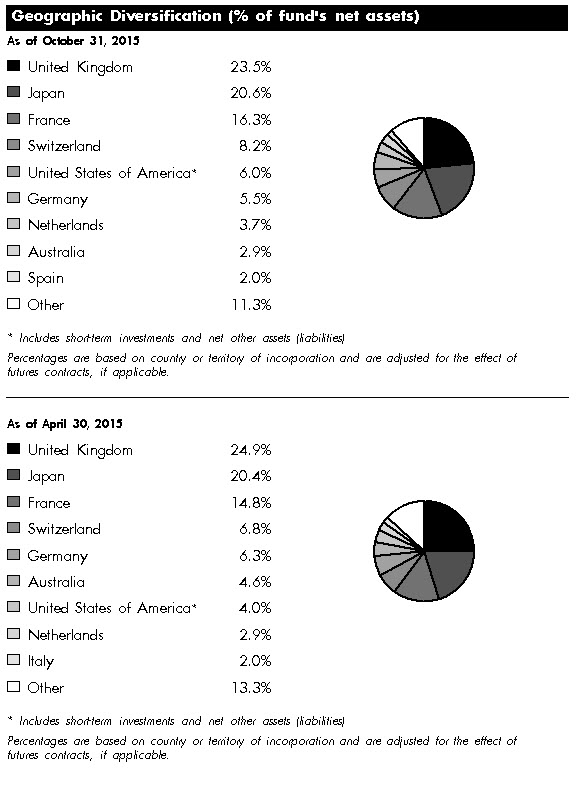
Asset Allocation as of October 31, 2015 |
| % of fund's
net assets | % of fund's net assets
6 months ago |
Stocks | 97.6 | 99.2 |
Short-Term Investments and Net Other Assets (Liabilities) | 2.4 | 0.8 |
Top Ten Stocks as of October 31, 2015 |
| % of fund's
net assets | % of fund's net assets
6 months ago |
Total SA (France, Oil, Gas & Consumable Fuels) | 3.1 | 2.8 |
Nestle SA (Switzerland, Food Products) | 2.7 | 2.0 |
Sanofi SA (France, Pharmaceuticals) | 2.6 | 2.4 |
Novartis AG (Switzerland, Pharmaceuticals) | 2.6 | 1.6 |
Toyota Motor Corp. (Japan, Automobiles) | 2.4 | 2.7 |
Mitsubishi UFJ Financial Group, Inc. (Japan, Banks) | 2.0 | 2.6 |
BP PLC sponsored ADR (United Kingdom, Oil, Gas & Consumable Fuels) | 2.0 | 2.8 |
HSBC Holdings PLC sponsored ADR (United Kingdom, Banks) | 1.9 | 2.1 |
Vodafone Group PLC sponsored ADR (United Kingdom, Wireless Telecommunication Services) | 1.8 | 2.0 |
Imperial Tobacco Group PLC (United Kingdom, Tobacco) | 1.8 | 1.2 |
| 22.9 | |
Market Sectors as of October 31, 2015 |
| % of fund's
net assets | % of fund's net assets
6 months ago |
Financials | 26.3 | 27.7 |
Health Care | 16.0 | 14.3 |
Consumer Discretionary | 14.4 | 15.5 |
Consumer Staples | 9.3 | 7.1 |
Industrials | 8.0 | 7.8 |
Energy | 6.7 | 6.8 |
Telecommunication Services | 6.1 | 7.1 |
Materials | 4.1 | 4.9 |
Information Technology | 3.6 | 5.6 |
Utilities | 3.1 | 2.4 |
Annual Report
Investments October 31, 2015
Showing Percentage of Net Assets
Common Stocks - 97.2% |
| Shares | | Value |
Australia - 2.9% |
Ansell Ltd. | 52,575 | | $ 748,141 |
Macquarie Group Ltd. | 25,419 | | 1,539,092 |
Telstra Corp. Ltd. | 157,443 | | 603,266 |
Transurban Group unit | 166,965 | | 1,237,218 |
Westpac Banking Corp. | 193,728 | | 4,315,102 |
TOTAL AUSTRALIA | | 8,442,819 |
Bailiwick of Jersey - 1.4% |
Shire PLC | 18,100 | | 1,370,729 |
Wolseley PLC | 43,283 | | 2,541,202 |
TOTAL BAILIWICK OF JERSEY | | 3,911,931 |
Belgium - 0.5% |
Anheuser-Busch InBev SA NV | 12,870 | | 1,535,708 |
Canada - 0.8% |
Imperial Oil Ltd. | 41,300 | | 1,374,245 |
Potash Corp. of Saskatchewan, Inc. | 45,500 | | 921,413 |
TOTAL CANADA | | 2,295,658 |
Denmark - 0.3% |
Topdanmark A/S (a) | 27,800 | | 739,761 |
Finland - 1.2% |
Sampo Oyj (A Shares) | 69,234 | | 3,386,403 |
France - 16.3% |
Atos Origin SA | 35,855 | | 2,860,498 |
AXA SA | 161,021 | | 4,297,347 |
Capgemini SA | 39,593 | | 3,527,920 |
Havas SA | 204,166 | | 1,771,393 |
Orange SA | 169,900 | | 2,995,624 |
Renault SA | 15,745 | | 1,484,328 |
Sanofi SA | 73,299 | | 7,394,100 |
Societe Generale Series A | 63,300 | | 2,939,856 |
Total SA | 183,273 | | 8,862,871 |
Unibail-Rodamco | 12,100 | | 3,380,995 |
VINCI SA | 57,500 | | 3,881,050 |
Vivendi SA | 140,492 | | 3,379,789 |
TOTAL FRANCE | | 46,775,771 |
Germany - 5.1% |
Axel Springer Verlag AG | 20,600 | | 1,158,464 |
BASF AG | 60,026 | | 4,917,561 |
Bayer AG | 15,103 | | 2,015,382 |
Common Stocks - continued |
| Shares | | Value |
Germany - continued |
Continental AG | 5,766 | | $ 1,386,685 |
Fresenius SE & Co. KGaA | 46,000 | | 3,380,190 |
GEA Group AG | 15,021 | | 602,323 |
SAP AG | 16,460 | | 1,297,626 |
TOTAL GERMANY | | 14,758,231 |
Hong Kong - 0.2% |
Power Assets Holdings Ltd. | 44,500 | | 442,615 |
Ireland - 1.4% |
Allergan PLC (a) | 7,280 | | 2,245,662 |
Medtronic PLC | 24,100 | | 1,781,472 |
TOTAL IRELAND | | 4,027,134 |
Israel - 1.4% |
Teva Pharmaceutical Industries Ltd. sponsored ADR | 67,099 | | 3,971,590 |
Italy - 1.7% |
Intesa Sanpaolo SpA | 654,300 | | 2,279,379 |
Mediaset SpA | 285,400 | | 1,449,941 |
Telecom Italia SpA (a) | 810,900 | | 1,131,273 |
TOTAL ITALY | | 4,860,593 |
Japan - 20.6% |
Astellas Pharma, Inc. | 196,600 | | 2,853,547 |
Dentsu, Inc. | 53,800 | | 3,024,536 |
East Japan Railway Co. | 31,200 | | 2,966,358 |
Hoya Corp. | 81,800 | | 3,375,622 |
Itochu Corp. | 192,500 | | 2,408,749 |
Japan Tobacco, Inc. | 109,100 | | 3,776,146 |
KDDI Corp. | 124,400 | | 3,010,273 |
Makita Corp. | 30,400 | | 1,665,702 |
Mitsubishi UFJ Financial Group, Inc. | 887,200 | | 5,737,997 |
Nippon Prologis REIT, Inc. | 574 | | 1,009,425 |
Nippon Telegraph & Telephone Corp. | 102,800 | | 3,768,792 |
OBIC Co. Ltd. | 31,900 | | 1,683,586 |
Olympus Corp. | 56,500 | | 1,905,820 |
ORIX Corp. | 175,700 | | 2,565,884 |
Seven & i Holdings Co. Ltd. | 57,100 | | 2,593,757 |
Seven Bank Ltd. | 388,600 | | 1,770,678 |
Sony Corp. | 70,300 | | 1,998,308 |
Sony Financial Holdings, Inc. | 114,800 | | 2,057,513 |
Common Stocks - continued |
| Shares | | Value |
Japan - continued |
Sumitomo Mitsui Financial Group, Inc. | 109,000 | | $ 4,348,410 |
Toyota Motor Corp. | 110,400 | | 6,763,594 |
TOTAL JAPAN | | 59,284,697 |
Luxembourg - 0.5% |
RTL Group SA | 16,739 | | 1,446,793 |
Netherlands - 3.7% |
ING Groep NV (Certificaten Van Aandelen) | 263,990 | | 3,842,076 |
Koninklijke KPN NV | 315,453 | | 1,155,883 |
Mylan N.V. | 19,600 | | 864,164 |
PostNL NV (a) | 92,431 | | 381,766 |
RELX NV | 253,849 | | 4,340,706 |
TOTAL NETHERLANDS | | 10,584,595 |
Singapore - 0.3% |
UOL Group Ltd. | 182,764 | | 852,916 |
Spain - 2.0% |
Iberdrola SA | 611,024 | | 4,365,416 |
Mediaset Espana Comunicacion SA | 119,100 | | 1,447,855 |
TOTAL SPAIN | | 5,813,271 |
Sweden - 1.6% |
Nordea Bank AB | 309,600 | | 3,424,478 |
Sandvik AB | 138,700 | | 1,297,134 |
TOTAL SWEDEN | | 4,721,612 |
Switzerland - 8.2% |
Credit Suisse Group AG | 10,513 | | 262,207 |
Credit Suisse Group AG (e)(f) | 91,500 | | 2,105,949 |
Nestle SA | 100,200 | | 7,652,674 |
Novartis AG | 80,719 | | 7,312,232 |
Syngenta AG (Switzerland) | 4,651 | | 1,562,598 |
UBS Group AG | 57,758 | | 1,156,893 |
Zurich Insurance Group AG | 13,435 | | 3,545,499 |
TOTAL SWITZERLAND | | 23,598,052 |
United Kingdom - 23.5% |
AstraZeneca PLC (United Kingdom) | 77,441 | | 4,935,515 |
Aviva PLC | 434,757 | | 3,249,190 |
BAE Systems PLC | 393,329 | | 2,660,671 |
Barclays PLC | 1,136,599 | | 4,049,454 |
BG Group PLC | 111,600 | | 1,763,117 |
Common Stocks - continued |
| Shares | | Value |
United Kingdom - continued |
BP PLC sponsored ADR | 160,157 | | $ 5,717,605 |
Bunzl PLC | 104,364 | | 2,990,899 |
Compass Group PLC | 183,539 | | 3,155,202 |
HSBC Holdings PLC sponsored ADR (d) | 139,842 | | 5,463,627 |
Imperial Tobacco Group PLC | 95,258 | | 5,138,272 |
Informa PLC | 241,209 | | 2,112,095 |
ITV PLC | 921,096 | | 3,583,983 |
Liberty Global PLC: | | | |
Class A (a) | 27,900 | | 1,242,108 |
Class A (a) | 7,000 | | 270,340 |
Lloyds Banking Group PLC | 3,551,200 | | 4,030,655 |
Meggitt PLC | 101,816 | | 555,009 |
Micro Focus International PLC | 64,100 | | 1,241,136 |
National Grid PLC | 276,182 | | 3,934,181 |
Prudential PLC | 69,249 | | 1,617,414 |
Rio Tinto PLC | 128,808 | | 4,694,443 |
Vodafone Group PLC sponsored ADR | 158,958 | | 5,240,845 |
TOTAL UNITED KINGDOM | | 67,645,761 |
United States of America - 3.6% |
Altria Group, Inc. | 31,400 | | 1,898,758 |
Chevron Corp. | 17,000 | | 1,544,960 |
Constellation Brands, Inc. Class A (sub. vtg.) | 21,800 | | 2,938,640 |
Edgewell Personal Care Co. (a) | 12,500 | | 1,058,875 |
McGraw Hill Financial, Inc. | 19,700 | | 1,825,008 |
ResMed, Inc. CDI | 182,510 | | 1,036,683 |
TOTAL UNITED STATES OF AMERICA | | 10,302,924 |
TOTAL COMMON STOCKS (Cost $279,167,390) |
279,398,835
|
Nonconvertible Preferred Stocks - 0.4% |
| | | |
Germany - 0.4% |
Volkswagen AG
(Cost $2,263,117) | 10,831 | |
1,300,100
|
Money Market Funds - 4.3% |
| Shares | | Value |
Fidelity Cash Central Fund, 0.18% (b) | 10,711,479 | | $ 10,711,479 |
Fidelity Securities Lending Cash Central Fund, 0.19% (b)(c) | 1,557,675 | | 1,557,675 |
TOTAL MONEY MARKET FUNDS (Cost $12,269,154) |
12,269,154
|
TOTAL INVESTMENT PORTFOLIO - 101.9% (Cost $293,699,661) | 292,968,089 |
NET OTHER ASSETS (LIABILITIES) - (1.9)% | (5,586,579) |
NET ASSETS - 100% | $ 287,381,510 |
Legend |
(a) Non-income producing |
(b) Affiliated fund that is generally available only to investment companies and other accounts managed by Fidelity Investments. The rate quoted is the annualized seven-day yield of the fund at period end. A complete unaudited listing of the fund's holdings as of its most recent quarter end is available upon request. In addition, each Fidelity Central Fund's financial statements, which are not covered by the Fund's Report of Independent Registered Public Accounting Firm, are available on the SEC's website or upon request. |
(c) Investment made with cash collateral received from securities on loan. |
(d) Security or a portion of the security is on loan at period end. |
(e) Security or a portion of the security purchased on a delayed delivery or when-issued basis. |
(f) Restricted securities - Investment in securities not registered under the Securities Act of 1933 (excluding 144A issues). At the end of the period, the value of restricted securities (excluding 144A issues) amounted to $2,105,949 or 0.7% of net assets. |
Additional information on each restricted holding is as follows: |
Security | Acquisition Date | Acquisition Cost |
Credit Suisse Group AG | 10/21/15 | $ 2,169,602 |
Affiliated Central Funds |
Information regarding fiscal year to date income earned by the Fund from investments in Fidelity Central Funds is as follows: |
Fund | Income earned |
Fidelity Cash Central Fund | $ 5,565 |
Fidelity Securities Lending Cash Central Fund | 112,755 |
Total | $ 118,320 |
Other Information |
Categorizations in the Schedule of Investments are based on country or territory of incorporation. |
The following is a summary of the inputs used, as of October 31, 2015, involving the Fund's assets and liabilities carried at fair value. The inputs or methodology used for valuing securities may not be an indication of the risk associated with investing in those securities. For more information on valuation inputs, and their aggregation into the levels used in the tables below, please refer to the Investment Valuation section in the accompanying Notes to Financial Statements. |
Valuation Inputs at Reporting Date: |
Description | Total | Level 1 | Level 2 | Level 3 |
Investments in Securities: | | | | |
Equities: | | | | |
Consumer Discretionary | $ 41,316,220 | $ 21,694,691 | $ 19,621,529 | $ - |
Consumer Staples | 26,592,830 | 11,034,545 | 15,558,285 | - |
Energy | 19,262,798 | 8,636,810 | 10,625,988 | - |
Financials | 75,793,208 | 24,758,859 | 51,034,349 | - |
Health Care | 45,190,849 | 10,878,270 | 34,312,579 | - |
Industrials | 23,188,081 | 9,708,181 | 13,479,900 | - |
Information Technology | 10,610,766 | 7,629,554 | 2,981,212 | - |
Materials | 12,096,015 | 921,413 | 11,174,602 | - |
Telecommunication Services | 17,905,956 | 5,240,845 | 12,665,111 | - |
Utilities | 8,742,212 | 4,365,416 | 4,376,796 | - |
Money Market Funds | 12,269,154 | 12,269,154 | - | - |
Total Investments in Securities: | $ 292,968,089 | $ 117,137,738 | $ 175,830,351 | $ - |
The following is a summary of transfers between Level 1 and Level 2 for the period ended October 31, 2015. Transfers are assumed to have occurred at the beginning of the period, and are primarily attributable to the valuation techniques used for foreign equity securities, as discussed in the accompanying Notes to Financial Statements: |
Transfers | Total |
Level 1 to Level 2 | $ 17,387,003 |
Level 2 to Level 1 | 3,914,138 |
See accompanying notes which are an integral part of the financial statements.
Annual Report
Statement of Assets and Liabilities
| | October 31, 2015 |
| | |
Assets | | |
Investment in securities, at value (including securities loaned of $1,512,009) - See accompanying schedule: Unaffiliated issuers (cost $281,430,507) | $ 280,698,935 | |
Fidelity Central Funds (cost $12,269,154) | 12,269,154 | |
Total Investments (cost $293,699,661) | | $ 292,968,089 |
Cash | | 11,900 |
Receivable for investments sold | | 611,490 |
Receivable for fund shares sold | | 1,965,354 |
Dividends receivable | | 851,987 |
Distributions receivable from Fidelity Central Funds | | 2,646 |
Prepaid expenses | | 559 |
Other receivables | | 1,752 |
Total assets | | 296,413,777 |
| | |
Liabilities | | |
Payable for investments purchased | | |
Regular delivery | $ 4,985,343 | |
Delayed delivery | 2,105,949 | |
Payable for fund shares redeemed | 102,123 | |
Accrued management fee | 162,913 | |
Distribution and service plan fees payable | 7,553 | |
Other affiliated payables | 48,219 | |
Other payables and accrued expenses | 62,492 | |
Collateral on securities loaned, at value | 1,557,675 | |
Total liabilities | | 9,032,267 |
| | |
Net Assets | | $ 287,381,510 |
Net Assets consist of: | | |
Paid in capital | | $ 390,986,470 |
Undistributed net investment income | | 3,583,213 |
Accumulated undistributed net realized gain (loss) on investments and foreign currency transactions | | (106,502,887) |
Net unrealized appreciation (depreciation) on investments and assets and liabilities in foreign currencies | | (685,286) |
Net Assets | | $ 287,381,510 |
See accompanying notes which are an integral part of the financial statements.
Annual Report
Financial Statements - continued
Statement of Assets and Liabilities - continued
| | October 31, 2015 |
Calculation of Maximum Offering Price | | |
Class A: | | |
Net Asset Value and redemption price per share
($8,955,961 ÷ 1,082,456 shares) | | $ 8.27 |
| | |
Maximum offering price per share (100/94.25 of $8.27) | | $ 8.77 |
Class T: | | |
Net Asset Value and redemption price per share
($4,085,545 ÷ 494,951 shares) | | $ 8.25 |
| | |
Maximum offering price per share (100/96.50 of $8.25) | | $ 8.55 |
Class B: | | |
Net Asset Value and offering price per share
($302,322 ÷ 36,246 shares)A | | $ 8.34 |
| | |
Class C: | | |
Net Asset Value and offering price per share
($4,501,895 ÷ 546,911 shares)A | | $ 8.23 |
| | |
International Value: | | |
Net Asset Value, offering price and redemption price
per share ($267,566,951 ÷ 32,294,974 shares) | | $ 8.29 |
| | |
Class I: | | |
Net Asset Value, offering price and redemption price
per share ($1,968,836 ÷ 237,625 shares) | | $ 8.29 |
A Redemption price per share is equal to net asset value less any applicable contingent deferred sales charge.
See accompanying notes which are an integral part of the financial statements.
Annual Report
Statement of Operations
| Year ended October 31, 2015 |
Investment Income | | |
Dividends | | $ 6,808,439 |
Income from Fidelity Central Funds | | 118,320 |
Income before foreign taxes withheld | | 6,926,759 |
Less foreign taxes withheld | | (493,861) |
Total income | | 6,432,898 |
| | |
Expenses | | |
Management fee | | |
Basic fee | $ 1,525,277 | |
Performance adjustment | (2,158) | |
Transfer agent fees | 408,663 | |
Distribution and service plan fees | 83,833 | |
Accounting and security lending fees | 114,042 | |
Custodian fees and expenses | 74,842 | |
Independent trustees' compensation | 905 | |
Registration fees | 74,886 | |
Audit | 60,612 | |
Legal | 535 | |
Miscellaneous | 1,759 | |
Total expenses before reductions | 2,343,196 | |
Expense reductions | (23,655) | 2,319,541 |
Net investment income (loss) | | 4,113,357 |
Realized and Unrealized Gain (Loss) | | |
Net realized gain (loss) on: | | |
Investment securities: | | |
Unaffiliated issuers | (2,418,325) | |
Foreign currency transactions | (56,980) | |
Total net realized gain (loss) | | (2,475,305) |
Change in net unrealized appreciation (depreciation) on: Investment securities | (2,382,002) | |
Assets and liabilities in foreign currencies | 71,045 | |
Total change in net unrealized appreciation (depreciation) | | (2,310,957) |
Net gain (loss) | | (4,786,262) |
Net increase (decrease) in net assets resulting from operations | | $ (672,905) |
See accompanying notes which are an integral part of the financial statements.
Annual Report
Financial Statements - continued
Statement of Changes in Net Assets
| Year ended
October 31,
2015 | Year ended
October 31,
2014 |
Increase (Decrease) in Net Assets | | |
Operations | | |
Net investment income (loss) | $ 4,113,357 | $ 7,699,402 |
Net realized gain (loss) | (2,475,305) | 12,080,123 |
Change in net unrealized appreciation (depreciation) | (2,310,957) | (23,435,459) |
Net increase (decrease) in net assets resulting from operations | (672,905) | (3,655,934) |
Distributions to shareholders from net investment income | (7,553,931) | (4,160,313) |
Distributions to shareholders from net realized gain | - | (301,192) |
Total distributions | (7,553,931) | (4,461,505) |
Share transactions - net increase (decrease) | 87,547,372 | 20,511,129 |
Redemption fees | 863 | 1,150 |
Total increase (decrease) in net assets | 79,321,399 | 12,394,840 |
| | |
Net Assets | | |
Beginning of period | 208,060,111 | 195,665,271 |
End of period (including undistributed net investment income of $3,583,213 and undistributed net investment income of $7,054,946, respectively) | $ 287,381,510 | $ 208,060,111 |
See accompanying notes which are an integral part of the financial statements.
Annual Report
Financial Highlights - Fidelity International Value Fund Class A
Years ended October 31, | 2015 | 2014 | 2013 | 2012 | 2011 |
Selected Per-Share Data | | | | | |
Net asset value, beginning of period | $ 8.62 | $ 8.96 | $ 7.39 | $ 7.02 | $ 8.22 |
Income from Investment Operations | | | | | |
Net investment income (loss) C | .13 | .31F | .17 | .20 | .22 |
Net realized and unrealized gain (loss) | (.20) | (.47) | 1.64 | .39 | (1.19) |
Total from investment operations | (.07) | (.16) | 1.81 | .59 | (.97) |
Distributions from net investment income | (.28) | (.17) | (.20) | (.22) | (.19) |
Distributions from net realized gain | - | (.01) | (.04) | - | (.03) |
Total distributions | (.28) | (.18) | (.24) | (.22) | (.23)I |
Redemption fees added to paid in capitalC, H | - | - | - | - | - |
Net asset value, end of period | $ 8.27 | $ 8.62 | $ 8.96 | $ 7.39 | $ 7.02 |
Total ReturnA, B | (.81)% | (1.76)% | 25.24% | 8.82% | (12.19)% |
Ratios to Average Net AssetsD, G | | | | | |
Expenses before reductions | 1.37% | 1.32% | 1.39% | 1.44% | 1.36% |
Expenses net of fee waivers, if any | 1.37% | 1.32% | 1.39% | 1.44% | 1.36% |
Expenses net of all reductions | 1.36% | 1.32% | 1.36% | 1.41% | 1.34% |
Net investment income (loss) | 1.58% | 3.44%F | 2.08% | 2.85% | 2.79% |
Supplemental Data | | | | | |
Net assets, end of period (000 omitted) | $ 8,956 | $ 6,296 | $ 6,191 | $ 4,491 | $ 4,668 |
Portfolio turnover rateE | 44% | 69% | 79% | 74% | 83% |
A Total returns would have been lower if certain expenses had not been reduced during the applicable periods shown.
B Total returns do not include the effect of the sales charges.
C Calculated based on average shares outstanding during the period.
D Fees and expenses of any underlying Fidelity Central Funds are not included in the Fund's expense ratio. The Fund indirectly bears its proportionate share of the expenses of any underlying Fidelity Central Funds.
E Amount does not include the portfolio activity of any underlying Fidelity Central Funds.
F Investment income per share reflects a large, non-recurring dividend which amounted to $.14 per share. Excluding this non-recurring dividend, the ratio of net investment income (loss) to average net assets would have been 1.90%.
G Expense ratios reflect operating expenses of the class. Expenses before reductions do not reflect amounts reimbursed by the investment adviser or reductions from brokerage service arrangements or reductions from other expense offset arrangements and do not represent the amount paid by the class during periods when reimbursements or reductions occur. Expenses net of fee waivers reflect expenses after reimbursement by the investment adviser but prior to reductions from brokerage service arrangements or other expense offset arrangements. Expenses net of all reductions represent the net expenses paid by the class.
H Amount represents less than $.005 per share.
I Total distributions of $.23 per share is comprised of distributions from net investment income of $.191 and distributions from net realized gain of $.034 per share.
See accompanying notes which are an integral part of the financial statements.
Annual Report
Financial Highlights - Fidelity International Value Fund Class T
Years ended October 31, | 2015 | 2014 | 2013 | 2012 | 2011 |
Selected Per-Share Data | | | | | |
Net asset value, beginning of period | $ 8.60 | $ 8.94 | $ 7.38 | $ 7.00 | $ 8.20 |
Income from Investment Operations | | | | | |
Net investment income (loss) C | .11 | .28F | .15 | .18 | .20 |
Net realized and unrealized gain (loss) | (.20) | (.46) | 1.64 | .40 | (1.19) |
Total from investment operations | (.09) | (.18) | 1.79 | .58 | (.99) |
Distributions from net investment income | (.26) | (.15) | (.19) | (.20) | (.17) |
Distributions from net realized gain | - | (.01) | (.04) | - | (.03) |
Total distributions | (.26) | (.16) | (.23) | (.20) | (.21)I |
Redemption fees added to paid in capitalC, H | - | - | - | - | - |
Net asset value, end of period | $ 8.25 | $ 8.60 | $ 8.94 | $ 7.38 | $ 7.00 |
Total ReturnA, B | (1.09)% | (1.99)% | 24.86% | 8.60% | (12.42)% |
Ratios to Average Net AssetsD, G | | | | | |
Expenses before reductions | 1.66% | 1.59% | 1.66% | 1.71% | 1.63% |
Expenses net of fee waivers, if any | 1.66% | 1.59% | 1.65% | 1.70% | 1.62% |
Expenses net of all reductions | 1.65% | 1.59% | 1.63% | 1.67% | 1.60% |
Net investment income (loss) | 1.29% | 3.17%F | 1.81% | 2.58% | 2.52% |
Supplemental Data | | | | | |
Net assets, end of period (000 omitted) | $ 4,086 | $ 3,604 | $ 3,758 | $ 2,693 | $ 2,468 |
Portfolio turnover rateE | 44% | 69% | 79% | 74% | 83% |
A Total returns would have been lower if certain expenses had not been reduced during the applicable periods shown.
B Total returns do not include the effect of the sales charges.
C Calculated based on average shares outstanding during the period.
D Fees and expenses of any underlying Fidelity Central Funds are not included in the Fund's expense ratio. The Fund indirectly bears its proportionate share of the expenses of any underlying Fidelity Central Funds.
E Amount does not include the portfolio activity of any underlying Fidelity Central Funds.
F Investment income per share reflects a large, non-recurring dividend which amounted to $.14 per share. Excluding this non-recurring dividend, the ratio of net investment income (loss) to average net assets would have been 1.64%.
G Expense ratios reflect operating expenses of the class. Expenses before reductions do not reflect amounts reimbursed by the investment adviser or reductions from brokerage service arrangements or reductions from other expense offset arrangements and do not represent the amount paid by the class during periods when reimbursements or reductions occur. Expenses net of fee waivers reflect expenses after reimbursement by the investment adviser but prior to reductions from brokerage service arrangements or other expense offset arrangements. Expenses net of all reductions represent the net expenses paid by the class.
H Amount represents less than $.005 per share.
I Total distributions of $.21 per share is comprised of distributions from net investment income of $.173 and distributions from net realized gain of $.034 per share.
See accompanying notes which are an integral part of the financial statements.
Annual Report
Financial Highlights - Fidelity International Value Fund Class B
Years ended October 31, | 2015 | 2014 | 2013 | 2012 | 2011 |
Selected Per-Share Data | | | | | |
Net asset value, beginning of period | $ 8.66 | $ 8.98 | $ 7.39 | $ 7.00 | $ 8.20 |
Income from Investment Operations | | | | | |
Net investment income (loss) C | .07 | .24F | .11 | .14 | .17 |
Net realized and unrealized gain (loss) | (.21) | (.45) | 1.65 | .41 | (1.20) |
Total from investment operations | (.14) | (.21) | 1.76 | .55 | (1.03) |
Distributions from net investment income | (.18) | (.09) | (.13) | (.16) | (.13) |
Distributions from net realized gain | - | (.01) | (.04) | - | (.03) |
Total distributions | (.18) | (.11) I | (.17) | (.16) | (.17)J |
Redemption fees added to paid in capitalC, H | - | - | - | - | - |
Net asset value, end of period | $ 8.34 | $ 8.66 | $ 8.98 | $ 7.39 | $ 7.00 |
Total ReturnA, B | (1.64)% | (2.39)% | 24.30% | 8.07% | (12.88)% |
Ratios to Average Net AssetsD, G | | | | | |
Expenses before reductions | 2.15% | 2.08% | 2.14% | 2.19% | 2.11% |
Expenses net of fee waivers, if any | 2.15% | 2.08% | 2.14% | 2.19% | 2.11% |
Expenses net of all reductions | 2.14% | 2.08% | 2.11% | 2.16% | 2.09% |
Net investment income (loss) | .81% | 2.68%F | 1.32% | 2.09% | 2.04% |
Supplemental Data | | | | | |
Net assets, end of period (000 omitted) | $ 302 | $ 414 | $ 678 | $ 691 | $ 901 |
Portfolio turnover rateE | 44% | 69% | 79% | 74% | 83% |
A Total returns would have been lower if certain expenses had not been reduced during the applicable periods shown.
B Total returns do not include the effect of the contingent deferred sales charge.
C Calculated based on average shares outstanding during the period.
D Fees and expenses of any underlying Fidelity Central Funds are not included in the Fund's expense ratio. The Fund indirectly bears its proportionate share of the expenses of any underlying Fidelity Central Funds.
E Amount does not include the portfolio activity of any underlying Fidelity Central Funds.
F Investment income per share reflects a large, non-recurring dividend which amounted to $.14 per share. Excluding this non-recurring dividend, the ratio of net investment income (loss) to average net assets would have been 1.15%.
G Expense ratios reflect operating expenses of the class. Expenses before reductions do not reflect amounts reimbursed by the investment adviser or reductions from brokerage service arrangements or reductions from other expense offset arrangements and do not represent the amount paid by the class during periods when reimbursements or reductions occur. Expenses net of fee waivers reflect expenses after reimbursement by the investment adviser but prior to reductions from brokerage service arrangements or other expense offset arrangements. Expenses net of all reductions represent the net expenses paid by the class.
H Amount represents less than $.005 per share.
I Total distributions of $.11 per share is comprised of distributions from net investment income of $.093 and distributions from net realized gain of $.014 per share.
J Total distributions of $.17 per share is comprised of distributions from net investment income of $.131 and distributions from net realized gain of $.034 per share.
See accompanying notes which are an integral part of the financial statements.
Annual Report
Financial Highlights - Fidelity International Value Fund Class C
Years ended October 31, | 2015 | 2014 | 2013 | 2012 | 2011 |
Selected Per-Share Data | | | | | |
Net asset value, beginning of period | $ 8.59 | $ 8.93 | $ 7.38 | $ 7.00 | $ 8.20 |
Income from Investment Operations | | | | | |
Net investment income (loss)C | .07 | .24F | .11 | .14 | .16 |
Net realized and unrealized gain (loss) | (.20) | (.45) | 1.63 | .41 | (1.19) |
Total from investment operations | (.13) | (.21) | 1.74 | .55 | (1.03) |
Distributions from net investment income | (.23) | (.11) | (.15) | (.17) | (.14) |
Distributions from net realized gain | - | (.01) | (.04) | - | (.03) |
Total distributions | (.23) | (.13)I | (.19) | (.17) | (.17) |
Redemption fees added to paid in capitalC, H | - | - | - | - | - |
Net asset value, end of period | $ 8.23 | $ 8.59 | $ 8.93 | $ 7.38 | $ 7.00 |
Total ReturnA, B | (1.58)% | (2.43)% | 24.17% | 8.12% | (12.84)% |
Ratios to Average Net AssetsD, G | | | | | |
Expenses before reductions | 2.15% | 2.07% | 2.14% | 2.19% | 2.12% |
Expenses net of fee waivers, if any | 2.14% | 2.07% | 2.14% | 2.19% | 2.11% |
Expenses net of all reductions | 2.14% | 2.07% | 2.11% | 2.16% | 2.09% |
Net investment income (loss) | .81% | 2.69%F | 1.33% | 2.09% | 2.04% |
Supplemental Data | | | | | |
Net assets, end of period (000 omitted) | $ 4,502 | $ 3,647 | $ 3,231 | $ 2,249 | $ 2,108 |
Portfolio turnover rateE | 44% | 69% | 79% | 74% | 83% |
A Total returns would have been lower if certain expenses had not been reduced during the applicable periods shown.
B Total returns do not include the effect of the contingent deferred sales charge.
C Calculated based on average shares outstanding during the period.
D Fees and expenses of any underlying Fidelity Central Funds are not included in the Fund's expense ratio. The Fund indirectly bears its proportionate share of the expenses of any underlying Fidelity Central Funds.
E Amount does not include the portfolio activity of any underlying Fidelity Central Funds.
F Investment income per share reflects a large, non-recurring dividend which amounted to $.14 per share. Excluding this non-recurring dividend, the ratio of net investment income (loss) to average net assets would have been 1.15%.
G Expense ratios reflect operating expenses of the class. Expenses before reductions do not reflect amounts reimbursed by the investment adviser or reductions from brokerage service arrangements or reductions from other expense offset arrangements and do not represent the amount paid by the class during periods when reimbursements or reductions occur. Expenses net of fee waivers reflect expenses after reimbursement by the investment adviser but prior to reductions from brokerage service arrangements or other expense offset arrangements. Expenses net of all reductions represent the net expenses paid by the class.
H Amount represents less than $.005 per share.
I Total distributions of $.13 per share is comprised of distributions from net investment income of $.111 and distributions from net realized gain of $.014 per share.
See accompanying notes which are an integral part of the financial statements.
Annual Report
Financial Highlights - Fidelity International Value Fund
Years ended October 31, | 2015 | 2014 | 2013 | 2012 | 2011 |
Selected Per-Share Data | | | | | |
Net asset value, beginning of period | $ 8.64 | $ 8.97 | $ 7.40 | $ 7.03 | $ 8.23 |
Income from Investment Operations | | | | | |
Net investment income (loss) B | .16 | .34E | .19 | .22 | .25 |
Net realized and unrealized gain (loss) | (.19) | (.46) | 1.65 | .40 | (1.20) |
Total from investment operations | (.03) | (.12) | 1.84 | .62 | (.95) |
Distributions from net investment income | (.32) | (.20) | (.22) | (.25) | (.22) |
Distributions from net realized gain | - | (.01) | (.04) | - | (.03) |
Total distributions | (.32) | (.21) | (.27)H | (.25) | (.25) |
Redemption fees added to paid in capitalB, G | - | - | - | - | - |
Net asset value, end of period | $ 8.29 | $ 8.64 | $ 8.97 | $ 7.40 | $ 7.03 |
Total ReturnA | (.41)% | (1.34)% | 25.57% | 9.19% | (11.91)% |
Ratios to Average Net AssetsC, F | | | | | |
Expenses before reductions | 1.02% | .96% | 1.05% | 1.13% | 1.04% |
Expenses net of fee waivers, if any | 1.02% | .96% | 1.05% | 1.13% | 1.03% |
Expenses net of all reductions | 1.01% | .95% | 1.02% | 1.10% | 1.01% |
Net investment income (loss) | 1.93% | 3.80%E | 2.41% | 3.16% | 3.11% |
Supplemental Data | | | | | |
Net assets, end of period (000 omitted) | $ 267,567 | $ 192,789 | $ 181,568 | $ 128,983 | $ 150,967 |
Portfolio turnover rateD | 44% | 69% | 79% | 74% | 83% |
A Total returns would have been lower if certain expenses had not been reduced during the applicable periods shown.
B Calculated based on average shares outstanding during the period.
C Fees and expenses of any underlying Fidelity Central Funds are not included in the Fund's expense ratio. The Fund indirectly bears its proportionate share of the expenses of any underlying Fidelity Central Funds.
D Amount does not include the portfolio activity of any underlying Fidelity Central Funds.
E Investment income per share reflects a large, non-recurring dividend which amounted to $.14 per share. Excluding this non-recurring dividend, the ratio of net investment income (loss) to average net assets would have been 2.27%.
F Expense ratios reflect operating expenses of the class. Expenses before reductions do not reflect amounts reimbursed by the investment adviser or reductions from brokerage service arrangements or reductions from other expense offset arrangements and do not represent the amount paid by the class during periods when reimbursements or reductions occur. Expenses net of fee waivers reflect expenses after reimbursement by the investment adviser but prior to reductions from brokerage service arrangements or other expense offset arrangements. Expenses net of all reductions represent the net expenses paid by the class.
G Amount represents less than $.005 per share.
H Total distributions of $.27 per share is comprised of distributions from net investment income of $.223 and distributions from net realized gain of $.042 per share.
See accompanying notes which are an integral part of the financial statements.
Annual Report
Financial Highlights - Fidelity International Value Fund Class I
Years ended October 31, | 2015 | 2014 | 2013 | 2012 | 2011 |
Selected Per-Share Data | | | | | |
Net asset value, beginning of period | $ 8.65 | $ 8.98 | $ 7.41 | $ 7.04 | $ 8.24 |
Income from Investment Operations | | | | | |
Net investment income (loss) B | .15 | .33E | .19 | .22 | .25 |
Net realized and unrealized gain (loss) | (.19) | (.45) | 1.65 | .40 | (1.19) |
Total from investment operations | (.04) | (.12) | 1.84 | .62 | (.94) |
Distributions from net investment income | (.32) | (.19) | (.23) | (.25) | (.22) |
Distributions from net realized gain | - | (.01) | (.04) | - | (.03) |
Total distributions | (.32) | (.21)H | (.27) | (.25) | (.26)I |
Redemption fees added to paid in capitalB, G | - | - | - | - | - |
Net asset value, end of period | $ 8.29 | $ 8.65 | $ 8.98 | $ 7.41 | $ 7.04 |
Total ReturnA | (.53)% | (1.41)% | 25.64% | 9.22% | (11.83)% |
Ratios to Average Net AssetsC, F | | | | | |
Expenses before reductions | 1.14% | 1.05% | 1.07% | 1.10% | .98% |
Expenses net of fee waivers, if any | 1.14% | 1.05% | 1.07% | 1.10% | .98% |
Expenses net of all reductions | 1.13% | 1.04% | 1.04% | 1.07% | .96% |
Net investment income (loss) | 1.81% | 3.71%E | 2.39% | 3.18% | 3.17% |
Supplemental Data | | | | | |
Net assets, end of period (000 omitted) | $ 1,969 | $ 1,310 | $ 239 | $ 372 | $ 473 |
Portfolio turnover rateD | 44% | 69% | 79% | 74% | 83% |
A Total returns would have been lower if certain expenses had not been reduced during the applicable periods shown.
B Calculated based on average shares outstanding during the period.
C Fees and expenses of any underlying Fidelity Central Funds are not included in the Fund's expense ratio. The Fund indirectly bears its proportionate share of the expenses of any underlying Fidelity Central Funds.
D Amount does not include the portfolio activity of any underlying Fidelity Central Funds.
E Investment income per share reflects a large, non-recurring dividend which amounted to $.14 per share. Excluding this non-recurring dividend, the ratio of net investment income (loss) to average net assets would have been 2.18%.
F Expense ratios reflect operating expenses of the class. Expenses before reductions do not reflect amounts reimbursed by the investment adviser or reductions from brokerage service arrangements or reductions from other expense offset arrangements and do not represent the amount paid by the class during periods when reimbursements or reductions occur. Expenses net of fee waivers reflect expenses after reimbursement by the investment adviser but prior to reductions from brokerage service arrangements or other expense offset arrangements. Expenses net of all reductions represent the net expenses paid by the class.
G Amount represents less than $.005 per share.
H Total distributions of $.21 per share is comprised of distributions from net investment income of $.191 and distributions from net realized gain of $.014 per share.
I Total distributions of $.26 per share is comprised of distributions from net investment income of $.221 and distributions from net realized gain of $.034 per share.
See accompanying notes which are an integral part of the financial statements.
Annual Report
For the period ended October 31, 2015
1. Organization.
Fidelity International Value Fund (the Fund) is a fund of Fidelity Investment Trust (the Trust) and is authorized to issue an unlimited number of shares. The Trust is registered under the Investment Company Act of 1940, as amended (the 1940 Act), as an open-end management investment company organized as a Massachusetts business trust. The Fund offers Class A, Class T, Class C, International Value, and Class I (formerly Institutional Class) shares, each of which, along with Class B shares, has equal rights as to assets and voting privileges. Class B shares are closed to new accounts and additional purchases, except for exchanges and reinvestments. Each class has exclusive voting rights with respect to matters that affect that class. Class B shares will automatically convert to Class A shares after a holding period of seven years from the initial date of purchase.
2. Investments in Fidelity Central Funds.
The Fund invests in Fidelity Central Funds, which are open-end investment companies generally available only to other investment companies and accounts managed by the investment adviser and its affiliates. The Fund's Schedule of Investments lists each of the Fidelity Central Funds held as of period end, if any, as an investment of the Fund, but does not include the underlying holdings of each Fidelity Central Fund. As an Investing Fund, the Fund indirectly bears its proportionate share of the expenses of the underlying Fidelity Central Funds.
The Money Market Central Funds seek preservation of capital and current income and are managed by Fidelity Investments Money Management, Inc. (FIMM), an affiliate of the investment adviser. Annualized expenses of the Money Market Central Funds as of their most recent shareholder report date are less than .005%.
A complete unaudited list of holdings for each Fidelity Central Fund is available upon request or at the Securities and Exchange Commission (the SEC) website at www.sec.gov. In addition, the financial statements of the Fidelity Central Funds, which are not covered by the Fund's Report of Independent Registered Public Accounting Firm, are available on the SEC website or upon request.
3. Significant Accounting Policies.
The financial statements have been prepared in conformity with accounting principles generally accepted in the United States of America (GAAP), which require management to make certain estimates and assumptions at the date of the financial statements. Actual results could differ from those estimates. Subsequent events, if any, through the date that the financial statements were issued have been evaluated in the preparation of the financial statements. The following summarizes the significant accounting policies of the Fund:
Annual Report
3. Significant Accounting Policies - continued
Investment Valuation. Investments are valued as of 4:00 p.m. Eastern time on the last calendar day of the period. The Board of Trustees (the Board) has delegated the day to day responsibility for the valuation of the Fund's investments to the Fidelity Management & Research Company (FMR) Fair Value Committee (the Committee). In accordance with valuation policies and procedures approved by the Board, the Fund attempts to obtain prices from one or more third party pricing vendors or brokers to value its investments. When current market prices, quotations or currency exchange rates are not readily available or reliable, investments will be fair valued in good faith by the Committee, in accordance with procedures adopted by the Board. Factors used in determining fair value vary by investment type and may include market or investment specific events. The frequency with which these procedures are used cannot be predicted and they may be utilized to a significant extent. The Committee oversees the Fund's valuation policies and procedures and reports to the Board on the Committee's activities and fair value determinations. The Board monitors the appropriateness of the procedures used in valuing the Fund's investments and ratifies the fair value determinations of the Committee.
The Fund categorizes the inputs to valuation techniques used to value its investments into a disclosure hierarchy consisting of three levels as shown below:
Level 1 - quoted prices in active markets for identical investments
Level 2 - other significant observable inputs (including quoted prices for similar investments, interest rates, prepayment speeds, etc.)
Level 3 - unobservable inputs (including the Fund's own assumptions based on the best information available)
Valuation techniques used to value the Fund's investments by major category are as follows:
Equity securities, including restricted securities, for which market quotations are readily available, are valued at the last reported sale price or official closing price as reported by a third party pricing vendor on the primary market or exchange on which they are traded and are categorized as Level 1 in the hierarchy. In the event there were no sales during the day or closing prices are not available, securities are valued at the last quoted bid price or may be valued using the last available price and are generally categorized as Level 2 in the hierarchy. For foreign equity securities, when market or security specific events arise, comparisons to the valuation of American Depositary Receipts (ADRs), futures contracts, Exchange-Traded Funds (ETFs) and certain indexes as well as quoted prices for similar securities may be used and would be categorized as Level 2 in the hierarchy. Utilizing these techniques may result in transfers between Level 1 and Level 2.
Annual Report
Notes to Financial Statements - continued
3. Significant Accounting Policies - continued
Investment Valuation - continued
For equity securities, including restricted securities, where observable inputs are limited, assumptions about market activity and risk are used and these securities may be categorized as Level 3 in the hierarchy.
Investments in open-end mutual funds, including the Fidelity Central Funds, are valued at their closing net asset value (NAV) each business day and are categorized as Level 1 in the hierarchy.
Changes in valuation techniques may result in transfers in or out of an assigned level within the disclosure hierarchy. The aggregate value of investments by input level as of October 31, 2015, including information on transfers between Levels 1 and 2, is included at the end of the Fund's Schedule of Investments.
Foreign Currency. The Fund may use foreign currency contracts to facilitate transactions in foreign-denominated securities. Gains and losses from these transactions may arise from changes in the value of the foreign currency or if the counterparties do not perform under the contracts' terms.
Foreign-denominated assets, including investment securities, and liabilities are translated into U.S. dollars at the exchange rates at period end. Purchases and sales of investment securities, income and dividends received and expenses denominated in foreign currencies are translated into U.S. dollars at the exchange rate in effect on the transaction date.
The effects of exchange rate fluctuations on investments are included with the net realized and unrealized gain (loss) on investment securities. Other foreign currency transactions resulting in realized and unrealized gain (loss) are disclosed separately.
Investment Transactions and Income. For financial reporting purposes, the Fund's investment holdings and NAV include trades executed through the end of the last business day of the period. The NAV per share for processing shareholder transactions is calculated as of the close of business of the New York Stock Exchange (NYSE), normally 4:00 p.m. Eastern time and includes trades executed through the end of the prior business day. Gains and losses on securities sold are determined on the basis of identified cost. Dividend income is recorded on the ex-dividend date, except for certain dividends from foreign securities where the ex-dividend date may have passed, which are recorded as soon as the Fund is informed of the ex-dividend date. Non-cash dividends included in dividend income, if any, are recorded at the fair market value of the securities received. Income and capital gain distributions from Fidelity Central Funds, if any, are recorded on the ex-dividend date. Distributions received on securities that represent a return of
Annual Report
3. Significant Accounting Policies - continued
Investment Transactions and Income - continued
capital or capital gain are recorded as a reduction of cost of investments and/or as a realized gain. Subsequent to ex-dividend date the Fund determines the components of these distributions, based upon receipt of tax filings or other correspondence relating to the underlying investment. Interest income is accrued as earned and includes coupon interest and amortization of premium and accretion of discount on debt securities as applicable. Investment income is recorded net of foreign taxes withheld where recovery of such taxes is uncertain.
Class Allocations and Expenses. Investment income, realized and unrealized capital gains and losses, common expenses of the Fund, and certain fund-level expense reductions, if any, are allocated daily on a pro-rata basis to each class based on the relative net assets of each class to the total net assets of the Fund. Each class differs with respect to transfer agent and distribution and service plan fees incurred. Certain expense reductions may also differ by class. For the reporting period, the allocated portion of income and expenses to each class as a percent of its average net assets may vary due to the timing of recording these transactions in relation to fluctuating net assets of the classes. Expenses directly attributable to a fund are charged to that fund. Expenses attributable to more than one fund are allocated among the respective funds on the basis of relative net assets or other appropriate methods. Expense estimates are accrued in the period to which they relate and adjustments are made when actual amounts are known.
Income Tax Information and Distributions to Shareholders. Each year, the Fund intends to qualify as a regulated investment company under Subchapter M of the Internal Revenue Code, including distributing substantially all of its taxable income and realized gains. As a result, no provision for U.S. Federal income taxes is required. As of October 31, 2015, the Fund did not have any unrecognized tax benefits in the financial statements; nor is the Fund aware of any tax positions for which it is reasonably possible that the total amounts of unrecognized tax benefits will significantly change in the next twelve months. The Fund files a U.S. federal tax return, in addition to state and local tax returns as required. The Fund's federal income tax returns are subject to examination by the Internal Revenue Service (IRS) for a period of three fiscal years after they are filed. State and local tax returns may be subject to examination for an additional fiscal year depending on the jurisdiction. Foreign taxes are provided for based on the Fund's understanding of the tax rules and rates that exist in the foreign markets in which it invests.
Distributions are declared and recorded on the ex-dividend date. Income dividends and capital gain distributions are declared separately for each class. Income and capital gain distributions are determined in accordance with income tax regulations, which may differ from GAAP
Annual Report
Notes to Financial Statements - continued
3. Significant Accounting Policies - continued
Income Tax Information and Distributions to Shareholders - continued
Capital accounts within the financial statements are adjusted for permanent book-tax differences. These adjustments have no impact on net assets or the results of operations. Capital accounts are not adjusted for temporary book-tax differences which will reverse in a subsequent period.
Book-tax differences are primarily due to foreign currency transactions, passive foreign investment companies (PFIC), partnerships, capital loss carryforwards, and losses deferred due to wash sales.
The federal tax cost of investment securities and unrealized appreciation (depreciation) as of period end were as follows:
Gross unrealized appreciation | $ 19,037,265 |
Gross unrealized depreciation | (20,289,295) |
Net unrealized appreciation (depreciation) on securities | $ (1,252,030) |
Tax Cost | $ 294,220,119 |
The tax-based components of distributable earnings as of period end were as follows:
Undistributed ordinary income | $ 3,582,798 |
Capital loss carryforward | $ (105,982,428) |
Net unrealized appreciation (depreciation) on securities and other investments | $ (1,205,329) |
Capital loss carryforwards are only available to offset future capital gains of the Fund to the extent provided by regulations and may be limited. Under the Regulated Investment Company Modernization Act of 2010 (the Act), the Fund is permitted to carry forward capital losses incurred in taxable years beginning after December 22, 2010 for an unlimited period and such capital losses are required to be used prior to any losses that expire. The capital loss carryforward information presented below, including any applicable limitation, is estimated as of fiscal period end and is subject to adjustment.
Fiscal year of expiration | |
2016 | $ (2,663,413) |
2017 | (65,376,972) |
2018 | (3,571,319) |
2019 | (31,368,797) |
Total with expiration | $ (102,980,501) |
No expiration | |
Short-term | $ (3,001,927) |
Total capital loss carryforward | $ (105,982,428) |
The tax character of distributions paid was as follows:
| October 31, 2015 | October 31, 2014 |
Ordinary Income | 7,553,931 | 4,461,505 |
Annual Report
3. Significant Accounting Policies - continued
Short-Term Trading (Redemption) Fees. Shares held by investors in the Fund less than 30 days may have been subject to a redemption fee equal to 1.00% of the NAV of shares redeemed. All redemption fees, which reduce the proceeds of the shareholder redemption, are retained by the Fund and accounted for as an addition to paid in capital.
Delayed Delivery Transactions and When-Issued Securities. During the period, the Fund transacted in securities on a delayed delivery or when-issued basis. Payment and delivery may take place after the customary settlement period for that security. The price of the underlying securities and the date when the securities will be delivered and paid for are fixed at the time the transaction is negotiated. The securities purchased on a delayed delivery or when-issued basis are identified as such in the Fund's Schedule of Investments. With respect to purchase commitments, the Fund identifies securities as segregated in its records with a value at least equal to the amount of the commitment. Losses may arise due to changes in the value of the underlying securities or if the counterparty does not perform under the contract's terms, or if the issuer does not issue the securities due to political, economic, or other factors.
Restricted Securities. The Fund may invest in securities that are subject to legal or contractual restrictions on resale. These securities generally may be resold in transactions exempt from registration or to the public if the securities are registered. Disposal of these securities may involve time-consuming negotiations and expense, and prompt sale at an acceptable price may be difficult. Information regarding restricted securities is included at the end of the Fund's Schedule of Investments.
4. Purchases and Sales of Investments.
Purchases and sales of securities, other than short-term securities, aggregated $174,734,340 and $94,895,330, respectively.
5. Fees and Other Transactions with Affiliates.
Management Fee. Fidelity Management & Research Company (the investment adviser) and its affiliates provide the Fund with investment management related services for which the Fund pays a monthly management fee. The management fee is the sum of an individual fund fee rate that is based on an annual rate of .45% of the Fund's average net assets and an annualized group fee rate that averaged .25% during the period. The group fee rate is based upon the average net assets of all the mutual funds advised by the investment adviser, including any mutual funds previously advised by the investment adviser that are currently advised by Fidelity SelectCo, LLC, an affiliate of the investment adviser. The group fee rate decreases as assets under management increase and increases as assets under management decrease. In addition, the management fee is
Annual Report
Notes to Financial Statements - continued
5. Fees and Other Transactions with Affiliates - continued
Management Fee - continued
subject to a performance adjustment (up to a maximum of ± .20% of the Fund's average net assets over a 36 month performance period). The upward or downward adjustment to the management fee is based on the relative investment performance of International Value as compared to its benchmark index, the MSCI EAFE Value Index, over the same 36 month performance period. For the reporting period, the total annual management fee rate, including the performance adjustment, was .70% of the Fund's average net assets. The performance adjustment included in the management fee rate may be higher or lower than the maximum performance adjustment rate due to the difference between the average net assets for the reporting and performance periods.
Distribution and Service Plan Fees. In accordance with Rule 12b-1 of the 1940 Act, the Fund has adopted separate Distribution and Service Plans for each class of shares. Certain classes pay Fidelity Distributors Corporation (FDC), an affiliate of the investment adviser, separate Distribution and Service Fees, each of which is based on an annual percentage of each class' average net assets. In addition, FDC may pay financial intermediaries for selling shares of the Fund and providing shareholder support services. For the period, the Distribution and Service Fee rates, total fees and amounts retained by FDC were as follows:
| Distribution
Fee | Service
Fee | Total Fees | Retained
by FDC |
Class A | -% | .25% | $ 18,667 | $ 598 |
Class T | .25% | .25% | 19,464 | - |
Class B | .75% | .25% | 3,497 | 2,623 |
Class C | .75% | .25% | 42,205 | 7,959 |
| | | $ 83,833 | $ 11,180 |
Sales Load. FDC may receive a front-end sales charge of up to 5.75% for selling Class A shares and 3.50% for selling Class T shares, some of which is paid to financial intermediaries for selling shares of the Fund. Depending on the holding period, FDC may receive contingent deferred sales charges levied on Class A, Class T, Class B, and Class C redemptions. The deferred sales charges range from 5.00% to 1.00% for Class B shares, 1.00% for Class C shares, 1.00% for certain purchases of Class A shares and .25% for certain purchases of Class T shares.
Annual Report
5. Fees and Other Transactions with Affiliates - continued
Sales Load - continued
For the period, sales charge amounts retained by FDC were as follows:
| Retained
by FDC |
Class A | $ 6,394 |
Class T | 1,543 |
Class BA | 99 |
Class CA | 969 |
| $ 9,005 |
A When Class B and Class C shares are initially sold, FDC pays commissions from its own resources to financial intermediaries through which the sales are made.
Transfer Agent Fees. Fidelity Investments Institutional Operations Company, Inc., (FIIOC), an affiliate of the investment adviser, is the transfer, dividend disbursing and shareholder servicing agent for each class of the Fund. FIIOC receives account fees and asset-based fees that vary according to the account size and type of account of the shareholders of the respective classes of the Fund. FIIOC pays for typesetting, printing and mailing of shareholder reports, except proxy statements.
For the period, transfer agent fees for each class were as follows:
| Amount | % of
Class-Level Average
Net Assets |
Class A | $ 20,480 | .27 |
Class T | 12,140 | .31 |
Class B | 1,039 | .30 |
Class C | 12,740 | .30 |
International Value | 355,158 | .18 |
Class I | 7,106 | .29 |
| $ 408,663 | |
Accounting and Security Lending Fees. Fidelity Service Company, Inc. (FSC), an affiliate of the investment adviser, maintains the Fund's accounting records. The accounting fee is based on the level of average net assets for each month. Under a separate contract, FSC administers the security lending program. The security lending fee is based on the number and duration of lending transactions.
Brokerage Commissions. The Fund placed a portion of its portfolio transactions with brokerage firms which are affiliates of the investment adviser. Brokerage commissions are included in net realized gain (loss) and change in net unrealized appreciation (depreciation) in the Statement of Operations. The commissions paid to these affiliated firms were $227 for the period.
Annual Report
Notes to Financial Statements - continued
6. Committed Line of Credit.
The Fund participates with other funds managed by the investment adviser or an affiliate in a $4.25 billion credit facility (the "line of credit") to be utilized for temporary or emergency purposes to fund shareholder redemptions or for other short-term liquidity purposes. The Fund has agreed to pay commitment fees on its pro-rata portion of the line of credit, which amounted to $305 and is reflected in Miscellaneous expenses on the Statement of Operations. During the period, the Fund did not borrow on this line of credit.
7. Security Lending.
The Fund lends portfolio securities through a lending agent from time to time in order to earn additional income. For equity securities, a lending agent is used and may loan securities to certain qualified borrowers, including Fidelity Capital Markets (FCM), a broker-dealer affiliated with the Fund. On the settlement date of the loan, the Fund receives collateral (in the form of U.S. Treasury obligations, letters of credit and/or cash) against the loaned securities and maintains collateral in an amount not less than 100% of the market value of the loaned securities during the period of the loan. The market value of the loaned securities is determined at the close of business of the Fund and any additional required collateral is delivered to the Fund on the next business day. The Fund or borrower may terminate the loan at any time, and if the borrower defaults on its obligation to return the securities loaned because of insolvency or other reasons, the Fund may apply collateral received from the borrower against the obligation. The Fund may experience delays and costs in recovering the securities loaned. Any cash collateral received is invested in the Fidelity Securities Lending Cash Central Fund. The value of loaned securities and cash collateral at period end are disclosed on the Fund's Statement of Assets and Liabilities. Security lending income represents the income earned on investing cash collateral, less rebates paid to borrowers and any lending agent fees associated with the loan, plus any premium payments received for lending certain types of securities. Security lending income is presented in the Statement of Operations as a component of income from Fidelity Central Funds. Total security lending income during the period amounted to $112,755. During the period, there were no securities loaned to FCM.
Annual Report
8. Expense Reductions.
Commissions paid to certain brokers with whom the investment adviser, or its affiliates, places trades on behalf of the Fund include an amount in addition to trade execution, which may be rebated back to the Fund to offset certain expenses. This amount totaled $18,272 for the period.
In addition, during the period the investment adviser reimbursed and /or waived a portion of fund-level operating expenses in the amount of $841 and a portion of class-level operating expenses as follows:
| Amount |
Class A | $ 23 |
Class T | 8 |
Class B | 1 |
Class C | 8 |
International Value | 4,489 |
Class I | 13 |
| $ 4,542 |
9. Distributions to Shareholders.
Distributions to shareholders of each class were as follows:
Years ended October 31, | 2015 | 2014 |
From net investment income | | |
Class A | $ 204,314 | $ 117,558 |
Class T | 109,443 | 63,542 |
Class B | 8,373 | 6,919 |
Class C | 99,311 | 40,539 |
International Value | 7,079,700 | 3,926,459 |
Class I | 52,790 | 5,296 |
Total | $ 7,553,931 | $ 4,160,313 |
From net realized gain | | |
Class A | $ - | $ 9,681 |
Class T | - | 5,931 |
Class B | - | 1,042 |
Class C | - | 5,113 |
International Value | - | 279,037 |
Class I | - | 388 |
Total | $ - | $ 301,192 |
Annual Report
Notes to Financial Statements - continued
10. Share Transactions.
Share transactions for each class were as follows and may contain automatic conversions between classes or exchanges between funds:
| Shares | Dollars |
Years ended October 31, | 2015 | 2014 | 2015 | 2014 |
Class A | | | | |
Shares sold | 527,583 | 271,659 | $ 4,502,640 | $ 2,416,438 |
Reinvestment of distributions | 23,604 | 12,904 | 197,333 | 112,525 |
Shares redeemed | (198,812) | (245,285) | (1,665,353) | (2,196,440) |
Net increase (decrease) | 352,375 | 39,278 | $ 3,034,620 | $ 332,523 |
Class T | | | | |
Shares sold | 117,820 | 79,778 | $ 1,007,336 | $ 709,484 |
Reinvestment of distributions | 12,981 | 7,900 | 108,520 | 68,891 |
Shares redeemed | (54,747) | (88,989) | (463,119) | (796,094) |
Net increase (decrease) | 76,054 | (1,311) | $ 652,737 | $ (17,719) |
Class B | | | | |
Shares sold | 2,257 | 1,662 | $ 18,258 | $ 15,295 |
Reinvestment of distributions | 891 | 756 | 7,565 | 6,661 |
Shares redeemed | (14,741) | (30,069) | (124,607) | (270,154) |
Net increase (decrease) | (11,593) | (27,651) | $ (98,784) | $ (248,198) |
Class C | | | | |
Shares sold | 208,019 | 107,427 | $ 1,779,247 | $ 961,012 |
Reinvestment of distributions | 10,999 | 4,784 | 92,173 | 41,813 |
Shares redeemed | (96,570) | (49,408) | (802,299) | (437,003) |
Net increase (decrease) | 122,448 | 62,803 | $ 1,069,121 | $ 565,822 |
International Value | | | | |
Shares sold | 14,508,730 | 5,177,049 | $ 121,044,962 | $ 46,484,243 |
Reinvestment of distributions | 823,202 | 470,965 | 6,873,736 | 4,097,400 |
Shares redeemed | (5,350,163) | (3,570,903) | (45,687,658) | (31,830,840) |
Net increase (decrease) | 9,981,769 | 2,077,111 | $ 82,231,040 | $ 18,750,803 |
Class I | | | | |
Shares sold | 413,299 | 140,760 | $ 3,523,105 | $ 1,271,347 |
Reinvestment of distributions | 5,275 | 394 | 44,098 | 3,438 |
Shares redeemed | (332,392) | (16,367) | (2,908,565) | (146,887) |
Net increase (decrease) | 86,182 | 124,787 | $ 658,638 | $ 1,127,898 |
11. Other.
The Fund's organizational documents provide former and current trustees and officers with a limited indemnification against liabilities arising in connection with the performance of their duties to the Fund. In the normal course of business, the Fund may also enter into contracts that provide general indemnifications. The Fund's maximum exposure under these arrangements is unknown as this would be dependent on future claims that may be made against the Fund. The risk of material loss from such claims is considered remote.
Annual Report
11. Other - continued
At the end of the period, Strategic Advisers International II Fund, was the owner of record of approximately 60% of the total outstanding shares of the Fund. Mutual funds managed by the investment adviser or its affiliates were the owners of record, in the aggregate, of approximately 63% of the total outstanding shares of the Fund.
Annual Report
To the Trustees of Fidelity Investment Trust and Shareholders of Fidelity International Value Fund:
We have audited the accompanying statement of assets and liabilities of Fidelity International Value Fund (the Fund), a fund of Fidelity Investment Trust, including the schedule of investments, as of October 31, 2015, and the related statement of operations for the year then ended, the statement of changes in net assets for each of the two years in the period then ended, and the financial highlights for each of the five years in the period then ended. These financial statements and financial highlights are the responsibility of the Fund's management. Our responsibility is to express an opinion on these financial statements and financial highlights based on our audits.
We conducted our audits in accordance with the standards of the Public Company Accounting Oversight Board (United States). Those standards require that we plan and perform the audit to obtain reasonable assurance about whether the financial statements and financial highlights are free of material misstatement. The Fund is not required to have, nor were we engaged to perform, an audit of its internal control over financial reporting. Our audits included consideration of internal control over financial reporting as a basis for designing audit procedures that are appropriate in the circumstances, but not for the purpose of expressing an opinion on the effectiveness of the Fund's internal control over financial reporting. Accordingly, we express no such opinion. An audit also includes examining, on a test basis, evidence supporting the amounts and disclosures in the financial statements, assessing the accounting principles used and significant estimates made by management, as well as evaluating the overall financial statement presentation. Our procedures included confirmation of securities owned as of October 31, 2015, by correspondence with the custodians and brokers; when replies were not received from brokers, we performed other auditing procedures. We believe that our audits provide a reasonable basis for our opinion.
In our opinion, such financial statements and financial highlights referred to above present fairly, in all material respects, the financial position of Fidelity International Value Fund as of October 31, 2015, the results of its operations for the year then ended, the changes in its net assets for each of the two years in the period then ended, and the financial highlights for each of the five years in the period then ended, in conformity with accounting principles generally accepted in the United States of America.
DELOITTE & TOUCHE LLP
Boston, Massachusetts
December 17, 2015
Annual Report
The Trustees, Member of the Advisory Board, and officers of the trust and fund, as applicable, are listed below. The Board of Trustees governs the fund and is responsible for protecting the interests of shareholders. The Trustees are experienced executives who meet periodically throughout the year to oversee the fund's activities, review contractual arrangements with companies that provide services to the fund, oversee management of the risks associated with such activities and contractual arrangements, and review the fund's performance. Each of the Trustees oversees 170 funds.
The Trustees hold office without limit in time except that (a) any Trustee may resign; (b) any Trustee may be removed by written instrument, signed by at least two-thirds of the number of Trustees prior to such removal; (c) any Trustee who requests to be retired or who has become incapacitated by illness or injury may be retired by written instrument signed by a majority of the other Trustees; and (d) any Trustee may be removed at any special meeting of shareholders by a two-thirds vote of the outstanding voting securities of the trust. Each Trustee who is not an interested person (as defined in the 1940 Act) of the trust and the fund (Independent Trustee), shall retire not later than the last day of the calendar year in which his or her 75th birthday occurs. The Independent Trustees may waive this mandatory retirement age policy with respect to individual Trustees. The officers and Advisory Board Member hold office without limit in time, except that any officer and Advisory Board Member may resign or may be removed by a vote of a majority of the Trustees at any regular meeting or any special meeting of the Trustees. Except as indicated, each individual has held the office shown or other offices in the same company for the past five years.
Experience, Skills, Attributes, and Qualifications of the Fund's Trustees. The Governance and Nominating Committee has adopted a statement of policy that describes the experience, qualifications, attributes, and skills that are necessary and desirable for potential Independent Trustee candidates (Statement of Policy). The Board believes that each Trustee satisfied at the time he or she was initially elected or appointed a Trustee, and continues to satisfy, the standards contemplated by the Statement of Policy. The Governance and Nominating Committee also engages professional search firms to help identify potential Independent Trustee candidates who have the experience, qualifications, attributes, and skills consistent with the Statement of Policy. From time to time, additional criteria based on the composition and skills of the current Independent Trustees, as well as experience or skills that may be appropriate in light of future changes to board composition, business conditions, and regulatory or other developments, have also been considered by the professional search firms and the Governance and Nominating Committee. In addition, the Board takes into account the Trustees' commitment and participation in Board and committee meetings, as well as their leadership of standing and ad hoc committees throughout their tenure.
In determining that a particular Trustee was and continues to be qualified to serve as a Trustee, the Board has considered a variety of criteria, none of which, in isolation, was controlling. The Board believes that, collectively, the Trustees have balanced and diverse experience, qualifications, attributes, and skills, which allow the Board to operate effectively in governing the fund and protecting the interests of shareholders. Information about the specific experience, skills, attributes, and qualifications of each Trustee, which in each case led to the Board's conclusion that the Trustee should serve (or continue to serve) as a trustee of the fund, is provided below.
Annual Report
Board Structure and Oversight Function. James C. Curvey is an interested person (as defined in the 1940 Act) and currently serves as Chairman. The Trustees have determined that an interested Chairman is appropriate and benefits shareholders because an interested Chairman has a personal and professional stake in the quality and continuity of services provided to the fund. Independent Trustees exercise their informed business judgment to appoint an individual of their choosing to serve as Chairman, regardless of whether the Trustee happens to be independent or a member of management. The Independent Trustees have determined that they can act independently and effectively without having an Independent Trustee serve as Chairman and that a key structural component for assuring that they are in a position to do so is for the Independent Trustees to constitute a substantial majority for the Board. The Independent Trustees also regularly meet in executive session. Ned C. Lautenbach serves as Chairman of the Independent Trustees and as such (i) acts as a liaison between the Independent Trustees and management with respect to matters important to the Independent Trustees and (ii) with management prepares agendas for Board meetings.
Fidelity funds are overseen by different Boards of Trustees. The fund's Board oversees Fidelity's high income and certain equity funds, and other Boards oversee Fidelity's investment-grade bond, money market, asset allocation, and sector funds. The asset allocation funds may invest in Fidelity funds overseen by the fund's Board. The use of separate Boards, each with its own committee structure, allows the Trustees of each group of Fidelity funds to focus on the unique issues of the funds they oversee, including common research, investment, and operational issues. On occasion, the separate Boards establish joint committees to address issues of overlapping consequences for the Fidelity funds overseen by each Board.
The Trustees operate using a system of committees to facilitate the timely and efficient consideration of all matters of importance to the Trustees, the fund, and fund shareholders and to facilitate compliance with legal and regulatory requirements and oversight of the fund's activities and associated risks. The Board, acting through its committees, has charged FMR and its affiliates with (i) identifying events or circumstances the occurrence of which could have demonstrably adverse effects on the fund's business and/or reputation; (ii) implementing processes and controls to lessen the possibility that such events or circumstances occur or to mitigate the effects of such events or circumstances if they do occur; and (iii) creating and maintaining a system designed to evaluate continuously business and market conditions in order to facilitate the identification and implementation processes described in (i) and (ii) above. Because the day-to-day operations and activities of the fund are carried out by or through FMR, its affiliates and other service providers, the fund's exposure to risks is mitigated but not eliminated by the processes overseen by the Trustees. While each of the Board's committees has responsibility for overseeing different aspects of the fund's activities, oversight is exercised primarily through the Operations, Audit, and Compliance Committees. In addition, the Independent Trustees have worked with FMR to enhance the Board's oversight of investment and financial risks, legal and regulatory risks, technology risks, and operational risks, including the development of additional risk reporting to the Board. For example, a working group comprised of Independent Trustees and FMR has worked and continues to work to review the Fidelity funds' valuation-related activities, reporting and risk management. Appropriate personnel, including but not limited to the fund's Chief Compliance Officer (CCO), FMR's internal auditor, the independent accountants, the fund's Treasurer and portfolio management personnel, make periodic reports to the Board's committees, as appropriate, including an annual review of Fidelity's risk management program for the Fidelity funds. The responsibilities of each standing committee, including their oversight responsibilities, are described further under "Standing Committees of the Fund's Trustees."
Annual Report
Trustees and Officers - continued
The fund's Statement of Additional Information (SAI) includes more information about the Trustees. To request a free copy, call Fidelity at 1-800-544-8544.
Interested Trustees*:
Correspondence intended for each Trustee who is an interested person may be sent to Fidelity Investments, 245 Summer Street, Boston, Massachusetts 02210.
Name, Year of Birth; Principal Occupations and Other Relevant Experience+ |
James C. Curvey (1935) |
Year of Election or Appointment: 2007 Trustee Chairman of the Board of Trustees |
| Mr. Curvey also serves as Trustee of other Fidelity funds. Mr. Curvey is a Director of Fidelity Research & Analysis Co. (investment adviser firm, 2009-present), and Vice Chairman (2007-present) and Director of FMR LLC (diversified financial services company). In addition, Mr. Curvey serves as an Overseer for the Boston Symphony Orchestra and a member of the board of Artis-Naples, Naples, Florida, and as a Trustee for Brewster Academy, Wolfeboro, New Hampshire. Previously, Mr. Curvey served as a Director of Fidelity Investments Money Management, Inc. (investment adviser firm, 2009-2014) and a Director of FMR and FMR Co., Inc. (investment adviser firms, 2007-2014). |
Charles S. Morrison (1960) |
Year of Election or Appointment: 2014 Trustee |
| Mr. Morrison also serves as Trustee of other funds. He serves as a Director of Fidelity Investments Money Management, Inc. (FIMM) (investment adviser firm, 2014-present), Director of Fidelity SelectCo, LLC (investment adviser firm, 2014-present), President, Asset Management (2014-present), and is an employee of Fidelity Investments. Previously, Mr. Morrison served as Vice President of Fidelity's Fixed Income and Asset Allocation Funds (2012-2014), President, Fixed Income (2011-2014), Vice President of Fidelity's Money Market Funds (2005-2009), President, Money Market Group Leader of FMR (investment adviser firm, 2009), and Senior Vice President, Money Market Group of FMR (2004-2009). Mr. Morrison also served as Vice President of Fidelity's Bond Funds (2002-2005), certain Balanced Funds (2002-2005), and certain Asset Allocation Funds (2002-2007), and as Senior Vice President (2002-2005) of Fidelity's Bond Division. |
* Trustees have been determined to be "Interested Trustees" by virtue of, among other things, their affiliation with the trust or various entities under common control with FMR.
+ The information above includes each Trustee's principal occupation during the last five years and other information relating to the experience, attributes, and skills relevant to each Trustee's qualifications to serve as a Trustee, which led to the conclusion that each Trustee should serve as a Trustee for the fund.
Annual Report
Trustees and Officers - continued
Independent Trustees:
Correspondence intended for each Independent Trustee (that is, the Trustees other than the Interested Trustees) may be sent to Fidelity Investments, P.O. Box 55235, Boston, Massachusetts 02205-5235.
Name, Year of Birth; Principal Occupations and Other Relevant Experience+ |
Dennis J. Dirks (1948) |
Year of Election or Appointment: 2005 Trustee |
| Mr. Dirks also serves as Trustee of other Fidelity funds. Prior to his retirement in May 2003, Mr. Dirks was Chief Operating Officer and a member of the Board of The Depository Trust & Clearing Corporation (DTCC). He also served as President, Chief Operating Officer, and Board member of The Depository Trust Company (DTC) and President and Board member of the National Securities Clearing Corporation (NSCC). In addition, Mr. Dirks served as Chief Executive Officer and Board member of the Government Securities Clearing Corporation, Chief Executive Officer and Board member of the Mortgage-Backed Securities Clearing Corporation, as a Trustee and a member of the Finance Committee of Manhattan College (2005-2008), as a Trustee and a member of the Finance Committee of AHRC of Nassau County (2006-2008), and as a member of the Independent Directors Council (IDC) Governing Council (2010-2015). Mr. Dirks is a member of the Board of Directors for The Brookville Center for Children's Services, Inc. (2009-present). |
Alan J. Lacy (1953) |
Year of Election or Appointment: 2008 Trustee |
| Mr. Lacy also serves as Trustee of other Fidelity funds. Mr. Lacy serves as a member of the Board of Directors of Dave & Buster's Entertainment, Inc. (restaurant and entertainment complexes, 2010-present) and Bristol-Myers Squibb Company (global pharmaceuticals, 2008-present). In addition, Mr. Lacy served as Senior Adviser (2007-2014) of Oak Hill Capital Partners, L.P. (private equity) and also served as Chief Executive Officer (2000-2005) and Vice Chairman (2005-2006) of Sears Holdings Corporation and Sears, Roebuck and Co. (retail). Mr. Lacy is a member of the Board of Trustees of The National Parks Conservation Association (2006-present). Previously, Mr. Lacy served as Chairman of the Board of Trustees of the National Parks Conservation Association (2008-2011) and as a member of the Board of Directors for The Western Union Company (global money transfer, 2006-2011), The Hillman Companies, Inc. (hardware wholesalers, 2010-2014), and Earth Fare, Inc. (retail grocery, 2010-2014). |
Ned C. Lautenbach (1944) |
Year of Election or Appointment: 2000 Trustee Chairman of the Independent Trustees |
| Mr. Lautenbach also serves as Trustee of other Fidelity funds. Mr. Lautenbach currently serves as the Lead Director of the Eaton Corporation Board of Directors (diversified industrial, 1997-present). Mr. Lautenbach is Chairman of the Board of Directors of Artis-Naples in Naples, Florida (2012-present), a member of the Council on Foreign Relations (1994-present), and a member of the Board of Governors, State University System of Florida (2013-present). Previously, Mr. Lautenbach was a Partner/Advisory Partner at Clayton, Dubilier & Rice, LLC (private equity investment, 1998-2010), as well as a Director of Sony Corporation (2006-2007). |
Joseph Mauriello (1944) |
Year of Election or Appointment: 2008 Trustee |
| Mr. Mauriello also serves as Trustee of other Fidelity funds. Prior to his retirement in January 2006, Mr. Mauriello served in numerous senior management positions including Deputy Chairman and Chief Operating Officer (2004-2005), and Vice Chairman of Financial Services (2002-2004) of KPMG LLP US (professional services, 1965-2005). Mr. Mauriello currently serves as a member of the Board of Directors of XL Group plc. (global insurance and re-insurance, 2006-present) and the Independent Directors Council (IDC) Governing Council (2015-present). Previously, Mr. Mauriello served as a Director of the Hamilton Funds of the Bank of New York (2006-2007) and of Arcadia Resources Inc. (health care services and products, 2007-2012). |
Robert W. Selander (1950) |
Year of Election or Appointment: 2011 Trustee |
| Mr. Selander also serves as Trustee of other Fidelity funds. Mr. Selander serves as a Director of The Western Union Company (global money transfer, 2014-present). Previously, Mr. Selander served as a Member of the Advisory Board of other Fidelity funds (2011), and Executive Vice Chairman (2010), Chief Executive Officer (2009-2010), and President and Chief Executive Officer (1997-2009) of Mastercard, Inc. |
Cornelia M. Small (1944) |
Year of Election or Appointment: 2005 Trustee |
| Ms. Small also serves as Trustee of other Fidelity funds. Ms. Small is a member of the Board of Directors (2009-present) and Chair of the Investment Committee (2010-present) of the Teagle Foundation. Ms. Small also serves on the Investment Committee of the Berkshire Taconic Community Foundation (2008-present). Previously, Ms. Small served as Chairperson (2002-2008) and a member of the Investment Committee and Chairperson (2008-2012) and a member of the Board of Trustees of Smith College. In addition, Ms. Small served as Chief Investment Officer, Director of Global Equity Investments, and a member of the Board of Directors of Scudder, Stevens & Clark and Scudder Kemper Investments. |
William S. Stavropoulos (1939) |
Year of Election or Appointment: 2001 Trustee Vice Chairman of the Independent Trustees |
| Mr. Stavropoulos also serves as Trustee of other Fidelity funds. Mr. Stavropoulos serves as President and Founder of the Michigan Baseball Foundation, the Great Lakes Loons (2007-present). Mr. Stavropoulos is Chairman Emeritus of the Board of Directors of The Dow Chemical Company, where he previously served in numerous senior management positions, including President, CEO (1995-2000; 2002-2004), Chairman of the Executive Committee (2000-2006), and as a member of the Board of Directors (1990-2006). Currently, Mr. Stavropoulos is Chairman of the Board of Directors of Univar Inc. (global distributor of commodity and specialty chemicals), a Director of Teradata Corporation (data warehousing and technology solutions), and Maersk Inc. (industrial conglomerate), and a member of the Advisory Board for Metalmark Capital LLC (private equity investment, 2005-present). Mr. Stavropoulos is an operating advisor to Clayton, Dubilier & Rice, LLC (private equity investment). In addition, Mr. Stavropoulos is a member of the University of Notre Dame Advisory Council for the College of Science, a Trustee of the Rollin L. Gerstacker Foundation, and a Director of the Naples Philharmonic Center for the Arts. Previously, Mr. Stavropoulos served as a Director of Chemical Financial Corporation (bank holding company, 1993-2012) and Tyco International, Ltd. (multinational manufacturing and services, 2007-2012). |
David M. Thomas (1949) |
Year of Election or Appointment: 2008 Trustee |
| Mr. Thomas also serves as Trustee of other Fidelity funds. Mr. Thomas serves as Non-Executive Chairman of the Board of Directors of Fortune Brands Home and Security (home and security products, 2011-present), as a member of the Board of Directors (2004-present) and Presiding Director (2013-present) of Interpublic Group of Companies, Inc. (marketing communication), and as a member of the Board of Trustees of the University of Florida (2013-present). Previously, Mr. Thomas served as Executive Chairman (2005-2006) and Chairman and Chief Executive Officer (2000-2005) of IMS Health, Inc. (pharmaceutical and healthcare information solutions), and a Director of Fortune Brands, Inc. (consumer products, 2000-2011). |
+ The information above includes each Trustee's principal occupation during the last five years and other information relating to the experience, attributes, and skills relevant to each Trustee's qualifications to serve as a Trustee, which led to the conclusion that each Trustee should serve as a Trustee for the fund.
Advisory Board Member and Officers:
Correspondence intended for each officer and Peter S. Lynch may be sent to Fidelity Investments, 245 Summer Street, Boston, Massachusetts 02210. Officers appear below in alphabetical order.
Name, Year of Birth; Principal Occupation |
Peter S. Lynch (1944) |
Year of Election or Appointment: 2003 Member of the Advisory Board |
| Mr. Lynch also serves as Member of the Advisory Board of other Fidelity funds. Mr. Lynch is Vice Chairman and a Director of FMR (investment adviser firm) and FMR Co., Inc. (investment adviser firm). In addition, Mr. Lynch serves as a Trustee of Boston College and as the Chairman of the Inner-City Scholarship Fund. Previously, Mr. Lynch served on the Special Olympics International Board of Directors (1997-2006). |
Elizabeth Paige Baumann (1968) |
Year of Election or Appointment: 2012 Anti-Money Laundering (AML) Officer |
| Ms. Baumann also serves as AML Officer of other funds. She is Chief AML Officer of FMR LLC (diversified financial services company, 2012-present) and is an employee of Fidelity Investments. Previously, Ms. Baumann served as Vice President and Deputy Anti-Money Laundering Officer (2007-2012). |
Marc R. Bryant (1966) |
Year of Election or Appointment: 2015 Secretary and Chief Legal Officer (CLO) |
| Mr. Bryant also serves as Secretary and CLO of other funds. Mr. Bryant serves as CLO, Secretary, and Senior Vice President of Fidelity Management & Research Company (investment adviser firm, 2015-present) and FMR Co., Inc. (investment adviser firm, 2015-present); Secretary of Fidelity SelectCo, LLC (investment adviser firm, 2015-present) and Fidelity Investments Money Management, Inc. (investment adviser firm, 2015-present); and CLO of Fidelity Management & Research (Hong Kong) Limited (investment adviser firm, 2015-present). He is Senior Vice President and Deputy General Counsel of FMR LLC (diversified financial services company). Previously, Mr. Bryant served as Secretary and Chief Legal Officer of Fidelity Rutland Square Trust II (2010-2014) and Assistant Secretary of Fidelity's Fixed Income and Asset Allocation Funds (2013-2015). Prior to joining Fidelity Investments, Mr. Bryant served as a Senior Vice President and the Head of Global Retail Legal for AllianceBernstein L.P. (2006-2010), and as the General Counsel for ProFund Advisors LLC (2001-2006). |
William C. Coffey (1969) |
Year of Election or Appointment: 2009 Assistant Secretary |
| Mr. Coffey also serves as Assistant Secretary of other funds. He is Senior Vice President and Deputy General Counsel of FMR LLC (diversified financial services company, 2010-present), and is an employee of Fidelity Investments. Previously, Mr. Coffey served as Vice President and Associate General Counsel of FMR LLC (2005-2009). |
Timothy M. Cohen (1969) |
Year of Election or Appointment: 2014 Vice President of certain Equity Funds |
| Mr. Cohen also serves as Vice President of other funds. Mr. Cohen serves as Chief Compliance Officer of FMR Investment Management (U.K.) Limited (investment adviser firm, 2013-present) and is an employee of Fidelity Investments. Previously, Mr. Cohen served as a Director of FMR Investment Management (U.K.) Limited (2013-2015). |
Jonathan Davis (1968) |
Year of Election or Appointment: 2010 Assistant Treasurer |
| Mr. Davis also serves as Assistant Treasurer of other funds, and is an employee of Fidelity Investments. Previously, Mr. Davis served as Vice President and Associate General Counsel of FMR LLC (diversified financial services company, 2003-2010). |
Adrien E. Deberghes (1967) |
Year of Election or Appointment: 2008 Deputy Treasurer |
| Mr. Deberghes also serves as an officer of other funds. He is an employee of Fidelity Investments (2008-present). Prior to joining Fidelity Investments, Mr. Deberghes was Senior Vice President of Mutual Fund Administration at State Street Corporation (2007-2008), Senior Director of Mutual Fund Administration at Investors Bank & Trust (2005-2007), and Director of Finance for Dunkin' Brands (2000-2005). |
Stephanie J. Dorsey (1969) |
Year of Election or Appointment: 2010 Assistant Treasurer |
| Ms. Dorsey also serves as an officer of other funds. She is an employee of Fidelity Investments (2008-present) and has served in other fund officer roles. Prior to joining Fidelity Investments, Ms. Dorsey served as Treasurer (2004-2008) of the JPMorgan Mutual Funds and Vice President (2004-2008) of JPMorgan Chase Bank. |
Howard J. Galligan III (1966) |
Year of Election or Appointment: 2014 Chief Financial Officer |
| Mr. Galligan also serves as Chief Financial Officer of other funds. Mr. Galligan serves as President of Fidelity Pricing and Cash Management Services (FPCMS) (2014-present) and as a Director of Strategic Advisers, Inc. (investment adviser firm, 2008-present). Previously, Mr. Galligan served as Chief Administrative Officer of Asset Management (2011-2014) and Chief Operating Officer and Senior Vice President of Investment Support for Strategic Advisers, Inc. (2003-2011). |
Scott C. Goebel (1968) |
Year of Election or Appointment: 2015 Vice President |
| Mr. Goebel serves as Vice President of other funds and is an employee of Fidelity Investments (2001-present). Previously, Mr. Goebel served as Secretary of Fidelity SelectCo, LLC (investment adviser firm, 2013-2015), Fidelity Investments Money Management, Inc. (FIMM) (investment adviser firm, 2010-2015), and Fidelity Research and Analysis Company (FRAC) (investment adviser firm, 2010-2015); General Counsel, Secretary, and Senior Vice President of Fidelity Management & Research Company (investment adviser firm, 2008-2015) and FMR Co., Inc. (investment adviser firm, 2008-2015); Assistant Secretary of Fidelity Management & Research (Japan) Limited (investment adviser firm, 2008-2015) and FMR Investment Management (U.K.) Limited (investment adviser firm, 2008-2015); Chief Legal Officer (CLO) of Fidelity Management & Research (Hong Kong) Limited (investment adviser firm, 2008-2015); Secretary and CLO of certain Fidelity funds (2008-2015); Assistant Secretary of FIMM (2008-2010), FRAC (2008-2010), and certain funds (2007-2008); and as Vice President and Secretary of Fidelity Distributors Corporation (FDC) (2005-2007). |
Brian B. Hogan (1964) |
Year of Election or Appointment: 2009 Vice President |
| Mr. Hogan also serves as Trustee or Vice President of other funds. Mr. Hogan serves as a Director of Fidelity SelectCo, LLC (investment adviser firm, 2014-present) and President of the Equity Division of FMR (investment adviser firm, 2009-present). Previously, Mr. Hogan served as Senior Vice President, Equity Research of FMR (2006-2009) and as a portfolio manager. |
Chris Maher (1972) |
Year of Election or Appointment: 2013 Assistant Treasurer |
| Mr. Maher serves as Assistant Treasurer of other funds. Mr. Maher is Vice President of Valuation Oversight and is an employee of Fidelity Investments. Previously, Mr. Maher served as Vice President of Asset Management Compliance (2013), Vice President of the Program Management Group of FMR (investment adviser firm, 2010-2013), and Vice President of Valuation Oversight (2008-2010). |
Kenneth B. Robins (1969) |
Year of Election or Appointment: 2008 President and Treasurer |
| Mr. Robins also serves as an officer of other funds. Mr. Robins serves as Executive Vice President of Fidelity Investments Money Management, Inc. (FIMM) (investment adviser firm, 2013-present) and is an employee of Fidelity Investments (2004-present). Previously, Mr. Robins served in other fund officer roles. |
Stacie M. Smith (1974) |
Year of Election or Appointment: 2013 Deputy Treasurer |
| Ms. Smith also serves as an officer of other funds. She is an employee of Fidelity Investments (2009-present) and has served in other fund officer roles. Prior to joining Fidelity Investments, Ms. Smith served as Senior Audit Manager of Ernst & Young LLP (1996-2009). |
Renee Stagnone (1975) |
Year of Election or Appointment: 2013 Deputy Treasurer |
| Ms. Stagnone also serves as Deputy Treasurer of other funds. Ms. Stagnone is an employee of Fidelity Investments (1997-present). |
Linda J. Wondrack (1964) |
Year of Election or Appointment: 2014 Chief Compliance Officer |
| Ms. Wondrack also serves as Chief Compliance Officer of other funds. Ms. Wondrack is Executive Vice President and head of the Ethics Office and Asset Management Compliance for Fidelity Investments (2012- present). Ms. Wondrack also serves as Chief Compliance Officer of Fidelity SelectCo, LLC (investment adviser firm, 2014-present); Chief Compliance Officer of Impresa Management LLC (2013-present); and Chief Compliance Officer of FMR Co., Inc. (investment adviser firm), Fidelity Investments Money Management, Inc. (investment adviser firm), Fidelity Management & Research (Japan) Limited (investment adviser firm), FMR Investment Management (U.K.) Limited (investment adviser firm), Fidelity Management & Research (Hong Kong) (investment adviser firm), Fidelity Management & Research Company (investment adviser firm), FIAM LLC (investment adviser firm), and Strategic Advisers, Inc. (investment adviser firm), Ballyrock Investment Advisors LLC, and Northern Neck Investors LLC (2012-present). Previously, Ms. Wondrack served as Senior Vice President and Chief Compliance Officer for Columbia Management Investment Advisers, LLC (2005-2012); Chief Compliance Officer for certain funds within the Columbia Family of Funds (2007-2012); and Senior Vice President of Compliance Risk Management at Bank of America (2005-2010). |
Joseph F. Zambello (1957) |
Year of Election or Appointment: 2011 Deputy Treasurer |
| Mr. Zambello also serves as Deputy Treasurer of other funds. Mr. Zambello is an employee of Fidelity Investments (1991-present). Previously, Mr. Zambello served as Vice President of the Program Management Group of FMR (investment adviser firm, 2009-2011) and Vice President of the Transfer Agent Oversight Group (2005-2009). |
Annual Report
International Value Fund designates 1% of the dividends distributed during the fiscal year as qualifying for the dividends-received deduction for corporate shareholders.
International Value Fund designates 100% of the dividends distributed during the fiscal year as amounts which may be taken into account as a dividend for the purposes of the maximum rate under section 1(h)(11) of the Internal Revenue Code.
The amounts per share which represent income derived from sources within, and taxes paid to, foreign countries or possessions of the United States are as follows:
| Pay Date | Income | Taxes |
International Value Fund | 12/08/2014 | $0.3261 | $0.0091 |
The fund will notify shareholders in January 2016 of amounts for use in preparing 2015 income tax returns.
Annual Report
Fidelity International Value Fund
Each year, the Board of Trustees, including the Independent Trustees (together, the Board), votes on the renewal of the management contract with Fidelity Management & Research Company (FMR) and the sub-advisory agreements (together, the Advisory Contracts) for the fund. The Board, assisted by the advice of fund counsel and Independent Trustees' counsel, requests and considers a broad range of information relevant to the renewal of the Advisory Contracts throughout the year.
The Board meets regularly and, at each of its meetings, covers an extensive agenda of topics and materials and considers factors that are relevant to its annual consideration of the renewal of the fund's Advisory Contracts, including the services and support provided to the fund and its shareholders. The Board has established various standing committees (Committees), each composed of and chaired by Independent Trustees with varying backgrounds, to which the Board has assigned specific subject matter responsibilities in order to enhance effective decision-making by the Board. The Board, acting directly and through its Committees, requests and receives information concerning the annual consideration of the renewal of the fund's Advisory Contracts. The Board also meets as needed to consider matters specifically related to the Board's annual consideration of the renewal of the Advisory Contracts. Members of the Board may also meet with trustees of other Fidelity funds through ad hoc joint committees to discuss certain matters relevant to all of the Fidelity funds.
At its July 2015 meeting, the Board unanimously determined to renew the fund's Advisory Contracts. In reaching its determination, the Board considered all factors it believed relevant, including (i) the nature, extent, and quality of the services to be provided to the fund and its shareholders (including the investment performance of the fund); (ii) the competitiveness of the fund's management fee and total expense ratio relative to peer funds; (iii) the total costs of the services to be provided by and the profits to be realized by Fidelity from its relationship with the fund; and (iv) the extent to which (if any) economies of scale exist and would be realized as the fund grows, and whether any economies of scale are appropriately shared with fund shareholders.
In considering whether to renew the Advisory Contracts for the fund, the Board reached a determination, with the assistance of fund counsel and Independent Trustees' counsel and through the exercise of its business judgment, that the renewal of the Advisory Contracts was in the best interests of the fund and its shareholders and that the compensation payable under the Advisory Contracts was fair and reasonable. The Board's decision to renew the Advisory Contracts was not based on any single factor, but rather was based on a comprehensive consideration of all the information provided to the Board at its meetings throughout the year. The Board, in reaching its determination to renew the Advisory Contracts, was aware that shareholders of the fund have a broad range of investment choices available to them, including a wide choice among funds offered by Fidelity's competitors, and that the fund's shareholders, who have the opportunity to review and weigh the disclosure provided by the fund in its prospectus and other public disclosures, have chosen to invest in this fund, which is part of the Fidelity family of funds.
Annual Report
Nature, Extent, and Quality of Services Provided. The Board considered Fidelity's staffing as it relates to the fund, including the backgrounds of investment personnel of Fidelity, and also considered the fund's investment objective, strategies, and related investment philosophy. The Independent Trustees also had discussions with senior management of Fidelity's investment operations and investment groups. The Board considered the structure of the portfolio manager compensation program and whether this structure provides appropriate incentives to act in the best interests of the fund. Additionally, the Board considered the portfolio managers' investments, if any, in the funds that they manage.
Resources Dedicated to Investment Management and Support Services. The Board and the Fund Oversight and Research Committees reviewed the general qualifications and capabilities of Fidelity's investment staff, including its size, education, experience, and resources, as well as Fidelity's approach to recruiting, training, managing, and compensating investment personnel. The Board noted that Fidelity has continued to increase the resources devoted to non-U.S. offices, including expansion of Fidelity's global investment organization. The Board also noted that Fidelity's analysts have extensive resources, tools and capabilities that allow them to conduct sophisticated quantitative and fundamental analysis, as well as credit analysis of issuers, counterparties and guarantors. Further, the Board considered that Fidelity's investment professionals have sufficient access to global information and data so as to provide competitive investment results over time, and that those professionals also have access to sophisticated tools that permit them to assess portfolio construction and risk and performance attribution characteristics continuously, as well as to transmit new information and research conclusions rapidly around the world. Additionally, in its deliberations, the Board considered Fidelity's trading, risk management, and compliance capabilities and resources, which are integral parts of the investment management process.
Shareholder and Administrative Services. The Board considered (i) the nature, extent, quality, and cost of advisory, administrative, and shareholder services performed by FMR, the sub-advisers (together with FMR, the Investment Advisers), and their affiliates under the Advisory Contracts and under separate agreements covering transfer agency, pricing and bookkeeping, and securities lending services for the fund; (ii) the nature and extent of the supervision of third party service providers, principally custodians and subcustodians; and (iii) the resources devoted to, and the record of compliance with, the fund's compliance policies and procedures. The Board also reviewed the allocation of fund brokerage, including allocations to brokers affiliated with the Investment Advisers, the use of brokerage commissions to pay fund expenses, and the use of "soft" commission dollars to pay for research services.
Annual Report
Board Approval of Investment Advisory Contracts and
Management Fees - continued
The Board noted that the growth of fund assets over time across the complex allows Fidelity to reinvest in the development of services designed to enhance the value or convenience of the Fidelity funds as investment vehicles. These services include 24-hour access to account information and market information through telephone representatives and over the Internet, investor education materials and asset allocation tools, and the expanded availability of Fidelity Investor Centers.
In 2014, the Board formed an ad hoc Committee on Transfer Agency Fees to review the variety of transfer agency fee structures throughout the industry and Fidelity's competitive positioning with respect to industry participants.
Investment in a Large Fund Family. The Board considered the benefits to shareholders of investing in a Fidelity fund, including the benefits of investing in a fund that is part of a large family of funds offering a variety of investment disciplines and providing a large variety of mutual fund investor services. The Board noted that Fidelity had taken, or had made recommendations that resulted in the Fidelity funds taking, a number of actions over the previous year that benefited particular funds, including (i) continuing to dedicate additional resources to investment research and to the support of the senior management team that oversees asset management; (ii) continuing efforts to enhance Fidelity's global research capabilities; (iii) launching new funds and making other enhancements to meet client needs; (iv) reducing management fees and total expenses for certain index funds and diversified international funds; (v) continuing to launch dedicated lower cost underlying funds to meet portfolio construction needs related to expanding underlying fund options for Fidelity funds of funds, specifically for the Freedom Fund product lines; (vi) rationalizing product lines and gaining increased efficiencies through fund mergers; (vii) launching active fixed-income exchange-traded funds; (viii) continuing to develop, acquire and implement systems and technology to improve services to the funds and information security and to increase efficiency; (ix) implementing investment enhancements to further strengthen Fidelity's target date product line to increase investors' probability of success in achieving their goals; (x) modifying the eligibility criteria for certain share classes to accommodate roll-over assets from employer-sponsored retirement plans; (xi) launching a new Class W of the Freedom Index Funds to attract and retain Fidelity record-kept retirement plan assets; and (xii) implementing changes to Fidelity's money market product line in response to recent money market regulatory reforms.
Investment Performance. The Board considered whether the fund has operated in accordance with its investment objective, as well as its record of compliance with its investment restrictions and its performance history.
Annual Report
The Board took into account discussions with representatives of the Investment Advisers about fund investment performance that occur at Board meetings throughout the year. In this regard the Board noted that as part of regularly scheduled fund reviews and other reports to the Board on fund performance, the Board considers annualized return information for the fund, for different time periods, measured against a securities market index ("benchmark index") and a peer group of funds with similar objectives ("peer group"), if any. In its evaluation of fund investment performance, the Board gave particular attention to information indicating changes in performance of certain Fidelity funds for specific time periods and discussed with the Investment Advisers the reasons for any overperformance or underperformance.
In addition to reviewing absolute and relative fund performance, the Independent Trustees periodically consider the appropriateness of fund performance metrics in evaluating the results achieved. In general, the Independent Trustees believe that fund performance should be evaluated based on net performance (after fees and expenses) of both the highest performing and lowest performing fund share classes, where applicable, compared to appropriate benchmark indices, over appropriate time periods that may include full market cycles, and compared to peer groups, as applicable, over the same periods, taking into account relevant factors including the following: general market conditions; issuer-specific information; and fund cash flows and other factors.
The Independent Trustees recognize that shareholders evaluate performance on a net basis over their own holding periods, for which one-, three-, and five-year periods are often used as a proxy. For this reason, the performance information reviewed by the Board also included net cumulative calendar year total return information for the fund and an appropriate benchmark index and peer group for the most recent one-, three-, and five-year periods, as shown below. Returns are shown compared to the 25th percentile (top of box, 75% beaten) and 75th percentile (bottom of box, 25% beaten) of the peer universe. Returns of the benchmark index are "net MA," i.e., adjusted for tax withholding rates applicable to U.S.-based funds organized as Massachusetts business trusts.
Annual Report
Board Approval of Investment Advisory Contracts and
Management Fees - continued
Fidelity International Value Fund
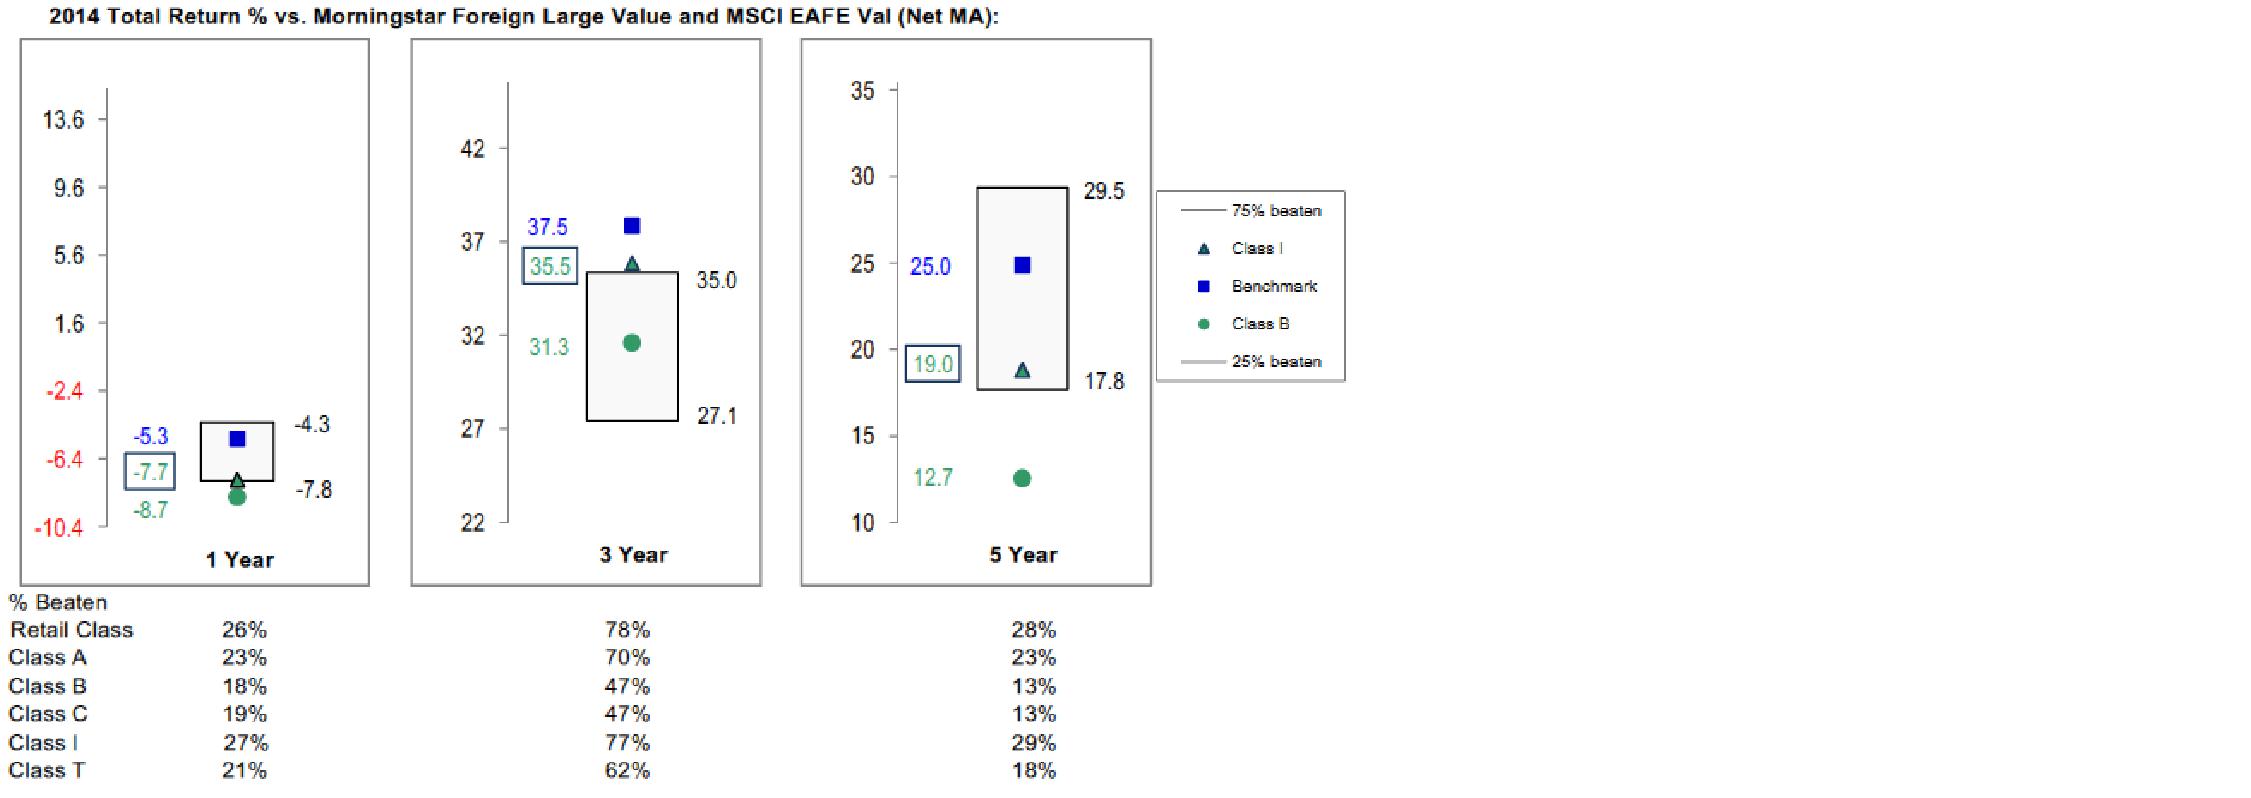
The Board also considered that the fund's management fee is subject to upward or downward adjustment depending upon whether, and to what extent, the fund's investment performance for the performance period exceeds, or is exceeded by, a securities index, thus leading to a performance adjustment for the same period. The Board noted that the performance adjustment provides FMR with a strong economic incentive to seek to achieve superior performance for the fund's shareholders and helps to more closely align the interests of FMR and the shareholders of the fund.
Based on its review, the Board concluded that the nature, extent, and quality of services provided to the fund under the Advisory Contracts should benefit the shareholders of the fund.
Competitiveness of Management Fee and Total Expense Ratio. The Board considered the fund's management fee and total expense ratio compared to "mapped groups" of competitive funds and classes created for the purpose of facilitating the Trustees' competitive analysis of management fees and total expenses. Fidelity creates "mapped groups" by combining similar Lipper investment objective categories that have comparable investment mandates. Combining Lipper investment objective categories aids the Board's management fee and total expense ratio comparisons by broadening the competitive group used for comparison.
Management Fee. The Board considered two proprietary management fee comparisons for the 12-month periods shown in basis points (BP) in the chart below. The group of Lipper funds used by the Board for management fee comparisons is referred to below as the "Total Mapped Group." The Total Mapped Group comparison focuses on a fund's standing in terms of gross management fees before expense reimbursements or caps, and without giving effect to the fund's performance adjustment, relative to the total universe of funds with comparable investment mandates, regardless of whether their management fee structures also are comparable. Funds with comparable investment mandates offer exposure to similar types of securities. Funds with comparable management fee structures have similar management fee contractual arrangements (e.g., flat rate charged for advisory services, all-inclusive fee rate, etc.). "TMG %" represents the percentage of funds in the Total Mapped Group that had management fees that were lower than the fund's. For example, a hypothetical TMG % of 20% would mean that 80% of the funds in the Total Mapped Group had higher, and 20% had lower, management fees than the fund. The fund's actual TMG %s and the number of funds in the Total Mapped Group are in the chart below. The "Asset-Size Peer Group" (ASPG) comparison focuses on a fund's standing relative to a subset of non-Fidelity funds within the Total Mapped Group that are similar in size and management fee structure without taking into account performance adjustments, if any. For example, if a fund is in the first quartile of the ASPG, the fund's management fee ranks in the least expensive or lowest 25% of funds in the ASPG. The ASPG represents at least 15% of the funds in the Total Mapped Group with comparable asset size and management fee structures, subject to a minimum of 50 funds (or all funds in the Total Mapped Group if fewer than 50). Additional information, such as the ASPG quartile in which the fund's management fee rate ranked and the impact of the fund's performance adjustment, is also included in the chart and considered by the Board.
Annual Report
Fidelity International Value Fund

Annual Report
Board Approval of Investment Advisory Contracts and
Management Fees - continued
The Board noted that the fund's management fee rate ranked below the median of its Total Mapped Group and below the median of its ASPG for 2014. The Board also noted the effect of the fund's performance adjustment, if any, on the fund's management fee ranking.
The Board noted that, in 2014, the ad hoc Committee on Group Fee was formed by it and other Fidelity fund boards to conduct an in-depth review of the "group fee" component of the management fee of funds with such management fee structures. Committee focus included the mechanics of the group fee, the competitive landscape of group fee structures, Fidelity funds with no group fee component and investment products not included in group fee assets. The Board also considered that, for funds subject to the group fee, FMR agreed to voluntarily waive fees over a specified period of time in amounts designed to account for assets converted from certain funds to certain collective investment trusts.
The Board also noted that, in 2013, the ad hoc Committee on Management Fees was formed to conduct an in-depth review of the management fee rates of Fidelity's active equity mutual funds. The Committee focused on the following areas: (i) standard fee structures; (ii) research consumption and trading evolution; (iii) management fee competitiveness/profitability by category; and (iv) factors that drive institutional pricing.
Based on its review, the Board concluded that the fund's management fee is fair and reasonable in light of the services that the fund receives and the other factors considered.
Total Expense Ratio. In its review of each class's total expense ratio, the Board considered the fund's management fee as well as other fund or class expenses, as applicable, such as transfer agent fees, pricing and bookkeeping fees, fund-paid 12b-1 fees, and custodial, legal, and audit fees. The Board noted the impact of the fund's performance adjustment. The Board also noted that Fidelity may agree to waive fees and expenses from time to time, and the extent to which, if any, it has done so for the fund. As part of its review, the Board also considered the current and historical total expense ratios of each class of the fund compared to competitive fund median expenses. Each class of the fund is compared to those funds and classes in the Total Mapped Group (used by the Board for management fee comparisons) that have a similar sales load structure.
The Board noted that the total expense ratio of each of Class A, Class B, and the retail class ranked below its competitive median for 2014, the total expense ratio of Class I ranked equal to its competitive median for 2014, and the total expense ratio of each of Class T and Class C ranked above its competitive median for 2014. The Board considered that, in general, various factors can affect total expense ratios. The Board noted that the total expense ratio of Class T was above the competitive median primarily because of higher 12b-1 fees on Class T as compared to most competitor funds. Class T has a higher 12b-1 fee, but a lower front-end sales charge, than traditionally priced front-end sales charge classes. The Board considered that Class T is primarily sold load-waived in the retirement plan market where its 0.50% 12b-1 fee is comparable to competing no-load, higher 12b-1 fee classes designed specifically for retirement plans. The Board noted that the fund offers multiple classes, each of which has a different sales load and 12b-1 fee structure, and that the multiple structures are intended to offer a range of pricing options for the intermediary market. The Board also noted that the total expense ratios of the classes vary primarily by the level of their 12b-1 fees, although differences in transfer agent fees may also cause expenses to vary from class to class.
Annual Report
Fees Charged to Other Fidelity Clients. The Board also considered Fidelity fee structures and other information with respect to clients of Fidelity, such as other funds advised or subadvised by Fidelity, pension plan clients, and other institutional clients with similar mandates. The Board noted the findings of the 2013 ad hoc joint committee (created with the board of other Fidelity funds), which reviewed and compared Fidelity's institutional investment advisory business with its business of providing services to the Fidelity funds, including the differences in services provided, fees charged, and costs incurred, as well as competition in their respective marketplaces.
Based on its review of total expense ratios and fees charged to other Fidelity clients, the Board concluded that, although in some cases above the median of the universe presented for comparison, the total expense ratio of each class of the fund was reasonable in light of the services that the fund and its shareholders receive and the other factors considered.
Costs of the Services and Profitability. The Board considered the revenues earned and the expenses incurred by Fidelity in conducting the business of developing, marketing, distributing, managing, administering and servicing the fund and servicing the fund's shareholders. The Board also considered the level of Fidelity's profits in respect of all the Fidelity funds.
On an annual basis, Fidelity presents to the Board information about the profitability of its relationship with the fund. Fidelity calculates profitability information for each fund, as well as aggregate profitability information for groups of Fidelity funds and all Fidelity funds, using a series of detailed revenue and cost allocation methodologies which originate with the books and records of Fidelity on which Fidelity's audited financial statements are based. The Audit Committee of the Board reviews any significant changes from the prior year's methodologies.
PricewaterhouseCoopers LLP (PwC), independent registered public accounting firm and auditor to Fidelity and certain Fidelity funds, has been engaged annually by the Board as part of the Board's assessment of Fidelity's profitability analysis. PwC's engagement includes the review and assessment of the methodologies used by Fidelity in determining the revenues and expenses attributable to Fidelity's mutual fund business, and completion of agreed-upon procedures in respect of the mathematical accuracy of fund profitability and its conformity to established allocation methodologies. After considering PwC's reports issued under the engagement and information provided by Fidelity, the Board concluded that while other allocation methods may also be reasonable, Fidelity's profitability methodologies are reasonable in all material respects.
Annual Report
Board Approval of Investment Advisory Contracts and
Management Fees - continued
The Board also reviewed Fidelity's non-fund businesses and fall-out benefits related to the mutual fund business as well as cases where Fidelity's affiliates may benefit from or be related to the fund's business.
The Board considered the costs of the services provided by and the profits realized by Fidelity in connection with the operation of the fund and was satisfied that the profitability was not excessive.
Economies of Scale. The Board considered whether there have been economies of scale in respect of the management of the Fidelity funds, whether the Fidelity funds (including the fund) have appropriately benefited from any such economies of scale, and whether there is potential for realization of any further economies of scale. The Board considered the extent to which the fund will benefit from economies of scale as assets grow through increased services to the fund, through waivers or reimbursements, or through fee or expense ratio reductions. The Board also noted that in 2013, it and the boards of other Fidelity funds created an ad hoc committee (the Economies of Scale Committee) to analyze whether Fidelity attains economies of scale in respect of the management and servicing of the Fidelity funds, whether the Fidelity funds have appropriately benefited from such economies of scale, and whether there is potential for realization of any further economies of scale.
The Board recognized that the fund's management contract incorporates a "group fee" structure, which provides for lower group fee rates as total group assets increase, and for higher group fee rates as total group assets decrease (with "group assets" defined to include fund assets under FMR's management plus sector fund assets previously under FMR's management and currently managed by Fidelity SelectCo, LLC). FMR calculates the group fee rates based on a tiered asset "breakpoint" schedule that varies based on asset class. The Board considered that the group fee is designed to deliver the benefits of economies of scale to fund shareholders when total Fidelity fund assets increase, even if assets of any particular fund are unchanged or have declined, because some portion of Fidelity's costs are attributable to services provided to all Fidelity funds, and all funds benefit if those costs can be allocated among more assets. The Board concluded that, given the group fee structure, fund shareholders will benefit from lower management fees as group assets increase at the fund complex level, regardless of whether Fidelity achieves any such economies of scale.
The Board concluded, taking into account the analysis of the Economies of Scale Committee, that economies of scale, if any, are being appropriately shared between fund shareholders and Fidelity.
Annual Report
Additional Information Requested by the Board. In order to develop fully the factual basis for consideration of the Fidelity funds' Advisory Contracts, the Board requested and received additional information on certain topics, including: (i) fund performance trends and Fidelity's long-term strategies for certain funds; (ii) the various share classes employed by Fidelity and the attributes of each class, together with similar information on the distribution and servicing payments made by Fidelity or the funds to third-party participants in the distribution channels; (iii) fund profitability, and fund performance in relation to fund profitability; (iv) the methodology with respect to evaluating competitive fund data and peer group classifications and fee comparisons; (v) annual fund profitability margins, with particular focus on certain funds with negative margins; (vi) the realization of fall-out benefits in certain Fidelity business units; (vii) economies of scale and the way in which they are shared with fund shareholders; (viii) Fidelity's group fee structures, including the group fee schedule of breakpoints; (ix) the impact of cost containment measures on the funds; and (x) the transfer agent fee structure.
Based on its evaluation of all of the conclusions noted above, and after considering all factors it believed relevant, the Board concluded that the advisory fee structures are fair and reasonable, and that the fund's Advisory Contracts should be renewed.
Annual Report
Investment Adviser
Fidelity Management & Research
Company
Boston, MA
Investment Sub-Advisers
FMR Co., Inc.
FMR Investment Management
(U.K.) Limited
Fidelity Management & Research
(Hong Kong) Limited
Fidelity Management & Research
(Japan) Limited
FIL Investment Advisors
FIL Investment Advisors (UK) Limited
FIL Investments (Japan) Limited
General Distributor
Fidelity Distributors Corporation
Smithfield, RI
Transfer and Service Agents
Fidelity Investments Institutional
Operations Company, Inc.
Boston, MA
Fidelity Service Company, Inc.
Boston, MA
Custodian
The Northern Trust Company
Chicago, IL
The Fidelity Telephone Connection
Mutual Fund 24-Hour Service
Exchanges/Redemptions
and Account Assistance 1-800-544-6666
Product Information 1-800-544-8888
Retirement Accounts 1-800-544-4774
(8 a.m. - 9 p.m.)
TDD Service 1-800-544-0118
for the deaf and hearing impaired
(9 a.m. - 9 p.m. Eastern time)
Fidelity Automated Service
Telephone (FAST®)
1-800-544-5555

Automated line for quickest service
(Fidelity Investment logo)(registered trademark)
Corporate Headquarters
245 Summer St., Boston, MA 02210
www.fidelity.com
FIV-UANN-1215
1.827481.109
(Fidelity Investment logo)(registered trademark)
Fidelity Advisor®
International Value
Fund - Class A, Class T, Class B
and Class C
Annual Report
October 31, 2015
(Fidelity Cover Art)
Class A, Class T, Class B, and Class C are classes of Fidelity® International Value Fund
Contents
Performance | (Click Here) | How the fund has done over time. |
Management's Discussion of Fund Performance | (Click Here) | The Portfolio Manager's review of fund performance and strategy. |
Shareholder Expense Example | (Click Here) | An example of shareholder expenses. |
Investment Changes | (Click Here) | A summary of major shifts in the fund's investments over the past six months. |
Investments | (Click Here) | A complete list of the fund's investments with their market values. |
Financial Statements | (Click Here) | Statements of assets and liabilities, operations, and changes in net assets, as well as financial highlights. |
Notes | (Click Here) | Notes to financial statements. |
Report of Independent Registered Public Accounting Firm | (Click Here) | |
Trustees and Officers | (Click Here) | |
Distributions | (Click Here) | |
Board Approval of Investment Advisory Contracts and Management Fees | (Click Here) | |
To view a fund's proxy voting guidelines and proxy voting record for the 12-month period ended June 30, visit http://www.fidelity.com/proxyvotingresults or visit the Securities and Exchange Commission's (SEC) web site at http://www.sec.gov. You may also call 1-877-208-0098 to request a free copy of the proxy voting guidelines.
Standard & Poor's, S&P and S&P 500 are registered service marks of The McGraw-Hill Companies, Inc. and have been licensed for use by Fidelity Distributors Corporation.
Other third-party marks appearing herein are the property of their respective owners.
All other marks appearing herein are registered or unregistered trademarks or service marks of FMR LLC or an affiliated company. © 2015 FMR LLC. All rights reserved.
Annual Report
This report and the financial statements contained herein are submitted for the general information of the shareholders of the fund. This report is not authorized for distribution to prospective investors in the fund unless preceded or accompanied by an effective prospectus.
A fund files its complete schedule of portfolio holdings with the SEC for the first and third quarters of each fiscal year on Form N-Q. Forms N-Q are available on the SEC's web site at http://www.sec.gov. A fund's Forms N-Q may be reviewed and copied at the SEC's Public Reference Room in Washington, DC. Information regarding the operation of the SEC's Public Reference Room may be obtained by calling 1-800-SEC-0330. For a complete list of a fund's portfolio holdings, view the most recent holdings listing, semiannual report, or annual report on Fidelity's web site at http://www.fidelity.com, http://www.advisor.fidelity.com, or http://www.401k.com, as applicable.
NOT FDIC INSURED • MAY LOSE VALUE • NO BANK GUARANTEE
Neither the fund nor Fidelity Distributors Corporation is a bank.
Annual Report
Average annual total return reflects the change in the value of an investment, assuming reinvestment of the class' distributions from dividend income and capital gains (the profits earned upon the sale of securities that have grown in value, if any) and assuming a constant rate of performance each year. The $10,000 table and the fund's returns do not reflect the deduction of taxes that a shareholder would pay on fund distributions or the redemption of fund shares. During periods of reimbursement by Fidelity, a fund's total return will be greater than it would be had the reimbursement not occurred. How a fund did yesterday is no guarantee of how it will do tomorrow. Returns reflect the conversion of Class B shares to Class A shares after a maximum of seven years.
Average Annual Total Returns
Periods ended October 31, 2015 | Past 1
year | Past 5
years | Life of
fund A |
Class A (incl. 5.75% sales charge) | -6.52% | 1.91% | -0.04% |
Class T (incl. 3.50% sales charge) | -4.55% | 2.13% | -0.06% |
Class B (incl. contingent deferred sales charge)B | -6.46% | 1.99% | 0.03% |
Class C (incl. contingent deferred sales charge)C | -2.54% | 2.36% | -0.16% |
A From May 18, 2006.
B Class B shares' contingent deferred sales charges included in the past one year, past five years, and life of fund total return figures are 5%, 2%, and 0%, respectively.
C Class C shares' contingent deferred sales charges included in the past one year, past five years, and life of fund total return figures are 1%, 0%, and 0%, respectively.
Annual Report
$10,000 Over Life of Fund
Let's say hypothetically that $10,000 was invested in Fidelity Advisor® International Value Fund - Class A on May 18, 2006, when the fund started, and the current 5.75% sales charge was paid. The chart shows how the value of your investment would have changed, and also shows how the MSCI EAFE Value Index performed over the same period.
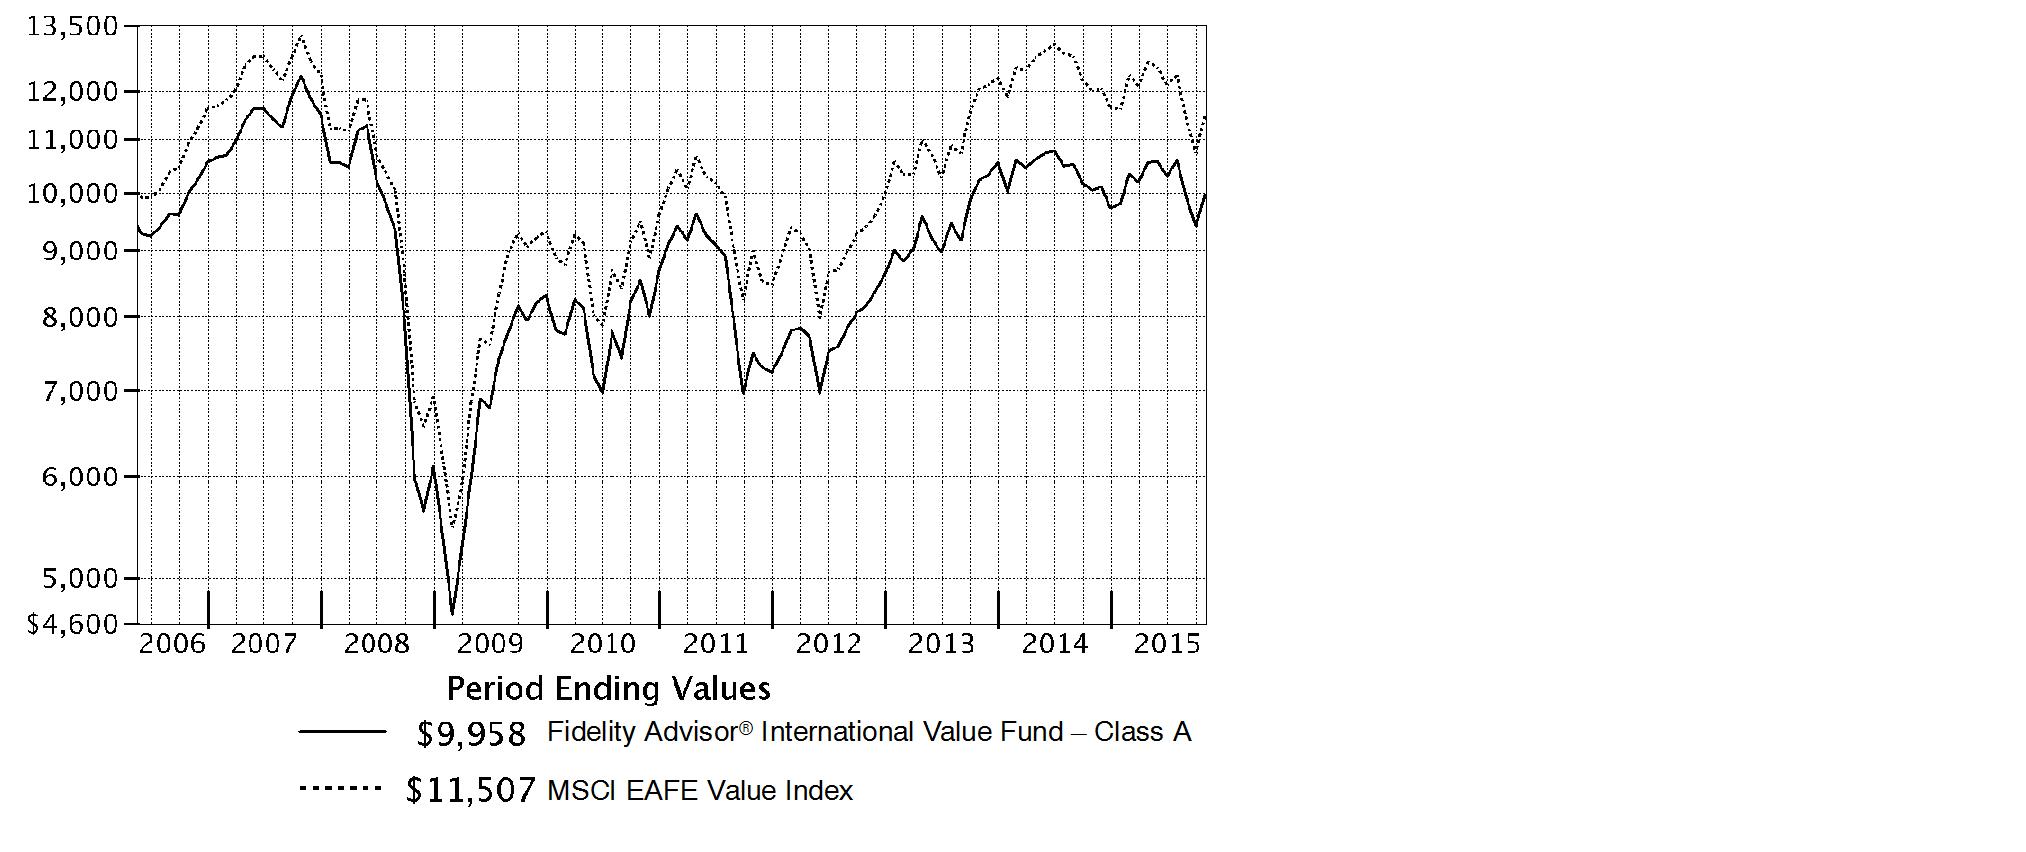
Annual Report
Market Recap: International equities suffered a moderate setback for the 12 months ending October 31, 2015, held back by a collapse in commodities prices that hurt resources-related sectors and geographies. The MSCI ACWI (All Country World Index) ex USA Index returned -4.55% for the period, affected also by concerns about global economic growth. Commodity producers remained under pressure for much of the past year, largely related to economic deceleration in China (-1%), the world's second-largest economy and a leading consumer of raw materials. This effect was exacerbated by U.S. dollar strength relative to global currencies, which weighed on commodities priced in dollars and acutely impacted equity returns within regions most exposed to resources prices. The emerging-markets group, for example, returned about -15% this period. Canada, a significant energy producer, returned roughly -17%. Net energy consumer Japan (+9%) was the best-performing region by far. Only about a quarter of the nearly 50 index countries managed a gain this period: Ireland (+19%) - the EU's fastest-growing economy - and Israel (+17%) proved top performers; Greece (-56%) and Brazil (-46%), among the worst. As for sectors, energy (-25%) and materials (-16%) declined sharply, whereas the two consumer sectors each gained about 6%.
Comments from Portfolio Manager Alex Zavratsky: For the year, the fund's share classes (excluding sales charges, if applicable) declined modestly, outperforming the -4.09% result of the benchmark MSCI EAFE Value Index. Versus the benchmark, key contributors included stock selection in various countries throughout Europe, especially France and Switzerland, as well as in the United Kingdom. Conversely, positioning in Japan detracted. Relative results also were affected by a downward fair-value pricing adjustment of 0.80 percentage points, largely related to the fund's Japan-based investments. Looking at individual stocks, largely avoiding U.K-based oil giant and index component Royal Dutch Shell helped most. The fund started the review period with an underweighted position, later eliminated. Shares of Royal Dutch Shell returned roughly -23% amid disappointing financial results, weakening oil prices and high capital expenditures, and our decisions here proved the biggest contributor to relative results this period. Avoiding Spain's Banco Santander, a benchmark constituent, also was a good call. Conversely, the fund's position in French bank BNP Paribas was the biggest relative detractor the past year. We held an underweighted position in the stock earlier in the period and sold it once the stock no longer fit our investment criteria. This stance hurt the fund because BNP outpaced the market the past year.
The views expressed above reflect those of the portfolio manager(s) only through the end of the period as stated on the cover of this report and do not necessarily represent the views of Fidelity or any other person in the Fidelity organization. Any such views are subject to change at any time based upon market or other conditions and Fidelity disclaims any responsibility to update such views. These views may not be relied on as investment advice and, because investment decisions for a Fidelity fund are based on numerous factors, may not be relied on as an indication of trading intent on behalf of any Fidelity fund.
Annual Report
Shareholder Expense Example
As a shareholder of the Fund, you incur two types of costs: (1) transaction costs, including sales charges (loads) on purchase payments or redemption proceeds, redemption fees and (2) ongoing costs, including management fees, distribution and/or service (12b-1) fees and other Fund expenses. This Example is intended to help you understand your ongoing costs (in dollars) of investing in the Fund and to compare these costs with the ongoing costs of investing in other mutual funds.
The Example is based on an investment of $1,000 invested at the beginning of the period and held for the entire period (May 1, 2015 to October 31, 2015).
Actual Expenses
The first line of the accompanying table for each class of the Fund provides information about actual account values and actual expenses. You may use the information in this line, together with the amount you invested, to estimate the expenses that you paid over the period. Simply divide your account value by $1,000.00 (for example, an $8,600 account value divided by $1,000.00 = 8.6), then multiply the result by the number in the first line for a class of the Fund under the heading entitled "Expenses Paid During Period" to estimate the expenses you paid on your account during this period. A small balance maintenance fee of $12.00 that is charged once a year may apply for certain accounts with a value of less than $2,000. This fee is not included in the table below. If it was, the estimate of expenses you paid during the period would be higher, and your ending account value lower, by this amount. In addition, the Fund, as a shareholder in the underlying Fidelity Central Funds, will indirectly bear its pro-rata share of the fees and expenses incurred by the underlying Fidelity Central Funds. These fees and expenses are not included in the Fund's annualized expense ratio used to calculate the expense estimate in the table below.
Hypothetical Example for Comparison Purposes
The second line of the accompanying table for each class of the Fund provides information about hypothetical account values and hypothetical expenses based on a Class' actual expense ratio and an assumed rate of return of 5% per year before expenses, which is not the Class' actual return. The hypothetical account values and expenses may not be used to estimate the actual ending account balance or expenses you paid for the period. You may use this information to compare the ongoing costs of investing in the Fund and other funds. To do so, compare this 5% hypothetical example with the 5% hypothetical examples that appear in the shareholder reports of the other funds. A small balance maintenance fee of $12.00 that is charged once a year may apply for certain accounts with a value of less than $2,000. This fee is not included in the table below. If it was, the estimate of expenses you paid during the period would be higher, and your ending account value lower, by this amount. In addition, the Fund, as a shareholder in the underlying Fidelity Central Funds, will indirectly bear its pro-rata share of the fees and expenses incurred by the underlying Fidelity Central Funds. These fees and expenses are not included in the Fund's annualized expense ratio used to calculate the expense estimate in the table below.
Please note that the expenses shown in the table are meant to highlight your ongoing costs only and do not reflect any transaction costs. Therefore, the second line of the table is useful in comparing ongoing costs only, and will not help you determine the relative total costs of owning different funds. In addition, if these transactional costs were included, your costs would have been higher.
Annual Report
| Annualized
Expense RatioB | Beginning
Account Value
May 1, 2015 | Ending
Account Value
October 31, 2015 | Expenses Paid
During PeriodC
May 1, 2015 to
October 31, 2015 |
Class A | 1.34% | | | |
Actual | | $ 1,000.00 | $ 944.10 | $ 6.57 |
HypotheticalA | | $ 1,000.00 | $ 1,018.45 | $ 6.82 |
Class T | 1.63% | | | |
Actual | | $ 1,000.00 | $ 942.90 | $ 7.98 |
HypotheticalA | | $ 1,000.00 | $ 1,016.99 | $ 8.29 |
Class B | 2.10% | | | |
Actual | | $ 1,000.00 | $ 941.30 | $ 10.28 |
HypotheticalA | | $ 1,000.00 | $ 1,014.62 | $ 10.66 |
Class C | 2.13% | | | |
Actual | | $ 1,000.00 | $ 940.60 | $ 10.42 |
HypotheticalA | | $ 1,000.00 | $ 1,014.47 | $ 10.82 |
International Value | .98% | | | |
Actual | | $ 1,000.00 | $ 946.30 | $ 4.81 |
HypotheticalA | | $ 1,000.00 | $ 1,020.27 | $ 4.99 |
Class I | 1.10% | | | |
Actual | | $ 1,000.00 | $ 946.30 | $ 5.40 |
HypotheticalA | | $ 1,000.00 | $ 1,019.66 | $ 5.60 |
A 5% return per year before expenses
B Annualized expense ratio reflects expenses net of applicable fee waivers.
C Expenses are equal to each Class' annualized expense ratio, multiplied by the average account value over the period, multiplied by 184/365 (to reflect the one-half year period).
Annual Report
Investment Changes (Unaudited)
Asset Allocation as of October 31, 2015 |
| % of fund's
net assets | % of fund's net assets
6 months ago |
Stocks | 97.6 | 99.2 |
Short-Term Investments and Net Other Assets (Liabilities) | 2.4 | 0.8 |
Top Ten Stocks as of October 31, 2015 |
| % of fund's
net assets | % of fund's net assets
6 months ago |
Total SA (France, Oil, Gas & Consumable Fuels) | 3.1 | 2.8 |
Nestle SA (Switzerland, Food Products) | 2.7 | 2.0 |
Sanofi SA (France, Pharmaceuticals) | 2.6 | 2.4 |
Novartis AG (Switzerland, Pharmaceuticals) | 2.6 | 1.6 |
Toyota Motor Corp. (Japan, Automobiles) | 2.4 | 2.7 |
Mitsubishi UFJ Financial Group, Inc. (Japan, Banks) | 2.0 | 2.6 |
BP PLC sponsored ADR (United Kingdom, Oil, Gas & Consumable Fuels) | 2.0 | 2.8 |
HSBC Holdings PLC sponsored ADR (United Kingdom, Banks) | 1.9 | 2.1 |
Vodafone Group PLC sponsored ADR (United Kingdom, Wireless Telecommunication Services) | 1.8 | 2.0 |
Imperial Tobacco Group PLC (United Kingdom, Tobacco) | 1.8 | 1.2 |
| 22.9 | |
Market Sectors as of October 31, 2015 |
| % of fund's
net assets | % of fund's net assets
6 months ago |
Financials | 26.3 | 27.7 |
Health Care | 16.0 | 14.3 |
Consumer Discretionary | 14.4 | 15.5 |
Consumer Staples | 9.3 | 7.1 |
Industrials | 8.0 | 7.8 |
Energy | 6.7 | 6.8 |
Telecommunication Services | 6.1 | 7.1 |
Materials | 4.1 | 4.9 |
Information Technology | 3.6 | 5.6 |
Utilities | 3.1 | 2.4 |
Annual Report
Investments October 31, 2015
Showing Percentage of Net Assets
Common Stocks - 97.2% |
| Shares | | Value |
Australia - 2.9% |
Ansell Ltd. | 52,575 | | $ 748,141 |
Macquarie Group Ltd. | 25,419 | | 1,539,092 |
Telstra Corp. Ltd. | 157,443 | | 603,266 |
Transurban Group unit | 166,965 | | 1,237,218 |
Westpac Banking Corp. | 193,728 | | 4,315,102 |
TOTAL AUSTRALIA | | 8,442,819 |
Bailiwick of Jersey - 1.4% |
Shire PLC | 18,100 | | 1,370,729 |
Wolseley PLC | 43,283 | | 2,541,202 |
TOTAL BAILIWICK OF JERSEY | | 3,911,931 |
Belgium - 0.5% |
Anheuser-Busch InBev SA NV | 12,870 | | 1,535,708 |
Canada - 0.8% |
Imperial Oil Ltd. | 41,300 | | 1,374,245 |
Potash Corp. of Saskatchewan, Inc. | 45,500 | | 921,413 |
TOTAL CANADA | | 2,295,658 |
Denmark - 0.3% |
Topdanmark A/S (a) | 27,800 | | 739,761 |
Finland - 1.2% |
Sampo Oyj (A Shares) | 69,234 | | 3,386,403 |
France - 16.3% |
Atos Origin SA | 35,855 | | 2,860,498 |
AXA SA | 161,021 | | 4,297,347 |
Capgemini SA | 39,593 | | 3,527,920 |
Havas SA | 204,166 | | 1,771,393 |
Orange SA | 169,900 | | 2,995,624 |
Renault SA | 15,745 | | 1,484,328 |
Sanofi SA | 73,299 | | 7,394,100 |
Societe Generale Series A | 63,300 | | 2,939,856 |
Total SA | 183,273 | | 8,862,871 |
Unibail-Rodamco | 12,100 | | 3,380,995 |
VINCI SA | 57,500 | | 3,881,050 |
Vivendi SA | 140,492 | | 3,379,789 |
TOTAL FRANCE | | 46,775,771 |
Germany - 5.1% |
Axel Springer Verlag AG | 20,600 | | 1,158,464 |
BASF AG | 60,026 | | 4,917,561 |
Bayer AG | 15,103 | | 2,015,382 |
Common Stocks - continued |
| Shares | | Value |
Germany - continued |
Continental AG | 5,766 | | $ 1,386,685 |
Fresenius SE & Co. KGaA | 46,000 | | 3,380,190 |
GEA Group AG | 15,021 | | 602,323 |
SAP AG | 16,460 | | 1,297,626 |
TOTAL GERMANY | | 14,758,231 |
Hong Kong - 0.2% |
Power Assets Holdings Ltd. | 44,500 | | 442,615 |
Ireland - 1.4% |
Allergan PLC (a) | 7,280 | | 2,245,662 |
Medtronic PLC | 24,100 | | 1,781,472 |
TOTAL IRELAND | | 4,027,134 |
Israel - 1.4% |
Teva Pharmaceutical Industries Ltd. sponsored ADR | 67,099 | | 3,971,590 |
Italy - 1.7% |
Intesa Sanpaolo SpA | 654,300 | | 2,279,379 |
Mediaset SpA | 285,400 | | 1,449,941 |
Telecom Italia SpA (a) | 810,900 | | 1,131,273 |
TOTAL ITALY | | 4,860,593 |
Japan - 20.6% |
Astellas Pharma, Inc. | 196,600 | | 2,853,547 |
Dentsu, Inc. | 53,800 | | 3,024,536 |
East Japan Railway Co. | 31,200 | | 2,966,358 |
Hoya Corp. | 81,800 | | 3,375,622 |
Itochu Corp. | 192,500 | | 2,408,749 |
Japan Tobacco, Inc. | 109,100 | | 3,776,146 |
KDDI Corp. | 124,400 | | 3,010,273 |
Makita Corp. | 30,400 | | 1,665,702 |
Mitsubishi UFJ Financial Group, Inc. | 887,200 | | 5,737,997 |
Nippon Prologis REIT, Inc. | 574 | | 1,009,425 |
Nippon Telegraph & Telephone Corp. | 102,800 | | 3,768,792 |
OBIC Co. Ltd. | 31,900 | | 1,683,586 |
Olympus Corp. | 56,500 | | 1,905,820 |
ORIX Corp. | 175,700 | | 2,565,884 |
Seven & i Holdings Co. Ltd. | 57,100 | | 2,593,757 |
Seven Bank Ltd. | 388,600 | | 1,770,678 |
Sony Corp. | 70,300 | | 1,998,308 |
Sony Financial Holdings, Inc. | 114,800 | | 2,057,513 |
Common Stocks - continued |
| Shares | | Value |
Japan - continued |
Sumitomo Mitsui Financial Group, Inc. | 109,000 | | $ 4,348,410 |
Toyota Motor Corp. | 110,400 | | 6,763,594 |
TOTAL JAPAN | | 59,284,697 |
Luxembourg - 0.5% |
RTL Group SA | 16,739 | | 1,446,793 |
Netherlands - 3.7% |
ING Groep NV (Certificaten Van Aandelen) | 263,990 | | 3,842,076 |
Koninklijke KPN NV | 315,453 | | 1,155,883 |
Mylan N.V. | 19,600 | | 864,164 |
PostNL NV (a) | 92,431 | | 381,766 |
RELX NV | 253,849 | | 4,340,706 |
TOTAL NETHERLANDS | | 10,584,595 |
Singapore - 0.3% |
UOL Group Ltd. | 182,764 | | 852,916 |
Spain - 2.0% |
Iberdrola SA | 611,024 | | 4,365,416 |
Mediaset Espana Comunicacion SA | 119,100 | | 1,447,855 |
TOTAL SPAIN | | 5,813,271 |
Sweden - 1.6% |
Nordea Bank AB | 309,600 | | 3,424,478 |
Sandvik AB | 138,700 | | 1,297,134 |
TOTAL SWEDEN | | 4,721,612 |
Switzerland - 8.2% |
Credit Suisse Group AG | 10,513 | | 262,207 |
Credit Suisse Group AG (e)(f) | 91,500 | | 2,105,949 |
Nestle SA | 100,200 | | 7,652,674 |
Novartis AG | 80,719 | | 7,312,232 |
Syngenta AG (Switzerland) | 4,651 | | 1,562,598 |
UBS Group AG | 57,758 | | 1,156,893 |
Zurich Insurance Group AG | 13,435 | | 3,545,499 |
TOTAL SWITZERLAND | | 23,598,052 |
United Kingdom - 23.5% |
AstraZeneca PLC (United Kingdom) | 77,441 | | 4,935,515 |
Aviva PLC | 434,757 | | 3,249,190 |
BAE Systems PLC | 393,329 | | 2,660,671 |
Barclays PLC | 1,136,599 | | 4,049,454 |
BG Group PLC | 111,600 | | 1,763,117 |
Common Stocks - continued |
| Shares | | Value |
United Kingdom - continued |
BP PLC sponsored ADR | 160,157 | | $ 5,717,605 |
Bunzl PLC | 104,364 | | 2,990,899 |
Compass Group PLC | 183,539 | | 3,155,202 |
HSBC Holdings PLC sponsored ADR (d) | 139,842 | | 5,463,627 |
Imperial Tobacco Group PLC | 95,258 | | 5,138,272 |
Informa PLC | 241,209 | | 2,112,095 |
ITV PLC | 921,096 | | 3,583,983 |
Liberty Global PLC: | | | |
Class A (a) | 27,900 | | 1,242,108 |
Class A (a) | 7,000 | | 270,340 |
Lloyds Banking Group PLC | 3,551,200 | | 4,030,655 |
Meggitt PLC | 101,816 | | 555,009 |
Micro Focus International PLC | 64,100 | | 1,241,136 |
National Grid PLC | 276,182 | | 3,934,181 |
Prudential PLC | 69,249 | | 1,617,414 |
Rio Tinto PLC | 128,808 | | 4,694,443 |
Vodafone Group PLC sponsored ADR | 158,958 | | 5,240,845 |
TOTAL UNITED KINGDOM | | 67,645,761 |
United States of America - 3.6% |
Altria Group, Inc. | 31,400 | | 1,898,758 |
Chevron Corp. | 17,000 | | 1,544,960 |
Constellation Brands, Inc. Class A (sub. vtg.) | 21,800 | | 2,938,640 |
Edgewell Personal Care Co. (a) | 12,500 | | 1,058,875 |
McGraw Hill Financial, Inc. | 19,700 | | 1,825,008 |
ResMed, Inc. CDI | 182,510 | | 1,036,683 |
TOTAL UNITED STATES OF AMERICA | | 10,302,924 |
TOTAL COMMON STOCKS (Cost $279,167,390) |
279,398,835
|
Nonconvertible Preferred Stocks - 0.4% |
| | | |
Germany - 0.4% |
Volkswagen AG
(Cost $2,263,117) | 10,831 | |
1,300,100
|
Money Market Funds - 4.3% |
| Shares | | Value |
Fidelity Cash Central Fund, 0.18% (b) | 10,711,479 | | $ 10,711,479 |
Fidelity Securities Lending Cash Central Fund, 0.19% (b)(c) | 1,557,675 | | 1,557,675 |
TOTAL MONEY MARKET FUNDS (Cost $12,269,154) |
12,269,154
|
TOTAL INVESTMENT PORTFOLIO - 101.9% (Cost $293,699,661) | 292,968,089 |
NET OTHER ASSETS (LIABILITIES) - (1.9)% | (5,586,579) |
NET ASSETS - 100% | $ 287,381,510 |
Legend |
(a) Non-income producing |
(b) Affiliated fund that is generally available only to investment companies and other accounts managed by Fidelity Investments. The rate quoted is the annualized seven-day yield of the fund at period end. A complete unaudited listing of the fund's holdings as of its most recent quarter end is available upon request. In addition, each Fidelity Central Fund's financial statements, which are not covered by the Fund's Report of Independent Registered Public Accounting Firm, are available on the SEC's website or upon request. |
(c) Investment made with cash collateral received from securities on loan. |
(d) Security or a portion of the security is on loan at period end. |
(e) Security or a portion of the security purchased on a delayed delivery or when-issued basis. |
(f) Restricted securities - Investment in securities not registered under the Securities Act of 1933 (excluding 144A issues). At the end of the period, the value of restricted securities (excluding 144A issues) amounted to $2,105,949 or 0.7% of net assets. |
Additional information on each restricted holding is as follows: |
Security | Acquisition Date | Acquisition Cost |
Credit Suisse Group AG | 10/21/15 | $ 2,169,602 |
Affiliated Central Funds |
Information regarding fiscal year to date income earned by the Fund from investments in Fidelity Central Funds is as follows: |
Fund | Income earned |
Fidelity Cash Central Fund | $ 5,565 |
Fidelity Securities Lending Cash Central Fund | 112,755 |
Total | $ 118,320 |
Other Information |
Categorizations in the Schedule of Investments are based on country or territory of incorporation. |
The following is a summary of the inputs used, as of October 31, 2015, involving the Fund's assets and liabilities carried at fair value. The inputs or methodology used for valuing securities may not be an indication of the risk associated with investing in those securities. For more information on valuation inputs, and their aggregation into the levels used in the tables below, please refer to the Investment Valuation section in the accompanying Notes to Financial Statements. |
Valuation Inputs at Reporting Date: |
Description | Total | Level 1 | Level 2 | Level 3 |
Investments in Securities: | | | | |
Equities: | | | | |
Consumer Discretionary | $ 41,316,220 | $ 21,694,691 | $ 19,621,529 | $ - |
Consumer Staples | 26,592,830 | 11,034,545 | 15,558,285 | - |
Energy | 19,262,798 | 8,636,810 | 10,625,988 | - |
Financials | 75,793,208 | 24,758,859 | 51,034,349 | - |
Health Care | 45,190,849 | 10,878,270 | 34,312,579 | - |
Industrials | 23,188,081 | 9,708,181 | 13,479,900 | - |
Information Technology | 10,610,766 | 7,629,554 | 2,981,212 | - |
Materials | 12,096,015 | 921,413 | 11,174,602 | - |
Telecommunication Services | 17,905,956 | 5,240,845 | 12,665,111 | - |
Utilities | 8,742,212 | 4,365,416 | 4,376,796 | - |
Money Market Funds | 12,269,154 | 12,269,154 | - | - |
Total Investments in Securities: | $ 292,968,089 | $ 117,137,738 | $ 175,830,351 | $ - |
The following is a summary of transfers between Level 1 and Level 2 for the period ended October 31, 2015. Transfers are assumed to have occurred at the beginning of the period, and are primarily attributable to the valuation techniques used for foreign equity securities, as discussed in the accompanying Notes to Financial Statements: |
Transfers | Total |
Level 1 to Level 2 | $ 17,387,003 |
Level 2 to Level 1 | 3,914,138 |
See accompanying notes which are an integral part of the financial statements.
Annual Report
Statement of Assets and Liabilities
| | October 31, 2015 |
| | |
Assets | | |
Investment in securities, at value (including securities loaned of $1,512,009) - See accompanying schedule: Unaffiliated issuers (cost $281,430,507) | $ 280,698,935 | |
Fidelity Central Funds (cost $12,269,154) | 12,269,154 | |
Total Investments (cost $293,699,661) | | $ 292,968,089 |
Cash | | 11,900 |
Receivable for investments sold | | 611,490 |
Receivable for fund shares sold | | 1,965,354 |
Dividends receivable | | 851,987 |
Distributions receivable from Fidelity Central Funds | | 2,646 |
Prepaid expenses | | 559 |
Other receivables | | 1,752 |
Total assets | | 296,413,777 |
| | |
Liabilities | | |
Payable for investments purchased | | |
Regular delivery | $ 4,985,343 | |
Delayed delivery | 2,105,949 | |
Payable for fund shares redeemed | 102,123 | |
Accrued management fee | 162,913 | |
Distribution and service plan fees payable | 7,553 | |
Other affiliated payables | 48,219 | |
Other payables and accrued expenses | 62,492 | |
Collateral on securities loaned, at value | 1,557,675 | |
Total liabilities | | 9,032,267 |
| | |
Net Assets | | $ 287,381,510 |
Net Assets consist of: | | |
Paid in capital | | $ 390,986,470 |
Undistributed net investment income | | 3,583,213 |
Accumulated undistributed net realized gain (loss) on investments and foreign currency transactions | | (106,502,887) |
Net unrealized appreciation (depreciation) on investments and assets and liabilities in foreign currencies | | (685,286) |
Net Assets | | $ 287,381,510 |
See accompanying notes which are an integral part of the financial statements.
Annual Report
Financial Statements - continued
Statement of Assets and Liabilities - continued
| | October 31, 2015 |
Calculation of Maximum Offering Price | | |
Class A: | | |
Net Asset Value and redemption price per share
($8,955,961 ÷ 1,082,456 shares) | | $ 8.27 |
| | |
Maximum offering price per share (100/94.25 of $8.27) | | $ 8.77 |
Class T: | | |
Net Asset Value and redemption price per share
($4,085,545 ÷ 494,951 shares) | | $ 8.25 |
| | |
Maximum offering price per share (100/96.50 of $8.25) | | $ 8.55 |
Class B: | | |
Net Asset Value and offering price per share
($302,322 ÷ 36,246 shares)A | | $ 8.34 |
| | |
Class C: | | |
Net Asset Value and offering price per share
($4,501,895 ÷ 546,911 shares)A | | $ 8.23 |
| | |
International Value: | | |
Net Asset Value, offering price and redemption price
per share ($267,566,951 ÷ 32,294,974 shares) | | $ 8.29 |
| | |
Class I: | | |
Net Asset Value, offering price and redemption price
per share ($1,968,836 ÷ 237,625 shares) | | $ 8.29 |
A Redemption price per share is equal to net asset value less any applicable contingent deferred sales charge.
See accompanying notes which are an integral part of the financial statements.
Annual Report
Statement of Operations
| Year ended October 31, 2015 |
Investment Income | | |
Dividends | | $ 6,808,439 |
Income from Fidelity Central Funds | | 118,320 |
Income before foreign taxes withheld | | 6,926,759 |
Less foreign taxes withheld | | (493,861) |
Total income | | 6,432,898 |
| | |
Expenses | | |
Management fee | | |
Basic fee | $ 1,525,277 | |
Performance adjustment | (2,158) | |
Transfer agent fees | 408,663 | |
Distribution and service plan fees | 83,833 | |
Accounting and security lending fees | 114,042 | |
Custodian fees and expenses | 74,842 | |
Independent trustees' compensation | 905 | |
Registration fees | 74,886 | |
Audit | 60,612 | |
Legal | 535 | |
Miscellaneous | 1,759 | |
Total expenses before reductions | 2,343,196 | |
Expense reductions | (23,655) | 2,319,541 |
Net investment income (loss) | | 4,113,357 |
Realized and Unrealized Gain (Loss) | | |
Net realized gain (loss) on: | | |
Investment securities: | | |
Unaffiliated issuers | (2,418,325) | |
Foreign currency transactions | (56,980) | |
Total net realized gain (loss) | | (2,475,305) |
Change in net unrealized appreciation (depreciation) on: Investment securities | (2,382,002) | |
Assets and liabilities in foreign currencies | 71,045 | |
Total change in net unrealized appreciation (depreciation) | | (2,310,957) |
Net gain (loss) | | (4,786,262) |
Net increase (decrease) in net assets resulting from operations | | $ (672,905) |
See accompanying notes which are an integral part of the financial statements.
Annual Report
Financial Statements - continued
Statement of Changes in Net Assets
| Year ended
October 31,
2015 | Year ended
October 31,
2014 |
Increase (Decrease) in Net Assets | | |
Operations | | |
Net investment income (loss) | $ 4,113,357 | $ 7,699,402 |
Net realized gain (loss) | (2,475,305) | 12,080,123 |
Change in net unrealized appreciation (depreciation) | (2,310,957) | (23,435,459) |
Net increase (decrease) in net assets resulting from operations | (672,905) | (3,655,934) |
Distributions to shareholders from net investment income | (7,553,931) | (4,160,313) |
Distributions to shareholders from net realized gain | - | (301,192) |
Total distributions | (7,553,931) | (4,461,505) |
Share transactions - net increase (decrease) | 87,547,372 | 20,511,129 |
Redemption fees | 863 | 1,150 |
Total increase (decrease) in net assets | 79,321,399 | 12,394,840 |
| | |
Net Assets | | |
Beginning of period | 208,060,111 | 195,665,271 |
End of period (including undistributed net investment income of $3,583,213 and undistributed net investment income of $7,054,946, respectively) | $ 287,381,510 | $ 208,060,111 |
See accompanying notes which are an integral part of the financial statements.
Annual Report
Financial Highlights - Fidelity International Value Fund Class A
Years ended October 31, | 2015 | 2014 | 2013 | 2012 | 2011 |
Selected Per-Share Data | | | | | |
Net asset value, beginning of period | $ 8.62 | $ 8.96 | $ 7.39 | $ 7.02 | $ 8.22 |
Income from Investment Operations | | | | | |
Net investment income (loss) C | .13 | .31F | .17 | .20 | .22 |
Net realized and unrealized gain (loss) | (.20) | (.47) | 1.64 | .39 | (1.19) |
Total from investment operations | (.07) | (.16) | 1.81 | .59 | (.97) |
Distributions from net investment income | (.28) | (.17) | (.20) | (.22) | (.19) |
Distributions from net realized gain | - | (.01) | (.04) | - | (.03) |
Total distributions | (.28) | (.18) | (.24) | (.22) | (.23)I |
Redemption fees added to paid in capitalC, H | - | - | - | - | - |
Net asset value, end of period | $ 8.27 | $ 8.62 | $ 8.96 | $ 7.39 | $ 7.02 |
Total ReturnA, B | (.81)% | (1.76)% | 25.24% | 8.82% | (12.19)% |
Ratios to Average Net AssetsD, G | | | | | |
Expenses before reductions | 1.37% | 1.32% | 1.39% | 1.44% | 1.36% |
Expenses net of fee waivers, if any | 1.37% | 1.32% | 1.39% | 1.44% | 1.36% |
Expenses net of all reductions | 1.36% | 1.32% | 1.36% | 1.41% | 1.34% |
Net investment income (loss) | 1.58% | 3.44%F | 2.08% | 2.85% | 2.79% |
Supplemental Data | | | | | |
Net assets, end of period (000 omitted) | $ 8,956 | $ 6,296 | $ 6,191 | $ 4,491 | $ 4,668 |
Portfolio turnover rateE | 44% | 69% | 79% | 74% | 83% |
A Total returns would have been lower if certain expenses had not been reduced during the applicable periods shown.
B Total returns do not include the effect of the sales charges.
C Calculated based on average shares outstanding during the period.
D Fees and expenses of any underlying Fidelity Central Funds are not included in the Fund's expense ratio. The Fund indirectly bears its proportionate share of the expenses of any underlying Fidelity Central Funds.
E Amount does not include the portfolio activity of any underlying Fidelity Central Funds.
F Investment income per share reflects a large, non-recurring dividend which amounted to $.14 per share. Excluding this non-recurring dividend, the ratio of net investment income (loss) to average net assets would have been 1.90%.
G Expense ratios reflect operating expenses of the class. Expenses before reductions do not reflect amounts reimbursed by the investment adviser or reductions from brokerage service arrangements or reductions from other expense offset arrangements and do not represent the amount paid by the class during periods when reimbursements or reductions occur. Expenses net of fee waivers reflect expenses after reimbursement by the investment adviser but prior to reductions from brokerage service arrangements or other expense offset arrangements. Expenses net of all reductions represent the net expenses paid by the class.
H Amount represents less than $.005 per share.
I Total distributions of $.23 per share is comprised of distributions from net investment income of $.191 and distributions from net realized gain of $.034 per share.
See accompanying notes which are an integral part of the financial statements.
Annual Report
Financial Highlights - Fidelity International Value Fund Class T
Years ended October 31, | 2015 | 2014 | 2013 | 2012 | 2011 |
Selected Per-Share Data | | | | | |
Net asset value, beginning of period | $ 8.60 | $ 8.94 | $ 7.38 | $ 7.00 | $ 8.20 |
Income from Investment Operations | | | | | |
Net investment income (loss) C | .11 | .28F | .15 | .18 | .20 |
Net realized and unrealized gain (loss) | (.20) | (.46) | 1.64 | .40 | (1.19) |
Total from investment operations | (.09) | (.18) | 1.79 | .58 | (.99) |
Distributions from net investment income | (.26) | (.15) | (.19) | (.20) | (.17) |
Distributions from net realized gain | - | (.01) | (.04) | - | (.03) |
Total distributions | (.26) | (.16) | (.23) | (.20) | (.21)I |
Redemption fees added to paid in capitalC, H | - | - | - | - | - |
Net asset value, end of period | $ 8.25 | $ 8.60 | $ 8.94 | $ 7.38 | $ 7.00 |
Total ReturnA, B | (1.09)% | (1.99)% | 24.86% | 8.60% | (12.42)% |
Ratios to Average Net AssetsD, G | | | | | |
Expenses before reductions | 1.66% | 1.59% | 1.66% | 1.71% | 1.63% |
Expenses net of fee waivers, if any | 1.66% | 1.59% | 1.65% | 1.70% | 1.62% |
Expenses net of all reductions | 1.65% | 1.59% | 1.63% | 1.67% | 1.60% |
Net investment income (loss) | 1.29% | 3.17%F | 1.81% | 2.58% | 2.52% |
Supplemental Data | | | | | |
Net assets, end of period (000 omitted) | $ 4,086 | $ 3,604 | $ 3,758 | $ 2,693 | $ 2,468 |
Portfolio turnover rateE | 44% | 69% | 79% | 74% | 83% |
A Total returns would have been lower if certain expenses had not been reduced during the applicable periods shown.
B Total returns do not include the effect of the sales charges.
C Calculated based on average shares outstanding during the period.
D Fees and expenses of any underlying Fidelity Central Funds are not included in the Fund's expense ratio. The Fund indirectly bears its proportionate share of the expenses of any underlying Fidelity Central Funds.
E Amount does not include the portfolio activity of any underlying Fidelity Central Funds.
F Investment income per share reflects a large, non-recurring dividend which amounted to $.14 per share. Excluding this non-recurring dividend, the ratio of net investment income (loss) to average net assets would have been 1.64%.
G Expense ratios reflect operating expenses of the class. Expenses before reductions do not reflect amounts reimbursed by the investment adviser or reductions from brokerage service arrangements or reductions from other expense offset arrangements and do not represent the amount paid by the class during periods when reimbursements or reductions occur. Expenses net of fee waivers reflect expenses after reimbursement by the investment adviser but prior to reductions from brokerage service arrangements or other expense offset arrangements. Expenses net of all reductions represent the net expenses paid by the class.
H Amount represents less than $.005 per share.
I Total distributions of $.21 per share is comprised of distributions from net investment income of $.173 and distributions from net realized gain of $.034 per share.
See accompanying notes which are an integral part of the financial statements.
Annual Report
Financial Highlights - Fidelity International Value Fund Class B
Years ended October 31, | 2015 | 2014 | 2013 | 2012 | 2011 |
Selected Per-Share Data | | | | | |
Net asset value, beginning of period | $ 8.66 | $ 8.98 | $ 7.39 | $ 7.00 | $ 8.20 |
Income from Investment Operations | | | | | |
Net investment income (loss) C | .07 | .24F | .11 | .14 | .17 |
Net realized and unrealized gain (loss) | (.21) | (.45) | 1.65 | .41 | (1.20) |
Total from investment operations | (.14) | (.21) | 1.76 | .55 | (1.03) |
Distributions from net investment income | (.18) | (.09) | (.13) | (.16) | (.13) |
Distributions from net realized gain | - | (.01) | (.04) | - | (.03) |
Total distributions | (.18) | (.11) I | (.17) | (.16) | (.17)J |
Redemption fees added to paid in capitalC, H | - | - | - | - | - |
Net asset value, end of period | $ 8.34 | $ 8.66 | $ 8.98 | $ 7.39 | $ 7.00 |
Total ReturnA, B | (1.64)% | (2.39)% | 24.30% | 8.07% | (12.88)% |
Ratios to Average Net AssetsD, G | | | | | |
Expenses before reductions | 2.15% | 2.08% | 2.14% | 2.19% | 2.11% |
Expenses net of fee waivers, if any | 2.15% | 2.08% | 2.14% | 2.19% | 2.11% |
Expenses net of all reductions | 2.14% | 2.08% | 2.11% | 2.16% | 2.09% |
Net investment income (loss) | .81% | 2.68%F | 1.32% | 2.09% | 2.04% |
Supplemental Data | | | | | |
Net assets, end of period (000 omitted) | $ 302 | $ 414 | $ 678 | $ 691 | $ 901 |
Portfolio turnover rateE | 44% | 69% | 79% | 74% | 83% |
A Total returns would have been lower if certain expenses had not been reduced during the applicable periods shown.
B Total returns do not include the effect of the contingent deferred sales charge.
C Calculated based on average shares outstanding during the period.
D Fees and expenses of any underlying Fidelity Central Funds are not included in the Fund's expense ratio. The Fund indirectly bears its proportionate share of the expenses of any underlying Fidelity Central Funds.
E Amount does not include the portfolio activity of any underlying Fidelity Central Funds.
F Investment income per share reflects a large, non-recurring dividend which amounted to $.14 per share. Excluding this non-recurring dividend, the ratio of net investment income (loss) to average net assets would have been 1.15%.
G Expense ratios reflect operating expenses of the class. Expenses before reductions do not reflect amounts reimbursed by the investment adviser or reductions from brokerage service arrangements or reductions from other expense offset arrangements and do not represent the amount paid by the class during periods when reimbursements or reductions occur. Expenses net of fee waivers reflect expenses after reimbursement by the investment adviser but prior to reductions from brokerage service arrangements or other expense offset arrangements. Expenses net of all reductions represent the net expenses paid by the class.
H Amount represents less than $.005 per share.
I Total distributions of $.11 per share is comprised of distributions from net investment income of $.093 and distributions from net realized gain of $.014 per share.
J Total distributions of $.17 per share is comprised of distributions from net investment income of $.131 and distributions from net realized gain of $.034 per share.
See accompanying notes which are an integral part of the financial statements.
Annual Report
Financial Highlights - Fidelity International Value Fund Class C
Years ended October 31, | 2015 | 2014 | 2013 | 2012 | 2011 |
Selected Per-Share Data | | | | | |
Net asset value, beginning of period | $ 8.59 | $ 8.93 | $ 7.38 | $ 7.00 | $ 8.20 |
Income from Investment Operations | | | | | |
Net investment income (loss)C | .07 | .24F | .11 | .14 | .16 |
Net realized and unrealized gain (loss) | (.20) | (.45) | 1.63 | .41 | (1.19) |
Total from investment operations | (.13) | (.21) | 1.74 | .55 | (1.03) |
Distributions from net investment income | (.23) | (.11) | (.15) | (.17) | (.14) |
Distributions from net realized gain | - | (.01) | (.04) | - | (.03) |
Total distributions | (.23) | (.13)I | (.19) | (.17) | (.17) |
Redemption fees added to paid in capitalC, H | - | - | - | - | - |
Net asset value, end of period | $ 8.23 | $ 8.59 | $ 8.93 | $ 7.38 | $ 7.00 |
Total ReturnA, B | (1.58)% | (2.43)% | 24.17% | 8.12% | (12.84)% |
Ratios to Average Net AssetsD, G | | | | | |
Expenses before reductions | 2.15% | 2.07% | 2.14% | 2.19% | 2.12% |
Expenses net of fee waivers, if any | 2.14% | 2.07% | 2.14% | 2.19% | 2.11% |
Expenses net of all reductions | 2.14% | 2.07% | 2.11% | 2.16% | 2.09% |
Net investment income (loss) | .81% | 2.69%F | 1.33% | 2.09% | 2.04% |
Supplemental Data | | | | | |
Net assets, end of period (000 omitted) | $ 4,502 | $ 3,647 | $ 3,231 | $ 2,249 | $ 2,108 |
Portfolio turnover rateE | 44% | 69% | 79% | 74% | 83% |
A Total returns would have been lower if certain expenses had not been reduced during the applicable periods shown.
B Total returns do not include the effect of the contingent deferred sales charge.
C Calculated based on average shares outstanding during the period.
D Fees and expenses of any underlying Fidelity Central Funds are not included in the Fund's expense ratio. The Fund indirectly bears its proportionate share of the expenses of any underlying Fidelity Central Funds.
E Amount does not include the portfolio activity of any underlying Fidelity Central Funds.
F Investment income per share reflects a large, non-recurring dividend which amounted to $.14 per share. Excluding this non-recurring dividend, the ratio of net investment income (loss) to average net assets would have been 1.15%.
G Expense ratios reflect operating expenses of the class. Expenses before reductions do not reflect amounts reimbursed by the investment adviser or reductions from brokerage service arrangements or reductions from other expense offset arrangements and do not represent the amount paid by the class during periods when reimbursements or reductions occur. Expenses net of fee waivers reflect expenses after reimbursement by the investment adviser but prior to reductions from brokerage service arrangements or other expense offset arrangements. Expenses net of all reductions represent the net expenses paid by the class.
H Amount represents less than $.005 per share.
I Total distributions of $.13 per share is comprised of distributions from net investment income of $.111 and distributions from net realized gain of $.014 per share.
See accompanying notes which are an integral part of the financial statements.
Annual Report
Financial Highlights - Fidelity International Value Fund
Years ended October 31, | 2015 | 2014 | 2013 | 2012 | 2011 |
Selected Per-Share Data | | | | | |
Net asset value, beginning of period | $ 8.64 | $ 8.97 | $ 7.40 | $ 7.03 | $ 8.23 |
Income from Investment Operations | | | | | |
Net investment income (loss) B | .16 | .34E | .19 | .22 | .25 |
Net realized and unrealized gain (loss) | (.19) | (.46) | 1.65 | .40 | (1.20) |
Total from investment operations | (.03) | (.12) | 1.84 | .62 | (.95) |
Distributions from net investment income | (.32) | (.20) | (.22) | (.25) | (.22) |
Distributions from net realized gain | - | (.01) | (.04) | - | (.03) |
Total distributions | (.32) | (.21) | (.27)H | (.25) | (.25) |
Redemption fees added to paid in capitalB, G | - | - | - | - | - |
Net asset value, end of period | $ 8.29 | $ 8.64 | $ 8.97 | $ 7.40 | $ 7.03 |
Total ReturnA | (.41)% | (1.34)% | 25.57% | 9.19% | (11.91)% |
Ratios to Average Net AssetsC, F | | | | | |
Expenses before reductions | 1.02% | .96% | 1.05% | 1.13% | 1.04% |
Expenses net of fee waivers, if any | 1.02% | .96% | 1.05% | 1.13% | 1.03% |
Expenses net of all reductions | 1.01% | .95% | 1.02% | 1.10% | 1.01% |
Net investment income (loss) | 1.93% | 3.80%E | 2.41% | 3.16% | 3.11% |
Supplemental Data | | | | | |
Net assets, end of period (000 omitted) | $ 267,567 | $ 192,789 | $ 181,568 | $ 128,983 | $ 150,967 |
Portfolio turnover rateD | 44% | 69% | 79% | 74% | 83% |
A Total returns would have been lower if certain expenses had not been reduced during the applicable periods shown.
B Calculated based on average shares outstanding during the period.
C Fees and expenses of any underlying Fidelity Central Funds are not included in the Fund's expense ratio. The Fund indirectly bears its proportionate share of the expenses of any underlying Fidelity Central Funds.
D Amount does not include the portfolio activity of any underlying Fidelity Central Funds.
E Investment income per share reflects a large, non-recurring dividend which amounted to $.14 per share. Excluding this non-recurring dividend, the ratio of net investment income (loss) to average net assets would have been 2.27%.
F Expense ratios reflect operating expenses of the class. Expenses before reductions do not reflect amounts reimbursed by the investment adviser or reductions from brokerage service arrangements or reductions from other expense offset arrangements and do not represent the amount paid by the class during periods when reimbursements or reductions occur. Expenses net of fee waivers reflect expenses after reimbursement by the investment adviser but prior to reductions from brokerage service arrangements or other expense offset arrangements. Expenses net of all reductions represent the net expenses paid by the class.
G Amount represents less than $.005 per share.
H Total distributions of $.27 per share is comprised of distributions from net investment income of $.223 and distributions from net realized gain of $.042 per share.
See accompanying notes which are an integral part of the financial statements.
Annual Report
Financial Highlights - Fidelity International Value Fund Class I
Years ended October 31, | 2015 | 2014 | 2013 | 2012 | 2011 |
Selected Per-Share Data | | | | | |
Net asset value, beginning of period | $ 8.65 | $ 8.98 | $ 7.41 | $ 7.04 | $ 8.24 |
Income from Investment Operations | | | | | |
Net investment income (loss) B | .15 | .33E | .19 | .22 | .25 |
Net realized and unrealized gain (loss) | (.19) | (.45) | 1.65 | .40 | (1.19) |
Total from investment operations | (.04) | (.12) | 1.84 | .62 | (.94) |
Distributions from net investment income | (.32) | (.19) | (.23) | (.25) | (.22) |
Distributions from net realized gain | - | (.01) | (.04) | - | (.03) |
Total distributions | (.32) | (.21)H | (.27) | (.25) | (.26)I |
Redemption fees added to paid in capitalB, G | - | - | - | - | - |
Net asset value, end of period | $ 8.29 | $ 8.65 | $ 8.98 | $ 7.41 | $ 7.04 |
Total ReturnA | (.53)% | (1.41)% | 25.64% | 9.22% | (11.83)% |
Ratios to Average Net AssetsC, F | | | | | |
Expenses before reductions | 1.14% | 1.05% | 1.07% | 1.10% | .98% |
Expenses net of fee waivers, if any | 1.14% | 1.05% | 1.07% | 1.10% | .98% |
Expenses net of all reductions | 1.13% | 1.04% | 1.04% | 1.07% | .96% |
Net investment income (loss) | 1.81% | 3.71%E | 2.39% | 3.18% | 3.17% |
Supplemental Data | | | | | |
Net assets, end of period (000 omitted) | $ 1,969 | $ 1,310 | $ 239 | $ 372 | $ 473 |
Portfolio turnover rateD | 44% | 69% | 79% | 74% | 83% |
A Total returns would have been lower if certain expenses had not been reduced during the applicable periods shown.
B Calculated based on average shares outstanding during the period.
C Fees and expenses of any underlying Fidelity Central Funds are not included in the Fund's expense ratio. The Fund indirectly bears its proportionate share of the expenses of any underlying Fidelity Central Funds.
D Amount does not include the portfolio activity of any underlying Fidelity Central Funds.
E Investment income per share reflects a large, non-recurring dividend which amounted to $.14 per share. Excluding this non-recurring dividend, the ratio of net investment income (loss) to average net assets would have been 2.18%.
F Expense ratios reflect operating expenses of the class. Expenses before reductions do not reflect amounts reimbursed by the investment adviser or reductions from brokerage service arrangements or reductions from other expense offset arrangements and do not represent the amount paid by the class during periods when reimbursements or reductions occur. Expenses net of fee waivers reflect expenses after reimbursement by the investment adviser but prior to reductions from brokerage service arrangements or other expense offset arrangements. Expenses net of all reductions represent the net expenses paid by the class.
G Amount represents less than $.005 per share.
H Total distributions of $.21 per share is comprised of distributions from net investment income of $.191 and distributions from net realized gain of $.014 per share.
I Total distributions of $.26 per share is comprised of distributions from net investment income of $.221 and distributions from net realized gain of $.034 per share.
See accompanying notes which are an integral part of the financial statements.
Annual Report
For the period ended October 31, 2015
1. Organization.
Fidelity International Value Fund (the Fund) is a fund of Fidelity Investment Trust (the Trust) and is authorized to issue an unlimited number of shares. The Trust is registered under the Investment Company Act of 1940, as amended (the 1940 Act), as an open-end management investment company organized as a Massachusetts business trust. The Fund offers Class A, Class T, Class C, International Value, and Class I (formerly Institutional Class) shares, each of which, along with Class B shares, has equal rights as to assets and voting privileges. Class B shares are closed to new accounts and additional purchases, except for exchanges and reinvestments. Each class has exclusive voting rights with respect to matters that affect that class. Class B shares will automatically convert to Class A shares after a holding period of seven years from the initial date of purchase.
2. Investments in Fidelity Central Funds.
The Fund invests in Fidelity Central Funds, which are open-end investment companies generally available only to other investment companies and accounts managed by the investment adviser and its affiliates. The Fund's Schedule of Investments lists each of the Fidelity Central Funds held as of period end, if any, as an investment of the Fund, but does not include the underlying holdings of each Fidelity Central Fund. As an Investing Fund, the Fund indirectly bears its proportionate share of the expenses of the underlying Fidelity Central Funds.
The Money Market Central Funds seek preservation of capital and current income and are managed by Fidelity Investments Money Management, Inc. (FIMM), an affiliate of the investment adviser. Annualized expenses of the Money Market Central Funds as of their most recent shareholder report date are less than .005%.
A complete unaudited list of holdings for each Fidelity Central Fund is available upon request or at the Securities and Exchange Commission (the SEC) website at www.sec.gov. In addition, the financial statements of the Fidelity Central Funds, which are not covered by the Fund's Report of Independent Registered Public Accounting Firm, are available on the SEC website or upon request.
3. Significant Accounting Policies.
The financial statements have been prepared in conformity with accounting principles generally accepted in the United States of America (GAAP), which require management to make certain estimates and assumptions at the date of the financial statements. Actual results could differ from those estimates. Subsequent events, if any, through the date that the financial statements were issued have been evaluated in the preparation of the financial statements. The following summarizes the significant accounting policies of the Fund:
Annual Report
3. Significant Accounting Policies - continued
Investment Valuation. Investments are valued as of 4:00 p.m. Eastern time on the last calendar day of the period. The Board of Trustees (the Board) has delegated the day to day responsibility for the valuation of the Fund's investments to the Fidelity Management & Research Company (FMR) Fair Value Committee (the Committee). In accordance with valuation policies and procedures approved by the Board, the Fund attempts to obtain prices from one or more third party pricing vendors or brokers to value its investments. When current market prices, quotations or currency exchange rates are not readily available or reliable, investments will be fair valued in good faith by the Committee, in accordance with procedures adopted by the Board. Factors used in determining fair value vary by investment type and may include market or investment specific events. The frequency with which these procedures are used cannot be predicted and they may be utilized to a significant extent. The Committee oversees the Fund's valuation policies and procedures and reports to the Board on the Committee's activities and fair value determinations. The Board monitors the appropriateness of the procedures used in valuing the Fund's investments and ratifies the fair value determinations of the Committee.
The Fund categorizes the inputs to valuation techniques used to value its investments into a disclosure hierarchy consisting of three levels as shown below:
Level 1 - quoted prices in active markets for identical investments
Level 2 - other significant observable inputs (including quoted prices for similar investments, interest rates, prepayment speeds, etc.)
Level 3 - unobservable inputs (including the Fund's own assumptions based on the best information available)
Valuation techniques used to value the Fund's investments by major category are as follows:
Equity securities, including restricted securities, for which market quotations are readily available, are valued at the last reported sale price or official closing price as reported by a third party pricing vendor on the primary market or exchange on which they are traded and are categorized as Level 1 in the hierarchy. In the event there were no sales during the day or closing prices are not available, securities are valued at the last quoted bid price or may be valued using the last available price and are generally categorized as Level 2 in the hierarchy. For foreign equity securities, when market or security specific events arise, comparisons to the valuation of American Depositary Receipts (ADRs), futures contracts, Exchange-Traded Funds (ETFs) and certain indexes as well as quoted prices for similar securities may be used and would be categorized as Level 2 in the hierarchy. Utilizing these techniques may result in transfers between Level 1 and Level 2.
Annual Report
Notes to Financial Statements - continued
3. Significant Accounting Policies - continued
Investment Valuation - continued
For equity securities, including restricted securities, where observable inputs are limited, assumptions about market activity and risk are used and these securities may be categorized as Level 3 in the hierarchy.
Investments in open-end mutual funds, including the Fidelity Central Funds, are valued at their closing net asset value (NAV) each business day and are categorized as Level 1 in the hierarchy.
Changes in valuation techniques may result in transfers in or out of an assigned level within the disclosure hierarchy. The aggregate value of investments by input level as of October 31, 2015, including information on transfers between Levels 1 and 2, is included at the end of the Fund's Schedule of Investments.
Foreign Currency. The Fund may use foreign currency contracts to facilitate transactions in foreign-denominated securities. Gains and losses from these transactions may arise from changes in the value of the foreign currency or if the counterparties do not perform under the contracts' terms.
Foreign-denominated assets, including investment securities, and liabilities are translated into U.S. dollars at the exchange rates at period end. Purchases and sales of investment securities, income and dividends received and expenses denominated in foreign currencies are translated into U.S. dollars at the exchange rate in effect on the transaction date.
The effects of exchange rate fluctuations on investments are included with the net realized and unrealized gain (loss) on investment securities. Other foreign currency transactions resulting in realized and unrealized gain (loss) are disclosed separately.
Investment Transactions and Income. For financial reporting purposes, the Fund's investment holdings and NAV include trades executed through the end of the last business day of the period. The NAV per share for processing shareholder transactions is calculated as of the close of business of the New York Stock Exchange (NYSE), normally 4:00 p.m. Eastern time and includes trades executed through the end of the prior business day. Gains and losses on securities sold are determined on the basis of identified cost. Dividend income is recorded on the ex-dividend date, except for certain dividends from foreign securities where the ex-dividend date may have passed, which are recorded as soon as the Fund is informed of the ex-dividend date. Non-cash dividends included in dividend income, if any, are recorded at the fair market value of the securities received. Income and capital gain distributions from Fidelity Central Funds, if any, are recorded on the ex-dividend date. Distributions received on securities that represent a return of
Annual Report
3. Significant Accounting Policies - continued
Investment Transactions and Income - continued
capital or capital gain are recorded as a reduction of cost of investments and/or as a realized gain. Subsequent to ex-dividend date the Fund determines the components of these distributions, based upon receipt of tax filings or other correspondence relating to the underlying investment. Interest income is accrued as earned and includes coupon interest and amortization of premium and accretion of discount on debt securities as applicable. Investment income is recorded net of foreign taxes withheld where recovery of such taxes is uncertain.
Class Allocations and Expenses. Investment income, realized and unrealized capital gains and losses, common expenses of the Fund, and certain fund-level expense reductions, if any, are allocated daily on a pro-rata basis to each class based on the relative net assets of each class to the total net assets of the Fund. Each class differs with respect to transfer agent and distribution and service plan fees incurred. Certain expense reductions may also differ by class. For the reporting period, the allocated portion of income and expenses to each class as a percent of its average net assets may vary due to the timing of recording these transactions in relation to fluctuating net assets of the classes. Expenses directly attributable to a fund are charged to that fund. Expenses attributable to more than one fund are allocated among the respective funds on the basis of relative net assets or other appropriate methods. Expense estimates are accrued in the period to which they relate and adjustments are made when actual amounts are known.
Income Tax Information and Distributions to Shareholders. Each year, the Fund intends to qualify as a regulated investment company under Subchapter M of the Internal Revenue Code, including distributing substantially all of its taxable income and realized gains. As a result, no provision for U.S. Federal income taxes is required. As of October 31, 2015, the Fund did not have any unrecognized tax benefits in the financial statements; nor is the Fund aware of any tax positions for which it is reasonably possible that the total amounts of unrecognized tax benefits will significantly change in the next twelve months. The Fund files a U.S. federal tax return, in addition to state and local tax returns as required. The Fund's federal income tax returns are subject to examination by the Internal Revenue Service (IRS) for a period of three fiscal years after they are filed. State and local tax returns may be subject to examination for an additional fiscal year depending on the jurisdiction. Foreign taxes are provided for based on the Fund's understanding of the tax rules and rates that exist in the foreign markets in which it invests.
Distributions are declared and recorded on the ex-dividend date. Income dividends and capital gain distributions are declared separately for each class. Income and capital gain distributions are determined in accordance with income tax regulations, which may differ from GAAP
Annual Report
Notes to Financial Statements - continued
3. Significant Accounting Policies - continued
Income Tax Information and Distributions to Shareholders - continued
Capital accounts within the financial statements are adjusted for permanent book-tax differences. These adjustments have no impact on net assets or the results of operations. Capital accounts are not adjusted for temporary book-tax differences which will reverse in a subsequent period.
Book-tax differences are primarily due to foreign currency transactions, passive foreign investment companies (PFIC), partnerships, capital loss carryforwards, and losses deferred due to wash sales.
The federal tax cost of investment securities and unrealized appreciation (depreciation) as of period end were as follows:
Gross unrealized appreciation | $ 19,037,265 |
Gross unrealized depreciation | (20,289,295) |
Net unrealized appreciation (depreciation) on securities | $ (1,252,030) |
Tax Cost | $ 294,220,119 |
The tax-based components of distributable earnings as of period end were as follows:
Undistributed ordinary income | $ 3,582,798 |
Capital loss carryforward | $ (105,982,428) |
Net unrealized appreciation (depreciation) on securities and other investments | $ (1,205,329) |
Capital loss carryforwards are only available to offset future capital gains of the Fund to the extent provided by regulations and may be limited. Under the Regulated Investment Company Modernization Act of 2010 (the Act), the Fund is permitted to carry forward capital losses incurred in taxable years beginning after December 22, 2010 for an unlimited period and such capital losses are required to be used prior to any losses that expire. The capital loss carryforward information presented below, including any applicable limitation, is estimated as of fiscal period end and is subject to adjustment.
Fiscal year of expiration | |
2016 | $ (2,663,413) |
2017 | (65,376,972) |
2018 | (3,571,319) |
2019 | (31,368,797) |
Total with expiration | $ (102,980,501) |
No expiration | |
Short-term | $ (3,001,927) |
Total capital loss carryforward | $ (105,982,428) |
The tax character of distributions paid was as follows:
| October 31, 2015 | October 31, 2014 |
Ordinary Income | 7,553,931 | 4,461,505 |
Annual Report
3. Significant Accounting Policies - continued
Short-Term Trading (Redemption) Fees. Shares held by investors in the Fund less than 30 days may have been subject to a redemption fee equal to 1.00% of the NAV of shares redeemed. All redemption fees, which reduce the proceeds of the shareholder redemption, are retained by the Fund and accounted for as an addition to paid in capital.
Delayed Delivery Transactions and When-Issued Securities. During the period, the Fund transacted in securities on a delayed delivery or when-issued basis. Payment and delivery may take place after the customary settlement period for that security. The price of the underlying securities and the date when the securities will be delivered and paid for are fixed at the time the transaction is negotiated. The securities purchased on a delayed delivery or when-issued basis are identified as such in the Fund's Schedule of Investments. With respect to purchase commitments, the Fund identifies securities as segregated in its records with a value at least equal to the amount of the commitment. Losses may arise due to changes in the value of the underlying securities or if the counterparty does not perform under the contract's terms, or if the issuer does not issue the securities due to political, economic, or other factors.
Restricted Securities. The Fund may invest in securities that are subject to legal or contractual restrictions on resale. These securities generally may be resold in transactions exempt from registration or to the public if the securities are registered. Disposal of these securities may involve time-consuming negotiations and expense, and prompt sale at an acceptable price may be difficult. Information regarding restricted securities is included at the end of the Fund's Schedule of Investments.
4. Purchases and Sales of Investments.
Purchases and sales of securities, other than short-term securities, aggregated $174,734,340 and $94,895,330, respectively.
5. Fees and Other Transactions with Affiliates.
Management Fee. Fidelity Management & Research Company (the investment adviser) and its affiliates provide the Fund with investment management related services for which the Fund pays a monthly management fee. The management fee is the sum of an individual fund fee rate that is based on an annual rate of .45% of the Fund's average net assets and an annualized group fee rate that averaged .25% during the period. The group fee rate is based upon the average net assets of all the mutual funds advised by the investment adviser, including any mutual funds previously advised by the investment adviser that are currently advised by Fidelity SelectCo, LLC, an affiliate of the investment adviser. The group fee rate decreases as assets under management increase and increases as assets under management decrease. In addition, the management fee is
Annual Report
Notes to Financial Statements - continued
5. Fees and Other Transactions with Affiliates - continued
Management Fee - continued
subject to a performance adjustment (up to a maximum of ± .20% of the Fund's average net assets over a 36 month performance period). The upward or downward adjustment to the management fee is based on the relative investment performance of International Value as compared to its benchmark index, the MSCI EAFE Value Index, over the same 36 month performance period. For the reporting period, the total annual management fee rate, including the performance adjustment, was .70% of the Fund's average net assets. The performance adjustment included in the management fee rate may be higher or lower than the maximum performance adjustment rate due to the difference between the average net assets for the reporting and performance periods.
Distribution and Service Plan Fees. In accordance with Rule 12b-1 of the 1940 Act, the Fund has adopted separate Distribution and Service Plans for each class of shares. Certain classes pay Fidelity Distributors Corporation (FDC), an affiliate of the investment adviser, separate Distribution and Service Fees, each of which is based on an annual percentage of each class' average net assets. In addition, FDC may pay financial intermediaries for selling shares of the Fund and providing shareholder support services. For the period, the Distribution and Service Fee rates, total fees and amounts retained by FDC were as follows:
| Distribution
Fee | Service
Fee | Total Fees | Retained
by FDC |
Class A | -% | .25% | $ 18,667 | $ 598 |
Class T | .25% | .25% | 19,464 | - |
Class B | .75% | .25% | 3,497 | 2,623 |
Class C | .75% | .25% | 42,205 | 7,959 |
| | | $ 83,833 | $ 11,180 |
Sales Load. FDC may receive a front-end sales charge of up to 5.75% for selling Class A shares and 3.50% for selling Class T shares, some of which is paid to financial intermediaries for selling shares of the Fund. Depending on the holding period, FDC may receive contingent deferred sales charges levied on Class A, Class T, Class B, and Class C redemptions. The deferred sales charges range from 5.00% to 1.00% for Class B shares, 1.00% for Class C shares, 1.00% for certain purchases of Class A shares and .25% for certain purchases of Class T shares.
Annual Report
5. Fees and Other Transactions with Affiliates - continued
Sales Load - continued
For the period, sales charge amounts retained by FDC were as follows:
| Retained
by FDC |
Class A | $ 6,394 |
Class T | 1,543 |
Class BA | 99 |
Class CA | 969 |
| $ 9,005 |
A When Class B and Class C shares are initially sold, FDC pays commissions from its own resources to financial intermediaries through which the sales are made.
Transfer Agent Fees. Fidelity Investments Institutional Operations Company, Inc., (FIIOC), an affiliate of the investment adviser, is the transfer, dividend disbursing and shareholder servicing agent for each class of the Fund. FIIOC receives account fees and asset-based fees that vary according to the account size and type of account of the shareholders of the respective classes of the Fund. FIIOC pays for typesetting, printing and mailing of shareholder reports, except proxy statements.
For the period, transfer agent fees for each class were as follows:
| Amount | % of
Class-Level Average
Net Assets |
Class A | $ 20,480 | .27 |
Class T | 12,140 | .31 |
Class B | 1,039 | .30 |
Class C | 12,740 | .30 |
International Value | 355,158 | .18 |
Class I | 7,106 | .29 |
| $ 408,663 | |
Accounting and Security Lending Fees. Fidelity Service Company, Inc. (FSC), an affiliate of the investment adviser, maintains the Fund's accounting records. The accounting fee is based on the level of average net assets for each month. Under a separate contract, FSC administers the security lending program. The security lending fee is based on the number and duration of lending transactions.
Brokerage Commissions. The Fund placed a portion of its portfolio transactions with brokerage firms which are affiliates of the investment adviser. Brokerage commissions are included in net realized gain (loss) and change in net unrealized appreciation (depreciation) in the Statement of Operations. The commissions paid to these affiliated firms were $227 for the period.
Annual Report
Notes to Financial Statements - continued
6. Committed Line of Credit.
The Fund participates with other funds managed by the investment adviser or an affiliate in a $4.25 billion credit facility (the "line of credit") to be utilized for temporary or emergency purposes to fund shareholder redemptions or for other short-term liquidity purposes. The Fund has agreed to pay commitment fees on its pro-rata portion of the line of credit, which amounted to $305 and is reflected in Miscellaneous expenses on the Statement of Operations. During the period, the Fund did not borrow on this line of credit.
7. Security Lending.
The Fund lends portfolio securities through a lending agent from time to time in order to earn additional income. For equity securities, a lending agent is used and may loan securities to certain qualified borrowers, including Fidelity Capital Markets (FCM), a broker-dealer affiliated with the Fund. On the settlement date of the loan, the Fund receives collateral (in the form of U.S. Treasury obligations, letters of credit and/or cash) against the loaned securities and maintains collateral in an amount not less than 100% of the market value of the loaned securities during the period of the loan. The market value of the loaned securities is determined at the close of business of the Fund and any additional required collateral is delivered to the Fund on the next business day. The Fund or borrower may terminate the loan at any time, and if the borrower defaults on its obligation to return the securities loaned because of insolvency or other reasons, the Fund may apply collateral received from the borrower against the obligation. The Fund may experience delays and costs in recovering the securities loaned. Any cash collateral received is invested in the Fidelity Securities Lending Cash Central Fund. The value of loaned securities and cash collateral at period end are disclosed on the Fund's Statement of Assets and Liabilities. Security lending income represents the income earned on investing cash collateral, less rebates paid to borrowers and any lending agent fees associated with the loan, plus any premium payments received for lending certain types of securities. Security lending income is presented in the Statement of Operations as a component of income from Fidelity Central Funds. Total security lending income during the period amounted to $112,755. During the period, there were no securities loaned to FCM.
Annual Report
8. Expense Reductions.
Commissions paid to certain brokers with whom the investment adviser, or its affiliates, places trades on behalf of the Fund include an amount in addition to trade execution, which may be rebated back to the Fund to offset certain expenses. This amount totaled $18,272 for the period.
In addition, during the period the investment adviser reimbursed and /or waived a portion of fund-level operating expenses in the amount of $841 and a portion of class-level operating expenses as follows:
| Amount |
Class A | $ 23 |
Class T | 8 |
Class B | 1 |
Class C | 8 |
International Value | 4,489 |
Class I | 13 |
| $ 4,542 |
9. Distributions to Shareholders.
Distributions to shareholders of each class were as follows:
Years ended October 31, | 2015 | 2014 |
From net investment income | | |
Class A | $ 204,314 | $ 117,558 |
Class T | 109,443 | 63,542 |
Class B | 8,373 | 6,919 |
Class C | 99,311 | 40,539 |
International Value | 7,079,700 | 3,926,459 |
Class I | 52,790 | 5,296 |
Total | $ 7,553,931 | $ 4,160,313 |
From net realized gain | | |
Class A | $ - | $ 9,681 |
Class T | - | 5,931 |
Class B | - | 1,042 |
Class C | - | 5,113 |
International Value | - | 279,037 |
Class I | - | 388 |
Total | $ - | $ 301,192 |
Annual Report
Notes to Financial Statements - continued
10. Share Transactions.
Share transactions for each class were as follows and may contain automatic conversions between classes or exchanges between funds:
| Shares | Dollars |
Years ended October 31, | 2015 | 2014 | 2015 | 2014 |
Class A | | | | |
Shares sold | 527,583 | 271,659 | $ 4,502,640 | $ 2,416,438 |
Reinvestment of distributions | 23,604 | 12,904 | 197,333 | 112,525 |
Shares redeemed | (198,812) | (245,285) | (1,665,353) | (2,196,440) |
Net increase (decrease) | 352,375 | 39,278 | $ 3,034,620 | $ 332,523 |
Class T | | | | |
Shares sold | 117,820 | 79,778 | $ 1,007,336 | $ 709,484 |
Reinvestment of distributions | 12,981 | 7,900 | 108,520 | 68,891 |
Shares redeemed | (54,747) | (88,989) | (463,119) | (796,094) |
Net increase (decrease) | 76,054 | (1,311) | $ 652,737 | $ (17,719) |
Class B | | | | |
Shares sold | 2,257 | 1,662 | $ 18,258 | $ 15,295 |
Reinvestment of distributions | 891 | 756 | 7,565 | 6,661 |
Shares redeemed | (14,741) | (30,069) | (124,607) | (270,154) |
Net increase (decrease) | (11,593) | (27,651) | $ (98,784) | $ (248,198) |
Class C | | | | |
Shares sold | 208,019 | 107,427 | $ 1,779,247 | $ 961,012 |
Reinvestment of distributions | 10,999 | 4,784 | 92,173 | 41,813 |
Shares redeemed | (96,570) | (49,408) | (802,299) | (437,003) |
Net increase (decrease) | 122,448 | 62,803 | $ 1,069,121 | $ 565,822 |
International Value | | | | |
Shares sold | 14,508,730 | 5,177,049 | $ 121,044,962 | $ 46,484,243 |
Reinvestment of distributions | 823,202 | 470,965 | 6,873,736 | 4,097,400 |
Shares redeemed | (5,350,163) | (3,570,903) | (45,687,658) | (31,830,840) |
Net increase (decrease) | 9,981,769 | 2,077,111 | $ 82,231,040 | $ 18,750,803 |
Class I | | | | |
Shares sold | 413,299 | 140,760 | $ 3,523,105 | $ 1,271,347 |
Reinvestment of distributions | 5,275 | 394 | 44,098 | 3,438 |
Shares redeemed | (332,392) | (16,367) | (2,908,565) | (146,887) |
Net increase (decrease) | 86,182 | 124,787 | $ 658,638 | $ 1,127,898 |
11. Other.
The Fund's organizational documents provide former and current trustees and officers with a limited indemnification against liabilities arising in connection with the performance of their duties to the Fund. In the normal course of business, the Fund may also enter into contracts that provide general indemnifications. The Fund's maximum exposure under these arrangements is unknown as this would be dependent on future claims that may be made against the Fund. The risk of material loss from such claims is considered remote.
Annual Report
11. Other - continued
At the end of the period, Strategic Advisers International II Fund, was the owner of record of approximately 60% of the total outstanding shares of the Fund. Mutual funds managed by the investment adviser or its affiliates were the owners of record, in the aggregate, of approximately 63% of the total outstanding shares of the Fund.
Annual Report
To the Trustees of Fidelity Investment Trust and Shareholders of Fidelity International Value Fund:
We have audited the accompanying statement of assets and liabilities of Fidelity International Value Fund (the Fund), a fund of Fidelity Investment Trust, including the schedule of investments, as of October 31, 2015, and the related statement of operations for the year then ended, the statement of changes in net assets for each of the two years in the period then ended, and the financial highlights for each of the five years in the period then ended. These financial statements and financial highlights are the responsibility of the Fund's management. Our responsibility is to express an opinion on these financial statements and financial highlights based on our audits.
We conducted our audits in accordance with the standards of the Public Company Accounting Oversight Board (United States). Those standards require that we plan and perform the audit to obtain reasonable assurance about whether the financial statements and financial highlights are free of material misstatement. The Fund is not required to have, nor were we engaged to perform, an audit of its internal control over financial reporting. Our audits included consideration of internal control over financial reporting as a basis for designing audit procedures that are appropriate in the circumstances, but not for the purpose of expressing an opinion on the effectiveness of the Fund's internal control over financial reporting. Accordingly, we express no such opinion. An audit also includes examining, on a test basis, evidence supporting the amounts and disclosures in the financial statements, assessing the accounting principles used and significant estimates made by management, as well as evaluating the overall financial statement presentation. Our procedures included confirmation of securities owned as of October 31, 2015, by correspondence with the custodians and brokers; when replies were not received from brokers, we performed other auditing procedures. We believe that our audits provide a reasonable basis for our opinion.
In our opinion, such financial statements and financial highlights referred to above present fairly, in all material respects, the financial position of Fidelity International Value Fund as of October 31, 2015, the results of its operations for the year then ended, the changes in its net assets for each of the two years in the period then ended, and the financial highlights for each of the five years in the period then ended, in conformity with accounting principles generally accepted in the United States of America.
DELOITTE & TOUCHE LLP
Boston, Massachusetts
December 17, 2015
Annual Report
The Trustees, Member of the Advisory Board, and officers of the trust and fund, as applicable, are listed below. The Board of Trustees governs the fund and is responsible for protecting the interests of shareholders. The Trustees are experienced executives who meet periodically throughout the year to oversee the fund's activities, review contractual arrangements with companies that provide services to the fund, oversee management of the risks associated with such activities and contractual arrangements, and review the fund's performance. Each of the Trustees oversees 170 funds.
The Trustees hold office without limit in time except that (a) any Trustee may resign; (b) any Trustee may be removed by written instrument, signed by at least two-thirds of the number of Trustees prior to such removal; (c) any Trustee who requests to be retired or who has become incapacitated by illness or injury may be retired by written instrument signed by a majority of the other Trustees; and (d) any Trustee may be removed at any special meeting of shareholders by a two-thirds vote of the outstanding voting securities of the trust. Each Trustee who is not an interested person (as defined in the 1940 Act) of the trust and the fund (Independent Trustee), shall retire not later than the last day of the calendar year in which his or her 75th birthday occurs. The Independent Trustees may waive this mandatory retirement age policy with respect to individual Trustees. The officers and Advisory Board Member hold office without limit in time, except that any officer and Advisory Board Member may resign or may be removed by a vote of a majority of the Trustees at any regular meeting or any special meeting of the Trustees. Except as indicated, each individual has held the office shown or other offices in the same company for the past five years.
Experience, Skills, Attributes, and Qualifications of the Fund's Trustees. The Governance and Nominating Committee has adopted a statement of policy that describes the experience, qualifications, attributes, and skills that are necessary and desirable for potential Independent Trustee candidates (Statement of Policy). The Board believes that each Trustee satisfied at the time he or she was initially elected or appointed a Trustee, and continues to satisfy, the standards contemplated by the Statement of Policy. The Governance and Nominating Committee also engages professional search firms to help identify potential Independent Trustee candidates who have the experience, qualifications, attributes, and skills consistent with the Statement of Policy. From time to time, additional criteria based on the composition and skills of the current Independent Trustees, as well as experience or skills that may be appropriate in light of future changes to board composition, business conditions, and regulatory or other developments, have also been considered by the professional search firms and the Governance and Nominating Committee. In addition, the Board takes into account the Trustees' commitment and participation in Board and committee meetings, as well as their leadership of standing and ad hoc committees throughout their tenure.
In determining that a particular Trustee was and continues to be qualified to serve as a Trustee, the Board has considered a variety of criteria, none of which, in isolation, was controlling. The Board believes that, collectively, the Trustees have balanced and diverse experience, qualifications, attributes, and skills, which allow the Board to operate effectively in governing the fund and protecting the interests of shareholders. Information about the specific experience, skills, attributes, and qualifications of each Trustee, which in each case led to the Board's conclusion that the Trustee should serve (or continue to serve) as a trustee of the fund, is provided below.
Annual Report
Board Structure and Oversight Function. James C. Curvey is an interested person (as defined in the 1940 Act) and currently serves as Chairman. The Trustees have determined that an interested Chairman is appropriate and benefits shareholders because an interested Chairman has a personal and professional stake in the quality and continuity of services provided to the fund. Independent Trustees exercise their informed business judgment to appoint an individual of their choosing to serve as Chairman, regardless of whether the Trustee happens to be independent or a member of management. The Independent Trustees have determined that they can act independently and effectively without having an Independent Trustee serve as Chairman and that a key structural component for assuring that they are in a position to do so is for the Independent Trustees to constitute a substantial majority for the Board. The Independent Trustees also regularly meet in executive session. Ned C. Lautenbach serves as Chairman of the Independent Trustees and as such (i) acts as a liaison between the Independent Trustees and management with respect to matters important to the Independent Trustees and (ii) with management prepares agendas for Board meetings.
Fidelity funds are overseen by different Boards of Trustees. The fund's Board oversees Fidelity's high income and certain equity funds, and other Boards oversee Fidelity's investment-grade bond, money market, asset allocation, and sector funds. The asset allocation funds may invest in Fidelity funds overseen by the fund's Board. The use of separate Boards, each with its own committee structure, allows the Trustees of each group of Fidelity funds to focus on the unique issues of the funds they oversee, including common research, investment, and operational issues. On occasion, the separate Boards establish joint committees to address issues of overlapping consequences for the Fidelity funds overseen by each Board.
The Trustees operate using a system of committees to facilitate the timely and efficient consideration of all matters of importance to the Trustees, the fund, and fund shareholders and to facilitate compliance with legal and regulatory requirements and oversight of the fund's activities and associated risks. The Board, acting through its committees, has charged FMR and its affiliates with (i) identifying events or circumstances the occurrence of which could have demonstrably adverse effects on the fund's business and/or reputation; (ii) implementing processes and controls to lessen the possibility that such events or circumstances occur or to mitigate the effects of such events or circumstances if they do occur; and (iii) creating and maintaining a system designed to evaluate continuously business and market conditions in order to facilitate the identification and implementation processes described in (i) and (ii) above. Because the day-to-day operations and activities of the fund are carried out by or through FMR, its affiliates and other service providers, the fund's exposure to risks is mitigated but not eliminated by the processes overseen by the Trustees. While each of the Board's committees has responsibility for overseeing different aspects of the fund's activities, oversight is exercised primarily through the Operations, Audit, and Compliance Committees. In addition, the Independent Trustees have worked with FMR to enhance the Board's oversight of investment and financial risks, legal and regulatory risks, technology risks, and operational risks, including the development of additional risk reporting to the Board. For example, a working group comprised of Independent Trustees and FMR has worked and continues to work to review the Fidelity funds' valuation-related activities, reporting and risk management. Appropriate personnel, including but not limited to the fund's Chief Compliance Officer (CCO), FMR's internal auditor, the independent accountants, the fund's Treasurer and portfolio management personnel, make periodic reports to the Board's committees, as appropriate, including an annual review of Fidelity's risk management program for the Fidelity funds. The responsibilities of each standing committee, including their oversight responsibilities, are described further under "Standing Committees of the Fund's Trustees."
Annual Report
Trustees and Officers - continued
The fund's Statement of Additional Information (SAI) includes more information about the Trustees. To request a free copy, call Fidelity at 1-877-208-0098.
Interested Trustees*:
Correspondence intended for each Trustee who is an interested person may be sent to Fidelity Investments, 245 Summer Street, Boston, Massachusetts 02210.
Name, Year of Birth; Principal Occupations and Other Relevant Experience+ |
James C. Curvey (1935) |
Year of Election or Appointment: 2007 Trustee Chairman of the Board of Trustees |
| Mr. Curvey also serves as Trustee of other Fidelity funds. Mr. Curvey is a Director of Fidelity Research & Analysis Co. (investment adviser firm, 2009-present), and Vice Chairman (2007-present) and Director of FMR LLC (diversified financial services company). In addition, Mr. Curvey serves as an Overseer for the Boston Symphony Orchestra and a member of the board of Artis-Naples, Naples, Florida, and as a Trustee for Brewster Academy, Wolfeboro, New Hampshire. Previously, Mr. Curvey served as a Director of Fidelity Investments Money Management, Inc. (investment adviser firm, 2009-2014) and a Director of FMR and FMR Co., Inc. (investment adviser firms, 2007-2014). |
Charles S. Morrison (1960) |
Year of Election or Appointment: 2014 Trustee |
| Mr. Morrison also serves as Trustee of other funds. He serves as a Director of Fidelity Investments Money Management, Inc. (FIMM) (investment adviser firm, 2014-present), Director of Fidelity SelectCo, LLC (investment adviser firm, 2014-present), President, Asset Management (2014-present), and is an employee of Fidelity Investments. Previously, Mr. Morrison served as Vice President of Fidelity's Fixed Income and Asset Allocation Funds (2012-2014), President, Fixed Income (2011-2014), Vice President of Fidelity's Money Market Funds (2005-2009), President, Money Market Group Leader of FMR (investment adviser firm, 2009), and Senior Vice President, Money Market Group of FMR (2004-2009). Mr. Morrison also served as Vice President of Fidelity's Bond Funds (2002-2005), certain Balanced Funds (2002-2005), and certain Asset Allocation Funds (2002-2007), and as Senior Vice President (2002-2005) of Fidelity's Bond Division. |
* Trustees have been determined to be "Interested Trustees" by virtue of, among other things, their affiliation with the trust or various entities under common control with FMR.
+ The information above includes each Trustee's principal occupation during the last five years and other information relating to the experience, attributes, and skills relevant to each Trustee's qualifications to serve as a Trustee, which led to the conclusion that each Trustee should serve as a Trustee for the fund.
Annual Report
Trustees and Officers - continued
Independent Trustees:
Correspondence intended for each Independent Trustee (that is, the Trustees other than the Interested Trustees) may be sent to Fidelity Investments, P.O. Box 55235, Boston, Massachusetts 02205-5235.
Name, Year of Birth; Principal Occupations and Other Relevant Experience+ |
Dennis J. Dirks (1948) |
Year of Election or Appointment: 2005 Trustee |
| Mr. Dirks also serves as Trustee of other Fidelity funds. Prior to his retirement in May 2003, Mr. Dirks was Chief Operating Officer and a member of the Board of The Depository Trust & Clearing Corporation (DTCC). He also served as President, Chief Operating Officer, and Board member of The Depository Trust Company (DTC) and President and Board member of the National Securities Clearing Corporation (NSCC). In addition, Mr. Dirks served as Chief Executive Officer and Board member of the Government Securities Clearing Corporation, Chief Executive Officer and Board member of the Mortgage-Backed Securities Clearing Corporation, as a Trustee and a member of the Finance Committee of Manhattan College (2005-2008), as a Trustee and a member of the Finance Committee of AHRC of Nassau County (2006-2008), and as a member of the Independent Directors Council (IDC) Governing Council (2010-2015). Mr. Dirks is a member of the Board of Directors for The Brookville Center for Children's Services, Inc. (2009-present). |
Alan J. Lacy (1953) |
Year of Election or Appointment: 2008 Trustee |
| Mr. Lacy also serves as Trustee of other Fidelity funds. Mr. Lacy serves as a member of the Board of Directors of Dave & Buster's Entertainment, Inc. (restaurant and entertainment complexes, 2010-present) and Bristol-Myers Squibb Company (global pharmaceuticals, 2008-present). In addition, Mr. Lacy served as Senior Adviser (2007-2014) of Oak Hill Capital Partners, L.P. (private equity) and also served as Chief Executive Officer (2000-2005) and Vice Chairman (2005-2006) of Sears Holdings Corporation and Sears, Roebuck and Co. (retail). Mr. Lacy is a member of the Board of Trustees of The National Parks Conservation Association (2006-present). Previously, Mr. Lacy served as Chairman of the Board of Trustees of the National Parks Conservation Association (2008-2011) and as a member of the Board of Directors for The Western Union Company (global money transfer, 2006-2011), The Hillman Companies, Inc. (hardware wholesalers, 2010-2014), and Earth Fare, Inc. (retail grocery, 2010-2014). |
Ned C. Lautenbach (1944) |
Year of Election or Appointment: 2000 Trustee Chairman of the Independent Trustees |
| Mr. Lautenbach also serves as Trustee of other Fidelity funds. Mr. Lautenbach currently serves as the Lead Director of the Eaton Corporation Board of Directors (diversified industrial, 1997-present). Mr. Lautenbach is Chairman of the Board of Directors of Artis-Naples in Naples, Florida (2012-present), a member of the Council on Foreign Relations (1994-present), and a member of the Board of Governors, State University System of Florida (2013-present). Previously, Mr. Lautenbach was a Partner/Advisory Partner at Clayton, Dubilier & Rice, LLC (private equity investment, 1998-2010), as well as a Director of Sony Corporation (2006-2007). |
Joseph Mauriello (1944) |
Year of Election or Appointment: 2008 Trustee |
| Mr. Mauriello also serves as Trustee of other Fidelity funds. Prior to his retirement in January 2006, Mr. Mauriello served in numerous senior management positions including Deputy Chairman and Chief Operating Officer (2004-2005), and Vice Chairman of Financial Services (2002-2004) of KPMG LLP US (professional services, 1965-2005). Mr. Mauriello currently serves as a member of the Board of Directors of XL Group plc. (global insurance and re-insurance, 2006-present) and the Independent Directors Council (IDC) Governing Council (2015-present). Previously, Mr. Mauriello served as a Director of the Hamilton Funds of the Bank of New York (2006-2007) and of Arcadia Resources Inc. (health care services and products, 2007-2012). |
Robert W. Selander (1950) |
Year of Election or Appointment: 2011 Trustee |
| Mr. Selander also serves as Trustee of other Fidelity funds. Mr. Selander serves as a Director of The Western Union Company (global money transfer, 2014-present). Previously, Mr. Selander served as a Member of the Advisory Board of other Fidelity funds (2011), and Executive Vice Chairman (2010), Chief Executive Officer (2009-2010), and President and Chief Executive Officer (1997-2009) of Mastercard, Inc. |
Cornelia M. Small (1944) |
Year of Election or Appointment: 2005 Trustee |
| Ms. Small also serves as Trustee of other Fidelity funds. Ms. Small is a member of the Board of Directors (2009-present) and Chair of the Investment Committee (2010-present) of the Teagle Foundation. Ms. Small also serves on the Investment Committee of the Berkshire Taconic Community Foundation (2008-present). Previously, Ms. Small served as Chairperson (2002-2008) and a member of the Investment Committee and Chairperson (2008-2012) and a member of the Board of Trustees of Smith College. In addition, Ms. Small served as Chief Investment Officer, Director of Global Equity Investments, and a member of the Board of Directors of Scudder, Stevens & Clark and Scudder Kemper Investments. |
William S. Stavropoulos (1939) |
Year of Election or Appointment: 2001 Trustee Vice Chairman of the Independent Trustees |
| Mr. Stavropoulos also serves as Trustee of other Fidelity funds. Mr. Stavropoulos serves as President and Founder of the Michigan Baseball Foundation, the Great Lakes Loons (2007-present). Mr. Stavropoulos is Chairman Emeritus of the Board of Directors of The Dow Chemical Company, where he previously served in numerous senior management positions, including President, CEO (1995-2000; 2002-2004), Chairman of the Executive Committee (2000-2006), and as a member of the Board of Directors (1990-2006). Currently, Mr. Stavropoulos is Chairman of the Board of Directors of Univar Inc. (global distributor of commodity and specialty chemicals), a Director of Teradata Corporation (data warehousing and technology solutions), and Maersk Inc. (industrial conglomerate), and a member of the Advisory Board for Metalmark Capital LLC (private equity investment, 2005-present). Mr. Stavropoulos is an operating advisor to Clayton, Dubilier & Rice, LLC (private equity investment). In addition, Mr. Stavropoulos is a member of the University of Notre Dame Advisory Council for the College of Science, a Trustee of the Rollin L. Gerstacker Foundation, and a Director of the Naples Philharmonic Center for the Arts. Previously, Mr. Stavropoulos served as a Director of Chemical Financial Corporation (bank holding company, 1993-2012) and Tyco International, Ltd. (multinational manufacturing and services, 2007-2012). |
David M. Thomas (1949) |
Year of Election or Appointment: 2008 Trustee |
| Mr. Thomas also serves as Trustee of other Fidelity funds. Mr. Thomas serves as Non-Executive Chairman of the Board of Directors of Fortune Brands Home and Security (home and security products, 2011-present), as a member of the Board of Directors (2004-present) and Presiding Director (2013-present) of Interpublic Group of Companies, Inc. (marketing communication), and as a member of the Board of Trustees of the University of Florida (2013-present). Previously, Mr. Thomas served as Executive Chairman (2005-2006) and Chairman and Chief Executive Officer (2000-2005) of IMS Health, Inc. (pharmaceutical and healthcare information solutions), and a Director of Fortune Brands, Inc. (consumer products, 2000-2011). |
+ The information above includes each Trustee's principal occupation during the last five years and other information relating to the experience, attributes, and skills relevant to each Trustee's qualifications to serve as a Trustee, which led to the conclusion that each Trustee should serve as a Trustee for the fund.
Advisory Board Member and Officers:
Correspondence intended for each officer and Peter S. Lynch may be sent to Fidelity Investments, 245 Summer Street, Boston, Massachusetts 02210. Officers appear below in alphabetical order.
Name, Year of Birth; Principal Occupation |
Peter S. Lynch (1944) |
Year of Election or Appointment: 2003 Member of the Advisory Board |
| Mr. Lynch also serves as Member of the Advisory Board of other Fidelity funds. Mr. Lynch is Vice Chairman and a Director of FMR (investment adviser firm) and FMR Co., Inc. (investment adviser firm). In addition, Mr. Lynch serves as a Trustee of Boston College and as the Chairman of the Inner-City Scholarship Fund. Previously, Mr. Lynch served on the Special Olympics International Board of Directors (1997-2006). |
Elizabeth Paige Baumann (1968) |
Year of Election or Appointment: 2012 Anti-Money Laundering (AML) Officer |
| Ms. Baumann also serves as AML Officer of other funds. She is Chief AML Officer of FMR LLC (diversified financial services company, 2012-present) and is an employee of Fidelity Investments. Previously, Ms. Baumann served as Vice President and Deputy Anti-Money Laundering Officer (2007-2012). |
Marc R. Bryant (1966) |
Year of Election or Appointment: 2015 Secretary and Chief Legal Officer (CLO) |
| Mr. Bryant also serves as Secretary and CLO of other funds. Mr. Bryant serves as CLO, Secretary, and Senior Vice President of Fidelity Management & Research Company (investment adviser firm, 2015-present) and FMR Co., Inc. (investment adviser firm, 2015-present); Secretary of Fidelity SelectCo, LLC (investment adviser firm, 2015-present) and Fidelity Investments Money Management, Inc. (investment adviser firm, 2015-present); and CLO of Fidelity Management & Research (Hong Kong) Limited (investment adviser firm, 2015-present). He is Senior Vice President and Deputy General Counsel of FMR LLC (diversified financial services company). Previously, Mr. Bryant served as Secretary and Chief Legal Officer of Fidelity Rutland Square Trust II (2010-2014) and Assistant Secretary of Fidelity's Fixed Income and Asset Allocation Funds (2013-2015). Prior to joining Fidelity Investments, Mr. Bryant served as a Senior Vice President and the Head of Global Retail Legal for AllianceBernstein L.P. (2006-2010), and as the General Counsel for ProFund Advisors LLC (2001-2006). |
William C. Coffey (1969) |
Year of Election or Appointment: 2009 Assistant Secretary |
| Mr. Coffey also serves as Assistant Secretary of other funds. He is Senior Vice President and Deputy General Counsel of FMR LLC (diversified financial services company, 2010-present), and is an employee of Fidelity Investments. Previously, Mr. Coffey served as Vice President and Associate General Counsel of FMR LLC (2005-2009). |
Timothy M. Cohen (1969) |
Year of Election or Appointment: 2014 Vice President of certain Equity Funds |
| Mr. Cohen also serves as Vice President of other funds. Mr. Cohen serves as Chief Compliance Officer of FMR Investment Management (U.K.) Limited (investment adviser firm, 2013-present) and is an employee of Fidelity Investments. Previously, Mr. Cohen served as a Director of FMR Investment Management (U.K.) Limited (2013-2015). |
Jonathan Davis (1968) |
Year of Election or Appointment: 2010 Assistant Treasurer |
| Mr. Davis also serves as Assistant Treasurer of other funds, and is an employee of Fidelity Investments. Previously, Mr. Davis served as Vice President and Associate General Counsel of FMR LLC (diversified financial services company, 2003-2010). |
Adrien E. Deberghes (1967) |
Year of Election or Appointment: 2008 Deputy Treasurer |
| Mr. Deberghes also serves as an officer of other funds. He is an employee of Fidelity Investments (2008-present). Prior to joining Fidelity Investments, Mr. Deberghes was Senior Vice President of Mutual Fund Administration at State Street Corporation (2007-2008), Senior Director of Mutual Fund Administration at Investors Bank & Trust (2005-2007), and Director of Finance for Dunkin' Brands (2000-2005). |
Stephanie J. Dorsey (1969) |
Year of Election or Appointment: 2010 Assistant Treasurer |
| Ms. Dorsey also serves as an officer of other funds. She is an employee of Fidelity Investments (2008-present) and has served in other fund officer roles. Prior to joining Fidelity Investments, Ms. Dorsey served as Treasurer (2004-2008) of the JPMorgan Mutual Funds and Vice President (2004-2008) of JPMorgan Chase Bank. |
Howard J. Galligan III (1966) |
Year of Election or Appointment: 2014 Chief Financial Officer |
| Mr. Galligan also serves as Chief Financial Officer of other funds. Mr. Galligan serves as President of Fidelity Pricing and Cash Management Services (FPCMS) (2014-present) and as a Director of Strategic Advisers, Inc. (investment adviser firm, 2008-present). Previously, Mr. Galligan served as Chief Administrative Officer of Asset Management (2011-2014) and Chief Operating Officer and Senior Vice President of Investment Support for Strategic Advisers, Inc. (2003-2011). |
Scott C. Goebel (1968) |
Year of Election or Appointment: 2015 Vice President |
| Mr. Goebel serves as Vice President of other funds and is an employee of Fidelity Investments (2001-present). Previously, Mr. Goebel served as Secretary of Fidelity SelectCo, LLC (investment adviser firm, 2013-2015), Fidelity Investments Money Management, Inc. (FIMM) (investment adviser firm, 2010-2015), and Fidelity Research and Analysis Company (FRAC) (investment adviser firm, 2010-2015); General Counsel, Secretary, and Senior Vice President of Fidelity Management & Research Company (investment adviser firm, 2008-2015) and FMR Co., Inc. (investment adviser firm, 2008-2015); Assistant Secretary of Fidelity Management & Research (Japan) Limited (investment adviser firm, 2008-2015) and FMR Investment Management (U.K.) Limited (investment adviser firm, 2008-2015); Chief Legal Officer (CLO) of Fidelity Management & Research (Hong Kong) Limited (investment adviser firm, 2008-2015); Secretary and CLO of certain Fidelity funds (2008-2015); Assistant Secretary of FIMM (2008-2010), FRAC (2008-2010), and certain funds (2007-2008); and as Vice President and Secretary of Fidelity Distributors Corporation (FDC) (2005-2007). |
Brian B. Hogan (1964) |
Year of Election or Appointment: 2009 Vice President |
| Mr. Hogan also serves as Trustee or Vice President of other funds. Mr. Hogan serves as a Director of Fidelity SelectCo, LLC (investment adviser firm, 2014-present) and President of the Equity Division of FMR (investment adviser firm, 2009-present). Previously, Mr. Hogan served as Senior Vice President, Equity Research of FMR (2006-2009) and as a portfolio manager. |
Chris Maher (1972) |
Year of Election or Appointment: 2013 Assistant Treasurer |
| Mr. Maher serves as Assistant Treasurer of other funds. Mr. Maher is Vice President of Valuation Oversight and is an employee of Fidelity Investments. Previously, Mr. Maher served as Vice President of Asset Management Compliance (2013), Vice President of the Program Management Group of FMR (investment adviser firm, 2010-2013), and Vice President of Valuation Oversight (2008-2010). |
Kenneth B. Robins (1969) |
Year of Election or Appointment: 2008 President and Treasurer |
| Mr. Robins also serves as an officer of other funds. Mr. Robins serves as Executive Vice President of Fidelity Investments Money Management, Inc. (FIMM) (investment adviser firm, 2013-present) and is an employee of Fidelity Investments (2004-present). Previously, Mr. Robins served in other fund officer roles. |
Stacie M. Smith (1974) |
Year of Election or Appointment: 2013 Deputy Treasurer |
| Ms. Smith also serves as an officer of other funds. She is an employee of Fidelity Investments (2009-present) and has served in other fund officer roles. Prior to joining Fidelity Investments, Ms. Smith served as Senior Audit Manager of Ernst & Young LLP (1996-2009). |
Renee Stagnone (1975) |
Year of Election or Appointment: 2013 Deputy Treasurer |
| Ms. Stagnone also serves as Deputy Treasurer of other funds. Ms. Stagnone is an employee of Fidelity Investments (1997-present). |
Linda J. Wondrack (1964) |
Year of Election or Appointment: 2014 Chief Compliance Officer |
| Ms. Wondrack also serves as Chief Compliance Officer of other funds. Ms. Wondrack is Executive Vice President and head of the Ethics Office and Asset Management Compliance for Fidelity Investments (2012- present). Ms. Wondrack also serves as Chief Compliance Officer of Fidelity SelectCo, LLC (investment adviser firm, 2014-present); Chief Compliance Officer of Impresa Management LLC (2013-present); and Chief Compliance Officer of FMR Co., Inc. (investment adviser firm), Fidelity Investments Money Management, Inc. (investment adviser firm), Fidelity Management & Research (Japan) Limited (investment adviser firm), FMR Investment Management (U.K.) Limited (investment adviser firm), Fidelity Management & Research (Hong Kong) (investment adviser firm), Fidelity Management & Research Company (investment adviser firm), FIAM LLC (investment adviser firm), and Strategic Advisers, Inc. (investment adviser firm), Ballyrock Investment Advisors LLC, and Northern Neck Investors LLC (2012-present). Previously, Ms. Wondrack served as Senior Vice President and Chief Compliance Officer for Columbia Management Investment Advisers, LLC (2005-2012); Chief Compliance Officer for certain funds within the Columbia Family of Funds (2007-2012); and Senior Vice President of Compliance Risk Management at Bank of America (2005-2010). |
Joseph F. Zambello (1957) |
Year of Election or Appointment: 2011 Deputy Treasurer |
| Mr. Zambello also serves as Deputy Treasurer of other funds. Mr. Zambello is an employee of Fidelity Investments (1991-present). Previously, Mr. Zambello served as Vice President of the Program Management Group of FMR (investment adviser firm, 2009-2011) and Vice President of the Transfer Agent Oversight Group (2005-2009). |
Annual Report
Class A designates 1%, Class T designates 1%, Class B designates 2% and Class C designates 1% of the dividends distributed during the fiscal year as qualifying for the dividends-received deduction for corporate shareholders.
Class A, Class T, Class B, and Class C designate 100% of the dividends distributed during the fiscal year as amounts which may be taken into account as a dividend for purposes of the maximum rate under section 1(h)(11) of the Internal Revenue Code.
The amounts per share which represent income derived from sources within, and taxes paid to, foreign countries or possessions of the United States are as follows:
| Pay Date | Income | Taxes |
Class A | 12/08/2014 | $0.2921 | $0.0091 |
Class T | 12/08/2014 | $0.2691 | $0.0091 |
Class B | 12/08/2014 | $0.1901 | $0.0091 |
Class C | 12/08/2014 | $0.2371 | $0.0091 |
The fund will notify shareholders in January 2016 of amounts for use in preparing 2015 income tax returns.
Annual Report
Fidelity International Value Fund
Each year, the Board of Trustees, including the Independent Trustees (together, the Board), votes on the renewal of the management contract with Fidelity Management & Research Company (FMR) and the sub-advisory agreements (together, the Advisory Contracts) for the fund. The Board, assisted by the advice of fund counsel and Independent Trustees' counsel, requests and considers a broad range of information relevant to the renewal of the Advisory Contracts throughout the year.
The Board meets regularly and, at each of its meetings, covers an extensive agenda of topics and materials and considers factors that are relevant to its annual consideration of the renewal of the fund's Advisory Contracts, including the services and support provided to the fund and its shareholders. The Board has established various standing committees (Committees), each composed of and chaired by Independent Trustees with varying backgrounds, to which the Board has assigned specific subject matter responsibilities in order to enhance effective decision-making by the Board. The Board, acting directly and through its Committees, requests and receives information concerning the annual consideration of the renewal of the fund's Advisory Contracts. The Board also meets as needed to consider matters specifically related to the Board's annual consideration of the renewal of the Advisory Contracts. Members of the Board may also meet with trustees of other Fidelity funds through ad hoc joint committees to discuss certain matters relevant to all of the Fidelity funds.
At its July 2015 meeting, the Board unanimously determined to renew the fund's Advisory Contracts. In reaching its determination, the Board considered all factors it believed relevant, including (i) the nature, extent, and quality of the services to be provided to the fund and its shareholders (including the investment performance of the fund); (ii) the competitiveness of the fund's management fee and total expense ratio relative to peer funds; (iii) the total costs of the services to be provided by and the profits to be realized by Fidelity from its relationship with the fund; and (iv) the extent to which (if any) economies of scale exist and would be realized as the fund grows, and whether any economies of scale are appropriately shared with fund shareholders.
In considering whether to renew the Advisory Contracts for the fund, the Board reached a determination, with the assistance of fund counsel and Independent Trustees' counsel and through the exercise of its business judgment, that the renewal of the Advisory Contracts was in the best interests of the fund and its shareholders and that the compensation payable under the Advisory Contracts was fair and reasonable. The Board's decision to renew the Advisory Contracts was not based on any single factor, but rather was based on a comprehensive consideration of all the information provided to the Board at its meetings throughout the year. The Board, in reaching its determination to renew the Advisory Contracts, was aware that shareholders of the fund have a broad range of investment choices available to them, including a wide choice among funds offered by Fidelity's competitors, and that the fund's shareholders, who have the opportunity to review and weigh the disclosure provided by the fund in its prospectus and other public disclosures, have chosen to invest in this fund, which is part of the Fidelity family of funds.
Annual Report
Nature, Extent, and Quality of Services Provided. The Board considered Fidelity's staffing as it relates to the fund, including the backgrounds of investment personnel of Fidelity, and also considered the fund's investment objective, strategies, and related investment philosophy. The Independent Trustees also had discussions with senior management of Fidelity's investment operations and investment groups. The Board considered the structure of the portfolio manager compensation program and whether this structure provides appropriate incentives to act in the best interests of the fund. Additionally, the Board considered the portfolio managers' investments, if any, in the funds that they manage.
Resources Dedicated to Investment Management and Support Services. The Board and the Fund Oversight and Research Committees reviewed the general qualifications and capabilities of Fidelity's investment staff, including its size, education, experience, and resources, as well as Fidelity's approach to recruiting, training, managing, and compensating investment personnel. The Board noted that Fidelity has continued to increase the resources devoted to non-U.S. offices, including expansion of Fidelity's global investment organization. The Board also noted that Fidelity's analysts have extensive resources, tools and capabilities that allow them to conduct sophisticated quantitative and fundamental analysis, as well as credit analysis of issuers, counterparties and guarantors. Further, the Board considered that Fidelity's investment professionals have sufficient access to global information and data so as to provide competitive investment results over time, and that those professionals also have access to sophisticated tools that permit them to assess portfolio construction and risk and performance attribution characteristics continuously, as well as to transmit new information and research conclusions rapidly around the world. Additionally, in its deliberations, the Board considered Fidelity's trading, risk management, and compliance capabilities and resources, which are integral parts of the investment management process.
Shareholder and Administrative Services. The Board considered (i) the nature, extent, quality, and cost of advisory, administrative, and shareholder services performed by FMR, the sub-advisers (together with FMR, the Investment Advisers), and their affiliates under the Advisory Contracts and under separate agreements covering transfer agency, pricing and bookkeeping, and securities lending services for the fund; (ii) the nature and extent of the supervision of third party service providers, principally custodians and subcustodians; and (iii) the resources devoted to, and the record of compliance with, the fund's compliance policies and procedures. The Board also reviewed the allocation of fund brokerage, including allocations to brokers affiliated with the Investment Advisers, the use of brokerage commissions to pay fund expenses, and the use of "soft" commission dollars to pay for research services.
Annual Report
Board Approval of Investment Advisory Contracts and
Management Fees - continued
The Board noted that the growth of fund assets over time across the complex allows Fidelity to reinvest in the development of services designed to enhance the value or convenience of the Fidelity funds as investment vehicles. These services include 24-hour access to account information and market information through telephone representatives and over the Internet, investor education materials and asset allocation tools, and the expanded availability of Fidelity Investor Centers.
In 2014, the Board formed an ad hoc Committee on Transfer Agency Fees to review the variety of transfer agency fee structures throughout the industry and Fidelity's competitive positioning with respect to industry participants.
Investment in a Large Fund Family. The Board considered the benefits to shareholders of investing in a Fidelity fund, including the benefits of investing in a fund that is part of a large family of funds offering a variety of investment disciplines and providing a large variety of mutual fund investor services. The Board noted that Fidelity had taken, or had made recommendations that resulted in the Fidelity funds taking, a number of actions over the previous year that benefited particular funds, including (i) continuing to dedicate additional resources to investment research and to the support of the senior management team that oversees asset management; (ii) continuing efforts to enhance Fidelity's global research capabilities; (iii) launching new funds and making other enhancements to meet client needs; (iv) reducing management fees and total expenses for certain index funds and diversified international funds; (v) continuing to launch dedicated lower cost underlying funds to meet portfolio construction needs related to expanding underlying fund options for Fidelity funds of funds, specifically for the Freedom Fund product lines; (vi) rationalizing product lines and gaining increased efficiencies through fund mergers; (vii) launching active fixed-income exchange-traded funds; (viii) continuing to develop, acquire and implement systems and technology to improve services to the funds and information security and to increase efficiency; (ix) implementing investment enhancements to further strengthen Fidelity's target date product line to increase investors' probability of success in achieving their goals; (x) modifying the eligibility criteria for certain share classes to accommodate roll-over assets from employer-sponsored retirement plans; (xi) launching a new Class W of the Freedom Index Funds to attract and retain Fidelity record-kept retirement plan assets; and (xii) implementing changes to Fidelity's money market product line in response to recent money market regulatory reforms.
Investment Performance. The Board considered whether the fund has operated in accordance with its investment objective, as well as its record of compliance with its investment restrictions and its performance history.
Annual Report
The Board took into account discussions with representatives of the Investment Advisers about fund investment performance that occur at Board meetings throughout the year. In this regard the Board noted that as part of regularly scheduled fund reviews and other reports to the Board on fund performance, the Board considers annualized return information for the fund, for different time periods, measured against a securities market index ("benchmark index") and a peer group of funds with similar objectives ("peer group"), if any. In its evaluation of fund investment performance, the Board gave particular attention to information indicating changes in performance of certain Fidelity funds for specific time periods and discussed with the Investment Advisers the reasons for any overperformance or underperformance.
In addition to reviewing absolute and relative fund performance, the Independent Trustees periodically consider the appropriateness of fund performance metrics in evaluating the results achieved. In general, the Independent Trustees believe that fund performance should be evaluated based on net performance (after fees and expenses) of both the highest performing and lowest performing fund share classes, where applicable, compared to appropriate benchmark indices, over appropriate time periods that may include full market cycles, and compared to peer groups, as applicable, over the same periods, taking into account relevant factors including the following: general market conditions; issuer-specific information; and fund cash flows and other factors.
The Independent Trustees recognize that shareholders evaluate performance on a net basis over their own holding periods, for which one-, three-, and five-year periods are often used as a proxy. For this reason, the performance information reviewed by the Board also included net cumulative calendar year total return information for the fund and an appropriate benchmark index and peer group for the most recent one-, three-, and five-year periods, as shown below. Returns are shown compared to the 25th percentile (top of box, 75% beaten) and 75th percentile (bottom of box, 25% beaten) of the peer universe. Returns of the benchmark index are "net MA," i.e., adjusted for tax withholding rates applicable to U.S.-based funds organized as Massachusetts business trusts.
Annual Report
Board Approval of Investment Advisory Contracts and
Management Fees - continued
Fidelity International Value Fund

The Board also considered that the fund's management fee is subject to upward or downward adjustment depending upon whether, and to what extent, the fund's investment performance for the performance period exceeds, or is exceeded by, a securities index, thus leading to a performance adjustment for the same period. The Board noted that the performance adjustment provides FMR with a strong economic incentive to seek to achieve superior performance for the fund's shareholders and helps to more closely align the interests of FMR and the shareholders of the fund.
Based on its review, the Board concluded that the nature, extent, and quality of services provided to the fund under the Advisory Contracts should benefit the shareholders of the fund.
Competitiveness of Management Fee and Total Expense Ratio. The Board considered the fund's management fee and total expense ratio compared to "mapped groups" of competitive funds and classes created for the purpose of facilitating the Trustees' competitive analysis of management fees and total expenses. Fidelity creates "mapped groups" by combining similar Lipper investment objective categories that have comparable investment mandates. Combining Lipper investment objective categories aids the Board's management fee and total expense ratio comparisons by broadening the competitive group used for comparison.
Management Fee. The Board considered two proprietary management fee comparisons for the 12-month periods shown in basis points (BP) in the chart below. The group of Lipper funds used by the Board for management fee comparisons is referred to below as the "Total Mapped Group." The Total Mapped Group comparison focuses on a fund's standing in terms of gross management fees before expense reimbursements or caps, and without giving effect to the fund's performance adjustment, relative to the total universe of funds with comparable investment mandates, regardless of whether their management fee structures also are comparable. Funds with comparable investment mandates offer exposure to similar types of securities. Funds with comparable management fee structures have similar management fee contractual arrangements (e.g., flat rate charged for advisory services, all-inclusive fee rate, etc.). "TMG %" represents the percentage of funds in the Total Mapped Group that had management fees that were lower than the fund's. For example, a hypothetical TMG % of 20% would mean that 80% of the funds in the Total Mapped Group had higher, and 20% had lower, management fees than the fund. The fund's actual TMG %s and the number of funds in the Total Mapped Group are in the chart below. The "Asset-Size Peer Group" (ASPG) comparison focuses on a fund's standing relative to a subset of non-Fidelity funds within the Total Mapped Group that are similar in size and management fee structure without taking into account performance adjustments, if any. For example, if a fund is in the first quartile of the ASPG, the fund's management fee ranks in the least expensive or lowest 25% of funds in the ASPG. The ASPG represents at least 15% of the funds in the Total Mapped Group with comparable asset size and management fee structures, subject to a minimum of 50 funds (or all funds in the Total Mapped Group if fewer than 50). Additional information, such as the ASPG quartile in which the fund's management fee rate ranked and the impact of the fund's performance adjustment, is also included in the chart and considered by the Board.
Annual Report
Fidelity International Value Fund

Annual Report
Board Approval of Investment Advisory Contracts and
Management Fees - continued
The Board noted that the fund's management fee rate ranked below the median of its Total Mapped Group and below the median of its ASPG for 2014. The Board also noted the effect of the fund's performance adjustment, if any, on the fund's management fee ranking.
The Board noted that, in 2014, the ad hoc Committee on Group Fee was formed by it and other Fidelity fund boards to conduct an in-depth review of the "group fee" component of the management fee of funds with such management fee structures. Committee focus included the mechanics of the group fee, the competitive landscape of group fee structures, Fidelity funds with no group fee component and investment products not included in group fee assets. The Board also considered that, for funds subject to the group fee, FMR agreed to voluntarily waive fees over a specified period of time in amounts designed to account for assets converted from certain funds to certain collective investment trusts.
The Board also noted that, in 2013, the ad hoc Committee on Management Fees was formed to conduct an in-depth review of the management fee rates of Fidelity's active equity mutual funds. The Committee focused on the following areas: (i) standard fee structures; (ii) research consumption and trading evolution; (iii) management fee competitiveness/profitability by category; and (iv) factors that drive institutional pricing.
Based on its review, the Board concluded that the fund's management fee is fair and reasonable in light of the services that the fund receives and the other factors considered.
Total Expense Ratio. In its review of each class's total expense ratio, the Board considered the fund's management fee as well as other fund or class expenses, as applicable, such as transfer agent fees, pricing and bookkeeping fees, fund-paid 12b-1 fees, and custodial, legal, and audit fees. The Board noted the impact of the fund's performance adjustment. The Board also noted that Fidelity may agree to waive fees and expenses from time to time, and the extent to which, if any, it has done so for the fund. As part of its review, the Board also considered the current and historical total expense ratios of each class of the fund compared to competitive fund median expenses. Each class of the fund is compared to those funds and classes in the Total Mapped Group (used by the Board for management fee comparisons) that have a similar sales load structure.
The Board noted that the total expense ratio of each of Class A, Class B, and the retail class ranked below its competitive median for 2014, the total expense ratio of Class I ranked equal to its competitive median for 2014, and the total expense ratio of each of Class T and Class C ranked above its competitive median for 2014. The Board considered that, in general, various factors can affect total expense ratios. The Board noted that the total expense ratio of Class T was above the competitive median primarily because of higher 12b-1 fees on Class T as compared to most competitor funds. Class T has a higher 12b-1 fee, but a lower front-end sales charge, than traditionally priced front-end sales charge classes. The Board considered that Class T is primarily sold load-waived in the retirement plan market where its 0.50% 12b-1 fee is comparable to competing no-load, higher 12b-1 fee classes designed specifically for retirement plans. The Board noted that the fund offers multiple classes, each of which has a different sales load and 12b-1 fee structure, and that the multiple structures are intended to offer a range of pricing options for the intermediary market. The Board also noted that the total expense ratios of the classes vary primarily by the level of their 12b-1 fees, although differences in transfer agent fees may also cause expenses to vary from class to class.
Annual Report
Fees Charged to Other Fidelity Clients. The Board also considered Fidelity fee structures and other information with respect to clients of Fidelity, such as other funds advised or subadvised by Fidelity, pension plan clients, and other institutional clients with similar mandates. The Board noted the findings of the 2013 ad hoc joint committee (created with the board of other Fidelity funds), which reviewed and compared Fidelity's institutional investment advisory business with its business of providing services to the Fidelity funds, including the differences in services provided, fees charged, and costs incurred, as well as competition in their respective marketplaces.
Based on its review of total expense ratios and fees charged to other Fidelity clients, the Board concluded that, although in some cases above the median of the universe presented for comparison, the total expense ratio of each class of the fund was reasonable in light of the services that the fund and its shareholders receive and the other factors considered.
Costs of the Services and Profitability. The Board considered the revenues earned and the expenses incurred by Fidelity in conducting the business of developing, marketing, distributing, managing, administering and servicing the fund and servicing the fund's shareholders. The Board also considered the level of Fidelity's profits in respect of all the Fidelity funds.
On an annual basis, Fidelity presents to the Board information about the profitability of its relationship with the fund. Fidelity calculates profitability information for each fund, as well as aggregate profitability information for groups of Fidelity funds and all Fidelity funds, using a series of detailed revenue and cost allocation methodologies which originate with the books and records of Fidelity on which Fidelity's audited financial statements are based. The Audit Committee of the Board reviews any significant changes from the prior year's methodologies.
PricewaterhouseCoopers LLP (PwC), independent registered public accounting firm and auditor to Fidelity and certain Fidelity funds, has been engaged annually by the Board as part of the Board's assessment of Fidelity's profitability analysis. PwC's engagement includes the review and assessment of the methodologies used by Fidelity in determining the revenues and expenses attributable to Fidelity's mutual fund business, and completion of agreed-upon procedures in respect of the mathematical accuracy of fund profitability and its conformity to established allocation methodologies. After considering PwC's reports issued under the engagement and information provided by Fidelity, the Board concluded that while other allocation methods may also be reasonable, Fidelity's profitability methodologies are reasonable in all material respects.
Annual Report
Board Approval of Investment Advisory Contracts and
Management Fees - continued
The Board also reviewed Fidelity's non-fund businesses and fall-out benefits related to the mutual fund business as well as cases where Fidelity's affiliates may benefit from or be related to the fund's business.
The Board considered the costs of the services provided by and the profits realized by Fidelity in connection with the operation of the fund and was satisfied that the profitability was not excessive.
Economies of Scale. The Board considered whether there have been economies of scale in respect of the management of the Fidelity funds, whether the Fidelity funds (including the fund) have appropriately benefited from any such economies of scale, and whether there is potential for realization of any further economies of scale. The Board considered the extent to which the fund will benefit from economies of scale as assets grow through increased services to the fund, through waivers or reimbursements, or through fee or expense ratio reductions. The Board also noted that in 2013, it and the boards of other Fidelity funds created an ad hoc committee (the Economies of Scale Committee) to analyze whether Fidelity attains economies of scale in respect of the management and servicing of the Fidelity funds, whether the Fidelity funds have appropriately benefited from such economies of scale, and whether there is potential for realization of any further economies of scale.
The Board recognized that the fund's management contract incorporates a "group fee" structure, which provides for lower group fee rates as total group assets increase, and for higher group fee rates as total group assets decrease (with "group assets" defined to include fund assets under FMR's management plus sector fund assets previously under FMR's management and currently managed by Fidelity SelectCo, LLC). FMR calculates the group fee rates based on a tiered asset "breakpoint" schedule that varies based on asset class. The Board considered that the group fee is designed to deliver the benefits of economies of scale to fund shareholders when total Fidelity fund assets increase, even if assets of any particular fund are unchanged or have declined, because some portion of Fidelity's costs are attributable to services provided to all Fidelity funds, and all funds benefit if those costs can be allocated among more assets. The Board concluded that, given the group fee structure, fund shareholders will benefit from lower management fees as group assets increase at the fund complex level, regardless of whether Fidelity achieves any such economies of scale.
The Board concluded, taking into account the analysis of the Economies of Scale Committee, that economies of scale, if any, are being appropriately shared between fund shareholders and Fidelity.
Annual Report
Additional Information Requested by the Board. In order to develop fully the factual basis for consideration of the Fidelity funds' Advisory Contracts, the Board requested and received additional information on certain topics, including: (i) fund performance trends and Fidelity's long-term strategies for certain funds; (ii) the various share classes employed by Fidelity and the attributes of each class, together with similar information on the distribution and servicing payments made by Fidelity or the funds to third-party participants in the distribution channels; (iii) fund profitability, and fund performance in relation to fund profitability; (iv) the methodology with respect to evaluating competitive fund data and peer group classifications and fee comparisons; (v) annual fund profitability margins, with particular focus on certain funds with negative margins; (vi) the realization of fall-out benefits in certain Fidelity business units; (vii) economies of scale and the way in which they are shared with fund shareholders; (viii) Fidelity's group fee structures, including the group fee schedule of breakpoints; (ix) the impact of cost containment measures on the funds; and (x) the transfer agent fee structure.
Based on its evaluation of all of the conclusions noted above, and after considering all factors it believed relevant, the Board concluded that the advisory fee structures are fair and reasonable, and that the fund's Advisory Contracts should be renewed.
Annual Report
Investment Adviser
Fidelity Management & Research Company
Boston, MA
Investment Sub-Advisers
FMR Co., Inc.
FMR Investment Management
(U.K.) Limited
Fidelity Management & Research
(Hong Kong) Limited
Fidelity Management & Research
(Japan) Limited
FIL Investment Advisors
FIL Investment Advisors (UK) Limited
FIL Investments (Japan) Limited
General Distributor
Fidelity Distributors Corporation
Smithfield, RI
Transfer and Service Agents
Fidelity Investments Institutional Operations Company, Inc.
Boston, MA
Fidelity Service Company, Inc.
Boston, MA
Custodian
The Northern Trust Company
Chicago, IL
(Fidelity Investment logo)(registered trademark)
AFIV-UANN-1215
1.827496.109
(Fidelity Investment logo)(registered trademark)
Fidelity Advisor®
International Value
Fund - Class I
(formerly Institutional Class)
Annual Report
October 31, 2015
(Fidelity Cover Art)
Class I is
a class of Fidelity®
International Value Fund
Contents
Performance | (Click Here) | How the fund has done over time. |
Management's Discussion of Fund Performance | (Click Here) | The Portfolio Manager's review of fund performance and strategy. |
Shareholder Expense Example | (Click Here) | An example of shareholder expenses. |
Investment Changes | (Click Here) | A summary of major shifts in the fund's investments over the past six months. |
Investments | (Click Here) | A complete list of the fund's investments with their market values. |
Financial Statements | (Click Here) | Statements of assets and liabilities, operations, and changes in net assets, as well as financial highlights. |
Notes | (Click Here) | Notes to financial statements. |
Report of Independent Registered Public Accounting Firm | (Click Here) | |
Trustees and Officers | (Click Here) | |
Distributions | (Click Here) | |
Board Approval of Investment Advisory Contracts and Management Fees | (Click Here) | |
To view a fund's proxy voting guidelines and proxy voting record for the 12-month period ended June 30, visit http://www.fidelity.com/proxyvotingresults or visit the Securities and Exchange Commission's (SEC) web site at http://www.sec.gov. You may also call 1-877-208-0098 to request a free copy of the proxy voting guidelines.
Standard & Poor's, S&P and S&P 500 are registered service marks of The McGraw-Hill Companies, Inc. and have been licensed for use by Fidelity Distributors Corporation.
Other third-party marks appearing herein are the property of their respective owners.
All other marks appearing herein are registered or unregistered trademarks or service marks of FMR LLC or an affiliated company. © 2015 FMR LLC. All rights reserved.
Annual Report
This report and the financial statements contained herein are submitted for the general information of the shareholders of the fund. This report is not authorized for distribution to prospective investors in the fund unless preceded or accompanied by an effective prospectus.
A fund files its complete schedule of portfolio holdings with the SEC for the first and third quarters of each fiscal year on Form N-Q. Forms N-Q are available on the SEC's web site at http://www.sec.gov. A fund's Forms N-Q may be reviewed and copied at the SEC's Public Reference Room in Washington, DC. Information regarding the operation of the SEC's Public Reference Room may be obtained by calling 1-800-SEC-0330. For a complete list of a fund's portfolio holdings, view the most recent holdings listing, semiannual report, or annual report on Fidelity's web site at http://www.fidelity.com, http://www.advisor.fidelity.com, or http://www.401k.com, as applicable.
NOT FDIC INSURED • MAY LOSE VALUE • NO BANK GUARANTEE
Neither the fund nor Fidelity Distributors Corporation is a bank.
Annual Report
Average annual total return reflects the change in the value of an investment, assuming reinvestment of the class' distributions from dividend income and capital gains (the profits earned upon the sale of securities that have grown in value, if any) and assuming a constant rate of performance each year. The $10,000 table and the fund's returns do not reflect the deduction of taxes that a shareholder would pay on fund distributions or the redemption of fund shares. During periods of reimbursement by Fidelity, a fund's total return will be greater than it would be had the reimbursement not occurred. How a fund did yesterday is no guarantee of how it will do tomorrow.
Average Annual Total Returns
Periods ended October 31, 2015 | Past 1
year | Past 5
years | Life of
fund A |
Class I | -0.53% | 3.48% | 0.94% |
A From May 18, 2006.
$10,000 Over Life of Fund
Let's say hypothetically that $10,000 was invested in Fidelity Advisor® International Value Fund - Class I on May 18, 2006, when the fund started. The chart shows how the value of your investment would have changed, and also shows how the MSCI EAFE Value Index performed over the same period.
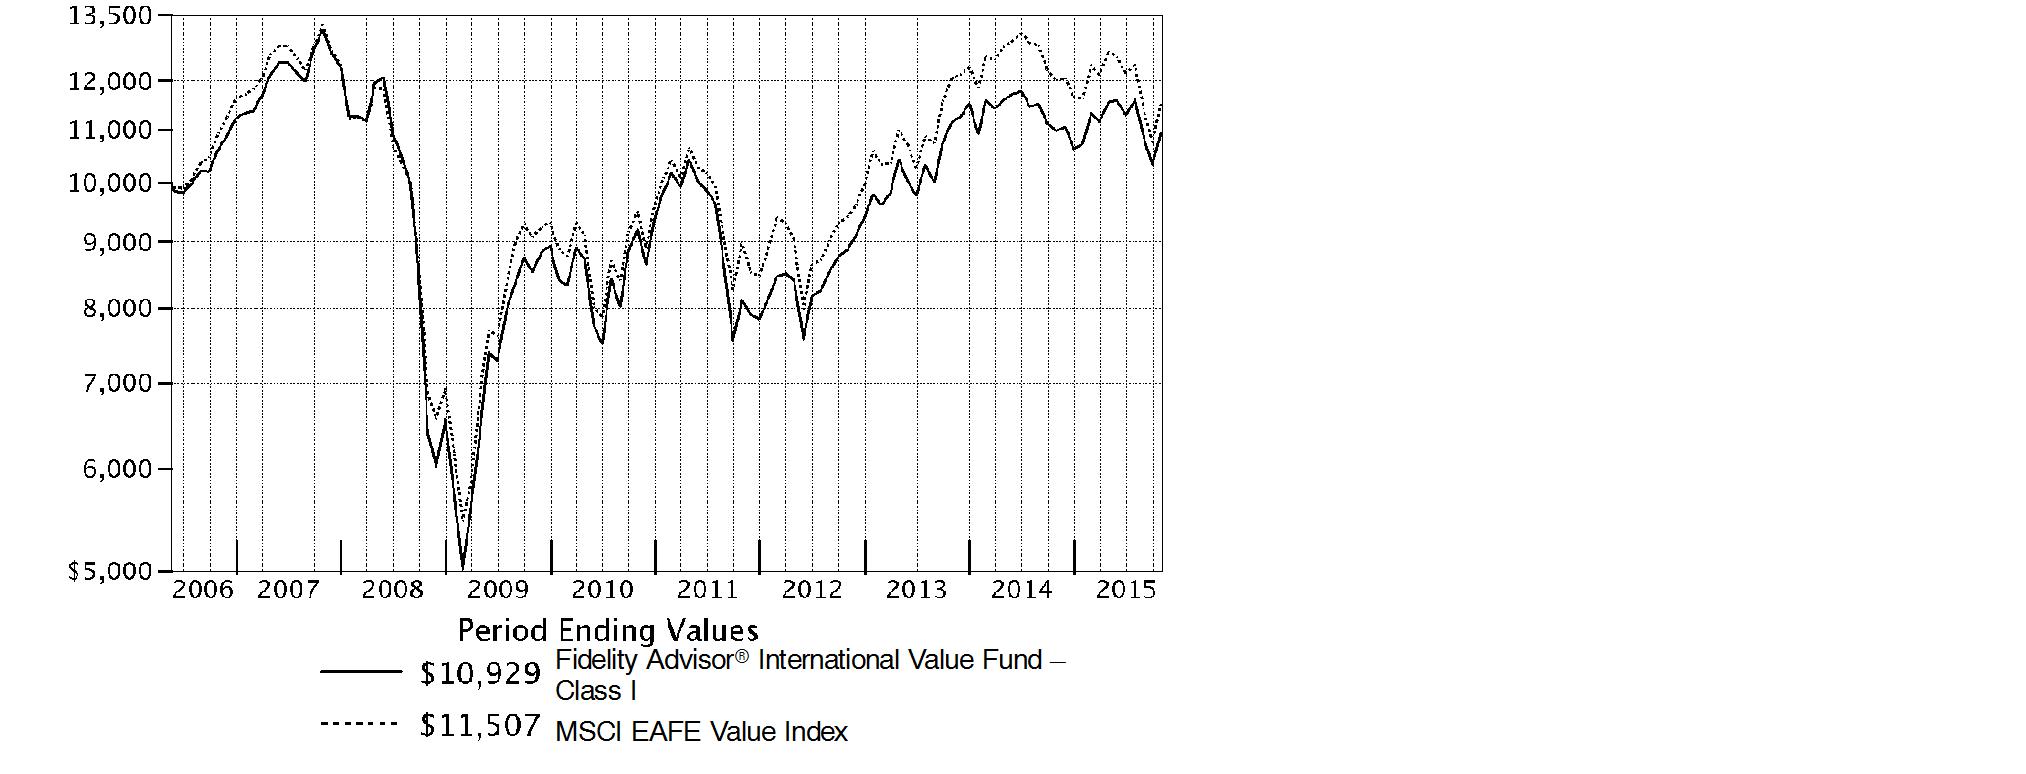
Annual Report
Market Recap: International equities suffered a moderate setback for the 12 months ending October 31, 2015, held back by a collapse in commodities prices that hurt resources-related sectors and geographies. The MSCI ACWI (All Country World Index) ex USA Index returned -4.55% for the period, affected also by concerns about global economic growth. Commodity producers remained under pressure for much of the past year, largely related to economic deceleration in China (-1%), the world's second-largest economy and a leading consumer of raw materials. This effect was exacerbated by U.S. dollar strength relative to global currencies, which weighed on commodities priced in dollars and acutely impacted equity returns within regions most exposed to resources prices. The emerging-markets group, for example, returned about -15% this period. Canada, a significant energy producer, returned roughly -17%. Net energy consumer Japan (+9%) was the best-performing region by far. Only about a quarter of the nearly 50 index countries managed a gain this period: Ireland (+19%) - the EU's fastest-growing economy - and Israel (+17%) proved top performers; Greece (-56%) and Brazil (-46%), among the worst. As for sectors, energy (-25%) and materials (-16%) declined sharply, whereas the two consumer sectors each gained about 6%.
Comments from Portfolio Manager Alex Zavratsky: For the year, the fund's share classes (excluding sales charges, if applicable) declined modestly, outperforming the -4.09% result of the benchmark MSCI EAFE Value Index. Versus the benchmark, key contributors included stock selection in various countries throughout Europe, especially France and Switzerland, as well as in the United Kingdom. Conversely, positioning in Japan detracted. Relative results also were affected by a downward fair-value pricing adjustment of 0.80 percentage points, largely related to the fund's Japan-based investments. Looking at individual stocks, largely avoiding U.K-based oil giant and index component Royal Dutch Shell helped most. The fund started the review period with an underweighted position, later eliminated. Shares of Royal Dutch Shell returned roughly -23% amid disappointing financial results, weakening oil prices and high capital expenditures, and our decisions here proved the biggest contributor to relative results this period. Avoiding Spain's Banco Santander, a benchmark constituent, also was a good call. Conversely, the fund's position in French bank BNP Paribas was the biggest relative detractor the past year. We held an underweighted position in the stock earlier in the period and sold it once the stock no longer fit our investment criteria. This stance hurt the fund because BNP outpaced the market the past year.
The views expressed above reflect those of the portfolio manager(s) only through the end of the period as stated on the cover of this report and do not necessarily represent the views of Fidelity or any other person in the Fidelity organization. Any such views are subject to change at any time based upon market or other conditions and Fidelity disclaims any responsibility to update such views. These views may not be relied on as investment advice and, because investment decisions for a Fidelity fund are based on numerous factors, may not be relied on as an indication of trading intent on behalf of any Fidelity fund.
Annual Report
Shareholder Expense Example
As a shareholder of the Fund, you incur two types of costs: (1) transaction costs, including sales charges (loads) on purchase payments or redemption proceeds, redemption fees and (2) ongoing costs, including management fees, distribution and/or service (12b-1) fees and other Fund expenses. This Example is intended to help you understand your ongoing costs (in dollars) of investing in the Fund and to compare these costs with the ongoing costs of investing in other mutual funds.
The Example is based on an investment of $1,000 invested at the beginning of the period and held for the entire period (May 1, 2015 to October 31, 2015).
Actual Expenses
The first line of the accompanying table for each class of the Fund provides information about actual account values and actual expenses. You may use the information in this line, together with the amount you invested, to estimate the expenses that you paid over the period. Simply divide your account value by $1,000.00 (for example, an $8,600 account value divided by $1,000.00 = 8.6), then multiply the result by the number in the first line for a class of the Fund under the heading entitled "Expenses Paid During Period" to estimate the expenses you paid on your account during this period. A small balance maintenance fee of $12.00 that is charged once a year may apply for certain accounts with a value of less than $2,000. This fee is not included in the table below. If it was, the estimate of expenses you paid during the period would be higher, and your ending account value lower, by this amount. In addition, the Fund, as a shareholder in the underlying Fidelity Central Funds, will indirectly bear its pro-rata share of the fees and expenses incurred by the underlying Fidelity Central Funds. These fees and expenses are not included in the Fund's annualized expense ratio used to calculate the expense estimate in the table below.
Hypothetical Example for Comparison Purposes
The second line of the accompanying table for each class of the Fund provides information about hypothetical account values and hypothetical expenses based on a Class' actual expense ratio and an assumed rate of return of 5% per year before expenses, which is not the Class' actual return. The hypothetical account values and expenses may not be used to estimate the actual ending account balance or expenses you paid for the period. You may use this information to compare the ongoing costs of investing in the Fund and other funds. To do so, compare this 5% hypothetical example with the 5% hypothetical examples that appear in the shareholder reports of the other funds. A small balance maintenance fee of $12.00 that is charged once a year may apply for certain accounts with a value of less than $2,000. This fee is not included in the table below. If it was, the estimate of expenses you paid during the period would be higher, and your ending account value lower, by this amount. In addition, the Fund, as a shareholder in the underlying Fidelity Central Funds, will indirectly bear its pro-rata share of the fees and expenses incurred by the underlying Fidelity Central Funds. These fees and expenses are not included in the Fund's annualized expense ratio used to calculate the expense estimate in the table below.
Please note that the expenses shown in the table are meant to highlight your ongoing costs only and do not reflect any transaction costs. Therefore, the second line of the table is useful in comparing ongoing costs only, and will not help you determine the relative total costs of owning different funds. In addition, if these transactional costs were included, your costs would have been higher.
Annual Report
Shareholder Expense Example - continued
| Annualized
Expense RatioB | Beginning
Account Value
May 1, 2015 | Ending
Account Value
October 31, 2015 | Expenses Paid
During PeriodC
May 1, 2015 to
October 31, 2015 |
Class A | 1.34% | | | |
Actual | | $ 1,000.00 | $ 944.10 | $ 6.57 |
HypotheticalA | | $ 1,000.00 | $ 1,018.45 | $ 6.82 |
Class T | 1.63% | | | |
Actual | | $ 1,000.00 | $ 942.90 | $ 7.98 |
HypotheticalA | | $ 1,000.00 | $ 1,016.99 | $ 8.29 |
Class B | 2.10% | | | |
Actual | | $ 1,000.00 | $ 941.30 | $ 10.28 |
HypotheticalA | | $ 1,000.00 | $ 1,014.62 | $ 10.66 |
Class C | 2.13% | | | |
Actual | | $ 1,000.00 | $ 940.60 | $ 10.42 |
HypotheticalA | | $ 1,000.00 | $ 1,014.47 | $ 10.82 |
International Value | .98% | | | |
Actual | | $ 1,000.00 | $ 946.30 | $ 4.81 |
HypotheticalA | | $ 1,000.00 | $ 1,020.27 | $ 4.99 |
Class I | 1.10% | | | |
Actual | | $ 1,000.00 | $ 946.30 | $ 5.40 |
HypotheticalA | | $ 1,000.00 | $ 1,019.66 | $ 5.60 |
A 5% return per year before expenses
B Annualized expense ratio reflects expenses net of applicable fee waivers.
C Expenses are equal to each Class' annualized expense ratio, multiplied by the average account value over the period, multiplied by 184/365 (to reflect the one-half year period).
Annual Report
Investment Changes (Unaudited)
Asset Allocation as of October 31, 2015 |
| % of fund's
net assets | % of fund's net assets
6 months ago |
Stocks | 97.6 | 99.2 |
Short-Term Investments and Net Other Assets (Liabilities) | 2.4 | 0.8 |
Top Ten Stocks as of October 31, 2015 |
| % of fund's
net assets | % of fund's net assets
6 months ago |
Total SA (France, Oil, Gas & Consumable Fuels) | 3.1 | 2.8 |
Nestle SA (Switzerland, Food Products) | 2.7 | 2.0 |
Sanofi SA (France, Pharmaceuticals) | 2.6 | 2.4 |
Novartis AG (Switzerland, Pharmaceuticals) | 2.6 | 1.6 |
Toyota Motor Corp. (Japan, Automobiles) | 2.4 | 2.7 |
Mitsubishi UFJ Financial Group, Inc. (Japan, Banks) | 2.0 | 2.6 |
BP PLC sponsored ADR (United Kingdom, Oil, Gas & Consumable Fuels) | 2.0 | 2.8 |
HSBC Holdings PLC sponsored ADR (United Kingdom, Banks) | 1.9 | 2.1 |
Vodafone Group PLC sponsored ADR (United Kingdom, Wireless Telecommunication Services) | 1.8 | 2.0 |
Imperial Tobacco Group PLC (United Kingdom, Tobacco) | 1.8 | 1.2 |
| 22.9 | |
Market Sectors as of October 31, 2015 |
| % of fund's
net assets | % of fund's net assets
6 months ago |
Financials | 26.3 | 27.7 |
Health Care | 16.0 | 14.3 |
Consumer Discretionary | 14.4 | 15.5 |
Consumer Staples | 9.3 | 7.1 |
Industrials | 8.0 | 7.8 |
Energy | 6.7 | 6.8 |
Telecommunication Services | 6.1 | 7.1 |
Materials | 4.1 | 4.9 |
Information Technology | 3.6 | 5.6 |
Utilities | 3.1 | 2.4 |
Annual Report
Investments October 31, 2015
Showing Percentage of Net Assets
Common Stocks - 97.2% |
| Shares | | Value |
Australia - 2.9% |
Ansell Ltd. | 52,575 | | $ 748,141 |
Macquarie Group Ltd. | 25,419 | | 1,539,092 |
Telstra Corp. Ltd. | 157,443 | | 603,266 |
Transurban Group unit | 166,965 | | 1,237,218 |
Westpac Banking Corp. | 193,728 | | 4,315,102 |
TOTAL AUSTRALIA | | 8,442,819 |
Bailiwick of Jersey - 1.4% |
Shire PLC | 18,100 | | 1,370,729 |
Wolseley PLC | 43,283 | | 2,541,202 |
TOTAL BAILIWICK OF JERSEY | | 3,911,931 |
Belgium - 0.5% |
Anheuser-Busch InBev SA NV | 12,870 | | 1,535,708 |
Canada - 0.8% |
Imperial Oil Ltd. | 41,300 | | 1,374,245 |
Potash Corp. of Saskatchewan, Inc. | 45,500 | | 921,413 |
TOTAL CANADA | | 2,295,658 |
Denmark - 0.3% |
Topdanmark A/S (a) | 27,800 | | 739,761 |
Finland - 1.2% |
Sampo Oyj (A Shares) | 69,234 | | 3,386,403 |
France - 16.3% |
Atos Origin SA | 35,855 | | 2,860,498 |
AXA SA | 161,021 | | 4,297,347 |
Capgemini SA | 39,593 | | 3,527,920 |
Havas SA | 204,166 | | 1,771,393 |
Orange SA | 169,900 | | 2,995,624 |
Renault SA | 15,745 | | 1,484,328 |
Sanofi SA | 73,299 | | 7,394,100 |
Societe Generale Series A | 63,300 | | 2,939,856 |
Total SA | 183,273 | | 8,862,871 |
Unibail-Rodamco | 12,100 | | 3,380,995 |
VINCI SA | 57,500 | | 3,881,050 |
Vivendi SA | 140,492 | | 3,379,789 |
TOTAL FRANCE | | 46,775,771 |
Germany - 5.1% |
Axel Springer Verlag AG | 20,600 | | 1,158,464 |
BASF AG | 60,026 | | 4,917,561 |
Bayer AG | 15,103 | | 2,015,382 |
Common Stocks - continued |
| Shares | | Value |
Germany - continued |
Continental AG | 5,766 | | $ 1,386,685 |
Fresenius SE & Co. KGaA | 46,000 | | 3,380,190 |
GEA Group AG | 15,021 | | 602,323 |
SAP AG | 16,460 | | 1,297,626 |
TOTAL GERMANY | | 14,758,231 |
Hong Kong - 0.2% |
Power Assets Holdings Ltd. | 44,500 | | 442,615 |
Ireland - 1.4% |
Allergan PLC (a) | 7,280 | | 2,245,662 |
Medtronic PLC | 24,100 | | 1,781,472 |
TOTAL IRELAND | | 4,027,134 |
Israel - 1.4% |
Teva Pharmaceutical Industries Ltd. sponsored ADR | 67,099 | | 3,971,590 |
Italy - 1.7% |
Intesa Sanpaolo SpA | 654,300 | | 2,279,379 |
Mediaset SpA | 285,400 | | 1,449,941 |
Telecom Italia SpA (a) | 810,900 | | 1,131,273 |
TOTAL ITALY | | 4,860,593 |
Japan - 20.6% |
Astellas Pharma, Inc. | 196,600 | | 2,853,547 |
Dentsu, Inc. | 53,800 | | 3,024,536 |
East Japan Railway Co. | 31,200 | | 2,966,358 |
Hoya Corp. | 81,800 | | 3,375,622 |
Itochu Corp. | 192,500 | | 2,408,749 |
Japan Tobacco, Inc. | 109,100 | | 3,776,146 |
KDDI Corp. | 124,400 | | 3,010,273 |
Makita Corp. | 30,400 | | 1,665,702 |
Mitsubishi UFJ Financial Group, Inc. | 887,200 | | 5,737,997 |
Nippon Prologis REIT, Inc. | 574 | | 1,009,425 |
Nippon Telegraph & Telephone Corp. | 102,800 | | 3,768,792 |
OBIC Co. Ltd. | 31,900 | | 1,683,586 |
Olympus Corp. | 56,500 | | 1,905,820 |
ORIX Corp. | 175,700 | | 2,565,884 |
Seven & i Holdings Co. Ltd. | 57,100 | | 2,593,757 |
Seven Bank Ltd. | 388,600 | | 1,770,678 |
Sony Corp. | 70,300 | | 1,998,308 |
Sony Financial Holdings, Inc. | 114,800 | | 2,057,513 |
Common Stocks - continued |
| Shares | | Value |
Japan - continued |
Sumitomo Mitsui Financial Group, Inc. | 109,000 | | $ 4,348,410 |
Toyota Motor Corp. | 110,400 | | 6,763,594 |
TOTAL JAPAN | | 59,284,697 |
Luxembourg - 0.5% |
RTL Group SA | 16,739 | | 1,446,793 |
Netherlands - 3.7% |
ING Groep NV (Certificaten Van Aandelen) | 263,990 | | 3,842,076 |
Koninklijke KPN NV | 315,453 | | 1,155,883 |
Mylan N.V. | 19,600 | | 864,164 |
PostNL NV (a) | 92,431 | | 381,766 |
RELX NV | 253,849 | | 4,340,706 |
TOTAL NETHERLANDS | | 10,584,595 |
Singapore - 0.3% |
UOL Group Ltd. | 182,764 | | 852,916 |
Spain - 2.0% |
Iberdrola SA | 611,024 | | 4,365,416 |
Mediaset Espana Comunicacion SA | 119,100 | | 1,447,855 |
TOTAL SPAIN | | 5,813,271 |
Sweden - 1.6% |
Nordea Bank AB | 309,600 | | 3,424,478 |
Sandvik AB | 138,700 | | 1,297,134 |
TOTAL SWEDEN | | 4,721,612 |
Switzerland - 8.2% |
Credit Suisse Group AG | 10,513 | | 262,207 |
Credit Suisse Group AG (e)(f) | 91,500 | | 2,105,949 |
Nestle SA | 100,200 | | 7,652,674 |
Novartis AG | 80,719 | | 7,312,232 |
Syngenta AG (Switzerland) | 4,651 | | 1,562,598 |
UBS Group AG | 57,758 | | 1,156,893 |
Zurich Insurance Group AG | 13,435 | | 3,545,499 |
TOTAL SWITZERLAND | | 23,598,052 |
United Kingdom - 23.5% |
AstraZeneca PLC (United Kingdom) | 77,441 | | 4,935,515 |
Aviva PLC | 434,757 | | 3,249,190 |
BAE Systems PLC | 393,329 | | 2,660,671 |
Barclays PLC | 1,136,599 | | 4,049,454 |
BG Group PLC | 111,600 | | 1,763,117 |
Common Stocks - continued |
| Shares | | Value |
United Kingdom - continued |
BP PLC sponsored ADR | 160,157 | | $ 5,717,605 |
Bunzl PLC | 104,364 | | 2,990,899 |
Compass Group PLC | 183,539 | | 3,155,202 |
HSBC Holdings PLC sponsored ADR (d) | 139,842 | | 5,463,627 |
Imperial Tobacco Group PLC | 95,258 | | 5,138,272 |
Informa PLC | 241,209 | | 2,112,095 |
ITV PLC | 921,096 | | 3,583,983 |
Liberty Global PLC: | | | |
Class A (a) | 27,900 | | 1,242,108 |
Class A (a) | 7,000 | | 270,340 |
Lloyds Banking Group PLC | 3,551,200 | | 4,030,655 |
Meggitt PLC | 101,816 | | 555,009 |
Micro Focus International PLC | 64,100 | | 1,241,136 |
National Grid PLC | 276,182 | | 3,934,181 |
Prudential PLC | 69,249 | | 1,617,414 |
Rio Tinto PLC | 128,808 | | 4,694,443 |
Vodafone Group PLC sponsored ADR | 158,958 | | 5,240,845 |
TOTAL UNITED KINGDOM | | 67,645,761 |
United States of America - 3.6% |
Altria Group, Inc. | 31,400 | | 1,898,758 |
Chevron Corp. | 17,000 | | 1,544,960 |
Constellation Brands, Inc. Class A (sub. vtg.) | 21,800 | | 2,938,640 |
Edgewell Personal Care Co. (a) | 12,500 | | 1,058,875 |
McGraw Hill Financial, Inc. | 19,700 | | 1,825,008 |
ResMed, Inc. CDI | 182,510 | | 1,036,683 |
TOTAL UNITED STATES OF AMERICA | | 10,302,924 |
TOTAL COMMON STOCKS (Cost $279,167,390) |
279,398,835
|
Nonconvertible Preferred Stocks - 0.4% |
| | | |
Germany - 0.4% |
Volkswagen AG
(Cost $2,263,117) | 10,831 | |
1,300,100
|
Money Market Funds - 4.3% |
| Shares | | Value |
Fidelity Cash Central Fund, 0.18% (b) | 10,711,479 | | $ 10,711,479 |
Fidelity Securities Lending Cash Central Fund, 0.19% (b)(c) | 1,557,675 | | 1,557,675 |
TOTAL MONEY MARKET FUNDS (Cost $12,269,154) |
12,269,154
|
TOTAL INVESTMENT PORTFOLIO - 101.9% (Cost $293,699,661) | 292,968,089 |
NET OTHER ASSETS (LIABILITIES) - (1.9)% | (5,586,579) |
NET ASSETS - 100% | $ 287,381,510 |
Legend |
(a) Non-income producing |
(b) Affiliated fund that is generally available only to investment companies and other accounts managed by Fidelity Investments. The rate quoted is the annualized seven-day yield of the fund at period end. A complete unaudited listing of the fund's holdings as of its most recent quarter end is available upon request. In addition, each Fidelity Central Fund's financial statements, which are not covered by the Fund's Report of Independent Registered Public Accounting Firm, are available on the SEC's website or upon request. |
(c) Investment made with cash collateral received from securities on loan. |
(d) Security or a portion of the security is on loan at period end. |
(e) Security or a portion of the security purchased on a delayed delivery or when-issued basis. |
(f) Restricted securities - Investment in securities not registered under the Securities Act of 1933 (excluding 144A issues). At the end of the period, the value of restricted securities (excluding 144A issues) amounted to $2,105,949 or 0.7% of net assets. |
Additional information on each restricted holding is as follows: |
Security | Acquisition Date | Acquisition Cost |
Credit Suisse Group AG | 10/21/15 | $ 2,169,602 |
Affiliated Central Funds |
Information regarding fiscal year to date income earned by the Fund from investments in Fidelity Central Funds is as follows: |
Fund | Income earned |
Fidelity Cash Central Fund | $ 5,565 |
Fidelity Securities Lending Cash Central Fund | 112,755 |
Total | $ 118,320 |
Other Information |
Categorizations in the Schedule of Investments are based on country or territory of incorporation. |
The following is a summary of the inputs used, as of October 31, 2015, involving the Fund's assets and liabilities carried at fair value. The inputs or methodology used for valuing securities may not be an indication of the risk associated with investing in those securities. For more information on valuation inputs, and their aggregation into the levels used in the tables below, please refer to the Investment Valuation section in the accompanying Notes to Financial Statements. |
Valuation Inputs at Reporting Date: |
Description | Total | Level 1 | Level 2 | Level 3 |
Investments in Securities: | | | | |
Equities: | | | | |
Consumer Discretionary | $ 41,316,220 | $ 21,694,691 | $ 19,621,529 | $ - |
Consumer Staples | 26,592,830 | 11,034,545 | 15,558,285 | - |
Energy | 19,262,798 | 8,636,810 | 10,625,988 | - |
Financials | 75,793,208 | 24,758,859 | 51,034,349 | - |
Health Care | 45,190,849 | 10,878,270 | 34,312,579 | - |
Industrials | 23,188,081 | 9,708,181 | 13,479,900 | - |
Information Technology | 10,610,766 | 7,629,554 | 2,981,212 | - |
Materials | 12,096,015 | 921,413 | 11,174,602 | - |
Telecommunication Services | 17,905,956 | 5,240,845 | 12,665,111 | - |
Utilities | 8,742,212 | 4,365,416 | 4,376,796 | - |
Money Market Funds | 12,269,154 | 12,269,154 | - | - |
Total Investments in Securities: | $ 292,968,089 | $ 117,137,738 | $ 175,830,351 | $ - |
The following is a summary of transfers between Level 1 and Level 2 for the period ended October 31, 2015. Transfers are assumed to have occurred at the beginning of the period, and are primarily attributable to the valuation techniques used for foreign equity securities, as discussed in the accompanying Notes to Financial Statements: |
Transfers | Total |
Level 1 to Level 2 | $ 17,387,003 |
Level 2 to Level 1 | 3,914,138 |
See accompanying notes which are an integral part of the financial statements.
Annual Report
Statement of Assets and Liabilities
| | October 31, 2015 |
| | |
Assets | | |
Investment in securities, at value (including securities loaned of $1,512,009) - See accompanying schedule: Unaffiliated issuers (cost $281,430,507) | $ 280,698,935 | |
Fidelity Central Funds (cost $12,269,154) | 12,269,154 | |
Total Investments (cost $293,699,661) | | $ 292,968,089 |
Cash | | 11,900 |
Receivable for investments sold | | 611,490 |
Receivable for fund shares sold | | 1,965,354 |
Dividends receivable | | 851,987 |
Distributions receivable from Fidelity Central Funds | | 2,646 |
Prepaid expenses | | 559 |
Other receivables | | 1,752 |
Total assets | | 296,413,777 |
| | |
Liabilities | | |
Payable for investments purchased | | |
Regular delivery | $ 4,985,343 | |
Delayed delivery | 2,105,949 | |
Payable for fund shares redeemed | 102,123 | |
Accrued management fee | 162,913 | |
Distribution and service plan fees payable | 7,553 | |
Other affiliated payables | 48,219 | |
Other payables and accrued expenses | 62,492 | |
Collateral on securities loaned, at value | 1,557,675 | |
Total liabilities | | 9,032,267 |
| | |
Net Assets | | $ 287,381,510 |
Net Assets consist of: | | |
Paid in capital | | $ 390,986,470 |
Undistributed net investment income | | 3,583,213 |
Accumulated undistributed net realized gain (loss) on investments and foreign currency transactions | | (106,502,887) |
Net unrealized appreciation (depreciation) on investments and assets and liabilities in foreign currencies | | (685,286) |
Net Assets | | $ 287,381,510 |
See accompanying notes which are an integral part of the financial statements.
Annual Report
Statement of Assets and Liabilities - continued
| | October 31, 2015 |
Calculation of Maximum Offering Price | | |
Class A: | | |
Net Asset Value and redemption price per share
($8,955,961 ÷ 1,082,456 shares) | | $ 8.27 |
| | |
Maximum offering price per share (100/94.25 of $8.27) | | $ 8.77 |
Class T: | | |
Net Asset Value and redemption price per share
($4,085,545 ÷ 494,951 shares) | | $ 8.25 |
| | |
Maximum offering price per share (100/96.50 of $8.25) | | $ 8.55 |
Class B: | | |
Net Asset Value and offering price per share
($302,322 ÷ 36,246 shares)A | | $ 8.34 |
| | |
Class C: | | |
Net Asset Value and offering price per share
($4,501,895 ÷ 546,911 shares)A | | $ 8.23 |
| | |
International Value: | | |
Net Asset Value, offering price and redemption price
per share ($267,566,951 ÷ 32,294,974 shares) | | $ 8.29 |
| | |
Class I: | | |
Net Asset Value, offering price and redemption price
per share ($1,968,836 ÷ 237,625 shares) | | $ 8.29 |
A Redemption price per share is equal to net asset value less any applicable contingent deferred sales charge.
See accompanying notes which are an integral part of the financial statements.
Annual Report
Financial Statements - continued
Statement of Operations
| Year ended October 31, 2015 |
Investment Income | | |
Dividends | | $ 6,808,439 |
Income from Fidelity Central Funds | | 118,320 |
Income before foreign taxes withheld | | 6,926,759 |
Less foreign taxes withheld | | (493,861) |
Total income | | 6,432,898 |
| | |
Expenses | | |
Management fee | | |
Basic fee | $ 1,525,277 | |
Performance adjustment | (2,158) | |
Transfer agent fees | 408,663 | |
Distribution and service plan fees | 83,833 | |
Accounting and security lending fees | 114,042 | |
Custodian fees and expenses | 74,842 | |
Independent trustees' compensation | 905 | |
Registration fees | 74,886 | |
Audit | 60,612 | |
Legal | 535 | |
Miscellaneous | 1,759 | |
Total expenses before reductions | 2,343,196 | |
Expense reductions | (23,655) | 2,319,541 |
Net investment income (loss) | | 4,113,357 |
Realized and Unrealized Gain (Loss) | | |
Net realized gain (loss) on: | | |
Investment securities: | | |
Unaffiliated issuers | (2,418,325) | |
Foreign currency transactions | (56,980) | |
Total net realized gain (loss) | | (2,475,305) |
Change in net unrealized appreciation (depreciation) on: Investment securities | (2,382,002) | |
Assets and liabilities in foreign currencies | 71,045 | |
Total change in net unrealized appreciation (depreciation) | | (2,310,957) |
Net gain (loss) | | (4,786,262) |
Net increase (decrease) in net assets resulting from operations | | $ (672,905) |
See accompanying notes which are an integral part of the financial statements.
Annual Report
Statement of Changes in Net Assets
| Year ended
October 31,
2015 | Year ended
October 31,
2014 |
Increase (Decrease) in Net Assets | | |
Operations | | |
Net investment income (loss) | $ 4,113,357 | $ 7,699,402 |
Net realized gain (loss) | (2,475,305) | 12,080,123 |
Change in net unrealized appreciation (depreciation) | (2,310,957) | (23,435,459) |
Net increase (decrease) in net assets resulting from operations | (672,905) | (3,655,934) |
Distributions to shareholders from net investment income | (7,553,931) | (4,160,313) |
Distributions to shareholders from net realized gain | - | (301,192) |
Total distributions | (7,553,931) | (4,461,505) |
Share transactions - net increase (decrease) | 87,547,372 | 20,511,129 |
Redemption fees | 863 | 1,150 |
Total increase (decrease) in net assets | 79,321,399 | 12,394,840 |
| | |
Net Assets | | |
Beginning of period | 208,060,111 | 195,665,271 |
End of period (including undistributed net investment income of $3,583,213 and undistributed net investment income of $7,054,946, respectively) | $ 287,381,510 | $ 208,060,111 |
See accompanying notes which are an integral part of the financial statements.
Annual Report
Financial Highlights - Fidelity International Value Fund Class A
Years ended October 31, | 2015 | 2014 | 2013 | 2012 | 2011 |
Selected Per-Share Data | | | | | |
Net asset value, beginning of period | $ 8.62 | $ 8.96 | $ 7.39 | $ 7.02 | $ 8.22 |
Income from Investment Operations | | | | | |
Net investment income (loss) C | .13 | .31F | .17 | .20 | .22 |
Net realized and unrealized gain (loss) | (.20) | (.47) | 1.64 | .39 | (1.19) |
Total from investment operations | (.07) | (.16) | 1.81 | .59 | (.97) |
Distributions from net investment income | (.28) | (.17) | (.20) | (.22) | (.19) |
Distributions from net realized gain | - | (.01) | (.04) | - | (.03) |
Total distributions | (.28) | (.18) | (.24) | (.22) | (.23)I |
Redemption fees added to paid in capitalC, H | - | - | - | - | - |
Net asset value, end of period | $ 8.27 | $ 8.62 | $ 8.96 | $ 7.39 | $ 7.02 |
Total ReturnA, B | (.81)% | (1.76)% | 25.24% | 8.82% | (12.19)% |
Ratios to Average Net AssetsD, G | | | | | |
Expenses before reductions | 1.37% | 1.32% | 1.39% | 1.44% | 1.36% |
Expenses net of fee waivers, if any | 1.37% | 1.32% | 1.39% | 1.44% | 1.36% |
Expenses net of all reductions | 1.36% | 1.32% | 1.36% | 1.41% | 1.34% |
Net investment income (loss) | 1.58% | 3.44%F | 2.08% | 2.85% | 2.79% |
Supplemental Data | | | | | |
Net assets, end of period (000 omitted) | $ 8,956 | $ 6,296 | $ 6,191 | $ 4,491 | $ 4,668 |
Portfolio turnover rateE | 44% | 69% | 79% | 74% | 83% |
A Total returns would have been lower if certain expenses had not been reduced during the applicable periods shown.
B Total returns do not include the effect of the sales charges.
C Calculated based on average shares outstanding during the period.
D Fees and expenses of any underlying Fidelity Central Funds are not included in the Fund's expense ratio. The Fund indirectly bears its proportionate share of the expenses of any underlying Fidelity Central Funds.
E Amount does not include the portfolio activity of any underlying Fidelity Central Funds.
F Investment income per share reflects a large, non-recurring dividend which amounted to $.14 per share. Excluding this non-recurring dividend, the ratio of net investment income (loss) to average net assets would have been 1.90%.
G Expense ratios reflect operating expenses of the class. Expenses before reductions do not reflect amounts reimbursed by the investment adviser or reductions from brokerage service arrangements or reductions from other expense offset arrangements and do not represent the amount paid by the class during periods when reimbursements or reductions occur. Expenses net of fee waivers reflect expenses after reimbursement by the investment adviser but prior to reductions from brokerage service arrangements or other expense offset arrangements. Expenses net of all reductions represent the net expenses paid by the class.
H Amount represents less than $.005 per share.
I Total distributions of $.23 per share is comprised of distributions from net investment income of $.191 and distributions from net realized gain of $.034 per share.
See accompanying notes which are an integral part of the financial statements.
Annual Report
Financial Highlights - Fidelity International Value Fund Class T
Years ended October 31, | 2015 | 2014 | 2013 | 2012 | 2011 |
Selected Per-Share Data | | | | | |
Net asset value, beginning of period | $ 8.60 | $ 8.94 | $ 7.38 | $ 7.00 | $ 8.20 |
Income from Investment Operations | | | | | |
Net investment income (loss) C | .11 | .28F | .15 | .18 | .20 |
Net realized and unrealized gain (loss) | (.20) | (.46) | 1.64 | .40 | (1.19) |
Total from investment operations | (.09) | (.18) | 1.79 | .58 | (.99) |
Distributions from net investment income | (.26) | (.15) | (.19) | (.20) | (.17) |
Distributions from net realized gain | - | (.01) | (.04) | - | (.03) |
Total distributions | (.26) | (.16) | (.23) | (.20) | (.21)I |
Redemption fees added to paid in capitalC, H | - | - | - | - | - |
Net asset value, end of period | $ 8.25 | $ 8.60 | $ 8.94 | $ 7.38 | $ 7.00 |
Total ReturnA, B | (1.09)% | (1.99)% | 24.86% | 8.60% | (12.42)% |
Ratios to Average Net AssetsD, G | | | | | |
Expenses before reductions | 1.66% | 1.59% | 1.66% | 1.71% | 1.63% |
Expenses net of fee waivers, if any | 1.66% | 1.59% | 1.65% | 1.70% | 1.62% |
Expenses net of all reductions | 1.65% | 1.59% | 1.63% | 1.67% | 1.60% |
Net investment income (loss) | 1.29% | 3.17%F | 1.81% | 2.58% | 2.52% |
Supplemental Data | | | | | |
Net assets, end of period (000 omitted) | $ 4,086 | $ 3,604 | $ 3,758 | $ 2,693 | $ 2,468 |
Portfolio turnover rateE | 44% | 69% | 79% | 74% | 83% |
A Total returns would have been lower if certain expenses had not been reduced during the applicable periods shown.
B Total returns do not include the effect of the sales charges.
C Calculated based on average shares outstanding during the period.
D Fees and expenses of any underlying Fidelity Central Funds are not included in the Fund's expense ratio. The Fund indirectly bears its proportionate share of the expenses of any underlying Fidelity Central Funds.
E Amount does not include the portfolio activity of any underlying Fidelity Central Funds.
F Investment income per share reflects a large, non-recurring dividend which amounted to $.14 per share. Excluding this non-recurring dividend, the ratio of net investment income (loss) to average net assets would have been 1.64%.
G Expense ratios reflect operating expenses of the class. Expenses before reductions do not reflect amounts reimbursed by the investment adviser or reductions from brokerage service arrangements or reductions from other expense offset arrangements and do not represent the amount paid by the class during periods when reimbursements or reductions occur. Expenses net of fee waivers reflect expenses after reimbursement by the investment adviser but prior to reductions from brokerage service arrangements or other expense offset arrangements. Expenses net of all reductions represent the net expenses paid by the class.
H Amount represents less than $.005 per share.
I Total distributions of $.21 per share is comprised of distributions from net investment income of $.173 and distributions from net realized gain of $.034 per share.
See accompanying notes which are an integral part of the financial statements.
Annual Report
Financial Highlights - Fidelity International Value Fund Class B
Years ended October 31, | 2015 | 2014 | 2013 | 2012 | 2011 |
Selected Per-Share Data | | | | | |
Net asset value, beginning of period | $ 8.66 | $ 8.98 | $ 7.39 | $ 7.00 | $ 8.20 |
Income from Investment Operations | | | | | |
Net investment income (loss) C | .07 | .24F | .11 | .14 | .17 |
Net realized and unrealized gain (loss) | (.21) | (.45) | 1.65 | .41 | (1.20) |
Total from investment operations | (.14) | (.21) | 1.76 | .55 | (1.03) |
Distributions from net investment income | (.18) | (.09) | (.13) | (.16) | (.13) |
Distributions from net realized gain | - | (.01) | (.04) | - | (.03) |
Total distributions | (.18) | (.11) I | (.17) | (.16) | (.17)J |
Redemption fees added to paid in capitalC, H | - | - | - | - | - |
Net asset value, end of period | $ 8.34 | $ 8.66 | $ 8.98 | $ 7.39 | $ 7.00 |
Total ReturnA, B | (1.64)% | (2.39)% | 24.30% | 8.07% | (12.88)% |
Ratios to Average Net AssetsD, G | | | | | |
Expenses before reductions | 2.15% | 2.08% | 2.14% | 2.19% | 2.11% |
Expenses net of fee waivers, if any | 2.15% | 2.08% | 2.14% | 2.19% | 2.11% |
Expenses net of all reductions | 2.14% | 2.08% | 2.11% | 2.16% | 2.09% |
Net investment income (loss) | .81% | 2.68%F | 1.32% | 2.09% | 2.04% |
Supplemental Data | | | | | |
Net assets, end of period (000 omitted) | $ 302 | $ 414 | $ 678 | $ 691 | $ 901 |
Portfolio turnover rateE | 44% | 69% | 79% | 74% | 83% |
A Total returns would have been lower if certain expenses had not been reduced during the applicable periods shown.
B Total returns do not include the effect of the contingent deferred sales charge.
C Calculated based on average shares outstanding during the period.
D Fees and expenses of any underlying Fidelity Central Funds are not included in the Fund's expense ratio. The Fund indirectly bears its proportionate share of the expenses of any underlying Fidelity Central Funds.
E Amount does not include the portfolio activity of any underlying Fidelity Central Funds.
F Investment income per share reflects a large, non-recurring dividend which amounted to $.14 per share. Excluding this non-recurring dividend, the ratio of net investment income (loss) to average net assets would have been 1.15%.
G Expense ratios reflect operating expenses of the class. Expenses before reductions do not reflect amounts reimbursed by the investment adviser or reductions from brokerage service arrangements or reductions from other expense offset arrangements and do not represent the amount paid by the class during periods when reimbursements or reductions occur. Expenses net of fee waivers reflect expenses after reimbursement by the investment adviser but prior to reductions from brokerage service arrangements or other expense offset arrangements. Expenses net of all reductions represent the net expenses paid by the class.
H Amount represents less than $.005 per share.
I Total distributions of $.11 per share is comprised of distributions from net investment income of $.093 and distributions from net realized gain of $.014 per share.
J Total distributions of $.17 per share is comprised of distributions from net investment income of $.131 and distributions from net realized gain of $.034 per share.
See accompanying notes which are an integral part of the financial statements.
Annual Report
Financial Highlights - Fidelity International Value Fund Class C
Years ended October 31, | 2015 | 2014 | 2013 | 2012 | 2011 |
Selected Per-Share Data | | | | | |
Net asset value, beginning of period | $ 8.59 | $ 8.93 | $ 7.38 | $ 7.00 | $ 8.20 |
Income from Investment Operations | | | | | |
Net investment income (loss)C | .07 | .24F | .11 | .14 | .16 |
Net realized and unrealized gain (loss) | (.20) | (.45) | 1.63 | .41 | (1.19) |
Total from investment operations | (.13) | (.21) | 1.74 | .55 | (1.03) |
Distributions from net investment income | (.23) | (.11) | (.15) | (.17) | (.14) |
Distributions from net realized gain | - | (.01) | (.04) | - | (.03) |
Total distributions | (.23) | (.13)I | (.19) | (.17) | (.17) |
Redemption fees added to paid in capitalC, H | - | - | - | - | - |
Net asset value, end of period | $ 8.23 | $ 8.59 | $ 8.93 | $ 7.38 | $ 7.00 |
Total ReturnA, B | (1.58)% | (2.43)% | 24.17% | 8.12% | (12.84)% |
Ratios to Average Net AssetsD, G | | | | | |
Expenses before reductions | 2.15% | 2.07% | 2.14% | 2.19% | 2.12% |
Expenses net of fee waivers, if any | 2.14% | 2.07% | 2.14% | 2.19% | 2.11% |
Expenses net of all reductions | 2.14% | 2.07% | 2.11% | 2.16% | 2.09% |
Net investment income (loss) | .81% | 2.69%F | 1.33% | 2.09% | 2.04% |
Supplemental Data | | | | | |
Net assets, end of period (000 omitted) | $ 4,502 | $ 3,647 | $ 3,231 | $ 2,249 | $ 2,108 |
Portfolio turnover rateE | 44% | 69% | 79% | 74% | 83% |
A Total returns would have been lower if certain expenses had not been reduced during the applicable periods shown.
B Total returns do not include the effect of the contingent deferred sales charge.
C Calculated based on average shares outstanding during the period.
D Fees and expenses of any underlying Fidelity Central Funds are not included in the Fund's expense ratio. The Fund indirectly bears its proportionate share of the expenses of any underlying Fidelity Central Funds.
E Amount does not include the portfolio activity of any underlying Fidelity Central Funds.
F Investment income per share reflects a large, non-recurring dividend which amounted to $.14 per share. Excluding this non-recurring dividend, the ratio of net investment income (loss) to average net assets would have been 1.15%.
G Expense ratios reflect operating expenses of the class. Expenses before reductions do not reflect amounts reimbursed by the investment adviser or reductions from brokerage service arrangements or reductions from other expense offset arrangements and do not represent the amount paid by the class during periods when reimbursements or reductions occur. Expenses net of fee waivers reflect expenses after reimbursement by the investment adviser but prior to reductions from brokerage service arrangements or other expense offset arrangements. Expenses net of all reductions represent the net expenses paid by the class.
H Amount represents less than $.005 per share.
I Total distributions of $.13 per share is comprised of distributions from net investment income of $.111 and distributions from net realized gain of $.014 per share.
See accompanying notes which are an integral part of the financial statements.
Annual Report
Financial Highlights - Fidelity International Value Fund
Years ended October 31, | 2015 | 2014 | 2013 | 2012 | 2011 |
Selected Per-Share Data | | | | | |
Net asset value, beginning of period | $ 8.64 | $ 8.97 | $ 7.40 | $ 7.03 | $ 8.23 |
Income from Investment Operations | | | | | |
Net investment income (loss) B | .16 | .34E | .19 | .22 | .25 |
Net realized and unrealized gain (loss) | (.19) | (.46) | 1.65 | .40 | (1.20) |
Total from investment operations | (.03) | (.12) | 1.84 | .62 | (.95) |
Distributions from net investment income | (.32) | (.20) | (.22) | (.25) | (.22) |
Distributions from net realized gain | - | (.01) | (.04) | - | (.03) |
Total distributions | (.32) | (.21) | (.27)H | (.25) | (.25) |
Redemption fees added to paid in capitalB, G | - | - | - | - | - |
Net asset value, end of period | $ 8.29 | $ 8.64 | $ 8.97 | $ 7.40 | $ 7.03 |
Total ReturnA | (.41)% | (1.34)% | 25.57% | 9.19% | (11.91)% |
Ratios to Average Net AssetsC, F | | | | | |
Expenses before reductions | 1.02% | .96% | 1.05% | 1.13% | 1.04% |
Expenses net of fee waivers, if any | 1.02% | .96% | 1.05% | 1.13% | 1.03% |
Expenses net of all reductions | 1.01% | .95% | 1.02% | 1.10% | 1.01% |
Net investment income (loss) | 1.93% | 3.80%E | 2.41% | 3.16% | 3.11% |
Supplemental Data | | | | | |
Net assets, end of period (000 omitted) | $ 267,567 | $ 192,789 | $ 181,568 | $ 128,983 | $ 150,967 |
Portfolio turnover rateD | 44% | 69% | 79% | 74% | 83% |
A Total returns would have been lower if certain expenses had not been reduced during the applicable periods shown.
B Calculated based on average shares outstanding during the period.
C Fees and expenses of any underlying Fidelity Central Funds are not included in the Fund's expense ratio. The Fund indirectly bears its proportionate share of the expenses of any underlying Fidelity Central Funds.
D Amount does not include the portfolio activity of any underlying Fidelity Central Funds.
E Investment income per share reflects a large, non-recurring dividend which amounted to $.14 per share. Excluding this non-recurring dividend, the ratio of net investment income (loss) to average net assets would have been 2.27%.
F Expense ratios reflect operating expenses of the class. Expenses before reductions do not reflect amounts reimbursed by the investment adviser or reductions from brokerage service arrangements or reductions from other expense offset arrangements and do not represent the amount paid by the class during periods when reimbursements or reductions occur. Expenses net of fee waivers reflect expenses after reimbursement by the investment adviser but prior to reductions from brokerage service arrangements or other expense offset arrangements. Expenses net of all reductions represent the net expenses paid by the class.
G Amount represents less than $.005 per share.
H Total distributions of $.27 per share is comprised of distributions from net investment income of $.223 and distributions from net realized gain of $.042 per share.
See accompanying notes which are an integral part of the financial statements.
Annual Report
Financial Highlights - Fidelity International Value Fund Class I
Years ended October 31, | 2015 | 2014 | 2013 | 2012 | 2011 |
Selected Per-Share Data | | | | | |
Net asset value, beginning of period | $ 8.65 | $ 8.98 | $ 7.41 | $ 7.04 | $ 8.24 |
Income from Investment Operations | | | | | |
Net investment income (loss) B | .15 | .33E | .19 | .22 | .25 |
Net realized and unrealized gain (loss) | (.19) | (.45) | 1.65 | .40 | (1.19) |
Total from investment operations | (.04) | (.12) | 1.84 | .62 | (.94) |
Distributions from net investment income | (.32) | (.19) | (.23) | (.25) | (.22) |
Distributions from net realized gain | - | (.01) | (.04) | - | (.03) |
Total distributions | (.32) | (.21)H | (.27) | (.25) | (.26)I |
Redemption fees added to paid in capitalB, G | - | - | - | - | - |
Net asset value, end of period | $ 8.29 | $ 8.65 | $ 8.98 | $ 7.41 | $ 7.04 |
Total ReturnA | (.53)% | (1.41)% | 25.64% | 9.22% | (11.83)% |
Ratios to Average Net AssetsC, F | | | | | |
Expenses before reductions | 1.14% | 1.05% | 1.07% | 1.10% | .98% |
Expenses net of fee waivers, if any | 1.14% | 1.05% | 1.07% | 1.10% | .98% |
Expenses net of all reductions | 1.13% | 1.04% | 1.04% | 1.07% | .96% |
Net investment income (loss) | 1.81% | 3.71%E | 2.39% | 3.18% | 3.17% |
Supplemental Data | | | | | |
Net assets, end of period (000 omitted) | $ 1,969 | $ 1,310 | $ 239 | $ 372 | $ 473 |
Portfolio turnover rateD | 44% | 69% | 79% | 74% | 83% |
A Total returns would have been lower if certain expenses had not been reduced during the applicable periods shown.
B Calculated based on average shares outstanding during the period.
C Fees and expenses of any underlying Fidelity Central Funds are not included in the Fund's expense ratio. The Fund indirectly bears its proportionate share of the expenses of any underlying Fidelity Central Funds.
D Amount does not include the portfolio activity of any underlying Fidelity Central Funds.
E Investment income per share reflects a large, non-recurring dividend which amounted to $.14 per share. Excluding this non-recurring dividend, the ratio of net investment income (loss) to average net assets would have been 2.18%.
F Expense ratios reflect operating expenses of the class. Expenses before reductions do not reflect amounts reimbursed by the investment adviser or reductions from brokerage service arrangements or reductions from other expense offset arrangements and do not represent the amount paid by the class during periods when reimbursements or reductions occur. Expenses net of fee waivers reflect expenses after reimbursement by the investment adviser but prior to reductions from brokerage service arrangements or other expense offset arrangements. Expenses net of all reductions represent the net expenses paid by the class.
G Amount represents less than $.005 per share.
H Total distributions of $.21 per share is comprised of distributions from net investment income of $.191 and distributions from net realized gain of $.014 per share.
I Total distributions of $.26 per share is comprised of distributions from net investment income of $.221 and distributions from net realized gain of $.034 per share.
See accompanying notes which are an integral part of the financial statements.
Annual Report
For the period ended October 31, 2015
1. Organization.
Fidelity International Value Fund (the Fund) is a fund of Fidelity Investment Trust (the Trust) and is authorized to issue an unlimited number of shares. The Trust is registered under the Investment Company Act of 1940, as amended (the 1940 Act), as an open-end management investment company organized as a Massachusetts business trust. The Fund offers Class A, Class T, Class C, International Value, and Class I (formerly Institutional Class) shares, each of which, along with Class B shares, has equal rights as to assets and voting privileges. Class B shares are closed to new accounts and additional purchases, except for exchanges and reinvestments. Each class has exclusive voting rights with respect to matters that affect that class. Class B shares will automatically convert to Class A shares after a holding period of seven years from the initial date of purchase.
2. Investments in Fidelity Central Funds.
The Fund invests in Fidelity Central Funds, which are open-end investment companies generally available only to other investment companies and accounts managed by the investment adviser and its affiliates. The Fund's Schedule of Investments lists each of the Fidelity Central Funds held as of period end, if any, as an investment of the Fund, but does not include the underlying holdings of each Fidelity Central Fund. As an Investing Fund, the Fund indirectly bears its proportionate share of the expenses of the underlying Fidelity Central Funds.
The Money Market Central Funds seek preservation of capital and current income and are managed by Fidelity Investments Money Management, Inc. (FIMM), an affiliate of the investment adviser. Annualized expenses of the Money Market Central Funds as of their most recent shareholder report date are less than .005%.
A complete unaudited list of holdings for each Fidelity Central Fund is available upon request or at the Securities and Exchange Commission (the SEC) website at www.sec.gov. In addition, the financial statements of the Fidelity Central Funds, which are not covered by the Fund's Report of Independent Registered Public Accounting Firm, are available on the SEC website or upon request.
3. Significant Accounting Policies.
The financial statements have been prepared in conformity with accounting principles generally accepted in the United States of America (GAAP), which require management to make certain estimates and assumptions at the date of the financial statements. Actual results could differ from those estimates. Subsequent events, if any, through the date that the financial statements were issued have been evaluated in the preparation of the financial statements. The following summarizes the significant accounting policies of the Fund:
Annual Report
3. Significant Accounting Policies - continued
Investment Valuation. Investments are valued as of 4:00 p.m. Eastern time on the last calendar day of the period. The Board of Trustees (the Board) has delegated the day to day responsibility for the valuation of the Fund's investments to the Fidelity Management & Research Company (FMR) Fair Value Committee (the Committee). In accordance with valuation policies and procedures approved by the Board, the Fund attempts to obtain prices from one or more third party pricing vendors or brokers to value its investments. When current market prices, quotations or currency exchange rates are not readily available or reliable, investments will be fair valued in good faith by the Committee, in accordance with procedures adopted by the Board. Factors used in determining fair value vary by investment type and may include market or investment specific events. The frequency with which these procedures are used cannot be predicted and they may be utilized to a significant extent. The Committee oversees the Fund's valuation policies and procedures and reports to the Board on the Committee's activities and fair value determinations. The Board monitors the appropriateness of the procedures used in valuing the Fund's investments and ratifies the fair value determinations of the Committee.
The Fund categorizes the inputs to valuation techniques used to value its investments into a disclosure hierarchy consisting of three levels as shown below:
Level 1 - quoted prices in active markets for identical investments
Level 2 - other significant observable inputs (including quoted prices for similar investments, interest rates, prepayment speeds, etc.)
Level 3 - unobservable inputs (including the Fund's own assumptions based on the best information available)
Valuation techniques used to value the Fund's investments by major category are as follows:
Equity securities, including restricted securities, for which market quotations are readily available, are valued at the last reported sale price or official closing price as reported by a third party pricing vendor on the primary market or exchange on which they are traded and are categorized as Level 1 in the hierarchy. In the event there were no sales during the day or closing prices are not available, securities are valued at the last quoted bid price or may be valued using the last available price and are generally categorized as Level 2 in the hierarchy. For foreign equity securities, when market or security specific events arise, comparisons to the valuation of American Depositary Receipts (ADRs), futures contracts, Exchange-Traded Funds (ETFs) and certain indexes as well as quoted prices for similar securities may be used and would be categorized as Level 2 in the hierarchy. Utilizing these techniques may result in transfers between Level 1 and Level 2.
Annual Report
Notes to Financial Statements - continued
3. Significant Accounting Policies - continued
Investment Valuation - continued
For equity securities, including restricted securities, where observable inputs are limited, assumptions about market activity and risk are used and these securities may be categorized as Level 3 in the hierarchy.
Investments in open-end mutual funds, including the Fidelity Central Funds, are valued at their closing net asset value (NAV) each business day and are categorized as Level 1 in the hierarchy.
Changes in valuation techniques may result in transfers in or out of an assigned level within the disclosure hierarchy. The aggregate value of investments by input level as of October 31, 2015, including information on transfers between Levels 1 and 2, is included at the end of the Fund's Schedule of Investments.
Foreign Currency. The Fund may use foreign currency contracts to facilitate transactions in foreign-denominated securities. Gains and losses from these transactions may arise from changes in the value of the foreign currency or if the counterparties do not perform under the contracts' terms.
Foreign-denominated assets, including investment securities, and liabilities are translated into U.S. dollars at the exchange rates at period end. Purchases and sales of investment securities, income and dividends received and expenses denominated in foreign currencies are translated into U.S. dollars at the exchange rate in effect on the transaction date.
The effects of exchange rate fluctuations on investments are included with the net realized and unrealized gain (loss) on investment securities. Other foreign currency transactions resulting in realized and unrealized gain (loss) are disclosed separately.
Investment Transactions and Income. For financial reporting purposes, the Fund's investment holdings and NAV include trades executed through the end of the last business day of the period. The NAV per share for processing shareholder transactions is calculated as of the close of business of the New York Stock Exchange (NYSE), normally 4:00 p.m. Eastern time and includes trades executed through the end of the prior business day. Gains and losses on securities sold are determined on the basis of identified cost. Dividend income is recorded on the ex-dividend date, except for certain dividends from foreign securities where the ex-dividend date may have passed, which are recorded as soon as the Fund is informed of the ex-dividend date. Non-cash dividends included in dividend income, if any, are recorded at the fair market value of the securities received. Income and capital gain distributions from Fidelity Central Funds, if any, are recorded on the ex-dividend date. Distributions received on securities that represent a return of
Annual Report
3. Significant Accounting Policies - continued
Investment Transactions and Income - continued
capital or capital gain are recorded as a reduction of cost of investments and/or as a realized gain. Subsequent to ex-dividend date the Fund determines the components of these distributions, based upon receipt of tax filings or other correspondence relating to the underlying investment. Interest income is accrued as earned and includes coupon interest and amortization of premium and accretion of discount on debt securities as applicable. Investment income is recorded net of foreign taxes withheld where recovery of such taxes is uncertain.
Class Allocations and Expenses. Investment income, realized and unrealized capital gains and losses, common expenses of the Fund, and certain fund-level expense reductions, if any, are allocated daily on a pro-rata basis to each class based on the relative net assets of each class to the total net assets of the Fund. Each class differs with respect to transfer agent and distribution and service plan fees incurred. Certain expense reductions may also differ by class. For the reporting period, the allocated portion of income and expenses to each class as a percent of its average net assets may vary due to the timing of recording these transactions in relation to fluctuating net assets of the classes. Expenses directly attributable to a fund are charged to that fund. Expenses attributable to more than one fund are allocated among the respective funds on the basis of relative net assets or other appropriate methods. Expense estimates are accrued in the period to which they relate and adjustments are made when actual amounts are known.
Income Tax Information and Distributions to Shareholders. Each year, the Fund intends to qualify as a regulated investment company under Subchapter M of the Internal Revenue Code, including distributing substantially all of its taxable income and realized gains. As a result, no provision for U.S. Federal income taxes is required. As of October 31, 2015, the Fund did not have any unrecognized tax benefits in the financial statements; nor is the Fund aware of any tax positions for which it is reasonably possible that the total amounts of unrecognized tax benefits will significantly change in the next twelve months. The Fund files a U.S. federal tax return, in addition to state and local tax returns as required. The Fund's federal income tax returns are subject to examination by the Internal Revenue Service (IRS) for a period of three fiscal years after they are filed. State and local tax returns may be subject to examination for an additional fiscal year depending on the jurisdiction. Foreign taxes are provided for based on the Fund's understanding of the tax rules and rates that exist in the foreign markets in which it invests.
Distributions are declared and recorded on the ex-dividend date. Income dividends and capital gain distributions are declared separately for each class. Income and capital gain distributions are determined in accordance with income tax regulations, which may differ from GAAP
Annual Report
Notes to Financial Statements - continued
3. Significant Accounting Policies - continued
Income Tax Information and Distributions to Shareholders - continued
Capital accounts within the financial statements are adjusted for permanent book-tax differences. These adjustments have no impact on net assets or the results of operations. Capital accounts are not adjusted for temporary book-tax differences which will reverse in a subsequent period.
Book-tax differences are primarily due to foreign currency transactions, passive foreign investment companies (PFIC), partnerships, capital loss carryforwards, and losses deferred due to wash sales.
The federal tax cost of investment securities and unrealized appreciation (depreciation) as of period end were as follows:
Gross unrealized appreciation | $ 19,037,265 |
Gross unrealized depreciation | (20,289,295) |
Net unrealized appreciation (depreciation) on securities | $ (1,252,030) |
Tax Cost | $ 294,220,119 |
The tax-based components of distributable earnings as of period end were as follows:
Undistributed ordinary income | $ 3,582,798 |
Capital loss carryforward | $ (105,982,428) |
Net unrealized appreciation (depreciation) on securities and other investments | $ (1,205,329) |
Capital loss carryforwards are only available to offset future capital gains of the Fund to the extent provided by regulations and may be limited. Under the Regulated Investment Company Modernization Act of 2010 (the Act), the Fund is permitted to carry forward capital losses incurred in taxable years beginning after December 22, 2010 for an unlimited period and such capital losses are required to be used prior to any losses that expire. The capital loss carryforward information presented below, including any applicable limitation, is estimated as of fiscal period end and is subject to adjustment.
Fiscal year of expiration | |
2016 | $ (2,663,413) |
2017 | (65,376,972) |
2018 | (3,571,319) |
2019 | (31,368,797) |
Total with expiration | $ (102,980,501) |
No expiration | |
Short-term | $ (3,001,927) |
Total capital loss carryforward | $ (105,982,428) |
The tax character of distributions paid was as follows:
| October 31, 2015 | October 31, 2014 |
Ordinary Income | 7,553,931 | 4,461,505 |
Annual Report
3. Significant Accounting Policies - continued
Short-Term Trading (Redemption) Fees. Shares held by investors in the Fund less than 30 days may have been subject to a redemption fee equal to 1.00% of the NAV of shares redeemed. All redemption fees, which reduce the proceeds of the shareholder redemption, are retained by the Fund and accounted for as an addition to paid in capital.
Delayed Delivery Transactions and When-Issued Securities. During the period, the Fund transacted in securities on a delayed delivery or when-issued basis. Payment and delivery may take place after the customary settlement period for that security. The price of the underlying securities and the date when the securities will be delivered and paid for are fixed at the time the transaction is negotiated. The securities purchased on a delayed delivery or when-issued basis are identified as such in the Fund's Schedule of Investments. With respect to purchase commitments, the Fund identifies securities as segregated in its records with a value at least equal to the amount of the commitment. Losses may arise due to changes in the value of the underlying securities or if the counterparty does not perform under the contract's terms, or if the issuer does not issue the securities due to political, economic, or other factors.
Restricted Securities. The Fund may invest in securities that are subject to legal or contractual restrictions on resale. These securities generally may be resold in transactions exempt from registration or to the public if the securities are registered. Disposal of these securities may involve time-consuming negotiations and expense, and prompt sale at an acceptable price may be difficult. Information regarding restricted securities is included at the end of the Fund's Schedule of Investments.
4. Purchases and Sales of Investments.
Purchases and sales of securities, other than short-term securities, aggregated $174,734,340 and $94,895,330, respectively.
5. Fees and Other Transactions with Affiliates.
Management Fee. Fidelity Management & Research Company (the investment adviser) and its affiliates provide the Fund with investment management related services for which the Fund pays a monthly management fee. The management fee is the sum of an individual fund fee rate that is based on an annual rate of .45% of the Fund's average net assets and an annualized group fee rate that averaged .25% during the period. The group fee rate is based upon the average net assets of all the mutual funds advised by the investment adviser, including any mutual funds previously advised by the investment adviser that are currently advised by Fidelity SelectCo, LLC, an affiliate of the investment adviser. The group fee rate decreases as assets under management increase and increases as assets under management decrease. In addition, the management fee is
Annual Report
Notes to Financial Statements - continued
5. Fees and Other Transactions with Affiliates - continued
Management Fee - continued
subject to a performance adjustment (up to a maximum of ± .20% of the Fund's average net assets over a 36 month performance period). The upward or downward adjustment to the management fee is based on the relative investment performance of International Value as compared to its benchmark index, the MSCI EAFE Value Index, over the same 36 month performance period. For the reporting period, the total annual management fee rate, including the performance adjustment, was .70% of the Fund's average net assets. The performance adjustment included in the management fee rate may be higher or lower than the maximum performance adjustment rate due to the difference between the average net assets for the reporting and performance periods.
Distribution and Service Plan Fees. In accordance with Rule 12b-1 of the 1940 Act, the Fund has adopted separate Distribution and Service Plans for each class of shares. Certain classes pay Fidelity Distributors Corporation (FDC), an affiliate of the investment adviser, separate Distribution and Service Fees, each of which is based on an annual percentage of each class' average net assets. In addition, FDC may pay financial intermediaries for selling shares of the Fund and providing shareholder support services. For the period, the Distribution and Service Fee rates, total fees and amounts retained by FDC were as follows:
| Distribution
Fee | Service
Fee | Total Fees | Retained
by FDC |
Class A | -% | .25% | $ 18,667 | $ 598 |
Class T | .25% | .25% | 19,464 | - |
Class B | .75% | .25% | 3,497 | 2,623 |
Class C | .75% | .25% | 42,205 | 7,959 |
| | | $ 83,833 | $ 11,180 |
Sales Load. FDC may receive a front-end sales charge of up to 5.75% for selling Class A shares and 3.50% for selling Class T shares, some of which is paid to financial intermediaries for selling shares of the Fund. Depending on the holding period, FDC may receive contingent deferred sales charges levied on Class A, Class T, Class B, and Class C redemptions. The deferred sales charges range from 5.00% to 1.00% for Class B shares, 1.00% for Class C shares, 1.00% for certain purchases of Class A shares and .25% for certain purchases of Class T shares.
Annual Report
5. Fees and Other Transactions with Affiliates - continued
Sales Load - continued
For the period, sales charge amounts retained by FDC were as follows:
| Retained
by FDC |
Class A | $ 6,394 |
Class T | 1,543 |
Class BA | 99 |
Class CA | 969 |
| $ 9,005 |
A When Class B and Class C shares are initially sold, FDC pays commissions from its own resources to financial intermediaries through which the sales are made.
Transfer Agent Fees. Fidelity Investments Institutional Operations Company, Inc., (FIIOC), an affiliate of the investment adviser, is the transfer, dividend disbursing and shareholder servicing agent for each class of the Fund. FIIOC receives account fees and asset-based fees that vary according to the account size and type of account of the shareholders of the respective classes of the Fund. FIIOC pays for typesetting, printing and mailing of shareholder reports, except proxy statements.
For the period, transfer agent fees for each class were as follows:
| Amount | % of
Class-Level Average
Net Assets |
Class A | $ 20,480 | .27 |
Class T | 12,140 | .31 |
Class B | 1,039 | .30 |
Class C | 12,740 | .30 |
International Value | 355,158 | .18 |
Class I | 7,106 | .29 |
| $ 408,663 | |
Accounting and Security Lending Fees. Fidelity Service Company, Inc. (FSC), an affiliate of the investment adviser, maintains the Fund's accounting records. The accounting fee is based on the level of average net assets for each month. Under a separate contract, FSC administers the security lending program. The security lending fee is based on the number and duration of lending transactions.
Brokerage Commissions. The Fund placed a portion of its portfolio transactions with brokerage firms which are affiliates of the investment adviser. Brokerage commissions are included in net realized gain (loss) and change in net unrealized appreciation (depreciation) in the Statement of Operations. The commissions paid to these affiliated firms were $227 for the period.
Annual Report
Notes to Financial Statements - continued
6. Committed Line of Credit.
The Fund participates with other funds managed by the investment adviser or an affiliate in a $4.25 billion credit facility (the "line of credit") to be utilized for temporary or emergency purposes to fund shareholder redemptions or for other short-term liquidity purposes. The Fund has agreed to pay commitment fees on its pro-rata portion of the line of credit, which amounted to $305 and is reflected in Miscellaneous expenses on the Statement of Operations. During the period, the Fund did not borrow on this line of credit.
7. Security Lending.
The Fund lends portfolio securities through a lending agent from time to time in order to earn additional income. For equity securities, a lending agent is used and may loan securities to certain qualified borrowers, including Fidelity Capital Markets (FCM), a broker-dealer affiliated with the Fund. On the settlement date of the loan, the Fund receives collateral (in the form of U.S. Treasury obligations, letters of credit and/or cash) against the loaned securities and maintains collateral in an amount not less than 100% of the market value of the loaned securities during the period of the loan. The market value of the loaned securities is determined at the close of business of the Fund and any additional required collateral is delivered to the Fund on the next business day. The Fund or borrower may terminate the loan at any time, and if the borrower defaults on its obligation to return the securities loaned because of insolvency or other reasons, the Fund may apply collateral received from the borrower against the obligation. The Fund may experience delays and costs in recovering the securities loaned. Any cash collateral received is invested in the Fidelity Securities Lending Cash Central Fund. The value of loaned securities and cash collateral at period end are disclosed on the Fund's Statement of Assets and Liabilities. Security lending income represents the income earned on investing cash collateral, less rebates paid to borrowers and any lending agent fees associated with the loan, plus any premium payments received for lending certain types of securities. Security lending income is presented in the Statement of Operations as a component of income from Fidelity Central Funds. Total security lending income during the period amounted to $112,755. During the period, there were no securities loaned to FCM.
Annual Report
8. Expense Reductions.
Commissions paid to certain brokers with whom the investment adviser, or its affiliates, places trades on behalf of the Fund include an amount in addition to trade execution, which may be rebated back to the Fund to offset certain expenses. This amount totaled $18,272 for the period.
In addition, during the period the investment adviser reimbursed and /or waived a portion of fund-level operating expenses in the amount of $841 and a portion of class-level operating expenses as follows:
| Amount |
Class A | $ 23 |
Class T | 8 |
Class B | 1 |
Class C | 8 |
International Value | 4,489 |
Class I | 13 |
| $ 4,542 |
9. Distributions to Shareholders.
Distributions to shareholders of each class were as follows:
Years ended October 31, | 2015 | 2014 |
From net investment income | | |
Class A | $ 204,314 | $ 117,558 |
Class T | 109,443 | 63,542 |
Class B | 8,373 | 6,919 |
Class C | 99,311 | 40,539 |
International Value | 7,079,700 | 3,926,459 |
Class I | 52,790 | 5,296 |
Total | $ 7,553,931 | $ 4,160,313 |
From net realized gain | | |
Class A | $ - | $ 9,681 |
Class T | - | 5,931 |
Class B | - | 1,042 |
Class C | - | 5,113 |
International Value | - | 279,037 |
Class I | - | 388 |
Total | $ - | $ 301,192 |
Annual Report
Notes to Financial Statements - continued
10. Share Transactions.
Share transactions for each class were as follows and may contain automatic conversions between classes or exchanges between funds:
| Shares | Dollars |
Years ended October 31, | 2015 | 2014 | 2015 | 2014 |
Class A | | | | |
Shares sold | 527,583 | 271,659 | $ 4,502,640 | $ 2,416,438 |
Reinvestment of distributions | 23,604 | 12,904 | 197,333 | 112,525 |
Shares redeemed | (198,812) | (245,285) | (1,665,353) | (2,196,440) |
Net increase (decrease) | 352,375 | 39,278 | $ 3,034,620 | $ 332,523 |
Class T | | | | |
Shares sold | 117,820 | 79,778 | $ 1,007,336 | $ 709,484 |
Reinvestment of distributions | 12,981 | 7,900 | 108,520 | 68,891 |
Shares redeemed | (54,747) | (88,989) | (463,119) | (796,094) |
Net increase (decrease) | 76,054 | (1,311) | $ 652,737 | $ (17,719) |
Class B | | | | |
Shares sold | 2,257 | 1,662 | $ 18,258 | $ 15,295 |
Reinvestment of distributions | 891 | 756 | 7,565 | 6,661 |
Shares redeemed | (14,741) | (30,069) | (124,607) | (270,154) |
Net increase (decrease) | (11,593) | (27,651) | $ (98,784) | $ (248,198) |
Class C | | | | |
Shares sold | 208,019 | 107,427 | $ 1,779,247 | $ 961,012 |
Reinvestment of distributions | 10,999 | 4,784 | 92,173 | 41,813 |
Shares redeemed | (96,570) | (49,408) | (802,299) | (437,003) |
Net increase (decrease) | 122,448 | 62,803 | $ 1,069,121 | $ 565,822 |
International Value | | | | |
Shares sold | 14,508,730 | 5,177,049 | $ 121,044,962 | $ 46,484,243 |
Reinvestment of distributions | 823,202 | 470,965 | 6,873,736 | 4,097,400 |
Shares redeemed | (5,350,163) | (3,570,903) | (45,687,658) | (31,830,840) |
Net increase (decrease) | 9,981,769 | 2,077,111 | $ 82,231,040 | $ 18,750,803 |
Class I | | | | |
Shares sold | 413,299 | 140,760 | $ 3,523,105 | $ 1,271,347 |
Reinvestment of distributions | 5,275 | 394 | 44,098 | 3,438 |
Shares redeemed | (332,392) | (16,367) | (2,908,565) | (146,887) |
Net increase (decrease) | 86,182 | 124,787 | $ 658,638 | $ 1,127,898 |
11. Other.
The Fund's organizational documents provide former and current trustees and officers with a limited indemnification against liabilities arising in connection with the performance of their duties to the Fund. In the normal course of business, the Fund may also enter into contracts that provide general indemnifications. The Fund's maximum exposure under these arrangements is unknown as this would be dependent on future claims that may be made against the Fund. The risk of material loss from such claims is considered remote.
Annual Report
11. Other - continued
At the end of the period, Strategic Advisers International II Fund, was the owner of record of approximately 60% of the total outstanding shares of the Fund. Mutual funds managed by the investment adviser or its affiliates were the owners of record, in the aggregate, of approximately 63% of the total outstanding shares of the Fund.
Annual Report
To the Trustees of Fidelity Investment Trust and Shareholders of Fidelity International Value Fund:
We have audited the accompanying statement of assets and liabilities of Fidelity International Value Fund (the Fund), a fund of Fidelity Investment Trust, including the schedule of investments, as of October 31, 2015, and the related statement of operations for the year then ended, the statement of changes in net assets for each of the two years in the period then ended, and the financial highlights for each of the five years in the period then ended. These financial statements and financial highlights are the responsibility of the Fund's management. Our responsibility is to express an opinion on these financial statements and financial highlights based on our audits.
We conducted our audits in accordance with the standards of the Public Company Accounting Oversight Board (United States). Those standards require that we plan and perform the audit to obtain reasonable assurance about whether the financial statements and financial highlights are free of material misstatement. The Fund is not required to have, nor were we engaged to perform, an audit of its internal control over financial reporting. Our audits included consideration of internal control over financial reporting as a basis for designing audit procedures that are appropriate in the circumstances, but not for the purpose of expressing an opinion on the effectiveness of the Fund's internal control over financial reporting. Accordingly, we express no such opinion. An audit also includes examining, on a test basis, evidence supporting the amounts and disclosures in the financial statements, assessing the accounting principles used and significant estimates made by management, as well as evaluating the overall financial statement presentation. Our procedures included confirmation of securities owned as of October 31, 2015, by correspondence with the custodians and brokers; when replies were not received from brokers, we performed other auditing procedures. We believe that our audits provide a reasonable basis for our opinion.
In our opinion, such financial statements and financial highlights referred to above present fairly, in all material respects, the financial position of Fidelity International Value Fund as of October 31, 2015, the results of its operations for the year then ended, the changes in its net assets for each of the two years in the period then ended, and the financial highlights for each of the five years in the period then ended, in conformity with accounting principles generally accepted in the United States of America.
DELOITTE & TOUCHE LLP
Boston, Massachusetts
December 17, 2015
Annual Report
The Trustees, Member of the Advisory Board, and officers of the trust and fund, as applicable, are listed below. The Board of Trustees governs the fund and is responsible for protecting the interests of shareholders. The Trustees are experienced executives who meet periodically throughout the year to oversee the fund's activities, review contractual arrangements with companies that provide services to the fund, oversee management of the risks associated with such activities and contractual arrangements, and review the fund's performance. Each of the Trustees oversees 170 funds.
The Trustees hold office without limit in time except that (a) any Trustee may resign; (b) any Trustee may be removed by written instrument, signed by at least two-thirds of the number of Trustees prior to such removal; (c) any Trustee who requests to be retired or who has become incapacitated by illness or injury may be retired by written instrument signed by a majority of the other Trustees; and (d) any Trustee may be removed at any special meeting of shareholders by a two-thirds vote of the outstanding voting securities of the trust. Each Trustee who is not an interested person (as defined in the 1940 Act) of the trust and the fund (Independent Trustee), shall retire not later than the last day of the calendar year in which his or her 75th birthday occurs. The Independent Trustees may waive this mandatory retirement age policy with respect to individual Trustees. The officers and Advisory Board Member hold office without limit in time, except that any officer and Advisory Board Member may resign or may be removed by a vote of a majority of the Trustees at any regular meeting or any special meeting of the Trustees. Except as indicated, each individual has held the office shown or other offices in the same company for the past five years.
Experience, Skills, Attributes, and Qualifications of the Fund's Trustees. The Governance and Nominating Committee has adopted a statement of policy that describes the experience, qualifications, attributes, and skills that are necessary and desirable for potential Independent Trustee candidates (Statement of Policy). The Board believes that each Trustee satisfied at the time he or she was initially elected or appointed a Trustee, and continues to satisfy, the standards contemplated by the Statement of Policy. The Governance and Nominating Committee also engages professional search firms to help identify potential Independent Trustee candidates who have the experience, qualifications, attributes, and skills consistent with the Statement of Policy. From time to time, additional criteria based on the composition and skills of the current Independent Trustees, as well as experience or skills that may be appropriate in light of future changes to board composition, business conditions, and regulatory or other developments, have also been considered by the professional search firms and the Governance and Nominating Committee. In addition, the Board takes into account the Trustees' commitment and participation in Board and committee meetings, as well as their leadership of standing and ad hoc committees throughout their tenure.
In determining that a particular Trustee was and continues to be qualified to serve as a Trustee, the Board has considered a variety of criteria, none of which, in isolation, was controlling. The Board believes that, collectively, the Trustees have balanced and diverse experience, qualifications, attributes, and skills, which allow the Board to operate effectively in governing the fund and protecting the interests of shareholders. Information about the specific experience, skills, attributes, and qualifications of each Trustee, which in each case led to the Board's conclusion that the Trustee should serve (or continue to serve) as a trustee of the fund, is provided below.
Annual Report
Board Structure and Oversight Function. James C. Curvey is an interested person (as defined in the 1940 Act) and currently serves as Chairman. The Trustees have determined that an interested Chairman is appropriate and benefits shareholders because an interested Chairman has a personal and professional stake in the quality and continuity of services provided to the fund. Independent Trustees exercise their informed business judgment to appoint an individual of their choosing to serve as Chairman, regardless of whether the Trustee happens to be independent or a member of management. The Independent Trustees have determined that they can act independently and effectively without having an Independent Trustee serve as Chairman and that a key structural component for assuring that they are in a position to do so is for the Independent Trustees to constitute a substantial majority for the Board. The Independent Trustees also regularly meet in executive session. Ned C. Lautenbach serves as Chairman of the Independent Trustees and as such (i) acts as a liaison between the Independent Trustees and management with respect to matters important to the Independent Trustees and (ii) with management prepares agendas for Board meetings.
Fidelity funds are overseen by different Boards of Trustees. The fund's Board oversees Fidelity's high income and certain equity funds, and other Boards oversee Fidelity's investment-grade bond, money market, asset allocation, and sector funds. The asset allocation funds may invest in Fidelity funds overseen by the fund's Board. The use of separate Boards, each with its own committee structure, allows the Trustees of each group of Fidelity funds to focus on the unique issues of the funds they oversee, including common research, investment, and operational issues. On occasion, the separate Boards establish joint committees to address issues of overlapping consequences for the Fidelity funds overseen by each Board.
The Trustees operate using a system of committees to facilitate the timely and efficient consideration of all matters of importance to the Trustees, the fund, and fund shareholders and to facilitate compliance with legal and regulatory requirements and oversight of the fund's activities and associated risks. The Board, acting through its committees, has charged FMR and its affiliates with (i) identifying events or circumstances the occurrence of which could have demonstrably adverse effects on the fund's business and/or reputation; (ii) implementing processes and controls to lessen the possibility that such events or circumstances occur or to mitigate the effects of such events or circumstances if they do occur; and (iii) creating and maintaining a system designed to evaluate continuously business and market conditions in order to facilitate the identification and implementation processes described in (i) and (ii) above. Because the day-to-day operations and activities of the fund are carried out by or through FMR, its affiliates and other service providers, the fund's exposure to risks is mitigated but not eliminated by the processes overseen by the Trustees. While each of the Board's committees has responsibility for overseeing different aspects of the fund's activities, oversight is exercised primarily through the Operations, Audit, and Compliance Committees. In addition, the Independent Trustees have worked with FMR to enhance the Board's oversight of investment and financial risks, legal and regulatory risks, technology risks, and operational risks, including the development of additional risk reporting to the Board. For example, a working group comprised of Independent Trustees and FMR has worked and continues to work to review the Fidelity funds' valuation-related activities, reporting and risk management. Appropriate personnel, including but not limited to the fund's Chief Compliance Officer (CCO), FMR's internal auditor, the independent accountants, the fund's Treasurer and portfolio management personnel, make periodic reports to the Board's committees, as appropriate, including an annual review of Fidelity's risk management program for the Fidelity funds. The responsibilities of each standing committee, including their oversight responsibilities, are described further under "Standing Committees of the Fund's Trustees."
Annual Report
Trustees and Officers - continued
The fund's Statement of Additional Information (SAI) includes more information about the Trustees. To request a free copy, call Fidelity at 1-877-208-0098.
Interested Trustees*:
Correspondence intended for each Trustee who is an interested person may be sent to Fidelity Investments, 245 Summer Street, Boston, Massachusetts 02210.
Name, Year of Birth; Principal Occupations and Other Relevant Experience+ |
James C. Curvey (1935) |
Year of Election or Appointment: 2007 Trustee Chairman of the Board of Trustees |
| Mr. Curvey also serves as Trustee of other Fidelity funds. Mr. Curvey is a Director of Fidelity Research & Analysis Co. (investment adviser firm, 2009-present), and Vice Chairman (2007-present) and Director of FMR LLC (diversified financial services company). In addition, Mr. Curvey serves as an Overseer for the Boston Symphony Orchestra and a member of the board of Artis-Naples, Naples, Florida, and as a Trustee for Brewster Academy, Wolfeboro, New Hampshire. Previously, Mr. Curvey served as a Director of Fidelity Investments Money Management, Inc. (investment adviser firm, 2009-2014) and a Director of FMR and FMR Co., Inc. (investment adviser firms, 2007-2014). |
Charles S. Morrison (1960) |
Year of Election or Appointment: 2014 Trustee |
| Mr. Morrison also serves as Trustee of other funds. He serves as a Director of Fidelity Investments Money Management, Inc. (FIMM) (investment adviser firm, 2014-present), Director of Fidelity SelectCo, LLC (investment adviser firm, 2014-present), President, Asset Management (2014-present), and is an employee of Fidelity Investments. Previously, Mr. Morrison served as Vice President of Fidelity's Fixed Income and Asset Allocation Funds (2012-2014), President, Fixed Income (2011-2014), Vice President of Fidelity's Money Market Funds (2005-2009), President, Money Market Group Leader of FMR (investment adviser firm, 2009), and Senior Vice President, Money Market Group of FMR (2004-2009). Mr. Morrison also served as Vice President of Fidelity's Bond Funds (2002-2005), certain Balanced Funds (2002-2005), and certain Asset Allocation Funds (2002-2007), and as Senior Vice President (2002-2005) of Fidelity's Bond Division. |
* Trustees have been determined to be "Interested Trustees" by virtue of, among other things, their affiliation with the trust or various entities under common control with FMR.
+ The information above includes each Trustee's principal occupation during the last five years and other information relating to the experience, attributes, and skills relevant to each Trustee's qualifications to serve as a Trustee, which led to the conclusion that each Trustee should serve as a Trustee for the fund.
Annual Report
Trustees and Officers - continued
Independent Trustees:
Correspondence intended for each Independent Trustee (that is, the Trustees other than the Interested Trustees) may be sent to Fidelity Investments, P.O. Box 55235, Boston, Massachusetts 02205-5235.
Name, Year of Birth; Principal Occupations and Other Relevant Experience+ |
Dennis J. Dirks (1948) |
Year of Election or Appointment: 2005 Trustee |
| Mr. Dirks also serves as Trustee of other Fidelity funds. Prior to his retirement in May 2003, Mr. Dirks was Chief Operating Officer and a member of the Board of The Depository Trust & Clearing Corporation (DTCC). He also served as President, Chief Operating Officer, and Board member of The Depository Trust Company (DTC) and President and Board member of the National Securities Clearing Corporation (NSCC). In addition, Mr. Dirks served as Chief Executive Officer and Board member of the Government Securities Clearing Corporation, Chief Executive Officer and Board member of the Mortgage-Backed Securities Clearing Corporation, as a Trustee and a member of the Finance Committee of Manhattan College (2005-2008), as a Trustee and a member of the Finance Committee of AHRC of Nassau County (2006-2008), and as a member of the Independent Directors Council (IDC) Governing Council (2010-2015). Mr. Dirks is a member of the Board of Directors for The Brookville Center for Children's Services, Inc. (2009-present). |
Alan J. Lacy (1953) |
Year of Election or Appointment: 2008 Trustee |
| Mr. Lacy also serves as Trustee of other Fidelity funds. Mr. Lacy serves as a member of the Board of Directors of Dave & Buster's Entertainment, Inc. (restaurant and entertainment complexes, 2010-present) and Bristol-Myers Squibb Company (global pharmaceuticals, 2008-present). In addition, Mr. Lacy served as Senior Adviser (2007-2014) of Oak Hill Capital Partners, L.P. (private equity) and also served as Chief Executive Officer (2000-2005) and Vice Chairman (2005-2006) of Sears Holdings Corporation and Sears, Roebuck and Co. (retail). Mr. Lacy is a member of the Board of Trustees of The National Parks Conservation Association (2006-present). Previously, Mr. Lacy served as Chairman of the Board of Trustees of the National Parks Conservation Association (2008-2011) and as a member of the Board of Directors for The Western Union Company (global money transfer, 2006-2011), The Hillman Companies, Inc. (hardware wholesalers, 2010-2014), and Earth Fare, Inc. (retail grocery, 2010-2014). |
Ned C. Lautenbach (1944) |
Year of Election or Appointment: 2000 Trustee Chairman of the Independent Trustees |
| Mr. Lautenbach also serves as Trustee of other Fidelity funds. Mr. Lautenbach currently serves as the Lead Director of the Eaton Corporation Board of Directors (diversified industrial, 1997-present). Mr. Lautenbach is Chairman of the Board of Directors of Artis-Naples in Naples, Florida (2012-present), a member of the Council on Foreign Relations (1994-present), and a member of the Board of Governors, State University System of Florida (2013-present). Previously, Mr. Lautenbach was a Partner/Advisory Partner at Clayton, Dubilier & Rice, LLC (private equity investment, 1998-2010), as well as a Director of Sony Corporation (2006-2007). |
Joseph Mauriello (1944) |
Year of Election or Appointment: 2008 Trustee |
| Mr. Mauriello also serves as Trustee of other Fidelity funds. Prior to his retirement in January 2006, Mr. Mauriello served in numerous senior management positions including Deputy Chairman and Chief Operating Officer (2004-2005), and Vice Chairman of Financial Services (2002-2004) of KPMG LLP US (professional services, 1965-2005). Mr. Mauriello currently serves as a member of the Board of Directors of XL Group plc. (global insurance and re-insurance, 2006-present) and the Independent Directors Council (IDC) Governing Council (2015-present). Previously, Mr. Mauriello served as a Director of the Hamilton Funds of the Bank of New York (2006-2007) and of Arcadia Resources Inc. (health care services and products, 2007-2012). |
Robert W. Selander (1950) |
Year of Election or Appointment: 2011 Trustee |
| Mr. Selander also serves as Trustee of other Fidelity funds. Mr. Selander serves as a Director of The Western Union Company (global money transfer, 2014-present). Previously, Mr. Selander served as a Member of the Advisory Board of other Fidelity funds (2011), and Executive Vice Chairman (2010), Chief Executive Officer (2009-2010), and President and Chief Executive Officer (1997-2009) of Mastercard, Inc. |
Cornelia M. Small (1944) |
Year of Election or Appointment: 2005 Trustee |
| Ms. Small also serves as Trustee of other Fidelity funds. Ms. Small is a member of the Board of Directors (2009-present) and Chair of the Investment Committee (2010-present) of the Teagle Foundation. Ms. Small also serves on the Investment Committee of the Berkshire Taconic Community Foundation (2008-present). Previously, Ms. Small served as Chairperson (2002-2008) and a member of the Investment Committee and Chairperson (2008-2012) and a member of the Board of Trustees of Smith College. In addition, Ms. Small served as Chief Investment Officer, Director of Global Equity Investments, and a member of the Board of Directors of Scudder, Stevens & Clark and Scudder Kemper Investments. |
William S. Stavropoulos (1939) |
Year of Election or Appointment: 2001 Trustee Vice Chairman of the Independent Trustees |
| Mr. Stavropoulos also serves as Trustee of other Fidelity funds. Mr. Stavropoulos serves as President and Founder of the Michigan Baseball Foundation, the Great Lakes Loons (2007-present). Mr. Stavropoulos is Chairman Emeritus of the Board of Directors of The Dow Chemical Company, where he previously served in numerous senior management positions, including President, CEO (1995-2000; 2002-2004), Chairman of the Executive Committee (2000-2006), and as a member of the Board of Directors (1990-2006). Currently, Mr. Stavropoulos is Chairman of the Board of Directors of Univar Inc. (global distributor of commodity and specialty chemicals), a Director of Teradata Corporation (data warehousing and technology solutions), and Maersk Inc. (industrial conglomerate), and a member of the Advisory Board for Metalmark Capital LLC (private equity investment, 2005-present). Mr. Stavropoulos is an operating advisor to Clayton, Dubilier & Rice, LLC (private equity investment). In addition, Mr. Stavropoulos is a member of the University of Notre Dame Advisory Council for the College of Science, a Trustee of the Rollin L. Gerstacker Foundation, and a Director of the Naples Philharmonic Center for the Arts. Previously, Mr. Stavropoulos served as a Director of Chemical Financial Corporation (bank holding company, 1993-2012) and Tyco International, Ltd. (multinational manufacturing and services, 2007-2012). |
David M. Thomas (1949) |
Year of Election or Appointment: 2008 Trustee |
| Mr. Thomas also serves as Trustee of other Fidelity funds. Mr. Thomas serves as Non-Executive Chairman of the Board of Directors of Fortune Brands Home and Security (home and security products, 2011-present), as a member of the Board of Directors (2004-present) and Presiding Director (2013-present) of Interpublic Group of Companies, Inc. (marketing communication), and as a member of the Board of Trustees of the University of Florida (2013-present). Previously, Mr. Thomas served as Executive Chairman (2005-2006) and Chairman and Chief Executive Officer (2000-2005) of IMS Health, Inc. (pharmaceutical and healthcare information solutions), and a Director of Fortune Brands, Inc. (consumer products, 2000-2011). |
+ The information above includes each Trustee's principal occupation during the last five years and other information relating to the experience, attributes, and skills relevant to each Trustee's qualifications to serve as a Trustee, which led to the conclusion that each Trustee should serve as a Trustee for the fund.
Advisory Board Member and Officers:
Correspondence intended for each officer and Peter S. Lynch may be sent to Fidelity Investments, 245 Summer Street, Boston, Massachusetts 02210. Officers appear below in alphabetical order.
Name, Year of Birth; Principal Occupation |
Peter S. Lynch (1944) |
Year of Election or Appointment: 2003 Member of the Advisory Board |
| Mr. Lynch also serves as Member of the Advisory Board of other Fidelity funds. Mr. Lynch is Vice Chairman and a Director of FMR (investment adviser firm) and FMR Co., Inc. (investment adviser firm). In addition, Mr. Lynch serves as a Trustee of Boston College and as the Chairman of the Inner-City Scholarship Fund. Previously, Mr. Lynch served on the Special Olympics International Board of Directors (1997-2006). |
Elizabeth Paige Baumann (1968) |
Year of Election or Appointment: 2012 Anti-Money Laundering (AML) Officer |
| Ms. Baumann also serves as AML Officer of other funds. She is Chief AML Officer of FMR LLC (diversified financial services company, 2012-present) and is an employee of Fidelity Investments. Previously, Ms. Baumann served as Vice President and Deputy Anti-Money Laundering Officer (2007-2012). |
Marc R. Bryant (1966) |
Year of Election or Appointment: 2015 Secretary and Chief Legal Officer (CLO) |
| Mr. Bryant also serves as Secretary and CLO of other funds. Mr. Bryant serves as CLO, Secretary, and Senior Vice President of Fidelity Management & Research Company (investment adviser firm, 2015-present) and FMR Co., Inc. (investment adviser firm, 2015-present); Secretary of Fidelity SelectCo, LLC (investment adviser firm, 2015-present) and Fidelity Investments Money Management, Inc. (investment adviser firm, 2015-present); and CLO of Fidelity Management & Research (Hong Kong) Limited (investment adviser firm, 2015-present). He is Senior Vice President and Deputy General Counsel of FMR LLC (diversified financial services company). Previously, Mr. Bryant served as Secretary and Chief Legal Officer of Fidelity Rutland Square Trust II (2010-2014) and Assistant Secretary of Fidelity's Fixed Income and Asset Allocation Funds (2013-2015). Prior to joining Fidelity Investments, Mr. Bryant served as a Senior Vice President and the Head of Global Retail Legal for AllianceBernstein L.P. (2006-2010), and as the General Counsel for ProFund Advisors LLC (2001-2006). |
William C. Coffey (1969) |
Year of Election or Appointment: 2009 Assistant Secretary |
| Mr. Coffey also serves as Assistant Secretary of other funds. He is Senior Vice President and Deputy General Counsel of FMR LLC (diversified financial services company, 2010-present), and is an employee of Fidelity Investments. Previously, Mr. Coffey served as Vice President and Associate General Counsel of FMR LLC (2005-2009). |
Timothy M. Cohen (1969) |
Year of Election or Appointment: 2014 Vice President of certain Equity Funds |
| Mr. Cohen also serves as Vice President of other funds. Mr. Cohen serves as Chief Compliance Officer of FMR Investment Management (U.K.) Limited (investment adviser firm, 2013-present) and is an employee of Fidelity Investments. Previously, Mr. Cohen served as a Director of FMR Investment Management (U.K.) Limited (2013-2015). |
Jonathan Davis (1968) |
Year of Election or Appointment: 2010 Assistant Treasurer |
| Mr. Davis also serves as Assistant Treasurer of other funds, and is an employee of Fidelity Investments. Previously, Mr. Davis served as Vice President and Associate General Counsel of FMR LLC (diversified financial services company, 2003-2010). |
Adrien E. Deberghes (1967) |
Year of Election or Appointment: 2008 Deputy Treasurer |
| Mr. Deberghes also serves as an officer of other funds. He is an employee of Fidelity Investments (2008-present). Prior to joining Fidelity Investments, Mr. Deberghes was Senior Vice President of Mutual Fund Administration at State Street Corporation (2007-2008), Senior Director of Mutual Fund Administration at Investors Bank & Trust (2005-2007), and Director of Finance for Dunkin' Brands (2000-2005). |
Stephanie J. Dorsey (1969) |
Year of Election or Appointment: 2010 Assistant Treasurer |
| Ms. Dorsey also serves as an officer of other funds. She is an employee of Fidelity Investments (2008-present) and has served in other fund officer roles. Prior to joining Fidelity Investments, Ms. Dorsey served as Treasurer (2004-2008) of the JPMorgan Mutual Funds and Vice President (2004-2008) of JPMorgan Chase Bank. |
Howard J. Galligan III (1966) |
Year of Election or Appointment: 2014 Chief Financial Officer |
| Mr. Galligan also serves as Chief Financial Officer of other funds. Mr. Galligan serves as President of Fidelity Pricing and Cash Management Services (FPCMS) (2014-present) and as a Director of Strategic Advisers, Inc. (investment adviser firm, 2008-present). Previously, Mr. Galligan served as Chief Administrative Officer of Asset Management (2011-2014) and Chief Operating Officer and Senior Vice President of Investment Support for Strategic Advisers, Inc. (2003-2011). |
Scott C. Goebel (1968) |
Year of Election or Appointment: 2015 Vice President |
| Mr. Goebel serves as Vice President of other funds and is an employee of Fidelity Investments (2001-present). Previously, Mr. Goebel served as Secretary of Fidelity SelectCo, LLC (investment adviser firm, 2013-2015), Fidelity Investments Money Management, Inc. (FIMM) (investment adviser firm, 2010-2015), and Fidelity Research and Analysis Company (FRAC) (investment adviser firm, 2010-2015); General Counsel, Secretary, and Senior Vice President of Fidelity Management & Research Company (investment adviser firm, 2008-2015) and FMR Co., Inc. (investment adviser firm, 2008-2015); Assistant Secretary of Fidelity Management & Research (Japan) Limited (investment adviser firm, 2008-2015) and FMR Investment Management (U.K.) Limited (investment adviser firm, 2008-2015); Chief Legal Officer (CLO) of Fidelity Management & Research (Hong Kong) Limited (investment adviser firm, 2008-2015); Secretary and CLO of certain Fidelity funds (2008-2015); Assistant Secretary of FIMM (2008-2010), FRAC (2008-2010), and certain funds (2007-2008); and as Vice President and Secretary of Fidelity Distributors Corporation (FDC) (2005-2007). |
Brian B. Hogan (1964) |
Year of Election or Appointment: 2009 Vice President |
| Mr. Hogan also serves as Trustee or Vice President of other funds. Mr. Hogan serves as a Director of Fidelity SelectCo, LLC (investment adviser firm, 2014-present) and President of the Equity Division of FMR (investment adviser firm, 2009-present). Previously, Mr. Hogan served as Senior Vice President, Equity Research of FMR (2006-2009) and as a portfolio manager. |
Chris Maher (1972) |
Year of Election or Appointment: 2013 Assistant Treasurer |
| Mr. Maher serves as Assistant Treasurer of other funds. Mr. Maher is Vice President of Valuation Oversight and is an employee of Fidelity Investments. Previously, Mr. Maher served as Vice President of Asset Management Compliance (2013), Vice President of the Program Management Group of FMR (investment adviser firm, 2010-2013), and Vice President of Valuation Oversight (2008-2010). |
Kenneth B. Robins (1969) |
Year of Election or Appointment: 2008 President and Treasurer |
| Mr. Robins also serves as an officer of other funds. Mr. Robins serves as Executive Vice President of Fidelity Investments Money Management, Inc. (FIMM) (investment adviser firm, 2013-present) and is an employee of Fidelity Investments (2004-present). Previously, Mr. Robins served in other fund officer roles. |
Stacie M. Smith (1974) |
Year of Election or Appointment: 2013 Deputy Treasurer |
| Ms. Smith also serves as an officer of other funds. She is an employee of Fidelity Investments (2009-present) and has served in other fund officer roles. Prior to joining Fidelity Investments, Ms. Smith served as Senior Audit Manager of Ernst & Young LLP (1996-2009). |
Renee Stagnone (1975) |
Year of Election or Appointment: 2013 Deputy Treasurer |
| Ms. Stagnone also serves as Deputy Treasurer of other funds. Ms. Stagnone is an employee of Fidelity Investments (1997-present). |
Linda J. Wondrack (1964) |
Year of Election or Appointment: 2014 Chief Compliance Officer |
| Ms. Wondrack also serves as Chief Compliance Officer of other funds. Ms. Wondrack is Executive Vice President and head of the Ethics Office and Asset Management Compliance for Fidelity Investments (2012- present). Ms. Wondrack also serves as Chief Compliance Officer of Fidelity SelectCo, LLC (investment adviser firm, 2014-present); Chief Compliance Officer of Impresa Management LLC (2013-present); and Chief Compliance Officer of FMR Co., Inc. (investment adviser firm), Fidelity Investments Money Management, Inc. (investment adviser firm), Fidelity Management & Research (Japan) Limited (investment adviser firm), FMR Investment Management (U.K.) Limited (investment adviser firm), Fidelity Management & Research (Hong Kong) (investment adviser firm), Fidelity Management & Research Company (investment adviser firm), FIAM LLC (investment adviser firm), and Strategic Advisers, Inc. (investment adviser firm), Ballyrock Investment Advisors LLC, and Northern Neck Investors LLC (2012-present). Previously, Ms. Wondrack served as Senior Vice President and Chief Compliance Officer for Columbia Management Investment Advisers, LLC (2005-2012); Chief Compliance Officer for certain funds within the Columbia Family of Funds (2007-2012); and Senior Vice President of Compliance Risk Management at Bank of America (2005-2010). |
Joseph F. Zambello (1957) |
Year of Election or Appointment: 2011 Deputy Treasurer |
| Mr. Zambello also serves as Deputy Treasurer of other funds. Mr. Zambello is an employee of Fidelity Investments (1991-present). Previously, Mr. Zambello served as Vice President of the Program Management Group of FMR (investment adviser firm, 2009-2011) and Vice President of the Transfer Agent Oversight Group (2005-2009). |
Annual Report
Class I designates 1% of the dividends distributed during the fiscal year as qualifying for the dividends-received deduction for corporate shareholders.
Class I designates 100% of the dividends distributed during the fiscal year as amounts which may be taken into account as a dividend for purposes of the maximum rate under section 1(h)(11) of the Internal Revenue Code.
The amounts per share which represent income derived from sources within, and taxes paid to, foreign countries or possessions of the United States are as follows:
| Pay Date | Income | Taxes |
Class I | 12/08/2014 | $0.3261 | $0.0091 |
The fund will notify shareholders in January 2016 of amounts for use in preparing 2015 income tax returns.
Annual Report
Fidelity International Value Fund
Each year, the Board of Trustees, including the Independent Trustees (together, the Board), votes on the renewal of the management contract with Fidelity Management & Research Company (FMR) and the sub-advisory agreements (together, the Advisory Contracts) for the fund. The Board, assisted by the advice of fund counsel and Independent Trustees' counsel, requests and considers a broad range of information relevant to the renewal of the Advisory Contracts throughout the year.
The Board meets regularly and, at each of its meetings, covers an extensive agenda of topics and materials and considers factors that are relevant to its annual consideration of the renewal of the fund's Advisory Contracts, including the services and support provided to the fund and its shareholders. The Board has established various standing committees (Committees), each composed of and chaired by Independent Trustees with varying backgrounds, to which the Board has assigned specific subject matter responsibilities in order to enhance effective decision-making by the Board. The Board, acting directly and through its Committees, requests and receives information concerning the annual consideration of the renewal of the fund's Advisory Contracts. The Board also meets as needed to consider matters specifically related to the Board's annual consideration of the renewal of the Advisory Contracts. Members of the Board may also meet with trustees of other Fidelity funds through ad hoc joint committees to discuss certain matters relevant to all of the Fidelity funds.
At its July 2015 meeting, the Board unanimously determined to renew the fund's Advisory Contracts. In reaching its determination, the Board considered all factors it believed relevant, including (i) the nature, extent, and quality of the services to be provided to the fund and its shareholders (including the investment performance of the fund); (ii) the competitiveness of the fund's management fee and total expense ratio relative to peer funds; (iii) the total costs of the services to be provided by and the profits to be realized by Fidelity from its relationship with the fund; and (iv) the extent to which (if any) economies of scale exist and would be realized as the fund grows, and whether any economies of scale are appropriately shared with fund shareholders.
In considering whether to renew the Advisory Contracts for the fund, the Board reached a determination, with the assistance of fund counsel and Independent Trustees' counsel and through the exercise of its business judgment, that the renewal of the Advisory Contracts was in the best interests of the fund and its shareholders and that the compensation payable under the Advisory Contracts was fair and reasonable. The Board's decision to renew the Advisory Contracts was not based on any single factor, but rather was based on a comprehensive consideration of all the information provided to the Board at its meetings throughout the year. The Board, in reaching its determination to renew the Advisory Contracts, was aware that shareholders of the fund have a broad range of investment choices available to them, including a wide choice among funds offered by Fidelity's competitors, and that the fund's shareholders, who have the opportunity to review and weigh the disclosure provided by the fund in its prospectus and other public disclosures, have chosen to invest in this fund, which is part of the Fidelity family of funds.
Annual Report
Nature, Extent, and Quality of Services Provided. The Board considered Fidelity's staffing as it relates to the fund, including the backgrounds of investment personnel of Fidelity, and also considered the fund's investment objective, strategies, and related investment philosophy. The Independent Trustees also had discussions with senior management of Fidelity's investment operations and investment groups. The Board considered the structure of the portfolio manager compensation program and whether this structure provides appropriate incentives to act in the best interests of the fund. Additionally, the Board considered the portfolio managers' investments, if any, in the funds that they manage.
Resources Dedicated to Investment Management and Support Services. The Board and the Fund Oversight and Research Committees reviewed the general qualifications and capabilities of Fidelity's investment staff, including its size, education, experience, and resources, as well as Fidelity's approach to recruiting, training, managing, and compensating investment personnel. The Board noted that Fidelity has continued to increase the resources devoted to non-U.S. offices, including expansion of Fidelity's global investment organization. The Board also noted that Fidelity's analysts have extensive resources, tools and capabilities that allow them to conduct sophisticated quantitative and fundamental analysis, as well as credit analysis of issuers, counterparties and guarantors. Further, the Board considered that Fidelity's investment professionals have sufficient access to global information and data so as to provide competitive investment results over time, and that those professionals also have access to sophisticated tools that permit them to assess portfolio construction and risk and performance attribution characteristics continuously, as well as to transmit new information and research conclusions rapidly around the world. Additionally, in its deliberations, the Board considered Fidelity's trading, risk management, and compliance capabilities and resources, which are integral parts of the investment management process.
Shareholder and Administrative Services. The Board considered (i) the nature, extent, quality, and cost of advisory, administrative, and shareholder services performed by FMR, the sub-advisers (together with FMR, the Investment Advisers), and their affiliates under the Advisory Contracts and under separate agreements covering transfer agency, pricing and bookkeeping, and securities lending services for the fund; (ii) the nature and extent of the supervision of third party service providers, principally custodians and subcustodians; and (iii) the resources devoted to, and the record of compliance with, the fund's compliance policies and procedures. The Board also reviewed the allocation of fund brokerage, including allocations to brokers affiliated with the Investment Advisers, the use of brokerage commissions to pay fund expenses, and the use of "soft" commission dollars to pay for research services.
Annual Report
Board Approval of Investment Advisory Contracts and
Management Fees - continued
The Board noted that the growth of fund assets over time across the complex allows Fidelity to reinvest in the development of services designed to enhance the value or convenience of the Fidelity funds as investment vehicles. These services include 24-hour access to account information and market information through telephone representatives and over the Internet, investor education materials and asset allocation tools, and the expanded availability of Fidelity Investor Centers.
In 2014, the Board formed an ad hoc Committee on Transfer Agency Fees to review the variety of transfer agency fee structures throughout the industry and Fidelity's competitive positioning with respect to industry participants.
Investment in a Large Fund Family. The Board considered the benefits to shareholders of investing in a Fidelity fund, including the benefits of investing in a fund that is part of a large family of funds offering a variety of investment disciplines and providing a large variety of mutual fund investor services. The Board noted that Fidelity had taken, or had made recommendations that resulted in the Fidelity funds taking, a number of actions over the previous year that benefited particular funds, including (i) continuing to dedicate additional resources to investment research and to the support of the senior management team that oversees asset management; (ii) continuing efforts to enhance Fidelity's global research capabilities; (iii) launching new funds and making other enhancements to meet client needs; (iv) reducing management fees and total expenses for certain index funds and diversified international funds; (v) continuing to launch dedicated lower cost underlying funds to meet portfolio construction needs related to expanding underlying fund options for Fidelity funds of funds, specifically for the Freedom Fund product lines; (vi) rationalizing product lines and gaining increased efficiencies through fund mergers; (vii) launching active fixed-income exchange-traded funds; (viii) continuing to develop, acquire and implement systems and technology to improve services to the funds and information security and to increase efficiency; (ix) implementing investment enhancements to further strengthen Fidelity's target date product line to increase investors' probability of success in achieving their goals; (x) modifying the eligibility criteria for certain share classes to accommodate roll-over assets from employer-sponsored retirement plans; (xi) launching a new Class W of the Freedom Index Funds to attract and retain Fidelity record-kept retirement plan assets; and (xii) implementing changes to Fidelity's money market product line in response to recent money market regulatory reforms.
Investment Performance. The Board considered whether the fund has operated in accordance with its investment objective, as well as its record of compliance with its investment restrictions and its performance history.
Annual Report
The Board took into account discussions with representatives of the Investment Advisers about fund investment performance that occur at Board meetings throughout the year. In this regard the Board noted that as part of regularly scheduled fund reviews and other reports to the Board on fund performance, the Board considers annualized return information for the fund, for different time periods, measured against a securities market index ("benchmark index") and a peer group of funds with similar objectives ("peer group"), if any. In its evaluation of fund investment performance, the Board gave particular attention to information indicating changes in performance of certain Fidelity funds for specific time periods and discussed with the Investment Advisers the reasons for any overperformance or underperformance.
In addition to reviewing absolute and relative fund performance, the Independent Trustees periodically consider the appropriateness of fund performance metrics in evaluating the results achieved. In general, the Independent Trustees believe that fund performance should be evaluated based on net performance (after fees and expenses) of both the highest performing and lowest performing fund share classes, where applicable, compared to appropriate benchmark indices, over appropriate time periods that may include full market cycles, and compared to peer groups, as applicable, over the same periods, taking into account relevant factors including the following: general market conditions; issuer-specific information; and fund cash flows and other factors.
The Independent Trustees recognize that shareholders evaluate performance on a net basis over their own holding periods, for which one-, three-, and five-year periods are often used as a proxy. For this reason, the performance information reviewed by the Board also included net cumulative calendar year total return information for the fund and an appropriate benchmark index and peer group for the most recent one-, three-, and five-year periods, as shown below. Returns are shown compared to the 25th percentile (top of box, 75% beaten) and 75th percentile (bottom of box, 25% beaten) of the peer universe. Returns of the benchmark index are "net MA," i.e., adjusted for tax withholding rates applicable to U.S.-based funds organized as Massachusetts business trusts.
Annual Report
Board Approval of Investment Advisory Contracts and
Management Fees - continued
Fidelity International Value Fund

The Board also considered that the fund's management fee is subject to upward or downward adjustment depending upon whether, and to what extent, the fund's investment performance for the performance period exceeds, or is exceeded by, a securities index, thus leading to a performance adjustment for the same period. The Board noted that the performance adjustment provides FMR with a strong economic incentive to seek to achieve superior performance for the fund's shareholders and helps to more closely align the interests of FMR and the shareholders of the fund.
Based on its review, the Board concluded that the nature, extent, and quality of services provided to the fund under the Advisory Contracts should benefit the shareholders of the fund.
Competitiveness of Management Fee and Total Expense Ratio. The Board considered the fund's management fee and total expense ratio compared to "mapped groups" of competitive funds and classes created for the purpose of facilitating the Trustees' competitive analysis of management fees and total expenses. Fidelity creates "mapped groups" by combining similar Lipper investment objective categories that have comparable investment mandates. Combining Lipper investment objective categories aids the Board's management fee and total expense ratio comparisons by broadening the competitive group used for comparison.
Management Fee. The Board considered two proprietary management fee comparisons for the 12-month periods shown in basis points (BP) in the chart below. The group of Lipper funds used by the Board for management fee comparisons is referred to below as the "Total Mapped Group." The Total Mapped Group comparison focuses on a fund's standing in terms of gross management fees before expense reimbursements or caps, and without giving effect to the fund's performance adjustment, relative to the total universe of funds with comparable investment mandates, regardless of whether their management fee structures also are comparable. Funds with comparable investment mandates offer exposure to similar types of securities. Funds with comparable management fee structures have similar management fee contractual arrangements (e.g., flat rate charged for advisory services, all-inclusive fee rate, etc.). "TMG %" represents the percentage of funds in the Total Mapped Group that had management fees that were lower than the fund's. For example, a hypothetical TMG % of 20% would mean that 80% of the funds in the Total Mapped Group had higher, and 20% had lower, management fees than the fund. The fund's actual TMG %s and the number of funds in the Total Mapped Group are in the chart below. The "Asset-Size Peer Group" (ASPG) comparison focuses on a fund's standing relative to a subset of non-Fidelity funds within the Total Mapped Group that are similar in size and management fee structure without taking into account performance adjustments, if any. For example, if a fund is in the first quartile of the ASPG, the fund's management fee ranks in the least expensive or lowest 25% of funds in the ASPG. The ASPG represents at least 15% of the funds in the Total Mapped Group with comparable asset size and management fee structures, subject to a minimum of 50 funds (or all funds in the Total Mapped Group if fewer than 50). Additional information, such as the ASPG quartile in which the fund's management fee rate ranked and the impact of the fund's performance adjustment, is also included in the chart and considered by the Board.
Annual Report
Fidelity International Value Fund
Annual Report
Board Approval of Investment Advisory Contracts and
Management Fees - continued
The Board noted that the fund's management fee rate ranked below the median of its Total Mapped Group and below the median of its ASPG for 2014. The Board also noted the effect of the fund's performance adjustment, if any, on the fund's management fee ranking.
The Board noted that, in 2014, the ad hoc Committee on Group Fee was formed by it and other Fidelity fund boards to conduct an in-depth review of the "group fee" component of the management fee of funds with such management fee structures. Committee focus included the mechanics of the group fee, the competitive landscape of group fee structures, Fidelity funds with no group fee component and investment products not included in group fee assets. The Board also considered that, for funds subject to the group fee, FMR agreed to voluntarily waive fees over a specified period of time in amounts designed to account for assets converted from certain funds to certain collective investment trusts.
The Board also noted that, in 2013, the ad hoc Committee on Management Fees was formed to conduct an in-depth review of the management fee rates of Fidelity's active equity mutual funds. The Committee focused on the following areas: (i) standard fee structures; (ii) research consumption and trading evolution; (iii) management fee competitiveness/profitability by category; and (iv) factors that drive institutional pricing.
Based on its review, the Board concluded that the fund's management fee is fair and reasonable in light of the services that the fund receives and the other factors considered.
Total Expense Ratio. In its review of each class's total expense ratio, the Board considered the fund's management fee as well as other fund or class expenses, as applicable, such as transfer agent fees, pricing and bookkeeping fees, fund-paid 12b-1 fees, and custodial, legal, and audit fees. The Board noted the impact of the fund's performance adjustment. The Board also noted that Fidelity may agree to waive fees and expenses from time to time, and the extent to which, if any, it has done so for the fund. As part of its review, the Board also considered the current and historical total expense ratios of each class of the fund compared to competitive fund median expenses. Each class of the fund is compared to those funds and classes in the Total Mapped Group (used by the Board for management fee comparisons) that have a similar sales load structure.
The Board noted that the total expense ratio of each of Class A, Class B, and the retail class ranked below its competitive median for 2014, the total expense ratio of Class I ranked equal to its competitive median for 2014, and the total expense ratio of each of Class T and Class C ranked above its competitive median for 2014. The Board considered that, in general, various factors can affect total expense ratios. The Board noted that the total expense ratio of Class T was above the competitive median primarily because of higher 12b-1 fees on Class T as compared to most competitor funds. Class T has a higher 12b-1 fee, but a lower front-end sales charge, than traditionally priced front-end sales charge classes. The Board considered that Class T is primarily sold load-waived in the retirement plan market where its 0.50% 12b-1 fee is comparable to competing no-load, higher 12b-1 fee classes designed specifically for retirement plans. The Board noted that the fund offers multiple classes, each of which has a different sales load and 12b-1 fee structure, and that the multiple structures are intended to offer a range of pricing options for the intermediary market. The Board also noted that the total expense ratios of the classes vary primarily by the level of their 12b-1 fees, although differences in transfer agent fees may also cause expenses to vary from class to class.
Annual Report
Fees Charged to Other Fidelity Clients. The Board also considered Fidelity fee structures and other information with respect to clients of Fidelity, such as other funds advised or subadvised by Fidelity, pension plan clients, and other institutional clients with similar mandates. The Board noted the findings of the 2013 ad hoc joint committee (created with the board of other Fidelity funds), which reviewed and compared Fidelity's institutional investment advisory business with its business of providing services to the Fidelity funds, including the differences in services provided, fees charged, and costs incurred, as well as competition in their respective marketplaces.
Based on its review of total expense ratios and fees charged to other Fidelity clients, the Board concluded that, although in some cases above the median of the universe presented for comparison, the total expense ratio of each class of the fund was reasonable in light of the services that the fund and its shareholders receive and the other factors considered.
Costs of the Services and Profitability. The Board considered the revenues earned and the expenses incurred by Fidelity in conducting the business of developing, marketing, distributing, managing, administering and servicing the fund and servicing the fund's shareholders. The Board also considered the level of Fidelity's profits in respect of all the Fidelity funds.
On an annual basis, Fidelity presents to the Board information about the profitability of its relationship with the fund. Fidelity calculates profitability information for each fund, as well as aggregate profitability information for groups of Fidelity funds and all Fidelity funds, using a series of detailed revenue and cost allocation methodologies which originate with the books and records of Fidelity on which Fidelity's audited financial statements are based. The Audit Committee of the Board reviews any significant changes from the prior year's methodologies.
PricewaterhouseCoopers LLP (PwC), independent registered public accounting firm and auditor to Fidelity and certain Fidelity funds, has been engaged annually by the Board as part of the Board's assessment of Fidelity's profitability analysis. PwC's engagement includes the review and assessment of the methodologies used by Fidelity in determining the revenues and expenses attributable to Fidelity's mutual fund business, and completion of agreed-upon procedures in respect of the mathematical accuracy of fund profitability and its conformity to established allocation methodologies. After considering PwC's reports issued under the engagement and information provided by Fidelity, the Board concluded that while other allocation methods may also be reasonable, Fidelity's profitability methodologies are reasonable in all material respects.
Annual Report
Board Approval of Investment Advisory Contracts and
Management Fees - continued
The Board also reviewed Fidelity's non-fund businesses and fall-out benefits related to the mutual fund business as well as cases where Fidelity's affiliates may benefit from or be related to the fund's business.
The Board considered the costs of the services provided by and the profits realized by Fidelity in connection with the operation of the fund and was satisfied that the profitability was not excessive.
Economies of Scale. The Board considered whether there have been economies of scale in respect of the management of the Fidelity funds, whether the Fidelity funds (including the fund) have appropriately benefited from any such economies of scale, and whether there is potential for realization of any further economies of scale. The Board considered the extent to which the fund will benefit from economies of scale as assets grow through increased services to the fund, through waivers or reimbursements, or through fee or expense ratio reductions. The Board also noted that in 2013, it and the boards of other Fidelity funds created an ad hoc committee (the Economies of Scale Committee) to analyze whether Fidelity attains economies of scale in respect of the management and servicing of the Fidelity funds, whether the Fidelity funds have appropriately benefited from such economies of scale, and whether there is potential for realization of any further economies of scale.
The Board recognized that the fund's management contract incorporates a "group fee" structure, which provides for lower group fee rates as total group assets increase, and for higher group fee rates as total group assets decrease (with "group assets" defined to include fund assets under FMR's management plus sector fund assets previously under FMR's management and currently managed by Fidelity SelectCo, LLC). FMR calculates the group fee rates based on a tiered asset "breakpoint" schedule that varies based on asset class. The Board considered that the group fee is designed to deliver the benefits of economies of scale to fund shareholders when total Fidelity fund assets increase, even if assets of any particular fund are unchanged or have declined, because some portion of Fidelity's costs are attributable to services provided to all Fidelity funds, and all funds benefit if those costs can be allocated among more assets. The Board concluded that, given the group fee structure, fund shareholders will benefit from lower management fees as group assets increase at the fund complex level, regardless of whether Fidelity achieves any such economies of scale.
The Board concluded, taking into account the analysis of the Economies of Scale Committee, that economies of scale, if any, are being appropriately shared between fund shareholders and Fidelity.
Annual Report
Additional Information Requested by the Board. In order to develop fully the factual basis for consideration of the Fidelity funds' Advisory Contracts, the Board requested and received additional information on certain topics, including: (i) fund performance trends and Fidelity's long-term strategies for certain funds; (ii) the various share classes employed by Fidelity and the attributes of each class, together with similar information on the distribution and servicing payments made by Fidelity or the funds to third-party participants in the distribution channels; (iii) fund profitability, and fund performance in relation to fund profitability; (iv) the methodology with respect to evaluating competitive fund data and peer group classifications and fee comparisons; (v) annual fund profitability margins, with particular focus on certain funds with negative margins; (vi) the realization of fall-out benefits in certain Fidelity business units; (vii) economies of scale and the way in which they are shared with fund shareholders; (viii) Fidelity's group fee structures, including the group fee schedule of breakpoints; (ix) the impact of cost containment measures on the funds; and (x) the transfer agent fee structure.
Based on its evaluation of all of the conclusions noted above, and after considering all factors it believed relevant, the Board concluded that the advisory fee structures are fair and reasonable, and that the fund's Advisory Contracts should be renewed.
Annual Report
Investment Adviser
Fidelity Management & Research Company
Boston, MA
Investment Sub-Advisers
FMR Co., Inc.
FMR Investment Management
(U.K.) Limited
Fidelity Management & Research
(Hong Kong) Limited
Fidelity Management & Research
(Japan) Limited
FIL Investment Advisors
FIL Investment Advisors (UK) Limited
FIL Investments (Japan) Limited
General Distributor
Fidelity Distributors Corporation
Smithfield, RI
Transfer and Service Agents
Fidelity Investments Institutional Operations Company, Inc.
Boston, MA
Fidelity Service Company, Inc.
Boston, MA
Custodian
The Northern Trust Company
Chicago, IL
(Fidelity Investment logo)(registered trademark)
AFIVI-UANN-1215
1.827488.109
ContentsPerformance: The Bottom LineManagement's Discussion of Fund PerformanceShareholder Expense ExampleInvestment Changes (Unaudited)Investments October 31, 2015Financial StatementsNotes to Financial StatementsReport of Independent Registered Public Accounting FirmTrustees and OfficersDistributions (Unaudited)Board Approval of Investment Advisory Contracts and Management FeesContentsPerformance: The Bottom LineManagement's Discussion of Fund PerformanceShareholder Expense ExampleInvestment Changes (Unaudited)Investments October 31, 2015Financial StatementsNotes to Financial StatementsReport of Independent Registered Public Accounting FirmTrustees and OfficersDistributions (Unaudited)Board Approval of Investment Advisory Contracts and Management FeesContentsPerformance: The Bottom LineManagement's Discussion of Fund PerformanceShareholder Expense ExampleInvestment Changes (Unaudited)Investments October 31, 2015Financial StatementsNotes to Financial StatementsReport of Independent Registered Public Accounting FirmTrustees and OfficersDistributions (Unaudited)Board Approval of Investment Advisory Contracts and Management Fees
Fidelity®
Global Commodity Stock
Fund
Annual Report
October 31, 2015
(Fidelity Cover Art)
Contents
Performance | (Click Here) | How the fund has done over time. |
Management's Discussion of Fund Performance | (Click Here) | The Portfolio Manager's review of fund performance and strategy. |
Shareholder Expense Example | (Click Here) | An example of shareholder expenses. |
Investment Changes | (Click Here) | A summary of major shifts in the fund's investments over the past six months. |
Investments | (Click Here) | A complete list of the fund's investments with their market values. |
Financial Statements | (Click Here) | Statements of assets and liabilities, operations, and changes in net assets, as well as financial highlights. |
Notes | (Click Here) | Notes to the financial statements. |
Report of Independent Registered Public Accounting Firm | (Click Here) | |
Trustees and Officers | (Click Here) | |
Distributions | (Click Here) | |
Board Approval of Investment Advisory Contracts and Management Fees | (Click Here) | |
To view a fund's proxy voting guidelines and proxy voting record for the 12-month period ended June 30, visit http://www.fidelity.com/proxyvotingresults or visit the Securities and Exchange Commission's (SEC) web site at http://www.sec.gov. You may also call 1-800-544-8544 to request a free copy of the proxy voting guidelines.
Standard & Poor's, S&P and S&P 500 are registered service marks of The McGraw-Hill Companies, Inc. and have been licensed for use by Fidelity Distributors Corporation.
Other third-party marks appearing herein are the property of their respective owners.
All other marks appearing herein are registered or unregistered trademarks or service marks of FMR LLC or an affiliated company. © 2015 FMR LLC. All rights reserved.
Annual Report
This report and the financial statements contained herein are submitted for the general information of the shareholders of the fund. This report is not authorized for distribution to prospective investors in the fund unless preceded or accompanied by an effective prospectus.
A fund files its complete schedule of portfolio holdings with the SEC for the first and third quarters of each fiscal year on Form N-Q. Forms N-Q are available on the SEC's web site at http://www.sec.gov. A fund's Forms N-Q may be reviewed and copied at the SEC's Public Reference Room in Washington, DC. Information regarding the operation of the SEC's Public Reference Room may be obtained by calling 1-800-SEC-0330. For a complete list of a fund's portfolio holdings, view the most recent holdings listing, semiannual report, or annual report on Fidelity's web site at http://www.fidelity.com, http://www.advisor.fidelity.com, or http://www.401k.com, as applicable.
NOT FDIC INSURED • MAY LOSE VALUE • NO BANK GUARANTEE
Neither the fund nor Fidelity Distributors Corporation is a bank.
Annual Report
Average annual total return reflects the change in the value of an investment, assuming reinvestment of the class' distributions from dividend income and capital gains (the profits earned upon the sale of securities that have grown in value, if any) and assuming a constant rate of performance each year. The $10,000 table and the fund's returns do not reflect the deduction of taxes that a shareholder would pay on fund distributions or the redemption of fund shares. During periods of reimbursement by Fidelity, a fund's total return will be greater than it would be had the reimbursement not occurred. How a fund did yesterday is no guarantee of how it will do tomorrow.
Average Annual Total Returns
Periods ended October 31, 2015 | Past 1
year | Past 5
years | Life of
fund A |
Fidelity® Global Commodity Stock Fund | -22.97% | -7.28% | 1.17% |
A From March 25, 2009.
$10,000 Over Life of Fund
Let's say hypothetically that $10,000 was invested in Fidelity® Global Commodity Stock Fund, a class of the fund, on March 25, 2009, when the fund started. The chart shows how the value of your investment would have changed, and also shows how the MSCI ACWI (All Country World Index) Index performed over the same period.
Annual Report
Market Recap: Following an August and September wherein a collapse in commodities prices hurt resources-related sectors and geographies, global equities rebounded in October to finish flat for the 12 months ending October 31, 2015. The MSCI ACWI (All Country World Index) Index returned 0.35% for the period. Commodity producers remained under pressure for much of the past year, largely related to economic deceleration in China (-1%), the world's second-largest economy and a leading consumer of raw materials. This effect was exacerbated by the strength of the U.S. dollar relative to global currencies, which weighed on commodities priced in dollars and acutely impacted equity returns within regions most exposed to resources prices. For example, the emerging-markets group returned -15% this period. Canada, a significant energy producer, returned about -17%. Conversely, net energy consumer Japan (+9%) proved the best-performing region by far. Only about a quarter of the nearly 50 countries in the index managed a gain: Israel (+17%) and fast-growing Ireland (+12%) performed best; Greece (-56%) and Brazil (-46%), among the worst. As for sectors, energy (-22%) and materials (-12%) declined sharply, while consumer discretionary (+13%) saw a gain driven largely by demand in the United States (+5%).
Comments from Portfolio Manager S. Joseph Wickwire II, CFA: For the year, the fund's share classes (excluding sales charges, if applicable) performed roughly in line with the -22.98% return of the industry benchmark, the MSCI AC World Commodity Producers Sector Capped Index. In a difficult market for commodity stocks, the fund significantly underperformed the broader global market, as measured by the MSCI ACWI (All Country World Index) Index. Versus the MSCI industry index, the fund was helped by stock picking in oil & gas exploration & production, agricultural & farm machinery, and paper packaging. Positioning in gold and fertilizers & agricultural chemicals also helped. Among individual stocks, overweighting fertilizer firms CF Industries Holdings and Agrium was additive, along with larger-than-benchmark stakes in several gold-related names. Conversely, the fund was hurt by positioning in the paper products industry and its stake in coal firm Peabody Energy, which was eliminated by period end. An out-of-benchmark stake in fertilizer firm Intrepid Potash was the fund's largest relative detractor, followed by an underweighting in Exxon Mobil.
The views expressed above reflect those of the portfolio manager(s) only through the end of the period as stated on the cover of this report and do not necessarily represent the views of Fidelity or any other person in the Fidelity organization. Any such views are subject to change at any time based upon market or other conditions and Fidelity disclaims any responsibility to update such views. These views may not be relied on as investment advice and, because investment decisions for a Fidelity fund are based on numerous factors, may not be relied on as an indication of trading intent on behalf of any Fidelity fund.
Annual Report
Shareholder Expense Example
As a shareholder of the Fund, you incur two types of costs: (1) transaction costs, including sales charges (loads) on purchase payments or redemption proceeds, redemption fees and (2) ongoing costs, including management fees, distribution and/or service (12b-1) fees and other Fund expenses. This Example is intended to help you understand your ongoing costs (in dollars) of investing in the Fund and to compare these costs with the ongoing costs of investing in other mutual funds.
The Example is based on an investment of $1,000 invested at the beginning of the period and held for the entire period (May 1, 2015 to October 31, 2015).
Actual Expenses
The first line of the accompanying table for each class of the Fund provides information about actual account values and actual expenses. You may use the information in this line, together with the amount you invested, to estimate the expenses that you paid over the period. Simply divide your account value by $1,000.00 (for example, an $8,600 account value divided by $1,000.00 = 8.6), then multiply the result by the number in the first line for a class of the Fund under the heading entitled "Expenses Paid During Period" to estimate the expenses you paid on your account during this period. A small balance maintenance fee of $12.00 that is charged once a year may apply for certain accounts with a value of less than $2,000. This fee is not included in the table below. If it was, the estimate of expenses you paid during the period would be higher, and your ending account value lower, by this amount. In addition, the Fund, as a shareholder in the underlying Fidelity Central Funds, will indirectly bear its pro-rata share of the fees and expenses incurred by the underlying Fidelity Central Funds. These fees and expenses are not included in the Fund's annualized expense ratio used to calculate the expense estimate in the table below.
Hypothetical Example for Comparison Purposes
The second line of the accompanying table for each class of the Fund provides information about hypothetical account values and hypothetical expenses based on a Class' actual expense ratio and an assumed rate of return of 5% per year before expenses, which is not the Class' actual return. The hypothetical account values and expenses may not be used to estimate the actual ending account balance or expenses you paid for the period. You may use this information to compare the ongoing costs of investing in the Fund and other funds. To do so, compare this 5% hypothetical example with the 5% hypothetical examples that appear in the shareholder reports of the other funds. A small balance maintenance fee of $12.00 that is charged once a year may apply for certain accounts with a value of less than $2,000. This fee is not included in the table below. If it was, the estimate of expenses you paid during the period would be higher, and your ending account value lower, by this amount. In addition, the Fund, as a shareholder in the underlying Fidelity Central Funds, will indirectly bear its pro-rata share of the fees and expenses incurred by the underlying Fidelity Central Funds. These fees and expenses are not included in the Fund's annualized expense ratio used to calculate the expense estimate in the table below.
Please note that the expenses shown in the table are meant to highlight your ongoing costs only and do not reflect any transaction costs. Therefore, the second line of the table is useful in comparing ongoing costs only, and will not help you determine the relative total costs of owning different funds. In addition, if these transactional costs were included, your costs would have been higher.
Annual Report
| Annualized
Expense RatioB | Beginning
Account Value
May 1, 2015 | Ending
Account Value
October 31, 2015 | Expenses Paid
During PeriodC
May 1, 2015 to
October 31, 2015 |
Class A | 1.33% | | | |
Actual | | $ 1,000.00 | $ 782.10 | $ 5.97 |
HypotheticalA | | $ 1,000.00 | $ 1,018.50 | $ 6.77 |
Class T | 1.61% | | | |
Actual | | $ 1,000.00 | $ 781.00 | $ 7.23 |
HypotheticalA | | $ 1,000.00 | $ 1,017.09 | $ 8.19 |
Class B | 2.10% | | | |
Actual | | $ 1,000.00 | $ 779.50 | $ 9.42 |
HypotheticalA | | $ 1,000.00 | $ 1,014.62 | $ 10.66 |
Class C | 2.10% | | | |
Actual | | $ 1,000.00 | $ 779.30 | $ 9.42 |
HypotheticalA | | $ 1,000.00 | $ 1,014.62 | $ 10.66 |
Global Commodity Stock | 1.10% | | | |
Actual | | $ 1,000.00 | $ 783.40 | $ 4.94 |
HypotheticalA | | $ 1,000.00 | $ 1,019.66 | $ 5.60 |
Class I | 1.06% | | | |
Actual | | $ 1,000.00 | $ 783.40 | $ 4.76 |
HypotheticalA | | $ 1,000.00 | $ 1,019.86 | $ 5.40 |
A 5% return per year before expenses
B Annualized expense ratio reflects expenses net of applicable fee waivers.
C Expenses are equal to each Class' annualized expense ratio, multiplied by the average account value over the period, multiplied by 184/365 (to reflect the one-half year period).
Annual Report
Investment Changes (Unaudited)
Annual Report
Investments October 31, 2015
Showing Percentage of Net Assets
Common Stocks - 99.1% |
| Shares | | Value |
AEROSPACE & DEFENSE - 0.3% |
Aerospace & Defense - 0.3% |
Rolls-Royce Group PLC | 67,900 | | $ 718,010 |
CHEMICALS - 30.5% |
Commodity Chemicals - 0.3% |
LyondellBasell Industries NV Class A | 7,600 | | 706,116 |
Diversified Chemicals - 0.6% |
Eastman Chemical Co. | 19,200 | | 1,385,664 |
Fertilizers & Agricultural Chemicals - 29.6% |
Agrium, Inc. | 95,100 | | 8,847,442 |
CF Industries Holdings, Inc. | 115,560 | | 5,866,981 |
Intrepid Potash, Inc. (a) | 570,800 | | 2,203,288 |
K&S AG | 45,900 | | 1,158,629 |
Monsanto Co. | 170,000 | | 15,847,392 |
Potash Corp. of Saskatchewan, Inc. | 554,600 | | 11,231,117 |
Sociedad Quimica y Minera de Chile SA (PN-B) sponsored ADR | 165,200 | | 3,201,576 |
Syngenta AG (Switzerland) | 25,297 | | 8,499,044 |
The Mosaic Co. | 267,759 | | 9,047,577 |
Yara International ASA | 52,400 | | 2,378,637 |
| | 68,281,683 |
TOTAL CHEMICALS | | 70,373,463 |
CONSTRUCTION MATERIALS - 0.2% |
Construction Materials - 0.2% |
West China Cement Ltd. | 2,914,000 | | 500,991 |
CONTAINERS & PACKAGING - 1.3% |
Paper Packaging - 1.3% |
WestRock Co. | 54,359 | | 2,922,340 |
ELECTRICAL EQUIPMENT - 0.6% |
Electrical Components & Equipment - 0.6% |
Eaton Corp. PLC | 19,000 | | 1,062,290 |
SolarCity Corp. (a)(d) | 14,700 | | 435,855 |
| | 1,498,145 |
ENERGY EQUIPMENT & SERVICES - 0.9% |
Oil & Gas Equipment & Services - 0.9% |
Amec Foster Wheeler PLC | 52,381 | | 574,136 |
Ezion Holdings Ltd. | 1,199,700 | | 597,331 |
Common Stocks - continued |
| Shares | | Value |
ENERGY EQUIPMENT & SERVICES - CONTINUED |
Oil & Gas Equipment & Services - continued |
SBM Offshore NV (a)(d) | 33,900 | | $ 464,672 |
Schlumberger Ltd. | 6,300 | | 492,408 |
| | 2,128,547 |
FOOD PRODUCTS - 2.6% |
Agricultural Products - 2.6% |
Archer Daniels Midland Co. | 39,100 | | 1,785,306 |
Bunge Ltd. | 9,700 | | 707,712 |
Darling International, Inc. (a) | 86,600 | | 876,392 |
First Resources Ltd. | 834,000 | | 1,117,200 |
Golden Agri-Resources Ltd. | 2,314,000 | | 642,187 |
PT Charoen Pokphand Indonesia Tbk | 1,920,700 | | 349,184 |
SLC Agricola SA | 101,100 | | 451,425 |
| | 5,929,406 |
INDEPENDENT POWER AND RENEWABLE ELECTRICITY PRODUCERS - 0.7% |
Independent Power Producers & Energy Traders - 0.5% |
China Resources Power Holdings Co. Ltd. | 224,000 | | 506,726 |
Dynegy, Inc. (a) | 30,800 | | 598,444 |
| | 1,105,170 |
Renewable Electricity - 0.2% |
NextEra Energy Partners LP | 19,600 | | 514,696 |
TOTAL INDEPENDENT POWER AND RENEWABLE ELECTRICITY PRODUCERS | | 1,619,866 |
MACHINERY - 2.5% |
Agricultural & Farm Machinery - 1.4% |
AGCO Corp. | 15,700 | | 759,723 |
Deere & Co. | 25,100 | | 1,957,800 |
Jain Irrigation Systems Ltd. | 579,003 | | 545,623 |
| | 3,263,146 |
Construction Machinery & Heavy Trucks - 0.3% |
Manitowoc Co., Inc. (d) | 48,700 | | 745,110 |
Industrial Machinery - 0.8% |
Andritz AG | 23,200 | | 1,168,444 |
The Weir Group PLC | 36,500 | | 600,384 |
| | 1,768,828 |
TOTAL MACHINERY | | 5,777,084 |
Common Stocks - continued |
| Shares | | Value |
METALS & MINING - 25.9% |
Aluminum - 0.9% |
Alcoa, Inc. | 183,600 | | $ 1,639,548 |
Norsk Hydro ASA | 132,900 | | 476,019 |
| | 2,115,567 |
Diversified Metals & Mining - 13.6% |
Anglo American PLC (United Kingdom) | 226,551 | | 1,900,700 |
BHP Billiton PLC | 672,746 | | 10,753,200 |
Boliden AB | 37,700 | | 721,915 |
First Quantum Minerals Ltd. | 103,824 | | 554,215 |
Freeport-McMoRan, Inc. | 105,100 | | 1,237,027 |
Glencore Xstrata PLC | 1,482,334 | | 2,570,812 |
Grupo Mexico SA de CV Series B | 470,111 | | 1,145,266 |
Ivanhoe Mines Ltd. (a) | 1,036,000 | | 554,604 |
Ivanhoe Mines Ltd. Class A warrants 12/10/15 (a)(e) | 422,500 | | 1,616 |
MMC Norilsk Nickel PJSC sponsored ADR | 30,700 | | 455,895 |
Rio Tinto PLC | 272,287 | | 9,923,574 |
South32 Ltd. (a) | 635,336 | | 657,900 |
Teck Resources Ltd. Class B (sub. vtg.) | 78,900 | | 462,201 |
Vedanta Ltd. (a) | 343,066 | | 521,572 |
| | 31,460,497 |
Gold - 5.8% |
Acacia Mining PLC | 20,000 | | 59,506 |
Agnico Eagle Mines Ltd. (Canada) | 35,600 | | 1,006,253 |
Argonaut Gold, Inc. (a) | 510,400 | | 526,950 |
B2Gold Corp. (a) | 1,488,180 | | 1,604,721 |
Barrick Gold Corp. | 187,900 | | 1,444,169 |
Continental Gold, Inc. (a) | 374,900 | | 467,335 |
Eldorado Gold Corp. | 127,150 | | 444,383 |
Franco-Nevada Corp. | 17,600 | | 892,652 |
Goldcorp, Inc. | 144,310 | | 1,846,365 |
New Gold, Inc. (a) | 177,700 | | 440,309 |
Newcrest Mining Ltd. (a) | 52,027 | | 453,221 |
Newmont Mining Corp. | 85,000 | | 1,654,100 |
Premier Gold Mines Ltd. (a) | 254,100 | | 466,381 |
Randgold Resources Ltd. sponsored ADR | 15,100 | | 1,009,737 |
Royal Gold, Inc. | 10,400 | | 497,536 |
Torex Gold Resources, Inc. (a) | 513,700 | | 487,143 |
| | 13,300,761 |
Common Stocks - continued |
| Shares | | Value |
METALS & MINING - CONTINUED |
Precious Metals & Minerals - 0.3% |
Impala Platinum Holdings Ltd. (a) | 60,500 | | $ 165,338 |
Tahoe Resources, Inc. | 59,000 | | 492,719 |
| | 658,057 |
Silver - 0.4% |
Silver Wheaton Corp. | 72,900 | | 990,695 |
Steel - 4.9% |
Aperam (a) | 15,200 | | 469,599 |
ArcelorMittal SA Class A unit (d) | 181,300 | | 1,017,093 |
Hitachi Metals Ltd. | 5,400 | | 61,160 |
Hyundai Steel Co. | 13,323 | | 607,941 |
JFE Holdings, Inc. | 47,300 | | 743,581 |
Nippon Steel & Sumitomo Metal Corp. | 118,000 | | 2,392,161 |
Nucor Corp. | 46,600 | | 1,971,180 |
POSCO | 11,061 | | 1,776,050 |
Steel Dynamics, Inc. | 26,400 | | 487,608 |
SunCoke Energy Partners LP | 49,700 | | 525,826 |
Thyssenkrupp AG | 63,200 | | 1,274,939 |
| | 11,327,138 |
TOTAL METALS & MINING | | 59,852,715 |
MULTI-UTILITIES - 0.3% |
Multi-Utilities - 0.3% |
E.ON AG | 66,804 | | 704,726 |
OIL, GAS & CONSUMABLE FUELS - 28.2% |
Coal & Consumable Fuels - 0.3% |
Cameco Corp. | 35,600 | | 504,215 |
Coal India Ltd. | 55,487 | | 270,828 |
| | 775,043 |
Integrated Oil & Gas - 13.2% |
BG Group PLC | 28,800 | | 454,998 |
BP PLC | 798,500 | | 4,745,480 |
Chevron Corp. | 96,000 | | 8,724,480 |
China Petroleum & Chemical Corp. (H Shares) | 682,000 | | 491,616 |
Exxon Mobil Corp. | 5,700 | | 471,618 |
Lukoil PJSC sponsored ADR | 29,900 | | 1,085,370 |
Occidental Petroleum Corp. | 6,600 | | 491,964 |
Royal Dutch Shell PLC Class A (United Kingdom) | 172,300 | | 4,498,301 |
Statoil ASA | 67,100 | | 1,084,623 |
Common Stocks - continued |
| Shares | | Value |
OIL, GAS & CONSUMABLE FUELS - CONTINUED |
Integrated Oil & Gas - continued |
Suncor Energy, Inc. | 101,632 | | $ 3,024,244 |
Total SA | 104,400 | | 5,048,663 |
YPF SA Class D sponsored ADR | 24,700 | | 527,592 |
| | 30,648,949 |
Oil & Gas Exploration & Production - 14.5% |
Anadarko Petroleum Corp. | 51,200 | | 3,424,256 |
Apache Corp. | 33,300 | | 1,569,429 |
Cabot Oil & Gas Corp. | 78,700 | | 1,708,577 |
California Resources Corp. | 160,200 | | 647,208 |
Canadian Natural Resources Ltd. | 53,000 | | 1,228,939 |
Cimarex Energy Co. | 4,400 | | 519,464 |
CNOOC Ltd. sponsored ADR | 14,900 | | 1,693,832 |
Cobalt International Energy, Inc. (a) | 136,100 | | 1,043,887 |
ConocoPhillips Co. | 64,200 | | 3,425,070 |
Continental Resources, Inc. (a) | 30,300 | | 1,027,473 |
Devon Energy Corp. | 43,600 | | 1,828,148 |
Encana Corp. | 111,400 | | 847,683 |
EOG Resources, Inc. | 32,600 | | 2,798,710 |
EQT Corp. | 23,400 | | 1,546,038 |
Hess Corp. | 10,200 | | 573,342 |
Marathon Oil Corp. | 58,100 | | 1,067,878 |
Memorial Resource Development Corp. (a) | 32,700 | | 578,463 |
Newfield Exploration Co. (a) | 12,400 | | 498,356 |
Noble Energy, Inc. | 47,300 | | 1,695,232 |
NOVATEK OAO GDR (Reg. S) | 8,200 | | 749,890 |
PDC Energy, Inc. (a) | 13,100 | | 790,454 |
Pioneer Natural Resources Co. | 3,610 | | 495,075 |
SM Energy Co. | 25,100 | | 837,085 |
Southwestern Energy Co. (a) | 161,700 | | 1,785,168 |
Tullow Oil PLC | 183,800 | | 574,909 |
Whiting Petroleum Corp. (a) | 27,300 | | 470,379 |
| | 33,424,945 |
Oil & Gas Storage & Transport - 0.2% |
Golar LNG Ltd. | 13,269 | | 384,934 |
TOTAL OIL, GAS & CONSUMABLE FUELS | | 65,233,871 |
PAPER & FOREST PRODUCTS - 4.2% |
Forest Products - 0.3% |
West Fraser Timber Co. Ltd. | 20,000 | | 707,709 |
Common Stocks - continued |
| Shares | | Value |
PAPER & FOREST PRODUCTS - CONTINUED |
Paper Products - 3.9% |
Fibria Celulose SA | 35,300 | | $ 481,828 |
International Paper Co. | 112,300 | | 4,794,087 |
Mondi PLC | 98,900 | | 2,293,062 |
Stora Enso Oyj (R Shares) | 57,700 | | 535,834 |
UPM-Kymmene Corp. | 44,800 | | 839,957 |
| | 8,944,768 |
TOTAL PAPER & FOREST PRODUCTS | | 9,652,477 |
REAL ESTATE INVESTMENT TRUSTS - 0.6% |
Specialized REITs - 0.6% |
Potlatch Corp. | 15,500 | | 484,220 |
Weyerhaeuser Co. | 32,400 | | 950,292 |
| | 1,434,512 |
TRADING COMPANIES & DISTRIBUTORS - 0.3% |
Trading Companies & Distributors - 0.3% |
Daewoo International Corp. | 35,906 | | 627,381 |
TOTAL COMMON STOCKS (Cost $346,268,311) |
228,973,534
|
Nonconvertible Preferred Stocks - 0.8% |
| | | |
AEROSPACE & DEFENSE - 0.0% |
Aerospace & Defense - 0.0% |
Rolls-Royce Group PLC | 6,294,330 | | 9,703 |
METALS & MINING - 0.6% |
Steel - 0.6% |
Vale SA (PN-A) sponsored ADR (d) | 399,000 | | 1,436,400 |
OIL, GAS & CONSUMABLE FUELS - 0.2% |
Integrated Oil & Gas - 0.2% |
Petroleo Brasileiro SA - Petrobras (PN) sponsored (non-vtg.) (a) | 123,600 | | 493,164 |
TOTAL NONCONVERTIBLE PREFERRED STOCKS (Cost $6,568,135) |
1,939,267
|
Money Market Funds - 1.3% |
| Shares | | Value |
Fidelity Securities Lending Cash Central Fund, 0.19% (b)(c)
(Cost $2,883,740) | 2,883,740 | | $ 2,883,740 |
TOTAL INVESTMENT PORTFOLIO - 101.2% (Cost $355,720,186) | | 233,796,541 |
NET OTHER ASSETS (LIABILITIES) - (1.2)% | | (2,771,389) |
NET ASSETS - 100% | $ 231,025,152 |
Legend |
(a) Non-income producing |
(b) Affiliated fund that is generally available only to investment companies and other accounts managed by Fidelity Investments. The rate quoted is the annualized seven-day yield of the fund at period end. A complete unaudited listing of the fund's holdings as of its most recent quarter end is available upon request. In addition, each Fidelity Central Fund's financial statements, which are not covered by the Fund's Report of Independent Registered Public Accounting Firm, are available on the SEC's website or upon request. |
(c) Investment made with cash collateral received from securities on loan. |
(d) Security or a portion of the security is on loan at period end. |
(e) Security exempt from registration under Rule 144A of the Securities Act of 1933. These securities may be resold in transactions exempt from registration, normally to qualified institutional buyers. At the end of the period, the value of these securities amounted to $1,616 or 0.0% of net assets. |
Affiliated Central Funds |
Information regarding fiscal year to date income earned by the Fund from investments in Fidelity Central Funds is as follows: |
Fund | Income earned |
Fidelity Cash Central Fund | $ 807 |
Fidelity Securities Lending Cash Central Fund | 150,371 |
Total | $ 151,178 |
Other Information |
The following is a summary of the inputs used, as of October 31, 2015, involving the Fund's assets and liabilities carried at fair value. The inputs or methodology used for valuing securities may not be an indication of the risk associated with investing in those securities. For more information on valuation inputs, and their aggregation into the levels used in the table below, please refer to the Investment Valuation section in the accompanying Notes to Financial Statements. |
Valuation Inputs at Reporting Date: |
Description | Total | Level 1 | Level 2 | Level 3 |
Investments in Securities: | | | | |
Common Stocks | $ 228,973,534 | $ 168,537,249 | $ 60,434,669 | $ 1,616 |
Nonconvertible Preferred Stocks | 1,939,267 | 1,939,267 | - | - |
Money Market Funds | 2,883,740 | 2,883,740 | - | - |
Total Investments in Securities: | $ 233,796,541 | $ 173,360,256 | $ 60,434,669 | $ 1,616 |
Distribution of investments by country or territory of incorporation, as a percentage of total net assets, is as follows (Unaudited): |
United States of America | 42.3% |
Canada | 16.9% |
United Kingdom | 16.0% |
Switzerland | 3.7% |
France | 2.2% |
Bailiwick of Jersey | 1.8% |
Norway | 1.7% |
Chile | 1.4% |
Germany | 1.4% |
Korea (South) | 1.4% |
Japan | 1.3% |
Brazil | 1.2% |
Russia | 1.0% |
Others (Individually Less Than 1%) | 7.7% |
| 100.0% |
See accompanying notes which are an integral part of the financial statements.
Annual Report
Statement of Assets and Liabilities
| | October 31, 2015 |
| | |
Assets | | |
Investment in securities, at value (including securities loaned of $2,674,064) - See accompanying schedule: Unaffiliated issuers (cost $352,836,446) | $ 230,912,801 | |
Fidelity Central Funds (cost $2,883,740) | 2,883,740 | |
Total Investments (cost $355,720,186) | | $ 233,796,541 |
Receivable for investments sold | | 2,055,645 |
Receivable for fund shares sold | | 111,112 |
Dividends receivable | | 704,389 |
Distributions receivable from Fidelity Central Funds | | 17,059 |
Prepaid expenses | | 736 |
Other receivables | | 5,526 |
Total assets | | 236,691,008 |
| | |
Liabilities | | |
Payable to custodian bank | $ 583,137 | |
Payable for investments purchased | 1,672,596 | |
Payable for fund shares redeemed | 253,324 | |
Accrued management fee | 137,667 | |
Distribution and service plan fees payable | 19,720 | |
Other affiliated payables | 66,953 | |
Other payables and accrued expenses | 48,719 | |
Collateral on securities loaned, at value | 2,883,740 | |
Total liabilities | | 5,665,856 |
| | |
Net Assets | | $ 231,025,152 |
Net Assets consist of: | | |
Paid in capital | | $ 417,503,217 |
Undistributed net investment income | | 4,650,806 |
Accumulated undistributed net realized gain (loss) on investments and foreign currency transactions | | (69,179,434) |
Net unrealized appreciation (depreciation) on investments and assets and liabilities in foreign currencies | | (121,949,437) |
Net Assets | | $ 231,025,152 |
See accompanying notes which are an integral part of the financial statements.
Annual Report
Statement of Assets and Liabilities - continued
| | October 31, 2015 |
| | |
Calculation of Maximum Offering Price | | |
Class A:
Net Asset Value and redemption price per share ($31,391,241 ÷ 3,123,473 shares) | | $ 10.05 |
| | |
Maximum offering price per share (100/94.25 of $10.05) | | $ 10.66 |
Class T:
Net Asset Value and redemption price per share ($6,335,000 ÷ 632,077 shares) | | $ 10.02 |
| | |
Maximum offering price per share (100/96.50 of $10.02) | | $ 10.38 |
Class B:
Net Asset Value and offering price per share ($864,320 ÷ 86,721 shares)A | | $ 9.97 |
| | |
Class C:
Net Asset Value and offering price per share ($11,273,614 ÷ 1,136,673 shares)A | | $ 9.92 |
| | |
Global Commodity Stock:
Net Asset Value, offering price and redemption price per share ($156,319,517 ÷ 15,497,777 shares) | | $ 10.09 |
| | |
Class I:
Net Asset Value, offering price and redemption price per share ($24,841,460 ÷ 2,462,815 shares) | | $ 10.09 |
A Redemption price per share is equal to net asset value less any applicable contingent deferred sales charge.
See accompanying notes which are an integral part of the financial statements.
Annual Report
Financial Statements - continued
Statement of Operations
| Year ended October 31, 2015 |
| | |
Investment Income | | |
Dividends | | $ 9,373,059 |
Income from Fidelity Central Funds | | 151,178 |
Income before foreign taxes withheld | | 9,524,237 |
Less foreign taxes withheld | | (486,789) |
Total income | | 9,037,448 |
| | |
Expenses | | |
Management fee | $ 1,985,858 | |
Transfer agent fees | 823,072 | |
Distribution and service plan fees | 302,688 | |
Accounting and security lending fees | 149,834 | |
Custodian fees and expenses | 54,429 | |
Independent trustees' compensation | 1,243 | |
Registration fees | 84,599 | |
Audit | 53,551 | |
Legal | 751 | |
Miscellaneous | 1,739 | |
Total expenses before reductions | 3,457,764 | |
Expense reductions | (21,513) | 3,436,251 |
Net investment income (loss) | | 5,601,197 |
Realized and Unrealized Gain (Loss) | | |
Net realized gain (loss) on: | | |
Investment securities: | | |
Unaffiliated issuers | (22,678,481) | |
Foreign currency transactions | (62,976) | |
Total net realized gain (loss) | | (22,741,457) |
Change in net unrealized appreciation (depreciation) on: Investment securities | (54,121,042) | |
Assets and liabilities in foreign currencies | (8,151) | |
Total change in net unrealized appreciation (depreciation) | | (54,129,193) |
Net gain (loss) | | (76,870,650) |
Net increase (decrease) in net assets resulting from operations | | $ (71,269,453) |
See accompanying notes which are an integral part of the financial statements.
Annual Report
Statement of Changes in Net Assets
| Year ended
October 31,
2015 | Year ended
October 31,
2014 |
Increase (Decrease) in Net Assets | | |
Operations | | |
Net investment income (loss) | $ 5,601,197 | $ 4,495,175 |
Net realized gain (loss) | (22,741,457) | (3,681,278) |
Change in net unrealized appreciation (depreciation) | (54,129,193) | (18,645,040) |
Net increase (decrease) in net assets resulting from operations | (71,269,453) | (17,831,143) |
Distributions to shareholders from net investment income | (3,898,874) | (4,765,250) |
Distributions to shareholders from net realized gain | (629,272) | (367,709) |
Total distributions | (4,528,146) | (5,132,959) |
Share transactions - net increase (decrease) | (20,805,112) | (64,489,864) |
Redemption fees | 7,987 | 7,328 |
Total increase (decrease) in net assets | (96,594,724) | (87,446,638) |
| | |
Net Assets | | |
Beginning of period | 327,619,876 | 415,066,514 |
End of period (including undistributed net investment income of $4,650,806 and undistributed net investment income of $3,567,856, respectively) | $ 231,025,152 | $ 327,619,876 |
See accompanying notes which are an integral part of the financial statements.
Annual Report
Financial Highlights - Fidelity Global Commodity Stock Fund Class A
Years ended October 31, | 2015 | 2014 | 2013 | 2012 | 2011 |
Selected Per-Share Data | | | | | |
Net asset value, beginning of period | $ 13.25 | $ 14.17 | $ 14.59 | $ 15.14 | $ 15.60 |
Income from Investment Operations | | | | | |
Net investment income (loss) C | .22 | .15 | .16 | .11 | .12 |
Net realized and unrealized gain (loss) | (3.25) | (.91) | (.45) | (.59) | (.38) |
Total from investment operations | (3.03) | (.76) | (.29) | (.48) | (.26) |
Distributions from net investment income | (.14) | (.15) | (.13) | (.05) | (.13) |
Distributions from net realized gain | (.03) | (.01) | - | (.01) | (.06) |
Total distributions | (.17) | (.16) | (.13) | (.07) H | (.20) I |
Redemption fees added to paid in capitalC,G | - | - | - | - | - |
Net asset value, end of period | $ 10.05 | $ 13.25 | $ 14.17 | $ 14.59 | $ 15.14 |
Total ReturnA, B | (23.16)% | (5.41)% | (2.00)% | (3.19)% | (1.80)% |
Ratios to Average Net AssetsD, F | | | | | |
Expenses before reductions | 1.34% | 1.35% | 1.36% | 1.34% | 1.32% |
Expenses net of fee waivers, if any | 1.34% | 1.35% | 1.35% | 1.34% | 1.32% |
Expenses net of all reductions | 1.34% | 1.35% | 1.34% | 1.33% | 1.31% |
Net investment income (loss) | 1.85% | 1.05% | 1.12% | .80% | .71% |
Supplemental Data | | | | | |
Net assets, end of period (000 omitted) | $ 31,391 | $ 51,586 | $ 71,293 | $ 99,694 | $ 127,979 |
Portfolio turnover rateE | 77% | 75% | 65% | 91% | 71% |
A Total returns would have been lower if certain expenses had not been reduced during the applicable periods shown.
B Total returns do not include the effect of the sales charges.
C Calculated based on average shares outstanding during the period.
D Fees and expenses of any underlying Fidelity Central Funds are not included in the Fund's expense ratio. The Fund indirectly bears its proportionate share of the expenses of any underlying Fidelity Central Funds.
E Amount does not include the portfolio activity of any underlying Fidelity Central Funds.
F Expense ratios reflect operating expenses of the class. Expenses before reductions do not reflect amounts reimbursed by the investment adviser or reductions from brokerage service arrangements or reductions from other expense offset arrangements and do not represent the amount paid by the class during periods when reimbursements or reductions occur. Expenses net of fee waivers reflect expenses after reimbursement by the investment adviser but prior to reductions from brokerage service arrangements or other expense offset arrangements. Expenses net of all reductions represent the net expenses paid by the class.
G Amount represents less than $.005 per share.
H Total distributions of $.07 per share is comprised of distributions from net investment income of $.052 and distributions from net realized gain of $.014 per share.
I Total distributions of $.20 per share is comprised of distributions from net investment income of $.133 and distributions from net realized gain of $.062 per share.
See accompanying notes which are an integral part of the financial statements.
Annual Report
Financial Highlights - Fidelity Global Commodity Stock Fund Class T
Years ended October 31, | 2015 | 2014 | 2013 | 2012 | 2011 |
Selected Per-Share Data | | | | | |
Net asset value, beginning of period | $ 13.21 | $ 14.13 | $ 14.54 | $ 15.08 | $ 15.55 |
Income from Investment Operations | | | | | |
Net investment income (loss) C | .19 | .11 | .12 | .08 | .07 |
Net realized and unrealized gain (loss) | (3.25) | (.90) | (.45) | (.60) | (.38) |
Total from investment operations | (3.06) | (.79) | (.33) | (.52) | (.31) |
Distributions from net investment income | (.10) | (.11) | (.08) | (.01) | (.10) |
Distributions from net realized gain | (.03) | (.01) | - | (.01) | (.06) |
Total distributions | (.13) | (.13) H | (.08) | (.02) | (.16) |
Redemption fees added to paid in capitalC,G | - | - | - | - | - |
Net asset value, end of period | $ 10.02 | $ 13.21 | $ 14.13 | $ 14.54 | $ 15.08 |
Total ReturnA, B | (23.40)% | (5.65)% | (2.26)% | (3.43)% | (2.09)% |
Ratios to Average Net AssetsD, F | | | | | |
Expenses before reductions | 1.63% | 1.62% | 1.62% | 1.61% | 1.60% |
Expenses net of fee waivers, if any | 1.63% | 1.62% | 1.61% | 1.61% | 1.60% |
Expenses net of all reductions | 1.62% | 1.62% | 1.60% | 1.60% | 1.59% |
Net investment income (loss) | 1.57% | .78% | .86% | .53% | .43% |
Supplemental Data | | | | | |
Net assets, end of period (000 omitted) | $ 6,335 | $ 9,867 | $ 12,551 | $ 16,692 | $ 20,831 |
Portfolio turnover rateE | 77% | 75% | 65% | 91% | 71% |
A Total returns would have been lower if certain expenses had not been reduced during the applicable periods shown.
B Total returns do not include the effect of the sales charges.
C Calculated based on average shares outstanding during the period.
D Fees and expenses of any underlying Fidelity Central Funds are not included in the Fund's expense ratio. The Fund indirectly bears its proportionate share of the expenses of any underlying Fidelity Central Funds.
E Amount does not include the portfolio activity of any underlying Fidelity Central Funds.
F Expense ratios reflect operating expenses of the class. Expenses before reductions do not reflect amounts reimbursed by the investment adviser or reductions from brokerage service arrangements or reductions from other expense offset arrangements and do not represent the amount paid by the class during periods when reimbursements or reductions occur. Expenses net of fee waivers reflect expenses after reimbursement by the investment adviser but prior to reductions from brokerage service arrangements or other expense offset arrangements. Expenses net of all reductions represent the net expenses paid by the class.
G Amount represents less than $.005 per share.
H Total distributions of $.13 per share is comprised of distributions from net investment income of $.113 and distributions from net realized gain of $.013 per share.
See accompanying notes which are an integral part of the financial statements.
Annual Report
Financial Highlights - Fidelity Global Commodity Stock Fund Class B
Years ended October 31, | 2015 | 2014 | 2013 | 2012 | 2011 |
Selected Per-Share Data | | | | | |
Net asset value, beginning of period | $ 13.12 | $ 14.01 | $ 14.41 | $ 15.00 | $ 15.46 |
Income from Investment Operations | | | | | |
Net investment income (loss) C | .13 | .04 | .05 | - G | (.01) |
Net realized and unrealized gain (loss) | (3.24) | (.89) | (.45) | (.59) | (.39) |
Total from investment operations | (3.11) | (.85) | (.40) | (.59) | (.40) |
Distributions from net investment income | (.02) | (.03) | - G | - | - |
Distributions from net realized gain | (.03) | (.01) | - | - | (.06) |
Total distributions | (.04) H | (.04) | - G | - | (.06) |
Redemption fees added to paid in capitalC, G | - | - | - | - | - |
Net asset value, end of period | $ 9.97 | $ 13.12 | $ 14.01 | $ 14.41 | $ 15.00 |
Total ReturnA, B | (23.76)% | (6.06)% | (2.75)% | (3.93)% | (2.62)% |
Ratios to Average Net AssetsD, F | | | | | |
Expenses before reductions | 2.13% | 2.11% | 2.11% | 2.10% | 2.11% |
Expenses net of fee waivers, if any | 2.12% | 2.11% | 2.11% | 2.10% | 2.11% |
Expenses net of all reductions | 2.12% | 2.11% | 2.10% | 2.10% | 2.10% |
Net investment income (loss) | 1.07% | .29% | .36% | .03% | (.09)% |
Supplemental Data | | | | | |
Net assets, end of period (000 omitted) | $ 864 | $ 1,584 | $ 2,303 | $ 3,097 | $ 4,324 |
Portfolio turnover rateE | 77% | 75% | 65% | 91% | 71% |
A Total returns would have been lower if certain expenses had not been reduced during the applicable periods shown.
B Total returns do not include the effect of the contingent deferred sales charge.
C Calculated based on average shares outstanding during the period.
D Fees and expenses of any underlying Fidelity Central Funds are not included in the Fund's expense ratio. The Fund indirectly bears its proportionate share of the expenses of any underlying Fidelity Central Funds.
E Amount does not include the portfolio activity of any underlying Fidelity Central Funds.
F Expense ratios reflect operating expenses of the class. Expenses before reductions do not reflect amounts reimbursed by the investment adviser or reductions from brokerage service arrangements or reductions from other expense offset arrangements and do not represent the amount paid by the class during periods when reimbursements or reductions occur. Expenses net of fee waivers reflect expenses after reimbursement by the investment adviser but prior to reductions from brokerage service arrangements or other expense offset arrangements. Expenses net of all reductions represent the net expenses paid by the class.
G Amount represents less than $.005 per share.
H Total distributions of $.04 per share is comprised of distributions from net investment income of $.016 and distributions from net realized gain of $.026 per share.
See accompanying notes which are an integral part of the financial statements.
Annual Report
Financial Highlights - Fidelity Global Commodity Stock Fund Class C
Years ended October 31, | 2015 | 2014 | 2013 | 2012 | 2011 |
Selected Per-Share Data | | | | | |
Net asset value, beginning of period | $ 13.06 | $ 13.96 | $ 14.37 | $ 14.95 | $ 15.45 |
Income from Investment Operations | | | | | |
Net investment income (loss) C | .13 | .04 | .05 | .01 | (.01) |
Net realized and unrealized gain (loss) | (3.22) | (.89) | (.44) | (.59) | (.38) |
Total from investment operations | (3.09) | (.85) | (.39) | (.58) | (.39) |
Distributions from net investment income | (.03) | (.03) | (.02) | - | (.05) |
Distributions from net realized gain | (.03) | (.01) | - | - | (.06) |
Total distributions | (.05) I | (.05) H | (.02) | - | (.11) |
Redemption fees added to paid in capitalC,G | - | - | - | - | - |
Net asset value, end of period | $ 9.92 | $ 13.06 | $ 13.96 | $ 14.37 | $ 14.95 |
Total ReturnA, B | (23.74)% | (6.13)% | (2.75)% | (3.88)% | (2.58)% |
Ratios to Average Net AssetsD, F | | | | | |
Expenses before reductions | 2.12% | 2.11% | 2.11% | 2.10% | 2.09% |
Expenses net of fee waivers, if any | 2.12% | 2.11% | 2.11% | 2.10% | 2.09% |
Expenses net of all reductions | 2.11% | 2.11% | 2.10% | 2.09% | 2.08% |
Net investment income (loss) | 1.08% | .29% | .36% | .03% | (.07)% |
Supplemental Data | | | | | |
Net assets, end of period (000 omitted) | $ 11,274 | $ 17,659 | $ 23,830 | $ 31,865 | $ 37,185 |
Portfolio turnover rateE | 77% | 75% | 65% | 91% | 71% |
A Total returns would have been lower if certain expenses had not been reduced during the applicable periods shown.
B Total returns do not include the effect of the contingent deferred sales charge.
C Calculated based on average shares outstanding during the period.
D Fees and expenses of any underlying Fidelity Central Funds are not included in the Fund's expense ratio. The Fund indirectly bears its proportionate share of the expenses of any underlying Fidelity Central Funds.
E Amount does not include the portfolio activity of any underlying Fidelity Central Funds.
F Expense ratios reflect operating expenses of the class. Expenses before reductions do not reflect amounts reimbursed by the investment adviser or reductions from brokerage service arrangements or reductions from other expense offset arrangements and do not represent the amount paid by the class during periods when reimbursements or reductions occur. Expenses net of fee waivers reflect expenses after reimbursement by the investment adviser but prior to reductions from brokerage service arrangements or other expense offset arrangements. Expenses net of all reductions represent the net expenses paid by the class.
G Amount represents less than $.005 per share.
H Total distributions of $.05 per share is comprised of distributions from net investment income of $.033 and distributions from net realized gain of $.013 per share.
I Total distributions of $.05 per share is comprised of distributions from net investment income of $.025 and distributions from net realized gain of $.026 per share.
See accompanying notes which are an integral part of the financial statements.
Annual Report
Financial Highlights - Fidelity Global Commodity Stock Fund
Years ended October 31, | 2015 | 2014 | 2013 | 2012 | 2011 |
Selected Per-Share Data | | | | | |
Net asset value, beginning of period | $ 13.31 | $ 14.24 | $ 14.66 | $ 15.21 | $ 15.66 |
Income from Investment Operations | | | | | |
Net investment income (loss) B | .25 | .19 | .19 | .15 | .16 |
Net realized and unrealized gain (loss) | (3.27) | (.92) | (.45) | (.60) | (.39) |
Total from investment operations | (3.02) | (.73) | (.26) | (.45) | (.23) |
Distributions from net investment income | (.18) | (.19) | (.16) | (.08) | (.16) |
Distributions from net realized gain | (.03) | (.01) | - | (.01) | (.06) |
Total distributions | (.20) H | (.20) | (.16) | (.10) G | (.22) |
Redemption fees added to paid in capitalB,F | - | - | - | - | - |
Net asset value, end of period | $ 10.09 | $ 13.31 | $ 14.24 | $ 14.66 | $ 15.21 |
Total ReturnA | (22.97)% | (5.16)% | (1.75)% | (2.96)% | (1.59)% |
Ratios to Average Net AssetsC, E | | | | | |
Expenses before reductions | 1.12% | 1.11% | 1.11% | 1.10% | 1.08% |
Expenses net of fee waivers, if any | 1.12% | 1.11% | 1.11% | 1.10% | 1.08% |
Expenses net of all reductions | 1.11% | 1.11% | 1.09% | 1.09% | 1.07% |
Net investment income (loss) | 2.08% | 1.29% | 1.37% | 1.04% | .95% |
Supplemental Data | | | | | |
Net assets, end of period (000 omitted) | $ 156,320 | $ 223,084 | $ 273,476 | $ 387,242 | $ 531,224 |
Portfolio turnover rateD | 77% | 75% | 65% | 91% | 71% |
A Total returns would have been lower if certain expenses had not been reduced during the applicable periods shown.
B Calculated based on average shares outstanding during the period.
C Fees and expenses of any underlying Fidelity Central Funds are not included in the Fund's expense ratio. The Fund indirectly bears its proportionate share of the expenses of any underlying Fidelity Central Funds.
D Amount does not include the portfolio activity of any underlying Fidelity Central Funds.
E Expense ratios reflect operating expenses of the class. Expenses before reductions do not reflect amounts reimbursed by the investment adviser or reductions from brokerage service arrangements or reductions from other expense offset arrangements and do not represent the amount paid by the class during periods when reimbursements or reductions occur. Expenses net of fee waivers reflect expenses after reimbursement by the investment adviser but prior to reductions from brokerage service arrangements or other expense offset arrangements. Expenses net of all reductions represent the net expenses paid by the class.
F Amount represents less than $.005 per share.
G Total distributions of $.10 per share is comprised of distributions from net investment income of $.084 and distributions from net realized gain of $.014 per share.
H Total distributions of $.20 per share is comprised of distributions from net investment income of $.178 and distributions from net realized gain of $.026 per share.
See accompanying notes which are an integral part of the financial statements.
Annual Report
Financial Highlights - Fidelity Global Commodity Stock Fund Class I
Years ended October 31, | 2015 | 2014 | 2013 | 2012 | 2011 |
Selected Per-Share Data | | | | | |
Net asset value, beginning of period | $ 13.31 | $ 14.24 | $ 14.67 | $ 15.22 | $ 15.66 |
Income from Investment Operations | | | | | |
Net investment income (loss) B | .25 | .19 | .20 | .16 | .16 |
Net realized and unrealized gain (loss) | (3.26) | (.92) | (.45) | (.60) | (.38) |
Total from investment operations | (3.01) | (.73) | (.25) | (.44) | (.22) |
Distributions from net investment income | (.19) | (.19) | (.18) | (.09) | (.16) |
Distributions from net realized gain | (.03) | (.01) | - | (.01) | (.06) |
Total distributions | (.21) H | (.20) | (.18) | (.11) G | (.22) |
Redemption fees added to paid in capitalB,F | - | - | - | - | - |
Net asset value, end of period | $ 10.09 | $ 13.31 | $ 14.24 | $ 14.67 | $ 15.22 |
Total ReturnA | (22.93)% | (5.16)% | (1.71)% | (2.90)% | (1.50)% |
Ratios to Average Net AssetsC, E | | | | | |
Expenses before reductions | 1.09% | 1.06% | 1.04% | 1.04% | 1.03% |
Expenses net of fee waivers, if any | 1.08% | 1.06% | 1.04% | 1.04% | 1.03% |
Expenses net of all reductions | 1.08% | 1.06% | 1.03% | 1.03% | 1.03% |
Net investment income (loss) | 2.11% | 1.34% | 1.43% | 1.10% | .99% |
Supplemental Data | | | | | |
Net assets, end of period (000 omitted) | $ 24,841 | $ 23,840 | $ 31,613 | $ 50,540 | $ 58,925 |
Portfolio turnover rateD | 77% | 75% | 65% | 91% | 71% |
A Total returns would have been lower if certain expenses had not been reduced during the applicable periods shown.
B Calculated based on average shares outstanding during the period.
C Fees and expenses of any underlying Fidelity Central Funds are not included in the Fund's expense ratio. The Fund indirectly bears its proportionate share of the expenses of any underlying Fidelity Central Funds.
D Amount does not include the portfolio activity of any underlying Fidelity Central Funds.
E Expense ratios reflect operating expenses of the class. Expenses before reductions do not reflect amounts reimbursed by the investment adviser or reductions from brokerage service arrangements or reductions from other expense offset arrangements and do not represent the amount paid by the class during periods when reimbursements or reductions occur. Expenses net of fee waivers reflect expenses after reimbursement by the investment adviser but prior to reductions from brokerage service arrangements or other expense offset arrangements. Expenses net of all reductions represent the net expenses paid by the class.
F Amount represents less than $.005 per share.
G Total distributions of $.11 per share is comprised of distributions from net investment income of $.093 and distributions from net realized gain of $.014 per share.
H Total distributions of $.21 per share is comprised of distributions from net investment income of $.186 and distributions from net realized gain of $.026 per share.
See accompanying notes which are an integral part of the financial statements.
Annual Report
For the period ended October 31, 2015
1. Organization.
Fidelity Global Commodity Stock Fund (the Fund) is a non-diversified fund of Fidelity Investment Trust (the Trust) and is authorized to issue an unlimited number of shares. The Trust is registered under the Investment Company Act of 1940, as amended (the 1940 Act), as an open-end management investment company organized as a Massachusetts business trust. The Fund offers Class A, Class T, Class C, Global Commodity Stock and Class I shares (formerly Institutional Class), each of which, along with Class B shares, has equal rights as to assets and voting privileges. Class B shares are closed to new accounts and additional purchases, except for exchanges and reinvestments. Each class has exclusive voting rights with respect to matters that affect that class. Class B shares will automatically convert to Class A shares after a holding period of seven years from the initial date of purchase. The Fund's investments in emerging markets can be subject to social, economic, regulatory, and political uncertainties and can be extremely volatile.
2. Investments in Fidelity Central Funds.
The Fund invests in Fidelity Central Funds, which are open-end investment companies generally available only to other investment companies and accounts managed by the investment adviser and its affiliates. The Fund's Schedule of Investments lists each of the Fidelity Central Funds held as of period end, if any, as an investment of the Fund, but does not include the underlying holdings of each Fidelity Central Fund. As an Investing Fund, the Fund indirectly bears its proportionate share of the expenses of the underlying Fidelity Central Funds.
The Money Market Central Funds seek preservation of capital and current income and are managed by Fidelity Investments Money Management, Inc. (FIMM), an affiliate of the investment adviser. Annualized expenses of the Money Market Central Funds as of their most recent shareholder report date are less than .005%.
A complete unaudited list of holdings for each Fidelity Central Fund is available upon request or at the Securities and Exchange Commission (the SEC) website at www.sec.gov. In addition, the financial statements of the Fidelity Central Funds, which are not covered by the Fund's Report of Independent Registered Public Accounting Firm, are available on the SEC website or upon request.
3. Significant Accounting Policies.
The financial statements have been prepared in conformity with accounting principles generally accepted in the United States of America (GAAP), which require management to make certain estimates and assumptions at the date of the financial statements. Actual results could differ from those estimates. Subsequent events, if any, through the date that the financial statements were issued have been evaluated in the preparation of
Annual Report
Notes to Financial Statements - continued
3. Significant Accounting Policies - continued
the financial statements. The following summarizes the significant accounting policies of the Fund:
Investment Valuation. Investments are valued as of 4:00 p.m. Eastern time on the last calendar day of the period. The Board of Trustees (the Board) has delegated the day to day responsibility for the valuation of the Fund's investments to the Fidelity Management & Research Company (FMR) Fair Value Committee (the Committee). In accordance with valuation policies and procedures approved by the Board, the Fund attempts to obtain prices from one or more third party pricing vendors or brokers to value its investments. When current market prices, quotations or currency exchange rates are not readily available or reliable, investments will be fair valued in good faith by the Committee, in accordance with procedures adopted by the Board. Factors used in determining fair value vary by investment type and may include market or investment specific events. The frequency with which these procedures are used cannot be predicted and they may be utilized to a significant extent. The Committee oversees the Fund's valuation policies and procedures and reports to the Board on the Committee's activities and fair value determinations. The Board monitors the appropriateness of the procedures used in valuing the Fund's investments and ratifies the fair value determinations of the Committee.
The Fund categorizes the inputs to valuation techniques used to value its investments into a disclosure hierarchy consisting of three levels as shown below:
Level 1 - quoted prices in active markets for identical investments
Level 2 - other significant observable inputs (including quoted prices for similar investments, interest rates, prepayment speeds, etc.)
Level 3 - unobservable inputs (including the Fund's own assumptions based on the best information available)
Valuation techniques used to value the Fund's investments by major category are as follows:
Equity securities, including restricted securities, for which market quotations are readily available, are valued at the last reported sale price or official closing price as reported by a third party pricing vendor on the primary market or exchange on which they are traded and are categorized as Level 1 in the hierarchy. In the event there were no sales during the day or closing prices are not available, securities are valued at the last quoted bid price or may be valued using the last available price and are generally categorized as Level 2 in the hierarchy. For foreign equity securities, when market or security specific events arise, comparisons to the valuation of American Depositary Receipts (ADRs),
Annual Report
3. Significant Accounting Policies - continued
Investment Valuation - continued
futures contracts, Exchange-Traded Funds (ETFs) and certain indexes as well as quoted prices for similar securities may be used and would be categorized as Level 2 in the hierarchy. Utilizing these techniques may result in transfers between Level 1 and Level 2. For equity securities, including restricted securities, where observable inputs are limited, assumptions about market activity and risk are used and these securities may be categorized as Level 3 in the hierarchy.
Investments in open-end mutual funds, including the Fidelity Central Funds, are valued at their closing net asset value (NAV) each business day and are categorized as Level 1 in the hierarchy.
Foreign Currency. The Fund may use foreign currency contracts to facilitate transactions in foreign-denominated securities. Gains and losses from these transactions may arise from changes in the value of the foreign currency or if the counterparties do not perform under the contracts' terms.
Foreign-denominated assets, including investment securities, and liabilities are translated into U.S. dollars at the exchange rates at period end. Purchases and sales of investment securities, income and dividends received and expenses denominated in foreign currencies are translated into U.S. dollars at the exchange rate in effect on the transaction date.
The effects of exchange rate fluctuations on investments are included with the net realized and unrealized gain (loss) on investment securities. Other foreign currency transactions resulting in realized and unrealized gain (loss) are disclosed separately.
Investment Transactions and Income. For financial reporting purposes, the Fund's investment holdings and NAV include trades executed through the end of the last business day of the period. The NAV per share for processing shareholder transactions is calculated as of the close of business of the New York Stock Exchange (NYSE), normally 4:00 p.m. Eastern time and includes trades executed through the end of the prior business day. Gains and losses on securities sold are determined on the basis of identified cost and may include proceeds received from litigation. Dividend income is recorded on the ex-dividend date, except for certain dividends from foreign securities where the ex-dividend date may have passed, which are recorded as soon as the Fund is informed of the ex-dividend date. Non-cash dividends included in dividend income, if any, are recorded at the fair market value of the securities received. Income and capital gain distributions from Fidelity Central Funds, if any, are recorded on the ex-dividend date. Distributions received on securities that represent a return of capital or capital gain are recorded as a reduction of cost of investments and/or as a realized gain. Subsequent to ex-dividend date the Fund determines the components of these distributions, based
Annual Report
Notes to Financial Statements - continued
3. Significant Accounting Policies - continued
Investment Transactions and Income - continued
upon receipt of tax filings or other correspondence relating to the underlying investment. Interest income is accrued as earned and includes coupon interest and amortization of premium and accretion of discount on debt securities as applicable. Investment income is recorded net of foreign taxes withheld where recovery of such taxes is uncertain.
Class Allocations and Expenses. Investment income, realized and unrealized capital gains and losses, common expenses of the Fund, and certain fund-level expense reductions, if any, are allocated daily on a pro-rata basis to each class based on the relative net assets of each class to the total net assets of the Fund. Each class differs with respect to transfer agent and distribution and service plan fees incurred. Certain expense reductions may also differ by class. For the reporting period, the allocated portion of income and expenses to each class as a percent of its average net assets may vary due to the timing of recording these transactions in relation to fluctuating net assets of the classes. Expenses directly attributable to a fund are charged to that fund. Expenses attributable to more than one fund are allocated among the respective funds on the basis of relative net assets or other appropriate methods. Expense estimates are accrued in the period to which they relate and adjustments are made when actual amounts are known.
Income Tax Information and Distributions to Shareholders. Each year, the Fund intends to qualify as a regulated investment company under Subchapter M of the Internal Revenue Code, including distributing substantially all of its taxable income and realized gains. As a result, no provision for U.S. Federal income taxes is required. As of October 31, 2015, the Fund did not have any unrecognized tax benefits in the financial statements; nor is the Fund aware of any tax positions for which it is reasonably possible that the total amounts of unrecognized tax benefits will significantly change in the next twelve months. The Fund files a U.S. federal tax return, in addition to state and local tax returns as required. The Fund's federal income tax returns are subject to examination by the Internal Revenue Service (IRS) for a period of three fiscal years after they are filed. State and local tax returns may be subject to examination for an additional fiscal year depending on the jurisdiction. Foreign taxes are provided for based on the Fund's understanding of the tax rules and rates that exist in the foreign markets in which it invests.
Distributions are declared and recorded on the ex-dividend date. Income dividends and capital gain distributions are declared separately for each class. Income and capital gain distributions are determined in accordance with income tax regulations, which may differ from GAAP. In addition, the Fund claimed a portion of the payment made to redeeming shareholders as a distribution for income tax purposes.
Capital accounts within the financial statements are adjusted for permanent book-tax differences. These adjustments have no impact on net assets or the results of operations.
Annual Report
3. Significant Accounting Policies - continued
Income Tax Information and Distributions to Shareholders - continued
Capital accounts are not adjusted for temporary book-tax differences which will reverse in a subsequent period.
Book-tax differences are primarily due to foreign currency transactions, passive foreign investment companies (PFIC), partnerships, capital loss carryforwards and losses deferred due to wash sales.
The federal tax cost of investment securities and unrealized appreciation (depreciation) as of period end were as follows:
Gross unrealized appreciation | $ 1,558,121 |
Gross unrealized depreciation | (128,064,703) |
Net unrealized appreciation (depreciation) on securities | $ (126,506,582) |
Tax Cost | $ 360,303,123 |
The tax-based components of distributable earnings as of period end were as follows:
Undistributed ordinary income | $ 4,827,284 |
Capital loss carryforward | $ (64,772,918) |
Net unrealized appreciation (depreciation) on securities and other investments | $ (126,532,429) |
Capital loss carryforwards are only available to offset future capital gains of the Fund to the extent provided by regulations and may be limited. Under the Regulated Investment Company Modernization Act of 2010 (the Act), the Fund is permitted to carry forward capital losses incurred in taxable years beginning after December 22, 2010 for an unlimited period and such capital losses are required to be used prior to any losses that expire. The capital loss carryforward information presented below, including any applicable limitation, is estimated as of prior fiscal period end and is subject to adjustment.
Fiscal year of expiration 2019 | $ (6,952,413) |
No expiration | |
Short-term | (17,522,131) |
Long-term | (40,298,374) |
Total no expiration | (57,820,505) |
Total capital loss carryforward | $ (64,772,918) |
Annual Report
Notes to Financial Statements - continued
3. Significant Accounting Policies - continued
Income Tax Information and Distributions to Shareholders - continued
The tax character of distributions paid was as follows:
| October 31, 2015 | October 31, 2014 |
Ordinary Income | $ 4,528,146 | $ 5,132,959 |
Short-Term Trading (Redemption) Fees. Shares held by investors in the Fund less than 30 days may have been subject to a redemption fee equal to 1.00% of the NAV of shares redeemed. All redemption fees, which reduce the proceeds of the shareholder redemption, are retained by the Fund and accounted for as an addition to paid in capital.
Restricted Securities. The Fund may invest in securities that are subject to legal or contractual restrictions on resale. These securities generally may be resold in transactions exempt from registration or to the public if the securities are registered. Disposal of these securities may involve time-consuming negotiations and expense, and prompt sale at an acceptable price may be difficult. Information regarding restricted securities is included at the end of the Fund's Schedule of Investments.
4. Purchases and Sales of Investments.
Purchases and sales of securities, other than short-term securities, aggregated $217,511,154 and $235,143,180, respectively.
5. Fees and Other Transactions with Affiliates.
Management Fee. Fidelity Management & Research Company (the investment adviser) and its affiliates provide the Fund with investment management related services for which the Fund pays a monthly management fee. The management fee is the sum of an individual fund fee rate that is based on an annual rate of .45% of the Fund's average net assets and an annualized group fee rate that averaged .25% during the period. The group fee rate is based upon the average net assets of all the mutual funds advised by the investment adviser, including any mutual funds previously advised by the investment adviser that are currently advised by Fidelity SelectCo, LLC, an affiliate of the investment adviser. The group fee rate decreases as assets under management increase and increases as assets under management decrease. For the reporting period, the total annual management fee rate was .70% of the Fund's average net assets.
Distribution and Service Plan Fees. In accordance with Rule 12b-1 of the 1940 Act, the Fund has adopted separate Distribution and Service Plans for each class of shares. Certain classes pay Fidelity Distributors Corporation (FDC), an affiliate of the investment adviser, separate Distribution and Service Fees, each of which is based on an
Annual Report
5. Fees and Other Transactions with Affiliates - continued
Distribution and Service Plan Fees - continued
annual percentage of each class' average net assets. In addition, FDC may pay financial intermediaries for selling shares of the Fund and providing shareholder support services.
For the period, the Distribution and Service Fee rates, total fees and amounts retained by FDC were as follows:
| Distribution
Fee | Service
Fee | Total Fees | Retained
by FDC |
Class A | -% | .25% | $ 103,367 | $ 690 |
Class T | .25% | .25% | 42,080 | 4 |
Class B | .75% | .25% | 12,224 | 9,168 |
Class C | .75% | .25% | 145,017 | 16,745 |
| | | $ 302,688 | $ 26,607 |
Sales Load. FDC may receive a front-end sales charge of up to 5.75% for selling Class A shares and 3.50% for selling Class T shares, some of which is paid to financial intermediaries for selling shares of the Fund. Depending on the holding period, FDC may receive contingent deferred sales charges levied on Class A, Class T, Class B, and Class C redemptions. The deferred sales charges range from 5.00% to 1.00% for Class B shares, 1.00% for Class C shares, 1.00% for certain purchases of Class A shares and .25% for certain purchases of Class T shares.
For the period, sales charge amounts retained by FDC were as follows:
| Retained
by FDC |
Class A | $ 18,579 |
Class T | 1,858 |
Class BA | 2,196 |
Class C A | 2,768 |
| $ 25,401 |
A When Class B and Class C shares are initially sold, FDC pays commissions from its own resources to financial intermediaries through which the sales are made.
Transfer Agent Fees. Fidelity Investments Institutional Operations Company, Inc., (FIIOC), an affiliate of the investment adviser, is the transfer, dividend disbursing and shareholder servicing agent for each class of the Fund. FIIOC receives account fees and asset-based fees that vary according to the account size and type of account of the shareholders of the respective classes of the Fund. FIIOC pays for typesetting, printing and mailing of shareholder reports, except proxy statements.
Annual Report
Notes to Financial Statements - continued
5. Fees and Other Transactions with Affiliates - continued
Transfer Agent Fees - continued
For the period, transfer agent fees for each class were as follows:
| Amount | % of
Class-Level Average
Net Assets |
Class A | $ 111,180 | .27 |
Class T | 25,675 | .31 |
Class B | 3,619 | .30 |
Class C | 41,951 | .29 |
Global Commodity Stock | 576,631 | .30 |
Class I | 64,016 | .26 |
| $ 823,072 | |
Accounting and Security Lending Fees. Fidelity Service Company, Inc. (FSC), an affiliate of the investment adviser, maintains the Fund's accounting records. The accounting fee is based on the level of average net assets for each month. Under a separate contract, FSC administers the security lending program. The security lending fee is based on the number and duration of lending transactions.
Brokerage Commissions. The Fund placed a portion of its portfolio transactions with brokerage firms which are affiliates of the investment adviser. Brokerage commissions are included in net realized gain (loss) and change in net unrealized appreciation (depreciation) in the Statement of Operations. The commissions paid to these affiliated firms were $8,965 for the period.
6. Committed Line of Credit.
The Fund participates with other funds managed by the investment adviser or an affiliate in a $4.25 billion credit facility (the "line of credit") to be utilized for temporary or emergency purposes to fund shareholder redemptions or for other short-term liquidity purposes. The Fund has agreed to pay commitment fees on its pro-rata portion of the line of credit, which amounted to $424 and is reflected in Miscellaneous expenses on the Statement of Operations. During the period, the Fund did not borrow on this line of credit.
7. Security Lending.
The Fund lends portfolio securities through a lending agent from time to time in order to earn additional income. For equity securities, a lending agent is used and may loan securities to certain qualified borrowers, including Fidelity Capital Markets (FCM), a
Annual Report
7. Security Lending - continued
broker-dealer affiliated with the Fund. On the settlement date of the loan, the Fund receives collateral (in the form of U.S. Treasury obligations, letters of credit and/or cash) against the loaned securities and maintains collateral in an amount not less than 100% of the market value of the loaned securities during the period of the loan. The market value of the loaned securities is determined at the close of business of the Fund and any additional required collateral is delivered to the Fund on the next business day. The Fund or borrower may terminate the loan at any time, and if the borrower defaults on its obligation to return the securities loaned because of insolvency or other reasons, the Fund may apply collateral received from the borrower against the obligation. The Fund may experience delays and costs in recovering the securities loaned. Any cash collateral received is invested in the Fidelity Securities Lending Cash Central Fund. The value of loaned securities and cash collateral at period end are disclosed on the Fund's Statement of Assets and Liabilities. Security lending income represents the income earned on investing cash collateral, less rebates paid to borrowers and any lending agent fees associated with the loan, plus any premium payments received for lending certain types of securities. Security lending income is presented in the Statement of Operations as a component of income from Fidelity Central Funds. Total security lending income during the period amounted to $150,371, including $102 from securities loaned to FCM.
8. Expense Reductions.
Commissions paid to certain brokers with whom the investment adviser, or its affiliates, places trades on behalf of the Fund include an amount in addition to trade execution, which may be rebated back to the Fund to offset certain expenses. This amount totaled $17,208 for the period.
In addition, during the period the investment adviser reimbursed and/or waived a portion of fund-level operating expenses in the amount of $1,143 and a portion of class-level operating expenses as follows:
| Amount |
Class A | $ 880 |
Class T | 23 |
Class B | 4 |
Class C | 170 |
Global Commodity Stock | 1,381 |
Class I | 704 |
| $ 3,162 |
Annual Report
Notes to Financial Statements - continued
9. Distributions to Shareholders.
Distributions to shareholders of each class were as follows:
Years ended October 31, | 2015 | 2014 |
From net investment income | | |
Class A | $ 520,699 | $ 708,856 |
Class T | 72,766 | 98,770 |
Class B | 1,871 | 4,646 |
Class C | 32,755 | 54,810 |
Global Commodity Stock | 2,937,401 | 3,531,196 |
Class I | 333,382 | 366,972 |
Total | $ 3,898,874 | $ 4,765,250 |
From net realized gain | | |
Class A | $ 97,397 | $ 63,118 |
Class T | 19,110 | 11,363 |
Class B | 3,040 | 2,083 |
Class C | 34,065 | 21,591 |
Global Commodity Stock | 429,058 | 244,178 |
Class I | 46,602 | 25,376 |
Total | $ 629,272 | $ 367,709 |
10. Share Transactions.
Share transactions for each class were as follows and may contain automatic conversions between classes or exchanges between funds:
| Shares | Dollars |
Years ended October 31, | 2015 | 2014 | 2015 | 2014 |
Class A | | | | |
Shares sold | 526,290 | 686,605 | $ 6,210,169 | $ 9,882,029 |
Reinvestment of distributions | 46,881 | 49,529 | 594,452 | 677,563 |
Shares redeemed | (1,342,823) | (1,874,574) | (16,036,860) | (26,738,279) |
Net increase (decrease) | (769,652) | (1,138,440) | $ (9,232,239) | $ (16,178,687) |
Class T | | | | |
Shares sold | 79,898 | 67,497 | $ 963,935 | $ 970,700 |
Reinvestment of distributions | 7,092 | 7,867 | 89,851 | 107,538 |
Shares redeemed | (201,781) | (216,700) | (2,371,414) | (3,112,471) |
Net increase (decrease) | (114,791) | (141,336) | $ (1,317,628) | $ (2,034,233) |
Class B | | | | |
Shares sold | 580 | 2,197 | $ 7,071 | $ 29,999 |
Reinvestment of distributions | 371 | 453 | 4,698 | 6,179 |
Shares redeemed | (35,007) | (46,232) | (422,886) | (649,491) |
Net increase (decrease) | (34,056) | (43,582) | $ (411,117) | $ (613,313) |
Annual Report
10. Share Transactions - continued
| Shares | Dollars |
Years ended October 31, | 2015 | 2014 | 2015 | 2014 |
Class C | | | | |
Shares sold | 206,447 | 167,515 | $ 2,471,711 | $ 2,371,848 |
Reinvestment of distributions | 4,962 | 4,980 | 62,526 | 67,632 |
Shares redeemed | (426,784) | (527,630) | (5,161,590) | (7,391,284) |
Net increase (decrease) | (215,375) | (355,135) | $ (2,627,353) | $ (4,951,804) |
Global Commodity Stock | | | | |
Shares sold | 4,004,137 | 3,796,689 | $ 47,467,615 | $ 54,637,922 |
Reinvestment of distributions | 238,065 | 246,397 | 3,023,431 | 3,378,098 |
Shares redeemed | (5,506,523) | (6,485,397) | (65,599,040) | (92,819,253) |
Net increase (decrease) | (1,264,321) | (2,442,311) | $ (15,107,994) | $ (34,803,233) |
Class I | | | | |
Shares sold | 1,576,324 | 912,359 | $ 18,219,363 | $ 13,219,634 |
Reinvestment of distributions | 24,972 | 20,652 | 316,895 | 283,141 |
Shares redeemed | (929,289) | (1,362,707) | (10,645,039) | (19,411,369) |
Net increase (decrease) | 672,007 | (429,696) | $ 7,891,219 | $ (5,908,594) |
11. Other.
The Fund's organizational documents provide former and current trustees and officers with a limited indemnification against liabilities arising in connection with the performance of their duties to the Fund. In the normal course of business, the Fund may also enter into contracts that provide general indemnifications. The Fund's maximum exposure under these arrangements is unknown as this would be dependent on future claims that may be made against the Fund. The risk of material loss from such claims is considered remote.
At the end of the period, the investment adviser or its affiliates were the owners of record of 17% of the outstanding shares of the Funds.
Annual Report
To the Trustees of Fidelity Investment Trust and the Shareholders of Fidelity Global Commodity Stock Fund:
In our opinion, the accompanying statement of assets and liabilities, including the schedule of investments, and the related statements of operations and of changes in net assets and the financial highlights present fairly, in all material respects, the financial position of Fidelity Global Commodity Stock Fund (a fund of Fidelity Investment Trust) at October 31, 2015, the results of its operations for the year then ended, the changes in its net assets for each of the two years in the period then ended and the financial highlights for each of the five years in the period then ended, in conformity with accounting principles generally accepted in the United States of America. These financial statements and financial highlights (hereafter referred to as "financial statements") are the responsibility of the Fidelity Global Commodity Stock Fund's management. Our responsibility is to express an opinion on these financial statements based on our audits. We conducted our audits of these financial statements in accordance with the standards of the Public Company Accounting Oversight Board (United States). Those standards require that we plan and perform the audit to obtain reasonable assurance about whether the financial statements are free of material misstatement. An audit includes examining, on a test basis, evidence supporting the amounts and disclosures in the financial statements, assessing the accounting principles used and significant estimates made by management, and evaluating the overall financial statement presentation. We believe that our audits, which included confirmation of securities at October 31, 2015 by correspondence with the custodian and brokers, provide a reasonable basis for our opinion.
PricewaterhouseCoopers LLP
Boston, Massachusetts
December 18, 2015
Annual Report
The Trustees, Member of the Advisory Board, and officers of the trust and fund, as applicable, are listed below. The Board of Trustees governs the fund and is responsible for protecting the interests of shareholders. The Trustees are experienced executives who meet periodically throughout the year to oversee the fund's activities, review contractual arrangements with companies that provide services to the fund, oversee management of the risks associated with such activities and contractual arrangements, and review the fund's performance. Each of the Trustees oversees 170 funds.
The Trustees hold office without limit in time except that (a) any Trustee may resign; (b) any Trustee may be removed by written instrument, signed by at least two-thirds of the number of Trustees prior to such removal; (c) any Trustee who requests to be retired or who has become incapacitated by illness or injury may be retired by written instrument signed by a majority of the other Trustees; and (d) any Trustee may be removed at any special meeting of shareholders by a two-thirds vote of the outstanding voting securities of the trust. Each Trustee who is not an interested person (as defined in the 1940 Act) of the trust and the fund (Independent Trustee), shall retire not later than the last day of the calendar year in which his or her 75th birthday occurs. The Independent Trustees may waive this mandatory retirement age policy with respect to individual Trustees. The officers and Advisory Board Member hold office without limit in time, except that any officer and Advisory Board Member may resign or may be removed by a vote of a majority of the Trustees at any regular meeting or any special meeting of the Trustees. Except as indicated, each individual has held the office shown or other offices in the same company for the past five years.
Experience, Skills, Attributes, and Qualifications of the Fund's Trustees. The Governance and Nominating Committee has adopted a statement of policy that describes the experience, qualifications, attributes, and skills that are necessary and desirable for potential Independent Trustee candidates (Statement of Policy). The Board believes that each Trustee satisfied at the time he or she was initially elected or appointed a Trustee, and continues to satisfy, the standards contemplated by the Statement of Policy. The Governance and Nominating Committee also engages professional search firms to help identify potential Independent Trustee candidates who have the experience, qualifications, attributes, and skills consistent with the Statement of Policy. From time to time, additional criteria based on the composition and skills of the current Independent Trustees, as well as experience or skills that may be appropriate in light of future changes to board composition, business conditions, and regulatory or other developments, have also been considered by the professional search firms and the Governance and Nominating Committee. In addition, the Board takes into account the Trustees' commitment and participation in Board and committee meetings, as well as their leadership of standing and ad hoc committees throughout their tenure.
In determining that a particular Trustee was and continues to be qualified to serve as a Trustee, the Board has considered a variety of criteria, none of which, in isolation, was controlling. The Board believes that, collectively, the Trustees have balanced and diverse experience, qualifications, attributes, and skills, which allow the Board to operate effectively in governing the fund and protecting the interests of shareholders. Information about the specific experience, skills, attributes, and qualifications of each Trustee, which in each case led to the Board's conclusion that the Trustee should serve (or continue to serve) as a trustee of the fund, is provided below.
Annual Report
Board Structure and Oversight Function. James C. Curvey is an interested person (as defined in the 1940 Act) and currently serves as Chairman. The Trustees have determined that an interested Chairman is appropriate and benefits shareholders because an interested Chairman has a personal and professional stake in the quality and continuity of services provided to the fund. Independent Trustees exercise their informed business judgment to appoint an individual of their choosing to serve as Chairman, regardless of whether the Trustee happens to be independent or a member of management. The Independent Trustees have determined that they can act independently and effectively without having an Independent Trustee serve as Chairman and that a key structural component for assuring that they are in a position to do so is for the Independent Trustees to constitute a substantial majority for the Board. The Independent Trustees also regularly meet in executive session. Ned C. Lautenbach serves as Chairman of the Independent Trustees and as such (i) acts as a liaison between the Independent Trustees and management with respect to matters important to the Independent Trustees and (ii) with management prepares agendas for Board meetings.
Fidelity funds are overseen by different Boards of Trustees. The fund's Board oversees Fidelity's high income and certain equity funds, and other Boards oversee Fidelity's investment-grade bond, money market, asset allocation, and sector funds. The asset allocation funds may invest in Fidelity funds overseen by the fund's Board. The use of separate Boards, each with its own committee structure, allows the Trustees of each group of Fidelity funds to focus on the unique issues of the funds they oversee, including common research, investment, and operational issues. On occasion, the separate Boards establish joint committees to address issues of overlapping consequences for the Fidelity funds overseen by each Board.
The Trustees operate using a system of committees to facilitate the timely and efficient consideration of all matters of importance to the Trustees, the fund, and fund shareholders and to facilitate compliance with legal and regulatory requirements and oversight of the fund's activities and associated risks. The Board, acting through its committees, has charged FMR and its affiliates with (i) identifying events or circumstances the occurrence of which could have demonstrably adverse effects on the fund's business and/or reputation; (ii) implementing processes and controls to lessen the possibility that such events or circumstances occur or to mitigate the effects of such events or circumstances if they do occur; and (iii) creating and maintaining a system designed to evaluate continuously business and market conditions in order to facilitate the identification and implementation processes described in (i) and (ii) above. Because the day-to-day operations and activities of the fund are carried out by or through FMR, its affiliates and other service providers, the fund's exposure to risks is mitigated but not eliminated by the processes overseen by the Trustees. While each of the Board's committees has responsibility for overseeing different aspects of the fund's activities, oversight is exercised primarily through the Operations, Audit, and Compliance Committees. In addition, the Independent Trustees have worked with FMR to enhance the Board's oversight of investment and financial risks, legal and regulatory risks, technology risks, and operational risks, including the development of additional risk reporting to the Board. For example, a working group comprised of Independent Trustees and FMR has worked and continues to work to review the Fidelity funds' valuation-related activities, reporting and risk management. Appropriate personnel, including but not limited to the fund's Chief Compliance Officer (CCO), FMR's internal auditor, the independent accountants, the fund's Treasurer and portfolio management personnel, make periodic reports to the Board's committees, as appropriate, including an annual review of Fidelity's risk management program for the Fidelity funds. The responsibilities of each standing committee, including their oversight responsibilities, are described further under "Standing Committees of the Fund's Trustees."
Annual Report
Trustees and Officers - continued
The fund's Statement of Additional Information (SAI) includes more information about the Trustees. To request a free copy, call Fidelity at 1-800-544-8544.
Interested Trustees*:
Correspondence intended for each Trustee who is an interested person may be sent to Fidelity Investments, 245 Summer Street, Boston, Massachusetts 02210.
Name, Year of Birth; Principal Occupations and Other Relevant Experience+ |
James C. Curvey (1935) |
Year of Election or Appointment: 2007 Trustee Chairman of the Board of Trustees |
| Mr. Curvey also serves as Trustee of other Fidelity funds. Mr. Curvey is a Director of Fidelity Research & Analysis Co. (investment adviser firm, 2009-present), and Vice Chairman (2007-present) and Director of FMR LLC (diversified financial services company). In addition, Mr. Curvey serves as an Overseer for the Boston Symphony Orchestra and a member of the board of Artis-Naples, Naples, Florida, and as a Trustee for Brewster Academy, Wolfeboro, New Hampshire. Previously, Mr. Curvey served as a Director of Fidelity Investments Money Management, Inc. (investment adviser firm, 2009-2014) and a Director of FMR and FMR Co., Inc. (investment adviser firms, 2007-2014). |
Charles S. Morrison (1960) |
Year of Election or Appointment: 2014 Trustee |
| Mr. Morrison also serves as Trustee of other funds. He serves as a Director of Fidelity Investments Money Management, Inc. (FIMM) (investment adviser firm, 2014-present), Director of Fidelity SelectCo, LLC (investment adviser firm, 2014-present), President, Asset Management (2014-present), and is an employee of Fidelity Investments. Previously, Mr. Morrison served as Vice President of Fidelity's Fixed Income and Asset Allocation Funds (2012-2014), President, Fixed Income (2011-2014), Vice President of Fidelity's Money Market Funds (2005-2009), President, Money Market Group Leader of FMR (investment adviser firm, 2009), and Senior Vice President, Money Market Group of FMR (2004-2009). Mr. Morrison also served as Vice President of Fidelity's Bond Funds (2002-2005), certain Balanced Funds (2002-2005), and certain Asset Allocation Funds (2002-2007), and as Senior Vice President (2002-2005) of Fidelity's Bond Division. |
* Trustees have been determined to be "Interested Trustees" by virtue of, among other things, their affiliation with the trust or various entities under common control with FMR.
+ The information above includes each Trustee's principal occupation during the last five years and other information relating to the experience, attributes, and skills relevant to each Trustee's qualifications to serve as a Trustee, which led to the conclusion that each Trustee should serve as a Trustee for the fund.
Annual Report
Trustees and Officers - continued
Independent Trustees:
Correspondence intended for each Independent Trustee (that is, the Trustees other than the Interested Trustees) may be sent to Fidelity Investments, P.O. Box 55235, Boston, Massachusetts 02205-5235.
Name, Year of Birth; Principal Occupations and Other Relevant Experience+ |
Dennis J. Dirks (1948) |
Year of Election or Appointment: 2005 Trustee |
| Mr. Dirks also serves as Trustee of other Fidelity funds. Prior to his retirement in May 2003, Mr. Dirks was Chief Operating Officer and a member of the Board of The Depository Trust & Clearing Corporation (DTCC). He also served as President, Chief Operating Officer, and Board member of The Depository Trust Company (DTC) and President and Board member of the National Securities Clearing Corporation (NSCC). In addition, Mr. Dirks served as Chief Executive Officer and Board member of the Government Securities Clearing Corporation, Chief Executive Officer and Board member of the Mortgage-Backed Securities Clearing Corporation, as a Trustee and a member of the Finance Committee of Manhattan College (2005-2008), as a Trustee and a member of the Finance Committee of AHRC of Nassau County (2006-2008), and as a member of the Independent Directors Council (IDC) Governing Council (2010-2015). Mr. Dirks is a member of the Board of Directors for The Brookville Center for Children's Services, Inc. (2009-present). |
Alan J. Lacy (1953) |
Year of Election or Appointment: 2008 Trustee |
| Mr. Lacy also serves as Trustee of other Fidelity funds. Mr. Lacy serves as a member of the Board of Directors of Dave & Buster's Entertainment, Inc. (restaurant and entertainment complexes, 2010-present) and Bristol-Myers Squibb Company (global pharmaceuticals, 2008-present). In addition, Mr. Lacy served as Senior Adviser (2007-2014) of Oak Hill Capital Partners, L.P. (private equity) and also served as Chief Executive Officer (2000-2005) and Vice Chairman (2005-2006) of Sears Holdings Corporation and Sears, Roebuck and Co. (retail). Mr. Lacy is a member of the Board of Trustees of The National Parks Conservation Association (2006-present). Previously, Mr. Lacy served as Chairman of the Board of Trustees of the National Parks Conservation Association (2008-2011) and as a member of the Board of Directors for The Western Union Company (global money transfer, 2006-2011), The Hillman Companies, Inc. (hardware wholesalers, 2010-2014), and Earth Fare, Inc. (retail grocery, 2010-2014). |
Ned C. Lautenbach (1944) |
Year of Election or Appointment: 2000 Trustee Chairman of the Independent Trustees |
| Mr. Lautenbach also serves as Trustee of other Fidelity funds. Mr. Lautenbach currently serves as the Lead Director of the Eaton Corporation Board of Directors (diversified industrial, 1997-present). Mr. Lautenbach is Chairman of the Board of Directors of Artis-Naples in Naples, Florida (2012-present), a member of the Council on Foreign Relations (1994-present), and a member of the Board of Governors, State University System of Florida (2013-present). Previously, Mr. Lautenbach was a Partner/Advisory Partner at Clayton, Dubilier & Rice, LLC (private equity investment, 1998-2010), as well as a Director of Sony Corporation (2006-2007). |
Joseph Mauriello (1944) |
Year of Election or Appointment: 2008 Trustee |
| Mr. Mauriello also serves as Trustee of other Fidelity funds. Prior to his retirement in January 2006, Mr. Mauriello served in numerous senior management positions including Deputy Chairman and Chief Operating Officer (2004-2005), and Vice Chairman of Financial Services (2002-2004) of KPMG LLP US (professional services, 1965-2005). Mr. Mauriello currently serves as a member of the Board of Directors of XL Group plc. (global insurance and re-insurance, 2006-present) and the Independent Directors Council (IDC) Governing Council (2015-present). Previously, Mr. Mauriello served as a Director of the Hamilton Funds of the Bank of New York (2006-2007) and of Arcadia Resources Inc. (health care services and products, 2007-2012). |
Robert W. Selander (1950) |
Year of Election or Appointment: 2011 Trustee |
| Mr. Selander also serves as Trustee of other Fidelity funds. Mr. Selander serves as a Director of The Western Union Company (global money transfer, 2014-present). Previously, Mr. Selander served as a Member of the Advisory Board of other Fidelity funds (2011), and Executive Vice Chairman (2010), Chief Executive Officer (2009-2010), and President and Chief Executive Officer (1997-2009) of Mastercard, Inc. |
Cornelia M. Small (1944) |
Year of Election or Appointment: 2005 Trustee |
| Ms. Small also serves as Trustee of other Fidelity funds. Ms. Small is a member of the Board of Directors (2009-present) and Chair of the Investment Committee (2010-present) of the Teagle Foundation. Ms. Small also serves on the Investment Committee of the Berkshire Taconic Community Foundation (2008-present). Previously, Ms. Small served as Chairperson (2002-2008) and a member of the Investment Committee and Chairperson (2008-2012) and a member of the Board of Trustees of Smith College. In addition, Ms. Small served as Chief Investment Officer, Director of Global Equity Investments, and a member of the Board of Directors of Scudder, Stevens & Clark and Scudder Kemper Investments. |
William S. Stavropoulos (1939) |
Year of Election or Appointment: 2001 Trustee Vice Chairman of the Independent Trustees |
| Mr. Stavropoulos also serves as Trustee of other Fidelity funds. Mr. Stavropoulos serves as President and Founder of the Michigan Baseball Foundation, the Great Lakes Loons (2007-present). Mr. Stavropoulos is Chairman Emeritus of the Board of Directors of The Dow Chemical Company, where he previously served in numerous senior management positions, including President, CEO (1995-2000; 2002-2004), Chairman of the Executive Committee (2000-2006), and as a member of the Board of Directors (1990-2006). Currently, Mr. Stavropoulos is Chairman of the Board of Directors of Univar Inc. (global distributor of commodity and specialty chemicals), a Director of Teradata Corporation (data warehousing and technology solutions), and Maersk Inc. (industrial conglomerate), and a member of the Advisory Board for Metalmark Capital LLC (private equity investment, 2005-present). Mr. Stavropoulos is an operating advisor to Clayton, Dubilier & Rice, LLC (private equity investment). In addition, Mr. Stavropoulos is a member of the University of Notre Dame Advisory Council for the College of Science, a Trustee of the Rollin L. Gerstacker Foundation, and a Director of the Naples Philharmonic Center for the Arts. Previously, Mr. Stavropoulos served as a Director of Chemical Financial Corporation (bank holding company, 1993-2012) and Tyco International, Ltd. (multinational manufacturing and services, 2007-2012). |
David M. Thomas (1949) |
Year of Election or Appointment: 2008 Trustee |
| Mr. Thomas also serves as Trustee of other Fidelity funds. Mr. Thomas serves as Non-Executive Chairman of the Board of Directors of Fortune Brands Home and Security (home and security products, 2011-present), as a member of the Board of Directors (2004-present) and Presiding Director (2013-present) of Interpublic Group of Companies, Inc. (marketing communication), and as a member of the Board of Trustees of the University of Florida (2013-present). Previously, Mr. Thomas served as Executive Chairman (2005-2006) and Chairman and Chief Executive Officer (2000-2005) of IMS Health, Inc. (pharmaceutical and healthcare information solutions), and a Director of Fortune Brands, Inc. (consumer products, 2000-2011). |
+ The information above includes each Trustee's principal occupation during the last five years and other information relating to the experience, attributes, and skills relevant to each Trustee's qualifications to serve as a Trustee, which led to the conclusion that each Trustee should serve as a Trustee for the fund.
Advisory Board Member and Officers:
Correspondence intended for each officer and Peter S. Lynch may be sent to Fidelity Investments, 245 Summer Street, Boston, Massachusetts 02210. Officers appear below in alphabetical order.
Name, Year of Birth; Principal Occupation |
Peter S. Lynch (1944) |
Year of Election or Appointment: 2003 Member of the Advisory Board |
| Mr. Lynch also serves as Member of the Advisory Board of other Fidelity funds. Mr. Lynch is Vice Chairman and a Director of FMR (investment adviser firm) and FMR Co., Inc. (investment adviser firm). In addition, Mr. Lynch serves as a Trustee of Boston College and as the Chairman of the Inner-City Scholarship Fund. Previously, Mr. Lynch served on the Special Olympics International Board of Directors (1997-2006). |
Christopher S. Bartel (1971) |
Year of Election or Appointment: 2009 Vice President |
| Mr. Bartel also serves as Vice President of other funds. Mr. Bartel serves as a Director, President, and Chief Executive Officer of Fidelity Management & Research (Japan) Limited (investment adviser firm, 2012-present), a Director of Fidelity Management & Research (Hong Kong) (investment adviser firm, 2012-present), and Senior Vice President of Global Equity Research (2010-present). Previously, Mr. Bartel served as Senior Vice President of Equity Research (2009-2010), Managing Director of Research (2006-2009), and an analyst and portfolio manager (2000-2006). |
Elizabeth Paige Baumann (1968) |
Year of Election or Appointment: 2012 Anti-Money Laundering (AML) Officer |
| Ms. Baumann also serves as AML Officer of other funds. She is Chief AML Officer of FMR LLC (diversified financial services company, 2012-present) and is an employee of Fidelity Investments. Previously, Ms. Baumann served as Vice President and Deputy Anti-Money Laundering Officer (2007-2012). |
Marc R. Bryant (1966) |
Year of Election or Appointment: 2015 Secretary and Chief Legal Officer (CLO) |
| Mr. Bryant also serves as Secretary and CLO of other funds. Mr. Bryant serves as CLO, Secretary, and Senior Vice President of Fidelity Management & Research Company (investment adviser firm, 2015-present) and FMR Co., Inc. (investment adviser firm, 2015-present); Secretary of Fidelity SelectCo, LLC (investment adviser firm, 2015-present) and Fidelity Investments Money Management, Inc. (investment adviser firm, 2015-present); and CLO of Fidelity Management & Research (Hong Kong) Limited (investment adviser firm, 2015-present). He is Senior Vice President and Deputy General Counsel of FMR LLC (diversified financial services company). Previously, Mr. Bryant served as Secretary and Chief Legal Officer of Fidelity Rutland Square Trust II (2010-2014) and Assistant Secretary of Fidelity's Fixed Income and Asset Allocation Funds (2013-2015). Prior to joining Fidelity Investments, Mr. Bryant served as a Senior Vice President and the Head of Global Retail Legal for AllianceBernstein L.P. (2006-2010), and as the General Counsel for ProFund Advisors LLC (2001-2006). |
William C. Coffey (1969) |
Year of Election or Appointment: 2009 Assistant Secretary |
| Mr. Coffey also serves as Assistant Secretary of other funds. He is Senior Vice President and Deputy General Counsel of FMR LLC (diversified financial services company, 2010-present), and is an employee of Fidelity Investments. Previously, Mr. Coffey served as Vice President and Associate General Counsel of FMR LLC (2005-2009). |
Jonathan Davis (1968) |
Year of Election or Appointment: 2010 Assistant Treasurer |
| Mr. Davis also serves as Assistant Treasurer of other funds, and is an employee of Fidelity Investments. Previously, Mr. Davis served as Vice President and Associate General Counsel of FMR LLC (diversified financial services company, 2003-2010). |
Adrien E. Deberghes (1967) |
Year of Election or Appointment: 2008 Deputy Treasurer |
| Mr. Deberghes also serves as an officer of other funds. He is an employee of Fidelity Investments (2008-present). Prior to joining Fidelity Investments, Mr. Deberghes was Senior Vice President of Mutual Fund Administration at State Street Corporation (2007-2008), Senior Director of Mutual Fund Administration at Investors Bank & Trust (2005-2007), and Director of Finance for Dunkin' Brands (2000-2005). |
Stephanie J. Dorsey (1969) |
Year of Election or Appointment: 2010 Assistant Treasurer |
| Ms. Dorsey also serves as an officer of other funds. She is an employee of Fidelity Investments (2008-present) and has served in other fund officer roles. Prior to joining Fidelity Investments, Ms. Dorsey served as Treasurer (2004-2008) of the JPMorgan Mutual Funds and Vice President (2004-2008) of JPMorgan Chase Bank. |
Howard J. Galligan III (1966) |
Year of Election or Appointment: 2014 Chief Financial Officer |
| Mr. Galligan also serves as Chief Financial Officer of other funds. Mr. Galligan serves as President of Fidelity Pricing and Cash Management Services (FPCMS) (2014-present) and as a Director of Strategic Advisers, Inc. (investment adviser firm, 2008-present). Previously, Mr. Galligan served as Chief Administrative Officer of Asset Management (2011-2014) and Chief Operating Officer and Senior Vice President of Investment Support for Strategic Advisers, Inc. (2003-2011). |
Scott C. Goebel (1968) |
Year of Election or Appointment: 2015 Vice President |
| Mr. Goebel serves as Vice President of other funds and is an employee of Fidelity Investments (2001-present). Previously, Mr. Goebel served as Secretary of Fidelity SelectCo, LLC (investment adviser firm, 2013-2015), Fidelity Investments Money Management, Inc. (FIMM) (investment adviser firm, 2010-2015), and Fidelity Research and Analysis Company (FRAC) (investment adviser firm, 2010-2015); General Counsel, Secretary, and Senior Vice President of Fidelity Management & Research Company (investment adviser firm, 2008-2015) and FMR Co., Inc. (investment adviser firm, 2008-2015); Assistant Secretary of Fidelity Management & Research (Japan) Limited (investment adviser firm, 2008-2015) and FMR Investment Management (U.K.) Limited (investment adviser firm, 2008-2015); Chief Legal Officer (CLO) of Fidelity Management & Research (Hong Kong) Limited (investment adviser firm, 2008-2015); Secretary and CLO of certain Fidelity funds (2008-2015); Assistant Secretary of FIMM (2008-2010), FRAC (2008-2010), and certain funds (2007-2008); and as Vice President and Secretary of Fidelity Distributors Corporation (FDC) (2005-2007). |
Brian B. Hogan (1964) |
Year of Election or Appointment: 2009 Vice President |
| Mr. Hogan also serves as Trustee or Vice President of other funds. Mr. Hogan serves as a Director of Fidelity SelectCo, LLC (investment adviser firm, 2014-present) and President of the Equity Division of FMR (investment adviser firm, 2009-present). Previously, Mr. Hogan served as Senior Vice President, Equity Research of FMR (2006-2009) and as a portfolio manager. |
Chris Maher (1972) |
Year of Election or Appointment: 2013 Assistant Treasurer |
| Mr. Maher serves as Assistant Treasurer of other funds. Mr. Maher is Vice President of Valuation Oversight and is an employee of Fidelity Investments. Previously, Mr. Maher served as Vice President of Asset Management Compliance (2013), Vice President of the Program Management Group of FMR (investment adviser firm, 2010-2013), and Vice President of Valuation Oversight (2008-2010). |
Kenneth B. Robins (1969) |
Year of Election or Appointment: 2008 President and Treasurer |
| Mr. Robins also serves as an officer of other funds. Mr. Robins serves as Executive Vice President of Fidelity Investments Money Management, Inc. (FIMM) (investment adviser firm, 2013-present) and is an employee of Fidelity Investments (2004-present). Previously, Mr. Robins served in other fund officer roles. |
Stacie M. Smith (1974) |
Year of Election or Appointment: 2013 Deputy Treasurer |
| Ms. Smith also serves as an officer of other funds. She is an employee of Fidelity Investments (2009-present) and has served in other fund officer roles. Prior to joining Fidelity Investments, Ms. Smith served as Senior Audit Manager of Ernst & Young LLP (1996-2009). |
Renee Stagnone (1975) |
Year of Election or Appointment: 2013 Deputy Treasurer |
| Ms. Stagnone also serves as Deputy Treasurer of other funds. Ms. Stagnone is an employee of Fidelity Investments (1997-present). |
Linda J. Wondrack (1964) |
Year of Election or Appointment: 2014 Chief Compliance Officer |
| Ms. Wondrack also serves as Chief Compliance Officer of other funds. Ms. Wondrack is Executive Vice President and head of the Ethics Office and Asset Management Compliance for Fidelity Investments (2012-present). Ms. Wondrack also serves as Chief Compliance Officer of Fidelity SelectCo, LLC (investment adviser firm, 2014-present); Chief Compliance Officer of Impresa Management LLC (2013-present); and Chief Compliance Officer of FMR Co., Inc. (investment adviser firm), Fidelity Investments Money Management, Inc. (investment adviser firm), Fidelity Management & Research (Japan) Limited (investment adviser firm), FMR Investment Management (U.K.) Limited (investment adviser firm), Fidelity Management & Research (Hong Kong) (investment adviser firm), Fidelity Management & Research Company (investment adviser firm), FIAM LLC (investment adviser firm), and Strategic Advisers, Inc. (investment adviser firm), Ballyrock Investment Advisors LLC, and Northern Neck Investors LLC (2012-present). Previously, Ms. Wondrack served as Senior Vice President and Chief Compliance Officer for Columbia Management Investment Advisers, LLC (2005-2012); Chief Compliance Officer for certain funds within the Columbia Family of Funds (2007-2012); and Senior Vice President of Compliance Risk Management at Bank of America (2005-2010). |
Joseph F. Zambello (1957) |
Year of Election or Appointment: 2011 Deputy Treasurer |
| Mr. Zambello also serves as Deputy Treasurer of other funds. Mr. Zambello is an employee of Fidelity Investments (1991-present). Previously, Mr. Zambello served as Vice President of the Program Management Group of FMR (investment adviser firm, 2009-2011) and Vice President of the Transfer Agent Oversight Group (2005-2009). |
Annual Report
The Board of Trustees of Fidelity Global Commodity Stock Fund voted to pay to shareholders of record at the opening of business on record date, the following distributions per share derived from capital gains realized from sales of portfolio securities, and dividends derived from net investment income:
| Pay Date | Record Date | Dividends | Capital Gains |
Global Commodity Stock | 12/07/15 | 12/04/15 | $0.241 | $0.010 |
Global Commodity Stock designates 54% of the dividend distributed during the fiscal year as qualifying for the dividends-received deduction for corporate shareholders.
Global Commodity Stock designates 100% of the dividend distributed during the fiscal year as amounts which may be taken into account as a dividend for the purposes of the maximum rate under section 1(h)(11) of the Internal Revenue Code.
The amounts per share which represent income derived from sources within, and taxes paid to, foreign countries or possessions of the United States are as follows:
| Pay Date | Income | Taxes |
Global Commodity Stock Fund | 12/08/14 | $0.2134 | $0.0094 |
The fund will notify shareholders in January 2016 of amounts for use in preparing 2015 income tax returns.
Annual Report
Fidelity Global Commodity Stock Fund
Each year, the Board of Trustees, including the Independent Trustees (together, the Board), votes on the renewal of the management contract with Fidelity Management & Research Company (FMR) and the sub-advisory agreements (together, the Advisory Contracts) for the fund. The Board, assisted by the advice of fund counsel and Independent Trustees' counsel, requests and considers a broad range of information relevant to the renewal of the Advisory Contracts throughout the year.
The Board meets regularly and, at each of its meetings, covers an extensive agenda of topics and materials and considers factors that are relevant to its annual consideration of the renewal of the fund's Advisory Contracts, including the services and support provided to the fund and its shareholders. The Board has established various standing committees (Committees), each composed of and chaired by Independent Trustees with varying backgrounds, to which the Board has assigned specific subject matter responsibilities in order to enhance effective decision-making by the Board. The Board, acting directly and through its Committees, requests and receives information concerning the annual consideration of the renewal of the fund's Advisory Contracts. The Board also meets as needed to consider matters specifically related to the Board's annual consideration of the renewal of the Advisory Contracts. Members of the Board may also meet with trustees of other Fidelity funds through ad hoc joint committees to discuss certain matters relevant to all of the Fidelity funds.
At its July 2015 meeting, the Board unanimously determined to renew the fund's Advisory Contracts. In reaching its determination, the Board considered all factors it believed relevant, including (i) the nature, extent, and quality of the services to be provided to the fund and its shareholders (including the investment performance of the fund); (ii) the competitiveness of the fund's management fee and total expense ratio relative to peer funds; (iii) the total costs of the services to be provided by and the profits to be realized by Fidelity from its relationship with the fund; and (iv) the extent to which (if any) economies of scale exist and would be realized as the fund grows, and whether any economies of scale are appropriately shared with fund shareholders.
In considering whether to renew the Advisory Contracts for the fund, the Board reached a determination, with the assistance of fund counsel and Independent Trustees' counsel and through the exercise of its business judgment, that the renewal of the Advisory Contracts was in the best interests of the fund and its shareholders and that the compensation payable under the Advisory Contracts was fair and reasonable. The Board's decision to renew the Advisory Contracts was not based on any single factor, but rather was based on a comprehensive consideration of all the information provided to the Board at its meetings throughout the year. The Board, in reaching its determination to renew the Advisory Contracts, was aware that shareholders of the fund have a broad range of investment choices available to them, including a wide choice among funds offered by Fidelity's competitors, and that the fund's shareholders, who have the opportunity to review and weigh the disclosure provided by the fund in its prospectus and other public disclosures, have chosen to invest in this fund, which is part of the Fidelity family of funds.
Annual Report
Nature, Extent, and Quality of Services Provided. The Board considered Fidelity's staffing as it relates to the fund, including the backgrounds of investment personnel of Fidelity, and also considered the fund's investment objective, strategies, and related investment philosophy. The Independent Trustees also had discussions with senior management of Fidelity's investment operations and investment groups. The Board considered the structure of the portfolio manager compensation program and whether this structure provides appropriate incentives to act in the best interests of the fund. Additionally, the Board considered the portfolio managers' investments, if any, in the funds that they manage.
Resources Dedicated to Investment Management and Support Services. The Board and the Fund Oversight and Research Committees reviewed the general qualifications and capabilities of Fidelity's investment staff, including its size, education, experience, and resources, as well as Fidelity's approach to recruiting, training, managing, and compensating investment personnel. The Board noted that Fidelity has continued to increase the resources devoted to non-U.S. offices, including expansion of Fidelity's global investment organization. The Board also noted that Fidelity's analysts have extensive resources, tools and capabilities that allow them to conduct sophisticated quantitative and fundamental analysis, as well as credit analysis of issuers, counterparties and guarantors. Further, the Board considered that Fidelity's investment professionals have sufficient access to global information and data so as to provide competitive investment results over time, and that those professionals also have access to sophisticated tools that permit them to assess portfolio construction and risk and performance attribution characteristics continuously, as well as to transmit new information and research conclusions rapidly around the world. Additionally, in its deliberations, the Board considered Fidelity's trading, risk management, and compliance capabilities and resources, which are integral parts of the investment management process.
Shareholder and Administrative Services. The Board considered (i) the nature, extent, quality, and cost of advisory, administrative, and shareholder services performed by FMR, the sub-advisers (together with FMR, the Investment Advisers), and their affiliates under the Advisory Contracts and under separate agreements covering transfer agency, pricing and bookkeeping, and securities lending services for the fund; (ii) the nature and extent of the supervision of third party service providers, principally custodians and subcustodians; and (iii) the resources devoted to, and the record of compliance with, the fund's compliance policies and procedures. The Board also reviewed the allocation of fund brokerage, including allocations to brokers affiliated with the Investment Advisers, the use of brokerage commissions to pay fund expenses, and the use of "soft" commission dollars to pay for research services.
Annual Report
Board Approval of Investment Advisory Contracts and
Management Fees - continued
The Board noted that the growth of fund assets over time across the complex allows Fidelity to reinvest in the development of services designed to enhance the value or convenience of the Fidelity funds as investment vehicles. These services include 24-hour access to account information and market information through telephone representatives and over the Internet, investor education materials and asset allocation tools, and the expanded availability of Fidelity Investor Centers.
In 2014, the Board formed an ad hoc Committee on Transfer Agency Fees to review the variety of transfer agency fee structures throughout the industry and Fidelity's competitive positioning with respect to industry participants.
Investment in a Large Fund Family. The Board considered the benefits to shareholders of investing in a Fidelity fund, including the benefits of investing in a fund that is part of a large family of funds offering a variety of investment disciplines and providing a large variety of mutual fund investor services. The Board noted that Fidelity had taken, or had made recommendations that resulted in the Fidelity funds taking, a number of actions over the previous year that benefited particular funds, including (i) continuing to dedicate additional resources to investment research and to the support of the senior management team that oversees asset management; (ii) continuing efforts to enhance Fidelity's global research capabilities; (iii) launching new funds and making other enhancements to meet client needs; (iv) reducing management fees and total expenses for certain index funds and diversified international funds; (v) continuing to launch dedicated lower cost underlying funds to meet portfolio construction needs related to expanding underlying fund options for Fidelity funds of funds, specifically for the Freedom Fund product lines; (vi) rationalizing product lines and gaining increased efficiencies through fund mergers; (vii) launching active fixed-income exchange-traded funds; (viii) continuing to develop, acquire and implement systems and technology to improve services to the funds and information security and to increase efficiency; (ix) implementing investment enhancements to further strengthen Fidelity's target date product line to increase investors' probability of success in achieving their goals; (x) modifying the eligibility criteria for certain share classes to accommodate roll-over assets from employer-sponsored retirement plans; (xi) launching a new Class W of the Freedom Index Funds to attract and retain Fidelity record-kept retirement plan assets; and (xii) implementing changes to Fidelity's money market product line in response to recent money market regulatory reforms.
Investment Performance. The Board considered whether the fund has operated in accordance with its investment objective, as well as its record of compliance with its investment restrictions and its performance history.
Annual Report
The Board took into account discussions with representatives of the Investment Advisers about fund investment performance that occur at Board meetings throughout the year. In this regard the Board noted that as part of regularly scheduled fund reviews and other reports to the Board on fund performance, the Board considers annualized return information for the fund, for different time periods, measured against a securities market index ("benchmark index") and a peer group of funds with similar objectives ("peer group"), if any. In its evaluation of fund investment performance, the Board gave particular attention to information indicating changes in performance of certain Fidelity funds for specific time periods and discussed with the Investment Advisers the reasons for any overperformance or underperformance.
In addition to reviewing absolute and relative fund performance, the Independent Trustees periodically consider the appropriateness of fund performance metrics in evaluating the results achieved. In general, the Independent Trustees believe that fund performance should be evaluated based on net performance (after fees and expenses) of both the highest performing and lowest performing fund share classes, where applicable, compared to appropriate benchmark indices, over appropriate time periods that may include full market cycles, and compared to peer groups, as applicable, over the same periods, taking into account relevant factors including the following: general market conditions; issuer-specific information; and fund cash flows and other factors.
The Independent Trustees recognize that shareholders evaluate performance on a net basis over their own holding periods, for which one-, three-, and five-year periods are often used as a proxy. For this reason, the performance information reviewed by the Board also included net cumulative calendar year total return information for the fund and an appropriate benchmark index for the most recent one-, three-, and five-year periods, as shown below. A peer group is not shown below because the fund does not generally utilize a peer group for performance comparison purposes.
Annual Report
Board Approval of Investment Advisory Contracts and
Management Fees - continued
Fidelity Global Commodity Stock Fund

The Board has discussed the fund's performance with FMR, including the fund's underperformance based on more recent periods ended after 2014 (which periods are not shown in the chart above) but prior to the date of the Board's approval of the renewal of the Advisory Contracts, and has engaged with FMR to consider what steps might be taken to remediate the fund's more recent underperformance.
Based on its review, the Board concluded that the nature, extent, and quality of services provided to the fund under the Advisory Contracts should benefit the shareholders of the fund.
Competitiveness of Management Fee and Total Expense Ratio. The Board considered the fund's management fee and total expense ratio compared to "mapped groups" of competitive funds and classes created for the purpose of facilitating the Trustees' competitive analysis of management fees and total expenses. Fidelity creates "mapped groups" by combining similar Lipper investment objective categories that have comparable investment mandates. Combining Lipper investment objective categories aids the Board's management fee and total expense ratio comparisons by broadening the competitive group used for comparison.
Management Fee. The Board considered two proprietary management fee comparisons for the 12-month periods shown in basis points (BP) in the chart below. The group of Lipper funds used by the Board for management fee comparisons is referred to below as the "Total Mapped Group." The Total Mapped Group comparison focuses on a fund's standing in terms of gross management fees before expense reimbursements or caps relative to the total universe of funds with comparable investment mandates, regardless of whether their management fee structures also are comparable. Funds with comparable investment mandates offer exposure to similar types of securities. Funds with comparable management fee structures have similar management fee contractual arrangements (e.g., flat rate charged for advisory services, all-inclusive fee rate, etc.). "TMG %" represents the percentage of funds in the Total Mapped Group that had management fees that were lower than the fund's. For example, a hypothetical TMG % of 20% would mean that 80% of the funds in the Total Mapped Group had higher, and 20% had lower, management fees than the fund. The fund's actual TMG %s and the number of funds in the Total Mapped Group are in the chart below. The "Asset-Size Peer Group" (ASPG) comparison focuses on a fund's standing relative to a subset of non-Fidelity funds within the Total Mapped Group that are similar in size and management fee structure without taking into account performance adjustments, if any. For example, if a fund is in the first quartile of the ASPG, the fund's management fee ranks in the least expensive or lowest 25% of funds in the ASPG. The ASPG represents at least 15% of the funds in the Total Mapped Group with comparable asset size and management fee structures, subject to a minimum of 50 funds (or all funds in the Total Mapped Group if fewer than 50). Additional information, such as the ASPG quartile in which the fund's management fee rate ranked, is also included in the chart and considered by the Board.
Annual Report
Fidelity Global Commodity Stock Fund
The Board noted that the fund's management fee rate ranked below the median of its Total Mapped Group and below the median of its ASPG for 2014.
The Board noted that, in 2014, the ad hoc Committee on Group Fee was formed by it and other Fidelity fund boards to conduct an in-depth review of the "group fee" component of the management fee of funds with such management fee structures. Committee focus included the mechanics of the group fee, the competitive landscape of group fee structures, Fidelity funds with no group fee component and investment products not included in group fee assets. The Board also considered that, for funds subject to the group fee, FMR agreed to voluntarily waive fees over a specified period of time in amounts designed to account for assets converted from certain funds to certain collective investment trusts.
Annual Report
Board Approval of Investment Advisory Contracts and
Management Fees - continued
The Board also noted that, in 2013, the ad hoc Committee on Management Fees was formed to conduct an in-depth review of the management fee rates of Fidelity's active equity mutual funds. The Committee focused on the following areas: (i) standard fee structures; (ii) research consumption and trading evolution; (iii) management fee competitiveness/profitability by category; and (iv) factors that drive institutional pricing.
Based on its review, the Board concluded that the fund's management fee is fair and reasonable in light of the services that the fund receives and the other factors considered.
Total Expense Ratio. In its review of each class's total expense ratio, the Board considered the fund's management fee as well as other fund or class expenses, as applicable, such as transfer agent fees, pricing and bookkeeping fees, fund-paid 12b-1 fees, and custodial, legal, and audit fees. The Board also noted that Fidelity may agree to waive fees and expenses from time to time, and the extent to which, if any, it has done so for the fund. As part of its review, the Board also considered the current and historical total expense ratios of each class of the fund compared to competitive fund median expenses. Each class of the fund is compared to those funds and classes in the Total Mapped Group (used by the Board for management fee comparisons) that have a similar sales load structure.
The Board noted that the total expense ratio of each of Class A, Class I, and the retail class ranked below its competitive median for 2014 and the total expense ratio of each of Class T, Class B, and Class C ranked above its competitive median for 2014. The Board considered that, in general, various factors can affect total expense ratios. The Board noted that the total expense ratio of Class T was above the competitive median primarily because of higher 12b-1 fees on Class T as compared to most competitor funds. Class T has a higher 12b-1 fee, but a lower front-end sales charge, than traditionally priced front-end sales charge classes. The Board considered that Class T is primarily sold load-waived in the retirement plan market where its 0.50% 12b-1 fee is comparable to competing no-load, higher 12b-1 fee classes designed specifically for retirement plans. The Board noted that the fund offers multiple classes, each of which has a different sales load and 12b-1 fee structure, and that the multiple structures are intended to offer a range of pricing options for the intermediary market. The Board also noted that the total expense ratios of the classes vary primarily by the level of their 12b-1 fees, although differences in transfer agent fees may also cause expenses to vary from class to class.
Annual Report
Fees Charged to Other Fidelity Clients. The Board also considered Fidelity fee structures and other information with respect to clients of Fidelity, such as other funds advised or subadvised by Fidelity, pension plan clients, and other institutional clients with similar mandates. The Board noted the findings of the 2013 ad hoc joint committee (created with the board of other Fidelity funds), which reviewed and compared Fidelity's institutional investment advisory business with its business of providing services to the Fidelity funds, including the differences in services provided, fees charged, and costs incurred, as well as competition in their respective marketplaces.
Based on its review of total expense ratios and fees charged to other Fidelity clients, the Board concluded that, although in some cases above the median of the universe presented for comparison, the total expense ratio of each class of the fund was reasonable in light of the services that the fund and its shareholders receive and the other factors considered.
Costs of the Services and Profitability. The Board considered the revenues earned and the expenses incurred by Fidelity in conducting the business of developing, marketing, distributing, managing, administering and servicing the fund and servicing the fund's shareholders. The Board also considered the level of Fidelity's profits in respect of all the Fidelity funds.
On an annual basis, Fidelity presents to the Board information about the profitability of its relationship with the fund. Fidelity calculates profitability information for each fund, as well as aggregate profitability information for groups of Fidelity funds and all Fidelity funds, using a series of detailed revenue and cost allocation methodologies which originate with the books and records of Fidelity on which Fidelity's audited financial statements are based. The Audit Committee of the Board reviews any significant changes from the prior year's methodologies.
PricewaterhouseCoopers LLP (PwC), independent registered public accounting firm and auditor to Fidelity and certain Fidelity funds, has been engaged annually by the Board as part of the Board's assessment of Fidelity's profitability analysis. PwC's engagement includes the review and assessment of the methodologies used by Fidelity in determining the revenues and expenses attributable to Fidelity's mutual fund business, and completion of agreed-upon procedures in respect of the mathematical accuracy of fund profitability and its conformity to established allocation methodologies. After considering PwC's reports issued under the engagement and information provided by Fidelity, the Board concluded that while other allocation methods may also be reasonable, Fidelity's profitability methodologies are reasonable in all material respects.
Annual Report
Board Approval of Investment Advisory Contracts and
Management Fees - continued
The Board also reviewed Fidelity's non-fund businesses and fall-out benefits related to the mutual fund business as well as cases where Fidelity's affiliates may benefit from or be related to the fund's business.
The Board considered the costs of the services provided by and the profits realized by Fidelity in connection with the operation of the fund and was satisfied that the profitability was not excessive.
Economies of Scale. The Board considered whether there have been economies of scale in respect of the management of the Fidelity funds, whether the Fidelity funds (including the fund) have appropriately benefited from any such economies of scale, and whether there is potential for realization of any further economies of scale. The Board considered the extent to which the fund will benefit from economies of scale as assets grow through increased services to the fund, through waivers or reimbursements, or through fee or expense ratio reductions. The Board also noted that in 2013, it and the boards of other Fidelity funds created an ad hoc committee (the Economies of Scale Committee) to analyze whether Fidelity attains economies of scale in respect of the management and servicing of the Fidelity funds, whether the Fidelity funds have appropriately benefited from such economies of scale, and whether there is potential for realization of any further economies of scale.
The Board recognized that the fund's management contract incorporates a "group fee" structure, which provides for lower group fee rates as total group assets increase, and for higher group fee rates as total group assets decrease (with "group assets" defined to include fund assets under FMR's management plus sector fund assets previously under FMR's management and currently managed by Fidelity SelectCo, LLC). FMR calculates the group fee rates based on a tiered asset "breakpoint" schedule that varies based on asset class. The Board considered that the group fee is designed to deliver the benefits of economies of scale to fund shareholders when total Fidelity fund assets increase, even if assets of any particular fund are unchanged or have declined, because some portion of Fidelity's costs are attributable to services provided to all Fidelity funds, and all funds benefit if those costs can be allocated among more assets. The Board concluded that, given the group fee structure, fund shareholders will benefit from lower management fees as group assets increase at the fund complex level, regardless of whether Fidelity achieves any such economies of scale.
The Board concluded, taking into account the analysis of the Economies of Scale Committee, that economies of scale, if any, are being appropriately shared between fund shareholders and Fidelity.
Additional Information Requested by the Board. In order to develop fully the factual basis for consideration of the Fidelity funds' Advisory Contracts, the Board requested and received additional information on certain topics, including: (i) fund performance trends and Fidelity's long-term strategies for certain funds; (ii) the various share classes employed by Fidelity and the attributes of each class, together with similar information on the distribution and servicing payments made by Fidelity or the funds to third-party participants in the distribution channels; (iii) fund profitability, and fund performance in relation to fund profitability; (iv) the methodology with respect to evaluating competitive fund data and peer group classifications and fee comparisons; (v) annual fund profitability margins, with particular focus on certain funds with negative margins; (vi) the realization of fall-out benefits in certain Fidelity business units; (vii) economies of scale and the way in which they are shared with fund shareholders; (viii) Fidelity's group fee structures, including the group fee schedule of breakpoints; (ix) the impact of cost containment measures on the funds; and (x) the transfer agent fee structure.
Annual Report
Based on its evaluation of all of the conclusions noted above, and after considering all factors it believed relevant, the Board concluded that the advisory fee structures are fair and reasonable, and that the fund's Advisory Contracts should be renewed.
Annual Report
Investment Adviser
Fidelity Management & Research Company
Boston, MA
Investment Sub-Advisers
FMR Co., Inc.
FMR Investment Management
(U.K.) Limited
FIL Investments (Japan) Limited
FIL Investment Advisors
FIL Investment Advisors
(UK) Limited
Fidelity Management & Research
(Hong Kong) Limited
Fidelity Management & Research
(Japan) Limited
General Distributor
Fidelity Distributors Corporation
Smithfield, RI
Transfer and Service Agents
Fidelity Investments Institutional
Operations Company, Inc.
Boston, MA
Fidelity Service Company, Inc.
Boston, MA
Custodian
State Street Bank and Trust Company
Quincy, MA
The Fidelity Telephone Connection
Mutual Fund 24-Hour Service
Exchanges/Redemptions
and Account Assistance 1-800-544-6666
Product Information 1-800-544-6666
Retirement Accounts 1-800-544-4774
(8 a.m. - 9 p.m.)
TDD Service 1-800-544-0118
for the deaf and hearing impaired
(9 a.m. - 9 p.m. Eastern time)
Fidelity Automated Service
Telephone (FAST®)
1-800-544-5555

Automated line for quickest service
(Fidelity Investment logo)(registered trademark)
Corporate Headquarters
245 Summer St., Boston, MA 02210
www.fidelity.com
GCS-UANN-1215
1.879379.106
(Fidelity Investment logo)(registered trademark)
Fidelity Advisor®
Global Commodity Stock
Fund - Class A, Class T, Class B
and Class C
Annual Report
October 31, 2015
(Fidelity Cover Art)
Class A, Class T, Class B,
and Class C are classes
of Fidelity® Global Commodity
Stock Fund
Contents
Performance | (Click Here) | How the fund has done over time. |
Management's Discussion of Fund Performance | (Click Here) | The Portfolio Manager's review of fund performance and strategy. |
Shareholder Expense Example | (Click Here) | An example of shareholder expenses. |
Investment Changes | (Click Here) | A summary of major shifts in the fund's investments over the past six months. |
Investments | (Click Here) | A complete list of the fund's investments with their market values. |
Financial Statements | (Click Here) | Statements of assets and liabilities, operations, and changes in net assets, as well as financial highlights. |
Notes | (Click Here) | Notes to the financial statements. |
Report of Independent Registered Public Accounting Firm | (Click Here) | |
Trustees and Officers | (Click Here) | |
Distributions | (Click Here) | |
Board Approval of Investment Advisory Contracts and Management Fees | (Click Here) | |
To view a fund's proxy voting guidelines and proxy voting record for the 12-month period ended June 30, visit http://www.fidelity.com/proxyvotingresults or visit the Securities and Exchange Commission's (SEC) web site at http://www.sec.gov. You may also call 1-877-208-0098 to request a free copy of the proxy voting guidelines.
Standard & Poor's, S&P and S&P 500 are registered service marks of The McGraw-Hill Companies, Inc. and have been licensed for use by Fidelity Distributors Corporation.
Other third-party marks appearing herein are the property of their respective owners.
All other marks appearing herein are registered or unregistered trademarks or service marks of FMR LLC or an affiliated company. © 2015 FMR LLC. All rights reserved.
Annual Report
This report and the financial statements contained herein are submitted for the general information of the shareholders of the fund. This report is not authorized for distribution to prospective investors in the fund unless preceded or accompanied by an effective prospectus.
A fund files its complete schedule of portfolio holdings with the SEC for the first and third quarters of each fiscal year on Form N-Q. Forms N-Q are available on the SEC's web site at http://www.sec.gov. A fund's Forms N-Q may be reviewed and copied at the SEC's Public Reference Room in Washington, DC. Information regarding the operation of the SEC's Public Reference Room may be obtained by calling 1-800-SEC-0330. For a complete list of a fund's portfolio holdings, view the most recent holdings listing, semiannual report, or annual report on Fidelity's web site at http://www.fidelity.com, http://www.advisor.fidelity.com, or http://www.401k.com, as applicable.
NOT FDIC INSURED • MAY LOSE VALUE • NO BANK GUARANTEE
Neither the fund nor Fidelity Distributors Corporation is a bank.
Annual Report
Average annual total return reflects the change in the value of an investment, assuming reinvestment of the class' distributions from dividend income and capital gains (the profits earned upon the sale of securities that have grown in value, if any) and assuming a constant rate of performance each year. The $10,000 table and the fund's returns do not reflect the deduction of taxes that a shareholder would pay on fund distributions or the redemption of fund shares. During periods of reimbursement by Fidelity, a fund's total return will be greater than it would be had the reimbursement not occurred. How a fund did yesterday is no guarantee of how it will do tomorrow.
Average Annual Total Returns
Periods ended October 31, 2015 | Past 1
year | Past 5
years | Life of
fund A |
Class A (incl. 5.75% sales charge) | -27.58% | -8.59% | 0.02% |
Class T (incl. 3.50% sales charge) | -26.08% | -8.41% | 0.10% |
Class B (incl. contingent deferred sales charge) B | -27.56% | -8.58% | 0.15% |
Class C (incl. contingent deferred sales charge) C | -24.50% | -8.20% | 0.15% |
A From March 25, 2009.
B Class B shares' contingent deferred sales charges included in the past one year, past 5 years, and life of fund total return figures are 5%, 2%, and 0%, respectively.
C Class C shares' contingent deferred sales charges included in the past one year, past 5 years, and life of fund total return figures are 1%, 0%, and 0%, respectively.
Annual Report
$10,000 Over Life of Fund
Let's say hypothetically that $10,000 was invested in Fidelity Advisor® Global Commodity Stock Fund - Class A on March 25, 2009, when the fund started, and the current 5.75% sales charge was paid. The chart shows how the value of your investment would have changed, and also shows how the MSCI ACWI (All Country World Index) Index performed over the same period.
Annual Report
Market Recap: Following an August and September wherein a collapse in commodities prices hurt resources-related sectors and geographies, global equities rebounded in October to finish flat for the 12 months ending October 31, 2015. The MSCI ACWI (All Country World Index) Index returned 0.35% for the period. Commodity producers remained under pressure for much of the past year, largely related to economic deceleration in China (-1%), the world's second-largest economy and a leading consumer of raw materials. This effect was exacerbated by the strength of the U.S. dollar relative to global currencies, which weighed on commodities priced in dollars and acutely impacted equity returns within regions most exposed to resources prices. For example, the emerging-markets group returned -15% this period. Canada, a significant energy producer, returned about -17%. Conversely, net energy consumer Japan (+9%) proved the best-performing region by far. Only about a quarter of the nearly 50 countries in the index managed a gain: Israel (+17%) and fast-growing Ireland (+12%) performed best; Greece (-56%) and Brazil (-46%), among the worst. As for sectors, energy (-22%) and materials (-12%) declined sharply, while consumer discretionary (+13%) saw a gain driven largely by demand in the United States (+5%).
Comments from Portfolio Manager S. Joseph Wickwire II, CFA: For the year, the fund's share classes (excluding sales charges, if applicable) performed roughly in line with the -22.98% return of the industry benchmark, the MSCI AC World Commodity Producers Sector Capped Index. In a difficult market for commodity stocks, the fund significantly underperformed the broader global market, as measured by the MSCI ACWI (All Country World Index) Index. Versus the MSCI industry index, the fund was helped by stock picking in oil & gas exploration & production, agricultural & farm machinery, and paper packaging. Positioning in gold and fertilizers & agricultural chemicals also helped. Among individual stocks, overweighting fertilizer firms CF Industries Holdings and Agrium was additive, along with larger-than-benchmark stakes in several gold-related names. Conversely, the fund was hurt by positioning in the paper products industry and its stake in coal firm Peabody Energy, which was eliminated by period end. An out-of-benchmark stake in fertilizer firm Intrepid Potash was the fund's largest relative detractor, followed by an underweighting in Exxon Mobil.
The views expressed above reflect those of the portfolio manager(s) only through the end of the period as stated on the cover of this report and do not necessarily represent the views of Fidelity or any other person in the Fidelity organization. Any such views are subject to change at any time based upon market or other conditions and Fidelity disclaims any responsibility to update such views. These views may not be relied on as investment advice and, because investment decisions for a Fidelity fund are based on numerous factors, may not be relied on as an indication of trading intent on behalf of any Fidelity fund.
Annual Report
Shareholder Expense Example
As a shareholder of the Fund, you incur two types of costs: (1) transaction costs, including sales charges (loads) on purchase payments or redemption proceeds, redemption fees and (2) ongoing costs, including management fees, distribution and/or service (12b-1) fees and other Fund expenses. This Example is intended to help you understand your ongoing costs (in dollars) of investing in the Fund and to compare these costs with the ongoing costs of investing in other mutual funds.
The Example is based on an investment of $1,000 invested at the beginning of the period and held for the entire period (May 1, 2015 to October 31, 2015).
Actual Expenses
The first line of the accompanying table for each class of the Fund provides information about actual account values and actual expenses. You may use the information in this line, together with the amount you invested, to estimate the expenses that you paid over the period. Simply divide your account value by $1,000.00 (for example, an $8,600 account value divided by $1,000.00 = 8.6), then multiply the result by the number in the first line for a class of the Fund under the heading entitled "Expenses Paid During Period" to estimate the expenses you paid on your account during this period. A small balance maintenance fee of $12.00 that is charged once a year may apply for certain accounts with a value of less than $2,000. This fee is not included in the table below. If it was, the estimate of expenses you paid during the period would be higher, and your ending account value lower, by this amount. In addition, the Fund, as a shareholder in the underlying Fidelity Central Funds, will indirectly bear its pro-rata share of the fees and expenses incurred by the underlying Fidelity Central Funds. These fees and expenses are not included in the Fund's annualized expense ratio used to calculate the expense estimate in the table below.
Hypothetical Example for Comparison Purposes
The second line of the accompanying table for each class of the Fund provides information about hypothetical account values and hypothetical expenses based on a Class' actual expense ratio and an assumed rate of return of 5% per year before expenses, which is not the Class' actual return. The hypothetical account values and expenses may not be used to estimate the actual ending account balance or expenses you paid for the period. You may use this information to compare the ongoing costs of investing in the Fund and other funds. To do so, compare this 5% hypothetical example with the 5% hypothetical examples that appear in the shareholder reports of the other funds. A small balance maintenance fee of $12.00 that is charged once a year may apply for certain accounts with a value of less than $2,000. This fee is not included in the table below. If it was, the estimate of expenses you paid during the period would be higher, and your ending account value lower, by this amount. In addition, the Fund, as a shareholder in the underlying Fidelity Central Funds, will indirectly bear its pro-rata share of the fees and expenses incurred by the underlying Fidelity Central Funds. These fees and expenses are not included in the Fund's annualized expense ratio used to calculate the expense estimate in the table below.
Please note that the expenses shown in the table are meant to highlight your ongoing costs only and do not reflect any transaction costs. Therefore, the second line of the table is useful in comparing ongoing costs only, and will not help you determine the relative total costs of owning different funds. In addition, if these transactional costs were included, your costs would have been higher.
Annual Report
| Annualized
Expense RatioB | Beginning
Account Value
May 1, 2015 | Ending
Account Value
October 31, 2015 | Expenses Paid
During PeriodC
May 1, 2015 to
October 31, 2015 |
Class A | 1.33% | | | |
Actual | | $ 1,000.00 | $ 782.10 | $ 5.97 |
HypotheticalA | | $ 1,000.00 | $ 1,018.50 | $ 6.77 |
Class T | 1.61% | | | |
Actual | | $ 1,000.00 | $ 781.00 | $ 7.23 |
HypotheticalA | | $ 1,000.00 | $ 1,017.09 | $ 8.19 |
Class B | 2.10% | | | |
Actual | | $ 1,000.00 | $ 779.50 | $ 9.42 |
HypotheticalA | | $ 1,000.00 | $ 1,014.62 | $ 10.66 |
Class C | 2.10% | | | |
Actual | | $ 1,000.00 | $ 779.30 | $ 9.42 |
HypotheticalA | | $ 1,000.00 | $ 1,014.62 | $ 10.66 |
Global Commodity Stock | 1.10% | | | |
Actual | | $ 1,000.00 | $ 783.40 | $ 4.94 |
HypotheticalA | | $ 1,000.00 | $ 1,019.66 | $ 5.60 |
Class I | 1.06% | | | |
Actual | | $ 1,000.00 | $ 783.40 | $ 4.76 |
HypotheticalA | | $ 1,000.00 | $ 1,019.86 | $ 5.40 |
A 5% return per year before expenses
B Annualized expense ratio reflects expenses net of applicable fee waivers.
C Expenses are equal to each Class' annualized expense ratio, multiplied by the average account value over the period, multiplied by 184/365 (to reflect the one-half year period).
Annual Report
Investment Changes (Unaudited)
Annual Report
Investments October 31, 2015
Showing Percentage of Net Assets
Common Stocks - 99.1% |
| Shares | | Value |
AEROSPACE & DEFENSE - 0.3% |
Aerospace & Defense - 0.3% |
Rolls-Royce Group PLC | 67,900 | | $ 718,010 |
CHEMICALS - 30.5% |
Commodity Chemicals - 0.3% |
LyondellBasell Industries NV Class A | 7,600 | | 706,116 |
Diversified Chemicals - 0.6% |
Eastman Chemical Co. | 19,200 | | 1,385,664 |
Fertilizers & Agricultural Chemicals - 29.6% |
Agrium, Inc. | 95,100 | | 8,847,442 |
CF Industries Holdings, Inc. | 115,560 | | 5,866,981 |
Intrepid Potash, Inc. (a) | 570,800 | | 2,203,288 |
K&S AG | 45,900 | | 1,158,629 |
Monsanto Co. | 170,000 | | 15,847,392 |
Potash Corp. of Saskatchewan, Inc. | 554,600 | | 11,231,117 |
Sociedad Quimica y Minera de Chile SA (PN-B) sponsored ADR | 165,200 | | 3,201,576 |
Syngenta AG (Switzerland) | 25,297 | | 8,499,044 |
The Mosaic Co. | 267,759 | | 9,047,577 |
Yara International ASA | 52,400 | | 2,378,637 |
| | 68,281,683 |
TOTAL CHEMICALS | | 70,373,463 |
CONSTRUCTION MATERIALS - 0.2% |
Construction Materials - 0.2% |
West China Cement Ltd. | 2,914,000 | | 500,991 |
CONTAINERS & PACKAGING - 1.3% |
Paper Packaging - 1.3% |
WestRock Co. | 54,359 | | 2,922,340 |
ELECTRICAL EQUIPMENT - 0.6% |
Electrical Components & Equipment - 0.6% |
Eaton Corp. PLC | 19,000 | | 1,062,290 |
SolarCity Corp. (a)(d) | 14,700 | | 435,855 |
| | 1,498,145 |
ENERGY EQUIPMENT & SERVICES - 0.9% |
Oil & Gas Equipment & Services - 0.9% |
Amec Foster Wheeler PLC | 52,381 | | 574,136 |
Ezion Holdings Ltd. | 1,199,700 | | 597,331 |
Common Stocks - continued |
| Shares | | Value |
ENERGY EQUIPMENT & SERVICES - CONTINUED |
Oil & Gas Equipment & Services - continued |
SBM Offshore NV (a)(d) | 33,900 | | $ 464,672 |
Schlumberger Ltd. | 6,300 | | 492,408 |
| | 2,128,547 |
FOOD PRODUCTS - 2.6% |
Agricultural Products - 2.6% |
Archer Daniels Midland Co. | 39,100 | | 1,785,306 |
Bunge Ltd. | 9,700 | | 707,712 |
Darling International, Inc. (a) | 86,600 | | 876,392 |
First Resources Ltd. | 834,000 | | 1,117,200 |
Golden Agri-Resources Ltd. | 2,314,000 | | 642,187 |
PT Charoen Pokphand Indonesia Tbk | 1,920,700 | | 349,184 |
SLC Agricola SA | 101,100 | | 451,425 |
| | 5,929,406 |
INDEPENDENT POWER AND RENEWABLE ELECTRICITY PRODUCERS - 0.7% |
Independent Power Producers & Energy Traders - 0.5% |
China Resources Power Holdings Co. Ltd. | 224,000 | | 506,726 |
Dynegy, Inc. (a) | 30,800 | | 598,444 |
| | 1,105,170 |
Renewable Electricity - 0.2% |
NextEra Energy Partners LP | 19,600 | | 514,696 |
TOTAL INDEPENDENT POWER AND RENEWABLE ELECTRICITY PRODUCERS | | 1,619,866 |
MACHINERY - 2.5% |
Agricultural & Farm Machinery - 1.4% |
AGCO Corp. | 15,700 | | 759,723 |
Deere & Co. | 25,100 | | 1,957,800 |
Jain Irrigation Systems Ltd. | 579,003 | | 545,623 |
| | 3,263,146 |
Construction Machinery & Heavy Trucks - 0.3% |
Manitowoc Co., Inc. (d) | 48,700 | | 745,110 |
Industrial Machinery - 0.8% |
Andritz AG | 23,200 | | 1,168,444 |
The Weir Group PLC | 36,500 | | 600,384 |
| | 1,768,828 |
TOTAL MACHINERY | | 5,777,084 |
Common Stocks - continued |
| Shares | | Value |
METALS & MINING - 25.9% |
Aluminum - 0.9% |
Alcoa, Inc. | 183,600 | | $ 1,639,548 |
Norsk Hydro ASA | 132,900 | | 476,019 |
| | 2,115,567 |
Diversified Metals & Mining - 13.6% |
Anglo American PLC (United Kingdom) | 226,551 | | 1,900,700 |
BHP Billiton PLC | 672,746 | | 10,753,200 |
Boliden AB | 37,700 | | 721,915 |
First Quantum Minerals Ltd. | 103,824 | | 554,215 |
Freeport-McMoRan, Inc. | 105,100 | | 1,237,027 |
Glencore Xstrata PLC | 1,482,334 | | 2,570,812 |
Grupo Mexico SA de CV Series B | 470,111 | | 1,145,266 |
Ivanhoe Mines Ltd. (a) | 1,036,000 | | 554,604 |
Ivanhoe Mines Ltd. Class A warrants 12/10/15 (a)(e) | 422,500 | | 1,616 |
MMC Norilsk Nickel PJSC sponsored ADR | 30,700 | | 455,895 |
Rio Tinto PLC | 272,287 | | 9,923,574 |
South32 Ltd. (a) | 635,336 | | 657,900 |
Teck Resources Ltd. Class B (sub. vtg.) | 78,900 | | 462,201 |
Vedanta Ltd. (a) | 343,066 | | 521,572 |
| | 31,460,497 |
Gold - 5.8% |
Acacia Mining PLC | 20,000 | | 59,506 |
Agnico Eagle Mines Ltd. (Canada) | 35,600 | | 1,006,253 |
Argonaut Gold, Inc. (a) | 510,400 | | 526,950 |
B2Gold Corp. (a) | 1,488,180 | | 1,604,721 |
Barrick Gold Corp. | 187,900 | | 1,444,169 |
Continental Gold, Inc. (a) | 374,900 | | 467,335 |
Eldorado Gold Corp. | 127,150 | | 444,383 |
Franco-Nevada Corp. | 17,600 | | 892,652 |
Goldcorp, Inc. | 144,310 | | 1,846,365 |
New Gold, Inc. (a) | 177,700 | | 440,309 |
Newcrest Mining Ltd. (a) | 52,027 | | 453,221 |
Newmont Mining Corp. | 85,000 | | 1,654,100 |
Premier Gold Mines Ltd. (a) | 254,100 | | 466,381 |
Randgold Resources Ltd. sponsored ADR | 15,100 | | 1,009,737 |
Royal Gold, Inc. | 10,400 | | 497,536 |
Torex Gold Resources, Inc. (a) | 513,700 | | 487,143 |
| | 13,300,761 |
Common Stocks - continued |
| Shares | | Value |
METALS & MINING - CONTINUED |
Precious Metals & Minerals - 0.3% |
Impala Platinum Holdings Ltd. (a) | 60,500 | | $ 165,338 |
Tahoe Resources, Inc. | 59,000 | | 492,719 |
| | 658,057 |
Silver - 0.4% |
Silver Wheaton Corp. | 72,900 | | 990,695 |
Steel - 4.9% |
Aperam (a) | 15,200 | | 469,599 |
ArcelorMittal SA Class A unit (d) | 181,300 | | 1,017,093 |
Hitachi Metals Ltd. | 5,400 | | 61,160 |
Hyundai Steel Co. | 13,323 | | 607,941 |
JFE Holdings, Inc. | 47,300 | | 743,581 |
Nippon Steel & Sumitomo Metal Corp. | 118,000 | | 2,392,161 |
Nucor Corp. | 46,600 | | 1,971,180 |
POSCO | 11,061 | | 1,776,050 |
Steel Dynamics, Inc. | 26,400 | | 487,608 |
SunCoke Energy Partners LP | 49,700 | | 525,826 |
Thyssenkrupp AG | 63,200 | | 1,274,939 |
| | 11,327,138 |
TOTAL METALS & MINING | | 59,852,715 |
MULTI-UTILITIES - 0.3% |
Multi-Utilities - 0.3% |
E.ON AG | 66,804 | | 704,726 |
OIL, GAS & CONSUMABLE FUELS - 28.2% |
Coal & Consumable Fuels - 0.3% |
Cameco Corp. | 35,600 | | 504,215 |
Coal India Ltd. | 55,487 | | 270,828 |
| | 775,043 |
Integrated Oil & Gas - 13.2% |
BG Group PLC | 28,800 | | 454,998 |
BP PLC | 798,500 | | 4,745,480 |
Chevron Corp. | 96,000 | | 8,724,480 |
China Petroleum & Chemical Corp. (H Shares) | 682,000 | | 491,616 |
Exxon Mobil Corp. | 5,700 | | 471,618 |
Lukoil PJSC sponsored ADR | 29,900 | | 1,085,370 |
Occidental Petroleum Corp. | 6,600 | | 491,964 |
Royal Dutch Shell PLC Class A (United Kingdom) | 172,300 | | 4,498,301 |
Statoil ASA | 67,100 | | 1,084,623 |
Common Stocks - continued |
| Shares | | Value |
OIL, GAS & CONSUMABLE FUELS - CONTINUED |
Integrated Oil & Gas - continued |
Suncor Energy, Inc. | 101,632 | | $ 3,024,244 |
Total SA | 104,400 | | 5,048,663 |
YPF SA Class D sponsored ADR | 24,700 | | 527,592 |
| | 30,648,949 |
Oil & Gas Exploration & Production - 14.5% |
Anadarko Petroleum Corp. | 51,200 | | 3,424,256 |
Apache Corp. | 33,300 | | 1,569,429 |
Cabot Oil & Gas Corp. | 78,700 | | 1,708,577 |
California Resources Corp. | 160,200 | | 647,208 |
Canadian Natural Resources Ltd. | 53,000 | | 1,228,939 |
Cimarex Energy Co. | 4,400 | | 519,464 |
CNOOC Ltd. sponsored ADR | 14,900 | | 1,693,832 |
Cobalt International Energy, Inc. (a) | 136,100 | | 1,043,887 |
ConocoPhillips Co. | 64,200 | | 3,425,070 |
Continental Resources, Inc. (a) | 30,300 | | 1,027,473 |
Devon Energy Corp. | 43,600 | | 1,828,148 |
Encana Corp. | 111,400 | | 847,683 |
EOG Resources, Inc. | 32,600 | | 2,798,710 |
EQT Corp. | 23,400 | | 1,546,038 |
Hess Corp. | 10,200 | | 573,342 |
Marathon Oil Corp. | 58,100 | | 1,067,878 |
Memorial Resource Development Corp. (a) | 32,700 | | 578,463 |
Newfield Exploration Co. (a) | 12,400 | | 498,356 |
Noble Energy, Inc. | 47,300 | | 1,695,232 |
NOVATEK OAO GDR (Reg. S) | 8,200 | | 749,890 |
PDC Energy, Inc. (a) | 13,100 | | 790,454 |
Pioneer Natural Resources Co. | 3,610 | | 495,075 |
SM Energy Co. | 25,100 | | 837,085 |
Southwestern Energy Co. (a) | 161,700 | | 1,785,168 |
Tullow Oil PLC | 183,800 | | 574,909 |
Whiting Petroleum Corp. (a) | 27,300 | | 470,379 |
| | 33,424,945 |
Oil & Gas Storage & Transport - 0.2% |
Golar LNG Ltd. | 13,269 | | 384,934 |
TOTAL OIL, GAS & CONSUMABLE FUELS | | 65,233,871 |
PAPER & FOREST PRODUCTS - 4.2% |
Forest Products - 0.3% |
West Fraser Timber Co. Ltd. | 20,000 | | 707,709 |
Common Stocks - continued |
| Shares | | Value |
PAPER & FOREST PRODUCTS - CONTINUED |
Paper Products - 3.9% |
Fibria Celulose SA | 35,300 | | $ 481,828 |
International Paper Co. | 112,300 | | 4,794,087 |
Mondi PLC | 98,900 | | 2,293,062 |
Stora Enso Oyj (R Shares) | 57,700 | | 535,834 |
UPM-Kymmene Corp. | 44,800 | | 839,957 |
| | 8,944,768 |
TOTAL PAPER & FOREST PRODUCTS | | 9,652,477 |
REAL ESTATE INVESTMENT TRUSTS - 0.6% |
Specialized REITs - 0.6% |
Potlatch Corp. | 15,500 | | 484,220 |
Weyerhaeuser Co. | 32,400 | | 950,292 |
| | 1,434,512 |
TRADING COMPANIES & DISTRIBUTORS - 0.3% |
Trading Companies & Distributors - 0.3% |
Daewoo International Corp. | 35,906 | | 627,381 |
TOTAL COMMON STOCKS (Cost $346,268,311) |
228,973,534
|
Nonconvertible Preferred Stocks - 0.8% |
| | | |
AEROSPACE & DEFENSE - 0.0% |
Aerospace & Defense - 0.0% |
Rolls-Royce Group PLC | 6,294,330 | | 9,703 |
METALS & MINING - 0.6% |
Steel - 0.6% |
Vale SA (PN-A) sponsored ADR (d) | 399,000 | | 1,436,400 |
OIL, GAS & CONSUMABLE FUELS - 0.2% |
Integrated Oil & Gas - 0.2% |
Petroleo Brasileiro SA - Petrobras (PN) sponsored (non-vtg.) (a) | 123,600 | | 493,164 |
TOTAL NONCONVERTIBLE PREFERRED STOCKS (Cost $6,568,135) |
1,939,267
|
Money Market Funds - 1.3% |
| Shares | | Value |
Fidelity Securities Lending Cash Central Fund, 0.19% (b)(c)
(Cost $2,883,740) | 2,883,740 | | $ 2,883,740 |
TOTAL INVESTMENT PORTFOLIO - 101.2% (Cost $355,720,186) | | 233,796,541 |
NET OTHER ASSETS (LIABILITIES) - (1.2)% | | (2,771,389) |
NET ASSETS - 100% | $ 231,025,152 |
Legend |
(a) Non-income producing |
(b) Affiliated fund that is generally available only to investment companies and other accounts managed by Fidelity Investments. The rate quoted is the annualized seven-day yield of the fund at period end. A complete unaudited listing of the fund's holdings as of its most recent quarter end is available upon request. In addition, each Fidelity Central Fund's financial statements, which are not covered by the Fund's Report of Independent Registered Public Accounting Firm, are available on the SEC's website or upon request. |
(c) Investment made with cash collateral received from securities on loan. |
(d) Security or a portion of the security is on loan at period end. |
(e) Security exempt from registration under Rule 144A of the Securities Act of 1933. These securities may be resold in transactions exempt from registration, normally to qualified institutional buyers. At the end of the period, the value of these securities amounted to $1,616 or 0.0% of net assets. |
Affiliated Central Funds |
Information regarding fiscal year to date income earned by the Fund from investments in Fidelity Central Funds is as follows: |
Fund | Income earned |
Fidelity Cash Central Fund | $ 807 |
Fidelity Securities Lending Cash Central Fund | 150,371 |
Total | $ 151,178 |
Other Information |
The following is a summary of the inputs used, as of October 31, 2015, involving the Fund's assets and liabilities carried at fair value. The inputs or methodology used for valuing securities may not be an indication of the risk associated with investing in those securities. For more information on valuation inputs, and their aggregation into the levels used in the table below, please refer to the Investment Valuation section in the accompanying Notes to Financial Statements. |
Valuation Inputs at Reporting Date: |
Description | Total | Level 1 | Level 2 | Level 3 |
Investments in Securities: | | | | |
Common Stocks | $ 228,973,534 | $ 168,537,249 | $ 60,434,669 | $ 1,616 |
Nonconvertible Preferred Stocks | 1,939,267 | 1,939,267 | - | - |
Money Market Funds | 2,883,740 | 2,883,740 | - | - |
Total Investments in Securities: | $ 233,796,541 | $ 173,360,256 | $ 60,434,669 | $ 1,616 |
Distribution of investments by country or territory of incorporation, as a percentage of total net assets, is as follows (Unaudited): |
United States of America | 42.3% |
Canada | 16.9% |
United Kingdom | 16.0% |
Switzerland | 3.7% |
France | 2.2% |
Bailiwick of Jersey | 1.8% |
Norway | 1.7% |
Chile | 1.4% |
Germany | 1.4% |
Korea (South) | 1.4% |
Japan | 1.3% |
Brazil | 1.2% |
Russia | 1.0% |
Others (Individually Less Than 1%) | 7.7% |
| 100.0% |
See accompanying notes which are an integral part of the financial statements.
Annual Report
Statement of Assets and Liabilities
| | October 31, 2015 |
| | |
Assets | | |
Investment in securities, at value (including securities loaned of $2,674,064) - See accompanying schedule: Unaffiliated issuers (cost $352,836,446) | $ 230,912,801 | |
Fidelity Central Funds (cost $2,883,740) | 2,883,740 | |
Total Investments (cost $355,720,186) | | $ 233,796,541 |
Receivable for investments sold | | 2,055,645 |
Receivable for fund shares sold | | 111,112 |
Dividends receivable | | 704,389 |
Distributions receivable from Fidelity Central Funds | | 17,059 |
Prepaid expenses | | 736 |
Other receivables | | 5,526 |
Total assets | | 236,691,008 |
| | |
Liabilities | | |
Payable to custodian bank | $ 583,137 | |
Payable for investments purchased | 1,672,596 | |
Payable for fund shares redeemed | 253,324 | |
Accrued management fee | 137,667 | |
Distribution and service plan fees payable | 19,720 | |
Other affiliated payables | 66,953 | |
Other payables and accrued expenses | 48,719 | |
Collateral on securities loaned, at value | 2,883,740 | |
Total liabilities | | 5,665,856 |
| | |
Net Assets | | $ 231,025,152 |
Net Assets consist of: | | |
Paid in capital | | $ 417,503,217 |
Undistributed net investment income | | 4,650,806 |
Accumulated undistributed net realized gain (loss) on investments and foreign currency transactions | | (69,179,434) |
Net unrealized appreciation (depreciation) on investments and assets and liabilities in foreign currencies | | (121,949,437) |
Net Assets | | $ 231,025,152 |
See accompanying notes which are an integral part of the financial statements.
Annual Report
Statement of Assets and Liabilities - continued
| | October 31, 2015 |
| | |
Calculation of Maximum Offering Price | | |
Class A:
Net Asset Value and redemption price per share ($31,391,241 ÷ 3,123,473 shares) | | $ 10.05 |
| | |
Maximum offering price per share (100/94.25 of $10.05) | | $ 10.66 |
Class T:
Net Asset Value and redemption price per share ($6,335,000 ÷ 632,077 shares) | | $ 10.02 |
| | |
Maximum offering price per share (100/96.50 of $10.02) | | $ 10.38 |
Class B:
Net Asset Value and offering price per share ($864,320 ÷ 86,721 shares)A | | $ 9.97 |
| | |
Class C:
Net Asset Value and offering price per share ($11,273,614 ÷ 1,136,673 shares)A | | $ 9.92 |
| | |
Global Commodity Stock:
Net Asset Value, offering price and redemption price per share ($156,319,517 ÷ 15,497,777 shares) | | $ 10.09 |
| | |
Class I:
Net Asset Value, offering price and redemption price per share ($24,841,460 ÷ 2,462,815 shares) | | $ 10.09 |
A Redemption price per share is equal to net asset value less any applicable contingent deferred sales charge.
See accompanying notes which are an integral part of the financial statements.
Annual Report
Financial Statements - continued
Statement of Operations
| Year ended October 31, 2015 |
| | |
Investment Income | | |
Dividends | | $ 9,373,059 |
Income from Fidelity Central Funds | | 151,178 |
Income before foreign taxes withheld | | 9,524,237 |
Less foreign taxes withheld | | (486,789) |
Total income | | 9,037,448 |
| | |
Expenses | | |
Management fee | $ 1,985,858 | |
Transfer agent fees | 823,072 | |
Distribution and service plan fees | 302,688 | |
Accounting and security lending fees | 149,834 | |
Custodian fees and expenses | 54,429 | |
Independent trustees' compensation | 1,243 | |
Registration fees | 84,599 | |
Audit | 53,551 | |
Legal | 751 | |
Miscellaneous | 1,739 | |
Total expenses before reductions | 3,457,764 | |
Expense reductions | (21,513) | 3,436,251 |
Net investment income (loss) | | 5,601,197 |
Realized and Unrealized Gain (Loss) | | |
Net realized gain (loss) on: | | |
Investment securities: | | |
Unaffiliated issuers | (22,678,481) | |
Foreign currency transactions | (62,976) | |
Total net realized gain (loss) | | (22,741,457) |
Change in net unrealized appreciation (depreciation) on: Investment securities | (54,121,042) | |
Assets and liabilities in foreign currencies | (8,151) | |
Total change in net unrealized appreciation (depreciation) | | (54,129,193) |
Net gain (loss) | | (76,870,650) |
Net increase (decrease) in net assets resulting from operations | | $ (71,269,453) |
See accompanying notes which are an integral part of the financial statements.
Annual Report
Statement of Changes in Net Assets
| Year ended
October 31,
2015 | Year ended
October 31,
2014 |
Increase (Decrease) in Net Assets | | |
Operations | | |
Net investment income (loss) | $ 5,601,197 | $ 4,495,175 |
Net realized gain (loss) | (22,741,457) | (3,681,278) |
Change in net unrealized appreciation (depreciation) | (54,129,193) | (18,645,040) |
Net increase (decrease) in net assets resulting from operations | (71,269,453) | (17,831,143) |
Distributions to shareholders from net investment income | (3,898,874) | (4,765,250) |
Distributions to shareholders from net realized gain | (629,272) | (367,709) |
Total distributions | (4,528,146) | (5,132,959) |
Share transactions - net increase (decrease) | (20,805,112) | (64,489,864) |
Redemption fees | 7,987 | 7,328 |
Total increase (decrease) in net assets | (96,594,724) | (87,446,638) |
| | |
Net Assets | | |
Beginning of period | 327,619,876 | 415,066,514 |
End of period (including undistributed net investment income of $4,650,806 and undistributed net investment income of $3,567,856, respectively) | $ 231,025,152 | $ 327,619,876 |
See accompanying notes which are an integral part of the financial statements.
Annual Report
Financial Highlights - Fidelity Global Commodity Stock Fund Class A
Years ended October 31, | 2015 | 2014 | 2013 | 2012 | 2011 |
Selected Per-Share Data | | | | | |
Net asset value, beginning of period | $ 13.25 | $ 14.17 | $ 14.59 | $ 15.14 | $ 15.60 |
Income from Investment Operations | | | | | |
Net investment income (loss) C | .22 | .15 | .16 | .11 | .12 |
Net realized and unrealized gain (loss) | (3.25) | (.91) | (.45) | (.59) | (.38) |
Total from investment operations | (3.03) | (.76) | (.29) | (.48) | (.26) |
Distributions from net investment income | (.14) | (.15) | (.13) | (.05) | (.13) |
Distributions from net realized gain | (.03) | (.01) | - | (.01) | (.06) |
Total distributions | (.17) | (.16) | (.13) | (.07) H | (.20) I |
Redemption fees added to paid in capitalC,G | - | - | - | - | - |
Net asset value, end of period | $ 10.05 | $ 13.25 | $ 14.17 | $ 14.59 | $ 15.14 |
Total ReturnA, B | (23.16)% | (5.41)% | (2.00)% | (3.19)% | (1.80)% |
Ratios to Average Net AssetsD, F | | | | | |
Expenses before reductions | 1.34% | 1.35% | 1.36% | 1.34% | 1.32% |
Expenses net of fee waivers, if any | 1.34% | 1.35% | 1.35% | 1.34% | 1.32% |
Expenses net of all reductions | 1.34% | 1.35% | 1.34% | 1.33% | 1.31% |
Net investment income (loss) | 1.85% | 1.05% | 1.12% | .80% | .71% |
Supplemental Data | | | | | |
Net assets, end of period (000 omitted) | $ 31,391 | $ 51,586 | $ 71,293 | $ 99,694 | $ 127,979 |
Portfolio turnover rateE | 77% | 75% | 65% | 91% | 71% |
A Total returns would have been lower if certain expenses had not been reduced during the applicable periods shown.
B Total returns do not include the effect of the sales charges.
C Calculated based on average shares outstanding during the period.
D Fees and expenses of any underlying Fidelity Central Funds are not included in the Fund's expense ratio. The Fund indirectly bears its proportionate share of the expenses of any underlying Fidelity Central Funds.
E Amount does not include the portfolio activity of any underlying Fidelity Central Funds.
F Expense ratios reflect operating expenses of the class. Expenses before reductions do not reflect amounts reimbursed by the investment adviser or reductions from brokerage service arrangements or reductions from other expense offset arrangements and do not represent the amount paid by the class during periods when reimbursements or reductions occur. Expenses net of fee waivers reflect expenses after reimbursement by the investment adviser but prior to reductions from brokerage service arrangements or other expense offset arrangements. Expenses net of all reductions represent the net expenses paid by the class.
G Amount represents less than $.005 per share.
H Total distributions of $.07 per share is comprised of distributions from net investment income of $.052 and distributions from net realized gain of $.014 per share.
I Total distributions of $.20 per share is comprised of distributions from net investment income of $.133 and distributions from net realized gain of $.062 per share.
See accompanying notes which are an integral part of the financial statements.
Annual Report
Financial Highlights - Fidelity Global Commodity Stock Fund Class T
Years ended October 31, | 2015 | 2014 | 2013 | 2012 | 2011 |
Selected Per-Share Data | | | | | |
Net asset value, beginning of period | $ 13.21 | $ 14.13 | $ 14.54 | $ 15.08 | $ 15.55 |
Income from Investment Operations | | | | | |
Net investment income (loss) C | .19 | .11 | .12 | .08 | .07 |
Net realized and unrealized gain (loss) | (3.25) | (.90) | (.45) | (.60) | (.38) |
Total from investment operations | (3.06) | (.79) | (.33) | (.52) | (.31) |
Distributions from net investment income | (.10) | (.11) | (.08) | (.01) | (.10) |
Distributions from net realized gain | (.03) | (.01) | - | (.01) | (.06) |
Total distributions | (.13) | (.13) H | (.08) | (.02) | (.16) |
Redemption fees added to paid in capitalC,G | - | - | - | - | - |
Net asset value, end of period | $ 10.02 | $ 13.21 | $ 14.13 | $ 14.54 | $ 15.08 |
Total ReturnA, B | (23.40)% | (5.65)% | (2.26)% | (3.43)% | (2.09)% |
Ratios to Average Net AssetsD, F | | | | | |
Expenses before reductions | 1.63% | 1.62% | 1.62% | 1.61% | 1.60% |
Expenses net of fee waivers, if any | 1.63% | 1.62% | 1.61% | 1.61% | 1.60% |
Expenses net of all reductions | 1.62% | 1.62% | 1.60% | 1.60% | 1.59% |
Net investment income (loss) | 1.57% | .78% | .86% | .53% | .43% |
Supplemental Data | | | | | |
Net assets, end of period (000 omitted) | $ 6,335 | $ 9,867 | $ 12,551 | $ 16,692 | $ 20,831 |
Portfolio turnover rateE | 77% | 75% | 65% | 91% | 71% |
A Total returns would have been lower if certain expenses had not been reduced during the applicable periods shown.
B Total returns do not include the effect of the sales charges.
C Calculated based on average shares outstanding during the period.
D Fees and expenses of any underlying Fidelity Central Funds are not included in the Fund's expense ratio. The Fund indirectly bears its proportionate share of the expenses of any underlying Fidelity Central Funds.
E Amount does not include the portfolio activity of any underlying Fidelity Central Funds.
F Expense ratios reflect operating expenses of the class. Expenses before reductions do not reflect amounts reimbursed by the investment adviser or reductions from brokerage service arrangements or reductions from other expense offset arrangements and do not represent the amount paid by the class during periods when reimbursements or reductions occur. Expenses net of fee waivers reflect expenses after reimbursement by the investment adviser but prior to reductions from brokerage service arrangements or other expense offset arrangements. Expenses net of all reductions represent the net expenses paid by the class.
G Amount represents less than $.005 per share.
H Total distributions of $.13 per share is comprised of distributions from net investment income of $.113 and distributions from net realized gain of $.013 per share.
See accompanying notes which are an integral part of the financial statements.
Annual Report
Financial Highlights - Fidelity Global Commodity Stock Fund Class B
Years ended October 31, | 2015 | 2014 | 2013 | 2012 | 2011 |
Selected Per-Share Data | | | | | |
Net asset value, beginning of period | $ 13.12 | $ 14.01 | $ 14.41 | $ 15.00 | $ 15.46 |
Income from Investment Operations | | | | | |
Net investment income (loss) C | .13 | .04 | .05 | - G | (.01) |
Net realized and unrealized gain (loss) | (3.24) | (.89) | (.45) | (.59) | (.39) |
Total from investment operations | (3.11) | (.85) | (.40) | (.59) | (.40) |
Distributions from net investment income | (.02) | (.03) | - G | - | - |
Distributions from net realized gain | (.03) | (.01) | - | - | (.06) |
Total distributions | (.04) H | (.04) | - G | - | (.06) |
Redemption fees added to paid in capitalC, G | - | - | - | - | - |
Net asset value, end of period | $ 9.97 | $ 13.12 | $ 14.01 | $ 14.41 | $ 15.00 |
Total ReturnA, B | (23.76)% | (6.06)% | (2.75)% | (3.93)% | (2.62)% |
Ratios to Average Net AssetsD, F | | | | | |
Expenses before reductions | 2.13% | 2.11% | 2.11% | 2.10% | 2.11% |
Expenses net of fee waivers, if any | 2.12% | 2.11% | 2.11% | 2.10% | 2.11% |
Expenses net of all reductions | 2.12% | 2.11% | 2.10% | 2.10% | 2.10% |
Net investment income (loss) | 1.07% | .29% | .36% | .03% | (.09)% |
Supplemental Data | | | | | |
Net assets, end of period (000 omitted) | $ 864 | $ 1,584 | $ 2,303 | $ 3,097 | $ 4,324 |
Portfolio turnover rateE | 77% | 75% | 65% | 91% | 71% |
A Total returns would have been lower if certain expenses had not been reduced during the applicable periods shown.
B Total returns do not include the effect of the contingent deferred sales charge.
C Calculated based on average shares outstanding during the period.
D Fees and expenses of any underlying Fidelity Central Funds are not included in the Fund's expense ratio. The Fund indirectly bears its proportionate share of the expenses of any underlying Fidelity Central Funds.
E Amount does not include the portfolio activity of any underlying Fidelity Central Funds.
F Expense ratios reflect operating expenses of the class. Expenses before reductions do not reflect amounts reimbursed by the investment adviser or reductions from brokerage service arrangements or reductions from other expense offset arrangements and do not represent the amount paid by the class during periods when reimbursements or reductions occur. Expenses net of fee waivers reflect expenses after reimbursement by the investment adviser but prior to reductions from brokerage service arrangements or other expense offset arrangements. Expenses net of all reductions represent the net expenses paid by the class.
G Amount represents less than $.005 per share.
H Total distributions of $.04 per share is comprised of distributions from net investment income of $.016 and distributions from net realized gain of $.026 per share.
See accompanying notes which are an integral part of the financial statements.
Annual Report
Financial Highlights - Fidelity Global Commodity Stock Fund Class C
Years ended October 31, | 2015 | 2014 | 2013 | 2012 | 2011 |
Selected Per-Share Data | | | | | |
Net asset value, beginning of period | $ 13.06 | $ 13.96 | $ 14.37 | $ 14.95 | $ 15.45 |
Income from Investment Operations | | | | | |
Net investment income (loss) C | .13 | .04 | .05 | .01 | (.01) |
Net realized and unrealized gain (loss) | (3.22) | (.89) | (.44) | (.59) | (.38) |
Total from investment operations | (3.09) | (.85) | (.39) | (.58) | (.39) |
Distributions from net investment income | (.03) | (.03) | (.02) | - | (.05) |
Distributions from net realized gain | (.03) | (.01) | - | - | (.06) |
Total distributions | (.05) I | (.05) H | (.02) | - | (.11) |
Redemption fees added to paid in capitalC,G | - | - | - | - | - |
Net asset value, end of period | $ 9.92 | $ 13.06 | $ 13.96 | $ 14.37 | $ 14.95 |
Total ReturnA, B | (23.74)% | (6.13)% | (2.75)% | (3.88)% | (2.58)% |
Ratios to Average Net AssetsD, F | | | | | |
Expenses before reductions | 2.12% | 2.11% | 2.11% | 2.10% | 2.09% |
Expenses net of fee waivers, if any | 2.12% | 2.11% | 2.11% | 2.10% | 2.09% |
Expenses net of all reductions | 2.11% | 2.11% | 2.10% | 2.09% | 2.08% |
Net investment income (loss) | 1.08% | .29% | .36% | .03% | (.07)% |
Supplemental Data | | | | | |
Net assets, end of period (000 omitted) | $ 11,274 | $ 17,659 | $ 23,830 | $ 31,865 | $ 37,185 |
Portfolio turnover rateE | 77% | 75% | 65% | 91% | 71% |
A Total returns would have been lower if certain expenses had not been reduced during the applicable periods shown.
B Total returns do not include the effect of the contingent deferred sales charge.
C Calculated based on average shares outstanding during the period.
D Fees and expenses of any underlying Fidelity Central Funds are not included in the Fund's expense ratio. The Fund indirectly bears its proportionate share of the expenses of any underlying Fidelity Central Funds.
E Amount does not include the portfolio activity of any underlying Fidelity Central Funds.
F Expense ratios reflect operating expenses of the class. Expenses before reductions do not reflect amounts reimbursed by the investment adviser or reductions from brokerage service arrangements or reductions from other expense offset arrangements and do not represent the amount paid by the class during periods when reimbursements or reductions occur. Expenses net of fee waivers reflect expenses after reimbursement by the investment adviser but prior to reductions from brokerage service arrangements or other expense offset arrangements. Expenses net of all reductions represent the net expenses paid by the class.
G Amount represents less than $.005 per share.
H Total distributions of $.05 per share is comprised of distributions from net investment income of $.033 and distributions from net realized gain of $.013 per share.
I Total distributions of $.05 per share is comprised of distributions from net investment income of $.025 and distributions from net realized gain of $.026 per share.
See accompanying notes which are an integral part of the financial statements.
Annual Report
Financial Highlights - Fidelity Global Commodity Stock Fund
Years ended October 31, | 2015 | 2014 | 2013 | 2012 | 2011 |
Selected Per-Share Data | | | | | |
Net asset value, beginning of period | $ 13.31 | $ 14.24 | $ 14.66 | $ 15.21 | $ 15.66 |
Income from Investment Operations | | | | | |
Net investment income (loss) B | .25 | .19 | .19 | .15 | .16 |
Net realized and unrealized gain (loss) | (3.27) | (.92) | (.45) | (.60) | (.39) |
Total from investment operations | (3.02) | (.73) | (.26) | (.45) | (.23) |
Distributions from net investment income | (.18) | (.19) | (.16) | (.08) | (.16) |
Distributions from net realized gain | (.03) | (.01) | - | (.01) | (.06) |
Total distributions | (.20) H | (.20) | (.16) | (.10) G | (.22) |
Redemption fees added to paid in capitalB,F | - | - | - | - | - |
Net asset value, end of period | $ 10.09 | $ 13.31 | $ 14.24 | $ 14.66 | $ 15.21 |
Total ReturnA | (22.97)% | (5.16)% | (1.75)% | (2.96)% | (1.59)% |
Ratios to Average Net AssetsC, E | | | | | |
Expenses before reductions | 1.12% | 1.11% | 1.11% | 1.10% | 1.08% |
Expenses net of fee waivers, if any | 1.12% | 1.11% | 1.11% | 1.10% | 1.08% |
Expenses net of all reductions | 1.11% | 1.11% | 1.09% | 1.09% | 1.07% |
Net investment income (loss) | 2.08% | 1.29% | 1.37% | 1.04% | .95% |
Supplemental Data | | | | | |
Net assets, end of period (000 omitted) | $ 156,320 | $ 223,084 | $ 273,476 | $ 387,242 | $ 531,224 |
Portfolio turnover rateD | 77% | 75% | 65% | 91% | 71% |
A Total returns would have been lower if certain expenses had not been reduced during the applicable periods shown.
B Calculated based on average shares outstanding during the period.
C Fees and expenses of any underlying Fidelity Central Funds are not included in the Fund's expense ratio. The Fund indirectly bears its proportionate share of the expenses of any underlying Fidelity Central Funds.
D Amount does not include the portfolio activity of any underlying Fidelity Central Funds.
E Expense ratios reflect operating expenses of the class. Expenses before reductions do not reflect amounts reimbursed by the investment adviser or reductions from brokerage service arrangements or reductions from other expense offset arrangements and do not represent the amount paid by the class during periods when reimbursements or reductions occur. Expenses net of fee waivers reflect expenses after reimbursement by the investment adviser but prior to reductions from brokerage service arrangements or other expense offset arrangements. Expenses net of all reductions represent the net expenses paid by the class.
F Amount represents less than $.005 per share.
G Total distributions of $.10 per share is comprised of distributions from net investment income of $.084 and distributions from net realized gain of $.014 per share.
H Total distributions of $.20 per share is comprised of distributions from net investment income of $.178 and distributions from net realized gain of $.026 per share.
See accompanying notes which are an integral part of the financial statements.
Annual Report
Financial Highlights - Fidelity Global Commodity Stock Fund Class I
Years ended October 31, | 2015 | 2014 | 2013 | 2012 | 2011 |
Selected Per-Share Data | | | | | |
Net asset value, beginning of period | $ 13.31 | $ 14.24 | $ 14.67 | $ 15.22 | $ 15.66 |
Income from Investment Operations | | | | | |
Net investment income (loss) B | .25 | .19 | .20 | .16 | .16 |
Net realized and unrealized gain (loss) | (3.26) | (.92) | (.45) | (.60) | (.38) |
Total from investment operations | (3.01) | (.73) | (.25) | (.44) | (.22) |
Distributions from net investment income | (.19) | (.19) | (.18) | (.09) | (.16) |
Distributions from net realized gain | (.03) | (.01) | - | (.01) | (.06) |
Total distributions | (.21) H | (.20) | (.18) | (.11) G | (.22) |
Redemption fees added to paid in capitalB,F | - | - | - | - | - |
Net asset value, end of period | $ 10.09 | $ 13.31 | $ 14.24 | $ 14.67 | $ 15.22 |
Total ReturnA | (22.93)% | (5.16)% | (1.71)% | (2.90)% | (1.50)% |
Ratios to Average Net AssetsC, E | | | | | |
Expenses before reductions | 1.09% | 1.06% | 1.04% | 1.04% | 1.03% |
Expenses net of fee waivers, if any | 1.08% | 1.06% | 1.04% | 1.04% | 1.03% |
Expenses net of all reductions | 1.08% | 1.06% | 1.03% | 1.03% | 1.03% |
Net investment income (loss) | 2.11% | 1.34% | 1.43% | 1.10% | .99% |
Supplemental Data | | | | | |
Net assets, end of period (000 omitted) | $ 24,841 | $ 23,840 | $ 31,613 | $ 50,540 | $ 58,925 |
Portfolio turnover rateD | 77% | 75% | 65% | 91% | 71% |
A Total returns would have been lower if certain expenses had not been reduced during the applicable periods shown.
B Calculated based on average shares outstanding during the period.
C Fees and expenses of any underlying Fidelity Central Funds are not included in the Fund's expense ratio. The Fund indirectly bears its proportionate share of the expenses of any underlying Fidelity Central Funds.
D Amount does not include the portfolio activity of any underlying Fidelity Central Funds.
E Expense ratios reflect operating expenses of the class. Expenses before reductions do not reflect amounts reimbursed by the investment adviser or reductions from brokerage service arrangements or reductions from other expense offset arrangements and do not represent the amount paid by the class during periods when reimbursements or reductions occur. Expenses net of fee waivers reflect expenses after reimbursement by the investment adviser but prior to reductions from brokerage service arrangements or other expense offset arrangements. Expenses net of all reductions represent the net expenses paid by the class.
F Amount represents less than $.005 per share.
G Total distributions of $.11 per share is comprised of distributions from net investment income of $.093 and distributions from net realized gain of $.014 per share.
H Total distributions of $.21 per share is comprised of distributions from net investment income of $.186 and distributions from net realized gain of $.026 per share.
See accompanying notes which are an integral part of the financial statements.
Annual Report
For the period ended October 31, 2015
1. Organization.
Fidelity Global Commodity Stock Fund (the Fund) is a non-diversified fund of Fidelity Investment Trust (the Trust) and is authorized to issue an unlimited number of shares. The Trust is registered under the Investment Company Act of 1940, as amended (the 1940 Act), as an open-end management investment company organized as a Massachusetts business trust. The Fund offers Class A, Class T, Class C, Global Commodity Stock and Class I shares (formerly Institutional Class), each of which, along with Class B shares, has equal rights as to assets and voting privileges. Class B shares are closed to new accounts and additional purchases, except for exchanges and reinvestments. Each class has exclusive voting rights with respect to matters that affect that class. Class B shares will automatically convert to Class A shares after a holding period of seven years from the initial date of purchase. The Fund's investments in emerging markets can be subject to social, economic, regulatory, and political uncertainties and can be extremely volatile.
2. Investments in Fidelity Central Funds.
The Fund invests in Fidelity Central Funds, which are open-end investment companies generally available only to other investment companies and accounts managed by the investment adviser and its affiliates. The Fund's Schedule of Investments lists each of the Fidelity Central Funds held as of period end, if any, as an investment of the Fund, but does not include the underlying holdings of each Fidelity Central Fund. As an Investing Fund, the Fund indirectly bears its proportionate share of the expenses of the underlying Fidelity Central Funds.
The Money Market Central Funds seek preservation of capital and current income and are managed by Fidelity Investments Money Management, Inc. (FIMM), an affiliate of the investment adviser. Annualized expenses of the Money Market Central Funds as of their most recent shareholder report date are less than .005%.
A complete unaudited list of holdings for each Fidelity Central Fund is available upon request or at the Securities and Exchange Commission (the SEC) website at www.sec.gov. In addition, the financial statements of the Fidelity Central Funds, which are not covered by the Fund's Report of Independent Registered Public Accounting Firm, are available on the SEC website or upon request.
3. Significant Accounting Policies.
The financial statements have been prepared in conformity with accounting principles generally accepted in the United States of America (GAAP), which require management to make certain estimates and assumptions at the date of the financial statements. Actual results could differ from those estimates. Subsequent events, if any, through the date that the financial statements were issued have been evaluated in the preparation of
Annual Report
Notes to Financial Statements - continued
3. Significant Accounting Policies - continued
the financial statements. The following summarizes the significant accounting policies of the Fund:
Investment Valuation. Investments are valued as of 4:00 p.m. Eastern time on the last calendar day of the period. The Board of Trustees (the Board) has delegated the day to day responsibility for the valuation of the Fund's investments to the Fidelity Management & Research Company (FMR) Fair Value Committee (the Committee). In accordance with valuation policies and procedures approved by the Board, the Fund attempts to obtain prices from one or more third party pricing vendors or brokers to value its investments. When current market prices, quotations or currency exchange rates are not readily available or reliable, investments will be fair valued in good faith by the Committee, in accordance with procedures adopted by the Board. Factors used in determining fair value vary by investment type and may include market or investment specific events. The frequency with which these procedures are used cannot be predicted and they may be utilized to a significant extent. The Committee oversees the Fund's valuation policies and procedures and reports to the Board on the Committee's activities and fair value determinations. The Board monitors the appropriateness of the procedures used in valuing the Fund's investments and ratifies the fair value determinations of the Committee.
The Fund categorizes the inputs to valuation techniques used to value its investments into a disclosure hierarchy consisting of three levels as shown below:
Level 1 - quoted prices in active markets for identical investments
Level 2 - other significant observable inputs (including quoted prices for similar investments, interest rates, prepayment speeds, etc.)
Level 3 - unobservable inputs (including the Fund's own assumptions based on the best information available)
Valuation techniques used to value the Fund's investments by major category are as follows:
Equity securities, including restricted securities, for which market quotations are readily available, are valued at the last reported sale price or official closing price as reported by a third party pricing vendor on the primary market or exchange on which they are traded and are categorized as Level 1 in the hierarchy. In the event there were no sales during the day or closing prices are not available, securities are valued at the last quoted bid price or may be valued using the last available price and are generally categorized as Level 2 in the hierarchy. For foreign equity securities, when market or security specific events arise, comparisons to the valuation of American Depositary Receipts (ADRs),
Annual Report
3. Significant Accounting Policies - continued
Investment Valuation - continued
futures contracts, Exchange-Traded Funds (ETFs) and certain indexes as well as quoted prices for similar securities may be used and would be categorized as Level 2 in the hierarchy. Utilizing these techniques may result in transfers between Level 1 and Level 2. For equity securities, including restricted securities, where observable inputs are limited, assumptions about market activity and risk are used and these securities may be categorized as Level 3 in the hierarchy.
Investments in open-end mutual funds, including the Fidelity Central Funds, are valued at their closing net asset value (NAV) each business day and are categorized as Level 1 in the hierarchy.
Foreign Currency. The Fund may use foreign currency contracts to facilitate transactions in foreign-denominated securities. Gains and losses from these transactions may arise from changes in the value of the foreign currency or if the counterparties do not perform under the contracts' terms.
Foreign-denominated assets, including investment securities, and liabilities are translated into U.S. dollars at the exchange rates at period end. Purchases and sales of investment securities, income and dividends received and expenses denominated in foreign currencies are translated into U.S. dollars at the exchange rate in effect on the transaction date.
The effects of exchange rate fluctuations on investments are included with the net realized and unrealized gain (loss) on investment securities. Other foreign currency transactions resulting in realized and unrealized gain (loss) are disclosed separately.
Investment Transactions and Income. For financial reporting purposes, the Fund's investment holdings and NAV include trades executed through the end of the last business day of the period. The NAV per share for processing shareholder transactions is calculated as of the close of business of the New York Stock Exchange (NYSE), normally 4:00 p.m. Eastern time and includes trades executed through the end of the prior business day. Gains and losses on securities sold are determined on the basis of identified cost and may include proceeds received from litigation. Dividend income is recorded on the ex-dividend date, except for certain dividends from foreign securities where the ex-dividend date may have passed, which are recorded as soon as the Fund is informed of the ex-dividend date. Non-cash dividends included in dividend income, if any, are recorded at the fair market value of the securities received. Income and capital gain distributions from Fidelity Central Funds, if any, are recorded on the ex-dividend date. Distributions received on securities that represent a return of capital or capital gain are recorded as a reduction of cost of investments and/or as a realized gain. Subsequent to ex-dividend date the Fund determines the components of these distributions, based
Annual Report
Notes to Financial Statements - continued
3. Significant Accounting Policies - continued
Investment Transactions and Income - continued
upon receipt of tax filings or other correspondence relating to the underlying investment. Interest income is accrued as earned and includes coupon interest and amortization of premium and accretion of discount on debt securities as applicable. Investment income is recorded net of foreign taxes withheld where recovery of such taxes is uncertain.
Class Allocations and Expenses. Investment income, realized and unrealized capital gains and losses, common expenses of the Fund, and certain fund-level expense reductions, if any, are allocated daily on a pro-rata basis to each class based on the relative net assets of each class to the total net assets of the Fund. Each class differs with respect to transfer agent and distribution and service plan fees incurred. Certain expense reductions may also differ by class. For the reporting period, the allocated portion of income and expenses to each class as a percent of its average net assets may vary due to the timing of recording these transactions in relation to fluctuating net assets of the classes. Expenses directly attributable to a fund are charged to that fund. Expenses attributable to more than one fund are allocated among the respective funds on the basis of relative net assets or other appropriate methods. Expense estimates are accrued in the period to which they relate and adjustments are made when actual amounts are known.
Income Tax Information and Distributions to Shareholders. Each year, the Fund intends to qualify as a regulated investment company under Subchapter M of the Internal Revenue Code, including distributing substantially all of its taxable income and realized gains. As a result, no provision for U.S. Federal income taxes is required. As of October 31, 2015, the Fund did not have any unrecognized tax benefits in the financial statements; nor is the Fund aware of any tax positions for which it is reasonably possible that the total amounts of unrecognized tax benefits will significantly change in the next twelve months. The Fund files a U.S. federal tax return, in addition to state and local tax returns as required. The Fund's federal income tax returns are subject to examination by the Internal Revenue Service (IRS) for a period of three fiscal years after they are filed. State and local tax returns may be subject to examination for an additional fiscal year depending on the jurisdiction. Foreign taxes are provided for based on the Fund's understanding of the tax rules and rates that exist in the foreign markets in which it invests.
Distributions are declared and recorded on the ex-dividend date. Income dividends and capital gain distributions are declared separately for each class. Income and capital gain distributions are determined in accordance with income tax regulations, which may differ from GAAP. In addition, the Fund claimed a portion of the payment made to redeeming shareholders as a distribution for income tax purposes.
Capital accounts within the financial statements are adjusted for permanent book-tax differences. These adjustments have no impact on net assets or the results of operations.
Annual Report
3. Significant Accounting Policies - continued
Income Tax Information and Distributions to Shareholders - continued
Capital accounts are not adjusted for temporary book-tax differences which will reverse in a subsequent period.
Book-tax differences are primarily due to foreign currency transactions, passive foreign investment companies (PFIC), partnerships, capital loss carryforwards and losses deferred due to wash sales.
The federal tax cost of investment securities and unrealized appreciation (depreciation) as of period end were as follows:
Gross unrealized appreciation | $ 1,558,121 |
Gross unrealized depreciation | (128,064,703) |
Net unrealized appreciation (depreciation) on securities | $ (126,506,582) |
Tax Cost | $ 360,303,123 |
The tax-based components of distributable earnings as of period end were as follows:
Undistributed ordinary income | $ 4,827,284 |
Capital loss carryforward | $ (64,772,918) |
Net unrealized appreciation (depreciation) on securities and other investments | $ (126,532,429) |
Capital loss carryforwards are only available to offset future capital gains of the Fund to the extent provided by regulations and may be limited. Under the Regulated Investment Company Modernization Act of 2010 (the Act), the Fund is permitted to carry forward capital losses incurred in taxable years beginning after December 22, 2010 for an unlimited period and such capital losses are required to be used prior to any losses that expire. The capital loss carryforward information presented below, including any applicable limitation, is estimated as of prior fiscal period end and is subject to adjustment.
Fiscal year of expiration 2019 | $ (6,952,413) |
No expiration | |
Short-term | (17,522,131) |
Long-term | (40,298,374) |
Total no expiration | (57,820,505) |
Total capital loss carryforward | $ (64,772,918) |
Annual Report
Notes to Financial Statements - continued
3. Significant Accounting Policies - continued
Income Tax Information and Distributions to Shareholders - continued
The tax character of distributions paid was as follows:
| October 31, 2015 | October 31, 2014 |
Ordinary Income | $ 4,528,146 | $ 5,132,959 |
Short-Term Trading (Redemption) Fees. Shares held by investors in the Fund less than 30 days may have been subject to a redemption fee equal to 1.00% of the NAV of shares redeemed. All redemption fees, which reduce the proceeds of the shareholder redemption, are retained by the Fund and accounted for as an addition to paid in capital.
Restricted Securities. The Fund may invest in securities that are subject to legal or contractual restrictions on resale. These securities generally may be resold in transactions exempt from registration or to the public if the securities are registered. Disposal of these securities may involve time-consuming negotiations and expense, and prompt sale at an acceptable price may be difficult. Information regarding restricted securities is included at the end of the Fund's Schedule of Investments.
4. Purchases and Sales of Investments.
Purchases and sales of securities, other than short-term securities, aggregated $217,511,154 and $235,143,180, respectively.
5. Fees and Other Transactions with Affiliates.
Management Fee. Fidelity Management & Research Company (the investment adviser) and its affiliates provide the Fund with investment management related services for which the Fund pays a monthly management fee. The management fee is the sum of an individual fund fee rate that is based on an annual rate of .45% of the Fund's average net assets and an annualized group fee rate that averaged .25% during the period. The group fee rate is based upon the average net assets of all the mutual funds advised by the investment adviser, including any mutual funds previously advised by the investment adviser that are currently advised by Fidelity SelectCo, LLC, an affiliate of the investment adviser. The group fee rate decreases as assets under management increase and increases as assets under management decrease. For the reporting period, the total annual management fee rate was .70% of the Fund's average net assets.
Distribution and Service Plan Fees. In accordance with Rule 12b-1 of the 1940 Act, the Fund has adopted separate Distribution and Service Plans for each class of shares. Certain classes pay Fidelity Distributors Corporation (FDC), an affiliate of the investment adviser, separate Distribution and Service Fees, each of which is based on an
Annual Report
5. Fees and Other Transactions with Affiliates - continued
Distribution and Service Plan Fees - continued
annual percentage of each class' average net assets. In addition, FDC may pay financial intermediaries for selling shares of the Fund and providing shareholder support services.
For the period, the Distribution and Service Fee rates, total fees and amounts retained by FDC were as follows:
| Distribution
Fee | Service
Fee | Total Fees | Retained
by FDC |
Class A | -% | .25% | $ 103,367 | $ 690 |
Class T | .25% | .25% | 42,080 | 4 |
Class B | .75% | .25% | 12,224 | 9,168 |
Class C | .75% | .25% | 145,017 | 16,745 |
| | | $ 302,688 | $ 26,607 |
Sales Load. FDC may receive a front-end sales charge of up to 5.75% for selling Class A shares and 3.50% for selling Class T shares, some of which is paid to financial intermediaries for selling shares of the Fund. Depending on the holding period, FDC may receive contingent deferred sales charges levied on Class A, Class T, Class B, and Class C redemptions. The deferred sales charges range from 5.00% to 1.00% for Class B shares, 1.00% for Class C shares, 1.00% for certain purchases of Class A shares and .25% for certain purchases of Class T shares.
For the period, sales charge amounts retained by FDC were as follows:
| Retained
by FDC |
Class A | $ 18,579 |
Class T | 1,858 |
Class BA | 2,196 |
Class C A | 2,768 |
| $ 25,401 |
A When Class B and Class C shares are initially sold, FDC pays commissions from its own resources to financial intermediaries through which the sales are made.
Transfer Agent Fees. Fidelity Investments Institutional Operations Company, Inc., (FIIOC), an affiliate of the investment adviser, is the transfer, dividend disbursing and shareholder servicing agent for each class of the Fund. FIIOC receives account fees and asset-based fees that vary according to the account size and type of account of the shareholders of the respective classes of the Fund. FIIOC pays for typesetting, printing and mailing of shareholder reports, except proxy statements.
Annual Report
Notes to Financial Statements - continued
5. Fees and Other Transactions with Affiliates - continued
Transfer Agent Fees - continued
For the period, transfer agent fees for each class were as follows:
| Amount | % of
Class-Level Average
Net Assets |
Class A | $ 111,180 | .27 |
Class T | 25,675 | .31 |
Class B | 3,619 | .30 |
Class C | 41,951 | .29 |
Global Commodity Stock | 576,631 | .30 |
Class I | 64,016 | .26 |
| $ 823,072 | |
Accounting and Security Lending Fees. Fidelity Service Company, Inc. (FSC), an affiliate of the investment adviser, maintains the Fund's accounting records. The accounting fee is based on the level of average net assets for each month. Under a separate contract, FSC administers the security lending program. The security lending fee is based on the number and duration of lending transactions.
Brokerage Commissions. The Fund placed a portion of its portfolio transactions with brokerage firms which are affiliates of the investment adviser. Brokerage commissions are included in net realized gain (loss) and change in net unrealized appreciation (depreciation) in the Statement of Operations. The commissions paid to these affiliated firms were $8,965 for the period.
6. Committed Line of Credit.
The Fund participates with other funds managed by the investment adviser or an affiliate in a $4.25 billion credit facility (the "line of credit") to be utilized for temporary or emergency purposes to fund shareholder redemptions or for other short-term liquidity purposes. The Fund has agreed to pay commitment fees on its pro-rata portion of the line of credit, which amounted to $424 and is reflected in Miscellaneous expenses on the Statement of Operations. During the period, the Fund did not borrow on this line of credit.
7. Security Lending.
The Fund lends portfolio securities through a lending agent from time to time in order to earn additional income. For equity securities, a lending agent is used and may loan securities to certain qualified borrowers, including Fidelity Capital Markets (FCM), a
Annual Report
7. Security Lending - continued
broker-dealer affiliated with the Fund. On the settlement date of the loan, the Fund receives collateral (in the form of U.S. Treasury obligations, letters of credit and/or cash) against the loaned securities and maintains collateral in an amount not less than 100% of the market value of the loaned securities during the period of the loan. The market value of the loaned securities is determined at the close of business of the Fund and any additional required collateral is delivered to the Fund on the next business day. The Fund or borrower may terminate the loan at any time, and if the borrower defaults on its obligation to return the securities loaned because of insolvency or other reasons, the Fund may apply collateral received from the borrower against the obligation. The Fund may experience delays and costs in recovering the securities loaned. Any cash collateral received is invested in the Fidelity Securities Lending Cash Central Fund. The value of loaned securities and cash collateral at period end are disclosed on the Fund's Statement of Assets and Liabilities. Security lending income represents the income earned on investing cash collateral, less rebates paid to borrowers and any lending agent fees associated with the loan, plus any premium payments received for lending certain types of securities. Security lending income is presented in the Statement of Operations as a component of income from Fidelity Central Funds. Total security lending income during the period amounted to $150,371, including $102 from securities loaned to FCM.
8. Expense Reductions.
Commissions paid to certain brokers with whom the investment adviser, or its affiliates, places trades on behalf of the Fund include an amount in addition to trade execution, which may be rebated back to the Fund to offset certain expenses. This amount totaled $17,208 for the period.
In addition, during the period the investment adviser reimbursed and/or waived a portion of fund-level operating expenses in the amount of $1,143 and a portion of class-level operating expenses as follows:
| Amount |
Class A | $ 880 |
Class T | 23 |
Class B | 4 |
Class C | 170 |
Global Commodity Stock | 1,381 |
Class I | 704 |
| $ 3,162 |
Annual Report
Notes to Financial Statements - continued
9. Distributions to Shareholders.
Distributions to shareholders of each class were as follows:
Years ended October 31, | 2015 | 2014 |
From net investment income | | |
Class A | $ 520,699 | $ 708,856 |
Class T | 72,766 | 98,770 |
Class B | 1,871 | 4,646 |
Class C | 32,755 | 54,810 |
Global Commodity Stock | 2,937,401 | 3,531,196 |
Class I | 333,382 | 366,972 |
Total | $ 3,898,874 | $ 4,765,250 |
From net realized gain | | |
Class A | $ 97,397 | $ 63,118 |
Class T | 19,110 | 11,363 |
Class B | 3,040 | 2,083 |
Class C | 34,065 | 21,591 |
Global Commodity Stock | 429,058 | 244,178 |
Class I | 46,602 | 25,376 |
Total | $ 629,272 | $ 367,709 |
10. Share Transactions.
Share transactions for each class were as follows and may contain automatic conversions between classes or exchanges between funds:
| Shares | Dollars |
Years ended October 31, | 2015 | 2014 | 2015 | 2014 |
Class A | | | | |
Shares sold | 526,290 | 686,605 | $ 6,210,169 | $ 9,882,029 |
Reinvestment of distributions | 46,881 | 49,529 | 594,452 | 677,563 |
Shares redeemed | (1,342,823) | (1,874,574) | (16,036,860) | (26,738,279) |
Net increase (decrease) | (769,652) | (1,138,440) | $ (9,232,239) | $ (16,178,687) |
Class T | | | | |
Shares sold | 79,898 | 67,497 | $ 963,935 | $ 970,700 |
Reinvestment of distributions | 7,092 | 7,867 | 89,851 | 107,538 |
Shares redeemed | (201,781) | (216,700) | (2,371,414) | (3,112,471) |
Net increase (decrease) | (114,791) | (141,336) | $ (1,317,628) | $ (2,034,233) |
Class B | | | | |
Shares sold | 580 | 2,197 | $ 7,071 | $ 29,999 |
Reinvestment of distributions | 371 | 453 | 4,698 | 6,179 |
Shares redeemed | (35,007) | (46,232) | (422,886) | (649,491) |
Net increase (decrease) | (34,056) | (43,582) | $ (411,117) | $ (613,313) |
Annual Report
10. Share Transactions - continued
| Shares | Dollars |
Years ended October 31, | 2015 | 2014 | 2015 | 2014 |
Class C | | | | |
Shares sold | 206,447 | 167,515 | $ 2,471,711 | $ 2,371,848 |
Reinvestment of distributions | 4,962 | 4,980 | 62,526 | 67,632 |
Shares redeemed | (426,784) | (527,630) | (5,161,590) | (7,391,284) |
Net increase (decrease) | (215,375) | (355,135) | $ (2,627,353) | $ (4,951,804) |
Global Commodity Stock | | | | |
Shares sold | 4,004,137 | 3,796,689 | $ 47,467,615 | $ 54,637,922 |
Reinvestment of distributions | 238,065 | 246,397 | 3,023,431 | 3,378,098 |
Shares redeemed | (5,506,523) | (6,485,397) | (65,599,040) | (92,819,253) |
Net increase (decrease) | (1,264,321) | (2,442,311) | $ (15,107,994) | $ (34,803,233) |
Class I | | | | |
Shares sold | 1,576,324 | 912,359 | $ 18,219,363 | $ 13,219,634 |
Reinvestment of distributions | 24,972 | 20,652 | 316,895 | 283,141 |
Shares redeemed | (929,289) | (1,362,707) | (10,645,039) | (19,411,369) |
Net increase (decrease) | 672,007 | (429,696) | $ 7,891,219 | $ (5,908,594) |
11. Other.
The Fund's organizational documents provide former and current trustees and officers with a limited indemnification against liabilities arising in connection with the performance of their duties to the Fund. In the normal course of business, the Fund may also enter into contracts that provide general indemnifications. The Fund's maximum exposure under these arrangements is unknown as this would be dependent on future claims that may be made against the Fund. The risk of material loss from such claims is considered remote.
At the end of the period, the investment adviser or its affiliates were the owners of record of 17% of the outstanding shares of the Funds.
Annual Report
To the Trustees of Fidelity Investment Trust and the Shareholders of Fidelity Global Commodity Stock Fund:
In our opinion, the accompanying statement of assets and liabilities, including the schedule of investments, and the related statements of operations and of changes in net assets and the financial highlights present fairly, in all material respects, the financial position of Fidelity Global Commodity Stock Fund (a fund of Fidelity Investment Trust) at October 31, 2015, the results of its operations for the year then ended, the changes in its net assets for each of the two years in the period then ended and the financial highlights for each of the five years in the period then ended, in conformity with accounting principles generally accepted in the United States of America. These financial statements and financial highlights (hereafter referred to as "financial statements") are the responsibility of the Fidelity Global Commodity Stock Fund's management. Our responsibility is to express an opinion on these financial statements based on our audits. We conducted our audits of these financial statements in accordance with the standards of the Public Company Accounting Oversight Board (United States). Those standards require that we plan and perform the audit to obtain reasonable assurance about whether the financial statements are free of material misstatement. An audit includes examining, on a test basis, evidence supporting the amounts and disclosures in the financial statements, assessing the accounting principles used and significant estimates made by management, and evaluating the overall financial statement presentation. We believe that our audits, which included confirmation of securities at October 31, 2015 by correspondence with the custodian and brokers, provide a reasonable basis for our opinion.
PricewaterhouseCoopers LLP
Boston, Massachusetts
December 18, 2015
Annual Report
The Trustees, Member of the Advisory Board, and officers of the trust and fund, as applicable, are listed below. The Board of Trustees governs the fund and is responsible for protecting the interests of shareholders. The Trustees are experienced executives who meet periodically throughout the year to oversee the fund's activities, review contractual arrangements with companies that provide services to the fund, oversee management of the risks associated with such activities and contractual arrangements, and review the fund's performance. Each of the Trustees oversees 170 funds.
The Trustees hold office without limit in time except that (a) any Trustee may resign; (b) any Trustee may be removed by written instrument, signed by at least two-thirds of the number of Trustees prior to such removal; (c) any Trustee who requests to be retired or who has become incapacitated by illness or injury may be retired by written instrument signed by a majority of the other Trustees; and (d) any Trustee may be removed at any special meeting of shareholders by a two-thirds vote of the outstanding voting securities of the trust. Each Trustee who is not an interested person (as defined in the 1940 Act) of the trust and the fund (Independent Trustee), shall retire not later than the last day of the calendar year in which his or her 75th birthday occurs. The Independent Trustees may waive this mandatory retirement age policy with respect to individual Trustees. The officers and Advisory Board Member hold office without limit in time, except that any officer and Advisory Board Member may resign or may be removed by a vote of a majority of the Trustees at any regular meeting or any special meeting of the Trustees. Except as indicated, each individual has held the office shown or other offices in the same company for the past five years.
Experience, Skills, Attributes, and Qualifications of the Fund's Trustees. The Governance and Nominating Committee has adopted a statement of policy that describes the experience, qualifications, attributes, and skills that are necessary and desirable for potential Independent Trustee candidates (Statement of Policy). The Board believes that each Trustee satisfied at the time he or she was initially elected or appointed a Trustee, and continues to satisfy, the standards contemplated by the Statement of Policy. The Governance and Nominating Committee also engages professional search firms to help identify potential Independent Trustee candidates who have the experience, qualifications, attributes, and skills consistent with the Statement of Policy. From time to time, additional criteria based on the composition and skills of the current Independent Trustees, as well as experience or skills that may be appropriate in light of future changes to board composition, business conditions, and regulatory or other developments, have also been considered by the professional search firms and the Governance and Nominating Committee. In addition, the Board takes into account the Trustees' commitment and participation in Board and committee meetings, as well as their leadership of standing and ad hoc committees throughout their tenure.
In determining that a particular Trustee was and continues to be qualified to serve as a Trustee, the Board has considered a variety of criteria, none of which, in isolation, was controlling. The Board believes that, collectively, the Trustees have balanced and diverse experience, qualifications, attributes, and skills, which allow the Board to operate effectively in governing the fund and protecting the interests of shareholders. Information about the specific experience, skills, attributes, and qualifications of each Trustee, which in each case led to the Board's conclusion that the Trustee should serve (or continue to serve) as a trustee of the fund, is provided below.
Annual Report
Board Structure and Oversight Function. James C. Curvey is an interested person (as defined in the 1940 Act) and currently serves as Chairman. The Trustees have determined that an interested Chairman is appropriate and benefits shareholders because an interested Chairman has a personal and professional stake in the quality and continuity of services provided to the fund. Independent Trustees exercise their informed business judgment to appoint an individual of their choosing to serve as Chairman, regardless of whether the Trustee happens to be independent or a member of management. The Independent Trustees have determined that they can act independently and effectively without having an Independent Trustee serve as Chairman and that a key structural component for assuring that they are in a position to do so is for the Independent Trustees to constitute a substantial majority for the Board. The Independent Trustees also regularly meet in executive session. Ned C. Lautenbach serves as Chairman of the Independent Trustees and as such (i) acts as a liaison between the Independent Trustees and management with respect to matters important to the Independent Trustees and (ii) with management prepares agendas for Board meetings.
Fidelity funds are overseen by different Boards of Trustees. The fund's Board oversees Fidelity's high income and certain equity funds, and other Boards oversee Fidelity's investment-grade bond, money market, asset allocation, and sector funds. The asset allocation funds may invest in Fidelity funds overseen by the fund's Board. The use of separate Boards, each with its own committee structure, allows the Trustees of each group of Fidelity funds to focus on the unique issues of the funds they oversee, including common research, investment, and operational issues. On occasion, the separate Boards establish joint committees to address issues of overlapping consequences for the Fidelity funds overseen by each Board.
The Trustees operate using a system of committees to facilitate the timely and efficient consideration of all matters of importance to the Trustees, the fund, and fund shareholders and to facilitate compliance with legal and regulatory requirements and oversight of the fund's activities and associated risks. The Board, acting through its committees, has charged FMR and its affiliates with (i) identifying events or circumstances the occurrence of which could have demonstrably adverse effects on the fund's business and/or reputation; (ii) implementing processes and controls to lessen the possibility that such events or circumstances occur or to mitigate the effects of such events or circumstances if they do occur; and (iii) creating and maintaining a system designed to evaluate continuously business and market conditions in order to facilitate the identification and implementation processes described in (i) and (ii) above. Because the day-to-day operations and activities of the fund are carried out by or through FMR, its affiliates and other service providers, the fund's exposure to risks is mitigated but not eliminated by the processes overseen by the Trustees. While each of the Board's committees has responsibility for overseeing different aspects of the fund's activities, oversight is exercised primarily through the Operations, Audit, and Compliance Committees. In addition, the Independent Trustees have worked with FMR to enhance the Board's oversight of investment and financial risks, legal and regulatory risks, technology risks, and operational risks, including the development of additional risk reporting to the Board. For example, a working group comprised of Independent Trustees and FMR has worked and continues to work to review the Fidelity funds' valuation-related activities, reporting and risk management. Appropriate personnel, including but not limited to the fund's Chief Compliance Officer (CCO), FMR's internal auditor, the independent accountants, the fund's Treasurer and portfolio management personnel, make periodic reports to the Board's committees, as appropriate, including an annual review of Fidelity's risk management program for the Fidelity funds. The responsibilities of each standing committee, including their oversight responsibilities, are described further under "Standing Committees of the Fund's Trustees."
Annual Report
Trustees and Officers - continued
The fund's Statement of Additional Information (SAI) includes more information about the Trustees. To request a free copy, call Fidelity at 1-877-208-0098.
Interested Trustees*:
Correspondence intended for each Trustee who is an interested person may be sent to Fidelity Investments, 245 Summer Street, Boston, Massachusetts 02210.
Name, Year of Birth; Principal Occupations and Other Relevant Experience+ |
James C. Curvey (1935) |
Year of Election or Appointment: 2007 Trustee Chairman of the Board of Trustees |
| Mr. Curvey also serves as Trustee of other Fidelity funds. Mr. Curvey is a Director of Fidelity Research & Analysis Co. (investment adviser firm, 2009-present), and Vice Chairman (2007-present) and Director of FMR LLC (diversified financial services company). In addition, Mr. Curvey serves as an Overseer for the Boston Symphony Orchestra and a member of the board of Artis-Naples, Naples, Florida, and as a Trustee for Brewster Academy, Wolfeboro, New Hampshire. Previously, Mr. Curvey served as a Director of Fidelity Investments Money Management, Inc. (investment adviser firm, 2009-2014) and a Director of FMR and FMR Co., Inc. (investment adviser firms, 2007-2014). |
Charles S. Morrison (1960) |
Year of Election or Appointment: 2014 Trustee |
| Mr. Morrison also serves as Trustee of other funds. He serves as a Director of Fidelity Investments Money Management, Inc. (FIMM) (investment adviser firm, 2014-present), Director of Fidelity SelectCo, LLC (investment adviser firm, 2014-present), President, Asset Management (2014-present), and is an employee of Fidelity Investments. Previously, Mr. Morrison served as Vice President of Fidelity's Fixed Income and Asset Allocation Funds (2012-2014), President, Fixed Income (2011-2014), Vice President of Fidelity's Money Market Funds (2005-2009), President, Money Market Group Leader of FMR (investment adviser firm, 2009), and Senior Vice President, Money Market Group of FMR (2004-2009). Mr. Morrison also served as Vice President of Fidelity's Bond Funds (2002-2005), certain Balanced Funds (2002-2005), and certain Asset Allocation Funds (2002-2007), and as Senior Vice President (2002-2005) of Fidelity's Bond Division. |
* Trustees have been determined to be "Interested Trustees" by virtue of, among other things, their affiliation with the trust or various entities under common control with FMR.
+ The information above includes each Trustee's principal occupation during the last five years and other information relating to the experience, attributes, and skills relevant to each Trustee's qualifications to serve as a Trustee, which led to the conclusion that each Trustee should serve as a Trustee for the fund.
Annual Report
Trustees and Officers - continued
Independent Trustees:
Correspondence intended for each Independent Trustee (that is, the Trustees other than the Interested Trustees) may be sent to Fidelity Investments, P.O. Box 55235, Boston, Massachusetts 02205-5235.
Name, Year of Birth; Principal Occupations and Other Relevant Experience+ |
Dennis J. Dirks (1948) |
Year of Election or Appointment: 2005 Trustee |
| Mr. Dirks also serves as Trustee of other Fidelity funds. Prior to his retirement in May 2003, Mr. Dirks was Chief Operating Officer and a member of the Board of The Depository Trust & Clearing Corporation (DTCC). He also served as President, Chief Operating Officer, and Board member of The Depository Trust Company (DTC) and President and Board member of the National Securities Clearing Corporation (NSCC). In addition, Mr. Dirks served as Chief Executive Officer and Board member of the Government Securities Clearing Corporation, Chief Executive Officer and Board member of the Mortgage-Backed Securities Clearing Corporation, as a Trustee and a member of the Finance Committee of Manhattan College (2005-2008), as a Trustee and a member of the Finance Committee of AHRC of Nassau County (2006-2008), and as a member of the Independent Directors Council (IDC) Governing Council (2010-2015). Mr. Dirks is a member of the Board of Directors for The Brookville Center for Children's Services, Inc. (2009-present). |
Alan J. Lacy (1953) |
Year of Election or Appointment: 2008 Trustee |
| Mr. Lacy also serves as Trustee of other Fidelity funds. Mr. Lacy serves as a member of the Board of Directors of Dave & Buster's Entertainment, Inc. (restaurant and entertainment complexes, 2010-present) and Bristol-Myers Squibb Company (global pharmaceuticals, 2008-present). In addition, Mr. Lacy served as Senior Adviser (2007-2014) of Oak Hill Capital Partners, L.P. (private equity) and also served as Chief Executive Officer (2000-2005) and Vice Chairman (2005-2006) of Sears Holdings Corporation and Sears, Roebuck and Co. (retail). Mr. Lacy is a member of the Board of Trustees of The National Parks Conservation Association (2006-present). Previously, Mr. Lacy served as Chairman of the Board of Trustees of the National Parks Conservation Association (2008-2011) and as a member of the Board of Directors for The Western Union Company (global money transfer, 2006-2011), The Hillman Companies, Inc. (hardware wholesalers, 2010-2014), and Earth Fare, Inc. (retail grocery, 2010-2014). |
Ned C. Lautenbach (1944) |
Year of Election or Appointment: 2000 Trustee Chairman of the Independent Trustees |
| Mr. Lautenbach also serves as Trustee of other Fidelity funds. Mr. Lautenbach currently serves as the Lead Director of the Eaton Corporation Board of Directors (diversified industrial, 1997-present). Mr. Lautenbach is Chairman of the Board of Directors of Artis-Naples in Naples, Florida (2012-present), a member of the Council on Foreign Relations (1994-present), and a member of the Board of Governors, State University System of Florida (2013-present). Previously, Mr. Lautenbach was a Partner/Advisory Partner at Clayton, Dubilier & Rice, LLC (private equity investment, 1998-2010), as well as a Director of Sony Corporation (2006-2007). |
Joseph Mauriello (1944) |
Year of Election or Appointment: 2008 Trustee |
| Mr. Mauriello also serves as Trustee of other Fidelity funds. Prior to his retirement in January 2006, Mr. Mauriello served in numerous senior management positions including Deputy Chairman and Chief Operating Officer (2004-2005), and Vice Chairman of Financial Services (2002-2004) of KPMG LLP US (professional services, 1965-2005). Mr. Mauriello currently serves as a member of the Board of Directors of XL Group plc. (global insurance and re-insurance, 2006-present) and the Independent Directors Council (IDC) Governing Council (2015-present). Previously, Mr. Mauriello served as a Director of the Hamilton Funds of the Bank of New York (2006-2007) and of Arcadia Resources Inc. (health care services and products, 2007-2012). |
Robert W. Selander (1950) |
Year of Election or Appointment: 2011 Trustee |
| Mr. Selander also serves as Trustee of other Fidelity funds. Mr. Selander serves as a Director of The Western Union Company (global money transfer, 2014-present). Previously, Mr. Selander served as a Member of the Advisory Board of other Fidelity funds (2011), and Executive Vice Chairman (2010), Chief Executive Officer (2009-2010), and President and Chief Executive Officer (1997-2009) of Mastercard, Inc. |
Cornelia M. Small (1944) |
Year of Election or Appointment: 2005 Trustee |
| Ms. Small also serves as Trustee of other Fidelity funds. Ms. Small is a member of the Board of Directors (2009-present) and Chair of the Investment Committee (2010-present) of the Teagle Foundation. Ms. Small also serves on the Investment Committee of the Berkshire Taconic Community Foundation (2008-present). Previously, Ms. Small served as Chairperson (2002-2008) and a member of the Investment Committee and Chairperson (2008-2012) and a member of the Board of Trustees of Smith College. In addition, Ms. Small served as Chief Investment Officer, Director of Global Equity Investments, and a member of the Board of Directors of Scudder, Stevens & Clark and Scudder Kemper Investments. |
William S. Stavropoulos (1939) |
Year of Election or Appointment: 2001 Trustee Vice Chairman of the Independent Trustees |
| Mr. Stavropoulos also serves as Trustee of other Fidelity funds. Mr. Stavropoulos serves as President and Founder of the Michigan Baseball Foundation, the Great Lakes Loons (2007-present). Mr. Stavropoulos is Chairman Emeritus of the Board of Directors of The Dow Chemical Company, where he previously served in numerous senior management positions, including President, CEO (1995-2000; 2002-2004), Chairman of the Executive Committee (2000-2006), and as a member of the Board of Directors (1990-2006). Currently, Mr. Stavropoulos is Chairman of the Board of Directors of Univar Inc. (global distributor of commodity and specialty chemicals), a Director of Teradata Corporation (data warehousing and technology solutions), and Maersk Inc. (industrial conglomerate), and a member of the Advisory Board for Metalmark Capital LLC (private equity investment, 2005-present). Mr. Stavropoulos is an operating advisor to Clayton, Dubilier & Rice, LLC (private equity investment). In addition, Mr. Stavropoulos is a member of the University of Notre Dame Advisory Council for the College of Science, a Trustee of the Rollin L. Gerstacker Foundation, and a Director of the Naples Philharmonic Center for the Arts. Previously, Mr. Stavropoulos served as a Director of Chemical Financial Corporation (bank holding company, 1993-2012) and Tyco International, Ltd. (multinational manufacturing and services, 2007-2012). |
David M. Thomas (1949) |
Year of Election or Appointment: 2008 Trustee |
| Mr. Thomas also serves as Trustee of other Fidelity funds. Mr. Thomas serves as Non-Executive Chairman of the Board of Directors of Fortune Brands Home and Security (home and security products, 2011-present), as a member of the Board of Directors (2004-present) and Presiding Director (2013-present) of Interpublic Group of Companies, Inc. (marketing communication), and as a member of the Board of Trustees of the University of Florida (2013-present). Previously, Mr. Thomas served as Executive Chairman (2005-2006) and Chairman and Chief Executive Officer (2000-2005) of IMS Health, Inc. (pharmaceutical and healthcare information solutions), and a Director of Fortune Brands, Inc. (consumer products, 2000-2011). |
+ The information above includes each Trustee's principal occupation during the last five years and other information relating to the experience, attributes, and skills relevant to each Trustee's qualifications to serve as a Trustee, which led to the conclusion that each Trustee should serve as a Trustee for the fund.
Advisory Board Member and Officers:
Correspondence intended for each officer and Peter S. Lynch may be sent to Fidelity Investments, 245 Summer Street, Boston, Massachusetts 02210. Officers appear below in alphabetical order.
Name, Year of Birth; Principal Occupation |
Peter S. Lynch (1944) |
Year of Election or Appointment: 2003 Member of the Advisory Board |
| Mr. Lynch also serves as Member of the Advisory Board of other Fidelity funds. Mr. Lynch is Vice Chairman and a Director of FMR (investment adviser firm) and FMR Co., Inc. (investment adviser firm). In addition, Mr. Lynch serves as a Trustee of Boston College and as the Chairman of the Inner-City Scholarship Fund. Previously, Mr. Lynch served on the Special Olympics International Board of Directors (1997-2006). |
Christopher S. Bartel (1971) |
Year of Election or Appointment: 2009 Vice President |
| Mr. Bartel also serves as Vice President of other funds. Mr. Bartel serves as a Director, President, and Chief Executive Officer of Fidelity Management & Research (Japan) Limited (investment adviser firm, 2012-present), a Director of Fidelity Management & Research (Hong Kong) (investment adviser firm, 2012-present), and Senior Vice President of Global Equity Research (2010-present). Previously, Mr. Bartel served as Senior Vice President of Equity Research (2009-2010), Managing Director of Research (2006-2009), and an analyst and portfolio manager (2000-2006). |
Elizabeth Paige Baumann (1968) |
Year of Election or Appointment: 2012 Anti-Money Laundering (AML) Officer |
| Ms. Baumann also serves as AML Officer of other funds. She is Chief AML Officer of FMR LLC (diversified financial services company, 2012-present) and is an employee of Fidelity Investments. Previously, Ms. Baumann served as Vice President and Deputy Anti-Money Laundering Officer (2007-2012). |
Marc R. Bryant (1966) |
Year of Election or Appointment: 2015 Secretary and Chief Legal Officer (CLO) |
| Mr. Bryant also serves as Secretary and CLO of other funds. Mr. Bryant serves as CLO, Secretary, and Senior Vice President of Fidelity Management & Research Company (investment adviser firm, 2015-present) and FMR Co., Inc. (investment adviser firm, 2015-present); Secretary of Fidelity SelectCo, LLC (investment adviser firm, 2015-present) and Fidelity Investments Money Management, Inc. (investment adviser firm, 2015-present); and CLO of Fidelity Management & Research (Hong Kong) Limited (investment adviser firm, 2015-present). He is Senior Vice President and Deputy General Counsel of FMR LLC (diversified financial services company). Previously, Mr. Bryant served as Secretary and Chief Legal Officer of Fidelity Rutland Square Trust II (2010-2014) and Assistant Secretary of Fidelity's Fixed Income and Asset Allocation Funds (2013-2015). Prior to joining Fidelity Investments, Mr. Bryant served as a Senior Vice President and the Head of Global Retail Legal for AllianceBernstein L.P. (2006-2010), and as the General Counsel for ProFund Advisors LLC (2001-2006). |
William C. Coffey (1969) |
Year of Election or Appointment: 2009 Assistant Secretary |
| Mr. Coffey also serves as Assistant Secretary of other funds. He is Senior Vice President and Deputy General Counsel of FMR LLC (diversified financial services company, 2010-present), and is an employee of Fidelity Investments. Previously, Mr. Coffey served as Vice President and Associate General Counsel of FMR LLC (2005-2009). |
Jonathan Davis (1968) |
Year of Election or Appointment: 2010 Assistant Treasurer |
| Mr. Davis also serves as Assistant Treasurer of other funds, and is an employee of Fidelity Investments. Previously, Mr. Davis served as Vice President and Associate General Counsel of FMR LLC (diversified financial services company, 2003-2010). |
Adrien E. Deberghes (1967) |
Year of Election or Appointment: 2008 Deputy Treasurer |
| Mr. Deberghes also serves as an officer of other funds. He is an employee of Fidelity Investments (2008-present). Prior to joining Fidelity Investments, Mr. Deberghes was Senior Vice President of Mutual Fund Administration at State Street Corporation (2007-2008), Senior Director of Mutual Fund Administration at Investors Bank & Trust (2005-2007), and Director of Finance for Dunkin' Brands (2000-2005). |
Stephanie J. Dorsey (1969) |
Year of Election or Appointment: 2010 Assistant Treasurer |
| Ms. Dorsey also serves as an officer of other funds. She is an employee of Fidelity Investments (2008-present) and has served in other fund officer roles. Prior to joining Fidelity Investments, Ms. Dorsey served as Treasurer (2004-2008) of the JPMorgan Mutual Funds and Vice President (2004-2008) of JPMorgan Chase Bank. |
Howard J. Galligan III (1966) |
Year of Election or Appointment: 2014 Chief Financial Officer |
| Mr. Galligan also serves as Chief Financial Officer of other funds. Mr. Galligan serves as President of Fidelity Pricing and Cash Management Services (FPCMS) (2014-present) and as a Director of Strategic Advisers, Inc. (investment adviser firm, 2008-present). Previously, Mr. Galligan served as Chief Administrative Officer of Asset Management (2011-2014) and Chief Operating Officer and Senior Vice President of Investment Support for Strategic Advisers, Inc. (2003-2011). |
Scott C. Goebel (1968) |
Year of Election or Appointment: 2015 Vice President |
| Mr. Goebel serves as Vice President of other funds and is an employee of Fidelity Investments (2001-present). Previously, Mr. Goebel served as Secretary of Fidelity SelectCo, LLC (investment adviser firm, 2013-2015), Fidelity Investments Money Management, Inc. (FIMM) (investment adviser firm, 2010-2015), and Fidelity Research and Analysis Company (FRAC) (investment adviser firm, 2010-2015); General Counsel, Secretary, and Senior Vice President of Fidelity Management & Research Company (investment adviser firm, 2008-2015) and FMR Co., Inc. (investment adviser firm, 2008-2015); Assistant Secretary of Fidelity Management & Research (Japan) Limited (investment adviser firm, 2008-2015) and FMR Investment Management (U.K.) Limited (investment adviser firm, 2008-2015); Chief Legal Officer (CLO) of Fidelity Management & Research (Hong Kong) Limited (investment adviser firm, 2008-2015); Secretary and CLO of certain Fidelity funds (2008-2015); Assistant Secretary of FIMM (2008-2010), FRAC (2008-2010), and certain funds (2007-2008); and as Vice President and Secretary of Fidelity Distributors Corporation (FDC) (2005-2007). |
Brian B. Hogan (1964) |
Year of Election or Appointment: 2009 Vice President |
| Mr. Hogan also serves as Trustee or Vice President of other funds. Mr. Hogan serves as a Director of Fidelity SelectCo, LLC (investment adviser firm, 2014-present) and President of the Equity Division of FMR (investment adviser firm, 2009-present). Previously, Mr. Hogan served as Senior Vice President, Equity Research of FMR (2006-2009) and as a portfolio manager. |
Chris Maher (1972) |
Year of Election or Appointment: 2013 Assistant Treasurer |
| Mr. Maher serves as Assistant Treasurer of other funds. Mr. Maher is Vice President of Valuation Oversight and is an employee of Fidelity Investments. Previously, Mr. Maher served as Vice President of Asset Management Compliance (2013), Vice President of the Program Management Group of FMR (investment adviser firm, 2010-2013), and Vice President of Valuation Oversight (2008-2010). |
Kenneth B. Robins (1969) |
Year of Election or Appointment: 2008 President and Treasurer |
| Mr. Robins also serves as an officer of other funds. Mr. Robins serves as Executive Vice President of Fidelity Investments Money Management, Inc. (FIMM) (investment adviser firm, 2013-present) and is an employee of Fidelity Investments (2004-present). Previously, Mr. Robins served in other fund officer roles. |
Stacie M. Smith (1974) |
Year of Election or Appointment: 2013 Deputy Treasurer |
| Ms. Smith also serves as an officer of other funds. She is an employee of Fidelity Investments (2009-present) and has served in other fund officer roles. Prior to joining Fidelity Investments, Ms. Smith served as Senior Audit Manager of Ernst & Young LLP (1996-2009). |
Renee Stagnone (1975) |
Year of Election or Appointment: 2013 Deputy Treasurer |
| Ms. Stagnone also serves as Deputy Treasurer of other funds. Ms. Stagnone is an employee of Fidelity Investments (1997-present). |
Linda J. Wondrack (1964) |
Year of Election or Appointment: 2014 Chief Compliance Officer |
| Ms. Wondrack also serves as Chief Compliance Officer of other funds. Ms. Wondrack is Executive Vice President and head of the Ethics Office and Asset Management Compliance for Fidelity Investments (2012-present). Ms. Wondrack also serves as Chief Compliance Officer of Fidelity SelectCo, LLC (investment adviser firm, 2014-present); Chief Compliance Officer of Impresa Management LLC (2013-present); and Chief Compliance Officer of FMR Co., Inc. (investment adviser firm), Fidelity Investments Money Management, Inc. (investment adviser firm), Fidelity Management & Research (Japan) Limited (investment adviser firm), FMR Investment Management (U.K.) Limited (investment adviser firm), Fidelity Management & Research (Hong Kong) (investment adviser firm), Fidelity Management & Research Company (investment adviser firm), FIAM LLC (investment adviser firm), and Strategic Advisers, Inc. (investment adviser firm), Ballyrock Investment Advisors LLC, and Northern Neck Investors LLC (2012-present). Previously, Ms. Wondrack served as Senior Vice President and Chief Compliance Officer for Columbia Management Investment Advisers, LLC (2005-2012); Chief Compliance Officer for certain funds within the Columbia Family of Funds (2007-2012); and Senior Vice President of Compliance Risk Management at Bank of America (2005-2010). |
Joseph F. Zambello (1957) |
Year of Election or Appointment: 2011 Deputy Treasurer |
| Mr. Zambello also serves as Deputy Treasurer of other funds. Mr. Zambello is an employee of Fidelity Investments (1991-present). Previously, Mr. Zambello served as Vice President of the Program Management Group of FMR (investment adviser firm, 2009-2011) and Vice President of the Transfer Agent Oversight Group (2005-2009). |
Annual Report
The Board of Trustees of Fidelity Global Commodity Stock Fund voted to pay to shareholders of record at the opening of business on record date, the following distributions per share derived from capital gains realized from sales of portfolio securities, and dividends derived from net investment income:
| Pay Date | Record Date | Dividends | Capital Gains |
Class A | 12/07/15 | 12/04/15 | $0.210 | $0.010 |
Class T | 12/07/15 | 12/04/15 | $0.172 | $0.010 |
Class B | 12/07/15 | 12/04/15 | $0.106 | $0.010 |
Class C | 12/07/15 | 12/04/15 | $0.120 | $0.010 |
Class A designates 66%, Class T designates 86%, Class B designates 100%, and Class C designates 100% of the dividend distributed during the fiscal year as qualifying for the dividends-received deduction for corporate shareholders.
Class A, T, B, and C designate 100% of the dividend distributed during the fiscal year as amounts which may be taken into account as a dividend for purposes of the maximum rate under section 1(h)(11) of the Internal Revenue Code.
The amounts per share which represent income derived from sources within, and taxes paid to, foreign countries or possessions of the United States are as follows:
| Pay Date | Income | Taxes |
Class A | 12/08/14 | $0.1744 | $0.0094 |
Class T | 12/08/14 | $0.1344 | $0.0094 |
Class B | 12/08/14 | $0.0514 | $0.0094 |
Class C | 12/08/14 | $0.0604 | $0.0094 |
The fund will notify shareholders in January 2016 of amounts for use in preparing 2015 income tax returns.
Annual Report
Fidelity Global Commodity Stock Fund
Each year, the Board of Trustees, including the Independent Trustees (together, the Board), votes on the renewal of the management contract with Fidelity Management & Research Company (FMR) and the sub-advisory agreements (together, the Advisory Contracts) for the fund. The Board, assisted by the advice of fund counsel and Independent Trustees' counsel, requests and considers a broad range of information relevant to the renewal of the Advisory Contracts throughout the year.
The Board meets regularly and, at each of its meetings, covers an extensive agenda of topics and materials and considers factors that are relevant to its annual consideration of the renewal of the fund's Advisory Contracts, including the services and support provided to the fund and its shareholders. The Board has established various standing committees (Committees), each composed of and chaired by Independent Trustees with varying backgrounds, to which the Board has assigned specific subject matter responsibilities in order to enhance effective decision-making by the Board. The Board, acting directly and through its Committees, requests and receives information concerning the annual consideration of the renewal of the fund's Advisory Contracts. The Board also meets as needed to consider matters specifically related to the Board's annual consideration of the renewal of the Advisory Contracts. Members of the Board may also meet with trustees of other Fidelity funds through ad hoc joint committees to discuss certain matters relevant to all of the Fidelity funds.
At its July 2015 meeting, the Board unanimously determined to renew the fund's Advisory Contracts. In reaching its determination, the Board considered all factors it believed relevant, including (i) the nature, extent, and quality of the services to be provided to the fund and its shareholders (including the investment performance of the fund); (ii) the competitiveness of the fund's management fee and total expense ratio relative to peer funds; (iii) the total costs of the services to be provided by and the profits to be realized by Fidelity from its relationship with the fund; and (iv) the extent to which (if any) economies of scale exist and would be realized as the fund grows, and whether any economies of scale are appropriately shared with fund shareholders.
In considering whether to renew the Advisory Contracts for the fund, the Board reached a determination, with the assistance of fund counsel and Independent Trustees' counsel and through the exercise of its business judgment, that the renewal of the Advisory Contracts was in the best interests of the fund and its shareholders and that the compensation payable under the Advisory Contracts was fair and reasonable. The Board's decision to renew the Advisory Contracts was not based on any single factor, but rather was based on a comprehensive consideration of all the information provided to the Board at its meetings throughout the year. The Board, in reaching its determination to renew the Advisory Contracts, was aware that shareholders of the fund have a broad range of investment choices available to them, including a wide choice among funds offered by Fidelity's competitors, and that the fund's shareholders, who have the opportunity to review and weigh the disclosure provided by the fund in its prospectus and other public disclosures, have chosen to invest in this fund, which is part of the Fidelity family of funds.
Annual Report
Nature, Extent, and Quality of Services Provided. The Board considered Fidelity's staffing as it relates to the fund, including the backgrounds of investment personnel of Fidelity, and also considered the fund's investment objective, strategies, and related investment philosophy. The Independent Trustees also had discussions with senior management of Fidelity's investment operations and investment groups. The Board considered the structure of the portfolio manager compensation program and whether this structure provides appropriate incentives to act in the best interests of the fund. Additionally, the Board considered the portfolio managers' investments, if any, in the funds that they manage.
Resources Dedicated to Investment Management and Support Services. The Board and the Fund Oversight and Research Committees reviewed the general qualifications and capabilities of Fidelity's investment staff, including its size, education, experience, and resources, as well as Fidelity's approach to recruiting, training, managing, and compensating investment personnel. The Board noted that Fidelity has continued to increase the resources devoted to non-U.S. offices, including expansion of Fidelity's global investment organization. The Board also noted that Fidelity's analysts have extensive resources, tools and capabilities that allow them to conduct sophisticated quantitative and fundamental analysis, as well as credit analysis of issuers, counterparties and guarantors. Further, the Board considered that Fidelity's investment professionals have sufficient access to global information and data so as to provide competitive investment results over time, and that those professionals also have access to sophisticated tools that permit them to assess portfolio construction and risk and performance attribution characteristics continuously, as well as to transmit new information and research conclusions rapidly around the world. Additionally, in its deliberations, the Board considered Fidelity's trading, risk management, and compliance capabilities and resources, which are integral parts of the investment management process.
Shareholder and Administrative Services. The Board considered (i) the nature, extent, quality, and cost of advisory, administrative, and shareholder services performed by FMR, the sub-advisers (together with FMR, the Investment Advisers), and their affiliates under the Advisory Contracts and under separate agreements covering transfer agency, pricing and bookkeeping, and securities lending services for the fund; (ii) the nature and extent of the supervision of third party service providers, principally custodians and subcustodians; and (iii) the resources devoted to, and the record of compliance with, the fund's compliance policies and procedures. The Board also reviewed the allocation of fund brokerage, including allocations to brokers affiliated with the Investment Advisers, the use of brokerage commissions to pay fund expenses, and the use of "soft" commission dollars to pay for research services.
Annual Report
Board Approval of Investment Advisory Contracts and
Management Fees - continued
The Board noted that the growth of fund assets over time across the complex allows Fidelity to reinvest in the development of services designed to enhance the value or convenience of the Fidelity funds as investment vehicles. These services include 24-hour access to account information and market information through telephone representatives and over the Internet, investor education materials and asset allocation tools, and the expanded availability of Fidelity Investor Centers.
In 2014, the Board formed an ad hoc Committee on Transfer Agency Fees to review the variety of transfer agency fee structures throughout the industry and Fidelity's competitive positioning with respect to industry participants.
Investment in a Large Fund Family. The Board considered the benefits to shareholders of investing in a Fidelity fund, including the benefits of investing in a fund that is part of a large family of funds offering a variety of investment disciplines and providing a large variety of mutual fund investor services. The Board noted that Fidelity had taken, or had made recommendations that resulted in the Fidelity funds taking, a number of actions over the previous year that benefited particular funds, including (i) continuing to dedicate additional resources to investment research and to the support of the senior management team that oversees asset management; (ii) continuing efforts to enhance Fidelity's global research capabilities; (iii) launching new funds and making other enhancements to meet client needs; (iv) reducing management fees and total expenses for certain index funds and diversified international funds; (v) continuing to launch dedicated lower cost underlying funds to meet portfolio construction needs related to expanding underlying fund options for Fidelity funds of funds, specifically for the Freedom Fund product lines; (vi) rationalizing product lines and gaining increased efficiencies through fund mergers; (vii) launching active fixed-income exchange-traded funds; (viii) continuing to develop, acquire and implement systems and technology to improve services to the funds and information security and to increase efficiency; (ix) implementing investment enhancements to further strengthen Fidelity's target date product line to increase investors' probability of success in achieving their goals; (x) modifying the eligibility criteria for certain share classes to accommodate roll-over assets from employer-sponsored retirement plans; (xi) launching a new Class W of the Freedom Index Funds to attract and retain Fidelity record-kept retirement plan assets; and (xii) implementing changes to Fidelity's money market product line in response to recent money market regulatory reforms.
Investment Performance. The Board considered whether the fund has operated in accordance with its investment objective, as well as its record of compliance with its investment restrictions and its performance history.
Annual Report
The Board took into account discussions with representatives of the Investment Advisers about fund investment performance that occur at Board meetings throughout the year. In this regard the Board noted that as part of regularly scheduled fund reviews and other reports to the Board on fund performance, the Board considers annualized return information for the fund, for different time periods, measured against a securities market index ("benchmark index") and a peer group of funds with similar objectives ("peer group"), if any. In its evaluation of fund investment performance, the Board gave particular attention to information indicating changes in performance of certain Fidelity funds for specific time periods and discussed with the Investment Advisers the reasons for any overperformance or underperformance.
In addition to reviewing absolute and relative fund performance, the Independent Trustees periodically consider the appropriateness of fund performance metrics in evaluating the results achieved. In general, the Independent Trustees believe that fund performance should be evaluated based on net performance (after fees and expenses) of both the highest performing and lowest performing fund share classes, where applicable, compared to appropriate benchmark indices, over appropriate time periods that may include full market cycles, and compared to peer groups, as applicable, over the same periods, taking into account relevant factors including the following: general market conditions; issuer-specific information; and fund cash flows and other factors.
The Independent Trustees recognize that shareholders evaluate performance on a net basis over their own holding periods, for which one-, three-, and five-year periods are often used as a proxy. For this reason, the performance information reviewed by the Board also included net cumulative calendar year total return information for the fund and an appropriate benchmark index for the most recent one-, three-, and five-year periods, as shown below. A peer group is not shown below because the fund does not generally utilize a peer group for performance comparison purposes.
Annual Report
Board Approval of Investment Advisory Contracts and
Management Fees - continued
Fidelity Global Commodity Stock Fund

The Board has discussed the fund's performance with FMR, including the fund's underperformance based on more recent periods ended after 2014 (which periods are not shown in the chart above) but prior to the date of the Board's approval of the renewal of the Advisory Contracts, and has engaged with FMR to consider what steps might be taken to remediate the fund's more recent underperformance.
Based on its review, the Board concluded that the nature, extent, and quality of services provided to the fund under the Advisory Contracts should benefit the shareholders of the fund.
Competitiveness of Management Fee and Total Expense Ratio. The Board considered the fund's management fee and total expense ratio compared to "mapped groups" of competitive funds and classes created for the purpose of facilitating the Trustees' competitive analysis of management fees and total expenses. Fidelity creates "mapped groups" by combining similar Lipper investment objective categories that have comparable investment mandates. Combining Lipper investment objective categories aids the Board's management fee and total expense ratio comparisons by broadening the competitive group used for comparison.
Management Fee. The Board considered two proprietary management fee comparisons for the 12-month periods shown in basis points (BP) in the chart below. The group of Lipper funds used by the Board for management fee comparisons is referred to below as the "Total Mapped Group." The Total Mapped Group comparison focuses on a fund's standing in terms of gross management fees before expense reimbursements or caps relative to the total universe of funds with comparable investment mandates, regardless of whether their management fee structures also are comparable. Funds with comparable investment mandates offer exposure to similar types of securities. Funds with comparable management fee structures have similar management fee contractual arrangements (e.g., flat rate charged for advisory services, all-inclusive fee rate, etc.). "TMG %" represents the percentage of funds in the Total Mapped Group that had management fees that were lower than the fund's. For example, a hypothetical TMG % of 20% would mean that 80% of the funds in the Total Mapped Group had higher, and 20% had lower, management fees than the fund. The fund's actual TMG %s and the number of funds in the Total Mapped Group are in the chart below. The "Asset-Size Peer Group" (ASPG) comparison focuses on a fund's standing relative to a subset of non-Fidelity funds within the Total Mapped Group that are similar in size and management fee structure without taking into account performance adjustments, if any. For example, if a fund is in the first quartile of the ASPG, the fund's management fee ranks in the least expensive or lowest 25% of funds in the ASPG. The ASPG represents at least 15% of the funds in the Total Mapped Group with comparable asset size and management fee structures, subject to a minimum of 50 funds (or all funds in the Total Mapped Group if fewer than 50). Additional information, such as the ASPG quartile in which the fund's management fee rate ranked, is also included in the chart and considered by the Board.
Annual Report
Fidelity Global Commodity Stock Fund

The Board noted that the fund's management fee rate ranked below the median of its Total Mapped Group and below the median of its ASPG for 2014.
The Board noted that, in 2014, the ad hoc Committee on Group Fee was formed by it and other Fidelity fund boards to conduct an in-depth review of the "group fee" component of the management fee of funds with such management fee structures. Committee focus included the mechanics of the group fee, the competitive landscape of group fee structures, Fidelity funds with no group fee component and investment products not included in group fee assets. The Board also considered that, for funds subject to the group fee, FMR agreed to voluntarily waive fees over a specified period of time in amounts designed to account for assets converted from certain funds to certain collective investment trusts.
Annual Report
Board Approval of Investment Advisory Contracts and
Management Fees - continued
The Board also noted that, in 2013, the ad hoc Committee on Management Fees was formed to conduct an in-depth review of the management fee rates of Fidelity's active equity mutual funds. The Committee focused on the following areas: (i) standard fee structures; (ii) research consumption and trading evolution; (iii) management fee competitiveness/profitability by category; and (iv) factors that drive institutional pricing.
Based on its review, the Board concluded that the fund's management fee is fair and reasonable in light of the services that the fund receives and the other factors considered.
Total Expense Ratio. In its review of each class's total expense ratio, the Board considered the fund's management fee as well as other fund or class expenses, as applicable, such as transfer agent fees, pricing and bookkeeping fees, fund-paid 12b-1 fees, and custodial, legal, and audit fees. The Board also noted that Fidelity may agree to waive fees and expenses from time to time, and the extent to which, if any, it has done so for the fund. As part of its review, the Board also considered the current and historical total expense ratios of each class of the fund compared to competitive fund median expenses. Each class of the fund is compared to those funds and classes in the Total Mapped Group (used by the Board for management fee comparisons) that have a similar sales load structure.
The Board noted that the total expense ratio of each of Class A, Class I, and the retail class ranked below its competitive median for 2014 and the total expense ratio of each of Class T, Class B, and Class C ranked above its competitive median for 2014. The Board considered that, in general, various factors can affect total expense ratios. The Board noted that the total expense ratio of Class T was above the competitive median primarily because of higher 12b-1 fees on Class T as compared to most competitor funds. Class T has a higher 12b-1 fee, but a lower front-end sales charge, than traditionally priced front-end sales charge classes. The Board considered that Class T is primarily sold load-waived in the retirement plan market where its 0.50% 12b-1 fee is comparable to competing no-load, higher 12b-1 fee classes designed specifically for retirement plans. The Board noted that the fund offers multiple classes, each of which has a different sales load and 12b-1 fee structure, and that the multiple structures are intended to offer a range of pricing options for the intermediary market. The Board also noted that the total expense ratios of the classes vary primarily by the level of their 12b-1 fees, although differences in transfer agent fees may also cause expenses to vary from class to class.
Annual Report
Fees Charged to Other Fidelity Clients. The Board also considered Fidelity fee structures and other information with respect to clients of Fidelity, such as other funds advised or subadvised by Fidelity, pension plan clients, and other institutional clients with similar mandates. The Board noted the findings of the 2013 ad hoc joint committee (created with the board of other Fidelity funds), which reviewed and compared Fidelity's institutional investment advisory business with its business of providing services to the Fidelity funds, including the differences in services provided, fees charged, and costs incurred, as well as competition in their respective marketplaces.
Based on its review of total expense ratios and fees charged to other Fidelity clients, the Board concluded that, although in some cases above the median of the universe presented for comparison, the total expense ratio of each class of the fund was reasonable in light of the services that the fund and its shareholders receive and the other factors considered.
Costs of the Services and Profitability. The Board considered the revenues earned and the expenses incurred by Fidelity in conducting the business of developing, marketing, distributing, managing, administering and servicing the fund and servicing the fund's shareholders. The Board also considered the level of Fidelity's profits in respect of all the Fidelity funds.
On an annual basis, Fidelity presents to the Board information about the profitability of its relationship with the fund. Fidelity calculates profitability information for each fund, as well as aggregate profitability information for groups of Fidelity funds and all Fidelity funds, using a series of detailed revenue and cost allocation methodologies which originate with the books and records of Fidelity on which Fidelity's audited financial statements are based. The Audit Committee of the Board reviews any significant changes from the prior year's methodologies.
PricewaterhouseCoopers LLP (PwC), independent registered public accounting firm and auditor to Fidelity and certain Fidelity funds, has been engaged annually by the Board as part of the Board's assessment of Fidelity's profitability analysis. PwC's engagement includes the review and assessment of the methodologies used by Fidelity in determining the revenues and expenses attributable to Fidelity's mutual fund business, and completion of agreed-upon procedures in respect of the mathematical accuracy of fund profitability and its conformity to established allocation methodologies. After considering PwC's reports issued under the engagement and information provided by Fidelity, the Board concluded that while other allocation methods may also be reasonable, Fidelity's profitability methodologies are reasonable in all material respects.
Annual Report
Board Approval of Investment Advisory Contracts and
Management Fees - continued
The Board also reviewed Fidelity's non-fund businesses and fall-out benefits related to the mutual fund business as well as cases where Fidelity's affiliates may benefit from or be related to the fund's business.
The Board considered the costs of the services provided by and the profits realized by Fidelity in connection with the operation of the fund and was satisfied that the profitability was not excessive.
Economies of Scale. The Board considered whether there have been economies of scale in respect of the management of the Fidelity funds, whether the Fidelity funds (including the fund) have appropriately benefited from any such economies of scale, and whether there is potential for realization of any further economies of scale. The Board considered the extent to which the fund will benefit from economies of scale as assets grow through increased services to the fund, through waivers or reimbursements, or through fee or expense ratio reductions. The Board also noted that in 2013, it and the boards of other Fidelity funds created an ad hoc committee (the Economies of Scale Committee) to analyze whether Fidelity attains economies of scale in respect of the management and servicing of the Fidelity funds, whether the Fidelity funds have appropriately benefited from such economies of scale, and whether there is potential for realization of any further economies of scale.
The Board recognized that the fund's management contract incorporates a "group fee" structure, which provides for lower group fee rates as total group assets increase, and for higher group fee rates as total group assets decrease (with "group assets" defined to include fund assets under FMR's management plus sector fund assets previously under FMR's management and currently managed by Fidelity SelectCo, LLC). FMR calculates the group fee rates based on a tiered asset "breakpoint" schedule that varies based on asset class. The Board considered that the group fee is designed to deliver the benefits of economies of scale to fund shareholders when total Fidelity fund assets increase, even if assets of any particular fund are unchanged or have declined, because some portion of Fidelity's costs are attributable to services provided to all Fidelity funds, and all funds benefit if those costs can be allocated among more assets. The Board concluded that, given the group fee structure, fund shareholders will benefit from lower management fees as group assets increase at the fund complex level, regardless of whether Fidelity achieves any such economies of scale.
The Board concluded, taking into account the analysis of the Economies of Scale Committee, that economies of scale, if any, are being appropriately shared between fund shareholders and Fidelity.
Additional Information Requested by the Board. In order to develop fully the factual basis for consideration of the Fidelity funds' Advisory Contracts, the Board requested and received additional information on certain topics, including: (i) fund performance trends and Fidelity's long-term strategies for certain funds; (ii) the various share classes employed by Fidelity and the attributes of each class, together with similar information on the distribution and servicing payments made by Fidelity or the funds to third-party participants in the distribution channels; (iii) fund profitability, and fund performance in relation to fund profitability; (iv) the methodology with respect to evaluating competitive fund data and peer group classifications and fee comparisons; (v) annual fund profitability margins, with particular focus on certain funds with negative margins; (vi) the realization of fall-out benefits in certain Fidelity business units; (vii) economies of scale and the way in which they are shared with fund shareholders; (viii) Fidelity's group fee structures, including the group fee schedule of breakpoints; (ix) the impact of cost containment measures on the funds; and (x) the transfer agent fee structure.
Annual Report
Based on its evaluation of all of the conclusions noted above, and after considering all factors it believed relevant, the Board concluded that the advisory fee structures are fair and reasonable, and that the fund's Advisory Contracts should be renewed.
Annual Report
Investment Adviser
Fidelity Management & Research Company
Boston, MA
Investment Sub-Advisers
FMR Co., Inc.
FMR Investment Management
(U.K.) Limited
FIL Investment Advisors
FIL Investments (Japan) Limited
FIL Investment Advisors (UK) Limited
Fidelity Management & Research
(Hong Kong) Limited
Fidelity Management & Research
(Japan) Limited
General Distributor
Fidelity Distributors Corporation
Smithfield, RI
Transfer and Service Agents
Fidelity Investments Institutional
Operations Company, Inc.
Boston, MA
Fidelity Service Company, Inc.
Boston, MA
Custodian
State Street Bank and Trust Company
Quincy, MA
(Fidelity Investment logo)(registered trademark)
AGCS-UANN-1215
1.879395.106
(Fidelity Investment logo)(registered trademark)
Fidelity Advisor®
Global Commodity Stock
Fund - Class I
(formerly Institutional Class)
Annual Report
October 31, 2015
(Fidelity Cover Art)
Class I is a
class of Fidelity® Global
Commodity Stock Fund
Contents
Performance | (Click Here) | How the fund has done over time. |
Management's Discussion of Fund Performance | (Click Here) | The Portfolio Manager's review of fund performance and strategy. |
Shareholder Expense Example | (Click Here) | An example of shareholder expenses. |
Investment Changes | (Click Here) | A summary of major shifts in the fund's investments over the past six months. |
Investments | (Click Here) | A complete list of the fund's investments with their market values. |
Financial Statements | (Click Here) | Statements of assets and liabilities, operations, and changes in net assets, as well as financial highlights. |
Notes | (Click Here) | Notes to the financial statements. |
Report of Independent Registered Public Accounting Firm | (Click Here) | |
Trustees and Officers | (Click Here) | |
Distributions | (Click Here) | |
Board Approval of Investment Advisory Contracts and Management Fees | (Click Here) | |
To view a fund's proxy voting guidelines and proxy voting record for the 12-month period ended June 30, visit http://www.fidelity.com/proxyvotingresults or visit the Securities and Exchange Commission's (SEC) web site at http://www.sec.gov. You may also call 1-877-208-0098 to request a free copy of the proxy voting guidelines.
Standard & Poor's, S&P and S&P 500 are registered service marks of The McGraw-Hill Companies, Inc. and have been licensed for use by Fidelity Distributors Corporation.
Other third-party marks appearing herein are the property of their respective owners.
All other marks appearing herein are registered or unregistered trademarks or service marks of FMR LLC or an affiliated company. © 2015 FMR LLC. All rights reserved.
Annual Report
This report and the financial statements contained herein are submitted for the general information of the shareholders of the fund. This report is not authorized for distribution to prospective investors in the fund unless preceded or accompanied by an effective prospectus.
A fund files its complete schedule of portfolio holdings with the SEC for the first and third quarters of each fiscal year on Form N-Q. Forms N-Q are available on the SEC's web site at http://www.sec.gov. A fund's Forms N-Q may be reviewed and copied at the SEC's Public Reference Room in Washington, DC. Information regarding the operation of the SEC's Public Reference Room may be obtained by calling 1-800-SEC-0330. For a complete list of a fund's portfolio holdings, view the most recent holdings listing, semiannual report, or annual report on Fidelity's web site at http://www.fidelity.com, http://www.advisor.fidelity.com, or http://www.401k.com, as applicable.
NOT FDIC INSURED • MAY LOSE VALUE • NO BANK GUARANTEE
Neither the fund nor Fidelity Distributors Corporation is a bank.
Annual Report
Average annual total return reflects the change in the value of an investment, assuming reinvestment of the class' distributions from dividend income and capital gains (the profits earned upon the sale of securities that have grown in value, if any) and assuming a constant rate of performance each year. The $10,000 table and the fund's returns do not reflect the deduction of taxes that a shareholder would pay on fund distributions or the redemption of fund shares. During periods of reimbursement by Fidelity, a fund's total return will be greater than it would be had the reimbursement not occurred. How a fund did yesterday is no guarantee of how it will do tomorrow.
Average Annual Total Returns
Periods ended October 31, 2015 | Past 1
year | Past 5
years | Life of
fund A |
Class I | -22.93% | -7.23% | 1.21% |
A From March 25, 2009.
$10,000 Over Life of Fund
Let's say hypothetically that $10,000 was invested in Fidelity Advisor® Global Commodity Stock Fund - Class I on March 25, 2009, when the fund started. The chart shows how the value of your investment would have changed, and also shows how the MSCI ACWI (All Country World Index) Index performed over the same period.
Annual Report
Market Recap: Following an August and September wherein a collapse in commodities prices hurt resources-related sectors and geographies, global equities rebounded in October to finish flat for the 12 months ending October 31, 2015. The MSCI ACWI (All Country World Index) Index returned 0.35% for the period. Commodity producers remained under pressure for much of the past year, largely related to economic deceleration in China (-1%), the world's second-largest economy and a leading consumer of raw materials. This effect was exacerbated by the strength of the U.S. dollar relative to global currencies, which weighed on commodities priced in dollars and acutely impacted equity returns within regions most exposed to resources prices. For example, the emerging-markets group returned -15% this period. Canada, a significant energy producer, returned about -17%. Conversely, net energy consumer Japan (+9%) proved the best-performing region by far. Only about a quarter of the nearly 50 countries in the index managed a gain: Israel (+17%) and fast-growing Ireland (+12%) performed best; Greece (-56%) and Brazil (-46%), among the worst. As for sectors, energy (-22%) and materials (-12%) declined sharply, while consumer discretionary (+13%) saw a gain driven largely by demand in the United States (+5%).
Comments from Portfolio Manager S. Joseph Wickwire II, CFA: For the year, the fund's share classes (excluding sales charges, if applicable) performed roughly in line with the -22.98% return of the industry benchmark, the MSCI AC World Commodity Producers Sector Capped Index. In a difficult market for commodity stocks, the fund significantly underperformed the broader global market, as measured by the MSCI ACWI (All Country World Index) Index. Versus the MSCI industry index, the fund was helped by stock picking in oil & gas exploration & production, agricultural & farm machinery, and paper packaging. Positioning in gold and fertilizers & agricultural chemicals also helped. Among individual stocks, overweighting fertilizer firms CF Industries Holdings and Agrium was additive, along with larger-than-benchmark stakes in several gold-related names. Conversely, the fund was hurt by positioning in the paper products industry and its stake in coal firm Peabody Energy, which was eliminated by period end. An out-of-benchmark stake in fertilizer firm Intrepid Potash was the fund's largest relative detractor, followed by an underweighting in Exxon Mobil.
The views expressed above reflect those of the portfolio manager(s) only through the end of the period as stated on the cover of this report and do not necessarily represent the views of Fidelity or any other person in the Fidelity organization. Any such views are subject to change at any time based upon market or other conditions and Fidelity disclaims any responsibility to update such views. These views may not be relied on as investment advice and, because investment decisions for a Fidelity fund are based on numerous factors, may not be relied on as an indication of trading intent on behalf of any Fidelity fund.
Annual Report
Shareholder Expense Example
As a shareholder of the Fund, you incur two types of costs: (1) transaction costs, including sales charges (loads) on purchase payments or redemption proceeds, redemption fees and (2) ongoing costs, including management fees, distribution and/or service (12b-1) fees and other Fund expenses. This Example is intended to help you understand your ongoing costs (in dollars) of investing in the Fund and to compare these costs with the ongoing costs of investing in other mutual funds.
The Example is based on an investment of $1,000 invested at the beginning of the period and held for the entire period (May 1, 2015 to October 31, 2015).
Actual Expenses
The first line of the accompanying table for each class of the Fund provides information about actual account values and actual expenses. You may use the information in this line, together with the amount you invested, to estimate the expenses that you paid over the period. Simply divide your account value by $1,000.00 (for example, an $8,600 account value divided by $1,000.00 = 8.6), then multiply the result by the number in the first line for a class of the Fund under the heading entitled "Expenses Paid During Period" to estimate the expenses you paid on your account during this period. A small balance maintenance fee of $12.00 that is charged once a year may apply for certain accounts with a value of less than $2,000. This fee is not included in the table below. If it was, the estimate of expenses you paid during the period would be higher, and your ending account value lower, by this amount. In addition, the Fund, as a shareholder in the underlying Fidelity Central Funds, will indirectly bear its pro-rata share of the fees and expenses incurred by the underlying Fidelity Central Funds. These fees and expenses are not included in the Fund's annualized expense ratio used to calculate the expense estimate in the table below.
Hypothetical Example for Comparison Purposes
The second line of the accompanying table for each class of the Fund provides information about hypothetical account values and hypothetical expenses based on a Class' actual expense ratio and an assumed rate of return of 5% per year before expenses, which is not the Class' actual return. The hypothetical account values and expenses may not be used to estimate the actual ending account balance or expenses you paid for the period. You may use this information to compare the ongoing costs of investing in the Fund and other funds. To do so, compare this 5% hypothetical example with the 5% hypothetical examples that appear in the shareholder reports of the other funds. A small balance maintenance fee of $12.00 that is charged once a year may apply for certain accounts with a value of less than $2,000. This fee is not included in the table below. If it was, the estimate of expenses you paid during the period would be higher, and your ending account value lower, by this amount. In addition, the Fund, as a shareholder in the underlying Fidelity Central Funds, will indirectly bear its pro-rata share of the fees and expenses incurred by the underlying Fidelity Central Funds. These fees and expenses are not included in the Fund's annualized expense ratio used to calculate the expense estimate in the table below.
Please note that the expenses shown in the table are meant to highlight your ongoing costs only and do not reflect any transaction costs. Therefore, the second line of the table is useful in comparing ongoing costs only, and will not help you determine the relative total costs of owning different funds. In addition, if these transactional costs were included, your costs would have been higher.
Annual Report
Shareholder Expense Example - continued
| Annualized
Expense RatioB | Beginning
Account Value
May 1, 2015 | Ending
Account Value
October 31, 2015 | Expenses Paid
During PeriodC
May 1, 2015 to
October 31, 2015 |
Class A | 1.33% | | | |
Actual | | $ 1,000.00 | $ 782.10 | $ 5.97 |
HypotheticalA | | $ 1,000.00 | $ 1,018.50 | $ 6.77 |
Class T | 1.61% | | | |
Actual | | $ 1,000.00 | $ 781.00 | $ 7.23 |
HypotheticalA | | $ 1,000.00 | $ 1,017.09 | $ 8.19 |
Class B | 2.10% | | | |
Actual | | $ 1,000.00 | $ 779.50 | $ 9.42 |
HypotheticalA | | $ 1,000.00 | $ 1,014.62 | $ 10.66 |
Class C | 2.10% | | | |
Actual | | $ 1,000.00 | $ 779.30 | $ 9.42 |
HypotheticalA | | $ 1,000.00 | $ 1,014.62 | $ 10.66 |
Global Commodity Stock | 1.10% | | | |
Actual | | $ 1,000.00 | $ 783.40 | $ 4.94 |
HypotheticalA | | $ 1,000.00 | $ 1,019.66 | $ 5.60 |
Class I | 1.06% | | | |
Actual | | $ 1,000.00 | $ 783.40 | $ 4.76 |
HypotheticalA | | $ 1,000.00 | $ 1,019.86 | $ 5.40 |
A 5% return per year before expenses
B Annualized expense ratio reflects expenses net of applicable fee waivers.
C Expenses are equal to each Class' annualized expense ratio, multiplied by the average account value over the period, multiplied by 184/365 (to reflect the one-half year period).
Annual Report
Investment Changes (Unaudited)
Annual Report
Investments October 31, 2015
Showing Percentage of Net Assets
Common Stocks - 99.1% |
| Shares | | Value |
AEROSPACE & DEFENSE - 0.3% |
Aerospace & Defense - 0.3% |
Rolls-Royce Group PLC | 67,900 | | $ 718,010 |
CHEMICALS - 30.5% |
Commodity Chemicals - 0.3% |
LyondellBasell Industries NV Class A | 7,600 | | 706,116 |
Diversified Chemicals - 0.6% |
Eastman Chemical Co. | 19,200 | | 1,385,664 |
Fertilizers & Agricultural Chemicals - 29.6% |
Agrium, Inc. | 95,100 | | 8,847,442 |
CF Industries Holdings, Inc. | 115,560 | | 5,866,981 |
Intrepid Potash, Inc. (a) | 570,800 | | 2,203,288 |
K&S AG | 45,900 | | 1,158,629 |
Monsanto Co. | 170,000 | | 15,847,392 |
Potash Corp. of Saskatchewan, Inc. | 554,600 | | 11,231,117 |
Sociedad Quimica y Minera de Chile SA (PN-B) sponsored ADR | 165,200 | | 3,201,576 |
Syngenta AG (Switzerland) | 25,297 | | 8,499,044 |
The Mosaic Co. | 267,759 | | 9,047,577 |
Yara International ASA | 52,400 | | 2,378,637 |
| | 68,281,683 |
TOTAL CHEMICALS | | 70,373,463 |
CONSTRUCTION MATERIALS - 0.2% |
Construction Materials - 0.2% |
West China Cement Ltd. | 2,914,000 | | 500,991 |
CONTAINERS & PACKAGING - 1.3% |
Paper Packaging - 1.3% |
WestRock Co. | 54,359 | | 2,922,340 |
ELECTRICAL EQUIPMENT - 0.6% |
Electrical Components & Equipment - 0.6% |
Eaton Corp. PLC | 19,000 | | 1,062,290 |
SolarCity Corp. (a)(d) | 14,700 | | 435,855 |
| | 1,498,145 |
ENERGY EQUIPMENT & SERVICES - 0.9% |
Oil & Gas Equipment & Services - 0.9% |
Amec Foster Wheeler PLC | 52,381 | | 574,136 |
Ezion Holdings Ltd. | 1,199,700 | | 597,331 |
Common Stocks - continued |
| Shares | | Value |
ENERGY EQUIPMENT & SERVICES - CONTINUED |
Oil & Gas Equipment & Services - continued |
SBM Offshore NV (a)(d) | 33,900 | | $ 464,672 |
Schlumberger Ltd. | 6,300 | | 492,408 |
| | 2,128,547 |
FOOD PRODUCTS - 2.6% |
Agricultural Products - 2.6% |
Archer Daniels Midland Co. | 39,100 | | 1,785,306 |
Bunge Ltd. | 9,700 | | 707,712 |
Darling International, Inc. (a) | 86,600 | | 876,392 |
First Resources Ltd. | 834,000 | | 1,117,200 |
Golden Agri-Resources Ltd. | 2,314,000 | | 642,187 |
PT Charoen Pokphand Indonesia Tbk | 1,920,700 | | 349,184 |
SLC Agricola SA | 101,100 | | 451,425 |
| | 5,929,406 |
INDEPENDENT POWER AND RENEWABLE ELECTRICITY PRODUCERS - 0.7% |
Independent Power Producers & Energy Traders - 0.5% |
China Resources Power Holdings Co. Ltd. | 224,000 | | 506,726 |
Dynegy, Inc. (a) | 30,800 | | 598,444 |
| | 1,105,170 |
Renewable Electricity - 0.2% |
NextEra Energy Partners LP | 19,600 | | 514,696 |
TOTAL INDEPENDENT POWER AND RENEWABLE ELECTRICITY PRODUCERS | | 1,619,866 |
MACHINERY - 2.5% |
Agricultural & Farm Machinery - 1.4% |
AGCO Corp. | 15,700 | | 759,723 |
Deere & Co. | 25,100 | | 1,957,800 |
Jain Irrigation Systems Ltd. | 579,003 | | 545,623 |
| | 3,263,146 |
Construction Machinery & Heavy Trucks - 0.3% |
Manitowoc Co., Inc. (d) | 48,700 | | 745,110 |
Industrial Machinery - 0.8% |
Andritz AG | 23,200 | | 1,168,444 |
The Weir Group PLC | 36,500 | | 600,384 |
| | 1,768,828 |
TOTAL MACHINERY | | 5,777,084 |
Common Stocks - continued |
| Shares | | Value |
METALS & MINING - 25.9% |
Aluminum - 0.9% |
Alcoa, Inc. | 183,600 | | $ 1,639,548 |
Norsk Hydro ASA | 132,900 | | 476,019 |
| | 2,115,567 |
Diversified Metals & Mining - 13.6% |
Anglo American PLC (United Kingdom) | 226,551 | | 1,900,700 |
BHP Billiton PLC | 672,746 | | 10,753,200 |
Boliden AB | 37,700 | | 721,915 |
First Quantum Minerals Ltd. | 103,824 | | 554,215 |
Freeport-McMoRan, Inc. | 105,100 | | 1,237,027 |
Glencore Xstrata PLC | 1,482,334 | | 2,570,812 |
Grupo Mexico SA de CV Series B | 470,111 | | 1,145,266 |
Ivanhoe Mines Ltd. (a) | 1,036,000 | | 554,604 |
Ivanhoe Mines Ltd. Class A warrants 12/10/15 (a)(e) | 422,500 | | 1,616 |
MMC Norilsk Nickel PJSC sponsored ADR | 30,700 | | 455,895 |
Rio Tinto PLC | 272,287 | | 9,923,574 |
South32 Ltd. (a) | 635,336 | | 657,900 |
Teck Resources Ltd. Class B (sub. vtg.) | 78,900 | | 462,201 |
Vedanta Ltd. (a) | 343,066 | | 521,572 |
| | 31,460,497 |
Gold - 5.8% |
Acacia Mining PLC | 20,000 | | 59,506 |
Agnico Eagle Mines Ltd. (Canada) | 35,600 | | 1,006,253 |
Argonaut Gold, Inc. (a) | 510,400 | | 526,950 |
B2Gold Corp. (a) | 1,488,180 | | 1,604,721 |
Barrick Gold Corp. | 187,900 | | 1,444,169 |
Continental Gold, Inc. (a) | 374,900 | | 467,335 |
Eldorado Gold Corp. | 127,150 | | 444,383 |
Franco-Nevada Corp. | 17,600 | | 892,652 |
Goldcorp, Inc. | 144,310 | | 1,846,365 |
New Gold, Inc. (a) | 177,700 | | 440,309 |
Newcrest Mining Ltd. (a) | 52,027 | | 453,221 |
Newmont Mining Corp. | 85,000 | | 1,654,100 |
Premier Gold Mines Ltd. (a) | 254,100 | | 466,381 |
Randgold Resources Ltd. sponsored ADR | 15,100 | | 1,009,737 |
Royal Gold, Inc. | 10,400 | | 497,536 |
Torex Gold Resources, Inc. (a) | 513,700 | | 487,143 |
| | 13,300,761 |
Common Stocks - continued |
| Shares | | Value |
METALS & MINING - CONTINUED |
Precious Metals & Minerals - 0.3% |
Impala Platinum Holdings Ltd. (a) | 60,500 | | $ 165,338 |
Tahoe Resources, Inc. | 59,000 | | 492,719 |
| | 658,057 |
Silver - 0.4% |
Silver Wheaton Corp. | 72,900 | | 990,695 |
Steel - 4.9% |
Aperam (a) | 15,200 | | 469,599 |
ArcelorMittal SA Class A unit (d) | 181,300 | | 1,017,093 |
Hitachi Metals Ltd. | 5,400 | | 61,160 |
Hyundai Steel Co. | 13,323 | | 607,941 |
JFE Holdings, Inc. | 47,300 | | 743,581 |
Nippon Steel & Sumitomo Metal Corp. | 118,000 | | 2,392,161 |
Nucor Corp. | 46,600 | | 1,971,180 |
POSCO | 11,061 | | 1,776,050 |
Steel Dynamics, Inc. | 26,400 | | 487,608 |
SunCoke Energy Partners LP | 49,700 | | 525,826 |
Thyssenkrupp AG | 63,200 | | 1,274,939 |
| | 11,327,138 |
TOTAL METALS & MINING | | 59,852,715 |
MULTI-UTILITIES - 0.3% |
Multi-Utilities - 0.3% |
E.ON AG | 66,804 | | 704,726 |
OIL, GAS & CONSUMABLE FUELS - 28.2% |
Coal & Consumable Fuels - 0.3% |
Cameco Corp. | 35,600 | | 504,215 |
Coal India Ltd. | 55,487 | | 270,828 |
| | 775,043 |
Integrated Oil & Gas - 13.2% |
BG Group PLC | 28,800 | | 454,998 |
BP PLC | 798,500 | | 4,745,480 |
Chevron Corp. | 96,000 | | 8,724,480 |
China Petroleum & Chemical Corp. (H Shares) | 682,000 | | 491,616 |
Exxon Mobil Corp. | 5,700 | | 471,618 |
Lukoil PJSC sponsored ADR | 29,900 | | 1,085,370 |
Occidental Petroleum Corp. | 6,600 | | 491,964 |
Royal Dutch Shell PLC Class A (United Kingdom) | 172,300 | | 4,498,301 |
Statoil ASA | 67,100 | | 1,084,623 |
Common Stocks - continued |
| Shares | | Value |
OIL, GAS & CONSUMABLE FUELS - CONTINUED |
Integrated Oil & Gas - continued |
Suncor Energy, Inc. | 101,632 | | $ 3,024,244 |
Total SA | 104,400 | | 5,048,663 |
YPF SA Class D sponsored ADR | 24,700 | | 527,592 |
| | 30,648,949 |
Oil & Gas Exploration & Production - 14.5% |
Anadarko Petroleum Corp. | 51,200 | | 3,424,256 |
Apache Corp. | 33,300 | | 1,569,429 |
Cabot Oil & Gas Corp. | 78,700 | | 1,708,577 |
California Resources Corp. | 160,200 | | 647,208 |
Canadian Natural Resources Ltd. | 53,000 | | 1,228,939 |
Cimarex Energy Co. | 4,400 | | 519,464 |
CNOOC Ltd. sponsored ADR | 14,900 | | 1,693,832 |
Cobalt International Energy, Inc. (a) | 136,100 | | 1,043,887 |
ConocoPhillips Co. | 64,200 | | 3,425,070 |
Continental Resources, Inc. (a) | 30,300 | | 1,027,473 |
Devon Energy Corp. | 43,600 | | 1,828,148 |
Encana Corp. | 111,400 | | 847,683 |
EOG Resources, Inc. | 32,600 | | 2,798,710 |
EQT Corp. | 23,400 | | 1,546,038 |
Hess Corp. | 10,200 | | 573,342 |
Marathon Oil Corp. | 58,100 | | 1,067,878 |
Memorial Resource Development Corp. (a) | 32,700 | | 578,463 |
Newfield Exploration Co. (a) | 12,400 | | 498,356 |
Noble Energy, Inc. | 47,300 | | 1,695,232 |
NOVATEK OAO GDR (Reg. S) | 8,200 | | 749,890 |
PDC Energy, Inc. (a) | 13,100 | | 790,454 |
Pioneer Natural Resources Co. | 3,610 | | 495,075 |
SM Energy Co. | 25,100 | | 837,085 |
Southwestern Energy Co. (a) | 161,700 | | 1,785,168 |
Tullow Oil PLC | 183,800 | | 574,909 |
Whiting Petroleum Corp. (a) | 27,300 | | 470,379 |
| | 33,424,945 |
Oil & Gas Storage & Transport - 0.2% |
Golar LNG Ltd. | 13,269 | | 384,934 |
TOTAL OIL, GAS & CONSUMABLE FUELS | | 65,233,871 |
PAPER & FOREST PRODUCTS - 4.2% |
Forest Products - 0.3% |
West Fraser Timber Co. Ltd. | 20,000 | | 707,709 |
Common Stocks - continued |
| Shares | | Value |
PAPER & FOREST PRODUCTS - CONTINUED |
Paper Products - 3.9% |
Fibria Celulose SA | 35,300 | | $ 481,828 |
International Paper Co. | 112,300 | | 4,794,087 |
Mondi PLC | 98,900 | | 2,293,062 |
Stora Enso Oyj (R Shares) | 57,700 | | 535,834 |
UPM-Kymmene Corp. | 44,800 | | 839,957 |
| | 8,944,768 |
TOTAL PAPER & FOREST PRODUCTS | | 9,652,477 |
REAL ESTATE INVESTMENT TRUSTS - 0.6% |
Specialized REITs - 0.6% |
Potlatch Corp. | 15,500 | | 484,220 |
Weyerhaeuser Co. | 32,400 | | 950,292 |
| | 1,434,512 |
TRADING COMPANIES & DISTRIBUTORS - 0.3% |
Trading Companies & Distributors - 0.3% |
Daewoo International Corp. | 35,906 | | 627,381 |
TOTAL COMMON STOCKS (Cost $346,268,311) |
228,973,534
|
Nonconvertible Preferred Stocks - 0.8% |
| | | |
AEROSPACE & DEFENSE - 0.0% |
Aerospace & Defense - 0.0% |
Rolls-Royce Group PLC | 6,294,330 | | 9,703 |
METALS & MINING - 0.6% |
Steel - 0.6% |
Vale SA (PN-A) sponsored ADR (d) | 399,000 | | 1,436,400 |
OIL, GAS & CONSUMABLE FUELS - 0.2% |
Integrated Oil & Gas - 0.2% |
Petroleo Brasileiro SA - Petrobras (PN) sponsored (non-vtg.) (a) | 123,600 | | 493,164 |
TOTAL NONCONVERTIBLE PREFERRED STOCKS (Cost $6,568,135) |
1,939,267
|
Money Market Funds - 1.3% |
| Shares | | Value |
Fidelity Securities Lending Cash Central Fund, 0.19% (b)(c)
(Cost $2,883,740) | 2,883,740 | | $ 2,883,740 |
TOTAL INVESTMENT PORTFOLIO - 101.2% (Cost $355,720,186) | | 233,796,541 |
NET OTHER ASSETS (LIABILITIES) - (1.2)% | | (2,771,389) |
NET ASSETS - 100% | $ 231,025,152 |
Legend |
(a) Non-income producing |
(b) Affiliated fund that is generally available only to investment companies and other accounts managed by Fidelity Investments. The rate quoted is the annualized seven-day yield of the fund at period end. A complete unaudited listing of the fund's holdings as of its most recent quarter end is available upon request. In addition, each Fidelity Central Fund's financial statements, which are not covered by the Fund's Report of Independent Registered Public Accounting Firm, are available on the SEC's website or upon request. |
(c) Investment made with cash collateral received from securities on loan. |
(d) Security or a portion of the security is on loan at period end. |
(e) Security exempt from registration under Rule 144A of the Securities Act of 1933. These securities may be resold in transactions exempt from registration, normally to qualified institutional buyers. At the end of the period, the value of these securities amounted to $1,616 or 0.0% of net assets. |
Affiliated Central Funds |
Information regarding fiscal year to date income earned by the Fund from investments in Fidelity Central Funds is as follows: |
Fund | Income earned |
Fidelity Cash Central Fund | $ 807 |
Fidelity Securities Lending Cash Central Fund | 150,371 |
Total | $ 151,178 |
Other Information |
The following is a summary of the inputs used, as of October 31, 2015, involving the Fund's assets and liabilities carried at fair value. The inputs or methodology used for valuing securities may not be an indication of the risk associated with investing in those securities. For more information on valuation inputs, and their aggregation into the levels used in the table below, please refer to the Investment Valuation section in the accompanying Notes to Financial Statements. |
Valuation Inputs at Reporting Date: |
Description | Total | Level 1 | Level 2 | Level 3 |
Investments in Securities: | | | | |
Common Stocks | $ 228,973,534 | $ 168,537,249 | $ 60,434,669 | $ 1,616 |
Nonconvertible Preferred Stocks | 1,939,267 | 1,939,267 | - | - |
Money Market Funds | 2,883,740 | 2,883,740 | - | - |
Total Investments in Securities: | $ 233,796,541 | $ 173,360,256 | $ 60,434,669 | $ 1,616 |
Distribution of investments by country or territory of incorporation, as a percentage of total net assets, is as follows (Unaudited): |
United States of America | 42.3% |
Canada | 16.9% |
United Kingdom | 16.0% |
Switzerland | 3.7% |
France | 2.2% |
Bailiwick of Jersey | 1.8% |
Norway | 1.7% |
Chile | 1.4% |
Germany | 1.4% |
Korea (South) | 1.4% |
Japan | 1.3% |
Brazil | 1.2% |
Russia | 1.0% |
Others (Individually Less Than 1%) | 7.7% |
| 100.0% |
See accompanying notes which are an integral part of the financial statements.
Annual Report
Statement of Assets and Liabilities
| | October 31, 2015 |
| | |
Assets | | |
Investment in securities, at value (including securities loaned of $2,674,064) - See accompanying schedule: Unaffiliated issuers (cost $352,836,446) | $ 230,912,801 | |
Fidelity Central Funds (cost $2,883,740) | 2,883,740 | |
Total Investments (cost $355,720,186) | | $ 233,796,541 |
Receivable for investments sold | | 2,055,645 |
Receivable for fund shares sold | | 111,112 |
Dividends receivable | | 704,389 |
Distributions receivable from Fidelity Central Funds | | 17,059 |
Prepaid expenses | | 736 |
Other receivables | | 5,526 |
Total assets | | 236,691,008 |
| | |
Liabilities | | |
Payable to custodian bank | $ 583,137 | |
Payable for investments purchased | 1,672,596 | |
Payable for fund shares redeemed | 253,324 | |
Accrued management fee | 137,667 | |
Distribution and service plan fees payable | 19,720 | |
Other affiliated payables | 66,953 | |
Other payables and accrued expenses | 48,719 | |
Collateral on securities loaned, at value | 2,883,740 | |
Total liabilities | | 5,665,856 |
| | |
Net Assets | | $ 231,025,152 |
Net Assets consist of: | | |
Paid in capital | | $ 417,503,217 |
Undistributed net investment income | | 4,650,806 |
Accumulated undistributed net realized gain (loss) on investments and foreign currency transactions | | (69,179,434) |
Net unrealized appreciation (depreciation) on investments and assets and liabilities in foreign currencies | | (121,949,437) |
Net Assets | | $ 231,025,152 |
See accompanying notes which are an integral part of the financial statements.
Annual Report
Financial Statements - continued
Statement of Assets and Liabilities - continued
| | October 31, 2015 |
| | |
Calculation of Maximum Offering Price | | |
Class A:
Net Asset Value and redemption price per share ($31,391,241 ÷ 3,123,473 shares) | | $ 10.05 |
| | |
Maximum offering price per share (100/94.25 of $10.05) | | $ 10.66 |
Class T:
Net Asset Value and redemption price per share ($6,335,000 ÷ 632,077 shares) | | $ 10.02 |
| | |
Maximum offering price per share (100/96.50 of $10.02) | | $ 10.38 |
Class B:
Net Asset Value and offering price per share ($864,320 ÷ 86,721 shares)A | | $ 9.97 |
| | |
Class C:
Net Asset Value and offering price per share ($11,273,614 ÷ 1,136,673 shares)A | | $ 9.92 |
| | |
Global Commodity Stock:
Net Asset Value, offering price and redemption price per share ($156,319,517 ÷ 15,497,777 shares) | | $ 10.09 |
| | |
Class I:
Net Asset Value, offering price and redemption price per share ($24,841,460 ÷ 2,462,815 shares) | | $ 10.09 |
A Redemption price per share is equal to net asset value less any applicable contingent deferred sales charge.
See accompanying notes which are an integral part of the financial statements.
Annual Report
Statement of Operations
| Year ended October 31, 2015 |
| | |
Investment Income | | |
Dividends | | $ 9,373,059 |
Income from Fidelity Central Funds | | 151,178 |
Income before foreign taxes withheld | | 9,524,237 |
Less foreign taxes withheld | | (486,789) |
Total income | | 9,037,448 |
| | |
Expenses | | |
Management fee | $ 1,985,858 | |
Transfer agent fees | 823,072 | |
Distribution and service plan fees | 302,688 | |
Accounting and security lending fees | 149,834 | |
Custodian fees and expenses | 54,429 | |
Independent trustees' compensation | 1,243 | |
Registration fees | 84,599 | |
Audit | 53,551 | |
Legal | 751 | |
Miscellaneous | 1,739 | |
Total expenses before reductions | 3,457,764 | |
Expense reductions | (21,513) | 3,436,251 |
Net investment income (loss) | | 5,601,197 |
Realized and Unrealized Gain (Loss) | | |
Net realized gain (loss) on: | | |
Investment securities: | | |
Unaffiliated issuers | (22,678,481) | |
Foreign currency transactions | (62,976) | |
Total net realized gain (loss) | | (22,741,457) |
Change in net unrealized appreciation (depreciation) on: Investment securities | (54,121,042) | |
Assets and liabilities in foreign currencies | (8,151) | |
Total change in net unrealized appreciation (depreciation) | | (54,129,193) |
Net gain (loss) | | (76,870,650) |
Net increase (decrease) in net assets resulting from operations | | $ (71,269,453) |
See accompanying notes which are an integral part of the financial statements.
Annual Report
Financial Statements - continued
Statement of Changes in Net Assets
| Year ended
October 31,
2015 | Year ended
October 31,
2014 |
Increase (Decrease) in Net Assets | | |
Operations | | |
Net investment income (loss) | $ 5,601,197 | $ 4,495,175 |
Net realized gain (loss) | (22,741,457) | (3,681,278) |
Change in net unrealized appreciation (depreciation) | (54,129,193) | (18,645,040) |
Net increase (decrease) in net assets resulting from operations | (71,269,453) | (17,831,143) |
Distributions to shareholders from net investment income | (3,898,874) | (4,765,250) |
Distributions to shareholders from net realized gain | (629,272) | (367,709) |
Total distributions | (4,528,146) | (5,132,959) |
Share transactions - net increase (decrease) | (20,805,112) | (64,489,864) |
Redemption fees | 7,987 | 7,328 |
Total increase (decrease) in net assets | (96,594,724) | (87,446,638) |
| | |
Net Assets | | |
Beginning of period | 327,619,876 | 415,066,514 |
End of period (including undistributed net investment income of $4,650,806 and undistributed net investment income of $3,567,856, respectively) | $ 231,025,152 | $ 327,619,876 |
See accompanying notes which are an integral part of the financial statements.
Annual Report
Financial Highlights - Fidelity Global Commodity Stock Fund Class A
Years ended October 31, | 2015 | 2014 | 2013 | 2012 | 2011 |
Selected Per-Share Data | | | | | |
Net asset value, beginning of period | $ 13.25 | $ 14.17 | $ 14.59 | $ 15.14 | $ 15.60 |
Income from Investment Operations | | | | | |
Net investment income (loss) C | .22 | .15 | .16 | .11 | .12 |
Net realized and unrealized gain (loss) | (3.25) | (.91) | (.45) | (.59) | (.38) |
Total from investment operations | (3.03) | (.76) | (.29) | (.48) | (.26) |
Distributions from net investment income | (.14) | (.15) | (.13) | (.05) | (.13) |
Distributions from net realized gain | (.03) | (.01) | - | (.01) | (.06) |
Total distributions | (.17) | (.16) | (.13) | (.07) H | (.20) I |
Redemption fees added to paid in capitalC,G | - | - | - | - | - |
Net asset value, end of period | $ 10.05 | $ 13.25 | $ 14.17 | $ 14.59 | $ 15.14 |
Total ReturnA, B | (23.16)% | (5.41)% | (2.00)% | (3.19)% | (1.80)% |
Ratios to Average Net AssetsD, F | | | | | |
Expenses before reductions | 1.34% | 1.35% | 1.36% | 1.34% | 1.32% |
Expenses net of fee waivers, if any | 1.34% | 1.35% | 1.35% | 1.34% | 1.32% |
Expenses net of all reductions | 1.34% | 1.35% | 1.34% | 1.33% | 1.31% |
Net investment income (loss) | 1.85% | 1.05% | 1.12% | .80% | .71% |
Supplemental Data | | | | | |
Net assets, end of period (000 omitted) | $ 31,391 | $ 51,586 | $ 71,293 | $ 99,694 | $ 127,979 |
Portfolio turnover rateE | 77% | 75% | 65% | 91% | 71% |
A Total returns would have been lower if certain expenses had not been reduced during the applicable periods shown.
B Total returns do not include the effect of the sales charges.
C Calculated based on average shares outstanding during the period.
D Fees and expenses of any underlying Fidelity Central Funds are not included in the Fund's expense ratio. The Fund indirectly bears its proportionate share of the expenses of any underlying Fidelity Central Funds.
E Amount does not include the portfolio activity of any underlying Fidelity Central Funds.
F Expense ratios reflect operating expenses of the class. Expenses before reductions do not reflect amounts reimbursed by the investment adviser or reductions from brokerage service arrangements or reductions from other expense offset arrangements and do not represent the amount paid by the class during periods when reimbursements or reductions occur. Expenses net of fee waivers reflect expenses after reimbursement by the investment adviser but prior to reductions from brokerage service arrangements or other expense offset arrangements. Expenses net of all reductions represent the net expenses paid by the class.
G Amount represents less than $.005 per share.
H Total distributions of $.07 per share is comprised of distributions from net investment income of $.052 and distributions from net realized gain of $.014 per share.
I Total distributions of $.20 per share is comprised of distributions from net investment income of $.133 and distributions from net realized gain of $.062 per share.
See accompanying notes which are an integral part of the financial statements.
Annual Report
Financial Highlights - Fidelity Global Commodity Stock Fund Class T
Years ended October 31, | 2015 | 2014 | 2013 | 2012 | 2011 |
Selected Per-Share Data | | | | | |
Net asset value, beginning of period | $ 13.21 | $ 14.13 | $ 14.54 | $ 15.08 | $ 15.55 |
Income from Investment Operations | | | | | |
Net investment income (loss) C | .19 | .11 | .12 | .08 | .07 |
Net realized and unrealized gain (loss) | (3.25) | (.90) | (.45) | (.60) | (.38) |
Total from investment operations | (3.06) | (.79) | (.33) | (.52) | (.31) |
Distributions from net investment income | (.10) | (.11) | (.08) | (.01) | (.10) |
Distributions from net realized gain | (.03) | (.01) | - | (.01) | (.06) |
Total distributions | (.13) | (.13) H | (.08) | (.02) | (.16) |
Redemption fees added to paid in capitalC,G | - | - | - | - | - |
Net asset value, end of period | $ 10.02 | $ 13.21 | $ 14.13 | $ 14.54 | $ 15.08 |
Total ReturnA, B | (23.40)% | (5.65)% | (2.26)% | (3.43)% | (2.09)% |
Ratios to Average Net AssetsD, F | | | | | |
Expenses before reductions | 1.63% | 1.62% | 1.62% | 1.61% | 1.60% |
Expenses net of fee waivers, if any | 1.63% | 1.62% | 1.61% | 1.61% | 1.60% |
Expenses net of all reductions | 1.62% | 1.62% | 1.60% | 1.60% | 1.59% |
Net investment income (loss) | 1.57% | .78% | .86% | .53% | .43% |
Supplemental Data | | | | | |
Net assets, end of period (000 omitted) | $ 6,335 | $ 9,867 | $ 12,551 | $ 16,692 | $ 20,831 |
Portfolio turnover rateE | 77% | 75% | 65% | 91% | 71% |
A Total returns would have been lower if certain expenses had not been reduced during the applicable periods shown.
B Total returns do not include the effect of the sales charges.
C Calculated based on average shares outstanding during the period.
D Fees and expenses of any underlying Fidelity Central Funds are not included in the Fund's expense ratio. The Fund indirectly bears its proportionate share of the expenses of any underlying Fidelity Central Funds.
E Amount does not include the portfolio activity of any underlying Fidelity Central Funds.
F Expense ratios reflect operating expenses of the class. Expenses before reductions do not reflect amounts reimbursed by the investment adviser or reductions from brokerage service arrangements or reductions from other expense offset arrangements and do not represent the amount paid by the class during periods when reimbursements or reductions occur. Expenses net of fee waivers reflect expenses after reimbursement by the investment adviser but prior to reductions from brokerage service arrangements or other expense offset arrangements. Expenses net of all reductions represent the net expenses paid by the class.
G Amount represents less than $.005 per share.
H Total distributions of $.13 per share is comprised of distributions from net investment income of $.113 and distributions from net realized gain of $.013 per share.
See accompanying notes which are an integral part of the financial statements.
Annual Report
Financial Highlights - Fidelity Global Commodity Stock Fund Class B
Years ended October 31, | 2015 | 2014 | 2013 | 2012 | 2011 |
Selected Per-Share Data | | | | | |
Net asset value, beginning of period | $ 13.12 | $ 14.01 | $ 14.41 | $ 15.00 | $ 15.46 |
Income from Investment Operations | | | | | |
Net investment income (loss) C | .13 | .04 | .05 | - G | (.01) |
Net realized and unrealized gain (loss) | (3.24) | (.89) | (.45) | (.59) | (.39) |
Total from investment operations | (3.11) | (.85) | (.40) | (.59) | (.40) |
Distributions from net investment income | (.02) | (.03) | - G | - | - |
Distributions from net realized gain | (.03) | (.01) | - | - | (.06) |
Total distributions | (.04) H | (.04) | - G | - | (.06) |
Redemption fees added to paid in capitalC, G | - | - | - | - | - |
Net asset value, end of period | $ 9.97 | $ 13.12 | $ 14.01 | $ 14.41 | $ 15.00 |
Total ReturnA, B | (23.76)% | (6.06)% | (2.75)% | (3.93)% | (2.62)% |
Ratios to Average Net AssetsD, F | | | | | |
Expenses before reductions | 2.13% | 2.11% | 2.11% | 2.10% | 2.11% |
Expenses net of fee waivers, if any | 2.12% | 2.11% | 2.11% | 2.10% | 2.11% |
Expenses net of all reductions | 2.12% | 2.11% | 2.10% | 2.10% | 2.10% |
Net investment income (loss) | 1.07% | .29% | .36% | .03% | (.09)% |
Supplemental Data | | | | | |
Net assets, end of period (000 omitted) | $ 864 | $ 1,584 | $ 2,303 | $ 3,097 | $ 4,324 |
Portfolio turnover rateE | 77% | 75% | 65% | 91% | 71% |
A Total returns would have been lower if certain expenses had not been reduced during the applicable periods shown.
B Total returns do not include the effect of the contingent deferred sales charge.
C Calculated based on average shares outstanding during the period.
D Fees and expenses of any underlying Fidelity Central Funds are not included in the Fund's expense ratio. The Fund indirectly bears its proportionate share of the expenses of any underlying Fidelity Central Funds.
E Amount does not include the portfolio activity of any underlying Fidelity Central Funds.
F Expense ratios reflect operating expenses of the class. Expenses before reductions do not reflect amounts reimbursed by the investment adviser or reductions from brokerage service arrangements or reductions from other expense offset arrangements and do not represent the amount paid by the class during periods when reimbursements or reductions occur. Expenses net of fee waivers reflect expenses after reimbursement by the investment adviser but prior to reductions from brokerage service arrangements or other expense offset arrangements. Expenses net of all reductions represent the net expenses paid by the class.
G Amount represents less than $.005 per share.
H Total distributions of $.04 per share is comprised of distributions from net investment income of $.016 and distributions from net realized gain of $.026 per share.
See accompanying notes which are an integral part of the financial statements.
Annual Report
Financial Highlights - Fidelity Global Commodity Stock Fund Class C
Years ended October 31, | 2015 | 2014 | 2013 | 2012 | 2011 |
Selected Per-Share Data | | | | | |
Net asset value, beginning of period | $ 13.06 | $ 13.96 | $ 14.37 | $ 14.95 | $ 15.45 |
Income from Investment Operations | | | | | |
Net investment income (loss) C | .13 | .04 | .05 | .01 | (.01) |
Net realized and unrealized gain (loss) | (3.22) | (.89) | (.44) | (.59) | (.38) |
Total from investment operations | (3.09) | (.85) | (.39) | (.58) | (.39) |
Distributions from net investment income | (.03) | (.03) | (.02) | - | (.05) |
Distributions from net realized gain | (.03) | (.01) | - | - | (.06) |
Total distributions | (.05) I | (.05) H | (.02) | - | (.11) |
Redemption fees added to paid in capitalC,G | - | - | - | - | - |
Net asset value, end of period | $ 9.92 | $ 13.06 | $ 13.96 | $ 14.37 | $ 14.95 |
Total ReturnA, B | (23.74)% | (6.13)% | (2.75)% | (3.88)% | (2.58)% |
Ratios to Average Net AssetsD, F | | | | | |
Expenses before reductions | 2.12% | 2.11% | 2.11% | 2.10% | 2.09% |
Expenses net of fee waivers, if any | 2.12% | 2.11% | 2.11% | 2.10% | 2.09% |
Expenses net of all reductions | 2.11% | 2.11% | 2.10% | 2.09% | 2.08% |
Net investment income (loss) | 1.08% | .29% | .36% | .03% | (.07)% |
Supplemental Data | | | | | |
Net assets, end of period (000 omitted) | $ 11,274 | $ 17,659 | $ 23,830 | $ 31,865 | $ 37,185 |
Portfolio turnover rateE | 77% | 75% | 65% | 91% | 71% |
A Total returns would have been lower if certain expenses had not been reduced during the applicable periods shown.
B Total returns do not include the effect of the contingent deferred sales charge.
C Calculated based on average shares outstanding during the period.
D Fees and expenses of any underlying Fidelity Central Funds are not included in the Fund's expense ratio. The Fund indirectly bears its proportionate share of the expenses of any underlying Fidelity Central Funds.
E Amount does not include the portfolio activity of any underlying Fidelity Central Funds.
F Expense ratios reflect operating expenses of the class. Expenses before reductions do not reflect amounts reimbursed by the investment adviser or reductions from brokerage service arrangements or reductions from other expense offset arrangements and do not represent the amount paid by the class during periods when reimbursements or reductions occur. Expenses net of fee waivers reflect expenses after reimbursement by the investment adviser but prior to reductions from brokerage service arrangements or other expense offset arrangements. Expenses net of all reductions represent the net expenses paid by the class.
G Amount represents less than $.005 per share.
H Total distributions of $.05 per share is comprised of distributions from net investment income of $.033 and distributions from net realized gain of $.013 per share.
I Total distributions of $.05 per share is comprised of distributions from net investment income of $.025 and distributions from net realized gain of $.026 per share.
See accompanying notes which are an integral part of the financial statements.
Annual Report
Financial Highlights - Fidelity Global Commodity Stock Fund
Years ended October 31, | 2015 | 2014 | 2013 | 2012 | 2011 |
Selected Per-Share Data | | | | | |
Net asset value, beginning of period | $ 13.31 | $ 14.24 | $ 14.66 | $ 15.21 | $ 15.66 |
Income from Investment Operations | | | | | |
Net investment income (loss) B | .25 | .19 | .19 | .15 | .16 |
Net realized and unrealized gain (loss) | (3.27) | (.92) | (.45) | (.60) | (.39) |
Total from investment operations | (3.02) | (.73) | (.26) | (.45) | (.23) |
Distributions from net investment income | (.18) | (.19) | (.16) | (.08) | (.16) |
Distributions from net realized gain | (.03) | (.01) | - | (.01) | (.06) |
Total distributions | (.20) H | (.20) | (.16) | (.10) G | (.22) |
Redemption fees added to paid in capitalB,F | - | - | - | - | - |
Net asset value, end of period | $ 10.09 | $ 13.31 | $ 14.24 | $ 14.66 | $ 15.21 |
Total ReturnA | (22.97)% | (5.16)% | (1.75)% | (2.96)% | (1.59)% |
Ratios to Average Net AssetsC, E | | | | | |
Expenses before reductions | 1.12% | 1.11% | 1.11% | 1.10% | 1.08% |
Expenses net of fee waivers, if any | 1.12% | 1.11% | 1.11% | 1.10% | 1.08% |
Expenses net of all reductions | 1.11% | 1.11% | 1.09% | 1.09% | 1.07% |
Net investment income (loss) | 2.08% | 1.29% | 1.37% | 1.04% | .95% |
Supplemental Data | | | | | |
Net assets, end of period (000 omitted) | $ 156,320 | $ 223,084 | $ 273,476 | $ 387,242 | $ 531,224 |
Portfolio turnover rateD | 77% | 75% | 65% | 91% | 71% |
A Total returns would have been lower if certain expenses had not been reduced during the applicable periods shown.
B Calculated based on average shares outstanding during the period.
C Fees and expenses of any underlying Fidelity Central Funds are not included in the Fund's expense ratio. The Fund indirectly bears its proportionate share of the expenses of any underlying Fidelity Central Funds.
D Amount does not include the portfolio activity of any underlying Fidelity Central Funds.
E Expense ratios reflect operating expenses of the class. Expenses before reductions do not reflect amounts reimbursed by the investment adviser or reductions from brokerage service arrangements or reductions from other expense offset arrangements and do not represent the amount paid by the class during periods when reimbursements or reductions occur. Expenses net of fee waivers reflect expenses after reimbursement by the investment adviser but prior to reductions from brokerage service arrangements or other expense offset arrangements. Expenses net of all reductions represent the net expenses paid by the class.
F Amount represents less than $.005 per share.
G Total distributions of $.10 per share is comprised of distributions from net investment income of $.084 and distributions from net realized gain of $.014 per share.
H Total distributions of $.20 per share is comprised of distributions from net investment income of $.178 and distributions from net realized gain of $.026 per share.
See accompanying notes which are an integral part of the financial statements.
Annual Report
Financial Highlights - Fidelity Global Commodity Stock Fund Class I
Years ended October 31, | 2015 | 2014 | 2013 | 2012 | 2011 |
Selected Per-Share Data | | | | | |
Net asset value, beginning of period | $ 13.31 | $ 14.24 | $ 14.67 | $ 15.22 | $ 15.66 |
Income from Investment Operations | | | | | |
Net investment income (loss) B | .25 | .19 | .20 | .16 | .16 |
Net realized and unrealized gain (loss) | (3.26) | (.92) | (.45) | (.60) | (.38) |
Total from investment operations | (3.01) | (.73) | (.25) | (.44) | (.22) |
Distributions from net investment income | (.19) | (.19) | (.18) | (.09) | (.16) |
Distributions from net realized gain | (.03) | (.01) | - | (.01) | (.06) |
Total distributions | (.21) H | (.20) | (.18) | (.11) G | (.22) |
Redemption fees added to paid in capitalB,F | - | - | - | - | - |
Net asset value, end of period | $ 10.09 | $ 13.31 | $ 14.24 | $ 14.67 | $ 15.22 |
Total ReturnA | (22.93)% | (5.16)% | (1.71)% | (2.90)% | (1.50)% |
Ratios to Average Net AssetsC, E | | | | | |
Expenses before reductions | 1.09% | 1.06% | 1.04% | 1.04% | 1.03% |
Expenses net of fee waivers, if any | 1.08% | 1.06% | 1.04% | 1.04% | 1.03% |
Expenses net of all reductions | 1.08% | 1.06% | 1.03% | 1.03% | 1.03% |
Net investment income (loss) | 2.11% | 1.34% | 1.43% | 1.10% | .99% |
Supplemental Data | | | | | |
Net assets, end of period (000 omitted) | $ 24,841 | $ 23,840 | $ 31,613 | $ 50,540 | $ 58,925 |
Portfolio turnover rateD | 77% | 75% | 65% | 91% | 71% |
A Total returns would have been lower if certain expenses had not been reduced during the applicable periods shown.
B Calculated based on average shares outstanding during the period.
C Fees and expenses of any underlying Fidelity Central Funds are not included in the Fund's expense ratio. The Fund indirectly bears its proportionate share of the expenses of any underlying Fidelity Central Funds.
D Amount does not include the portfolio activity of any underlying Fidelity Central Funds.
E Expense ratios reflect operating expenses of the class. Expenses before reductions do not reflect amounts reimbursed by the investment adviser or reductions from brokerage service arrangements or reductions from other expense offset arrangements and do not represent the amount paid by the class during periods when reimbursements or reductions occur. Expenses net of fee waivers reflect expenses after reimbursement by the investment adviser but prior to reductions from brokerage service arrangements or other expense offset arrangements. Expenses net of all reductions represent the net expenses paid by the class.
F Amount represents less than $.005 per share.
G Total distributions of $.11 per share is comprised of distributions from net investment income of $.093 and distributions from net realized gain of $.014 per share.
H Total distributions of $.21 per share is comprised of distributions from net investment income of $.186 and distributions from net realized gain of $.026 per share.
See accompanying notes which are an integral part of the financial statements.
Annual Report
For the period ended October 31, 2015
1. Organization.
Fidelity Global Commodity Stock Fund (the Fund) is a non-diversified fund of Fidelity Investment Trust (the Trust) and is authorized to issue an unlimited number of shares. The Trust is registered under the Investment Company Act of 1940, as amended (the 1940 Act), as an open-end management investment company organized as a Massachusetts business trust. The Fund offers Class A, Class T, Class C, Global Commodity Stock and Class I shares (formerly Institutional Class), each of which, along with Class B shares, has equal rights as to assets and voting privileges. Class B shares are closed to new accounts and additional purchases, except for exchanges and reinvestments. Each class has exclusive voting rights with respect to matters that affect that class. Class B shares will automatically convert to Class A shares after a holding period of seven years from the initial date of purchase. The Fund's investments in emerging markets can be subject to social, economic, regulatory, and political uncertainties and can be extremely volatile.
2. Investments in Fidelity Central Funds.
The Fund invests in Fidelity Central Funds, which are open-end investment companies generally available only to other investment companies and accounts managed by the investment adviser and its affiliates. The Fund's Schedule of Investments lists each of the Fidelity Central Funds held as of period end, if any, as an investment of the Fund, but does not include the underlying holdings of each Fidelity Central Fund. As an Investing Fund, the Fund indirectly bears its proportionate share of the expenses of the underlying Fidelity Central Funds.
The Money Market Central Funds seek preservation of capital and current income and are managed by Fidelity Investments Money Management, Inc. (FIMM), an affiliate of the investment adviser. Annualized expenses of the Money Market Central Funds as of their most recent shareholder report date are less than .005%.
A complete unaudited list of holdings for each Fidelity Central Fund is available upon request or at the Securities and Exchange Commission (the SEC) website at www.sec.gov. In addition, the financial statements of the Fidelity Central Funds, which are not covered by the Fund's Report of Independent Registered Public Accounting Firm, are available on the SEC website or upon request.
3. Significant Accounting Policies.
The financial statements have been prepared in conformity with accounting principles generally accepted in the United States of America (GAAP), which require management to make certain estimates and assumptions at the date of the financial statements. Actual results could differ from those estimates. Subsequent events, if any, through the date that the financial statements were issued have been evaluated in the preparation of
Annual Report
3. Significant Accounting Policies - continued
the financial statements. The following summarizes the significant accounting policies of the Fund:
Investment Valuation. Investments are valued as of 4:00 p.m. Eastern time on the last calendar day of the period. The Board of Trustees (the Board) has delegated the day to day responsibility for the valuation of the Fund's investments to the Fidelity Management & Research Company (FMR) Fair Value Committee (the Committee). In accordance with valuation policies and procedures approved by the Board, the Fund attempts to obtain prices from one or more third party pricing vendors or brokers to value its investments. When current market prices, quotations or currency exchange rates are not readily available or reliable, investments will be fair valued in good faith by the Committee, in accordance with procedures adopted by the Board. Factors used in determining fair value vary by investment type and may include market or investment specific events. The frequency with which these procedures are used cannot be predicted and they may be utilized to a significant extent. The Committee oversees the Fund's valuation policies and procedures and reports to the Board on the Committee's activities and fair value determinations. The Board monitors the appropriateness of the procedures used in valuing the Fund's investments and ratifies the fair value determinations of the Committee.
The Fund categorizes the inputs to valuation techniques used to value its investments into a disclosure hierarchy consisting of three levels as shown below:
Level 1 - quoted prices in active markets for identical investments
Level 2 - other significant observable inputs (including quoted prices for similar investments, interest rates, prepayment speeds, etc.)
Level 3 - unobservable inputs (including the Fund's own assumptions based on the best information available)
Valuation techniques used to value the Fund's investments by major category are as follows:
Equity securities, including restricted securities, for which market quotations are readily available, are valued at the last reported sale price or official closing price as reported by a third party pricing vendor on the primary market or exchange on which they are traded and are categorized as Level 1 in the hierarchy. In the event there were no sales during the day or closing prices are not available, securities are valued at the last quoted bid price or may be valued using the last available price and are generally categorized as Level 2 in the hierarchy. For foreign equity securities, when market or security specific events arise, comparisons to the valuation of American Depositary Receipts (ADRs),
Annual Report
Notes to Financial Statements - continued
3. Significant Accounting Policies - continued
Investment Valuation - continued
futures contracts, Exchange-Traded Funds (ETFs) and certain indexes as well as quoted prices for similar securities may be used and would be categorized as Level 2 in the hierarchy. Utilizing these techniques may result in transfers between Level 1 and Level 2. For equity securities, including restricted securities, where observable inputs are limited, assumptions about market activity and risk are used and these securities may be categorized as Level 3 in the hierarchy.
Investments in open-end mutual funds, including the Fidelity Central Funds, are valued at their closing net asset value (NAV) each business day and are categorized as Level 1 in the hierarchy.
Foreign Currency. The Fund may use foreign currency contracts to facilitate transactions in foreign-denominated securities. Gains and losses from these transactions may arise from changes in the value of the foreign currency or if the counterparties do not perform under the contracts' terms.
Foreign-denominated assets, including investment securities, and liabilities are translated into U.S. dollars at the exchange rates at period end. Purchases and sales of investment securities, income and dividends received and expenses denominated in foreign currencies are translated into U.S. dollars at the exchange rate in effect on the transaction date.
The effects of exchange rate fluctuations on investments are included with the net realized and unrealized gain (loss) on investment securities. Other foreign currency transactions resulting in realized and unrealized gain (loss) are disclosed separately.
Investment Transactions and Income. For financial reporting purposes, the Fund's investment holdings and NAV include trades executed through the end of the last business day of the period. The NAV per share for processing shareholder transactions is calculated as of the close of business of the New York Stock Exchange (NYSE), normally 4:00 p.m. Eastern time and includes trades executed through the end of the prior business day. Gains and losses on securities sold are determined on the basis of identified cost and may include proceeds received from litigation. Dividend income is recorded on the ex-dividend date, except for certain dividends from foreign securities where the ex-dividend date may have passed, which are recorded as soon as the Fund is informed of the ex-dividend date. Non-cash dividends included in dividend income, if any, are recorded at the fair market value of the securities received. Income and capital gain distributions from Fidelity Central Funds, if any, are recorded on the ex-dividend date. Distributions received on securities that represent a return of capital or capital gain are recorded as a reduction of cost of investments and/or as a realized gain. Subsequent to ex-dividend date the Fund determines the components of these distributions, based
Annual Report
3. Significant Accounting Policies - continued
Investment Transactions and Income - continued
upon receipt of tax filings or other correspondence relating to the underlying investment. Interest income is accrued as earned and includes coupon interest and amortization of premium and accretion of discount on debt securities as applicable. Investment income is recorded net of foreign taxes withheld where recovery of such taxes is uncertain.
Class Allocations and Expenses. Investment income, realized and unrealized capital gains and losses, common expenses of the Fund, and certain fund-level expense reductions, if any, are allocated daily on a pro-rata basis to each class based on the relative net assets of each class to the total net assets of the Fund. Each class differs with respect to transfer agent and distribution and service plan fees incurred. Certain expense reductions may also differ by class. For the reporting period, the allocated portion of income and expenses to each class as a percent of its average net assets may vary due to the timing of recording these transactions in relation to fluctuating net assets of the classes. Expenses directly attributable to a fund are charged to that fund. Expenses attributable to more than one fund are allocated among the respective funds on the basis of relative net assets or other appropriate methods. Expense estimates are accrued in the period to which they relate and adjustments are made when actual amounts are known.
Income Tax Information and Distributions to Shareholders. Each year, the Fund intends to qualify as a regulated investment company under Subchapter M of the Internal Revenue Code, including distributing substantially all of its taxable income and realized gains. As a result, no provision for U.S. Federal income taxes is required. As of October 31, 2015, the Fund did not have any unrecognized tax benefits in the financial statements; nor is the Fund aware of any tax positions for which it is reasonably possible that the total amounts of unrecognized tax benefits will significantly change in the next twelve months. The Fund files a U.S. federal tax return, in addition to state and local tax returns as required. The Fund's federal income tax returns are subject to examination by the Internal Revenue Service (IRS) for a period of three fiscal years after they are filed. State and local tax returns may be subject to examination for an additional fiscal year depending on the jurisdiction. Foreign taxes are provided for based on the Fund's understanding of the tax rules and rates that exist in the foreign markets in which it invests.
Distributions are declared and recorded on the ex-dividend date. Income dividends and capital gain distributions are declared separately for each class. Income and capital gain distributions are determined in accordance with income tax regulations, which may differ from GAAP. In addition, the Fund claimed a portion of the payment made to redeeming shareholders as a distribution for income tax purposes.
Capital accounts within the financial statements are adjusted for permanent book-tax differences. These adjustments have no impact on net assets or the results of operations.
Annual Report
Notes to Financial Statements - continued
3. Significant Accounting Policies - continued
Income Tax Information and Distributions to Shareholders - continued
Capital accounts are not adjusted for temporary book-tax differences which will reverse in a subsequent period.
Book-tax differences are primarily due to foreign currency transactions, passive foreign investment companies (PFIC), partnerships, capital loss carryforwards and losses deferred due to wash sales.
The federal tax cost of investment securities and unrealized appreciation (depreciation) as of period end were as follows:
Gross unrealized appreciation | $ 1,558,121 |
Gross unrealized depreciation | (128,064,703) |
Net unrealized appreciation (depreciation) on securities | $ (126,506,582) |
Tax Cost | $ 360,303,123 |
The tax-based components of distributable earnings as of period end were as follows:
Undistributed ordinary income | $ 4,827,284 |
Capital loss carryforward | $ (64,772,918) |
Net unrealized appreciation (depreciation) on securities and other investments | $ (126,532,429) |
Capital loss carryforwards are only available to offset future capital gains of the Fund to the extent provided by regulations and may be limited. Under the Regulated Investment Company Modernization Act of 2010 (the Act), the Fund is permitted to carry forward capital losses incurred in taxable years beginning after December 22, 2010 for an unlimited period and such capital losses are required to be used prior to any losses that expire. The capital loss carryforward information presented below, including any applicable limitation, is estimated as of prior fiscal period end and is subject to adjustment.
Fiscal year of expiration 2019 | $ (6,952,413) |
No expiration | |
Short-term | (17,522,131) |
Long-term | (40,298,374) |
Total no expiration | (57,820,505) |
Total capital loss carryforward | $ (64,772,918) |
Annual Report
3. Significant Accounting Policies - continued
Income Tax Information and Distributions to Shareholders - continued
The tax character of distributions paid was as follows:
| October 31, 2015 | October 31, 2014 |
Ordinary Income | $ 4,528,146 | $ 5,132,959 |
Short-Term Trading (Redemption) Fees. Shares held by investors in the Fund less than 30 days may have been subject to a redemption fee equal to 1.00% of the NAV of shares redeemed. All redemption fees, which reduce the proceeds of the shareholder redemption, are retained by the Fund and accounted for as an addition to paid in capital.
Restricted Securities. The Fund may invest in securities that are subject to legal or contractual restrictions on resale. These securities generally may be resold in transactions exempt from registration or to the public if the securities are registered. Disposal of these securities may involve time-consuming negotiations and expense, and prompt sale at an acceptable price may be difficult. Information regarding restricted securities is included at the end of the Fund's Schedule of Investments.
4. Purchases and Sales of Investments.
Purchases and sales of securities, other than short-term securities, aggregated $217,511,154 and $235,143,180, respectively.
5. Fees and Other Transactions with Affiliates.
Management Fee. Fidelity Management & Research Company (the investment adviser) and its affiliates provide the Fund with investment management related services for which the Fund pays a monthly management fee. The management fee is the sum of an individual fund fee rate that is based on an annual rate of .45% of the Fund's average net assets and an annualized group fee rate that averaged .25% during the period. The group fee rate is based upon the average net assets of all the mutual funds advised by the investment adviser, including any mutual funds previously advised by the investment adviser that are currently advised by Fidelity SelectCo, LLC, an affiliate of the investment adviser. The group fee rate decreases as assets under management increase and increases as assets under management decrease. For the reporting period, the total annual management fee rate was .70% of the Fund's average net assets.
Distribution and Service Plan Fees. In accordance with Rule 12b-1 of the 1940 Act, the Fund has adopted separate Distribution and Service Plans for each class of shares. Certain classes pay Fidelity Distributors Corporation (FDC), an affiliate of the investment adviser, separate Distribution and Service Fees, each of which is based on an
Annual Report
Notes to Financial Statements - continued
5. Fees and Other Transactions with Affiliates - continued
Distribution and Service Plan Fees - continued
annual percentage of each class' average net assets. In addition, FDC may pay financial intermediaries for selling shares of the Fund and providing shareholder support services.
For the period, the Distribution and Service Fee rates, total fees and amounts retained by FDC were as follows:
| Distribution
Fee | Service
Fee | Total Fees | Retained
by FDC |
Class A | -% | .25% | $ 103,367 | $ 690 |
Class T | .25% | .25% | 42,080 | 4 |
Class B | .75% | .25% | 12,224 | 9,168 |
Class C | .75% | .25% | 145,017 | 16,745 |
| | | $ 302,688 | $ 26,607 |
Sales Load. FDC may receive a front-end sales charge of up to 5.75% for selling Class A shares and 3.50% for selling Class T shares, some of which is paid to financial intermediaries for selling shares of the Fund. Depending on the holding period, FDC may receive contingent deferred sales charges levied on Class A, Class T, Class B, and Class C redemptions. The deferred sales charges range from 5.00% to 1.00% for Class B shares, 1.00% for Class C shares, 1.00% for certain purchases of Class A shares and .25% for certain purchases of Class T shares.
For the period, sales charge amounts retained by FDC were as follows:
| Retained
by FDC |
Class A | $ 18,579 |
Class T | 1,858 |
Class BA | 2,196 |
Class C A | 2,768 |
| $ 25,401 |
A When Class B and Class C shares are initially sold, FDC pays commissions from its own resources to financial intermediaries through which the sales are made.
Transfer Agent Fees. Fidelity Investments Institutional Operations Company, Inc., (FIIOC), an affiliate of the investment adviser, is the transfer, dividend disbursing and shareholder servicing agent for each class of the Fund. FIIOC receives account fees and asset-based fees that vary according to the account size and type of account of the shareholders of the respective classes of the Fund. FIIOC pays for typesetting, printing and mailing of shareholder reports, except proxy statements.
Annual Report
5. Fees and Other Transactions with Affiliates - continued
Transfer Agent Fees - continued
For the period, transfer agent fees for each class were as follows:
| Amount | % of
Class-Level Average
Net Assets |
Class A | $ 111,180 | .27 |
Class T | 25,675 | .31 |
Class B | 3,619 | .30 |
Class C | 41,951 | .29 |
Global Commodity Stock | 576,631 | .30 |
Class I | 64,016 | .26 |
| $ 823,072 | |
Accounting and Security Lending Fees. Fidelity Service Company, Inc. (FSC), an affiliate of the investment adviser, maintains the Fund's accounting records. The accounting fee is based on the level of average net assets for each month. Under a separate contract, FSC administers the security lending program. The security lending fee is based on the number and duration of lending transactions.
Brokerage Commissions. The Fund placed a portion of its portfolio transactions with brokerage firms which are affiliates of the investment adviser. Brokerage commissions are included in net realized gain (loss) and change in net unrealized appreciation (depreciation) in the Statement of Operations. The commissions paid to these affiliated firms were $8,965 for the period.
6. Committed Line of Credit.
The Fund participates with other funds managed by the investment adviser or an affiliate in a $4.25 billion credit facility (the "line of credit") to be utilized for temporary or emergency purposes to fund shareholder redemptions or for other short-term liquidity purposes. The Fund has agreed to pay commitment fees on its pro-rata portion of the line of credit, which amounted to $424 and is reflected in Miscellaneous expenses on the Statement of Operations. During the period, the Fund did not borrow on this line of credit.
7. Security Lending.
The Fund lends portfolio securities through a lending agent from time to time in order to earn additional income. For equity securities, a lending agent is used and may loan securities to certain qualified borrowers, including Fidelity Capital Markets (FCM), a
Annual Report
Notes to Financial Statements - continued
7. Security Lending - continued
broker-dealer affiliated with the Fund. On the settlement date of the loan, the Fund receives collateral (in the form of U.S. Treasury obligations, letters of credit and/or cash) against the loaned securities and maintains collateral in an amount not less than 100% of the market value of the loaned securities during the period of the loan. The market value of the loaned securities is determined at the close of business of the Fund and any additional required collateral is delivered to the Fund on the next business day. The Fund or borrower may terminate the loan at any time, and if the borrower defaults on its obligation to return the securities loaned because of insolvency or other reasons, the Fund may apply collateral received from the borrower against the obligation. The Fund may experience delays and costs in recovering the securities loaned. Any cash collateral received is invested in the Fidelity Securities Lending Cash Central Fund. The value of loaned securities and cash collateral at period end are disclosed on the Fund's Statement of Assets and Liabilities. Security lending income represents the income earned on investing cash collateral, less rebates paid to borrowers and any lending agent fees associated with the loan, plus any premium payments received for lending certain types of securities. Security lending income is presented in the Statement of Operations as a component of income from Fidelity Central Funds. Total security lending income during the period amounted to $150,371, including $102 from securities loaned to FCM.
8. Expense Reductions.
Commissions paid to certain brokers with whom the investment adviser, or its affiliates, places trades on behalf of the Fund include an amount in addition to trade execution, which may be rebated back to the Fund to offset certain expenses. This amount totaled $17,208 for the period.
In addition, during the period the investment adviser reimbursed and/or waived a portion of fund-level operating expenses in the amount of $1,143 and a portion of class-level operating expenses as follows:
| Amount |
Class A | $ 880 |
Class T | 23 |
Class B | 4 |
Class C | 170 |
Global Commodity Stock | 1,381 |
Class I | 704 |
| $ 3,162 |
Annual Report
9. Distributions to Shareholders.
Distributions to shareholders of each class were as follows:
Years ended October 31, | 2015 | 2014 |
From net investment income | | |
Class A | $ 520,699 | $ 708,856 |
Class T | 72,766 | 98,770 |
Class B | 1,871 | 4,646 |
Class C | 32,755 | 54,810 |
Global Commodity Stock | 2,937,401 | 3,531,196 |
Class I | 333,382 | 366,972 |
Total | $ 3,898,874 | $ 4,765,250 |
From net realized gain | | |
Class A | $ 97,397 | $ 63,118 |
Class T | 19,110 | 11,363 |
Class B | 3,040 | 2,083 |
Class C | 34,065 | 21,591 |
Global Commodity Stock | 429,058 | 244,178 |
Class I | 46,602 | 25,376 |
Total | $ 629,272 | $ 367,709 |
10. Share Transactions.
Share transactions for each class were as follows and may contain automatic conversions between classes or exchanges between funds:
| Shares | Dollars |
Years ended October 31, | 2015 | 2014 | 2015 | 2014 |
Class A | | | | |
Shares sold | 526,290 | 686,605 | $ 6,210,169 | $ 9,882,029 |
Reinvestment of distributions | 46,881 | 49,529 | 594,452 | 677,563 |
Shares redeemed | (1,342,823) | (1,874,574) | (16,036,860) | (26,738,279) |
Net increase (decrease) | (769,652) | (1,138,440) | $ (9,232,239) | $ (16,178,687) |
Class T | | | | |
Shares sold | 79,898 | 67,497 | $ 963,935 | $ 970,700 |
Reinvestment of distributions | 7,092 | 7,867 | 89,851 | 107,538 |
Shares redeemed | (201,781) | (216,700) | (2,371,414) | (3,112,471) |
Net increase (decrease) | (114,791) | (141,336) | $ (1,317,628) | $ (2,034,233) |
Class B | | | | |
Shares sold | 580 | 2,197 | $ 7,071 | $ 29,999 |
Reinvestment of distributions | 371 | 453 | 4,698 | 6,179 |
Shares redeemed | (35,007) | (46,232) | (422,886) | (649,491) |
Net increase (decrease) | (34,056) | (43,582) | $ (411,117) | $ (613,313) |
Annual Report
Notes to Financial Statements - continued
10. Share Transactions - continued
| Shares | Dollars |
Years ended October 31, | 2015 | 2014 | 2015 | 2014 |
Class C | | | | |
Shares sold | 206,447 | 167,515 | $ 2,471,711 | $ 2,371,848 |
Reinvestment of distributions | 4,962 | 4,980 | 62,526 | 67,632 |
Shares redeemed | (426,784) | (527,630) | (5,161,590) | (7,391,284) |
Net increase (decrease) | (215,375) | (355,135) | $ (2,627,353) | $ (4,951,804) |
Global Commodity Stock | | | | |
Shares sold | 4,004,137 | 3,796,689 | $ 47,467,615 | $ 54,637,922 |
Reinvestment of distributions | 238,065 | 246,397 | 3,023,431 | 3,378,098 |
Shares redeemed | (5,506,523) | (6,485,397) | (65,599,040) | (92,819,253) |
Net increase (decrease) | (1,264,321) | (2,442,311) | $ (15,107,994) | $ (34,803,233) |
Class I | | | | |
Shares sold | 1,576,324 | 912,359 | $ 18,219,363 | $ 13,219,634 |
Reinvestment of distributions | 24,972 | 20,652 | 316,895 | 283,141 |
Shares redeemed | (929,289) | (1,362,707) | (10,645,039) | (19,411,369) |
Net increase (decrease) | 672,007 | (429,696) | $ 7,891,219 | $ (5,908,594) |
11. Other.
The Fund's organizational documents provide former and current trustees and officers with a limited indemnification against liabilities arising in connection with the performance of their duties to the Fund. In the normal course of business, the Fund may also enter into contracts that provide general indemnifications. The Fund's maximum exposure under these arrangements is unknown as this would be dependent on future claims that may be made against the Fund. The risk of material loss from such claims is considered remote.
At the end of the period, the investment adviser or its affiliates were the owners of record of 17% of the outstanding shares of the Funds.
Annual Report
To the Trustees of Fidelity Investment Trust and the Shareholders of Fidelity Global Commodity Stock Fund:
In our opinion, the accompanying statement of assets and liabilities, including the schedule of investments, and the related statements of operations and of changes in net assets and the financial highlights present fairly, in all material respects, the financial position of Fidelity Global Commodity Stock Fund (a fund of Fidelity Investment Trust) at October 31, 2015, the results of its operations for the year then ended, the changes in its net assets for each of the two years in the period then ended and the financial highlights for each of the five years in the period then ended, in conformity with accounting principles generally accepted in the United States of America. These financial statements and financial highlights (hereafter referred to as "financial statements") are the responsibility of the Fidelity Global Commodity Stock Fund's management. Our responsibility is to express an opinion on these financial statements based on our audits. We conducted our audits of these financial statements in accordance with the standards of the Public Company Accounting Oversight Board (United States). Those standards require that we plan and perform the audit to obtain reasonable assurance about whether the financial statements are free of material misstatement. An audit includes examining, on a test basis, evidence supporting the amounts and disclosures in the financial statements, assessing the accounting principles used and significant estimates made by management, and evaluating the overall financial statement presentation. We believe that our audits, which included confirmation of securities at October 31, 2015 by correspondence with the custodian and brokers, provide a reasonable basis for our opinion.
PricewaterhouseCoopers LLP
Boston, Massachusetts
December 18, 2015
Annual Report
The Trustees, Member of the Advisory Board, and officers of the trust and fund, as applicable, are listed below. The Board of Trustees governs the fund and is responsible for protecting the interests of shareholders. The Trustees are experienced executives who meet periodically throughout the year to oversee the fund's activities, review contractual arrangements with companies that provide services to the fund, oversee management of the risks associated with such activities and contractual arrangements, and review the fund's performance. Each of the Trustees oversees 170 funds.
The Trustees hold office without limit in time except that (a) any Trustee may resign; (b) any Trustee may be removed by written instrument, signed by at least two-thirds of the number of Trustees prior to such removal; (c) any Trustee who requests to be retired or who has become incapacitated by illness or injury may be retired by written instrument signed by a majority of the other Trustees; and (d) any Trustee may be removed at any special meeting of shareholders by a two-thirds vote of the outstanding voting securities of the trust. Each Trustee who is not an interested person (as defined in the 1940 Act) of the trust and the fund (Independent Trustee), shall retire not later than the last day of the calendar year in which his or her 75th birthday occurs. The Independent Trustees may waive this mandatory retirement age policy with respect to individual Trustees. The officers and Advisory Board Member hold office without limit in time, except that any officer and Advisory Board Member may resign or may be removed by a vote of a majority of the Trustees at any regular meeting or any special meeting of the Trustees. Except as indicated, each individual has held the office shown or other offices in the same company for the past five years.
Experience, Skills, Attributes, and Qualifications of the Fund's Trustees. The Governance and Nominating Committee has adopted a statement of policy that describes the experience, qualifications, attributes, and skills that are necessary and desirable for potential Independent Trustee candidates (Statement of Policy). The Board believes that each Trustee satisfied at the time he or she was initially elected or appointed a Trustee, and continues to satisfy, the standards contemplated by the Statement of Policy. The Governance and Nominating Committee also engages professional search firms to help identify potential Independent Trustee candidates who have the experience, qualifications, attributes, and skills consistent with the Statement of Policy. From time to time, additional criteria based on the composition and skills of the current Independent Trustees, as well as experience or skills that may be appropriate in light of future changes to board composition, business conditions, and regulatory or other developments, have also been considered by the professional search firms and the Governance and Nominating Committee. In addition, the Board takes into account the Trustees' commitment and participation in Board and committee meetings, as well as their leadership of standing and ad hoc committees throughout their tenure.
In determining that a particular Trustee was and continues to be qualified to serve as a Trustee, the Board has considered a variety of criteria, none of which, in isolation, was controlling. The Board believes that, collectively, the Trustees have balanced and diverse experience, qualifications, attributes, and skills, which allow the Board to operate effectively in governing the fund and protecting the interests of shareholders. Information about the specific experience, skills, attributes, and qualifications of each Trustee, which in each case led to the Board's conclusion that the Trustee should serve (or continue to serve) as a trustee of the fund, is provided below.
Annual Report
Board Structure and Oversight Function. James C. Curvey is an interested person (as defined in the 1940 Act) and currently serves as Chairman. The Trustees have determined that an interested Chairman is appropriate and benefits shareholders because an interested Chairman has a personal and professional stake in the quality and continuity of services provided to the fund. Independent Trustees exercise their informed business judgment to appoint an individual of their choosing to serve as Chairman, regardless of whether the Trustee happens to be independent or a member of management. The Independent Trustees have determined that they can act independently and effectively without having an Independent Trustee serve as Chairman and that a key structural component for assuring that they are in a position to do so is for the Independent Trustees to constitute a substantial majority for the Board. The Independent Trustees also regularly meet in executive session. Ned C. Lautenbach serves as Chairman of the Independent Trustees and as such (i) acts as a liaison between the Independent Trustees and management with respect to matters important to the Independent Trustees and (ii) with management prepares agendas for Board meetings.
Fidelity funds are overseen by different Boards of Trustees. The fund's Board oversees Fidelity's high income and certain equity funds, and other Boards oversee Fidelity's investment-grade bond, money market, asset allocation, and sector funds. The asset allocation funds may invest in Fidelity funds overseen by the fund's Board. The use of separate Boards, each with its own committee structure, allows the Trustees of each group of Fidelity funds to focus on the unique issues of the funds they oversee, including common research, investment, and operational issues. On occasion, the separate Boards establish joint committees to address issues of overlapping consequences for the Fidelity funds overseen by each Board.
The Trustees operate using a system of committees to facilitate the timely and efficient consideration of all matters of importance to the Trustees, the fund, and fund shareholders and to facilitate compliance with legal and regulatory requirements and oversight of the fund's activities and associated risks. The Board, acting through its committees, has charged FMR and its affiliates with (i) identifying events or circumstances the occurrence of which could have demonstrably adverse effects on the fund's business and/or reputation; (ii) implementing processes and controls to lessen the possibility that such events or circumstances occur or to mitigate the effects of such events or circumstances if they do occur; and (iii) creating and maintaining a system designed to evaluate continuously business and market conditions in order to facilitate the identification and implementation processes described in (i) and (ii) above. Because the day-to-day operations and activities of the fund are carried out by or through FMR, its affiliates and other service providers, the fund's exposure to risks is mitigated but not eliminated by the processes overseen by the Trustees. While each of the Board's committees has responsibility for overseeing different aspects of the fund's activities, oversight is exercised primarily through the Operations, Audit, and Compliance Committees. In addition, the Independent Trustees have worked with FMR to enhance the Board's oversight of investment and financial risks, legal and regulatory risks, technology risks, and operational risks, including the development of additional risk reporting to the Board. For example, a working group comprised of Independent Trustees and FMR has worked and continues to work to review the Fidelity funds' valuation-related activities, reporting and risk management. Appropriate personnel, including but not limited to the fund's Chief Compliance Officer (CCO), FMR's internal auditor, the independent accountants, the fund's Treasurer and portfolio management personnel, make periodic reports to the Board's committees, as appropriate, including an annual review of Fidelity's risk management program for the Fidelity funds. The responsibilities of each standing committee, including their oversight responsibilities, are described further under "Standing Committees of the Fund's Trustees."
Annual Report
Trustees and Officers - continued
The fund's Statement of Additional Information (SAI) includes more information about the Trustees. To request a free copy, call Fidelity at 1-877-208-0098.
Interested Trustees*:
Correspondence intended for each Trustee who is an interested person may be sent to Fidelity Investments, 245 Summer Street, Boston, Massachusetts 02210.
Name, Year of Birth; Principal Occupations and Other Relevant Experience+ |
James C. Curvey (1935) |
Year of Election or Appointment: 2007 Trustee Chairman of the Board of Trustees |
| Mr. Curvey also serves as Trustee of other Fidelity funds. Mr. Curvey is a Director of Fidelity Research & Analysis Co. (investment adviser firm, 2009-present), and Vice Chairman (2007-present) and Director of FMR LLC (diversified financial services company). In addition, Mr. Curvey serves as an Overseer for the Boston Symphony Orchestra and a member of the board of Artis-Naples, Naples, Florida, and as a Trustee for Brewster Academy, Wolfeboro, New Hampshire. Previously, Mr. Curvey served as a Director of Fidelity Investments Money Management, Inc. (investment adviser firm, 2009-2014) and a Director of FMR and FMR Co., Inc. (investment adviser firms, 2007-2014). |
Charles S. Morrison (1960) |
Year of Election or Appointment: 2014 Trustee |
| Mr. Morrison also serves as Trustee of other funds. He serves as a Director of Fidelity Investments Money Management, Inc. (FIMM) (investment adviser firm, 2014-present), Director of Fidelity SelectCo, LLC (investment adviser firm, 2014-present), President, Asset Management (2014-present), and is an employee of Fidelity Investments. Previously, Mr. Morrison served as Vice President of Fidelity's Fixed Income and Asset Allocation Funds (2012-2014), President, Fixed Income (2011-2014), Vice President of Fidelity's Money Market Funds (2005-2009), President, Money Market Group Leader of FMR (investment adviser firm, 2009), and Senior Vice President, Money Market Group of FMR (2004-2009). Mr. Morrison also served as Vice President of Fidelity's Bond Funds (2002-2005), certain Balanced Funds (2002-2005), and certain Asset Allocation Funds (2002-2007), and as Senior Vice President (2002-2005) of Fidelity's Bond Division. |
* Trustees have been determined to be "Interested Trustees" by virtue of, among other things, their affiliation with the trust or various entities under common control with FMR.
+ The information above includes each Trustee's principal occupation during the last five years and other information relating to the experience, attributes, and skills relevant to each Trustee's qualifications to serve as a Trustee, which led to the conclusion that each Trustee should serve as a Trustee for the fund.
Annual Report
Trustees and Officers - continued
Independent Trustees:
Correspondence intended for each Independent Trustee (that is, the Trustees other than the Interested Trustees) may be sent to Fidelity Investments, P.O. Box 55235, Boston, Massachusetts 02205-5235.
Name, Year of Birth; Principal Occupations and Other Relevant Experience+ |
Dennis J. Dirks (1948) |
Year of Election or Appointment: 2005 Trustee |
| Mr. Dirks also serves as Trustee of other Fidelity funds. Prior to his retirement in May 2003, Mr. Dirks was Chief Operating Officer and a member of the Board of The Depository Trust & Clearing Corporation (DTCC). He also served as President, Chief Operating Officer, and Board member of The Depository Trust Company (DTC) and President and Board member of the National Securities Clearing Corporation (NSCC). In addition, Mr. Dirks served as Chief Executive Officer and Board member of the Government Securities Clearing Corporation, Chief Executive Officer and Board member of the Mortgage-Backed Securities Clearing Corporation, as a Trustee and a member of the Finance Committee of Manhattan College (2005-2008), as a Trustee and a member of the Finance Committee of AHRC of Nassau County (2006-2008), and as a member of the Independent Directors Council (IDC) Governing Council (2010-2015). Mr. Dirks is a member of the Board of Directors for The Brookville Center for Children's Services, Inc. (2009-present). |
Alan J. Lacy (1953) |
Year of Election or Appointment: 2008 Trustee |
| Mr. Lacy also serves as Trustee of other Fidelity funds. Mr. Lacy serves as a member of the Board of Directors of Dave & Buster's Entertainment, Inc. (restaurant and entertainment complexes, 2010-present) and Bristol-Myers Squibb Company (global pharmaceuticals, 2008-present). In addition, Mr. Lacy served as Senior Adviser (2007-2014) of Oak Hill Capital Partners, L.P. (private equity) and also served as Chief Executive Officer (2000-2005) and Vice Chairman (2005-2006) of Sears Holdings Corporation and Sears, Roebuck and Co. (retail). Mr. Lacy is a member of the Board of Trustees of The National Parks Conservation Association (2006-present). Previously, Mr. Lacy served as Chairman of the Board of Trustees of the National Parks Conservation Association (2008-2011) and as a member of the Board of Directors for The Western Union Company (global money transfer, 2006-2011), The Hillman Companies, Inc. (hardware wholesalers, 2010-2014), and Earth Fare, Inc. (retail grocery, 2010-2014). |
Ned C. Lautenbach (1944) |
Year of Election or Appointment: 2000 Trustee Chairman of the Independent Trustees |
| Mr. Lautenbach also serves as Trustee of other Fidelity funds. Mr. Lautenbach currently serves as the Lead Director of the Eaton Corporation Board of Directors (diversified industrial, 1997-present). Mr. Lautenbach is Chairman of the Board of Directors of Artis-Naples in Naples, Florida (2012-present), a member of the Council on Foreign Relations (1994-present), and a member of the Board of Governors, State University System of Florida (2013-present). Previously, Mr. Lautenbach was a Partner/Advisory Partner at Clayton, Dubilier & Rice, LLC (private equity investment, 1998-2010), as well as a Director of Sony Corporation (2006-2007). |
Joseph Mauriello (1944) |
Year of Election or Appointment: 2008 Trustee |
| Mr. Mauriello also serves as Trustee of other Fidelity funds. Prior to his retirement in January 2006, Mr. Mauriello served in numerous senior management positions including Deputy Chairman and Chief Operating Officer (2004-2005), and Vice Chairman of Financial Services (2002-2004) of KPMG LLP US (professional services, 1965-2005). Mr. Mauriello currently serves as a member of the Board of Directors of XL Group plc. (global insurance and re-insurance, 2006-present) and the Independent Directors Council (IDC) Governing Council (2015-present). Previously, Mr. Mauriello served as a Director of the Hamilton Funds of the Bank of New York (2006-2007) and of Arcadia Resources Inc. (health care services and products, 2007-2012). |
Robert W. Selander (1950) |
Year of Election or Appointment: 2011 Trustee |
| Mr. Selander also serves as Trustee of other Fidelity funds. Mr. Selander serves as a Director of The Western Union Company (global money transfer, 2014-present). Previously, Mr. Selander served as a Member of the Advisory Board of other Fidelity funds (2011), and Executive Vice Chairman (2010), Chief Executive Officer (2009-2010), and President and Chief Executive Officer (1997-2009) of Mastercard, Inc. |
Cornelia M. Small (1944) |
Year of Election or Appointment: 2005 Trustee |
| Ms. Small also serves as Trustee of other Fidelity funds. Ms. Small is a member of the Board of Directors (2009-present) and Chair of the Investment Committee (2010-present) of the Teagle Foundation. Ms. Small also serves on the Investment Committee of the Berkshire Taconic Community Foundation (2008-present). Previously, Ms. Small served as Chairperson (2002-2008) and a member of the Investment Committee and Chairperson (2008-2012) and a member of the Board of Trustees of Smith College. In addition, Ms. Small served as Chief Investment Officer, Director of Global Equity Investments, and a member of the Board of Directors of Scudder, Stevens & Clark and Scudder Kemper Investments. |
William S. Stavropoulos (1939) |
Year of Election or Appointment: 2001 Trustee Vice Chairman of the Independent Trustees |
| Mr. Stavropoulos also serves as Trustee of other Fidelity funds. Mr. Stavropoulos serves as President and Founder of the Michigan Baseball Foundation, the Great Lakes Loons (2007-present). Mr. Stavropoulos is Chairman Emeritus of the Board of Directors of The Dow Chemical Company, where he previously served in numerous senior management positions, including President, CEO (1995-2000; 2002-2004), Chairman of the Executive Committee (2000-2006), and as a member of the Board of Directors (1990-2006). Currently, Mr. Stavropoulos is Chairman of the Board of Directors of Univar Inc. (global distributor of commodity and specialty chemicals), a Director of Teradata Corporation (data warehousing and technology solutions), and Maersk Inc. (industrial conglomerate), and a member of the Advisory Board for Metalmark Capital LLC (private equity investment, 2005-present). Mr. Stavropoulos is an operating advisor to Clayton, Dubilier & Rice, LLC (private equity investment). In addition, Mr. Stavropoulos is a member of the University of Notre Dame Advisory Council for the College of Science, a Trustee of the Rollin L. Gerstacker Foundation, and a Director of the Naples Philharmonic Center for the Arts. Previously, Mr. Stavropoulos served as a Director of Chemical Financial Corporation (bank holding company, 1993-2012) and Tyco International, Ltd. (multinational manufacturing and services, 2007-2012). |
David M. Thomas (1949) |
Year of Election or Appointment: 2008 Trustee |
| Mr. Thomas also serves as Trustee of other Fidelity funds. Mr. Thomas serves as Non-Executive Chairman of the Board of Directors of Fortune Brands Home and Security (home and security products, 2011-present), as a member of the Board of Directors (2004-present) and Presiding Director (2013-present) of Interpublic Group of Companies, Inc. (marketing communication), and as a member of the Board of Trustees of the University of Florida (2013-present). Previously, Mr. Thomas served as Executive Chairman (2005-2006) and Chairman and Chief Executive Officer (2000-2005) of IMS Health, Inc. (pharmaceutical and healthcare information solutions), and a Director of Fortune Brands, Inc. (consumer products, 2000-2011). |
+ The information above includes each Trustee's principal occupation during the last five years and other information relating to the experience, attributes, and skills relevant to each Trustee's qualifications to serve as a Trustee, which led to the conclusion that each Trustee should serve as a Trustee for the fund.
Advisory Board Member and Officers:
Correspondence intended for each officer and Peter S. Lynch may be sent to Fidelity Investments, 245 Summer Street, Boston, Massachusetts 02210. Officers appear below in alphabetical order.
Name, Year of Birth; Principal Occupation |
Peter S. Lynch (1944) |
Year of Election or Appointment: 2003 Member of the Advisory Board |
| Mr. Lynch also serves as Member of the Advisory Board of other Fidelity funds. Mr. Lynch is Vice Chairman and a Director of FMR (investment adviser firm) and FMR Co., Inc. (investment adviser firm). In addition, Mr. Lynch serves as a Trustee of Boston College and as the Chairman of the Inner-City Scholarship Fund. Previously, Mr. Lynch served on the Special Olympics International Board of Directors (1997-2006). |
Christopher S. Bartel (1971) |
Year of Election or Appointment: 2009 Vice President |
| Mr. Bartel also serves as Vice President of other funds. Mr. Bartel serves as a Director, President, and Chief Executive Officer of Fidelity Management & Research (Japan) Limited (investment adviser firm, 2012-present), a Director of Fidelity Management & Research (Hong Kong) (investment adviser firm, 2012-present), and Senior Vice President of Global Equity Research (2010-present). Previously, Mr. Bartel served as Senior Vice President of Equity Research (2009-2010), Managing Director of Research (2006-2009), and an analyst and portfolio manager (2000-2006). |
Elizabeth Paige Baumann (1968) |
Year of Election or Appointment: 2012 Anti-Money Laundering (AML) Officer |
| Ms. Baumann also serves as AML Officer of other funds. She is Chief AML Officer of FMR LLC (diversified financial services company, 2012-present) and is an employee of Fidelity Investments. Previously, Ms. Baumann served as Vice President and Deputy Anti-Money Laundering Officer (2007-2012). |
Marc R. Bryant (1966) |
Year of Election or Appointment: 2015 Secretary and Chief Legal Officer (CLO) |
| Mr. Bryant also serves as Secretary and CLO of other funds. Mr. Bryant serves as CLO, Secretary, and Senior Vice President of Fidelity Management & Research Company (investment adviser firm, 2015-present) and FMR Co., Inc. (investment adviser firm, 2015-present); Secretary of Fidelity SelectCo, LLC (investment adviser firm, 2015-present) and Fidelity Investments Money Management, Inc. (investment adviser firm, 2015-present); and CLO of Fidelity Management & Research (Hong Kong) Limited (investment adviser firm, 2015-present). He is Senior Vice President and Deputy General Counsel of FMR LLC (diversified financial services company). Previously, Mr. Bryant served as Secretary and Chief Legal Officer of Fidelity Rutland Square Trust II (2010-2014) and Assistant Secretary of Fidelity's Fixed Income and Asset Allocation Funds (2013-2015). Prior to joining Fidelity Investments, Mr. Bryant served as a Senior Vice President and the Head of Global Retail Legal for AllianceBernstein L.P. (2006-2010), and as the General Counsel for ProFund Advisors LLC (2001-2006). |
William C. Coffey (1969) |
Year of Election or Appointment: 2009 Assistant Secretary |
| Mr. Coffey also serves as Assistant Secretary of other funds. He is Senior Vice President and Deputy General Counsel of FMR LLC (diversified financial services company, 2010-present), and is an employee of Fidelity Investments. Previously, Mr. Coffey served as Vice President and Associate General Counsel of FMR LLC (2005-2009). |
Jonathan Davis (1968) |
Year of Election or Appointment: 2010 Assistant Treasurer |
| Mr. Davis also serves as Assistant Treasurer of other funds, and is an employee of Fidelity Investments. Previously, Mr. Davis served as Vice President and Associate General Counsel of FMR LLC (diversified financial services company, 2003-2010). |
Adrien E. Deberghes (1967) |
Year of Election or Appointment: 2008 Deputy Treasurer |
| Mr. Deberghes also serves as an officer of other funds. He is an employee of Fidelity Investments (2008-present). Prior to joining Fidelity Investments, Mr. Deberghes was Senior Vice President of Mutual Fund Administration at State Street Corporation (2007-2008), Senior Director of Mutual Fund Administration at Investors Bank & Trust (2005-2007), and Director of Finance for Dunkin' Brands (2000-2005). |
Stephanie J. Dorsey (1969) |
Year of Election or Appointment: 2010 Assistant Treasurer |
| Ms. Dorsey also serves as an officer of other funds. She is an employee of Fidelity Investments (2008-present) and has served in other fund officer roles. Prior to joining Fidelity Investments, Ms. Dorsey served as Treasurer (2004-2008) of the JPMorgan Mutual Funds and Vice President (2004-2008) of JPMorgan Chase Bank. |
Howard J. Galligan III (1966) |
Year of Election or Appointment: 2014 Chief Financial Officer |
| Mr. Galligan also serves as Chief Financial Officer of other funds. Mr. Galligan serves as President of Fidelity Pricing and Cash Management Services (FPCMS) (2014-present) and as a Director of Strategic Advisers, Inc. (investment adviser firm, 2008-present). Previously, Mr. Galligan served as Chief Administrative Officer of Asset Management (2011-2014) and Chief Operating Officer and Senior Vice President of Investment Support for Strategic Advisers, Inc. (2003-2011). |
Scott C. Goebel (1968) |
Year of Election or Appointment: 2015 Vice President |
| Mr. Goebel serves as Vice President of other funds and is an employee of Fidelity Investments (2001-present). Previously, Mr. Goebel served as Secretary of Fidelity SelectCo, LLC (investment adviser firm, 2013-2015), Fidelity Investments Money Management, Inc. (FIMM) (investment adviser firm, 2010-2015), and Fidelity Research and Analysis Company (FRAC) (investment adviser firm, 2010-2015); General Counsel, Secretary, and Senior Vice President of Fidelity Management & Research Company (investment adviser firm, 2008-2015) and FMR Co., Inc. (investment adviser firm, 2008-2015); Assistant Secretary of Fidelity Management & Research (Japan) Limited (investment adviser firm, 2008-2015) and FMR Investment Management (U.K.) Limited (investment adviser firm, 2008-2015); Chief Legal Officer (CLO) of Fidelity Management & Research (Hong Kong) Limited (investment adviser firm, 2008-2015); Secretary and CLO of certain Fidelity funds (2008-2015); Assistant Secretary of FIMM (2008-2010), FRAC (2008-2010), and certain funds (2007-2008); and as Vice President and Secretary of Fidelity Distributors Corporation (FDC) (2005-2007). |
Brian B. Hogan (1964) |
Year of Election or Appointment: 2009 Vice President |
| Mr. Hogan also serves as Trustee or Vice President of other funds. Mr. Hogan serves as a Director of Fidelity SelectCo, LLC (investment adviser firm, 2014-present) and President of the Equity Division of FMR (investment adviser firm, 2009-present). Previously, Mr. Hogan served as Senior Vice President, Equity Research of FMR (2006-2009) and as a portfolio manager. |
Chris Maher (1972) |
Year of Election or Appointment: 2013 Assistant Treasurer |
| Mr. Maher serves as Assistant Treasurer of other funds. Mr. Maher is Vice President of Valuation Oversight and is an employee of Fidelity Investments. Previously, Mr. Maher served as Vice President of Asset Management Compliance (2013), Vice President of the Program Management Group of FMR (investment adviser firm, 2010-2013), and Vice President of Valuation Oversight (2008-2010). |
Kenneth B. Robins (1969) |
Year of Election or Appointment: 2008 President and Treasurer |
| Mr. Robins also serves as an officer of other funds. Mr. Robins serves as Executive Vice President of Fidelity Investments Money Management, Inc. (FIMM) (investment adviser firm, 2013-present) and is an employee of Fidelity Investments (2004-present). Previously, Mr. Robins served in other fund officer roles. |
Stacie M. Smith (1974) |
Year of Election or Appointment: 2013 Deputy Treasurer |
| Ms. Smith also serves as an officer of other funds. She is an employee of Fidelity Investments (2009-present) and has served in other fund officer roles. Prior to joining Fidelity Investments, Ms. Smith served as Senior Audit Manager of Ernst & Young LLP (1996-2009). |
Renee Stagnone (1975) |
Year of Election or Appointment: 2013 Deputy Treasurer |
| Ms. Stagnone also serves as Deputy Treasurer of other funds. Ms. Stagnone is an employee of Fidelity Investments (1997-present). |
Linda J. Wondrack (1964) |
Year of Election or Appointment: 2014 Chief Compliance Officer |
| Ms. Wondrack also serves as Chief Compliance Officer of other funds. Ms. Wondrack is Executive Vice President and head of the Ethics Office and Asset Management Compliance for Fidelity Investments (2012-present). Ms. Wondrack also serves as Chief Compliance Officer of Fidelity SelectCo, LLC (investment adviser firm, 2014-present); Chief Compliance Officer of Impresa Management LLC (2013-present); and Chief Compliance Officer of FMR Co., Inc. (investment adviser firm), Fidelity Investments Money Management, Inc. (investment adviser firm), Fidelity Management & Research (Japan) Limited (investment adviser firm), FMR Investment Management (U.K.) Limited (investment adviser firm), Fidelity Management & Research (Hong Kong) (investment adviser firm), Fidelity Management & Research Company (investment adviser firm), FIAM LLC (investment adviser firm), and Strategic Advisers, Inc. (investment adviser firm), Ballyrock Investment Advisors LLC, and Northern Neck Investors LLC (2012-present). Previously, Ms. Wondrack served as Senior Vice President and Chief Compliance Officer for Columbia Management Investment Advisers, LLC (2005-2012); Chief Compliance Officer for certain funds within the Columbia Family of Funds (2007-2012); and Senior Vice President of Compliance Risk Management at Bank of America (2005-2010). |
Joseph F. Zambello (1957) |
Year of Election or Appointment: 2011 Deputy Treasurer |
| Mr. Zambello also serves as Deputy Treasurer of other funds. Mr. Zambello is an employee of Fidelity Investments (1991-present). Previously, Mr. Zambello served as Vice President of the Program Management Group of FMR (investment adviser firm, 2009-2011) and Vice President of the Transfer Agent Oversight Group (2005-2009). |
Annual Report
The Board of Trustees of Fidelity Global Commodity Stock Fund voted to pay to shareholders of record at the opening of business on record date, the following distributions per share derived from capital gains realized from sales of portfolio securities, and dividends derived from net investment income:
| Pay Date | Record Date | Dividends | Capital Gains |
Class I | 12/07/15 | 12/04/15 | $0.250 | $0.010 |
Class I designates 52% of the dividend distributed during the fiscal year as qualifying for the dividends-received deduction for corporate shareholders.
Class I designates 100% of the dividend distributed during the fiscal year as amounts which may be taken into account as a dividend for the purposes of the maximum rate under section 1(h)(11) of the Internal Revenue Code.
The amounts per share which represent income derived from sources within, and taxes paid to, foreign countries or possessions of the United States are as follows:
| Pay Date | Income | Taxes |
Class I | 12/08/14 | $0.2214 | $0.0094 |
The fund will notify shareholders in January 2016 of amounts for use in preparing 2015 income tax returns.
Annual Report
Fidelity Global Commodity Stock Fund
Each year, the Board of Trustees, including the Independent Trustees (together, the Board), votes on the renewal of the management contract with Fidelity Management & Research Company (FMR) and the sub-advisory agreements (together, the Advisory Contracts) for the fund. The Board, assisted by the advice of fund counsel and Independent Trustees' counsel, requests and considers a broad range of information relevant to the renewal of the Advisory Contracts throughout the year.
The Board meets regularly and, at each of its meetings, covers an extensive agenda of topics and materials and considers factors that are relevant to its annual consideration of the renewal of the fund's Advisory Contracts, including the services and support provided to the fund and its shareholders. The Board has established various standing committees (Committees), each composed of and chaired by Independent Trustees with varying backgrounds, to which the Board has assigned specific subject matter responsibilities in order to enhance effective decision-making by the Board. The Board, acting directly and through its Committees, requests and receives information concerning the annual consideration of the renewal of the fund's Advisory Contracts. The Board also meets as needed to consider matters specifically related to the Board's annual consideration of the renewal of the Advisory Contracts. Members of the Board may also meet with trustees of other Fidelity funds through ad hoc joint committees to discuss certain matters relevant to all of the Fidelity funds.
At its July 2015 meeting, the Board unanimously determined to renew the fund's Advisory Contracts. In reaching its determination, the Board considered all factors it believed relevant, including (i) the nature, extent, and quality of the services to be provided to the fund and its shareholders (including the investment performance of the fund); (ii) the competitiveness of the fund's management fee and total expense ratio relative to peer funds; (iii) the total costs of the services to be provided by and the profits to be realized by Fidelity from its relationship with the fund; and (iv) the extent to which (if any) economies of scale exist and would be realized as the fund grows, and whether any economies of scale are appropriately shared with fund shareholders.
In considering whether to renew the Advisory Contracts for the fund, the Board reached a determination, with the assistance of fund counsel and Independent Trustees' counsel and through the exercise of its business judgment, that the renewal of the Advisory Contracts was in the best interests of the fund and its shareholders and that the compensation payable under the Advisory Contracts was fair and reasonable. The Board's decision to renew the Advisory Contracts was not based on any single factor, but rather was based on a comprehensive consideration of all the information provided to the Board at its meetings throughout the year. The Board, in reaching its determination to renew the Advisory Contracts, was aware that shareholders of the fund have a broad range of investment choices available to them, including a wide choice among funds offered by Fidelity's competitors, and that the fund's shareholders, who have the opportunity to review and weigh the disclosure provided by the fund in its prospectus and other public disclosures, have chosen to invest in this fund, which is part of the Fidelity family of funds.
Annual Report
Nature, Extent, and Quality of Services Provided. The Board considered Fidelity's staffing as it relates to the fund, including the backgrounds of investment personnel of Fidelity, and also considered the fund's investment objective, strategies, and related investment philosophy. The Independent Trustees also had discussions with senior management of Fidelity's investment operations and investment groups. The Board considered the structure of the portfolio manager compensation program and whether this structure provides appropriate incentives to act in the best interests of the fund. Additionally, the Board considered the portfolio managers' investments, if any, in the funds that they manage.
Resources Dedicated to Investment Management and Support Services. The Board and the Fund Oversight and Research Committees reviewed the general qualifications and capabilities of Fidelity's investment staff, including its size, education, experience, and resources, as well as Fidelity's approach to recruiting, training, managing, and compensating investment personnel. The Board noted that Fidelity has continued to increase the resources devoted to non-U.S. offices, including expansion of Fidelity's global investment organization. The Board also noted that Fidelity's analysts have extensive resources, tools and capabilities that allow them to conduct sophisticated quantitative and fundamental analysis, as well as credit analysis of issuers, counterparties and guarantors. Further, the Board considered that Fidelity's investment professionals have sufficient access to global information and data so as to provide competitive investment results over time, and that those professionals also have access to sophisticated tools that permit them to assess portfolio construction and risk and performance attribution characteristics continuously, as well as to transmit new information and research conclusions rapidly around the world. Additionally, in its deliberations, the Board considered Fidelity's trading, risk management, and compliance capabilities and resources, which are integral parts of the investment management process.
Shareholder and Administrative Services. The Board considered (i) the nature, extent, quality, and cost of advisory, administrative, and shareholder services performed by FMR, the sub-advisers (together with FMR, the Investment Advisers), and their affiliates under the Advisory Contracts and under separate agreements covering transfer agency, pricing and bookkeeping, and securities lending services for the fund; (ii) the nature and extent of the supervision of third party service providers, principally custodians and subcustodians; and (iii) the resources devoted to, and the record of compliance with, the fund's compliance policies and procedures. The Board also reviewed the allocation of fund brokerage, including allocations to brokers affiliated with the Investment Advisers, the use of brokerage commissions to pay fund expenses, and the use of "soft" commission dollars to pay for research services.
Annual Report
Board Approval of Investment Advisory Contracts and
Management Fees - continued
The Board noted that the growth of fund assets over time across the complex allows Fidelity to reinvest in the development of services designed to enhance the value or convenience of the Fidelity funds as investment vehicles. These services include 24-hour access to account information and market information through telephone representatives and over the Internet, investor education materials and asset allocation tools, and the expanded availability of Fidelity Investor Centers.
In 2014, the Board formed an ad hoc Committee on Transfer Agency Fees to review the variety of transfer agency fee structures throughout the industry and Fidelity's competitive positioning with respect to industry participants.
Investment in a Large Fund Family. The Board considered the benefits to shareholders of investing in a Fidelity fund, including the benefits of investing in a fund that is part of a large family of funds offering a variety of investment disciplines and providing a large variety of mutual fund investor services. The Board noted that Fidelity had taken, or had made recommendations that resulted in the Fidelity funds taking, a number of actions over the previous year that benefited particular funds, including (i) continuing to dedicate additional resources to investment research and to the support of the senior management team that oversees asset management; (ii) continuing efforts to enhance Fidelity's global research capabilities; (iii) launching new funds and making other enhancements to meet client needs; (iv) reducing management fees and total expenses for certain index funds and diversified international funds; (v) continuing to launch dedicated lower cost underlying funds to meet portfolio construction needs related to expanding underlying fund options for Fidelity funds of funds, specifically for the Freedom Fund product lines; (vi) rationalizing product lines and gaining increased efficiencies through fund mergers; (vii) launching active fixed-income exchange-traded funds; (viii) continuing to develop, acquire and implement systems and technology to improve services to the funds and information security and to increase efficiency; (ix) implementing investment enhancements to further strengthen Fidelity's target date product line to increase investors' probability of success in achieving their goals; (x) modifying the eligibility criteria for certain share classes to accommodate roll-over assets from employer-sponsored retirement plans; (xi) launching a new Class W of the Freedom Index Funds to attract and retain Fidelity record-kept retirement plan assets; and (xii) implementing changes to Fidelity's money market product line in response to recent money market regulatory reforms.
Investment Performance. The Board considered whether the fund has operated in accordance with its investment objective, as well as its record of compliance with its investment restrictions and its performance history.
Annual Report
The Board took into account discussions with representatives of the Investment Advisers about fund investment performance that occur at Board meetings throughout the year. In this regard the Board noted that as part of regularly scheduled fund reviews and other reports to the Board on fund performance, the Board considers annualized return information for the fund, for different time periods, measured against a securities market index ("benchmark index") and a peer group of funds with similar objectives ("peer group"), if any. In its evaluation of fund investment performance, the Board gave particular attention to information indicating changes in performance of certain Fidelity funds for specific time periods and discussed with the Investment Advisers the reasons for any overperformance or underperformance.
In addition to reviewing absolute and relative fund performance, the Independent Trustees periodically consider the appropriateness of fund performance metrics in evaluating the results achieved. In general, the Independent Trustees believe that fund performance should be evaluated based on net performance (after fees and expenses) of both the highest performing and lowest performing fund share classes, where applicable, compared to appropriate benchmark indices, over appropriate time periods that may include full market cycles, and compared to peer groups, as applicable, over the same periods, taking into account relevant factors including the following: general market conditions; issuer-specific information; and fund cash flows and other factors.
The Independent Trustees recognize that shareholders evaluate performance on a net basis over their own holding periods, for which one-, three-, and five-year periods are often used as a proxy. For this reason, the performance information reviewed by the Board also included net cumulative calendar year total return information for the fund and an appropriate benchmark index for the most recent one-, three-, and five-year periods, as shown below. A peer group is not shown below because the fund does not generally utilize a peer group for performance comparison purposes.
Annual Report
Board Approval of Investment Advisory Contracts and
Management Fees - continued
Fidelity Global Commodity Stock Fund
The Board has discussed the fund's performance with FMR, including the fund's underperformance based on more recent periods ended after 2014 (which periods are not shown in the chart above) but prior to the date of the Board's approval of the renewal of the Advisory Contracts, and has engaged with FMR to consider what steps might be taken to remediate the fund's more recent underperformance.
Based on its review, the Board concluded that the nature, extent, and quality of services provided to the fund under the Advisory Contracts should benefit the shareholders of the fund.
Competitiveness of Management Fee and Total Expense Ratio. The Board considered the fund's management fee and total expense ratio compared to "mapped groups" of competitive funds and classes created for the purpose of facilitating the Trustees' competitive analysis of management fees and total expenses. Fidelity creates "mapped groups" by combining similar Lipper investment objective categories that have comparable investment mandates. Combining Lipper investment objective categories aids the Board's management fee and total expense ratio comparisons by broadening the competitive group used for comparison.
Management Fee. The Board considered two proprietary management fee comparisons for the 12-month periods shown in basis points (BP) in the chart below. The group of Lipper funds used by the Board for management fee comparisons is referred to below as the "Total Mapped Group." The Total Mapped Group comparison focuses on a fund's standing in terms of gross management fees before expense reimbursements or caps relative to the total universe of funds with comparable investment mandates, regardless of whether their management fee structures also are comparable. Funds with comparable investment mandates offer exposure to similar types of securities. Funds with comparable management fee structures have similar management fee contractual arrangements (e.g., flat rate charged for advisory services, all-inclusive fee rate, etc.). "TMG %" represents the percentage of funds in the Total Mapped Group that had management fees that were lower than the fund's. For example, a hypothetical TMG % of 20% would mean that 80% of the funds in the Total Mapped Group had higher, and 20% had lower, management fees than the fund. The fund's actual TMG %s and the number of funds in the Total Mapped Group are in the chart below. The "Asset-Size Peer Group" (ASPG) comparison focuses on a fund's standing relative to a subset of non-Fidelity funds within the Total Mapped Group that are similar in size and management fee structure without taking into account performance adjustments, if any. For example, if a fund is in the first quartile of the ASPG, the fund's management fee ranks in the least expensive or lowest 25% of funds in the ASPG. The ASPG represents at least 15% of the funds in the Total Mapped Group with comparable asset size and management fee structures, subject to a minimum of 50 funds (or all funds in the Total Mapped Group if fewer than 50). Additional information, such as the ASPG quartile in which the fund's management fee rate ranked, is also included in the chart and considered by the Board.
Annual Report
Fidelity Global Commodity Stock Fund

The Board noted that the fund's management fee rate ranked below the median of its Total Mapped Group and below the median of its ASPG for 2014.
The Board noted that, in 2014, the ad hoc Committee on Group Fee was formed by it and other Fidelity fund boards to conduct an in-depth review of the "group fee" component of the management fee of funds with such management fee structures. Committee focus included the mechanics of the group fee, the competitive landscape of group fee structures, Fidelity funds with no group fee component and investment products not included in group fee assets. The Board also considered that, for funds subject to the group fee, FMR agreed to voluntarily waive fees over a specified period of time in amounts designed to account for assets converted from certain funds to certain collective investment trusts.
Annual Report
Board Approval of Investment Advisory Contracts and
Management Fees - continued
The Board also noted that, in 2013, the ad hoc Committee on Management Fees was formed to conduct an in-depth review of the management fee rates of Fidelity's active equity mutual funds. The Committee focused on the following areas: (i) standard fee structures; (ii) research consumption and trading evolution; (iii) management fee competitiveness/profitability by category; and (iv) factors that drive institutional pricing.
Based on its review, the Board concluded that the fund's management fee is fair and reasonable in light of the services that the fund receives and the other factors considered.
Total Expense Ratio. In its review of each class's total expense ratio, the Board considered the fund's management fee as well as other fund or class expenses, as applicable, such as transfer agent fees, pricing and bookkeeping fees, fund-paid 12b-1 fees, and custodial, legal, and audit fees. The Board also noted that Fidelity may agree to waive fees and expenses from time to time, and the extent to which, if any, it has done so for the fund. As part of its review, the Board also considered the current and historical total expense ratios of each class of the fund compared to competitive fund median expenses. Each class of the fund is compared to those funds and classes in the Total Mapped Group (used by the Board for management fee comparisons) that have a similar sales load structure.
The Board noted that the total expense ratio of each of Class A, Class I, and the retail class ranked below its competitive median for 2014 and the total expense ratio of each of Class T, Class B, and Class C ranked above its competitive median for 2014. The Board considered that, in general, various factors can affect total expense ratios. The Board noted that the total expense ratio of Class T was above the competitive median primarily because of higher 12b-1 fees on Class T as compared to most competitor funds. Class T has a higher 12b-1 fee, but a lower front-end sales charge, than traditionally priced front-end sales charge classes. The Board considered that Class T is primarily sold load-waived in the retirement plan market where its 0.50% 12b-1 fee is comparable to competing no-load, higher 12b-1 fee classes designed specifically for retirement plans. The Board noted that the fund offers multiple classes, each of which has a different sales load and 12b-1 fee structure, and that the multiple structures are intended to offer a range of pricing options for the intermediary market. The Board also noted that the total expense ratios of the classes vary primarily by the level of their 12b-1 fees, although differences in transfer agent fees may also cause expenses to vary from class to class.
Annual Report
Fees Charged to Other Fidelity Clients. The Board also considered Fidelity fee structures and other information with respect to clients of Fidelity, such as other funds advised or subadvised by Fidelity, pension plan clients, and other institutional clients with similar mandates. The Board noted the findings of the 2013 ad hoc joint committee (created with the board of other Fidelity funds), which reviewed and compared Fidelity's institutional investment advisory business with its business of providing services to the Fidelity funds, including the differences in services provided, fees charged, and costs incurred, as well as competition in their respective marketplaces.
Based on its review of total expense ratios and fees charged to other Fidelity clients, the Board concluded that, although in some cases above the median of the universe presented for comparison, the total expense ratio of each class of the fund was reasonable in light of the services that the fund and its shareholders receive and the other factors considered.
Costs of the Services and Profitability. The Board considered the revenues earned and the expenses incurred by Fidelity in conducting the business of developing, marketing, distributing, managing, administering and servicing the fund and servicing the fund's shareholders. The Board also considered the level of Fidelity's profits in respect of all the Fidelity funds.
On an annual basis, Fidelity presents to the Board information about the profitability of its relationship with the fund. Fidelity calculates profitability information for each fund, as well as aggregate profitability information for groups of Fidelity funds and all Fidelity funds, using a series of detailed revenue and cost allocation methodologies which originate with the books and records of Fidelity on which Fidelity's audited financial statements are based. The Audit Committee of the Board reviews any significant changes from the prior year's methodologies.
PricewaterhouseCoopers LLP (PwC), independent registered public accounting firm and auditor to Fidelity and certain Fidelity funds, has been engaged annually by the Board as part of the Board's assessment of Fidelity's profitability analysis. PwC's engagement includes the review and assessment of the methodologies used by Fidelity in determining the revenues and expenses attributable to Fidelity's mutual fund business, and completion of agreed-upon procedures in respect of the mathematical accuracy of fund profitability and its conformity to established allocation methodologies. After considering PwC's reports issued under the engagement and information provided by Fidelity, the Board concluded that while other allocation methods may also be reasonable, Fidelity's profitability methodologies are reasonable in all material respects.
Annual Report
Board Approval of Investment Advisory Contracts and
Management Fees - continued
The Board also reviewed Fidelity's non-fund businesses and fall-out benefits related to the mutual fund business as well as cases where Fidelity's affiliates may benefit from or be related to the fund's business.
The Board considered the costs of the services provided by and the profits realized by Fidelity in connection with the operation of the fund and was satisfied that the profitability was not excessive.
Economies of Scale. The Board considered whether there have been economies of scale in respect of the management of the Fidelity funds, whether the Fidelity funds (including the fund) have appropriately benefited from any such economies of scale, and whether there is potential for realization of any further economies of scale. The Board considered the extent to which the fund will benefit from economies of scale as assets grow through increased services to the fund, through waivers or reimbursements, or through fee or expense ratio reductions. The Board also noted that in 2013, it and the boards of other Fidelity funds created an ad hoc committee (the Economies of Scale Committee) to analyze whether Fidelity attains economies of scale in respect of the management and servicing of the Fidelity funds, whether the Fidelity funds have appropriately benefited from such economies of scale, and whether there is potential for realization of any further economies of scale.
The Board recognized that the fund's management contract incorporates a "group fee" structure, which provides for lower group fee rates as total group assets increase, and for higher group fee rates as total group assets decrease (with "group assets" defined to include fund assets under FMR's management plus sector fund assets previously under FMR's management and currently managed by Fidelity SelectCo, LLC). FMR calculates the group fee rates based on a tiered asset "breakpoint" schedule that varies based on asset class. The Board considered that the group fee is designed to deliver the benefits of economies of scale to fund shareholders when total Fidelity fund assets increase, even if assets of any particular fund are unchanged or have declined, because some portion of Fidelity's costs are attributable to services provided to all Fidelity funds, and all funds benefit if those costs can be allocated among more assets. The Board concluded that, given the group fee structure, fund shareholders will benefit from lower management fees as group assets increase at the fund complex level, regardless of whether Fidelity achieves any such economies of scale.
The Board concluded, taking into account the analysis of the Economies of Scale Committee, that economies of scale, if any, are being appropriately shared between fund shareholders and Fidelity.
Additional Information Requested by the Board. In order to develop fully the factual basis for consideration of the Fidelity funds' Advisory Contracts, the Board requested and received additional information on certain topics, including: (i) fund performance trends and Fidelity's long-term strategies for certain funds; (ii) the various share classes employed by Fidelity and the attributes of each class, together with similar information on the distribution and servicing payments made by Fidelity or the funds to third-party participants in the distribution channels; (iii) fund profitability, and fund performance in relation to fund profitability; (iv) the methodology with respect to evaluating competitive fund data and peer group classifications and fee comparisons; (v) annual fund profitability margins, with particular focus on certain funds with negative margins; (vi) the realization of fall-out benefits in certain Fidelity business units; (vii) economies of scale and the way in which they are shared with fund shareholders; (viii) Fidelity's group fee structures, including the group fee schedule of breakpoints; (ix) the impact of cost containment measures on the funds; and (x) the transfer agent fee structure.
Annual Report
Based on its evaluation of all of the conclusions noted above, and after considering all factors it believed relevant, the Board concluded that the advisory fee structures are fair and reasonable, and that the fund's Advisory Contracts should be renewed.
Annual Report
Investment Adviser
Fidelity Management & Research Company
Boston, MA
Investment Sub-Advisers
FMR Co., Inc.
FMR Investment Management
(U.K.) Limited
FIL Investment Advisors
FIL Investments (Japan) Limited
FIL Investment Advisors
(UK) Limited
Fidelity Management & Research
(Hong Kong) Limited
Fidelity Management & Research
(Japan) Limited
General Distributor
Fidelity Distributors Corporation
Smithfield, RI
Transfer and Service Agents
Fidelity Investments Institutional
Operations Company, Inc.
Boston, MA
Fidelity Service Company, Inc.
Boston, MA
Custodian
State Street Bank and Trust Company
Quincy, MA
(Fidelity Investment logo)(registered trademark)
AGCSI-UANN-1215
1.879388.106
ContentsPerformance: The Bottom LineManagement's Discussion of Fund PerformanceShareholder Expense ExampleInvestment Changes (Unaudited)Investments October 31, 2015Financial StatementsNotes to Financial StatementsReport of Independent Registered Public Accounting FirmTrustees and OfficersDistributions (Unaudited)Board Approval of Investment Advisory Contracts and Management FeesContentsPerformance: The Bottom LineManagement's Discussion of Fund PerformanceShareholder Expense ExampleInvestment Changes (Unaudited)Investments October 31, 2015Financial StatementsNotes to Financial StatementsReport of Independent Registered Public Accounting FirmTrustees and OfficersDistributions (Unaudited)Board Approval of Investment Advisory Contracts and Management FeesContentsPerformance: The Bottom LineManagement's Discussion of Fund PerformanceShareholder Expense ExampleInvestment Changes (Unaudited)Investments October 31, 2015Financial StatementsNotes to Financial StatementsReport of Independent Registered Public Accounting FirmTrustees and OfficersDistributions (Unaudited)Board Approval of Investment Advisory Contracts and Management Fees
Fidelity®
International Small Cap
Fund
Annual Report
October 31, 2015
(Fidelity Cover Art)
Contents
Performance | (Click Here) | How the fund has done over time. |
Management's Discussion of Fund Performance | (Click Here) | The Portfolio Manager's review of fund performance and strategy. |
Shareholder Expense Example | (Click Here) | An example of shareholder expenses. |
Investment Changes | (Click Here) | A summary of major shifts in the fund's investments over the past six months. |
Investments | (Click Here) | A complete list of the fund's investments with their market values. |
Financial Statements | (Click Here) | Statements of assets and liabilities, operations, and changes in net assets, as well as financial highlights. |
Notes | (Click Here) | Notes to financial statements. |
Report of Independent Registered Public Accounting Firm | (Click Here) | |
Trustees and Officers | (Click Here) | |
Distributions | (Click Here) | |
Board Approval of Investment Advisory Contracts and Management Fees | (Click Here) | |
To view a fund's proxy voting guidelines and proxy voting record for the 12-month period ended June 30, visit http://www.fidelity.com/proxyvotingresults or visit the Securities and Exchange Commission's (SEC) web site at http://www.sec.gov. You may also call 1-800-544-8544 to request a free copy of the proxy voting guidelines.
Standard & Poor's, S&P and S&P 500 are registered service marks of The McGraw-Hill Companies, Inc. and have been licensed for use by Fidelity Distributors Corporation.
Other third-party marks appearing herein are the property of their respective owners.
All other marks appearing herein are registered or unregistered trademarks or service marks of FMR LLC or an affiliated company. © 2015 FMR LLC. All rights reserved.
Annual Report
This report and the financial statements contained herein are submitted for the general information of the shareholders of the fund. This report is not authorized for distribution to prospective investors in the fund unless preceded or accompanied by an effective prospectus.
A fund files its complete schedule of portfolio holdings with the SEC for the first and third quarters of each fiscal year on Form N-Q. Forms N-Q are available on the SEC's web site at http://www.sec.gov. A fund's Forms N-Q may be reviewed and copied at the SEC's Public Reference Room in Washington, DC. Information regarding the operation of the SEC's Public Reference Room may be obtained by calling 1-800-SEC-0330. For a complete list of a fund's portfolio holdings, view the most recent holdings listing, semiannual report, or annual report on Fidelity's web site at http://www.fidelity.com, http://www.advisor.fidelity.com, or http://www.401k.com, as applicable.
NOT FDIC INSURED • MAY LOSE VALUE • NO BANK GUARANTEE
Neither the fund nor Fidelity Distributors Corporation is a bank.
Annual Report
Average annual total return reflects the change in the value of an investment, assuming reinvestment of the class' distributions from dividend income and capital gains (the profits earned upon the sale of securities that have grown in value, if any) and assuming a constant rate of performance each year. The $10,000 table and the fund's returns do not reflect the deduction of taxes that a shareholder would pay on fund distributions or the redemption of fund shares. During periods of reimbursement by Fidelity, a fund's total return will be greater than it would be had the reimbursement not occurred. How a fund did yesterday is no guarantee of how it will do tomorrow.
Average Annual Total Returns
Periods ended October 31, 2015 | Past 1
year | Past 5
years | Past 10
years |
Fidelity® International Small Cap Fund† | 6.53% | 7.81% | 6.81% |
† Prior to April 1, 2014, Fidelity International Small Cap Fund compared its performance to a different benchmark. The fund's historical performance may not represent its current investment policies.
$10,000 Over 10 Years
Let's say hypothetically that $10,000 was invested in Fidelity® International Small Cap Fund, a class of the fund, on October 31, 2005. The chart shows how the value of your investment would have changed, and also shows how the MSCI ACWI (All Country World Index) ex USA Small Cap Index performed over the same period.
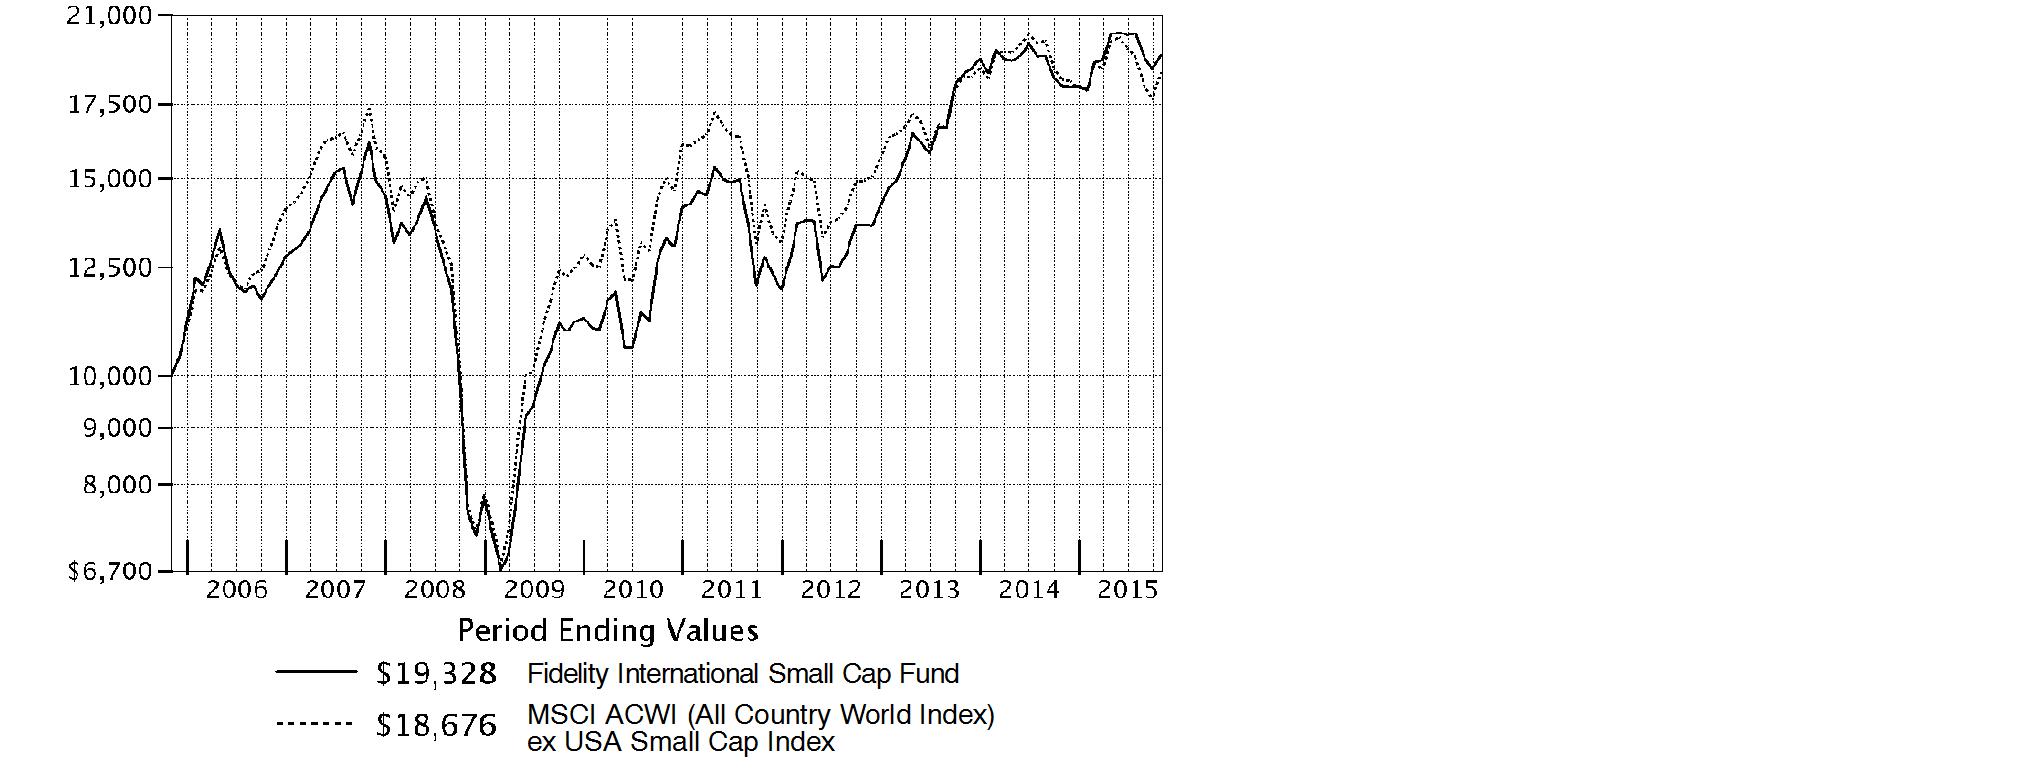
Annual Report
Market Recap: International equities suffered a moderate setback for the 12 months ending October 31, 2015, held back by a collapse in commodities prices that hurt resources-related sectors and geographies. The MSCI ACWI (All Country World Index) ex USA Index returned -4.55% for the period, affected also by concerns about global economic growth. Commodity producers remained under pressure for much of the past year, largely related to economic deceleration in China (-1%), the world's second-largest economy and a leading consumer of raw materials. This effect was exacerbated by U.S. dollar strength relative to global currencies, which weighed on commodities priced in dollars and acutely impacted equity returns within regions most exposed to resources prices. The emerging-markets group, for example, returned about -15% this period. Canada, a significant energy producer, returned roughly -17%. Net energy consumer Japan (+9%) was the best-performing region by far. Only about a quarter of the nearly 50 index countries managed a gain this period: Ireland (+19%) - the EU's fastest-growing economy - and Israel (+17%) proved top performers; Greece (-56%) and Brazil (-46%), among the worst. As for sectors, energy (-25%) and materials (-16%) declined sharply, whereas the two consumer sectors each gained about 6%.
Comments from Portfolio Manager Samuel Chamovitz: For the year, the fund's share classes (excluding sales charges, if applicable) posted mid-single-digit gains and considerably outdistanced the 1.62% return of the benchmark MSCI ACWI (All Country World Index) ex USA Small Cap Index. Stock selection in information technology, financials and consumer staples was especially beneficial to performance versus the benchmark. Geographically, stock picking in Japan, Switzerland, Israel and New Zealand stood out as positives. The top contributor was VZ Holding, a Switzerland-based provider of financial advisory and asset management services. VZ grew its market share on the strength of its asset management products and investor education initiatives. Other contributors included BGF Retail, a South Korean operator of convenience stores employing a franchise model, Israel-based flavors and fragrances maker Frutarom Industries, and Japanese drug-store chain Tsuruha Holdings. Conversely, stock selection in the United Kingdom and Ireland, as well as non-benchmark exposure to the U.S., were negatives. Relative results also were affected by a downward fair-value pricing adjustment of 0.56 percentage points. Our largest relative detractor was BW Offshore, listed on the Oslo Stock Exchange. This firm builds and operates Floating Production Storage and Offloading (FPSO) vessels used in offshore oil production. Another meaningful detractor was Petra Diamonds, a supplier of rough diamonds to the international market.
The views expressed above reflect those of the portfolio manager(s) only through the end of the period as stated on the cover of this report and do not necessarily represent the views of Fidelity or any other person in the Fidelity organization. Any such views are subject to change at any time based upon market or other conditions and Fidelity disclaims any responsibility to update such views. These views may not be relied on as investment advice and, because investment decisions for a Fidelity fund are based on numerous factors, may not be relied on as an indication of trading intent on behalf of any Fidelity fund.
Annual Report
Shareholder Expense Example
As a shareholder of the Fund, you incur two types of costs: (1) transaction costs, including sales charges (loads) on purchase payments or redemption proceeds, redemption fees and (2) ongoing costs, including management fees, distribution and/or service (12b-1) fees and other Fund expenses. This Example is intended to help you understand your ongoing costs (in dollars) of investing in the Fund and to compare these costs with the ongoing costs of investing in other mutual funds.
The Example is based on an investment of $1,000 invested at the beginning of the period and held for the entire period (May 1, 2015 to October 31, 2015).
Actual Expenses
The first line of the accompanying table for each class of the Fund provides information about actual account values and actual expenses. You may use the information in this line, together with the amount you invested, to estimate the expenses that you paid over the period. Simply divide your account value by $1,000.00 (for example, an $8,600 account value divided by $1,000.00 = 8.6), then multiply the result by the number in the first line for a class of the Fund under the heading entitled "Expenses Paid During Period" to estimate the expenses you paid on your account during this period. A small balance maintenance fee of $12.00 that is charged once a year may apply for certain accounts with a value of less than $2,000. This fee is not included in the table below. If it was, the estimate of expenses you paid during the period would be higher, and your ending account value lower, by this amount. In addition, the Fund, as a shareholder in the underlying Fidelity Central Funds, will indirectly bear its pro-rata share of the fees and expenses incurred by the underlying Fidelity Central Funds. These fees and expenses are not included in the Fund's annualized expense ratio used to calculate the expense estimate in the table below.
Hypothetical Example for Comparison Purposes
The second line of the accompanying table for each class of the Fund provides information about hypothetical account values and hypothetical expenses based on a Class' actual expense ratio and an assumed rate of return of 5% per year before expenses, which is not the Class' actual return. The hypothetical account values and expenses may not be used to estimate the actual ending account balance or expenses you paid for the period. You may use this information to compare the ongoing costs of investing in the Fund and other funds. To do so, compare this 5% hypothetical example with the 5% hypothetical examples that appear in the shareholder reports of the other funds. A small balance maintenance fee of $12.00 that is charged once a year may apply for certain accounts with a value of less than $2,000. This fee is not included in the table below. If it was, the estimate of expenses you paid during the period would be higher, and your ending account value lower, by this amount. In addition, the Fund, as a shareholder in the underlying Fidelity Central Funds, will indirectly bear its pro-rata share of the fees and expenses incurred by the underlying Fidelity Central Funds. These fees and expenses are not included in the Fund's annualized expense ratio used to calculate the expense estimate in the table below.
Annual Report
Shareholder Expense Example - continued
Please note that the expenses shown in the table are meant to highlight your ongoing costs only and do not reflect any transaction costs. Therefore, the second line of the table is useful in comparing ongoing costs only, and will not help you determine the relative total costs of owning different funds. In addition, if these transactional costs were included, your costs would have been higher.
| Annualized
Expense RatioB | Beginning
Account Value
May 1, 2015 | Ending
Account Value
October 31, 2015 | Expenses Paid
During PeriodC
May 1, 2015
to October 31, 2015 |
Class A | 1.63% | | | |
Actual | | $ 1,000.00 | $ 955.00 | $ 8.03 |
HypotheticalA | | $ 1,000.00 | $ 1,016.99 | $ 8.29 |
Class T | 1.92% | | | |
Actual | | $ 1,000.00 | $ 953.90 | $ 9.46 |
HypotheticalA | | $ 1,000.00 | $ 1,015.53 | $ 9.75 |
Class B | 2.42% | | | |
Actual | | $ 1,000.00 | $ 951.60 | $ 11.90 |
HypotheticalA | | $ 1,000.00 | $ 1,013.01 | $ 12.28 |
Class C | 2.41% | | | |
Actual | | $ 1,000.00 | $ 951.50 | $ 11.85 |
HypotheticalA | | $ 1,000.00 | $ 1,013.06 | $ 12.23 |
International Small Cap | 1.37% | | | |
Actual | | $ 1,000.00 | $ 956.80 | $ 6.76 |
HypotheticalA | | $ 1,000.00 | $ 1,018.30 | $ 6.97 |
Class I | 1.28% | | | |
Actual | | $ 1,000.00 | $ 957.20 | $ 6.31 |
HypotheticalA | | $ 1,000.00 | $ 1,018.75 | $ 6.51 |
A 5% return per year before expenses
B Annualized expense ratio reflects expenses net of applicable fee waivers.
C Expenses are equal to each Class' annualized expense ratio, multiplied by the average account value over the period, multiplied by 184/365 (to reflect the one-half year period).
Annual Report
Investment Changes (Unaudited)
Asset Allocation as of October 31, 2015 |
| % of fund's
net assets | % of fund's net assets
6 months ago |
Stocks | 94.6 | 94.6 |
Short-Term Investments and Net Other Assets (Liabilities) | 5.4 | 5.4 |
Top Ten Stocks as of October 31, 2015 |
| % of fund's
net assets | % of fund's net assets
6 months ago |
EBOS Group Ltd. (New Zealand, Health Care Providers & Services) | 1.1 | 1.2 |
Vontobel Holdings AG (Switzerland, Capital Markets) | 1.1 | 1.2 |
Frutarom Industries Ltd. (Israel, Chemicals) | 1.1 | 1.1 |
VZ Holding AG (Switzerland, Capital Markets) | 1.1 | 0.9 |
Micro Focus International PLC (United Kingdom, Software) | 1.1 | 1.0 |
United Drug PLC (United Kingdom) (Ireland, Health Care Providers & Services) | 1.0 | 1.2 |
Regus PLC (Bailiwick of Jersey, Commercial Services & Supplies) | 1.0 | 0.9 |
Hiscox Ltd. (Bermuda, Insurance) | 1.0 | 0.8 |
Amer Group PLC (A Shares) (Finland, Leisure Products) | 1.0 | 0.9 |
JSR Corp. (Japan, Chemicals) | 1.0 | 0.9 |
| 10.5 | |
Market Sectors as of October 31, 2015 |
| % of fund's
net assets | % of fund's net assets
6 months ago |
Financials | 22.6 | 21.9 |
Industrials | 18.9 | 17.9 |
Consumer Discretionary | 16.3 | 17.2 |
Information Technology | 10.0 | 9.0 |
Health Care | 8.5 | 8.8 |
Consumer Staples | 7.5 | 7.0 |
Materials | 6.9 | 7.9 |
Energy | 3.5 | 4.3 |
Utilities | 0.4 | 0.4 |
Telecommunication Services | 0.0 | 0.2 |
Annual Report
Investments October 31, 2015
Showing Percentage of Net Assets
Common Stocks - 94.4% |
| Shares | | Value |
Australia - 2.9% |
Austal Ltd. | 1,589,594 | | $ 2,562,477 |
Bradken Ltd. (a) | 1,226,491 | | 840,387 |
Challenger Ltd. | 960,083 | | 5,598,467 |
Charter Hall Group unit | 426,508 | | 1,356,865 |
GUD Holdings Ltd. | 726,825 | | 4,145,011 |
Imdex Ltd. (a) | 7,817,399 | | 1,246,756 |
Life Healthcare Group Ltd. | 1,826,612 | | 3,987,804 |
Nanosonics Ltd. (a) | 1,719,782 | | 1,953,007 |
RCG Corp. Ltd. | 2,822,812 | | 2,877,480 |
SomnoMed Ltd. (a)(d) | 584,445 | | 1,110,367 |
TOTAL AUSTRALIA | | 25,678,621 |
Austria - 1.6% |
Andritz AG | 115,532 | | 5,818,650 |
IMMOFINANZ Immobilien Anlagen AG (a) | 1,461,643 | | 3,748,214 |
RHI AG | 208,140 | | 4,708,085 |
TOTAL AUSTRIA | | 14,274,949 |
Bailiwick of Jersey - 1.4% |
Kennedy Wilson Europe Real Estate PLC | 193,806 | | 3,573,305 |
Regus PLC | 1,702,000 | | 8,779,246 |
TOTAL BAILIWICK OF JERSEY | | 12,352,551 |
Belgium - 0.9% |
Barco NV | 55,883 | | 3,672,356 |
Econocom Group SA (d) | 434,901 | | 3,888,082 |
TOTAL BELGIUM | | 7,560,438 |
Bermuda - 1.9% |
BW Offshore Ltd. | 6,094,227 | | 2,539,037 |
Hiscox Ltd. | 571,855 | | 8,529,206 |
Petra Diamonds Ltd. | 2,544,174 | | 2,927,847 |
Travelport Worldwide Ltd. | 222,200 | | 3,010,810 |
TOTAL BERMUDA | | 17,006,900 |
Brazil - 0.3% |
Banco ABC Brasil SA | 31,937 | | 69,976 |
MAHLE Metal Leve SA | 349,000 | | 2,118,497 |
TOTAL BRAZIL | | 2,188,473 |
British Virgin Islands - 0.2% |
Gem Diamonds Ltd. | 967,662 | | 1,476,830 |
Common Stocks - continued |
| Shares | | Value |
Canada - 4.0% |
AutoCanada, Inc. (d) | 132,484 | | $ 3,209,768 |
Constellation Software, Inc. | 4,766 | | 2,059,338 |
Dorel Industries, Inc. Class B (sub. vtg.) | 113,703 | | 2,891,270 |
Genesis Land Development Corp. (a) | 965,422 | | 2,178,032 |
Jean Coutu Group, Inc. Class A (sub. vtg.) | 291,013 | | 4,435,522 |
Lassonde Industries, Inc. Class A (sub. vtg.) | 31,269 | | 3,707,753 |
McCoy Global, Inc. | 1,335,870 | | 3,023,994 |
Open Text Corp. | 132,548 | | 6,143,878 |
ShawCor Ltd. Class A | 114,685 | | 2,433,855 |
Whitecap Resources, Inc. (d) | 563,453 | | 5,002,821 |
TOTAL CANADA | | 35,086,231 |
Cayman Islands - 3.7% |
AMVIG Holdings Ltd. | 14,266,000 | | 6,536,782 |
Bonjour Holdings Ltd. (d) | 44,460,800 | | 1,745,995 |
China High Precision Automation Group Ltd. (a) | 712,000 | | 1 |
China Metal Recycling (Holdings) Ltd. (a) | 436,800 | | 1 |
Greatview Aseptic Pack Co. Ltd. | 5,391,000 | | 2,530,849 |
Haitian International Holdings Ltd. | 1,491,000 | | 2,608,802 |
Lifestyle International Holdings Ltd. | 3,212,500 | | 4,645,766 |
Pico Far East Holdings Ltd. | 18,482,000 | | 4,906,092 |
SITC International Holdings Co. Ltd. | 11,482,000 | | 5,893,585 |
Value Partners Group Ltd. | 3,286,000 | | 3,479,602 |
TOTAL CAYMAN ISLANDS | | 32,347,475 |
Chile - 0.8% |
Quinenco SA | 2,409,395 | | 4,773,149 |
Vina San Pedro SA | 335,133,168 | | 2,642,103 |
TOTAL CHILE | | 7,415,252 |
Denmark - 1.0% |
Jyske Bank A/S (Reg.) (a) | 171,303 | | 8,362,651 |
Finland - 2.4% |
Amer Group PLC (A Shares) | 301,945 | | 8,473,503 |
Asiakastieto Group Oyj (a) | 181,623 | | 2,800,099 |
Cramo Oyj (B Shares) | 182,510 | | 3,351,642 |
Olvi PLC (A Shares) | 100,438 | | 2,435,349 |
Tikkurila Oyj | 230,646 | | 4,233,083 |
TOTAL FINLAND | | 21,293,676 |
France - 3.3% |
ALTEN | 108,019 | | 5,606,562 |
Common Stocks - continued |
| Shares | | Value |
France - continued |
Coface SA | 319,302 | | $ 2,585,300 |
Rexel SA | 251,900 | | 3,443,133 |
The Lisi Group | 143,009 | | 3,491,169 |
The Vicat Group (d) | 85,756 | | 5,497,782 |
Thermador Groupe SA | 26,557 | | 2,482,289 |
Wendel SA | 46,435 | | 5,573,444 |
TOTAL FRANCE | | 28,679,679 |
Germany - 3.4% |
AURELIUS AG | 103,235 | | 4,606,738 |
CompuGroup Medical AG | 199,249 | | 5,871,992 |
GEA Group AG | 72,166 | | 2,893,765 |
LEG Immobilien AG | 27,307 | | 2,178,542 |
LEONI AG | 125,097 | | 5,107,711 |
mutares AG | 113,000 | | 2,218,049 |
OSRAM Licht AG | 88,435 | | 5,203,716 |
SHW Group | 62,339 | | 1,633,230 |
TOTAL GERMANY | | 29,713,743 |
Greece - 0.4% |
Metka SA | 394,216 | | 3,784,452 |
Hong Kong - 1.9% |
Dah Sing Banking Group Ltd. | 2,745,600 | | 5,209,923 |
Far East Horizon Ltd. | 3,735,000 | | 3,106,680 |
Magnificent Estates Ltd. | 105,926,000 | | 3,000,694 |
Shun Ho Technology Holdings Ltd. (a) | 1,650,033 | | 563,312 |
Techtronic Industries Co. Ltd. | 1,264,000 | | 4,620,776 |
TOTAL HONG KONG | | 16,501,385 |
India - 0.6% |
Edelweiss Financial Services Ltd. | 3,486,519 | | 3,164,299 |
McLeod Russel India Ltd. (a) | 883,018 | | 2,317,244 |
TOTAL INDIA | | 5,481,543 |
Indonesia - 0.5% |
PT ACE Hardware Indonesia Tbk | 43,202,200 | | 2,103,157 |
PT Media Nusantara Citra Tbk | 16,013,700 | | 2,077,798 |
TOTAL INDONESIA | | 4,180,955 |
Ireland - 1.8% |
C&C Group PLC | 895,002 | | 3,572,606 |
Common Stocks - continued |
| Shares | | Value |
Ireland - continued |
Mincon Group PLC | 4,787,945 | | $ 3,474,942 |
United Drug PLC (United Kingdom) | 1,222,449 | | 8,955,274 |
TOTAL IRELAND | | 16,002,822 |
Isle of Man - 0.6% |
Optimal Payments PLC (a) | 1,050,400 | | 4,922,662 |
Israel - 1.1% |
Frutarom Industries Ltd. | 225,289 | | 9,735,555 |
Italy - 1.6% |
Banco di Desio e della Brianza SpA | 669,139 | | 2,289,868 |
Cerved Information Solutions SpA | 379,661 | | 2,880,710 |
Danieli & C. Officine Meccaniche SpA | 163,567 | | 3,500,201 |
Recordati SpA | 214,361 | | 5,329,676 |
TOTAL ITALY | | 14,000,455 |
Japan - 21.6% |
A/S One Corp. | 135,700 | | 4,816,903 |
Aeon Delight Co. Ltd. | 187,700 | | 5,407,309 |
Ain Holdings, Inc. | 97,300 | | 4,606,063 |
Arc Land Sakamoto Co. Ltd. | 180,700 | | 3,955,591 |
Broadleaf Co. Ltd. | 394,900 | | 4,523,418 |
Central Automotive Products Ltd. | 203,000 | | 1,477,932 |
Daiwa Industries Ltd. | 495,600 | | 3,278,728 |
Dexerials Corp. (d) | 292,400 | | 3,347,971 |
Fuji Corp. | 147,800 | | 2,784,103 |
Fukuda Denshi Co. Ltd. | 124,800 | | 6,089,695 |
Funai Soken Holdings, Inc. | 158,600 | | 2,433,164 |
GMO Internet, Inc. | 328,900 | | 4,658,251 |
Iida Group Holdings Co. Ltd. | 214,851 | | 4,026,924 |
JSR Corp. | 532,400 | | 8,408,353 |
KAWAI Musical Instruments Manufacturing Co. Ltd. | 203,600 | | 3,763,336 |
Kinugawa Rubber Industrial Co. Ltd. | 733,000 | | 4,088,732 |
Konica Minolta, Inc. | 228,400 | | 2,346,678 |
Kotobuki Spirits Co. Ltd. (d) | 79,100 | | 2,759,513 |
Leopalace21 Corp. (a) | 966,500 | | 5,149,440 |
Meitec Corp. | 145,700 | | 5,291,485 |
Message Co. Ltd. | 150,079 | | 3,699,108 |
Miraca Holdings, Inc. | 117,900 | | 5,247,173 |
Mitani Shoji Co. Ltd. | 244,700 | | 6,061,666 |
Monex Group, Inc. | 699,100 | | 1,965,183 |
Nihon House Holdings Co. Ltd. (d) | 1,020,700 | | 4,107,595 |
Nitori Holdings Co. Ltd. | 100,000 | | 7,797,893 |
Common Stocks - continued |
| Shares | | Value |
Japan - continued |
Paramount Bed Holdings Co. Ltd. | 195,000 | | $ 6,254,656 |
Ricoh Leasing Co. Ltd. | 232,900 | | 7,055,445 |
S Foods, Inc. (d) | 318,800 | | 5,541,613 |
San-Ai Oil Co. Ltd. | 589,000 | | 4,498,828 |
Shinsei Bank Ltd. | 2,824,000 | | 5,921,288 |
Ship Healthcare Holdings, Inc. | 202,200 | | 4,897,936 |
TKC Corp. | 336,500 | | 7,931,814 |
Toshiba Plant Systems & Services Corp. | 582,700 | | 6,241,559 |
Toyo Suisan Kaisha Ltd. | 116,900 | | 4,307,506 |
Tsuruha Holdings, Inc. | 104,800 | | 8,302,681 |
VT Holdings Co. Ltd. | 1,047,600 | | 6,478,390 |
Welcia Holdings Co. Ltd. | 77,700 | | 3,829,463 |
Yamada Consulting Group Co. Ltd. | 174,600 | | 5,110,414 |
TOTAL JAPAN | | 188,463,800 |
Korea (South) - 1.8% |
BGFretail Co. Ltd. | 17,709 | | 2,636,722 |
DGB Financial Group Co. Ltd. | 207,259 | | 1,924,158 |
Fila Korea Ltd. | 38,617 | | 3,382,205 |
Hy-Lok Corp. | 125,792 | | 3,514,512 |
Nice Information & Telecom, Inc. | 77,649 | | 2,920,925 |
NS Shopping Co. Ltd. | 7,760 | | 1,321,912 |
TOTAL KOREA (SOUTH) | | 15,700,434 |
Luxembourg - 0.8% |
Grand City Properties SA | 347,584 | | 6,941,129 |
Netherlands - 1.5% |
Amsterdam Commodities NV | 196,055 | | 4,934,898 |
BinckBank NV | 282,659 | | 2,493,446 |
IMCD Group BV | 142,000 | | 5,312,233 |
TOTAL NETHERLANDS | | 12,740,577 |
New Zealand - 2.0% |
EBOS Group Ltd. | 1,083,656 | | 10,016,335 |
Nuplex Industries Ltd. | 2,586,561 | | 7,461,346 |
TOTAL NEW ZEALAND | | 17,477,681 |
Norway - 1.9% |
ABG Sundal Collier ASA | 6,615,910 | | 4,983,296 |
Ekornes A/S | 331,597 | | 3,531,883 |
Common Stocks - continued |
| Shares | | Value |
Norway - continued |
Kongsberg Gruppen ASA | 329,633 | | $ 5,159,760 |
Spectrum ASA | 809,572 | | 2,810,766 |
TOTAL NORWAY | | 16,485,705 |
Portugal - 0.6% |
NOS SGPS SA | 624,100 | | 5,187,678 |
Romania - 0.4% |
Banca Transilvania SA (a) | 5,501,626 | | 3,458,855 |
Singapore - 2.3% |
Boustead Projects Pte Ltd. (a) | 618,906 | | 373,131 |
Boustead Singapore Ltd. | 2,099,820 | | 1,435,462 |
Hour Glass Ltd. | 7,926,700 | | 4,133,891 |
Interplex Holdings Ltd. | 6,290,400 | | 3,167,667 |
Mapletree Industrial (REIT) | 2,939,230 | | 3,197,260 |
OSIM International Ltd. | 3,306,600 | | 3,206,109 |
Wing Tai Holdings Ltd. | 3,973,100 | | 4,944,223 |
TOTAL SINGAPORE | | 20,457,743 |
South Africa - 0.8% |
Clicks Group Ltd. | 977,850 | | 7,143,626 |
Spain - 0.5% |
Hispania Activos Inmobiliarios SA (a) | 315,800 | | 4,757,592 |
Sweden - 0.9% |
AddTech AB (B Shares) | 198,619 | | 2,824,611 |
Coor Service Management Holding AB (a) | 474,600 | | 1,938,719 |
Ratos AB (B Shares) | 582,000 | | 3,406,078 |
TOTAL SWEDEN | | 8,169,408 |
Switzerland - 3.9% |
Allied World Assurance Co. Holdings AG | 214,004 | | 7,781,185 |
Daetwyler Holdings AG | 18,222 | | 2,556,924 |
Pargesa Holding SA | 75,506 | | 4,797,184 |
Vontobel Holdings AG | 199,296 | | 9,829,207 |
VZ Holding AG | 30,391 | | 9,469,804 |
TOTAL SWITZERLAND | | 34,434,304 |
Taiwan - 2.0% |
King's Town Bank | 3,141,000 | | 2,505,834 |
Sunspring Metal Corp. | 3,075,000 | | 4,418,566 |
Tripod Technology Corp. | 2,498,000 | | 3,862,609 |
Common Stocks - continued |
| Shares | | Value |
Taiwan - continued |
Vanguard International Semiconductor Corp. | 3,124,000 | | $ 4,036,710 |
Yung Chi Paint & Varnish Manufacturing Co. Ltd. | 1,109,000 | | 2,281,879 |
TOTAL TAIWAN | | 17,105,598 |
Thailand - 1.0% |
Delta Electronics PCL (For. Reg.) | 2,473,600 | | 5,877,746 |
TISCO Financial Group PCL | 2,495,800 | | 2,649,779 |
TOTAL THAILAND | | 8,527,525 |
Turkey - 0.4% |
Aygaz A/S | 864,000 | | 3,245,112 |
United Kingdom - 14.5% |
Aberdeen Asset Management PLC | 715,349 | | 3,823,345 |
AEW UK REIT PLC (a) | 2,258,268 | | 3,516,159 |
Alliance Pharma PLC | 1,734,982 | | 1,430,937 |
Amec Foster Wheeler PLC | 453,315 | | 4,968,684 |
Ashmore Group PLC (d) | 1,036,507 | | 4,314,274 |
BBA Aviation PLC | 2,224,598 | | 6,539,943 |
Bond International Software PLC | 899,666 | | 1,407,729 |
Brammer PLC (d) | 584,028 | | 2,073,027 |
Brewin Dolphin Holding PLC | 881,475 | | 3,668,981 |
Cineworld Group PLC | 695,276 | | 5,916,543 |
Close Brothers Group PLC | 290,880 | | 6,564,878 |
Countrywide PLC | 1,008,607 | | 7,230,139 |
Diploma PLC | 363,251 | | 3,592,321 |
Elementis PLC | 1,017,200 | | 3,678,799 |
Empiric Student Property PLC | 1,607,263 | | 2,713,144 |
Exova Group Ltd. PLC | 887,869 | | 2,035,999 |
Informa PLC | 842,548 | | 7,377,593 |
ITE Group PLC | 1,632,554 | | 3,529,735 |
James Fisher and Sons PLC | 120,505 | | 1,782,468 |
Luxfer Holdings PLC sponsored ADR | 428,009 | | 4,635,337 |
McColl's Retail Group PLC | 1,571,774 | | 3,561,879 |
Mears Group PLC | 1,047,710 | | 6,686,720 |
Meggitt PLC | 519,830 | | 2,833,644 |
Melrose PLC | 796,270 | | 3,267,684 |
Micro Focus International PLC | 476,044 | | 9,217,400 |
Moneysupermarket.com Group PLC | 778,475 | | 4,010,724 |
Sinclair Pharma PLC (a) | 6,551,214 | | 3,963,995 |
Spectris PLC | 189,347 | | 4,865,929 |
Ultra Electronics Holdings PLC | 278,425 | | 7,223,772 |
TOTAL UNITED KINGDOM | | 126,431,782 |
Common Stocks - continued |
| Shares | | Value |
United States of America - 1.2% |
Dillard's, Inc. Class A (d) | 89,894 | | $ 8,043,715 |
Hornbeck Offshore Services, Inc. (a)(d) | 152,170 | | 2,055,817 |
YOU On Demand Holdings, Inc. warrants 8/30/17 (a)(e) | 27,500 | | 3,207 |
TOTAL UNITED STATES OF AMERICA | | 10,102,739 |
TOTAL COMMON STOCKS (Cost $824,215,309) |
824,878,586
|
Nonconvertible Preferred Stocks - 0.2% |
| | | |
Brazil - 0.2% |
Banco ABC Brasil SA
(Cost $3,684,071) | 998,200 | |
2,200,075
|
Money Market Funds - 6.7% |
| | | |
Fidelity Cash Central Fund, 0.18% (b) | 45,030,641 | | 45,030,641 |
Fidelity Securities Lending Cash Central Fund, 0.19% (b)(c) | 13,666,537 | | 13,666,537 |
TOTAL MONEY MARKET FUNDS (Cost $58,697,178) |
58,697,178
|
TOTAL INVESTMENT PORTFOLIO - 101.3% (Cost $886,596,558) | | 885,775,839 |
NET OTHER ASSETS (LIABILITIES) - (1.3)% | | (11,784,036) |
NET ASSETS - 100% | $ 873,991,803 |
Legend |
(a) Non-income producing |
(b) Affiliated fund that is generally available only to investment companies and other accounts managed by Fidelity Investments. The rate quoted is the annualized seven-day yield of the fund at period end. A complete unaudited listing of the fund's holdings as of its most recent quarter end is available upon request. In addition, each Fidelity Central Fund's financial statements, which are not covered by the Fund's Report of Independent Registered Public Accounting Firm, are available on the SEC's website or upon request. |
(c) Investment made with cash collateral received from securities on loan. |
(d) Security or a portion of the security is on loan at period end. |
(e) Restricted securities - Investment in securities not registered under the Securities Act of 1933 (excluding 144A issues). At the end of the period, the value of restricted securities (excluding 144A issues) amounted to $3,207 or 0.0% of net assets. |
Additional information on each restricted holding is as follows: |
Security | Acquisition Date | Acquisition Cost |
YOU On Demand Holdings, Inc. warrants 8/30/17 | 9/14/12 | $ 0 |
Affiliated Central Funds |
Information regarding fiscal year to date income earned by the Fund from investments in Fidelity Central Funds is as follows: |
Fund | Income earned |
Fidelity Cash Central Fund | $ 61,602 |
Fidelity Securities Lending Cash Central Fund | 186,310 |
Total | $ 247,912 |
Other Information |
Categorizations in the Schedule of Investments are based on country or territory of incorporation. |
The following is a summary of the inputs used, as of October 31, 2015, involving the Fund's assets and liabilities carried at fair value. The inputs or methodology used for valuing securities may not be an indication of the risk associated with investing in those securities. For more information on valuation inputs, and their aggregation into the levels used in the table below, please refer to the Investment Valuation section in the accompanying Notes to Financial Statements. |
Valuation Inputs at Reporting Date: |
Description | Total | Level 1 | Level 2 | Level 3 |
Investments in Securities: | | | | |
Equities: | | | | |
Consumer Discretionary | $ 141,245,837 | $ 64,736,053 | $ 76,509,784 | $ - |
Consumer Staples | 66,734,541 | 35,070,458 | 31,664,083 | - |
Energy | 30,551,732 | 24,617,442 | 5,934,290 | - |
Financials | 197,971,252 | 145,172,798 | 52,798,454 | - |
Health Care | 73,624,858 | 35,568,209 | 38,056,649 | - |
Industrials | 167,680,599 | 118,410,225 | 49,270,374 | - |
Information Technology | 85,300,783 | 56,614,904 | 28,685,878 | 1 |
Materials | 60,723,947 | 42,001,206 | 18,722,740 | 1 |
Utilities | 3,245,112 | 3,245,112 | - | - |
Money Market Funds | 58,697,178 | 58,697,178 | - | - |
Total Investments in Securities: | $ 885,775,839 | $ 584,133,585 | $ 301,642,252 | $ 2 |
See accompanying notes which are an integral part of the financial statements.
Annual Report
Statement of Assets and Liabilities
| | October 31, 2015 |
| | |
Assets | | |
Investment in securities, at value (including securities loaned of $13,124,402) - See accompanying schedule: Unaffiliated issuers (cost $827,899,380) | $ 827,078,661 | |
Fidelity Central Funds (cost $58,697,178) | 58,697,178 | |
Total Investments (cost $886,596,558) | | $ 885,775,839 |
Foreign currency held at value (cost $115,306) | | 115,322 |
Receivable for investments sold | | 948,925 |
Receivable for fund shares sold | | 837,702 |
Dividends receivable | | 2,340,869 |
Distributions receivable from Fidelity Central Funds | | 31,829 |
Prepaid expenses | | 2,402 |
Other receivables | | 19,677 |
Total assets | | 890,072,565 |
| | |
Liabilities | | |
Payable for investments purchased | $ 376,272 | |
Payable for fund shares redeemed | 907,673 | |
Accrued management fee | 738,433 | |
Distribution and service plan fees payable | 20,677 | |
Other affiliated payables | 222,027 | |
Other payables and accrued expenses | 149,143 | |
Collateral on securities loaned, at value | 13,666,537 | |
Total liabilities | | 16,080,762 |
| | |
Net Assets | | $ 873,991,803 |
Net Assets consist of: | | |
Paid in capital | | $ 847,993,485 |
Undistributed net investment income | | 10,946,744 |
Accumulated undistributed net realized gain (loss) on investments and foreign currency transactions | | 15,943,085 |
Net unrealized appreciation (depreciation) on investments and assets and liabilities in foreign currencies | | (891,511) |
Net Assets | | $ 873,991,803 |
See accompanying notes which are an integral part of the financial statements.
Annual Report
Financial Statements - continued
Statement of Assets and Liabilities - continued
| | October 31, 2015 |
| | |
Calculation of Maximum Offering Price | | |
Class A: | | |
Net Asset Value and redemption price per share ($28,237,702 ÷ 1,244,283 shares) | | $ 22.69 |
| | |
Maximum offering price per share (100/94.25 of $22.69) | | $ 24.07 |
Class T: | | |
Net Asset Value and redemption price per share ($12,400,336 ÷ 549,894 shares) | | $ 22.55 |
| | |
Maximum offering price per share (100/96.50 of $22.55) | | $ 23.37 |
Class B: | | |
Net Asset Value and offering price per share ($390,361 ÷ 17,567 shares)A | | $ 22.22 |
| | |
Class C: | | |
Net Asset Value and offering price per share ($11,358,829 ÷ 517,141 shares)A | | $ 21.96 |
| | |
International Small Cap: | | |
Net Asset Value, offering price and redemption price per share ($811,534,198 ÷ 35,197,499 shares) | | $ 23.06 |
| | |
Class I: | | |
Net Asset Value, offering price and redemption price per share ($10,070,377 ÷ 433,304 shares) | | $ 23.24 |
A Redemption price per share is equal to net asset value less any applicable contingent deferred sales charge.
See accompanying notes which are an integral part of the financial statements.
Annual Report
Statement of Operations
| Year ended October 31, 2015 |
| | |
Investment Income | | |
Dividends | | $ 24,896,176 |
Interest | | 1,298 |
Income from Fidelity Central Funds | | 247,912 |
Income before foreign taxes withheld | | 25,145,386 |
Less foreign taxes withheld | | (1,896,045) |
Total income | | 23,249,341 |
| | |
Expenses | | |
Management fee | | |
Basic fee | $ 7,137,575 | |
Performance adjustment | 971,956 | |
Transfer agent fees | 2,147,993 | |
Distribution and service plan fees | 233,938 | |
Accounting and security lending fees | 403,900 | |
Custodian fees and expenses | 150,183 | |
Independent trustees' compensation | 3,595 | |
Registration fees | 91,083 | |
Audit | 156,053 | |
Legal | 2,634 | |
Miscellaneous | 8,119 | |
Total expenses before reductions | 11,307,029 | |
Expense reductions | (56,111) | 11,250,918 |
Net investment income (loss) | | 11,998,423 |
Realized and Unrealized Gain (Loss) | | |
Net realized gain (loss) on: | | |
Investment securities: | | |
Unaffiliated issuers (net of foreign taxes of $109,783) | 26,169,495 | |
Foreign currency transactions | (331,089) | |
Total net realized gain (loss) | | 25,838,406 |
Change in net unrealized appreciation (depreciation) on: Investment securities (net of decrease in deferred foreign taxes of $51,983) | 6,843,800 | |
Assets and liabilities in foreign currencies | (19,076) | |
Total change in net unrealized appreciation (depreciation) | | 6,824,724 |
Net gain (loss) | | 32,663,130 |
Net increase (decrease) in net assets resulting from operations | | $ 44,661,553 |
See accompanying notes which are an integral part of the financial statements.
Annual Report
Financial Statements - continued
Statement of Changes in Net Assets
| Year ended
October 31,
2015 | Year ended
October 31,
2014 |
Increase (Decrease) in Net Assets | | |
Operations | | |
Net investment income (loss) | $ 11,998,423 | $ 10,368,645 |
Net realized gain (loss) | 25,838,406 | 226,736,010 |
Change in net unrealized appreciation (depreciation) | 6,824,724 | (253,669,311) |
Net increase (decrease) in net assets resulting from operations | 44,661,553 | (16,564,656) |
Distributions to shareholders from net investment income | (7,662,528) | (4,012,676) |
Distributions to shareholders from net realized gain | (116,906,834) | (26,257,450) |
Total distributions | (124,569,362) | (30,270,126) |
Share transactions - net increase (decrease) | 53,722,708 | (201,807,331) |
Redemption fees | 103,111 | 276,780 |
Total increase (decrease) in net assets | (26,081,990) | (248,365,333) |
| | |
Net Assets | | |
Beginning of period | 900,073,793 | 1,148,439,126 |
End of period (including undistributed net investment income of $10,946,744 and undistributed net investment income of $7,150,729, respectively) | $ 873,991,803 | $ 900,073,793 |
See accompanying notes which are an integral part of the financial statements.
Annual Report
Financial Highlights - Fidelity International Small Cap Fund Class A
Years ended October 31, | 2015 | 2014 | 2013 | 2012 | 2011 |
Selected Per-Share Data | | | | | |
Net asset value, beginning of period | $ 24.98 | $ 26.34 | $ 19.74 | $ 18.97 | $ 20.42 |
Income from Investment Operations | | | | | |
Net investment income (loss)C | .27 | .17 | .06 | .06 | .10 |
Net realized and unrealized gain (loss) | 1.05 | (.89) | 6.94 | 1.09 | (.88) |
Total from investment operations | 1.32 | (.72) | 7.00 | 1.15 | (.78) |
Distributions from net investment income | (.16) | (.05) | (.07) | (.11) | (.02) |
Distributions from net realized gain | (3.45) | (.60) | (.33) | (.27) | (.66) |
Total distributions | (3.61) | (.65) | (.40) | (.38) | (.68) |
Redemption fees added to paid in capitalC | - G | .01 | - G | - G | .01 |
Net asset value, end of period | $ 22.69 | $ 24.98 | $ 26.34 | $ 19.74 | $ 18.97 |
Total ReturnA, B | 6.21% | (2.79)% | 36.18% | 6.28% | (4.00)% |
Ratios to Average Net AssetsE, F | | | | | |
Expenses before reductions | 1.59% | 1.50% | 1.61% | 1.63% | 1.56% |
Expenses net of fee waivers, if any | 1.58% | 1.50% | 1.61% | 1.63% | 1.55% |
Expenses net of all reductions | 1.58% | 1.50% | 1.60% | 1.60% | 1.54% |
Net investment income (loss) | 1.18% | .65% | .25% | .32% | .49% |
Supplemental Data | | | | | |
Net assets, end of period (000 omitted) | $ 28,238 | $ 24,572 | $ 24,020 | $ 14,125 | $ 17,185 |
Portfolio turnover rateD | 36% | 102% | 54% | 68% | 47% |
A Total returns would have been lower if certain expenses had not been reduced during the applicable periods shown.
B Total returns do not include the effect of the sales charges.
C Calculated based on average shares outstanding during the period.
D Amounts do not include the activity of the Underlying Funds.
E Fees and expenses of any underlying Fidelity Central Funds are not included in the Fund's expense ratio. The Fund indirectly bears its proportionate share of the expenses of any underlying Fidelity Central Funds.
F Expense ratios reflect operating expenses of the class. Expenses before reductions do not reflect amounts reimbursed by the investment adviser or reductions from brokerage service arrangements or reductions from other expense offset arrangements and do not represent the amount paid by the class during periods when reimbursements or reductions occur. Expenses net of fee waivers reflect expenses after reimbursement by the investment adviser but prior to reductions from brokerage service arrangements or other expense offset arrangements. Expenses net of all reductions represent the net expenses paid by the class.
G Amount represents less than $.005 per share.
See accompanying notes which are an integral part of the financial statements.
Annual Report
Financial Highlights - Fidelity International Small Cap Fund Class T
Years ended October 31, | 2015 | 2014 | 2013 | 2012 | 2011 |
Selected Per-Share Data | | | | | |
Net asset value, beginning of period | $ 24.81 | $ 26.17 | $ 19.59 | $ 18.80 | $ 20.23 |
Income from Investment Operations | | | | | |
Net investment income (loss)C | .21 | .10 | - G | .01 | .05 |
Net realized and unrealized gain (loss) | 1.04 | (.87) | 6.90 | 1.08 | (.86) |
Total from investment operations | 1.25 | (.77) | 6.90 | 1.09 | (.81) |
Distributions from net investment income | (.06) | - | - | (.03) | - |
Distributions from net realized gain | (3.45) | (.60) | (.32) | (.27) | (.63) |
Total distributions | (3.51) | (.60) | (.32) | (.30) | (.63) |
Redemption fees added to paid in capitalC | - G | .01 | - G | - G | .01 |
Net asset value, end of period | $ 22.55 | $ 24.81 | $ 26.17 | $ 19.59 | $ 18.80 |
Total ReturnA, B | 5.90% | (3.00)% | 35.80% | 5.97% | (4.18)% |
Ratios to Average Net AssetsE, F | | | | | |
Expenses before reductions | 1.87% | 1.77% | 1.87% | 1.88% | 1.82% |
Expenses net of fee waivers, if any | 1.86% | 1.77% | 1.87% | 1.88% | 1.81% |
Expenses net of all reductions | 1.86% | 1.76% | 1.85% | 1.85% | 1.79% |
Net investment income (loss) | .90% | .38% | (.01)% | .07% | .24% |
Supplemental Data | | | | | |
Net assets, end of period (000 omitted) | $ 12,400 | $ 12,296 | $ 13,530 | $ 9,262 | $ 13,744 |
Portfolio turnover rateD | 36% | 102% | 54% | 68% | 47% |
A Total returns would have been lower if certain expenses had not been reduced during the applicable periods shown.
B Total returns do not include the effect of the sales charges.
C Calculated based on average shares outstanding during the period.
D Amounts do not include the activity of the Underlying Funds.
E Fees and expenses of any underlying Fidelity Central Funds are not included in the Fund's expense ratio. The Fund indirectly bears its proportionate share of the expenses of any underlying Fidelity Central Funds.
F Expense ratios reflect operating expenses of the class. Expenses before reductions do not reflect amounts reimbursed by the investment adviser or reductions from brokerage service arrangements or reductions from other expense offset arrangements and do not represent the amount paid by the class during periods when reimbursements or reductions occur. Expenses net of fee waivers reflect expenses after reimbursement by the investment adviser but prior to reductions from brokerage service arrangements or other expense offset arrangements. Expenses net of all reductions represent the net expenses paid by the class.
G Amount represents less than $.005 per share.
See accompanying notes which are an integral part of the financial statements.
Annual Report
Financial Highlights - Fidelity International Small Cap Fund Class B
Years ended October 31, | 2015 | 2014 | 2013 | 2012 | 2011 |
Selected Per-Share Data | | | | | |
Net asset value, beginning of period | $ 24.51 | $ 25.87 | $ 19.22 | $ 18.38 | $ 19.79 |
Income from Investment Operations | | | | | |
Net investment income (loss)C | .09 | (.03) | (.11) | (.08) | (.05) |
Net realized and unrealized gain (loss) | 1.04 | (.87) | 6.84 | 1.07 | (.85) |
Total from investment operations | 1.13 | (.90) | 6.73 | .99 | (.90) |
Distributions from net realized gain | (3.42) | (.47) | (.08) | (.15) | (.52) |
Redemption fees added to paid in capitalC | - G | .01 | - G | - G | .01 |
Net asset value, end of period | $ 22.22 | $ 24.51 | $ 25.87 | $ 19.22 | $ 18.38 |
Total ReturnA, B | 5.40% | (3.52)% | 35.14% | 5.45% | (4.68)% |
Ratios to Average Net AssetsE, F | | | | | |
Expenses before reductions | 2.36% | 2.28% | 2.37% | 2.38% | 2.32% |
Expenses net of fee waivers, if any | 2.36% | 2.28% | 2.36% | 2.38% | 2.30% |
Expenses net of all reductions | 2.36% | 2.27% | 2.35% | 2.35% | 2.29% |
Net investment income (loss) | .41% | (.13)% | (.51)% | (.43)% | (.26)% |
Supplemental Data | | | | | |
Net assets, end of period (000 omitted) | $ 390 | $ 507 | $ 795 | $ 790 | $ 2,067 |
Portfolio turnover rateD | 36% | 102% | 54% | 68% | 47% |
A Total returns would have been lower if certain expenses had not been reduced during the applicable periods shown.
B Total returns do not include the effect of the contingent deferred sales charge.
C Calculated based on average shares outstanding during the period.
D Amounts do not include the activity of the Underlying Funds.
E Fees and expenses of any underlying Fidelity Central Funds are not included in the Fund's expense ratio. The Fund indirectly bears its proportionate share of the expenses of any underlying Fidelity Central Funds.
F Expense ratios reflect operating expenses of the class. Expenses before reductions do not reflect amounts reimbursed by the investment adviser or reductions from brokerage service arrangements or reductions from other expense offset arrangements and do not represent the amount paid by the class during periods when reimbursements or reductions occur. Expenses net of fee waivers reflect expenses after reimbursement by the investment adviser but prior to reductions from brokerage service arrangements or other expense offset arrangements. Expenses net of all reductions represent the net expenses paid by the class.
G Amount represents less than $.005 per share.
See accompanying notes which are an integral part of the financial statements.
Annual Report
Financial Highlights - Fidelity International Small Cap Fund Class C
Years ended October 31, | 2015 | 2014 | 2013 | 2012 | 2011 |
Selected Per-Share Data | | | | | |
Net asset value, beginning of period | $ 24.27 | $ 25.68 | $ 19.18 | $ 18.38 | $ 19.85 |
Income from Investment Operations | | | | | |
Net investment income (loss)C | .09 | (.02) | (.11) | (.08) | (.04) |
Net realized and unrealized gain (loss) | 1.02 | (.85) | 6.79 | 1.07 | (.85) |
Total from investment operations | 1.11 | (.87) | 6.68 | .99 | (.89) |
Distributions from net realized gain | (3.42) | (.55) | (.18) | (.19) | (.59) |
Redemption fees added to paid in capitalC | - G | .01 | - G | - G | .01 |
Net asset value, end of period | $ 21.96 | $ 24.27 | $ 25.68 | $ 19.18 | $ 18.38 |
Total ReturnA, B | 5.37% | (3.43)% | 35.15% | 5.46% | (4.64)% |
Ratios to Average Net AssetsE, F | | | | | |
Expenses before reductions | 2.36% | 2.23% | 2.33% | 2.38% | 2.27% |
Expenses net of fee waivers, if any | 2.35% | 2.22% | 2.33% | 2.38% | 2.26% |
Expenses net of all reductions | 2.35% | 2.22% | 2.32% | 2.35% | 2.24% |
Net investment income (loss) | .41% | (.07)% | (.47)% | (.43)% | (.21)% |
Supplemental Data | | | | | |
Net assets, end of period (000 omitted) | $ 11,359 | $ 12,576 | $ 13,426 | $ 6,799 | $ 9,545 |
Portfolio turnover rateD | 36% | 102% | 54% | 68% | 47% |
A Total returns would have been lower if certain expenses had not been reduced during the applicable periods shown.
B Total returns do not include the effect of the contingent deferred sales charge.
C Calculated based on average shares outstanding during the period.
D Amounts do not include the activity of the Underlying Funds.
E Fees and expenses of any underlying Fidelity Central Funds are not included in the Fund's expense ratio. The Fund indirectly bears its proportionate share of the expenses of any underlying Fidelity Central Funds.
F Expense ratios reflect operating expenses of the class. Expenses before reductions do not reflect amounts reimbursed by the investment adviser or reductions from brokerage service arrangements or reductions from other expense offset arrangements and do not represent the amount paid by the class during periods when reimbursements or reductions occur. Expenses net of fee waivers reflect expenses after reimbursement by the investment adviser but prior to reductions from brokerage service arrangements or other expense offset arrangements. Expenses net of all reductions represent the net expenses paid by the class.
G Amount represents less than $.005 per share.
See accompanying notes which are an integral part of the financial statements.
Annual Report
Financial Highlights - Fidelity International Small Cap Fund
Years ended October 31, | 2015 | 2014 | 2013 | 2012 | 2011 |
Selected Per-Share Data | | | | | |
Net asset value, beginning of period | $ 25.34 | $ 26.67 | $ 19.99 | $ 19.23 | $ 20.66 |
Income from Investment Operations | | | | | |
Net investment income (loss)B | .34 | .25 | .12 | .11 | .17 |
Net realized and unrealized gain (loss) | 1.07 | (.90) | 7.02 | 1.10 | (.89) |
Total from investment operations | 1.41 | (.65) | 7.14 | 1.21 | (.72) |
Distributions from net investment income | (.24) | (.09) | (.14) | (.18) | (.06) |
Distributions from net realized gain | (3.45) | (.60) | (.33) | (.27) | (.66) |
Total distributions | (3.69) | (.69) | (.46) G | (.45) | (.72) |
Redemption fees added to paid in capitalB | - F | .01 | - F | - F | .01 |
Net asset value, end of period | $ 23.06 | $ 25.34 | $ 26.67 | $ 19.99 | $ 19.23 |
Total ReturnA | 6.53% | (2.48)% | 36.56% | 6.55% | (3.65)% |
Ratios to Average Net AssetsD, E | | | | | |
Expenses before reductions | 1.31% | 1.21% | 1.33% | 1.35% | 1.26% |
Expenses net of fee waivers, if any | 1.31% | 1.20% | 1.32% | 1.35% | 1.25% |
Expenses net of all reductions | 1.31% | 1.20% | 1.31% | 1.33% | 1.23% |
Net investment income (loss) | 1.45% | .95% | .53% | .59% | .80% |
Supplemental Data | | | | | |
Net assets, end of period (000 omitted) | $ 811,534 | $ 842,031 | $ 1,029,629 | $ 692,769 | $ 856,692 |
Portfolio turnover rateC | 36% | 102% | 54% | 68% | 47% |
A Total returns would have been lower if certain expenses had not been reduced during the applicable periods shown.
B Calculated based on average shares outstanding during the period.
C Amounts do not include the activity of the Underlying Funds.
D Fees and expenses of any underlying Fidelity Central Funds are not included in the Fund's expense ratio. The Fund indirectly bears its proportionate share of the expenses of any underlying Fidelity Central Funds.
E Expense ratios reflect operating expenses of the class. Expenses before reductions do not reflect amounts reimbursed by the investment adviser or reductions from brokerage service arrangements or reductions from other expense offset arrangements and do not represent the amount paid by the class during periods when reimbursements or reductions occur. Expenses net of fee waivers reflect expenses after reimbursement by the investment adviser but prior to reductions from brokerage service arrangements or other expense offset arrangements. Expenses net of all reductions represent the net expenses paid by the class.
F Amount represents less than $.005 per share.
G Total distributions of $.46 per share is comprised of distributions from net investment income of $.136 and distributions from net realized gain of $.327 per share.
See accompanying notes which are an integral part of the financial statements.
Annual Report
Financial Highlights - Fidelity International Small Cap Fund Class I
Years ended October 31, | 2015 | 2014 | 2013 | 2012 | 2011 |
Selected Per-Share Data | | | | | |
Net asset value, beginning of period | $ 25.34 | $ 26.67 | $ 20.00 | $ 19.24 | $ 20.66 |
Income from Investment Operations | | | | | |
Net investment income (loss)B | .36 | .29 | .16 | .13 | .18 |
Net realized and unrealized gain (loss) | 1.07 | (.90) | 7.00 | 1.10 | (.89) |
Total from investment operations | 1.43 | (.61) | 7.16 | 1.23 | (.71) |
Distributions from net investment income | (.08) | (.13) | (.16) | (.20) | (.06) |
Distributions from net realized gain | (3.45) | (.60) | (.33) | (.27) | (.66) |
Total distributions | (3.53) | (.73) | (.49) | (.47) | (.72) |
Redemption fees added to paid in capitalB | - F | .01 | - F | - F | .01 |
Net asset value, end of period | $ 23.24 | $ 25.34 | $ 26.67 | $ 20.00 | $ 19.24 |
Total ReturnA | 6.60% | (2.35)% | 36.68% | 6.65% | (3.62)% |
Ratios to Average Net AssetsD, E | | | | | |
Expenses before reductions | 1.24% | 1.08% | 1.20% | 1.25% | 1.22% |
Expenses net of fee waivers, if any | 1.23% | 1.08% | 1.20% | 1.25% | 1.21% |
Expenses net of all reductions | 1.23% | 1.08% | 1.18% | 1.22% | 1.19% |
Net investment income (loss) | 1.53% | 1.07% | .66% | .70% | .84% |
Supplemental Data | | | | | |
Net assets, end of period (000 omitted) | $ 10,070 | $ 8,092 | $ 67,038 | $ 9,503 | $ 15,752 |
Portfolio turnover rateC | 36% | 102% | 54% | 68% | 47% |
A Total returns would have been lower if certain expenses had not been reduced during the applicable periods shown.
B Calculated based on average shares outstanding during the period.
C Amounts do not include the activity of the Underlying Funds.
D Fees and expenses of any underlying Fidelity Central Funds are not included in the Fund's expense ratio. The Fund indirectly bears its proportionate share of the expenses of any underlying Fidelity Central Funds.
E Expense ratios reflect operating expenses of the class. Expenses before reductions do not reflect amounts reimbursed by the investment adviser or reductions from brokerage service arrangements or reductions from other expense offset arrangements and do not represent the amount paid by the class during periods when reimbursements or reductions occur. Expenses net of fee waivers reflect expenses after reimbursement by the investment adviser but prior to reductions from brokerage service arrangements or other expense offset arrangements. Expenses net of all reductions represent the net expenses paid by the class.
F Amount represents less than $.005 per share.
See accompanying notes which are an integral part of the financial statements.
Annual Report
For the period ended October 31, 2015
1. Organization.
Fidelity International Small Cap Fund (the Fund) is a fund of Fidelity Investment Trust (the Trust) and is authorized to issue an unlimited number of shares. The Trust is registered under the Investment Company Act of 1940, as amended (the 1940 Act), as an open-end management investment company organized as a Massachusetts business trust. The Fund offers Class A, Class T, Class C, International Small Cap and Class I (formerly Institutional Class) shares, each of which, along with Class B shares, has equal rights as to assets and voting privileges. Class B shares are closed to new accounts and additional purchases, except for exchanges and reinvestments. Each class has exclusive voting rights with respect to matters that affect that class. Class B shares will automatically convert to Class A shares after a holding period of seven years from the initial date of purchase. The Fund's investments in emerging markets can be subject to social, economic, regulatory, and political uncertainties and can be extremely volatile.
2. Investments in Fidelity Central Funds.
The Fund invests in Fidelity Central Funds, which are open-end investment companies generally available only to other investment companies and accounts managed by the investment adviser and its affiliates. The Fund's Schedule of Investments lists each of the Fidelity Central Funds held as of period end, if any, as an investment of the Fund, but does not include the underlying holdings of each Fidelity Central Fund. As an Investing Fund, the Fund indirectly bears its proportionate share of the expenses of the underlying Fidelity Central Funds.
The Money Market Central Funds seek preservation of capital and current income and are managed by Fidelity Investments Money Management, Inc. (FIMM), an affiliate of the investment adviser. Annualized expenses of the Money Market Central Funds as of their most recent shareholder report date are less than .005%.
A complete unaudited list of holdings for each Fidelity Central Fund is available upon request or at the Securities and Exchange Commission (the SEC) website at www.sec.gov. In addition, the financial statements of the Fidelity Central Funds, which are not covered by the Fund's Report of Independent Registered Public Accounting Firm, are available on the SEC website or upon request.
3. Significant Accounting Policies.
The financial statements have been prepared in conformity with accounting principles generally accepted in the United States of America (GAAP), which require management to make certain estimates and assumptions at the date of the financial statements. Actual results could differ from those estimates. Subsequent events, if any, through the date that the financial statements were issued have been evaluated in the preparation of
Annual Report
Notes to Financial Statements - continued
3. Significant Accounting Policies - continued
the financial statements. The following summarizes the significant accounting policies of the Fund:
Investment Valuation. Investments are valued as of 4:00 p.m. Eastern time on the last calendar day of the period. The Board of Trustees (the Board) has delegated the day to day responsibility for the valuation of the Fund's investments to the Fidelity Management & Research Company (FMR) Fair Value Committee (the Committee). In accordance with valuation policies and procedures approved by the Board, the Fund attempts to obtain prices from one or more third party pricing vendors or brokers to value its investments. When current market prices, quotations or currency exchange rates are not readily available or reliable, investments will be fair valued in good faith by the Committee, in accordance with procedures adopted by the Board. Factors used in determining fair value vary by investment type and may include market or investment specific events. The frequency with which these procedures are used cannot be predicted and they may be utilized to a significant extent. The Committee oversees the Fund's valuation policies and procedures and reports to the Board on the Committee's activities and fair value determinations. The Board monitors the appropriateness of the procedures used in valuing the Fund's investments and ratifies the fair value determinations of the Committee.
The Fund categorizes the inputs to valuation techniques used to value its investments into a disclosure hierarchy consisting of three levels as shown below:
Level 1 - quoted prices in active markets for identical investments
Level 2 - other significant observable inputs (including quoted prices for similar investments, interest rates, prepayment speeds, etc.)
Level 3 - unobservable inputs (including the Fund's own assumptions based on the best information available)
Valuation techniques used to value the Fund's investments by major category are as follows:
Equity securities, including restricted securities, for which market quotations are readily available, are valued at the last reported sale price or official closing price as reported by a third party pricing vendor on the primary market or exchange on which they are traded and are categorized as Level 1 in the hierarchy. In the event there were no sales during the day or closing prices are not available, securities are valued at the last quoted bid price or may be valued using the last available price and are generally categorized as Level 2 in the hierarchy. For foreign equity securities, when market or security specific events arise, comparisons to the valuation of American Depositary Receipts (ADRs), futures contracts, Exchange-Traded Funds (ETFs) and certain indexes as well as quoted
Annual Report
3. Significant Accounting Policies - continued
Investment Valuation - continued
prices for similar securities may be used and would be categorized as Level 2 in the hierarchy. Utilizing these techniques may result in transfers between Level 1 and Level 2. For equity securities, including restricted securities, where observable inputs are limited, assumptions about market activity and risk are used and these securities may be categorized as Level 3 in the hierarchy.
Investments in open-end mutual funds, including the Fidelity Central Funds, are valued at their closing net asset value (NAV) each business day and are categorized as Level 1 in the hierarchy.
Changes in valuation techniques may result in transfers in or out of an assigned level within the disclosure hierarchy. The aggregate value of investments by input level as of October 31, 2015 is included at the end of the Fund's Schedule of Investments.
Foreign Currency. The Fund may use foreign currency contracts to facilitate transactions in foreign-denominated securities. Gains and losses from these transactions may arise from changes in the value of the foreign currency or if the counterparties do not perform under the contracts' terms.
Foreign-denominated assets, including investment securities, and liabilities are translated into U.S. dollars at the exchange rates at period end. Purchases and sales of investment securities, income and dividends received and expenses denominated in foreign currencies are translated into U.S. dollars at the exchange rate in effect on the transaction date.
The effects of exchange rate fluctuations on investments are included with the net realized and unrealized gain (loss) on investment securities. Other foreign currency transactions resulting in realized and unrealized gain (loss) are disclosed separately.
Investment Transactions and Income. For financial reporting purposes, the Fund's investment holdings and NAV include trades executed through the end of the last business day of the period. The NAV per share for processing shareholder transactions is calculated as of the close of business of the New York Stock Exchange (NYSE), normally 4:00 p.m. Eastern time and includes trades executed through the end of the prior business day. Gains and losses on securities sold are determined on the basis of identified cost and may include proceeds received from litigation. Dividend income is recorded on the ex-dividend date, except for certain dividends from foreign securities where the ex-dividend date may have passed, which are recorded as soon as the Fund is informed of the ex-dividend date. Non-cash dividends included in dividend income, if any, are recorded at the fair market value of the securities received. Income and capital gain distributions from Fidelity Central Funds, if any, are recorded on the ex-dividend date.
Annual Report
Notes to Financial Statements - continued
3. Significant Accounting Policies - continued
Investment Transactions and Income - continued
Distributions received on securities that represent a return of capital or capital gain are recorded as a reduction of cost of investments and/or as a realized gain. Subsequent to ex-dividend date the Fund determines the components of these distributions, based upon receipt of tax filings or other correspondence relating to the underlying investment. Interest income is accrued as earned and includes coupon interest and amortization of premium and accretion of discount on debt securities as applicable. Investment income is recorded net of foreign taxes withheld where recovery of such taxes is uncertain.
Class Allocations and Expenses. Investment income, realized and unrealized capital gains and losses, common expenses of the Fund, and certain fund-level expense reductions, if any, are allocated daily on a pro-rata basis to each class based on the relative net assets of each class to the total net assets of the Fund. Each class differs with respect to transfer agent and distribution and service plan fees incurred. Certain expense reductions may also differ by class. For the reporting period, the allocated portion of income and expenses to each class as a percent of its average net assets may vary due to the timing of recording these transactions in relation to fluctuating net assets of the classes. Expenses directly attributable to a fund are charged to that fund. Expenses attributable to more than one fund are allocated among the respective funds on the basis of relative net assets or other appropriate methods. Expense estimates are accrued in the period to which they relate and adjustments are made when actual amounts are known.
Income Tax Information and Distributions to Shareholders. Each year, the Fund intends to qualify as a regulated investment company under Subchapter M of the Internal Revenue Code, including distributing substantially all of its taxable income and realized gains. As a result, no provision for U.S. Federal income taxes is required. As of October 31, 2015, the Fund did not have any unrecognized tax benefits in the financial statements; nor is the Fund aware of any tax positions for which it is reasonably possible that the total amounts of unrecognized tax benefits will significantly change in the next twelve months. The Fund files a U.S. federal tax return, in addition to state and local tax returns as required. The Fund's federal income tax returns are subject to examination by the Internal Revenue Service (IRS) for a period of three fiscal years after they are filed. State and local tax returns may be subject to examination for an additional fiscal year depending on the jurisdiction. Foreign taxes are provided for based on the Fund's understanding of the tax rules and rates that exist in the foreign markets in which it invests. The Fund is subject to a tax imposed on capital gains by certain countries in which it invests.
Distributions are declared and recorded on the ex-dividend date. Income dividends and capital gain distributions are declared separately for each class. Income and capital gain distributions are determined in accordance with income tax regulations, which may
Annual Report
3. Significant Accounting Policies - continued
Income Tax Information and Distributions to Shareholders - continued
differ from GAAP. In addition, the Fund claimed a portion of the payment made to redeeming shareholders as a distribution for income tax purposes.
Capital accounts within the financial statements are adjusted for permanent book-tax differences. These adjustments have no impact on net assets or the results of operations. Capital accounts are not adjusted for temporary book-tax differences which will reverse in a subsequent period.
Book-tax differences are primarily due to foreign currency transactions, certain foreign taxes, passive foreign investment companies (PFIC) and losses deferred due to wash sales.
The federal tax cost of investment securities and unrealized appreciation (depreciation) as of period end were as follows:
Gross unrealized appreciation | $ 102,373,068 |
Gross unrealized depreciation | (110,741,632) |
Net unrealized appreciation (depreciation) on securities | $ (8,368,564) |
Tax Cost | $ 894,144,403 |
The tax-based components of distributable earnings as of period end were as follows:
Undistributed ordinary income | $ 15,328,717 |
Undistributed long-term capital gain | $ 19,111,574 |
Net unrealized appreciation (depreciation) on securities and other investments | $ (8,441,972) |
The tax character of distributions paid was as follows:
| October 31, 2015 | October 31, 2014 |
Ordinary Income | $ 8,729,905 | $ 30,270,126 |
Long-term Capital Gains | 115,839,457 | - |
Total | $ 124,569,362 | $ 30,270,126 |
Short-Term Trading (Redemption) Fees. Shares held by investors in the Fund less than 90 days may have been subject to a redemption fee equal to 2.00% of the NAV of shares redeemed. All redemption fees, which reduce the proceeds of the shareholder redemption, are retained by the Fund and accounted for as an addition to paid in capital.
Restricted Securities. The Fund may invest in securities that are subject to legal or contractual restrictions on resale. These securities generally may be resold in transactions exempt from registration or to the public if the securities are registered. Disposal of these securities may involve time-consuming negotiations and expense, and prompt sale
Annual Report
Notes to Financial Statements - continued
3. Significant Accounting Policies - continued
Restricted Securities - continued
at an acceptable price may be difficult. Information regarding restricted securities is included at the end of the Fund's Schedule of Investments.
4. Purchases and Sales of Investments.
Purchases and sales of securities, other than short-term securities, aggregated $286,769,775 and $355,615,175, respectively.
5. Fees and Other Transactions with Affiliates.
Management Fee. Fidelity Management & Research Company (the investment adviser) and its affiliates provide the Fund with investment management related services for which the Fund pays a monthly management fee. The management fee is the sum of an individual fund fee rate that is based on an annual rate of .60% of the Fund's average net assets and an annualized group fee rate that averaged .25% during the period. The group fee rate is based upon the average net assets of all the mutual funds advised by the investment adviser, including any mutual funds previously advised by the investment adviser that are currently advised by Fidelity SelectCo, LLC, an affiliate of the investment adviser. The group fee rate decreases as assets under management increase and increases as assets under management decrease. In addition, the management fee is subject to a performance adjustment (up to a maximum of ± .20% of the Fund's average net assets over a 36 month performance period). The upward or downward adjustment to the management fee is based on the relative investment performance of International Small Cap as compared to its benchmark index, the MSCI All Country World ex USA Small Cap Index effective April 1, 2014 (the MSCI EAFE Small Cap Index prior to April 1, 2014), over the same 36 month performance period. For the reporting period, the total annual management fee rate, including the performance adjustment, was .96% of the Fund's average net assets. The performance adjustment included in the management fee rate may be higher or lower than the maximum performance adjustment rate due to the difference between the average net assets for the reporting and performance periods.
Distribution and Service Plan Fees. In accordance with Rule 12b-1 of the 1940 Act, the Fund has adopted separate Distribution and Service Plans for each class of shares. Certain classes pay Fidelity Distributors Corporation (FDC), an affiliate of the investment adviser, separate Distribution and Service Fees, each of which is based on an annual percentage of each class' average net assets. In addition, FDC may pay financial intermediaries for selling shares of the Fund and providing shareholder support services.
Annual Report
5. Fees and Other Transactions with Affiliates - continued
Distribution and Service Plan Fees - continued
For the period, the Distribution and Service Fee rates, total fees and amounts retained by FDC were as follows:
| Distribution
Fee | Service
Fee | Total Fees | Retained
by FDC |
Class A | -% | .25% | $ 63,486 | $ 789 |
Class T | .25% | .25% | 59,620 | - |
Class B | .75% | .25% | 4,412 | 3,318 |
Class C | .75% | .25% | 106,420 | 13,666 |
| | | $ 233,938 | $ 17,773 |
Sales Load. FDC may receive a front-end sales charge of up to 5.75% for selling Class A shares and 3.50% for selling Class T shares, some of which is paid to financial intermediaries for selling shares of the Fund. Depending on the holding period, FDC may receive contingent deferred sales charges levied on Class A, Class T, Class B, and Class C redemptions. The deferred sales charges range from 5.00% to 1.00% for Class B shares, 1.00% for Class C shares, 1.00% for certain purchases of Class A shares and .25% for certain purchases of Class T shares.
For the period, sales charge amounts retained by FDC were as follows:
| Retained
by FDC |
Class A | $ 15,223 |
Class T | 3,172 |
Class BA | 74 |
Class C A | 2,729 |
| $ 21,198 |
A When Class B and Class C shares are initially sold, FDC pays commissions from its own resources to financial intermediaries through which the sales are made.
Transfer Agent Fees. Fidelity Investments Institutional Operations Company, Inc., (FIIOC), an affiliate of the investment adviser, is the transfer, dividend disbursing and shareholder servicing agent for each class of the Fund. FIIOC receives account fees and asset-based fees that vary according to the account size and type of account of the shareholders of the respective classes of the Fund. FIIOC pays for typesetting, printing and mailing of shareholder reports, except proxy statements.
Annual Report
Notes to Financial Statements - continued
5. Fees and Other Transactions with Affiliates - continued
Transfer Agent Fees - continued
For the period, transfer agent fees for each class were as follows:
| Amount | % of
Class-Level
Average
Net Assets |
Class A | $ 69,900 | .27 |
Class T | 36,352 | .30 |
Class B | 1,323 | .30 |
Class C | 31,483 | .30 |
International Small Cap | 1,992,868 | .25 |
Class I | 16,067 | .18 |
| $ 2,147,993 | |
Accounting and Security Lending Fees. Fidelity Service Company, Inc. (FSC), an affiliate of the investment adviser, maintains the Fund's accounting records. The accounting fee is based on the level of average net assets for each month. Under a separate contract, FSC administers the security lending program. The security lending fee is based on the number and duration of lending transactions.
Brokerage Commissions. The Fund placed a portion of its portfolio transactions with brokerage firms which are affiliates of the investment adviser. Brokerage commissions are included in net realized gain (loss) and change in net unrealized appreciation (depreciation) in the Statement of Operations. The commissions paid to these affiliated firms were $340 for the period.
Other. During the period, the investment adviser reimbursed the Fund for certain losses in the amount of $1,975.
6. Committed Line of Credit.
The Fund participates with other funds managed by the investment adviser or an affiliate in a $4.25 billion credit facility (the "line of credit") to be utilized for temporary or emergency purposes to fund shareholder redemptions or for other short-term liquidity purposes. The Fund has agreed to pay commitment fees on its pro-rata portion of the line of credit, which amounted to $1,210 and is reflected in Miscellaneous expenses on the Statement of Operations. During the period, the Fund did not borrow on this line of credit.
7. Security Lending.
The Fund lends portfolio securities through a lending agent from time to time in order to earn additional income. For equity securities, a lending agent is used and may loan securities to certain qualified borrowers, including Fidelity Capital Markets (FCM), a
Annual Report
7. Security Lending - continued
broker-dealer affiliated with the Fund. On the settlement date of the loan, the Fund receives collateral (in the form of U.S. Treasury obligations, letters of credit and/or cash) against the loaned securities and maintains collateral in an amount not less than 100% ofthe market value of the loaned securities during the period of the loan. The market value of the loaned securities is determined at the close of business of the Fund and any additional required collateral is delivered to the Fund on the next business day. The Fund or borrower may terminate the loan at any time, and if the borrower defaults on its obligation to return the securities loaned because of insolvency or other reasons, the Fund may apply collateral received from the borrower against the obligation. The Fund may experience delays and costs in recovering the securities loaned. Any cash collateral received is invested in the Fidelity Securities Lending Cash Central Fund. The value of loaned securities and cash collateral at period end are disclosed on the Fund's Statement of Assets and Liabilities. The value of securities loaned to FCM at period end was $363,206. Security lending income represents the income earned on investing cash collateral, less rebates paid to borrowers and any lending agent fees associated with the loan, plus any premium payments received for lending certain types of securities. Security lending income is presented in the Statement of Operations as a component of income from Fidelity Central Funds. Total security lending income during the period amounted to $186,310, including $3,174 from securities loaned to FCM.
8. Expense Reductions.
Commissions paid to certain brokers with whom the investment adviser, or its affiliates, places trades on behalf of the Fund include an amount in addition to trade execution, which may be rebated back to the Fund to offset certain expenses. This amount totaled $28,404 for the period.
Through arrangements with the Fund's custodian, credits realized as a result of certain uninvested cash balances were used to reduce the Fund's expenses. During the period, these credits reduced the Fund's custody expenses by $41.
In addition, during the period the investment adviser reimbursed and/or waived a portion of fund-level operating expenses in the amount of $3,507 and a portion of class-level operating expenses as follows:
| Amount |
Class A | $ 414 |
Class T | 191 |
Class B | 1 |
Class C | 281 |
International Small Cap | 22,441 |
Class I | 831 |
| $ 24,159 |
Annual Report
Notes to Financial Statements - continued
9. Distributions to Shareholders.
Distributions to shareholders of each class were as follows:
Years ended October 31, | 2015 | 2014 |
From net investment income | | |
Class A | $ 155,785 | $ 48,210 |
Class T | 27,108 | - |
International Small Cap | 7,454,709 | 3,601,146 |
Class I | 24,926 | 363,320 |
Total | $ 7,662,528 | $ 4,012,676 |
From net realized gain | | |
Class A | $ 3,382,206 | $ 564,345 |
Class T | 1,671,017 | 310,220 |
Class B | 66,002 | 14,343 |
Class C | 1,697,539 | 305,689 |
International Small Cap | 109,040,767 | 23,368,303 |
Class I | 1,049,303 | 1,694,550 |
Total | $ 116,906,834 | $ 26,257,450 |
10. Share Transactions.
Share transactions for each class were as follows and may contain automatic conversions between classes or exchanges between funds:
| Shares | Dollars |
Years ended October 31, | 2015 | 2014 | 2015 | 2014 |
Class A | | | | |
Shares sold | 432,152 | 355,842 | $ 9,990,970 | $ 9,376,508 |
Reinvestment of distributions | 159,613 | 22,103 | 3,404,539 | 571,356 |
Shares redeemed | (331,016) | (306,489) | (7,450,558) | (8,061,522) |
Net increase (decrease) | 260,749 | 71,456 | $ 5,944,951 | $ 1,886,342 |
Class T | | | | |
Shares sold | 124,085 | 115,645 | $ 2,869,552 | $ 3,022,509 |
Reinvestment of distributions | 77,005 | 11,686 | 1,636,354 | 300,676 |
Shares redeemed | (146,828) | (148,659) | (3,289,706) | (3,861,942) |
Net increase (decrease) | 54,262 | (21,328) | $ 1,216,200 | $ (538,757) |
Class B | | | | |
Shares sold | 4,667 | 3,137 | $ 108,058 | $ 80,198 |
Reinvestment of distributions | 2,954 | 538 | 62,128 | 13,734 |
Shares redeemed | (10,732) | (13,726) | (240,945) | (356,690) |
Net increase (decrease) | (3,111) | (10,051) | $ (70,759) | $ (262,758) |
Annual Report
10. Share Transactions - continued
| Shares | Dollars |
Years ended October 31, | 2015 | 2014 | 2015 | 2014 |
Class C | | | | |
Shares sold | 196,292 | 207,733 | $ 4,379,607 | $ 5,326,341 |
Reinvestment of distributions | 71,584 | 10,499 | 1,488,229 | 265,425 |
Shares redeemed | (268,981) | (222,725) | (5,818,752) | (5,644,059) |
Net increase (decrease) | (1,105) | (4,493) | $ 49,084 | $ (52,293) |
International Small Cap | | | | |
Shares sold | 7,876,402 | 7,158,603 | $ 184,799,928 | $ 190,711,642 |
Reinvestment of distributions | 5,231,399 | 988,313 | 113,102,853 | 25,844,388 |
Shares redeemed | (11,138,439) | (13,529,838) | (253,855,534) | (360,297,655) |
Net increase (decrease) | 1,969,362 | (5,382,922) | $ 44,047,247 | $ (143,741,625) |
Class I | | | | |
Shares sold | 256,693 | 1,844,038 | $ 5,987,647 | $ 48,462,558 |
Reinvestment of distributions | 46,102 | 61,170 | 1,003,648 | 1,598,368 |
Shares redeemed | (188,812) | (4,099,284) | (4,455,310) | (109,159,166) |
Net increase (decrease) | 113,983 | (2,194,076) | $ 2,535,985 | $ (59,098,240) |
11. Other.
The Fund's organizational documents provide former and current trustees and officers with a limited indemnification against liabilities arising in connection with the performance of their duties to the Fund. In the normal course of business, the Fund may also enter into contracts that provide general indemnifications. The Fund's maximum exposure under these arrangements is unknown as this would be dependent on future claims that may be made against the Fund. The risk of material loss from such claims is considered remote.
At the end of the period, the investment adviser or its affiliates were the owner of record of 15% of the total outstanding shares of the Fund.
Annual Report
To the Trustees of Fidelity Investment Trust and Shareholders of Fidelity International Small Cap Fund:
We have audited the accompanying statement of assets and liabilities of Fidelity International Small Cap Fund (the Fund), a fund of Fidelity Investment Trust, including the schedule of investments, as of October 31, 2015, and the related statement of operations for the year then ended, the statement of changes in net assets for each of the two years in the period then ended, and the financial highlights for each of the five years in the period then ended. These financial statements and financial highlights are the responsibility of the Fund's management. Our responsibility is to express an opinion on these financial statements and financial highlights based on our audits.
We conducted our audits in accordance with the standards of the Public Company Accounting Oversight Board (United States). Those standards require that we plan and perform the audit to obtain reasonable assurance about whether the financial statements and financial highlights are free of material misstatement. The Fund is not required to have, nor were we engaged to perform, an audit of its internal control over financial reporting. Our audits included consideration of internal control over financial reporting as a basis for designing audit procedures that are appropriate in the circumstances, but not for the purpose of expressing an opinion on the effectiveness of the Fund's internal control over financial reporting. Accordingly, we express no such opinion. An audit also includes examining, on a test basis, evidence supporting the amounts and disclosures in the financial statements, assessing the accounting principles used and significant estimates made by management, as well as evaluating the overall financial statement presentation. Our procedures included confirmation of securities owned as of October 31, 2015, by correspondence with the custodians and brokers; when replies were not received from brokers, we performed other auditing procedures. We believe that our audits provide a reasonable basis for our opinion.
In our opinion, such financial statements and financial highlights referred to above present fairly, in all material respects, the financial position of Fidelity International Small Cap Fund as of October 31, 2015, the results of its operations for the year then ended, the changes in its net assets for each of the two years in the period then ended, and the financial highlights for each of the five years in the period then ended, in conformity with accounting principles generally accepted in the United States of America.
DELOITTE & TOUCHE LLP
Boston, Massachusetts
December 18, 2015
Annual Report
The Trustees, Member of the Advisory Board, and officers of the trust and fund, as applicable, are listed below. The Board of Trustees governs the fund and is responsible for protecting the interests of shareholders. The Trustees are experienced executives who meet periodically throughout the year to oversee the fund's activities, review contractual arrangements with companies that provide services to the fund, oversee management of the risks associated with such activities and contractual arrangements, and review the fund's performance. Each of the Trustees oversees 170 funds.
The Trustees hold office without limit in time except that (a) any Trustee may resign; (b) any Trustee may be removed by written instrument, signed by at least two-thirds of the number of Trustees prior to such removal; (c) any Trustee who requests to be retired or who has become incapacitated by illness or injury may be retired by written instrument signed by a majority of the other Trustees; and (d) any Trustee may be removed at any special meeting of shareholders by a two-thirds vote of the outstanding voting securities of the trust. Each Trustee who is not an interested person (as defined in the 1940 Act) of the trust and the fund (Independent Trustee), shall retire not later than the last day of the calendar year in which his or her 75th birthday occurs. The Independent Trustees may waive this mandatory retirement age policy with respect to individual Trustees. The officers and Advisory Board Member hold office without limit in time, except that any officer and Advisory Board Member may resign or may be removed by a vote of a majority of the Trustees at any regular meeting or any special meeting of the Trustees. Except as indicated, each individual has held the office shown or other offices in the same company for the past five years.
Experience, Skills, Attributes, and Qualifications of the Fund's Trustees. The Governance and Nominating Committee has adopted a statement of policy that describes the experience, qualifications, attributes, and skills that are necessary and desirable for potential Independent Trustee candidates (Statement of Policy). The Board believes that each Trustee satisfied at the time he or she was initially elected or appointed a Trustee, and continues to satisfy, the standards contemplated by the Statement of Policy. The Governance and Nominating Committee also engages professional search firms to help identify potential Independent Trustee candidates who have the experience, qualifications, attributes, and skills consistent with the Statement of Policy. From time to time, additional criteria based on the composition and skills of the current Independent Trustees, as well as experience or skills that may be appropriate in light of future changes to board composition, business conditions, and regulatory or other developments, have also been considered by the professional search firms and the Governance and Nominating Committee. In addition, the Board takes into account the Trustees' commitment and participation in Board and committee meetings, as well as their leadership of standing and ad hoc committees throughout their tenure.
In determining that a particular Trustee was and continues to be qualified to serve as a Trustee, the Board has considered a variety of criteria, none of which, in isolation, was controlling. The Board believes that, collectively, the Trustees have balanced and diverse experience, qualifications, attributes, and skills, which allow the Board to operate effectively in governing the fund and protecting the interests of shareholders. Information about the specific experience, skills, attributes, and qualifications of each Trustee, which in each case led to the Board's conclusion that the Trustee should serve (or continue to serve) as a trustee of the fund, is provided below.
Annual Report
Trustees and Officers - continued
Board Structure and Oversight Function. James C. Curvey is an interested person (as defined in the 1940 Act) and currently serves as Chairman. The Trustees have determined that an interested Chairman is appropriate and benefits shareholders because an interested Chairman has a personal and professional stake in the quality and continuity of services provided to the fund. Independent Trustees exercise their informed business judgment to appoint an individual of their choosing to serve as Chairman, regardless of whether the Trustee happens to be independent or a member of management. The Independent Trustees have determined that they can act independently and effectively without having an Independent Trustee serve as Chairman and that a key structural component for assuring that they are in a position to do so is for the Independent Trustees to constitute a substantial majority for the Board. The Independent Trustees also regularly meet in executive session. Ned C. Lautenbach serves as Chairman of the Independent Trustees and as such (i) acts as a liaison between the Independent Trustees and management with respect to matters important to the Independent Trustees and (ii) with management prepares agendas for Board meetings.
Fidelity funds are overseen by different Boards of Trustees. The fund's Board oversees Fidelity's high income and certain equity funds, and other Boards oversee Fidelity's investment-grade bond, money market, asset allocation, and sector funds. The asset allocation funds may invest in Fidelity funds overseen by the fund's Board. The use of separate Boards, each with its own committee structure, allows the Trustees of each group of Fidelity funds to focus on the unique issues of the funds they oversee, including common research, investment, and operational issues. On occasion, the separate Boards establish joint committees to address issues of overlapping consequences for the Fidelity funds overseen by each Board.
The Trustees operate using a system of committees to facilitate the timely and efficient consideration of all matters of importance to the Trustees, the fund, and fund shareholders and to facilitate compliance with legal and regulatory requirements and oversight of the fund's activities and associated risks. The Board, acting through its committees, has charged FMR and its affiliates with (i) identifying events or circumstances the occurrence of which could have demonstrably adverse effects on the fund's business and/or reputation; (ii) implementing processes and controls to lessen the possibility that such events or circumstances occur or to mitigate the effects of such events or circumstances if they do occur; and (iii) creating and maintaining a system designed to evaluate continuously business and market conditions in order to facilitate the identification and implementation processes described in (i) and (ii) above. Because the day-to-day operations and activities of the fund are carried out by or through FMR, its affiliates and other service providers, the fund's exposure to risks is mitigated but not eliminated by the processes overseen by the Trustees. While each of the Board's committees has responsibility for overseeing different aspects of the fund's activities, oversight is exercised primarily through the Operations, Audit, and Compliance Committees. In addition, the Independent Trustees have worked with FMR to enhance the Board's oversight of investment and financial risks, legal and regulatory risks, technology risks, and operational risks, including the development of additional risk reporting to the Board. For example, a working group comprised of Independent Trustees and FMR has worked and continues to work to review the Fidelity funds' valuation-related activities, reporting and risk management. Appropriate personnel, including but not limited to the fund's Chief Compliance Officer (CCO), FMR's internal auditor, the independent accountants, the fund's Treasurer and portfolio management personnel, make periodic reports to the Board's committees, as appropriate, including an annual review of Fidelity's risk management program for the Fidelity funds. The responsibilities of each standing committee, including their oversight responsibilities, are described further under "Standing Committees of the Fund's Trustees."
Annual Report
The fund's Statement of Additional Information (SAI) includes more information about the Trustees. To request a free copy, call Fidelity at 1-800-544-8544.
Interested Trustees*:
Correspondence intended for each Trustee who is an interested person may be sent to Fidelity Investments, 245 Summer Street, Boston, Massachusetts 02210.
Name, Year of Birth; Principal Occupations and Other Relevant Experience+ |
James C. Curvey (1935) |
Year of Election or Appointment: 2007 Trustee Chairman of the Board of Trustees |
| Mr. Curvey also serves as Trustee of other Fidelity funds. Mr. Curvey is a Director of Fidelity Research & Analysis Co. (investment adviser firm, 2009-present), and Vice Chairman (2007-present) and Director of FMR LLC (diversified financial services company). In addition, Mr. Curvey serves as an Overseer for the Boston Symphony Orchestra and a member of the board of Artis-Naples, Naples, Florida, and as a Trustee for Brewster Academy, Wolfeboro, New Hampshire. Previously, Mr. Curvey served as a Director of Fidelity Investments Money Management, Inc. (investment adviser firm, 2009-2014) and a Director of FMR and FMR Co., Inc. (investment adviser firms 2007-2014). |
Charles S. Morrison (1960) |
Year of Election or Appointment: 2014 Trustee |
| Mr. Morrison also serves as Trustee of other funds. He serves as a Director of Fidelity Investments Money Management, Inc. (FIMM) (investment adviser firm, 2014-present), Director of Fidelity SelectCo, LLC (investment adviser firm, 2014-present), President, Asset Management (2014-present), and is an employee of Fidelity Investments. Previously, Mr. Morrison served as Vice President of Fidelity's Fixed Income and Asset Allocation Funds (2012-2014), President, Fixed Income (2011-2014), Vice President of Fidelity's Money Market Funds (2005-2009), President, Money Market Group Leader of FMR (investment adviser firm, 2009), and Senior Vice President, Money Market Group of FMR (2004-2009). Mr. Morrison also served as Vice President of Fidelity's Bond Funds (2002-2005), certain Balanced Funds (2002-2005), and certain Asset Allocation Funds (2002-2007), and as Senior Vice President (2002-2005) of Fidelity's Bond Division. |
* Trustees have been determined to be "Interested Trustees" by virtue of, among other things, their affiliation with the trust or various entities under common control with FMR.
+ The information above includes each Trustee's principal occupation during the last five years and other information relating to the experience, attributes, and skills relevant to each Trustee's qualifications to serve as a Trustee, which led to the conclusion that each Trustee should serve as a Trustee for the fund.
Independent Trustees:
Correspondence intended for each Independent Trustee (that is, the Trustees other than the Interested Trustees) may be sent to Fidelity Investments, P.O. Box 55235, Boston, Massachusetts 02205-5235.
Annual Report
Name, Year of Birth; Principal Occupations and Other Relevant Experience+ |
Dennis J. Dirks (1948) |
Year of Election or Appointment: 2005 Trustee |
| Mr. Dirks also serves as Trustee of other Fidelity funds. Prior to his retirement in May 2003, Mr. Dirks was Chief Operating Officer and a member of the Board of The Depository Trust & Clearing Corporation (DTCC). He also served as President, Chief Operating Officer, and Board member of The Depository Trust Company (DTC) and President and Board member of the National Securities Clearing Corporation (NSCC). In addition, Mr. Dirks served as Chief Executive Officer and Board member of the Government Securities Clearing Corporation, Chief Executive Officer and Board member of the Mortgage-Backed Securities Clearing Corporation, as a Trustee and a member of the Finance Committee of Manhattan College (2005-2008), as a Trustee and a member of the Finance Committee of AHRC of Nassau County (2006-2008), and as a member of the Independent Directors Council (IDC) Governing Council (2010-2015). Mr. Dirks is a member of the Board of Directors for The Brookville Center for Children's Services, Inc. (2009-present). |
Alan J. Lacy (1953) |
Year of Election or Appointment: 2008 Trustee |
| Mr. Lacy also serves as Trustee of other Fidelity funds. Mr. Lacy serves as a member of the Board of Directors of Dave & Buster's Entertainment, Inc. (restaurant and entertainment complexes, 2010-present) and Bristol-Myers Squibb Company (global pharmaceuticals, 2008-present). In addition, Mr. Lacy served as Senior Adviser (2007-2014) of Oak Hill Capital Partners, L.P. (private equity) and also served as Chief Executive Officer (2000-2005) and Vice Chairman (2005-2006) of Sears Holdings Corporation and Sears, Roebuck and Co. (retail). Mr. Lacy is a member of the Board of Trustees of The National Parks Conservation Association (2006-present). Previously, Mr. Lacy served as Chairman of the Board of Trustees of the National Parks Conservation Association (2008-2011) and as a member of the Board of Directors for The Western Union Company (global money transfer, 2006-2011), The Hillman Companies, Inc. (hardware wholesalers, 2010-2014), and Earth Fare, Inc. (retail grocery, 2010-2014). |
Ned C. Lautenbach (1944) |
Year of Election or Appointment: 2000 Trustee Chairman of the Independent Trustees |
| Mr. Lautenbach also serves as Trustee of other Fidelity funds. Mr. Lautenbach currently serves as the Lead Director of the Eaton Corporation Board of Directors (diversified industrial, 1997-present). Mr. Lautenbach is Chairman of the Board of Directors of Artis-Naples in Naples, Florida (2012-present), a member of the Council on Foreign Relations (1994-present), and a member of the Board of Governors, State University System of Florida (2013-present). Previously, Mr. Lautenbach was a Partner/Advisory Partner at Clayton, Dubilier & Rice, LLC (private equity investment, 1998-2010), as well as a Director of Sony Corporation (2006-2007). |
Joseph Mauriello (1944) |
Year of Election or Appointment: 2008 Trustee |
| Mr. Mauriello also serves as Trustee of other Fidelity funds. Prior to his retirement in January 2006, Mr. Mauriello served in numerous senior management positions including Deputy Chairman and Chief Operating Officer (2004-2005), and Vice Chairman of Financial Services (2002-2004) of KPMG LLP US (professional services, 1965-2005). Mr. Mauriello currently serves as a member of the Board of Directors of XL Group plc. (global insurance and re-insurance, 2006-present) and the Independent Directors Council (IDC) Governing Council (2015-present). Previously, Mr. Mauriello served as a Director of the Hamilton Funds of the Bank of New York (2006-2007) and of Arcadia Resources Inc. (health care services and products, 2007-2012). |
Robert W. Selander (1950) |
Year of Election or Appointment: 2011 Trustee |
| Mr. Selander also serves as Trustee of other Fidelity funds. Mr. Selander serves as a Director of The Western Union Company (global money transfer, 2014-present). Previously, Mr. Selander served as a Member of the Advisory Board of other Fidelity funds (2011), and Executive Vice Chairman (2010), Chief Executive Officer (2009-2010), and President and Chief Executive Officer (1997-2009) of Mastercard, Inc. |
Cornelia M. Small (1944) |
Year of Election or Appointment: 2005 Trustee |
| Ms. Small also serves as Trustee of other Fidelity funds. Ms. Small is a member of the Board of Directors (2009-present) and Chair of the Investment Committee (2010-present) of the Teagle Foundation. Ms. Small also serves on the Investment Committee of the Berkshire Taconic Community Foundation (2008-present). Previously, Ms. Small served as Chairperson (2002-2008) and a member of the Investment Committee and Chairperson (2008-2012) and a member of the Board of Trustees of Smith College. In addition, Ms. Small served as Chief Investment Officer, Director of Global Equity Investments, and a member of the Board of Directors of Scudder, Stevens & Clark and Scudder Kemper Investments. |
William S. Stavropoulos (1939) |
Year of Election or Appointment: 2001 Trustee Vice Chairman of the Independent Trustees |
| Mr. Stavropoulos also serves as Trustee of other Fidelity funds. Mr. Stavropoulos serves as President and Founder of the Michigan Baseball Foundation, the Great Lakes Loons (2007-present). Mr. Stavropoulos is Chairman Emeritus of the Board of Directors of The Dow Chemical Company, where he previously served in numerous senior management positions, including President, CEO (1995-2000; 2002-2004), Chairman of the Executive Committee (2000-2006), and as a member of the Board of Directors (1990-2006). Currently, Mr. Stavropoulos is Chairman of the Board of Directors of Univar Inc. (global distributor of commodity and specialty chemicals), a Director of Teradata Corporation (data warehousing and technology solutions), and Maersk Inc. (industrial conglomerate), and a member of the Advisory Board for Metalmark Capital LLC (private equity investment, 2005-present). Mr. Stavropoulos is an operating advisor to Clayton, Dubilier & Rice, LLC (private equity investment). In addition, Mr. Stavropoulos is a member of the University of Notre Dame Advisory Council for the College of Science, a Trustee of the Rollin L. Gerstacker Foundation, and a Director of the Naples Philharmonic Center for the Arts. Previously, Mr. Stavropoulos served as a Director of Chemical Financial Corporation (bank holding company, 1993-2012) and Tyco International, Ltd. (multinational manufacturing and services, 2007-2012). |
David M. Thomas (1949) |
Year of Election or Appointment: 2008 Trustee |
| Mr. Thomas also serves as Trustee of other Fidelity funds. Mr. Thomas serves as Non-Executive Chairman of the Board of Directors of Fortune Brands Home and Security (home and security products, 2011-present), as a member of the Board of Directors (2004-present) and Presiding Director (2013-present) of Interpublic Group of Companies, Inc. (marketing communication), and as a member of the Board of Trustees of the University of Florida (2013-present). Previously, Mr. Thomas served as Executive Chairman (2005-2006) and Chairman and Chief Executive Officer (2000-2005) of IMS Health, Inc. (pharmaceutical and healthcare information solutions), and a Director of Fortune Brands, Inc. (consumer products, 2000-2011). |
+ The information above includes each Trustee's principal occupation during the last five years and other information relating to the experience, attributes, and skills relevant to each Trustee's qualifications to serve as a Trustee, which led to the conclusion that each Trustee should serve as a Trustee for the fund.
Advisory Board Member and Officers:
Correspondence intended for each officer and Peter S. Lynch may be sent to Fidelity Investments, 245 Summer Street, Boston, Massachusetts 02210. Officers appear below in alphabetical order.
Name, Year of Birth; Principal Occupation |
Peter S. Lynch (1944) |
Year of Election or Appointment: 2003 Member of the Advisory Board |
| Mr. Lynch also serves as Member of the Advisory Board of other Fidelity funds. Mr. Lynch is Vice Chairman and a Director of FMR (investment adviser firm) and FMR Co., Inc. (investment adviser firm). In addition, Mr. Lynch serves as a Trustee of Boston College and as the Chairman of the Inner-City Scholarship Fund. Previously, Mr. Lynch served on the Special Olympics International Board of Directors (1997-2006). |
Elizabeth Paige Baumann (1968) |
Year of Election or Appointment: 2012 Anti-Money Laundering (AML) Officer |
| Ms. Baumann also serves as AML Officer of other funds. She is Chief AML Officer of FMR LLC (diversified financial services company, 2012-present) and is an employee of Fidelity Investments. Previously, Ms. Baumann served as Vice President and Deputy Anti-Money Laundering Officer (2007-2012). |
Marc R. Bryant (1966) |
Year of Election or Appointment: 2015 Secretary and Chief Legal Officer (CLO) |
| Mr. Bryant also serves as Secretary and CLO of other funds. Mr. Bryant serves as CLO, Secretary, and Senior Vice President of Fidelity Management & Research Company (investment adviser firm, 2015-present) and FMR Co., Inc. (investment adviser firm, 2015-present); Secretary of Fidelity SelectCo, LLC (investment adviser firm, 2015-present) and Fidelity Investments Money Management, Inc. (investment adviser firm, 2015-present); and CLO of Fidelity Management & Research (Hong Kong) Limited (investment adviser firm, 2015-present). He is Senior Vice President and Deputy General Counsel of FMR LLC (diversified financial services company). Previously, Mr. Bryant served as Secretary and Chief Legal Officer of Fidelity Rutland Square Trust II (2010-2014) and Assistant Secretary of Fidelity's Fixed Income and Asset Allocation Funds (2013-2015). Prior to joining Fidelity Investments, Mr. Bryant served as a Senior Vice President and the Head of Global Retail Legal for AllianceBernstein L.P. (2006-2010), and as the General Counsel for ProFund Advisors LLC (2001-2006). |
William C. Coffey (1969) |
Year of Election or Appointment: 2009 Assistant Secretary |
| Mr. Coffey also serves as Assistant Secretary of other funds. He is Senior Vice President and Deputy General Counsel of FMR LLC (diversified financial services company, 2010-present), and is an employee of Fidelity Investments. Previously, Mr. Coffey served as Vice President and Associate General Counsel of FMR LLC (2005-2009). |
Jonathan Davis (1968) |
Year of Election or Appointment: 2010 Assistant Treasurer |
| Mr. Davis also serves as Assistant Treasurer of other funds, and is an employee of Fidelity Investments. Previously, Mr. Davis served as Vice President and Associate General Counsel of FMR LLC (diversified financial services company, 2003-2010). |
Adrien E. Deberghes (1967) |
Year of Election or Appointment: 2008 Deputy Treasurer |
| Mr. Deberghes also serves as an officer of other funds. He is an employee of Fidelity Investments (2008-present). Prior to joining Fidelity Investments, Mr. Deberghes was Senior Vice President of Mutual Fund Administration at State Street Corporation (2007-2008), Senior Director of Mutual Fund Administration at Investors Bank & Trust (2005-2007), and Director of Finance for Dunkin' Brands (2000-2005). |
Stephanie J. Dorsey (1969) |
Year of Election or Appointment: 2010 Assistant Treasurer |
| Ms. Dorsey also serves as an officer of other funds. She is an employee of Fidelity Investments (2008-present) and has served in other fund officer roles. Prior to joining Fidelity Investments, Ms. Dorsey served as Treasurer (2004-2008) of the JPMorgan Mutual Funds and Vice President (2004-2008) of JPMorgan Chase Bank. |
Howard J. Galligan III (1966) |
Year of Election or Appointment: 2014 Chief Financial Officer |
| Mr. Galligan also serves as Chief Financial Officer of other funds. Mr. Galligan serves as President of Fidelity Pricing and Cash Management Services (FPCMS) (2014-present) and as a Director of Strategic Advisers, Inc. (investment adviser firm, 2008-present). Previously, Mr. Galligan served as Chief Administrative Officer of Asset Management (2011-2014) and Chief Operating Officer and Senior Vice President of Investment Support for Strategic Advisers, Inc. (2003-2011). |
Scott C. Goebel (1968) |
Year of Election or Appointment: 2015 Vice President |
| Mr. Goebel serves as Vice President of other funds and is an employee of Fidelity Investments (2001-present). Previously, Mr. Goebel served as Secretary of Fidelity SelectCo, LLC (investment adviser firm, 2013-2015), Fidelity Investments Money Management, Inc. (FIMM) (investment adviser firm, 2010-2015), and Fidelity Research and Analysis Company (FRAC) (investment adviser firm, 2010-2015); General Counsel, Secretary, and Senior Vice President of Fidelity Management & Research Company (investment adviser firm, 2008-2015) and FMR Co., Inc. (investment adviser firm, 2008-2015); Assistant Secretary of Fidelity Management & Research (Japan) Limited (investment adviser firm, 2008-2015) and FMR Investment Management (U.K.) Limited (investment adviser firm, 2008-2015); Chief Legal Officer (CLO) of Fidelity Management & Research (Hong Kong) Limited (investment adviser firm, 2008-2015); Secretary and CLO of certain Fidelity funds (2008-2015); Assistant Secretary of FIMM (2008-2010), FRAC (2008-2010), and certain funds (2007-2008); and as Vice President and Secretary of Fidelity Distributors Corporation (FDC) (2005-2007). |
Thomas C. Hense (1964) |
Year of Election or Appointment: 2008, 2010, or 2015 Vice President |
| Mr. Hense serves as Vice President of Fidelity Advisor Multi-Asset Income Fund (2015) and other funds (High Income (2008), Small Cap (2008), and Value (2010) funds), and is an employee of Fidelity Investments (1993-present). Previously, Mr. Hense served as a portfolio manager for Fidelity's Institutional Money Management Group (Pyramis) (2003-2008). |
Brian B. Hogan (1964) |
Year of Election or Appointment: 2009 Vice President |
| Mr. Hogan also serves as Trustee or Vice President of other funds. Mr. Hogan serves as a Director of Fidelity SelectCo, LLC (investment adviser firm, 2014-present) and President of the Equity Division of FMR (investment adviser firm, 2009-present). Previously, Mr. Hogan served as Senior Vice President, Equity Research of FMR (2006-2009) and as a portfolio manager. |
Chris Maher (1972) |
Year of Election or Appointment: 2013 Assistant Treasurer |
| Mr. Maher serves as Assistant Treasurer of other funds. Mr. Maher is Vice President of Valuation Oversight and is an employee of Fidelity Investments. Previously, Mr. Maher served as Vice President of Asset Management Compliance (2013), Vice President of the Program Management Group of FMR (investment adviser firm, 2010-2013), and Vice President of Valuation Oversight (2008-2010). |
Kenneth B. Robins (1969) |
Year of Election or Appointment: 2008 President and Treasurer |
| Mr. Robins also serves as an officer of other funds. Mr. Robins serves as Executive Vice President of Fidelity Investments Money Management, Inc. (FIMM) (investment adviser firm, 2013-present) and is an employee of Fidelity Investments (2004-present). Previously, Mr. Robins served in other fund officer roles. |
Stacie M. Smith (1974) |
Year of Election or Appointment: 2013 Deputy Treasurer |
| Ms. Smith also serves as an officer of other funds. She is an employee of Fidelity Investments (2009-present) and has served in other fund officer roles. Prior to joining Fidelity Investments, Ms. Smith served as Senior Audit Manager of Ernst & Young LLP (1996-2009). |
Renee Stagnone (1975) |
Year of Election or Appointment: 2013 Deputy Treasurer |
| Ms. Stagnone also serves as Deputy Treasurer of other funds. Ms. Stagnone is an employee of Fidelity Investments (1997-present). |
Linda J. Wondrack (1964) |
Year of Election or Appointment: 2014 Chief Compliance Officer |
| Ms. Wondrack also serves as Chief Compliance Officer of other funds. Ms. Wondrack is Executive Vice President and head of the Ethics Office and Asset Management Compliance for Fidelity Investments (2012-present). Ms. Wondrack also serves as Chief Compliance Officer of Fidelity SelectCo, LLC (investment adviser firm, 2014-present); Chief Compliance Officer of Impresa Management LLC (2013-present); and Chief Compliance Officer of FMR Co., Inc. (investment adviser firm), Fidelity Investments Money Management, Inc. (investment adviser firm), Fidelity Management & Research (Japan) Limited (investment adviser firm), FMR Investment Management (U.K.) Limited (investment adviser firm), Fidelity Management & Research (Hong Kong) (investment adviser firm), Fidelity Management & Research Company (investment adviser firm), FIAM LLC (investment adviser firm), and Strategic Advisers, Inc. (investment adviser firm), Ballyrock Investment Advisors LLC, and Northern Neck Investors LLC (2012-present). Previously, Ms. Wondrack served as Senior Vice President and Chief Compliance Officer for Columbia Management Investment Advisers, LLC (2005-2012); Chief Compliance Officer for certain funds within the Columbia Family of Funds (2007-2012); and Senior Vice President of Compliance Risk Management at Bank of America (2005-2010). |
Joseph F. Zambello (1957) |
Year of Election or Appointment: 2011 Deputy Treasurer |
| Mr. Zambello also serves as Deputy Treasurer of other funds. Mr. Zambello is an employee of Fidelity Investments (1991-present). Previously, Mr. Zambello served as Vice President of the Program Management Group of FMR (investment adviser firm, 2009-2011) and Vice President of the Transfer Agent Oversight Group (2005-2009). |
Annual Report
The Board of Trustees of Fidelity International Small Cap Fund voted to pay to shareholders of record at the opening of business on record date, the following distributions per share derived from capital gains realized from sales of portfolio securities, and dividends derived from net investment income:
| Pay Date | Record Date | Dividends | Capital Gains |
International Small Cap Fund | 12/07/15 | 12/04/15 | $0.293 | $0.620 |
The fund hereby designates as a capital gain dividend with respect to the taxable year ended October 2015, $19,117,976, or, if subsequently determined to be different, the net capital gain of such year.
International Small Cap Fund designates 2% of the dividends distributed during the fiscal year as qualifying for the dividends-received deduction for corporate shareholders.
International Small Cap Fund designates 100% of the dividend distributed during the fiscal year as amounts which may be taken into account as a dividend for purposes of the maximum rate under section 1(h)(11) of the Internal Revenue Code.
The amounts per share which represent income derived from sources within, and taxes paid to, foreign countries or possessions of the United States are as follows:
| Pay Date | Income | Taxes |
International Small Cap Fund | 12/08/2014 | $0.3195 | $0.0515 |
The fund will notify shareholders in January 2016 of amounts for use in preparing 2015 income tax returns.
Annual Report
Fidelity International Small Cap Fund
Each year, the Board of Trustees, including the Independent Trustees (together, the Board), votes on the renewal of the management contract with Fidelity Management & Research Company (FMR) and the sub-advisory agreements (together, the Advisory Contracts) for the fund. The Board, assisted by the advice of fund counsel and Independent Trustees' counsel, requests and considers a broad range of information relevant to the renewal of the Advisory Contracts throughout the year.
The Board meets regularly and, at each of its meetings, covers an extensive agenda of topics and materials and considers factors that are relevant to its annual consideration of the renewal of the fund's Advisory Contracts, including the services and support provided to the fund and its shareholders. The Board has established various standing committees (Committees), each composed of and chaired by Independent Trustees with varying backgrounds, to which the Board has assigned specific subject matter responsibilities in order to enhance effective decision-making by the Board. The Board, acting directly and through its Committees, requests and receives information concerning the annual consideration of the renewal of the fund's Advisory Contracts. The Board also meets as needed to consider matters specifically related to the Board's annual consideration of the renewal of the Advisory Contracts. Members of the Board may also meet with trustees of other Fidelity funds through ad hoc joint committees to discuss certain matters relevant to all of the Fidelity funds.
At its July 2015 meeting, the Board unanimously determined to renew the fund's Advisory Contracts. In reaching its determination, the Board considered all factors it believed relevant, including (i) the nature, extent, and quality of the services to be provided to the fund and its shareholders (including the investment performance of the fund); (ii) the competitiveness of the fund's management fee and total expense ratio relative to peer funds; (iii) the total costs of the services to be provided by and the profits to be realized by Fidelity from its relationship with the fund; and (iv) the extent to which (if any) economies of scale exist and would be realized as the fund grows, and whether any economies of scale are appropriately shared with fund shareholders.
In considering whether to renew the Advisory Contracts for the fund, the Board reached a determination, with the assistance of fund counsel and Independent Trustees' counsel and through the exercise of its business judgment, that the renewal of the Advisory Contracts was in the best interests of the fund and its shareholders and that the compensation payable under the Advisory Contracts was fair and reasonable. The Board's decision to renew the Advisory Contracts was not based on any single factor, but rather was based on a comprehensive consideration of all the information provided to the Board at its meetings throughout the year. The Board, in reaching its determination to renew the Advisory Contracts, was aware that shareholders of the fund have a broad range of investment choices available to them, including a wide choice among funds offered by Fidelity's competitors, and that the fund's shareholders, who have the opportunity to review and weigh the disclosure provided by the fund in its prospectus and other public disclosures, have chosen to invest in this fund, which is part of the Fidelity family of funds.
Annual Report
Board Approval of Investment Advisory Contracts and
Management Fees - continued
Nature, Extent, and Quality of Services Provided. The Board considered Fidelity's staffing as it relates to the fund, including the backgrounds of investment personnel of Fidelity, and also considered the fund's investment objective, strategies, and related investment philosophy. The Independent Trustees also had discussions with senior management of Fidelity's investment operations and investment groups. The Board considered the structure of the portfolio manager compensation program and whether this structure provides appropriate incentives to act in the best interests of the fund. Additionally, the Board considered the portfolio managers' investments, if any, in the funds that they manage.
Resources Dedicated to Investment Management and Support Services. The Board and the Fund Oversight and Research Committees reviewed the general qualifications and capabilities of Fidelity's investment staff, including its size, education, experience, and resources, as well as Fidelity's approach to recruiting, training, managing, and compensating investment personnel. The Board noted that Fidelity has continued to increase the resources devoted to non-U.S. offices, including expansion of Fidelity's global investment organization. The Board also noted that Fidelity's analysts have extensive resources, tools and capabilities that allow them to conduct sophisticated quantitative and fundamental analysis, as well as credit analysis of issuers, counterparties and guarantors. Further, the Board considered that Fidelity's investment professionals have sufficient access to global information and data so as to provide competitive investment results over time, and that those professionals also have access to sophisticated tools that permit them to assess portfolio construction and risk and performance attribution characteristics continuously, as well as to transmit new information and research conclusions rapidly around the world. Additionally, in its deliberations, the Board considered Fidelity's trading, risk management, and compliance capabilities and resources, which are integral parts of the investment management process.
Shareholder and Administrative Services. The Board considered (i) the nature, extent, quality, and cost of advisory, administrative, and shareholder services performed by FMR, the sub-advisers (together with FMR, the Investment Advisers), and their affiliates under the Advisory Contracts and under separate agreements covering transfer agency, pricing and bookkeeping, and securities lending services for the fund; (ii) the nature and extent of the supervision of third party service providers, principally custodians and subcustodians; and (iii) the resources devoted to, and the record of compliance with, the fund's compliance policies and procedures. The Board also reviewed the allocation of fund brokerage, including allocations to brokers affiliated with the Investment Advisers, the use of brokerage commissions to pay fund expenses, and the use of "soft" commission dollars to pay for research services.
Annual Report
The Board noted that the growth of fund assets over time across the complex allows Fidelity to reinvest in the development of services designed to enhance the value or convenience of the Fidelity funds as investment vehicles. These services include 24-hour access to account information and market information through telephone representatives and over the Internet, investor education materials and asset allocation tools, and the expanded availability of Fidelity Investor Centers.
In 2014, the Board formed an ad hoc Committee on Transfer Agency Fees to review the variety of transfer agency fee structures throughout the industry and Fidelity's competitive positioning with respect to industry participants.
Investment in a Large Fund Family. The Board considered the benefits to shareholders of investing in a Fidelity fund, including the benefits of investing in a fund that is part of a large family of funds offering a variety of investment disciplines and providing a large variety of mutual fund investor services. The Board noted that Fidelity had taken, or had made recommendations that resulted in the Fidelity funds taking, a number of actions over the previous year that benefited particular funds, including (i) continuing to dedicate additional resources to investment research and to the support of the senior management team that oversees asset management; (ii) continuing efforts to enhance Fidelity's global research capabilities; (iii) launching new funds and making other enhancements to meet client needs; (iv) reducing management fees and total expenses for certain index funds and diversified international funds; (v) continuing to launch dedicated lower cost underlying funds to meet portfolio construction needs related to expanding underlying fund options for Fidelity funds of funds, specifically for the Freedom Fund product lines; (vi) rationalizing product lines and gaining increased efficiencies through fund mergers; (vii) launching active fixed-income exchange-traded funds; (viii) continuing to develop, acquire and implement systems and technology to improve services to the funds and information security and to increase efficiency; (ix) implementing investment enhancements to further strengthen Fidelity's target date product line to increase investors' probability of success in achieving their goals; (x) modifying the eligibility criteria for certain share classes to accommodate roll-over assets from employer-sponsored retirement plans; (xi) launching a new Class W of the Freedom Index Funds to attract and retain Fidelity record-kept retirement plan assets; and (xii) implementing changes to Fidelity's money market product line in response to recent money market regulatory reforms.
Investment Performance. The Board considered whether the fund has operated in accordance with its investment objective, as well as its record of compliance with its investment restrictions and its performance history. The Board noted that there was a portfolio management change for the fund in March 2014.
Annual Report
Board Approval of Investment Advisory Contracts and
Management Fees - continued
The Board took into account discussions with representatives of the Investment Advisers about fund investment performance that occur at Board meetings throughout the year. In this regard the Board noted that as part of regularly scheduled fund reviews and other reports to the Board on fund performance, the Board considers annualized return information for the fund, for different time periods, measured against a securities market index ("benchmark index") and a peer group of funds with similar objectives ("peer group"), if any. In its evaluation of fund investment performance, the Board gave particular attention to information indicating changes in performance of certain Fidelity funds for specific time periods and discussed with the Investment Advisers the reasons for any overperformance or underperformance.
In addition to reviewing absolute and relative fund performance, the Independent Trustees periodically consider the appropriateness of fund performance metrics in evaluating the results achieved. In general, the Independent Trustees believe that fund performance should be evaluated based on net performance (after fees and expenses) of both the highest performing and lowest performing fund share classes, where applicable, compared to appropriate benchmark indices, over appropriate time periods that may include full market cycles, and compared to peer groups, as applicable, over the same periods, taking into account relevant factors including the following: general market conditions; issuer-specific information; and fund cash flows and other factors.
The Independent Trustees recognize that shareholders evaluate performance on a net basis over their own holding periods, for which one-, three-, and five-year periods are often used as a proxy. For this reason, the performance information reviewed by the Board also included net cumulative calendar year total return information for the fund and an appropriate benchmark index and peer group for the most recent one-, three-, and five-year periods, as shown below. Returns are shown compared to the 25th percentile (top of box, 75% beaten) and 75th percentile (bottom of box, 25% beaten) of the peer universe. Returns of the benchmark index are "net MA," i.e., adjusted for tax withholding rates applicable to U.S.-based funds organized as Massachusetts business trusts.
Annual Report
Fidelity International Small Cap Fund

The Board also considered that the fund's management fee is subject to upward or downward adjustment depending upon whether, and to what extent, the fund's investment performance for the performance period exceeds, or is exceeded by, a securities index, thus leading to a performance adjustment for the same period. The Board noted that the performance adjustment provides FMR with a strong economic incentive to seek to achieve superior performance for the fund's shareholders and helps to more closely align the interests of FMR and the shareholders of the fund.
Based on its review, the Board concluded that the nature, extent, and quality of services provided to the fund under the Advisory Contracts should benefit the shareholders of the fund.
Competitiveness of Management Fee and Total Expense Ratio. The Board considered the fund's management fee and total expense ratio compared to "mapped groups" of competitive funds and classes created for the purpose of facilitating the Trustees' competitive analysis of management fees and total expenses. Fidelity creates "mapped groups" by combining similar Lipper investment objective categories that have comparable investment mandates. Combining Lipper investment objective categories aids the Board's management fee and total expense ratio comparisons by broadening the competitive group used for comparison.
Management Fee. The Board considered two proprietary management fee comparisons for the 12-month periods shown in basis points (BP) in the chart below. The group of Lipper funds used by the Board for management fee comparisons is referred to below as the "Total Mapped Group." The Total Mapped Group is broader than the Lipper peer group used by the Board for performance comparisons because the Total Mapped Group combines several Lipper investment objective categories while the Lipper peer group does not. The Total Mapped Group comparison focuses on a fund's standing in terms of gross management fees before expense reimbursements or caps, and without giving effect to the fund's performance adjustment, relative to the total universe of funds with comparable investment mandates, regardless of whether their management fee structures also are comparable. Funds with comparable investment mandates offer exposure to similar types of securities. Funds with comparable management fee structures have similar management fee contractual arrangements (e.g., flat rate charged for advisory services, all-inclusive fee rate, etc.). "TMG %" represents the percentage of funds in the Total Mapped Group that had management fees that were lower than the fund's. For example, a hypothetical TMG % of 20% would mean that 80% of the funds in the Total Mapped Group had higher, and 20% had lower, management fees than the fund. The fund's actual TMG %s and the number of funds in the Total Mapped Group are in the chart below. The "Asset-Size Peer Group" (ASPG) comparison focuses on a fund's standing relative to a subset of non-Fidelity funds within the Total Mapped Group that are similar in size and management fee structure without taking into account performance adjustments, if any. For example, if a fund is in the first quartile of the ASPG, the fund's management fee ranks in the least expensive or lowest 25% of funds in the ASPG. The ASPG represents at least 15% of the funds in the Total Mapped Group with comparable asset size and management fee structures, subject to a minimum of 50 funds (or all funds in the Total Mapped Group if fewer than 50). Additional information, such as the ASPG quartile in which the fund's management fee rate ranked and the impact of the fund's performance adjustment, is also included in the chart and considered by the Board.
Annual Report
Board Approval of Investment Advisory Contracts and
Management Fees - continued
Fidelity International Small Cap Fund
Annual Report
The Board noted that the fund's management fee rate ranked below the median of its Total Mapped Group and below the median of its ASPG for 2014. The Board also noted the effect of the fund's performance adjustment, if any, on the fund's management fee ranking.
Furthermore, the Board considered that shareholders approved a prospective change in the index used to calculate the fund's performance adjustment, beginning April 1, 2014. The Board also considered that, because the performance adjustment is based on a rolling 36-month measurement period, during a transition period the fund's performance is compared to a blended index return that reflects the performance of the former index for the portion of the measurement period prior to April 1, 2014 and the performance of the current index for the remainder of the measurement period. The Board noted that the fund's performance adjustment for 2014 shown in the chart above reflects the effect of using the blended index return to calculate the fund's performance adjustment.
The Board noted that, in 2014, the ad hoc Committee on Group Fee was formed by it and other Fidelity fund boards to conduct an in-depth review of the "group fee" component of the management fee of funds with such management fee structures. Committee focus included the mechanics of the group fee, the competitive landscape of group fee structures, Fidelity funds with no group fee component and investment products not included in group fee assets. The Board also considered that, for funds subject to the group fee, FMR agreed to voluntarily waive fees over a specified period of time in amounts designed to account for assets converted from certain funds to certain collective investment trusts.
Annual Report
Board Approval of Investment Advisory Contracts and
Management Fees - continued
The Board also noted that, in 2013, the ad hoc Committee on Management Fees was formed to conduct an in-depth review of the management fee rates of Fidelity's active equity mutual funds. The Committee focused on the following areas: (i) standard fee structures; (ii) research consumption and trading evolution; (iii) management fee competitiveness/profitability by category; and (iv) factors that drive institutional pricing.
Based on its review, the Board concluded that the fund's management fee is fair and reasonable in light of the services that the fund receives and the other factors considered.
Total Expense Ratio. In its review of each class's total expense ratio, the Board considered the fund's management fee as well as other fund or class expenses, as applicable, such as transfer agent fees, pricing and bookkeeping fees, fund-paid 12b-1 fees, and custodial, legal, and audit fees. The Board noted the impact of the fund's performance adjustment. The Board also noted that Fidelity may agree to waive fees and expenses from time to time, and the extent to which, if any, it has done so for the fund. As part of its review, the Board also considered the current and historical total expense ratios of each class of the fund compared to competitive fund median expenses. Each class of the fund is compared to those funds and classes in the Total Mapped Group (used by the Board for management fee comparisons) that have a similar sales load structure.
The Board noted that the total expense ratio of each of Class A, Class B, Class C, Class I, and the retail class ranked below its competitive median for 2014 and the total expense ratio of Class T ranked above its competitive median for 2014. The Board considered that, in general, various factors can affect total expense ratios. The Board noted that the total expense ratio of Class T was above the competitive median primarily because of higher 12b-1 fees on Class T as compared to most competitor funds. Class T has a higher 12b-1 fee, but a lower front-end sales charge, than traditionally priced front-end sales charge classes. The Board considered that Class T is primarily sold load-waived in the retirement plan market where its 0.50% 12b-1 fee is comparable to competing no-load, higher 12b-1 fee classes designed specifically for retirement plans. The Board noted that the fund offers multiple classes, each of which has a different sales load and 12b-1 fee structure, and that the multiple structures are intended to offer a range of pricing options for the intermediary market. The Board also noted that the total expense ratios of the classes vary primarily by the level of their 12b-1 fees, although differences in transfer agent fees may also cause expenses to vary from class to class.
Fees Charged to Other Fidelity Clients. The Board also considered Fidelity fee structures and other information with respect to clients of Fidelity, such as other funds advised or subadvised by Fidelity, pension plan clients, and other institutional clients with similar mandates. The Board noted the findings of the 2013 ad hoc joint committee (created with the board of other Fidelity funds), which reviewed and compared Fidelity's institutional investment advisory business with its business of providing services to the Fidelity funds, including the differences in services provided, fees charged, and costs incurred, as well as competition in their respective marketplaces.
Annual Report
Based on its review of total expense ratios and fees charged to other Fidelity clients, the Board concluded that, although Class T was above the median of the universe presented for comparison, the total expense ratio of each class of the fund was reasonable in light of the services that the fund and its shareholders receive and the other factors considered.
Costs of the Services and Profitability. The Board considered the revenues earned and the expenses incurred by Fidelity in conducting the business of developing, marketing, distributing, managing, administering and servicing the fund and servicing the fund's shareholders. The Board also considered the level of Fidelity's profits in respect of all the Fidelity funds.
On an annual basis, Fidelity presents to the Board information about the profitability of its relationship with the fund. Fidelity calculates profitability information for each fund, as well as aggregate profitability information for groups of Fidelity funds and all Fidelity funds, using a series of detailed revenue and cost allocation methodologies which originate with the books and records of Fidelity on which Fidelity's audited financial statements are based. The Audit Committee of the Board reviews any significant changes from the prior year's methodologies.
PricewaterhouseCoopers LLP (PwC), independent registered public accounting firm and auditor to Fidelity and certain Fidelity funds, has been engaged annually by the Board as part of the Board's assessment of Fidelity's profitability analysis. PwC's engagement includes the review and assessment of the methodologies used by Fidelity in determining the revenues and expenses attributable to Fidelity's mutual fund business, and completion of agreed-upon procedures in respect of the mathematical accuracy of fund profitability and its conformity to established allocation methodologies. After considering PwC's reports issued under the engagement and information provided by Fidelity, the Board concluded that while other allocation methods may also be reasonable, Fidelity's profitability methodologies are reasonable in all material respects.
The Board also reviewed Fidelity's non-fund businesses and fall-out benefits related to the mutual fund business as well as cases where Fidelity's affiliates may benefit from or be related to the fund's business.
The Board considered the costs of the services provided by and the profits realized by Fidelity in connection with the operation of the fund and was satisfied that the profitability was not excessive.
Economies of Scale. The Board considered whether there have been economies of scale in respect of the management of the Fidelity funds, whether the Fidelity funds (including the fund) have appropriately benefited from any such economies of scale, and whether there is potential for realization of any further economies of scale. The Board considered the extent to which the fund will benefit from economies of scale as assets grow through increased services to the fund, through waivers or reimbursements, or through fee or expense ratio reductions. The Board also noted that in 2013, it and the boards of other Fidelity funds created an ad hoc committee (the Economies of Scale Committee) to analyze whether Fidelity attains economies of scale in respect of the management and servicing of the Fidelity funds, whether the Fidelity funds have appropriately benefited from such economies of scale, and whether there is potential for realization of any further economies of scale.
Annual Report
Board Approval of Investment Advisory Contracts and
Management Fees - continued
The Board recognized that the fund's management contract incorporates a "group fee" structure, which provides for lower group fee rates as total group assets increase, and for higher group fee rates as total group assets decrease (with "group assets" defined to include fund assets under FMR's management plus sector fund assets previously under FMR's management and currently managed by Fidelity SelectCo, LLC). FMR calculates the group fee rates based on a tiered asset "breakpoint" schedule that varies based on asset class. The Board considered that the group fee is designed to deliver the benefits of economies of scale to fund shareholders when total Fidelity fund assets increase, even if assets of any particular fund are unchanged or have declined, because some portion of Fidelity's costs are attributable to services provided to all Fidelity funds, and all funds benefit if those costs can be allocated among more assets. The Board concluded that, given the group fee structure, fund shareholders will benefit from lower management fees as group assets increase at the fund complex level, regardless of whether Fidelity achieves any such economies of scale.
The Board concluded, taking into account the analysis of the Economies of Scale Committee, that economies of scale, if any, are being appropriately shared between fund shareholders and Fidelity.
Additional Information Requested by the Board. In order to develop fully the factual basis for consideration of the Fidelity funds' Advisory Contracts, the Board requested and received additional information on certain topics, including: (i) fund performance trends and Fidelity's long-term strategies for certain funds; (ii) the various share classes employed by Fidelity and the attributes of each class, together with similar information on the distribution and servicing payments made by Fidelity or the funds to third-party participants in the distribution channels; (iii) fund profitability, and fund performance in relation to fund profitability; (iv) the methodology with respect to evaluating competitive fund data and peer group classifications and fee comparisons; (v) annual fund profitability margins, with particular focus on certain funds with negative margins; (vi) the realization of fall-out benefits in certain Fidelity business units; (vii) economies of scale and the way in which they are shared with fund shareholders; (viii) Fidelity's group fee structures, including the group fee schedule of breakpoints; (ix) the impact of cost containment measures on the funds; and (x) the transfer agent fee structure.
Annual Report
Based on its evaluation of all of the conclusions noted above, and after considering all factors it believed relevant, the Board concluded that the advisory fee structures are fair and reasonable, and that the fund's Advisory Contracts should be renewed.
Annual Report
Investment Adviser
Fidelity Management & Research Company
Boston, MA
Investment Sub-Advisers
FMR Co., Inc.
FMR Investment Management
(U.K.) Limited
Fidelity Management & Research
(Hong Kong) Limited
Fidelity Management & Research
(Japan) Limited
FIL Investment Advisors
FIL Investments (Japan) Limited
FIL Investment Advisors (UK)
Limited
General Distributor
Fidelity Distributors Corporation
Smithfield, RI
Transfer and Service Agents
Fidelity Investments Institutional
Operations Company, Inc.
Boston, MA
Fidelity Service Company, Inc.
Boston, MA
Custodian
The Bank of New York Mellon
New York, NY
The Fidelity Telephone Connection
Mutual Fund 24-Hour Service
Exchanges/Redemptions
and Account Assistance 1-800-544-6666
Product Information 1-800-544-8888
Retirement Accounts 1-800-544-4774
(8 a.m. - 9 p.m.)
TDD Service 1-800-544-0118
for the deaf and hearing impaired
(9 a.m. - 9 p.m. Eastern time)
Fidelity Automated Service
Telephone (FAST®)
1-800-544-5555

Automated line for quickest service
(Fidelity Investment logo)(registered trademark)
Corporate Headquarters
245 Summer St., Boston, MA 02210
www.fidelity.com
ISC-UANN-1215
1.793584.112
(Fidelity Investment logo)(registered trademark)
Fidelity Advisor®
International Small Cap
Fund - Class A, Class T, Class B
and Class C
Annual Report
October 31, 2015
(Fidelity Cover Art)
Class A, Class T, Class B, and
Class C are classes of Fidelity®
International Small Cap Fund
Contents
Performance | (Click Here) | How the fund has done over time. |
Management's Discussion of Fund Performance | (Click Here) | The Portfolio Manager's review of fund performance and strategy. |
Shareholder Expense Example | (Click Here) | An example of shareholder expenses. |
Investment Changes | (Click Here) | A summary of major shifts in the fund's investments over the past six months. |
Investments | (Click Here) | A complete list of the fund's investments with their market values. |
Financial Statements | (Click Here) | Statements of assets and liabilities, operations, and changes in net assets, as well as financial highlights. |
Notes | (Click Here) | Notes to financial statements. |
Report of Independent Registered Public Accounting Firm | (Click Here) | |
Trustees and Officers | (Click Here) | |
Distributions | (Click Here) | |
Board Approval of Investment Advisory Contracts and Management Fees | (Click Here) | |
To view a fund's proxy voting guidelines and proxy voting record for the 12-month period ended June 30, visit http://www.fidelity.com/proxyvotingresults or visit the Securities and Exchange Commission's (SEC) web site at http://www.sec.gov. You may also call 1-877-208-0098 to request a free copy of the proxy voting guidelines.
Standard & Poor's, S&P and S&P 500 are registered service marks of The McGraw-Hill Companies, Inc. and have been licensed for use by Fidelity Distributors Corporation.
Other third-party marks appearing herein are the property of their respective owners.
All other marks appearing herein are registered or unregistered trademarks or service marks of FMR LLC or an affiliated company. © 2015 FMR LLC. All rights reserved.
Annual Report
This report and the financial statements contained herein are submitted for the general information of the shareholders of the fund. This report is not authorized for distribution to prospective investors in the fund unless preceded or accompanied by an effective prospectus.
A fund files its complete schedule of portfolio holdings with the SEC for the first and third quarters of each fiscal year on Form N-Q. Forms N-Q are available on the SEC's web site at http://www.sec.gov. A fund's Forms N-Q may be reviewed and copied at the SEC's Public Reference Room in Washington, DC. Information regarding the operation of the SEC's Public Reference Room may be obtained by calling 1-800-SEC-0330. For a complete list of a fund's portfolio holdings, view the most recent holdings listing, semiannual report, or annual report on Fidelity's web site at http://www.fidelity.com, http://www.advisor.fidelity.com, or http://www.401k.com, as applicable.
NOT FDIC INSURED • MAY LOSE VALUE • NO BANK GUARANTEE
Neither the fund nor Fidelity Distributors Corporation is a bank.
Annual Report
Average annual total return reflects the change in the value of an investment, assuming reinvestment of the class' distributions from dividend income and capital gains (the profits earned upon the sale of securities that have grown in value, if any) and assuming a constant rate of performance each year. The $10,000 table and the fund's returns do not reflect the deduction of taxes that a shareholder would pay on fund distributions or the redemption of fund shares. During periods of reimbursement by Fidelity, a fund's total return will be greater than it would be had the reimbursement not occurred. How a fund did yesterday is no guarantee of how it will do tomorrow. Returns reflect the conversion of Class B shares to Class A shares after a maximum of seven years.
Average Annual Total Returns
Periods ended October 31, 2015 | Past 1
year | Past 5
years | Past 10
years |
Class A (incl. 5.75% sales charge)† | 0.10% | 6.22% | 5.90% |
Class T (incl. 3.50% sales charge)† | 2.19% | 6.45% | 5.88% |
Class B (incl. contingent deferred sales charge) A,† | 0.87% | 6.36% | 5.97% |
Class C (incl. contingent deferred sales charge) B,† | 4.46% | 6.70% | 5.74% |
A Class B shares' contingent deferred sales charges included in the past one year, past five years, and past ten years total return figures are 5%, 2%, and 0%, respectively.
B Class C shares' contingent deferred sales charges included in the past one year, past five years, and past ten years total return figures are 1%, 0%, and 0%, respectively.
† Prior to April 1, 2014, the fund compared its performance to a different benchmark. The fund's historical performance may not represent its current investment policies.
Annual Report
$10,000 Over 10 Years
Let's say hypothetically that $10,000 was invested in Fidelity Advisor® International Small Cap Fund - Class A on October 31, 2005, and the current 5.75% sales charge was paid. The chart shows how the value of your investment would have changed, and also shows how the MSCI ACWI (All Country World Index) ex USA Small Cap Index performed over the same period.
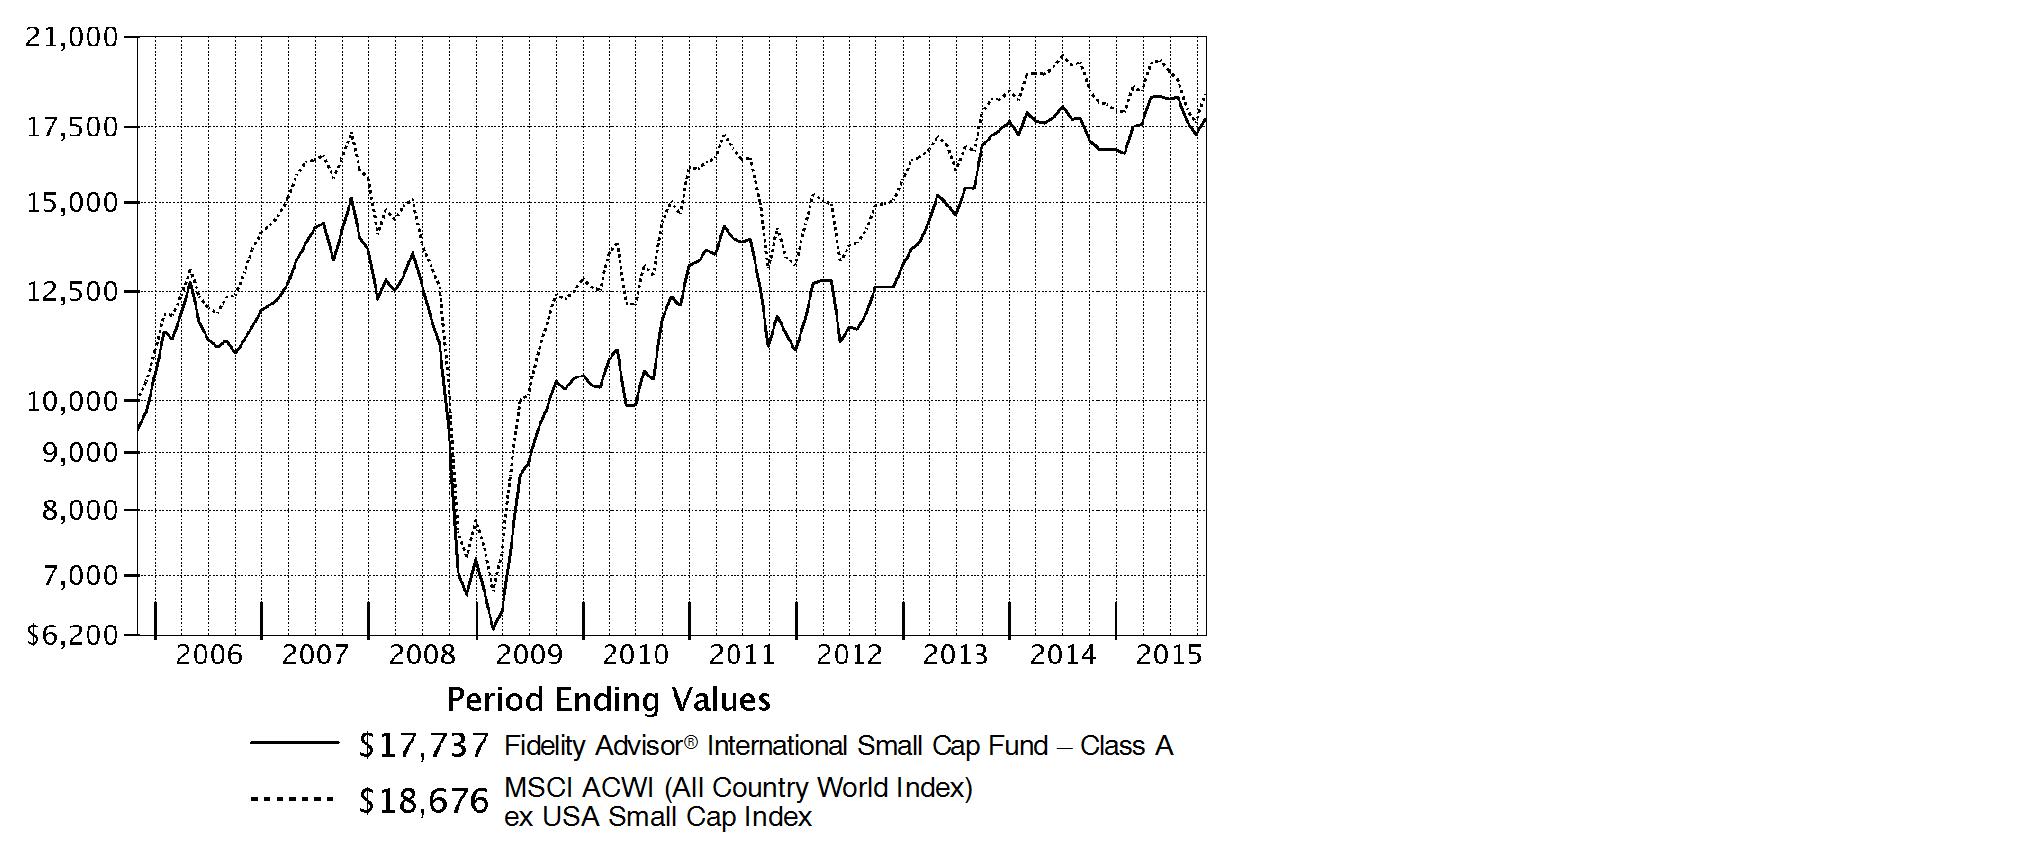
Annual Report
Market Recap: International equities suffered a moderate setback for the 12 months ending October 31, 2015, held back by a collapse in commodities prices that hurt resources-related sectors and geographies. The MSCI ACWI (All Country World Index) ex USA Index returned -4.55% for the period, affected also by concerns about global economic growth. Commodity producers remained under pressure for much of the past year, largely related to economic deceleration in China (-1%), the world's second-largest economy and a leading consumer of raw materials. This effect was exacerbated by U.S. dollar strength relative to global currencies, which weighed on commodities priced in dollars and acutely impacted equity returns within regions most exposed to resources prices. The emerging-markets group, for example, returned about -15% this period. Canada, a significant energy producer, returned roughly -17%. Net energy consumer Japan (+9%) was the best-performing region by far. Only about a quarter of the nearly 50 index countries managed a gain this period: Ireland (+19%) - the EU's fastest-growing economy - and Israel (+17%) proved top performers; Greece (-56%) and Brazil (-46%), among the worst. As for sectors, energy (-25%) and materials (-16%) declined sharply, whereas the two consumer sectors each gained about 6%.
Comments from Portfolio Manager Samuel Chamovitz: For the year, the fund's share classes (excluding sales charges, if applicable) posted mid-single-digit gains and considerably outdistanced the 1.62% return of the benchmark MSCI ACWI (All Country World Index) ex USA Small Cap Index. Stock selection in information technology, financials and consumer staples was especially beneficial to performance versus the benchmark. Geographically, stock picking in Japan, Switzerland, Israel and New Zealand stood out as positives. The top contributor was VZ Holding, a Switzerland-based provider of financial advisory and asset management services. VZ grew its market share on the strength of its asset management products and investor education initiatives. Other contributors included BGF Retail, a South Korean operator of convenience stores employing a franchise model, Israel-based flavors and fragrances maker Frutarom Industries, and Japanese drug-store chain Tsuruha Holdings. Conversely, stock selection in the United Kingdom and Ireland, as well as non-benchmark exposure to the U.S., were negatives. Relative results also were affected by a downward fair-value pricing adjustment of 0.56 percentage points. Our largest relative detractor was BW Offshore, listed on the Oslo Stock Exchange. This firm builds and operates Floating Production Storage and Offloading (FPSO) vessels used in offshore oil production. Another meaningful detractor was Petra Diamonds, a supplier of rough diamonds to the international market.
The views expressed above reflect those of the portfolio manager(s) only through the end of the period as stated on the cover of this report and do not necessarily represent the views of Fidelity or any other person in the Fidelity organization. Any such views are subject to change at any time based upon market or other conditions and Fidelity disclaims any responsibility to update such views. These views may not be relied on as investment advice and, because investment decisions for a Fidelity fund are based on numerous factors, may not be relied on as an indication of trading intent on behalf of any Fidelity fund.
Annual Report
Shareholder Expense Example
As a shareholder of the Fund, you incur two types of costs: (1) transaction costs, including sales charges (loads) on purchase payments or redemption proceeds, redemption fees and (2) ongoing costs, including management fees, distribution and/or service (12b-1) fees and other Fund expenses. This Example is intended to help you understand your ongoing costs (in dollars) of investing in the Fund and to compare these costs with the ongoing costs of investing in other mutual funds.
The Example is based on an investment of $1,000 invested at the beginning of the period and held for the entire period (May 1, 2015 to October 31, 2015).
Actual Expenses
The first line of the accompanying table for each class of the Fund provides information about actual account values and actual expenses. You may use the information in this line, together with the amount you invested, to estimate the expenses that you paid over the period. Simply divide your account value by $1,000.00 (for example, an $8,600 account value divided by $1,000.00 = 8.6), then multiply the result by the number in the first line for a class of the Fund under the heading entitled "Expenses Paid During Period" to estimate the expenses you paid on your account during this period. A small balance maintenance fee of $12.00 that is charged once a year may apply for certain accounts with a value of less than $2,000. This fee is not included in the table below. If it was, the estimate of expenses you paid during the period would be higher, and your ending account value lower, by this amount. In addition, the Fund, as a shareholder in the underlying Fidelity Central Funds, will indirectly bear its pro-rata share of the fees and expenses incurred by the underlying Fidelity Central Funds. These fees and expenses are not included in the Fund's annualized expense ratio used to calculate the expense estimate in the table below.
Hypothetical Example for Comparison Purposes
The second line of the accompanying table for each class of the Fund provides information about hypothetical account values and hypothetical expenses based on a Class' actual expense ratio and an assumed rate of return of 5% per year before expenses, which is not the Class' actual return. The hypothetical account values and expenses may not be used to estimate the actual ending account balance or expenses you paid for the period. You may use this information to compare the ongoing costs of investing in the Fund and other funds. To do so, compare this 5% hypothetical example with the 5% hypothetical examples that appear in the shareholder reports of the other funds. A small balance maintenance fee of $12.00 that is charged once a year may apply for certain accounts with a value of less than $2,000. This fee is not included in the table below. If it was, the estimate of expenses you paid during the period would be higher, and your ending account value lower, by this amount. In addition, the Fund, as a shareholder in the underlying Fidelity Central Funds, will indirectly bear its pro-rata share of the fees and expenses incurred by the underlying Fidelity Central Funds. These fees and expenses are not included in the Fund's annualized expense ratio used to calculate the expense estimate in the table below.
Annual Report
Please note that the expenses shown in the table are meant to highlight your ongoing costs only and do not reflect any transaction costs. Therefore, the second line of the table is useful in comparing ongoing costs only, and will not help you determine the relative total costs of owning different funds. In addition, if these transactional costs were included, your costs would have been higher.
| Annualized
Expense RatioB | Beginning
Account Value
May 1, 2015 | Ending
Account Value
October 31, 2015 | Expenses Paid
During PeriodC
May 1, 2015
to October 31, 2015 |
Class A | 1.63% | | | |
Actual | | $ 1,000.00 | $ 955.00 | $ 8.03 |
HypotheticalA | | $ 1,000.00 | $ 1,016.99 | $ 8.29 |
Class T | 1.92% | | | |
Actual | | $ 1,000.00 | $ 953.90 | $ 9.46 |
HypotheticalA | | $ 1,000.00 | $ 1,015.53 | $ 9.75 |
Class B | 2.42% | | | |
Actual | | $ 1,000.00 | $ 951.60 | $ 11.90 |
HypotheticalA | | $ 1,000.00 | $ 1,013.01 | $ 12.28 |
Class C | 2.41% | | | |
Actual | | $ 1,000.00 | $ 951.50 | $ 11.85 |
HypotheticalA | | $ 1,000.00 | $ 1,013.06 | $ 12.23 |
International Small Cap | 1.37% | | | |
Actual | | $ 1,000.00 | $ 956.80 | $ 6.76 |
HypotheticalA | | $ 1,000.00 | $ 1,018.30 | $ 6.97 |
Class I | 1.28% | | | |
Actual | | $ 1,000.00 | $ 957.20 | $ 6.31 |
HypotheticalA | | $ 1,000.00 | $ 1,018.75 | $ 6.51 |
A 5% return per year before expenses
B Annualized expense ratio reflects expenses net of applicable fee waivers.
C Expenses are equal to each Class' annualized expense ratio, multiplied by the average account value over the period, multiplied by 184/365 (to reflect the one-half year period).
Annual Report
Investment Changes (Unaudited)
Asset Allocation as of October 31, 2015 |
| % of fund's
net assets | % of fund's net assets
6 months ago |
Stocks | 94.6 | 94.6 |
Short-Term Investments and Net Other Assets (Liabilities) | 5.4 | 5.4 |
Top Ten Stocks as of October 31, 2015 |
| % of fund's
net assets | % of fund's net assets
6 months ago |
EBOS Group Ltd. (New Zealand, Health Care Providers & Services) | 1.1 | 1.2 |
Vontobel Holdings AG (Switzerland, Capital Markets) | 1.1 | 1.2 |
Frutarom Industries Ltd. (Israel, Chemicals) | 1.1 | 1.1 |
VZ Holding AG (Switzerland, Capital Markets) | 1.1 | 0.9 |
Micro Focus International PLC (United Kingdom, Software) | 1.1 | 1.0 |
United Drug PLC (United Kingdom) (Ireland, Health Care Providers & Services) | 1.0 | 1.2 |
Regus PLC (Bailiwick of Jersey, Commercial Services & Supplies) | 1.0 | 0.9 |
Hiscox Ltd. (Bermuda, Insurance) | 1.0 | 0.8 |
Amer Group PLC (A Shares) (Finland, Leisure Products) | 1.0 | 0.9 |
JSR Corp. (Japan, Chemicals) | 1.0 | 0.9 |
| 10.5 | |
Market Sectors as of October 31, 2015 |
| % of fund's
net assets | % of fund's net assets
6 months ago |
Financials | 22.6 | 21.9 |
Industrials | 18.9 | 17.9 |
Consumer Discretionary | 16.3 | 17.2 |
Information Technology | 10.0 | 9.0 |
Health Care | 8.5 | 8.8 |
Consumer Staples | 7.5 | 7.0 |
Materials | 6.9 | 7.9 |
Energy | 3.5 | 4.3 |
Utilities | 0.4 | 0.4 |
Telecommunication Services | 0.0 | 0.2 |
Annual Report
Investments October 31, 2015
Showing Percentage of Net Assets
Common Stocks - 94.4% |
| Shares | | Value |
Australia - 2.9% |
Austal Ltd. | 1,589,594 | | $ 2,562,477 |
Bradken Ltd. (a) | 1,226,491 | | 840,387 |
Challenger Ltd. | 960,083 | | 5,598,467 |
Charter Hall Group unit | 426,508 | | 1,356,865 |
GUD Holdings Ltd. | 726,825 | | 4,145,011 |
Imdex Ltd. (a) | 7,817,399 | | 1,246,756 |
Life Healthcare Group Ltd. | 1,826,612 | | 3,987,804 |
Nanosonics Ltd. (a) | 1,719,782 | | 1,953,007 |
RCG Corp. Ltd. | 2,822,812 | | 2,877,480 |
SomnoMed Ltd. (a)(d) | 584,445 | | 1,110,367 |
TOTAL AUSTRALIA | | 25,678,621 |
Austria - 1.6% |
Andritz AG | 115,532 | | 5,818,650 |
IMMOFINANZ Immobilien Anlagen AG (a) | 1,461,643 | | 3,748,214 |
RHI AG | 208,140 | | 4,708,085 |
TOTAL AUSTRIA | | 14,274,949 |
Bailiwick of Jersey - 1.4% |
Kennedy Wilson Europe Real Estate PLC | 193,806 | | 3,573,305 |
Regus PLC | 1,702,000 | | 8,779,246 |
TOTAL BAILIWICK OF JERSEY | | 12,352,551 |
Belgium - 0.9% |
Barco NV | 55,883 | | 3,672,356 |
Econocom Group SA (d) | 434,901 | | 3,888,082 |
TOTAL BELGIUM | | 7,560,438 |
Bermuda - 1.9% |
BW Offshore Ltd. | 6,094,227 | | 2,539,037 |
Hiscox Ltd. | 571,855 | | 8,529,206 |
Petra Diamonds Ltd. | 2,544,174 | | 2,927,847 |
Travelport Worldwide Ltd. | 222,200 | | 3,010,810 |
TOTAL BERMUDA | | 17,006,900 |
Brazil - 0.3% |
Banco ABC Brasil SA | 31,937 | | 69,976 |
MAHLE Metal Leve SA | 349,000 | | 2,118,497 |
TOTAL BRAZIL | | 2,188,473 |
British Virgin Islands - 0.2% |
Gem Diamonds Ltd. | 967,662 | | 1,476,830 |
Common Stocks - continued |
| Shares | | Value |
Canada - 4.0% |
AutoCanada, Inc. (d) | 132,484 | | $ 3,209,768 |
Constellation Software, Inc. | 4,766 | | 2,059,338 |
Dorel Industries, Inc. Class B (sub. vtg.) | 113,703 | | 2,891,270 |
Genesis Land Development Corp. (a) | 965,422 | | 2,178,032 |
Jean Coutu Group, Inc. Class A (sub. vtg.) | 291,013 | | 4,435,522 |
Lassonde Industries, Inc. Class A (sub. vtg.) | 31,269 | | 3,707,753 |
McCoy Global, Inc. | 1,335,870 | | 3,023,994 |
Open Text Corp. | 132,548 | | 6,143,878 |
ShawCor Ltd. Class A | 114,685 | | 2,433,855 |
Whitecap Resources, Inc. (d) | 563,453 | | 5,002,821 |
TOTAL CANADA | | 35,086,231 |
Cayman Islands - 3.7% |
AMVIG Holdings Ltd. | 14,266,000 | | 6,536,782 |
Bonjour Holdings Ltd. (d) | 44,460,800 | | 1,745,995 |
China High Precision Automation Group Ltd. (a) | 712,000 | | 1 |
China Metal Recycling (Holdings) Ltd. (a) | 436,800 | | 1 |
Greatview Aseptic Pack Co. Ltd. | 5,391,000 | | 2,530,849 |
Haitian International Holdings Ltd. | 1,491,000 | | 2,608,802 |
Lifestyle International Holdings Ltd. | 3,212,500 | | 4,645,766 |
Pico Far East Holdings Ltd. | 18,482,000 | | 4,906,092 |
SITC International Holdings Co. Ltd. | 11,482,000 | | 5,893,585 |
Value Partners Group Ltd. | 3,286,000 | | 3,479,602 |
TOTAL CAYMAN ISLANDS | | 32,347,475 |
Chile - 0.8% |
Quinenco SA | 2,409,395 | | 4,773,149 |
Vina San Pedro SA | 335,133,168 | | 2,642,103 |
TOTAL CHILE | | 7,415,252 |
Denmark - 1.0% |
Jyske Bank A/S (Reg.) (a) | 171,303 | | 8,362,651 |
Finland - 2.4% |
Amer Group PLC (A Shares) | 301,945 | | 8,473,503 |
Asiakastieto Group Oyj (a) | 181,623 | | 2,800,099 |
Cramo Oyj (B Shares) | 182,510 | | 3,351,642 |
Olvi PLC (A Shares) | 100,438 | | 2,435,349 |
Tikkurila Oyj | 230,646 | | 4,233,083 |
TOTAL FINLAND | | 21,293,676 |
France - 3.3% |
ALTEN | 108,019 | | 5,606,562 |
Common Stocks - continued |
| Shares | | Value |
France - continued |
Coface SA | 319,302 | | $ 2,585,300 |
Rexel SA | 251,900 | | 3,443,133 |
The Lisi Group | 143,009 | | 3,491,169 |
The Vicat Group (d) | 85,756 | | 5,497,782 |
Thermador Groupe SA | 26,557 | | 2,482,289 |
Wendel SA | 46,435 | | 5,573,444 |
TOTAL FRANCE | | 28,679,679 |
Germany - 3.4% |
AURELIUS AG | 103,235 | | 4,606,738 |
CompuGroup Medical AG | 199,249 | | 5,871,992 |
GEA Group AG | 72,166 | | 2,893,765 |
LEG Immobilien AG | 27,307 | | 2,178,542 |
LEONI AG | 125,097 | | 5,107,711 |
mutares AG | 113,000 | | 2,218,049 |
OSRAM Licht AG | 88,435 | | 5,203,716 |
SHW Group | 62,339 | | 1,633,230 |
TOTAL GERMANY | | 29,713,743 |
Greece - 0.4% |
Metka SA | 394,216 | | 3,784,452 |
Hong Kong - 1.9% |
Dah Sing Banking Group Ltd. | 2,745,600 | | 5,209,923 |
Far East Horizon Ltd. | 3,735,000 | | 3,106,680 |
Magnificent Estates Ltd. | 105,926,000 | | 3,000,694 |
Shun Ho Technology Holdings Ltd. (a) | 1,650,033 | | 563,312 |
Techtronic Industries Co. Ltd. | 1,264,000 | | 4,620,776 |
TOTAL HONG KONG | | 16,501,385 |
India - 0.6% |
Edelweiss Financial Services Ltd. | 3,486,519 | | 3,164,299 |
McLeod Russel India Ltd. (a) | 883,018 | | 2,317,244 |
TOTAL INDIA | | 5,481,543 |
Indonesia - 0.5% |
PT ACE Hardware Indonesia Tbk | 43,202,200 | | 2,103,157 |
PT Media Nusantara Citra Tbk | 16,013,700 | | 2,077,798 |
TOTAL INDONESIA | | 4,180,955 |
Ireland - 1.8% |
C&C Group PLC | 895,002 | | 3,572,606 |
Common Stocks - continued |
| Shares | | Value |
Ireland - continued |
Mincon Group PLC | 4,787,945 | | $ 3,474,942 |
United Drug PLC (United Kingdom) | 1,222,449 | | 8,955,274 |
TOTAL IRELAND | | 16,002,822 |
Isle of Man - 0.6% |
Optimal Payments PLC (a) | 1,050,400 | | 4,922,662 |
Israel - 1.1% |
Frutarom Industries Ltd. | 225,289 | | 9,735,555 |
Italy - 1.6% |
Banco di Desio e della Brianza SpA | 669,139 | | 2,289,868 |
Cerved Information Solutions SpA | 379,661 | | 2,880,710 |
Danieli & C. Officine Meccaniche SpA | 163,567 | | 3,500,201 |
Recordati SpA | 214,361 | | 5,329,676 |
TOTAL ITALY | | 14,000,455 |
Japan - 21.6% |
A/S One Corp. | 135,700 | | 4,816,903 |
Aeon Delight Co. Ltd. | 187,700 | | 5,407,309 |
Ain Holdings, Inc. | 97,300 | | 4,606,063 |
Arc Land Sakamoto Co. Ltd. | 180,700 | | 3,955,591 |
Broadleaf Co. Ltd. | 394,900 | | 4,523,418 |
Central Automotive Products Ltd. | 203,000 | | 1,477,932 |
Daiwa Industries Ltd. | 495,600 | | 3,278,728 |
Dexerials Corp. (d) | 292,400 | | 3,347,971 |
Fuji Corp. | 147,800 | | 2,784,103 |
Fukuda Denshi Co. Ltd. | 124,800 | | 6,089,695 |
Funai Soken Holdings, Inc. | 158,600 | | 2,433,164 |
GMO Internet, Inc. | 328,900 | | 4,658,251 |
Iida Group Holdings Co. Ltd. | 214,851 | | 4,026,924 |
JSR Corp. | 532,400 | | 8,408,353 |
KAWAI Musical Instruments Manufacturing Co. Ltd. | 203,600 | | 3,763,336 |
Kinugawa Rubber Industrial Co. Ltd. | 733,000 | | 4,088,732 |
Konica Minolta, Inc. | 228,400 | | 2,346,678 |
Kotobuki Spirits Co. Ltd. (d) | 79,100 | | 2,759,513 |
Leopalace21 Corp. (a) | 966,500 | | 5,149,440 |
Meitec Corp. | 145,700 | | 5,291,485 |
Message Co. Ltd. | 150,079 | | 3,699,108 |
Miraca Holdings, Inc. | 117,900 | | 5,247,173 |
Mitani Shoji Co. Ltd. | 244,700 | | 6,061,666 |
Monex Group, Inc. | 699,100 | | 1,965,183 |
Nihon House Holdings Co. Ltd. (d) | 1,020,700 | | 4,107,595 |
Nitori Holdings Co. Ltd. | 100,000 | | 7,797,893 |
Common Stocks - continued |
| Shares | | Value |
Japan - continued |
Paramount Bed Holdings Co. Ltd. | 195,000 | | $ 6,254,656 |
Ricoh Leasing Co. Ltd. | 232,900 | | 7,055,445 |
S Foods, Inc. (d) | 318,800 | | 5,541,613 |
San-Ai Oil Co. Ltd. | 589,000 | | 4,498,828 |
Shinsei Bank Ltd. | 2,824,000 | | 5,921,288 |
Ship Healthcare Holdings, Inc. | 202,200 | | 4,897,936 |
TKC Corp. | 336,500 | | 7,931,814 |
Toshiba Plant Systems & Services Corp. | 582,700 | | 6,241,559 |
Toyo Suisan Kaisha Ltd. | 116,900 | | 4,307,506 |
Tsuruha Holdings, Inc. | 104,800 | | 8,302,681 |
VT Holdings Co. Ltd. | 1,047,600 | | 6,478,390 |
Welcia Holdings Co. Ltd. | 77,700 | | 3,829,463 |
Yamada Consulting Group Co. Ltd. | 174,600 | | 5,110,414 |
TOTAL JAPAN | | 188,463,800 |
Korea (South) - 1.8% |
BGFretail Co. Ltd. | 17,709 | | 2,636,722 |
DGB Financial Group Co. Ltd. | 207,259 | | 1,924,158 |
Fila Korea Ltd. | 38,617 | | 3,382,205 |
Hy-Lok Corp. | 125,792 | | 3,514,512 |
Nice Information & Telecom, Inc. | 77,649 | | 2,920,925 |
NS Shopping Co. Ltd. | 7,760 | | 1,321,912 |
TOTAL KOREA (SOUTH) | | 15,700,434 |
Luxembourg - 0.8% |
Grand City Properties SA | 347,584 | | 6,941,129 |
Netherlands - 1.5% |
Amsterdam Commodities NV | 196,055 | | 4,934,898 |
BinckBank NV | 282,659 | | 2,493,446 |
IMCD Group BV | 142,000 | | 5,312,233 |
TOTAL NETHERLANDS | | 12,740,577 |
New Zealand - 2.0% |
EBOS Group Ltd. | 1,083,656 | | 10,016,335 |
Nuplex Industries Ltd. | 2,586,561 | | 7,461,346 |
TOTAL NEW ZEALAND | | 17,477,681 |
Norway - 1.9% |
ABG Sundal Collier ASA | 6,615,910 | | 4,983,296 |
Ekornes A/S | 331,597 | | 3,531,883 |
Common Stocks - continued |
| Shares | | Value |
Norway - continued |
Kongsberg Gruppen ASA | 329,633 | | $ 5,159,760 |
Spectrum ASA | 809,572 | | 2,810,766 |
TOTAL NORWAY | | 16,485,705 |
Portugal - 0.6% |
NOS SGPS SA | 624,100 | | 5,187,678 |
Romania - 0.4% |
Banca Transilvania SA (a) | 5,501,626 | | 3,458,855 |
Singapore - 2.3% |
Boustead Projects Pte Ltd. (a) | 618,906 | | 373,131 |
Boustead Singapore Ltd. | 2,099,820 | | 1,435,462 |
Hour Glass Ltd. | 7,926,700 | | 4,133,891 |
Interplex Holdings Ltd. | 6,290,400 | | 3,167,667 |
Mapletree Industrial (REIT) | 2,939,230 | | 3,197,260 |
OSIM International Ltd. | 3,306,600 | | 3,206,109 |
Wing Tai Holdings Ltd. | 3,973,100 | | 4,944,223 |
TOTAL SINGAPORE | | 20,457,743 |
South Africa - 0.8% |
Clicks Group Ltd. | 977,850 | | 7,143,626 |
Spain - 0.5% |
Hispania Activos Inmobiliarios SA (a) | 315,800 | | 4,757,592 |
Sweden - 0.9% |
AddTech AB (B Shares) | 198,619 | | 2,824,611 |
Coor Service Management Holding AB (a) | 474,600 | | 1,938,719 |
Ratos AB (B Shares) | 582,000 | | 3,406,078 |
TOTAL SWEDEN | | 8,169,408 |
Switzerland - 3.9% |
Allied World Assurance Co. Holdings AG | 214,004 | | 7,781,185 |
Daetwyler Holdings AG | 18,222 | | 2,556,924 |
Pargesa Holding SA | 75,506 | | 4,797,184 |
Vontobel Holdings AG | 199,296 | | 9,829,207 |
VZ Holding AG | 30,391 | | 9,469,804 |
TOTAL SWITZERLAND | | 34,434,304 |
Taiwan - 2.0% |
King's Town Bank | 3,141,000 | | 2,505,834 |
Sunspring Metal Corp. | 3,075,000 | | 4,418,566 |
Tripod Technology Corp. | 2,498,000 | | 3,862,609 |
Common Stocks - continued |
| Shares | | Value |
Taiwan - continued |
Vanguard International Semiconductor Corp. | 3,124,000 | | $ 4,036,710 |
Yung Chi Paint & Varnish Manufacturing Co. Ltd. | 1,109,000 | | 2,281,879 |
TOTAL TAIWAN | | 17,105,598 |
Thailand - 1.0% |
Delta Electronics PCL (For. Reg.) | 2,473,600 | | 5,877,746 |
TISCO Financial Group PCL | 2,495,800 | | 2,649,779 |
TOTAL THAILAND | | 8,527,525 |
Turkey - 0.4% |
Aygaz A/S | 864,000 | | 3,245,112 |
United Kingdom - 14.5% |
Aberdeen Asset Management PLC | 715,349 | | 3,823,345 |
AEW UK REIT PLC (a) | 2,258,268 | | 3,516,159 |
Alliance Pharma PLC | 1,734,982 | | 1,430,937 |
Amec Foster Wheeler PLC | 453,315 | | 4,968,684 |
Ashmore Group PLC (d) | 1,036,507 | | 4,314,274 |
BBA Aviation PLC | 2,224,598 | | 6,539,943 |
Bond International Software PLC | 899,666 | | 1,407,729 |
Brammer PLC (d) | 584,028 | | 2,073,027 |
Brewin Dolphin Holding PLC | 881,475 | | 3,668,981 |
Cineworld Group PLC | 695,276 | | 5,916,543 |
Close Brothers Group PLC | 290,880 | | 6,564,878 |
Countrywide PLC | 1,008,607 | | 7,230,139 |
Diploma PLC | 363,251 | | 3,592,321 |
Elementis PLC | 1,017,200 | | 3,678,799 |
Empiric Student Property PLC | 1,607,263 | | 2,713,144 |
Exova Group Ltd. PLC | 887,869 | | 2,035,999 |
Informa PLC | 842,548 | | 7,377,593 |
ITE Group PLC | 1,632,554 | | 3,529,735 |
James Fisher and Sons PLC | 120,505 | | 1,782,468 |
Luxfer Holdings PLC sponsored ADR | 428,009 | | 4,635,337 |
McColl's Retail Group PLC | 1,571,774 | | 3,561,879 |
Mears Group PLC | 1,047,710 | | 6,686,720 |
Meggitt PLC | 519,830 | | 2,833,644 |
Melrose PLC | 796,270 | | 3,267,684 |
Micro Focus International PLC | 476,044 | | 9,217,400 |
Moneysupermarket.com Group PLC | 778,475 | | 4,010,724 |
Sinclair Pharma PLC (a) | 6,551,214 | | 3,963,995 |
Spectris PLC | 189,347 | | 4,865,929 |
Ultra Electronics Holdings PLC | 278,425 | | 7,223,772 |
TOTAL UNITED KINGDOM | | 126,431,782 |
Common Stocks - continued |
| Shares | | Value |
United States of America - 1.2% |
Dillard's, Inc. Class A (d) | 89,894 | | $ 8,043,715 |
Hornbeck Offshore Services, Inc. (a)(d) | 152,170 | | 2,055,817 |
YOU On Demand Holdings, Inc. warrants 8/30/17 (a)(e) | 27,500 | | 3,207 |
TOTAL UNITED STATES OF AMERICA | | 10,102,739 |
TOTAL COMMON STOCKS (Cost $824,215,309) |
824,878,586
|
Nonconvertible Preferred Stocks - 0.2% |
| | | |
Brazil - 0.2% |
Banco ABC Brasil SA
(Cost $3,684,071) | 998,200 | |
2,200,075
|
Money Market Funds - 6.7% |
| | | |
Fidelity Cash Central Fund, 0.18% (b) | 45,030,641 | | 45,030,641 |
Fidelity Securities Lending Cash Central Fund, 0.19% (b)(c) | 13,666,537 | | 13,666,537 |
TOTAL MONEY MARKET FUNDS (Cost $58,697,178) |
58,697,178
|
TOTAL INVESTMENT PORTFOLIO - 101.3% (Cost $886,596,558) | | 885,775,839 |
NET OTHER ASSETS (LIABILITIES) - (1.3)% | | (11,784,036) |
NET ASSETS - 100% | $ 873,991,803 |
Legend |
(a) Non-income producing |
(b) Affiliated fund that is generally available only to investment companies and other accounts managed by Fidelity Investments. The rate quoted is the annualized seven-day yield of the fund at period end. A complete unaudited listing of the fund's holdings as of its most recent quarter end is available upon request. In addition, each Fidelity Central Fund's financial statements, which are not covered by the Fund's Report of Independent Registered Public Accounting Firm, are available on the SEC's website or upon request. |
(c) Investment made with cash collateral received from securities on loan. |
(d) Security or a portion of the security is on loan at period end. |
(e) Restricted securities - Investment in securities not registered under the Securities Act of 1933 (excluding 144A issues). At the end of the period, the value of restricted securities (excluding 144A issues) amounted to $3,207 or 0.0% of net assets. |
Additional information on each restricted holding is as follows: |
Security | Acquisition Date | Acquisition Cost |
YOU On Demand Holdings, Inc. warrants 8/30/17 | 9/14/12 | $ 0 |
Affiliated Central Funds |
Information regarding fiscal year to date income earned by the Fund from investments in Fidelity Central Funds is as follows: |
Fund | Income earned |
Fidelity Cash Central Fund | $ 61,602 |
Fidelity Securities Lending Cash Central Fund | 186,310 |
Total | $ 247,912 |
Other Information |
Categorizations in the Schedule of Investments are based on country or territory of incorporation. |
The following is a summary of the inputs used, as of October 31, 2015, involving the Fund's assets and liabilities carried at fair value. The inputs or methodology used for valuing securities may not be an indication of the risk associated with investing in those securities. For more information on valuation inputs, and their aggregation into the levels used in the table below, please refer to the Investment Valuation section in the accompanying Notes to Financial Statements. |
Valuation Inputs at Reporting Date: |
Description | Total | Level 1 | Level 2 | Level 3 |
Investments in Securities: | | | | |
Equities: | | | | |
Consumer Discretionary | $ 141,245,837 | $ 64,736,053 | $ 76,509,784 | $ - |
Consumer Staples | 66,734,541 | 35,070,458 | 31,664,083 | - |
Energy | 30,551,732 | 24,617,442 | 5,934,290 | - |
Financials | 197,971,252 | 145,172,798 | 52,798,454 | - |
Health Care | 73,624,858 | 35,568,209 | 38,056,649 | - |
Industrials | 167,680,599 | 118,410,225 | 49,270,374 | - |
Information Technology | 85,300,783 | 56,614,904 | 28,685,878 | 1 |
Materials | 60,723,947 | 42,001,206 | 18,722,740 | 1 |
Utilities | 3,245,112 | 3,245,112 | - | - |
Money Market Funds | 58,697,178 | 58,697,178 | - | - |
Total Investments in Securities: | $ 885,775,839 | $ 584,133,585 | $ 301,642,252 | $ 2 |
See accompanying notes which are an integral part of the financial statements.
Annual Report
Statement of Assets and Liabilities
| | October 31, 2015 |
| | |
Assets | | |
Investment in securities, at value (including securities loaned of $13,124,402) - See accompanying schedule: Unaffiliated issuers (cost $827,899,380) | $ 827,078,661 | |
Fidelity Central Funds (cost $58,697,178) | 58,697,178 | |
Total Investments (cost $886,596,558) | | $ 885,775,839 |
Foreign currency held at value (cost $115,306) | | 115,322 |
Receivable for investments sold | | 948,925 |
Receivable for fund shares sold | | 837,702 |
Dividends receivable | | 2,340,869 |
Distributions receivable from Fidelity Central Funds | | 31,829 |
Prepaid expenses | | 2,402 |
Other receivables | | 19,677 |
Total assets | | 890,072,565 |
| | |
Liabilities | | |
Payable for investments purchased | $ 376,272 | |
Payable for fund shares redeemed | 907,673 | |
Accrued management fee | 738,433 | |
Distribution and service plan fees payable | 20,677 | |
Other affiliated payables | 222,027 | |
Other payables and accrued expenses | 149,143 | |
Collateral on securities loaned, at value | 13,666,537 | |
Total liabilities | | 16,080,762 |
| | |
Net Assets | | $ 873,991,803 |
Net Assets consist of: | | |
Paid in capital | | $ 847,993,485 |
Undistributed net investment income | | 10,946,744 |
Accumulated undistributed net realized gain (loss) on investments and foreign currency transactions | | 15,943,085 |
Net unrealized appreciation (depreciation) on investments and assets and liabilities in foreign currencies | | (891,511) |
Net Assets | | $ 873,991,803 |
See accompanying notes which are an integral part of the financial statements.
Annual Report
Statement of Assets and Liabilities - continued
| | October 31, 2015 |
| | |
Calculation of Maximum Offering Price | | |
Class A: | | |
Net Asset Value and redemption price per share ($28,237,702 ÷ 1,244,283 shares) | | $ 22.69 |
| | |
Maximum offering price per share (100/94.25 of $22.69) | | $ 24.07 |
Class T: | | |
Net Asset Value and redemption price per share ($12,400,336 ÷ 549,894 shares) | | $ 22.55 |
| | |
Maximum offering price per share (100/96.50 of $22.55) | | $ 23.37 |
Class B: | | |
Net Asset Value and offering price per share ($390,361 ÷ 17,567 shares)A | | $ 22.22 |
| | |
Class C: | | |
Net Asset Value and offering price per share ($11,358,829 ÷ 517,141 shares)A | | $ 21.96 |
| | |
International Small Cap: | | |
Net Asset Value, offering price and redemption price per share ($811,534,198 ÷ 35,197,499 shares) | | $ 23.06 |
| | |
Class I: | | |
Net Asset Value, offering price and redemption price per share ($10,070,377 ÷ 433,304 shares) | | $ 23.24 |
A Redemption price per share is equal to net asset value less any applicable contingent deferred sales charge.
See accompanying notes which are an integral part of the financial statements.
Annual Report
Financial Statements - continued
Statement of Operations
| Year ended October 31, 2015 |
| | |
Investment Income | | |
Dividends | | $ 24,896,176 |
Interest | | 1,298 |
Income from Fidelity Central Funds | | 247,912 |
Income before foreign taxes withheld | | 25,145,386 |
Less foreign taxes withheld | | (1,896,045) |
Total income | | 23,249,341 |
| | |
Expenses | | |
Management fee | | |
Basic fee | $ 7,137,575 | |
Performance adjustment | 971,956 | |
Transfer agent fees | 2,147,993 | |
Distribution and service plan fees | 233,938 | |
Accounting and security lending fees | 403,900 | |
Custodian fees and expenses | 150,183 | |
Independent trustees' compensation | 3,595 | |
Registration fees | 91,083 | |
Audit | 156,053 | |
Legal | 2,634 | |
Miscellaneous | 8,119 | |
Total expenses before reductions | 11,307,029 | |
Expense reductions | (56,111) | 11,250,918 |
Net investment income (loss) | | 11,998,423 |
Realized and Unrealized Gain (Loss) | | |
Net realized gain (loss) on: | | |
Investment securities: | | |
Unaffiliated issuers (net of foreign taxes of $109,783) | 26,169,495 | |
Foreign currency transactions | (331,089) | |
Total net realized gain (loss) | | 25,838,406 |
Change in net unrealized appreciation (depreciation) on: Investment securities (net of decrease in deferred foreign taxes of $51,983) | 6,843,800 | |
Assets and liabilities in foreign currencies | (19,076) | |
Total change in net unrealized appreciation (depreciation) | | 6,824,724 |
Net gain (loss) | | 32,663,130 |
Net increase (decrease) in net assets resulting from operations | | $ 44,661,553 |
See accompanying notes which are an integral part of the financial statements.
Annual Report
Statement of Changes in Net Assets
| Year ended
October 31,
2015 | Year ended
October 31,
2014 |
Increase (Decrease) in Net Assets | | |
Operations | | |
Net investment income (loss) | $ 11,998,423 | $ 10,368,645 |
Net realized gain (loss) | 25,838,406 | 226,736,010 |
Change in net unrealized appreciation (depreciation) | 6,824,724 | (253,669,311) |
Net increase (decrease) in net assets resulting from operations | 44,661,553 | (16,564,656) |
Distributions to shareholders from net investment income | (7,662,528) | (4,012,676) |
Distributions to shareholders from net realized gain | (116,906,834) | (26,257,450) |
Total distributions | (124,569,362) | (30,270,126) |
Share transactions - net increase (decrease) | 53,722,708 | (201,807,331) |
Redemption fees | 103,111 | 276,780 |
Total increase (decrease) in net assets | (26,081,990) | (248,365,333) |
| | |
Net Assets | | |
Beginning of period | 900,073,793 | 1,148,439,126 |
End of period (including undistributed net investment income of $10,946,744 and undistributed net investment income of $7,150,729, respectively) | $ 873,991,803 | $ 900,073,793 |
See accompanying notes which are an integral part of the financial statements.
Annual Report
Financial Highlights - Fidelity International Small Cap Fund Class A
Years ended October 31, | 2015 | 2014 | 2013 | 2012 | 2011 |
Selected Per-Share Data | | | | | |
Net asset value, beginning of period | $ 24.98 | $ 26.34 | $ 19.74 | $ 18.97 | $ 20.42 |
Income from Investment Operations | | | | | |
Net investment income (loss)C | .27 | .17 | .06 | .06 | .10 |
Net realized and unrealized gain (loss) | 1.05 | (.89) | 6.94 | 1.09 | (.88) |
Total from investment operations | 1.32 | (.72) | 7.00 | 1.15 | (.78) |
Distributions from net investment income | (.16) | (.05) | (.07) | (.11) | (.02) |
Distributions from net realized gain | (3.45) | (.60) | (.33) | (.27) | (.66) |
Total distributions | (3.61) | (.65) | (.40) | (.38) | (.68) |
Redemption fees added to paid in capitalC | - G | .01 | - G | - G | .01 |
Net asset value, end of period | $ 22.69 | $ 24.98 | $ 26.34 | $ 19.74 | $ 18.97 |
Total ReturnA, B | 6.21% | (2.79)% | 36.18% | 6.28% | (4.00)% |
Ratios to Average Net AssetsE, F | | | | | |
Expenses before reductions | 1.59% | 1.50% | 1.61% | 1.63% | 1.56% |
Expenses net of fee waivers, if any | 1.58% | 1.50% | 1.61% | 1.63% | 1.55% |
Expenses net of all reductions | 1.58% | 1.50% | 1.60% | 1.60% | 1.54% |
Net investment income (loss) | 1.18% | .65% | .25% | .32% | .49% |
Supplemental Data | | | | | |
Net assets, end of period (000 omitted) | $ 28,238 | $ 24,572 | $ 24,020 | $ 14,125 | $ 17,185 |
Portfolio turnover rateD | 36% | 102% | 54% | 68% | 47% |
A Total returns would have been lower if certain expenses had not been reduced during the applicable periods shown.
B Total returns do not include the effect of the sales charges.
C Calculated based on average shares outstanding during the period.
D Amounts do not include the activity of the Underlying Funds.
E Fees and expenses of any underlying Fidelity Central Funds are not included in the Fund's expense ratio. The Fund indirectly bears its proportionate share of the expenses of any underlying Fidelity Central Funds.
F Expense ratios reflect operating expenses of the class. Expenses before reductions do not reflect amounts reimbursed by the investment adviser or reductions from brokerage service arrangements or reductions from other expense offset arrangements and do not represent the amount paid by the class during periods when reimbursements or reductions occur. Expenses net of fee waivers reflect expenses after reimbursement by the investment adviser but prior to reductions from brokerage service arrangements or other expense offset arrangements. Expenses net of all reductions represent the net expenses paid by the class.
G Amount represents less than $.005 per share.
See accompanying notes which are an integral part of the financial statements.
Annual Report
Financial Highlights - Fidelity International Small Cap Fund Class T
Years ended October 31, | 2015 | 2014 | 2013 | 2012 | 2011 |
Selected Per-Share Data | | | | | |
Net asset value, beginning of period | $ 24.81 | $ 26.17 | $ 19.59 | $ 18.80 | $ 20.23 |
Income from Investment Operations | | | | | |
Net investment income (loss)C | .21 | .10 | - G | .01 | .05 |
Net realized and unrealized gain (loss) | 1.04 | (.87) | 6.90 | 1.08 | (.86) |
Total from investment operations | 1.25 | (.77) | 6.90 | 1.09 | (.81) |
Distributions from net investment income | (.06) | - | - | (.03) | - |
Distributions from net realized gain | (3.45) | (.60) | (.32) | (.27) | (.63) |
Total distributions | (3.51) | (.60) | (.32) | (.30) | (.63) |
Redemption fees added to paid in capitalC | - G | .01 | - G | - G | .01 |
Net asset value, end of period | $ 22.55 | $ 24.81 | $ 26.17 | $ 19.59 | $ 18.80 |
Total ReturnA, B | 5.90% | (3.00)% | 35.80% | 5.97% | (4.18)% |
Ratios to Average Net AssetsE, F | | | | | |
Expenses before reductions | 1.87% | 1.77% | 1.87% | 1.88% | 1.82% |
Expenses net of fee waivers, if any | 1.86% | 1.77% | 1.87% | 1.88% | 1.81% |
Expenses net of all reductions | 1.86% | 1.76% | 1.85% | 1.85% | 1.79% |
Net investment income (loss) | .90% | .38% | (.01)% | .07% | .24% |
Supplemental Data | | | | | |
Net assets, end of period (000 omitted) | $ 12,400 | $ 12,296 | $ 13,530 | $ 9,262 | $ 13,744 |
Portfolio turnover rateD | 36% | 102% | 54% | 68% | 47% |
A Total returns would have been lower if certain expenses had not been reduced during the applicable periods shown.
B Total returns do not include the effect of the sales charges.
C Calculated based on average shares outstanding during the period.
D Amounts do not include the activity of the Underlying Funds.
E Fees and expenses of any underlying Fidelity Central Funds are not included in the Fund's expense ratio. The Fund indirectly bears its proportionate share of the expenses of any underlying Fidelity Central Funds.
F Expense ratios reflect operating expenses of the class. Expenses before reductions do not reflect amounts reimbursed by the investment adviser or reductions from brokerage service arrangements or reductions from other expense offset arrangements and do not represent the amount paid by the class during periods when reimbursements or reductions occur. Expenses net of fee waivers reflect expenses after reimbursement by the investment adviser but prior to reductions from brokerage service arrangements or other expense offset arrangements. Expenses net of all reductions represent the net expenses paid by the class.
G Amount represents less than $.005 per share.
See accompanying notes which are an integral part of the financial statements.
Annual Report
Financial Highlights - Fidelity International Small Cap Fund Class B
Years ended October 31, | 2015 | 2014 | 2013 | 2012 | 2011 |
Selected Per-Share Data | | | | | |
Net asset value, beginning of period | $ 24.51 | $ 25.87 | $ 19.22 | $ 18.38 | $ 19.79 |
Income from Investment Operations | | | | | |
Net investment income (loss)C | .09 | (.03) | (.11) | (.08) | (.05) |
Net realized and unrealized gain (loss) | 1.04 | (.87) | 6.84 | 1.07 | (.85) |
Total from investment operations | 1.13 | (.90) | 6.73 | .99 | (.90) |
Distributions from net realized gain | (3.42) | (.47) | (.08) | (.15) | (.52) |
Redemption fees added to paid in capitalC | - G | .01 | - G | - G | .01 |
Net asset value, end of period | $ 22.22 | $ 24.51 | $ 25.87 | $ 19.22 | $ 18.38 |
Total ReturnA, B | 5.40% | (3.52)% | 35.14% | 5.45% | (4.68)% |
Ratios to Average Net AssetsE, F | | | | | |
Expenses before reductions | 2.36% | 2.28% | 2.37% | 2.38% | 2.32% |
Expenses net of fee waivers, if any | 2.36% | 2.28% | 2.36% | 2.38% | 2.30% |
Expenses net of all reductions | 2.36% | 2.27% | 2.35% | 2.35% | 2.29% |
Net investment income (loss) | .41% | (.13)% | (.51)% | (.43)% | (.26)% |
Supplemental Data | | | | | |
Net assets, end of period (000 omitted) | $ 390 | $ 507 | $ 795 | $ 790 | $ 2,067 |
Portfolio turnover rateD | 36% | 102% | 54% | 68% | 47% |
A Total returns would have been lower if certain expenses had not been reduced during the applicable periods shown.
B Total returns do not include the effect of the contingent deferred sales charge.
C Calculated based on average shares outstanding during the period.
D Amounts do not include the activity of the Underlying Funds.
E Fees and expenses of any underlying Fidelity Central Funds are not included in the Fund's expense ratio. The Fund indirectly bears its proportionate share of the expenses of any underlying Fidelity Central Funds.
F Expense ratios reflect operating expenses of the class. Expenses before reductions do not reflect amounts reimbursed by the investment adviser or reductions from brokerage service arrangements or reductions from other expense offset arrangements and do not represent the amount paid by the class during periods when reimbursements or reductions occur. Expenses net of fee waivers reflect expenses after reimbursement by the investment adviser but prior to reductions from brokerage service arrangements or other expense offset arrangements. Expenses net of all reductions represent the net expenses paid by the class.
G Amount represents less than $.005 per share.
See accompanying notes which are an integral part of the financial statements.
Annual Report
Financial Highlights - Fidelity International Small Cap Fund Class C
Years ended October 31, | 2015 | 2014 | 2013 | 2012 | 2011 |
Selected Per-Share Data | | | | | |
Net asset value, beginning of period | $ 24.27 | $ 25.68 | $ 19.18 | $ 18.38 | $ 19.85 |
Income from Investment Operations | | | | | |
Net investment income (loss)C | .09 | (.02) | (.11) | (.08) | (.04) |
Net realized and unrealized gain (loss) | 1.02 | (.85) | 6.79 | 1.07 | (.85) |
Total from investment operations | 1.11 | (.87) | 6.68 | .99 | (.89) |
Distributions from net realized gain | (3.42) | (.55) | (.18) | (.19) | (.59) |
Redemption fees added to paid in capitalC | - G | .01 | - G | - G | .01 |
Net asset value, end of period | $ 21.96 | $ 24.27 | $ 25.68 | $ 19.18 | $ 18.38 |
Total ReturnA, B | 5.37% | (3.43)% | 35.15% | 5.46% | (4.64)% |
Ratios to Average Net AssetsE, F | | | | | |
Expenses before reductions | 2.36% | 2.23% | 2.33% | 2.38% | 2.27% |
Expenses net of fee waivers, if any | 2.35% | 2.22% | 2.33% | 2.38% | 2.26% |
Expenses net of all reductions | 2.35% | 2.22% | 2.32% | 2.35% | 2.24% |
Net investment income (loss) | .41% | (.07)% | (.47)% | (.43)% | (.21)% |
Supplemental Data | | | | | |
Net assets, end of period (000 omitted) | $ 11,359 | $ 12,576 | $ 13,426 | $ 6,799 | $ 9,545 |
Portfolio turnover rateD | 36% | 102% | 54% | 68% | 47% |
A Total returns would have been lower if certain expenses had not been reduced during the applicable periods shown.
B Total returns do not include the effect of the contingent deferred sales charge.
C Calculated based on average shares outstanding during the period.
D Amounts do not include the activity of the Underlying Funds.
E Fees and expenses of any underlying Fidelity Central Funds are not included in the Fund's expense ratio. The Fund indirectly bears its proportionate share of the expenses of any underlying Fidelity Central Funds.
F Expense ratios reflect operating expenses of the class. Expenses before reductions do not reflect amounts reimbursed by the investment adviser or reductions from brokerage service arrangements or reductions from other expense offset arrangements and do not represent the amount paid by the class during periods when reimbursements or reductions occur. Expenses net of fee waivers reflect expenses after reimbursement by the investment adviser but prior to reductions from brokerage service arrangements or other expense offset arrangements. Expenses net of all reductions represent the net expenses paid by the class.
G Amount represents less than $.005 per share.
See accompanying notes which are an integral part of the financial statements.
Annual Report
Financial Highlights - Fidelity International Small Cap Fund
Years ended October 31, | 2015 | 2014 | 2013 | 2012 | 2011 |
Selected Per-Share Data | | | | | |
Net asset value, beginning of period | $ 25.34 | $ 26.67 | $ 19.99 | $ 19.23 | $ 20.66 |
Income from Investment Operations | | | | | |
Net investment income (loss)B | .34 | .25 | .12 | .11 | .17 |
Net realized and unrealized gain (loss) | 1.07 | (.90) | 7.02 | 1.10 | (.89) |
Total from investment operations | 1.41 | (.65) | 7.14 | 1.21 | (.72) |
Distributions from net investment income | (.24) | (.09) | (.14) | (.18) | (.06) |
Distributions from net realized gain | (3.45) | (.60) | (.33) | (.27) | (.66) |
Total distributions | (3.69) | (.69) | (.46) G | (.45) | (.72) |
Redemption fees added to paid in capitalB | - F | .01 | - F | - F | .01 |
Net asset value, end of period | $ 23.06 | $ 25.34 | $ 26.67 | $ 19.99 | $ 19.23 |
Total ReturnA | 6.53% | (2.48)% | 36.56% | 6.55% | (3.65)% |
Ratios to Average Net AssetsD, E | | | | | |
Expenses before reductions | 1.31% | 1.21% | 1.33% | 1.35% | 1.26% |
Expenses net of fee waivers, if any | 1.31% | 1.20% | 1.32% | 1.35% | 1.25% |
Expenses net of all reductions | 1.31% | 1.20% | 1.31% | 1.33% | 1.23% |
Net investment income (loss) | 1.45% | .95% | .53% | .59% | .80% |
Supplemental Data | | | | | |
Net assets, end of period (000 omitted) | $ 811,534 | $ 842,031 | $ 1,029,629 | $ 692,769 | $ 856,692 |
Portfolio turnover rateC | 36% | 102% | 54% | 68% | 47% |
A Total returns would have been lower if certain expenses had not been reduced during the applicable periods shown.
B Calculated based on average shares outstanding during the period.
C Amounts do not include the activity of the Underlying Funds.
D Fees and expenses of any underlying Fidelity Central Funds are not included in the Fund's expense ratio. The Fund indirectly bears its proportionate share of the expenses of any underlying Fidelity Central Funds.
E Expense ratios reflect operating expenses of the class. Expenses before reductions do not reflect amounts reimbursed by the investment adviser or reductions from brokerage service arrangements or reductions from other expense offset arrangements and do not represent the amount paid by the class during periods when reimbursements or reductions occur. Expenses net of fee waivers reflect expenses after reimbursement by the investment adviser but prior to reductions from brokerage service arrangements or other expense offset arrangements. Expenses net of all reductions represent the net expenses paid by the class.
F Amount represents less than $.005 per share.
G Total distributions of $.46 per share is comprised of distributions from net investment income of $.136 and distributions from net realized gain of $.327 per share.
See accompanying notes which are an integral part of the financial statements.
Annual Report
Financial Highlights - Fidelity International Small Cap Fund Class I
Years ended October 31, | 2015 | 2014 | 2013 | 2012 | 2011 |
Selected Per-Share Data | | | | | |
Net asset value, beginning of period | $ 25.34 | $ 26.67 | $ 20.00 | $ 19.24 | $ 20.66 |
Income from Investment Operations | | | | | |
Net investment income (loss)B | .36 | .29 | .16 | .13 | .18 |
Net realized and unrealized gain (loss) | 1.07 | (.90) | 7.00 | 1.10 | (.89) |
Total from investment operations | 1.43 | (.61) | 7.16 | 1.23 | (.71) |
Distributions from net investment income | (.08) | (.13) | (.16) | (.20) | (.06) |
Distributions from net realized gain | (3.45) | (.60) | (.33) | (.27) | (.66) |
Total distributions | (3.53) | (.73) | (.49) | (.47) | (.72) |
Redemption fees added to paid in capitalB | - F | .01 | - F | - F | .01 |
Net asset value, end of period | $ 23.24 | $ 25.34 | $ 26.67 | $ 20.00 | $ 19.24 |
Total ReturnA | 6.60% | (2.35)% | 36.68% | 6.65% | (3.62)% |
Ratios to Average Net AssetsD, E | | | | | |
Expenses before reductions | 1.24% | 1.08% | 1.20% | 1.25% | 1.22% |
Expenses net of fee waivers, if any | 1.23% | 1.08% | 1.20% | 1.25% | 1.21% |
Expenses net of all reductions | 1.23% | 1.08% | 1.18% | 1.22% | 1.19% |
Net investment income (loss) | 1.53% | 1.07% | .66% | .70% | .84% |
Supplemental Data | | | | | |
Net assets, end of period (000 omitted) | $ 10,070 | $ 8,092 | $ 67,038 | $ 9,503 | $ 15,752 |
Portfolio turnover rateC | 36% | 102% | 54% | 68% | 47% |
A Total returns would have been lower if certain expenses had not been reduced during the applicable periods shown.
B Calculated based on average shares outstanding during the period.
C Amounts do not include the activity of the Underlying Funds.
D Fees and expenses of any underlying Fidelity Central Funds are not included in the Fund's expense ratio. The Fund indirectly bears its proportionate share of the expenses of any underlying Fidelity Central Funds.
E Expense ratios reflect operating expenses of the class. Expenses before reductions do not reflect amounts reimbursed by the investment adviser or reductions from brokerage service arrangements or reductions from other expense offset arrangements and do not represent the amount paid by the class during periods when reimbursements or reductions occur. Expenses net of fee waivers reflect expenses after reimbursement by the investment adviser but prior to reductions from brokerage service arrangements or other expense offset arrangements. Expenses net of all reductions represent the net expenses paid by the class.
F Amount represents less than $.005 per share.
See accompanying notes which are an integral part of the financial statements.
Annual Report
For the period ended October 31, 2015
1. Organization.
Fidelity International Small Cap Fund (the Fund) is a fund of Fidelity Investment Trust (the Trust) and is authorized to issue an unlimited number of shares. The Trust is registered under the Investment Company Act of 1940, as amended (the 1940 Act), as an open-end management investment company organized as a Massachusetts business trust. The Fund offers Class A, Class T, Class C, International Small Cap and Class I (formerly Institutional Class) shares, each of which, along with Class B shares, has equal rights as to assets and voting privileges. Class B shares are closed to new accounts and additional purchases, except for exchanges and reinvestments. Each class has exclusive voting rights with respect to matters that affect that class. Class B shares will automatically convert to Class A shares after a holding period of seven years from the initial date of purchase. The Fund's investments in emerging markets can be subject to social, economic, regulatory, and political uncertainties and can be extremely volatile.
2. Investments in Fidelity Central Funds.
The Fund invests in Fidelity Central Funds, which are open-end investment companies generally available only to other investment companies and accounts managed by the investment adviser and its affiliates. The Fund's Schedule of Investments lists each of the Fidelity Central Funds held as of period end, if any, as an investment of the Fund, but does not include the underlying holdings of each Fidelity Central Fund. As an Investing Fund, the Fund indirectly bears its proportionate share of the expenses of the underlying Fidelity Central Funds.
The Money Market Central Funds seek preservation of capital and current income and are managed by Fidelity Investments Money Management, Inc. (FIMM), an affiliate of the investment adviser. Annualized expenses of the Money Market Central Funds as of their most recent shareholder report date are less than .005%.
A complete unaudited list of holdings for each Fidelity Central Fund is available upon request or at the Securities and Exchange Commission (the SEC) website at www.sec.gov. In addition, the financial statements of the Fidelity Central Funds, which are not covered by the Fund's Report of Independent Registered Public Accounting Firm, are available on the SEC website or upon request.
3. Significant Accounting Policies.
The financial statements have been prepared in conformity with accounting principles generally accepted in the United States of America (GAAP), which require management to make certain estimates and assumptions at the date of the financial statements. Actual results could differ from those estimates. Subsequent events, if any, through the date that the financial statements were issued have been evaluated in the preparation of
Annual Report
3. Significant Accounting Policies - continued
the financial statements. The following summarizes the significant accounting policies of the Fund:
Investment Valuation. Investments are valued as of 4:00 p.m. Eastern time on the last calendar day of the period. The Board of Trustees (the Board) has delegated the day to day responsibility for the valuation of the Fund's investments to the Fidelity Management & Research Company (FMR) Fair Value Committee (the Committee). In accordance with valuation policies and procedures approved by the Board, the Fund attempts to obtain prices from one or more third party pricing vendors or brokers to value its investments. When current market prices, quotations or currency exchange rates are not readily available or reliable, investments will be fair valued in good faith by the Committee, in accordance with procedures adopted by the Board. Factors used in determining fair value vary by investment type and may include market or investment specific events. The frequency with which these procedures are used cannot be predicted and they may be utilized to a significant extent. The Committee oversees the Fund's valuation policies and procedures and reports to the Board on the Committee's activities and fair value determinations. The Board monitors the appropriateness of the procedures used in valuing the Fund's investments and ratifies the fair value determinations of the Committee.
The Fund categorizes the inputs to valuation techniques used to value its investments into a disclosure hierarchy consisting of three levels as shown below:
Level 1 - quoted prices in active markets for identical investments
Level 2 - other significant observable inputs (including quoted prices for similar investments, interest rates, prepayment speeds, etc.)
Level 3 - unobservable inputs (including the Fund's own assumptions based on the best information available)
Valuation techniques used to value the Fund's investments by major category are as follows:
Equity securities, including restricted securities, for which market quotations are readily available, are valued at the last reported sale price or official closing price as reported by a third party pricing vendor on the primary market or exchange on which they are traded and are categorized as Level 1 in the hierarchy. In the event there were no sales during the day or closing prices are not available, securities are valued at the last quoted bid price or may be valued using the last available price and are generally categorized as Level 2 in the hierarchy. For foreign equity securities, when market or security specific events arise, comparisons to the valuation of American Depositary Receipts (ADRs), futures contracts, Exchange-Traded Funds (ETFs) and certain indexes as well as quoted
Annual Report
Notes to Financial Statements - continued
3. Significant Accounting Policies - continued
Investment Valuation - continued
prices for similar securities may be used and would be categorized as Level 2 in the hierarchy. Utilizing these techniques may result in transfers between Level 1 and Level 2. For equity securities, including restricted securities, where observable inputs are limited, assumptions about market activity and risk are used and these securities may be categorized as Level 3 in the hierarchy.
Investments in open-end mutual funds, including the Fidelity Central Funds, are valued at their closing net asset value (NAV) each business day and are categorized as Level 1 in the hierarchy.
Changes in valuation techniques may result in transfers in or out of an assigned level within the disclosure hierarchy. The aggregate value of investments by input level as of October 31, 2015 is included at the end of the Fund's Schedule of Investments.
Foreign Currency. The Fund may use foreign currency contracts to facilitate transactions in foreign-denominated securities. Gains and losses from these transactions may arise from changes in the value of the foreign currency or if the counterparties do not perform under the contracts' terms.
Foreign-denominated assets, including investment securities, and liabilities are translated into U.S. dollars at the exchange rates at period end. Purchases and sales of investment securities, income and dividends received and expenses denominated in foreign currencies are translated into U.S. dollars at the exchange rate in effect on the transaction date.
The effects of exchange rate fluctuations on investments are included with the net realized and unrealized gain (loss) on investment securities. Other foreign currency transactions resulting in realized and unrealized gain (loss) are disclosed separately.
Investment Transactions and Income. For financial reporting purposes, the Fund's investment holdings and NAV include trades executed through the end of the last business day of the period. The NAV per share for processing shareholder transactions is calculated as of the close of business of the New York Stock Exchange (NYSE), normally 4:00 p.m. Eastern time and includes trades executed through the end of the prior business day. Gains and losses on securities sold are determined on the basis of identified cost and may include proceeds received from litigation. Dividend income is recorded on the ex-dividend date, except for certain dividends from foreign securities where the ex-dividend date may have passed, which are recorded as soon as the Fund is informed of the ex-dividend date. Non-cash dividends included in dividend income, if any, are recorded at the fair market value of the securities received. Income and capital gain distributions from Fidelity Central Funds, if any, are recorded on the ex-dividend date.
Annual Report
3. Significant Accounting Policies - continued
Investment Transactions and Income - continued
Distributions received on securities that represent a return of capital or capital gain are recorded as a reduction of cost of investments and/or as a realized gain. Subsequent to ex-dividend date the Fund determines the components of these distributions, based upon receipt of tax filings or other correspondence relating to the underlying investment. Interest income is accrued as earned and includes coupon interest and amortization of premium and accretion of discount on debt securities as applicable. Investment income is recorded net of foreign taxes withheld where recovery of such taxes is uncertain.
Class Allocations and Expenses. Investment income, realized and unrealized capital gains and losses, common expenses of the Fund, and certain fund-level expense reductions, if any, are allocated daily on a pro-rata basis to each class based on the relative net assets of each class to the total net assets of the Fund. Each class differs with respect to transfer agent and distribution and service plan fees incurred. Certain expense reductions may also differ by class. For the reporting period, the allocated portion of income and expenses to each class as a percent of its average net assets may vary due to the timing of recording these transactions in relation to fluctuating net assets of the classes. Expenses directly attributable to a fund are charged to that fund. Expenses attributable to more than one fund are allocated among the respective funds on the basis of relative net assets or other appropriate methods. Expense estimates are accrued in the period to which they relate and adjustments are made when actual amounts are known.
Income Tax Information and Distributions to Shareholders. Each year, the Fund intends to qualify as a regulated investment company under Subchapter M of the Internal Revenue Code, including distributing substantially all of its taxable income and realized gains. As a result, no provision for U.S. Federal income taxes is required. As of October 31, 2015, the Fund did not have any unrecognized tax benefits in the financial statements; nor is the Fund aware of any tax positions for which it is reasonably possible that the total amounts of unrecognized tax benefits will significantly change in the next twelve months. The Fund files a U.S. federal tax return, in addition to state and local tax returns as required. The Fund's federal income tax returns are subject to examination by the Internal Revenue Service (IRS) for a period of three fiscal years after they are filed. State and local tax returns may be subject to examination for an additional fiscal year depending on the jurisdiction. Foreign taxes are provided for based on the Fund's understanding of the tax rules and rates that exist in the foreign markets in which it invests. The Fund is subject to a tax imposed on capital gains by certain countries in which it invests.
Distributions are declared and recorded on the ex-dividend date. Income dividends and capital gain distributions are declared separately for each class. Income and capital gain distributions are determined in accordance with income tax regulations, which may
Annual Report
Notes to Financial Statements - continued
3. Significant Accounting Policies - continued
Income Tax Information and Distributions to Shareholders - continued
differ from GAAP. In addition, the Fund claimed a portion of the payment made to redeeming shareholders as a distribution for income tax purposes.
Capital accounts within the financial statements are adjusted for permanent book-tax differences. These adjustments have no impact on net assets or the results of operations. Capital accounts are not adjusted for temporary book-tax differences which will reverse in a subsequent period.
Book-tax differences are primarily due to foreign currency transactions, certain foreign taxes, passive foreign investment companies (PFIC) and losses deferred due to wash sales.
The federal tax cost of investment securities and unrealized appreciation (depreciation) as of period end were as follows:
Gross unrealized appreciation | $ 102,373,068 |
Gross unrealized depreciation | (110,741,632) |
Net unrealized appreciation (depreciation) on securities | $ (8,368,564) |
Tax Cost | $ 894,144,403 |
The tax-based components of distributable earnings as of period end were as follows:
Undistributed ordinary income | $ 15,328,717 |
Undistributed long-term capital gain | $ 19,111,574 |
Net unrealized appreciation (depreciation) on securities and other investments | $ (8,441,972) |
The tax character of distributions paid was as follows:
| October 31, 2015 | October 31, 2014 |
Ordinary Income | $ 8,729,905 | $ 30,270,126 |
Long-term Capital Gains | 115,839,457 | - |
Total | $ 124,569,362 | $ 30,270,126 |
Short-Term Trading (Redemption) Fees. Shares held by investors in the Fund less than 90 days may have been subject to a redemption fee equal to 2.00% of the NAV of shares redeemed. All redemption fees, which reduce the proceeds of the shareholder redemption, are retained by the Fund and accounted for as an addition to paid in capital.
Restricted Securities. The Fund may invest in securities that are subject to legal or contractual restrictions on resale. These securities generally may be resold in transactions exempt from registration or to the public if the securities are registered. Disposal of these securities may involve time-consuming negotiations and expense, and prompt sale
Annual Report
3. Significant Accounting Policies - continued
Restricted Securities - continued
at an acceptable price may be difficult. Information regarding restricted securities is included at the end of the Fund's Schedule of Investments.
4. Purchases and Sales of Investments.
Purchases and sales of securities, other than short-term securities, aggregated $286,769,775 and $355,615,175, respectively.
5. Fees and Other Transactions with Affiliates.
Management Fee. Fidelity Management & Research Company (the investment adviser) and its affiliates provide the Fund with investment management related services for which the Fund pays a monthly management fee. The management fee is the sum of an individual fund fee rate that is based on an annual rate of .60% of the Fund's average net assets and an annualized group fee rate that averaged .25% during the period. The group fee rate is based upon the average net assets of all the mutual funds advised by the investment adviser, including any mutual funds previously advised by the investment adviser that are currently advised by Fidelity SelectCo, LLC, an affiliate of the investment adviser. The group fee rate decreases as assets under management increase and increases as assets under management decrease. In addition, the management fee is subject to a performance adjustment (up to a maximum of ± .20% of the Fund's average net assets over a 36 month performance period). The upward or downward adjustment to the management fee is based on the relative investment performance of International Small Cap as compared to its benchmark index, the MSCI All Country World ex USA Small Cap Index effective April 1, 2014 (the MSCI EAFE Small Cap Index prior to April 1, 2014), over the same 36 month performance period. For the reporting period, the total annual management fee rate, including the performance adjustment, was .96% of the Fund's average net assets. The performance adjustment included in the management fee rate may be higher or lower than the maximum performance adjustment rate due to the difference between the average net assets for the reporting and performance periods.
Distribution and Service Plan Fees. In accordance with Rule 12b-1 of the 1940 Act, the Fund has adopted separate Distribution and Service Plans for each class of shares. Certain classes pay Fidelity Distributors Corporation (FDC), an affiliate of the investment adviser, separate Distribution and Service Fees, each of which is based on an annual percentage of each class' average net assets. In addition, FDC may pay financial intermediaries for selling shares of the Fund and providing shareholder support services.
Annual Report
Notes to Financial Statements - continued
5. Fees and Other Transactions with Affiliates - continued
Distribution and Service Plan Fees - continued
For the period, the Distribution and Service Fee rates, total fees and amounts retained by FDC were as follows:
| Distribution
Fee | Service
Fee | Total Fees | Retained
by FDC |
Class A | -% | .25% | $ 63,486 | $ 789 |
Class T | .25% | .25% | 59,620 | - |
Class B | .75% | .25% | 4,412 | 3,318 |
Class C | .75% | .25% | 106,420 | 13,666 |
| | | $ 233,938 | $ 17,773 |
Sales Load. FDC may receive a front-end sales charge of up to 5.75% for selling Class A shares and 3.50% for selling Class T shares, some of which is paid to financial intermediaries for selling shares of the Fund. Depending on the holding period, FDC may receive contingent deferred sales charges levied on Class A, Class T, Class B, and Class C redemptions. The deferred sales charges range from 5.00% to 1.00% for Class B shares, 1.00% for Class C shares, 1.00% for certain purchases of Class A shares and .25% for certain purchases of Class T shares.
For the period, sales charge amounts retained by FDC were as follows:
| Retained
by FDC |
Class A | $ 15,223 |
Class T | 3,172 |
Class BA | 74 |
Class C A | 2,729 |
| $ 21,198 |
A When Class B and Class C shares are initially sold, FDC pays commissions from its own resources to financial intermediaries through which the sales are made.
Transfer Agent Fees. Fidelity Investments Institutional Operations Company, Inc., (FIIOC), an affiliate of the investment adviser, is the transfer, dividend disbursing and shareholder servicing agent for each class of the Fund. FIIOC receives account fees and asset-based fees that vary according to the account size and type of account of the shareholders of the respective classes of the Fund. FIIOC pays for typesetting, printing and mailing of shareholder reports, except proxy statements.
Annual Report
5. Fees and Other Transactions with Affiliates - continued
Transfer Agent Fees - continued
For the period, transfer agent fees for each class were as follows:
| Amount | % of
Class-Level
Average
Net Assets |
Class A | $ 69,900 | .27 |
Class T | 36,352 | .30 |
Class B | 1,323 | .30 |
Class C | 31,483 | .30 |
International Small Cap | 1,992,868 | .25 |
Class I | 16,067 | .18 |
| $ 2,147,993 | |
Accounting and Security Lending Fees. Fidelity Service Company, Inc. (FSC), an affiliate of the investment adviser, maintains the Fund's accounting records. The accounting fee is based on the level of average net assets for each month. Under a separate contract, FSC administers the security lending program. The security lending fee is based on the number and duration of lending transactions.
Brokerage Commissions. The Fund placed a portion of its portfolio transactions with brokerage firms which are affiliates of the investment adviser. Brokerage commissions are included in net realized gain (loss) and change in net unrealized appreciation (depreciation) in the Statement of Operations. The commissions paid to these affiliated firms were $340 for the period.
Other. During the period, the investment adviser reimbursed the Fund for certain losses in the amount of $1,975.
6. Committed Line of Credit.
The Fund participates with other funds managed by the investment adviser or an affiliate in a $4.25 billion credit facility (the "line of credit") to be utilized for temporary or emergency purposes to fund shareholder redemptions or for other short-term liquidity purposes. The Fund has agreed to pay commitment fees on its pro-rata portion of the line of credit, which amounted to $1,210 and is reflected in Miscellaneous expenses on the Statement of Operations. During the period, the Fund did not borrow on this line of credit.
7. Security Lending.
The Fund lends portfolio securities through a lending agent from time to time in order to earn additional income. For equity securities, a lending agent is used and may loan securities to certain qualified borrowers, including Fidelity Capital Markets (FCM), a
Annual Report
Notes to Financial Statements - continued
7. Security Lending - continued
broker-dealer affiliated with the Fund. On the settlement date of the loan, the Fund receives collateral (in the form of U.S. Treasury obligations, letters of credit and/or cash) against the loaned securities and maintains collateral in an amount not less than 100% ofthe market value of the loaned securities during the period of the loan. The market value of the loaned securities is determined at the close of business of the Fund and any additional required collateral is delivered to the Fund on the next business day. The Fund or borrower may terminate the loan at any time, and if the borrower defaults on its obligation to return the securities loaned because of insolvency or other reasons, the Fund may apply collateral received from the borrower against the obligation. The Fund may experience delays and costs in recovering the securities loaned. Any cash collateral received is invested in the Fidelity Securities Lending Cash Central Fund. The value of loaned securities and cash collateral at period end are disclosed on the Fund's Statement of Assets and Liabilities. The value of securities loaned to FCM at period end was $363,206. Security lending income represents the income earned on investing cash collateral, less rebates paid to borrowers and any lending agent fees associated with the loan, plus any premium payments received for lending certain types of securities. Security lending income is presented in the Statement of Operations as a component of income from Fidelity Central Funds. Total security lending income during the period amounted to $186,310, including $3,174 from securities loaned to FCM.
8. Expense Reductions.
Commissions paid to certain brokers with whom the investment adviser, or its affiliates, places trades on behalf of the Fund include an amount in addition to trade execution, which may be rebated back to the Fund to offset certain expenses. This amount totaled $28,404 for the period.
Through arrangements with the Fund's custodian, credits realized as a result of certain uninvested cash balances were used to reduce the Fund's expenses. During the period, these credits reduced the Fund's custody expenses by $41.
In addition, during the period the investment adviser reimbursed and/or waived a portion of fund-level operating expenses in the amount of $3,507 and a portion of class-level operating expenses as follows:
| Amount |
Class A | $ 414 |
Class T | 191 |
Class B | 1 |
Class C | 281 |
International Small Cap | 22,441 |
Class I | 831 |
| $ 24,159 |
Annual Report
9. Distributions to Shareholders.
Distributions to shareholders of each class were as follows:
Years ended October 31, | 2015 | 2014 |
From net investment income | | |
Class A | $ 155,785 | $ 48,210 |
Class T | 27,108 | - |
International Small Cap | 7,454,709 | 3,601,146 |
Class I | 24,926 | 363,320 |
Total | $ 7,662,528 | $ 4,012,676 |
From net realized gain | | |
Class A | $ 3,382,206 | $ 564,345 |
Class T | 1,671,017 | 310,220 |
Class B | 66,002 | 14,343 |
Class C | 1,697,539 | 305,689 |
International Small Cap | 109,040,767 | 23,368,303 |
Class I | 1,049,303 | 1,694,550 |
Total | $ 116,906,834 | $ 26,257,450 |
10. Share Transactions.
Share transactions for each class were as follows and may contain automatic conversions between classes or exchanges between funds:
| Shares | Dollars |
Years ended October 31, | 2015 | 2014 | 2015 | 2014 |
Class A | | | | |
Shares sold | 432,152 | 355,842 | $ 9,990,970 | $ 9,376,508 |
Reinvestment of distributions | 159,613 | 22,103 | 3,404,539 | 571,356 |
Shares redeemed | (331,016) | (306,489) | (7,450,558) | (8,061,522) |
Net increase (decrease) | 260,749 | 71,456 | $ 5,944,951 | $ 1,886,342 |
Class T | | | | |
Shares sold | 124,085 | 115,645 | $ 2,869,552 | $ 3,022,509 |
Reinvestment of distributions | 77,005 | 11,686 | 1,636,354 | 300,676 |
Shares redeemed | (146,828) | (148,659) | (3,289,706) | (3,861,942) |
Net increase (decrease) | 54,262 | (21,328) | $ 1,216,200 | $ (538,757) |
Class B | | | | |
Shares sold | 4,667 | 3,137 | $ 108,058 | $ 80,198 |
Reinvestment of distributions | 2,954 | 538 | 62,128 | 13,734 |
Shares redeemed | (10,732) | (13,726) | (240,945) | (356,690) |
Net increase (decrease) | (3,111) | (10,051) | $ (70,759) | $ (262,758) |
Annual Report
Notes to Financial Statements - continued
10. Share Transactions - continued
| Shares | Dollars |
Years ended October 31, | 2015 | 2014 | 2015 | 2014 |
Class C | | | | |
Shares sold | 196,292 | 207,733 | $ 4,379,607 | $ 5,326,341 |
Reinvestment of distributions | 71,584 | 10,499 | 1,488,229 | 265,425 |
Shares redeemed | (268,981) | (222,725) | (5,818,752) | (5,644,059) |
Net increase (decrease) | (1,105) | (4,493) | $ 49,084 | $ (52,293) |
International Small Cap | | | | |
Shares sold | 7,876,402 | 7,158,603 | $ 184,799,928 | $ 190,711,642 |
Reinvestment of distributions | 5,231,399 | 988,313 | 113,102,853 | 25,844,388 |
Shares redeemed | (11,138,439) | (13,529,838) | (253,855,534) | (360,297,655) |
Net increase (decrease) | 1,969,362 | (5,382,922) | $ 44,047,247 | $ (143,741,625) |
Class I | | | | |
Shares sold | 256,693 | 1,844,038 | $ 5,987,647 | $ 48,462,558 |
Reinvestment of distributions | 46,102 | 61,170 | 1,003,648 | 1,598,368 |
Shares redeemed | (188,812) | (4,099,284) | (4,455,310) | (109,159,166) |
Net increase (decrease) | 113,983 | (2,194,076) | $ 2,535,985 | $ (59,098,240) |
11. Other.
The Fund's organizational documents provide former and current trustees and officers with a limited indemnification against liabilities arising in connection with the performance of their duties to the Fund. In the normal course of business, the Fund may also enter into contracts that provide general indemnifications. The Fund's maximum exposure under these arrangements is unknown as this would be dependent on future claims that may be made against the Fund. The risk of material loss from such claims is considered remote.
At the end of the period, the investment adviser or its affiliates were the owner of record of 15% of the total outstanding shares of the Fund.
Annual Report
To the Trustees of Fidelity Investment Trust and Shareholders of Fidelity International Small Cap Fund:
We have audited the accompanying statement of assets and liabilities of Fidelity International Small Cap Fund (the Fund), a fund of Fidelity Investment Trust, including the schedule of investments, as of October 31, 2015, and the related statement of operations for the year then ended, the statement of changes in net assets for each of the two years in the period then ended, and the financial highlights for each of the five years in the period then ended. These financial statements and financial highlights are the responsibility of the Fund's management. Our responsibility is to express an opinion on these financial statements and financial highlights based on our audits.
We conducted our audits in accordance with the standards of the Public Company Accounting Oversight Board (United States). Those standards require that we plan and perform the audit to obtain reasonable assurance about whether the financial statements and financial highlights are free of material misstatement. The Fund is not required to have, nor were we engaged to perform, an audit of its internal control over financial reporting. Our audits included consideration of internal control over financial reporting as a basis for designing audit procedures that are appropriate in the circumstances, but not for the purpose of expressing an opinion on the effectiveness of the Fund's internal control over financial reporting. Accordingly, we express no such opinion. An audit also includes examining, on a test basis, evidence supporting the amounts and disclosures in the financial statements, assessing the accounting principles used and significant estimates made by management, as well as evaluating the overall financial statement presentation. Our procedures included confirmation of securities owned as of October 31, 2015, by correspondence with the custodians and brokers; when replies were not received from brokers, we performed other auditing procedures. We believe that our audits provide a reasonable basis for our opinion.
In our opinion, such financial statements and financial highlights referred to above present fairly, in all material respects, the financial position of Fidelity International Small Cap Fund as of October 31, 2015, the results of its operations for the year then ended, the changes in its net assets for each of the two years in the period then ended, and the financial highlights for each of the five years in the period then ended, in conformity with accounting principles generally accepted in the United States of America.
DELOITTE & TOUCHE LLP
Boston, Massachusetts
December 18, 2015
Annual Report
The Trustees, Member of the Advisory Board, and officers of the trust and fund, as applicable, are listed below. The Board of Trustees governs the fund and is responsible for protecting the interests of shareholders. The Trustees are experienced executives who meet periodically throughout the year to oversee the fund's activities, review contractual arrangements with companies that provide services to the fund, oversee management of the risks associated with such activities and contractual arrangements, and review the fund's performance. Each of the Trustees oversees 170 funds.
The Trustees hold office without limit in time except that (a) any Trustee may resign; (b) any Trustee may be removed by written instrument, signed by at least two-thirds of the number of Trustees prior to such removal; (c) any Trustee who requests to be retired or who has become incapacitated by illness or injury may be retired by written instrument signed by a majority of the other Trustees; and (d) any Trustee may be removed at any special meeting of shareholders by a two-thirds vote of the outstanding voting securities of the trust. Each Trustee who is not an interested person (as defined in the 1940 Act) of the trust and the fund (Independent Trustee), shall retire not later than the last day of the calendar year in which his or her 75th birthday occurs. The Independent Trustees may waive this mandatory retirement age policy with respect to individual Trustees. The officers and Advisory Board Member hold office without limit in time, except that any officer and Advisory Board Member may resign or may be removed by a vote of a majority of the Trustees at any regular meeting or any special meeting of the Trustees. Except as indicated, each individual has held the office shown or other offices in the same company for the past five years.
Experience, Skills, Attributes, and Qualifications of the Fund's Trustees. The Governance and Nominating Committee has adopted a statement of policy that describes the experience, qualifications, attributes, and skills that are necessary and desirable for potential Independent Trustee candidates (Statement of Policy). The Board believes that each Trustee satisfied at the time he or she was initially elected or appointed a Trustee, and continues to satisfy, the standards contemplated by the Statement of Policy. The Governance and Nominating Committee also engages professional search firms to help identify potential Independent Trustee candidates who have the experience, qualifications, attributes, and skills consistent with the Statement of Policy. From time to time, additional criteria based on the composition and skills of the current Independent Trustees, as well as experience or skills that may be appropriate in light of future changes to board composition, business conditions, and regulatory or other developments, have also been considered by the professional search firms and the Governance and Nominating Committee. In addition, the Board takes into account the Trustees' commitment and participation in Board and committee meetings, as well as their leadership of standing and ad hoc committees throughout their tenure.
In determining that a particular Trustee was and continues to be qualified to serve as a Trustee, the Board has considered a variety of criteria, none of which, in isolation, was controlling. The Board believes that, collectively, the Trustees have balanced and diverse experience, qualifications, attributes, and skills, which allow the Board to operate effectively in governing the fund and protecting the interests of shareholders. Information about the specific experience, skills, attributes, and qualifications of each Trustee, which in each case led to the Board's conclusion that the Trustee should serve (or continue to serve) as a trustee of the fund, is provided below.
Annual Report
Board Structure and Oversight Function. James C. Curvey is an interested person (as defined in the 1940 Act) and currently serves as Chairman. The Trustees have determined that an interested Chairman is appropriate and benefits shareholders because an interested Chairman has a personal and professional stake in the quality and continuity of services provided to the fund. Independent Trustees exercise their informed business judgment to appoint an individual of their choosing to serve as Chairman, regardless of whether the Trustee happens to be independent or a member of management. The Independent Trustees have determined that they can act independently and effectively without having an Independent Trustee serve as Chairman and that a key structural component for assuring that they are in a position to do so is for the Independent Trustees to constitute a substantial majority for the Board. The Independent Trustees also regularly meet in executive session. Ned C. Lautenbach serves as Chairman of the Independent Trustees and as such (i) acts as a liaison between the Independent Trustees and management with respect to matters important to the Independent Trustees and (ii) with management prepares agendas for Board meetings.
Fidelity funds are overseen by different Boards of Trustees. The fund's Board oversees Fidelity's high income and certain equity funds, and other Boards oversee Fidelity's investment-grade bond, money market, asset allocation, and sector funds. The asset allocation funds may invest in Fidelity funds overseen by the fund's Board. The use of separate Boards, each with its own committee structure, allows the Trustees of each group of Fidelity funds to focus on the unique issues of the funds they oversee, including common research, investment, and operational issues. On occasion, the separate Boards establish joint committees to address issues of overlapping consequences for the Fidelity funds overseen by each Board.
The Trustees operate using a system of committees to facilitate the timely and efficient consideration of all matters of importance to the Trustees, the fund, and fund shareholders and to facilitate compliance with legal and regulatory requirements and oversight of the fund's activities and associated risks. The Board, acting through its committees, has charged FMR and its affiliates with (i) identifying events or circumstances the occurrence of which could have demonstrably adverse effects on the fund's business and/or reputation; (ii) implementing processes and controls to lessen the possibility that such events or circumstances occur or to mitigate the effects of such events or circumstances if they do occur; and (iii) creating and maintaining a system designed to evaluate continuously business and market conditions in order to facilitate the identification and implementation processes described in (i) and (ii) above. Because the day-to-day operations and activities of the fund are carried out by or through FMR, its affiliates and other service providers, the fund's exposure to risks is mitigated but not eliminated by the processes overseen by the Trustees. While each of the Board's committees has responsibility for overseeing different aspects of the fund's activities, oversight is exercised primarily through the Operations, Audit, and Compliance Committees. In addition, the Independent Trustees have worked with FMR to enhance the Board's oversight of investment and financial risks, legal and regulatory risks, technology risks, and operational risks, including the development of additional risk reporting to the Board. For example, a working group comprised of Independent Trustees and FMR has worked and continues to work to review the Fidelity funds' valuation-related activities, reporting and risk management. Appropriate personnel, including but not limited to the fund's Chief Compliance Officer (CCO), FMR's internal auditor, the independent accountants, the fund's Treasurer and portfolio management personnel, make periodic reports to the Board's committees, as appropriate, including an annual review of Fidelity's risk management program for the Fidelity funds. The responsibilities of each standing committee, including their oversight responsibilities, are described further under "Standing Committees of the Fund's Trustees."
Annual Report
Trustees and Officers - continued
The fund's Statement of Additional Information (SAI) includes more information about the Trustees. To request a free copy, call Fidelity at 1-877-208-0098.
Interested Trustees*:
Correspondence intended for each Trustee who is an interested person may be sent to Fidelity Investments, 245 Summer Street, Boston, Massachusetts 02210.
Name, Year of Birth; Principal Occupations and Other Relevant Experience+ |
James C. Curvey (1935) |
Year of Election or Appointment: 2007 Trustee Chairman of the Board of Trustees |
| Mr. Curvey also serves as Trustee of other Fidelity funds. Mr. Curvey is a Director of Fidelity Research & Analysis Co. (investment adviser firm, 2009-present), and Vice Chairman (2007-present) and Director of FMR LLC (diversified financial services company). In addition, Mr. Curvey serves as an Overseer for the Boston Symphony Orchestra and a member of the board of Artis-Naples, Naples, Florida, and as a Trustee for Brewster Academy, Wolfeboro, New Hampshire. Previously, Mr. Curvey served as a Director of Fidelity Investments Money Management, Inc. (investment adviser firm, 2009-2014) and a Director of FMR and FMR Co., Inc. (investment adviser firms 2007-2014). |
Charles S. Morrison (1960) |
Year of Election or Appointment: 2014 Trustee |
| Mr. Morrison also serves as Trustee of other funds. He serves as a Director of Fidelity Investments Money Management, Inc. (FIMM) (investment adviser firm, 2014-present), Director of Fidelity SelectCo, LLC (investment adviser firm, 2014-present), President, Asset Management (2014-present), and is an employee of Fidelity Investments. Previously, Mr. Morrison served as Vice President of Fidelity's Fixed Income and Asset Allocation Funds (2012-2014), President, Fixed Income (2011-2014), Vice President of Fidelity's Money Market Funds (2005-2009), President, Money Market Group Leader of FMR (investment adviser firm, 2009), and Senior Vice President, Money Market Group of FMR (2004-2009). Mr. Morrison also served as Vice President of Fidelity's Bond Funds (2002-2005), certain Balanced Funds (2002-2005), and certain Asset Allocation Funds (2002-2007), and as Senior Vice President (2002-2005) of Fidelity's Bond Division. |
* Trustees have been determined to be "Interested Trustees" by virtue of, among other things, their affiliation with the trust or various entities under common control with FMR.
+ The information above includes each Trustee's principal occupation during the last five years and other information relating to the experience, attributes, and skills relevant to each Trustee's qualifications to serve as a Trustee, which led to the conclusion that each Trustee should serve as a Trustee for the fund.
Annual Report
Trustees and Officers - continued
Independent Trustees:
Correspondence intended for each Independent Trustee (that is, the Trustees other than the Interested Trustees) may be sent to Fidelity Investments, P.O. Box 55235, Boston, Massachusetts 02205-5235.
Name, Year of Birth; Principal Occupations and Other Relevant Experience+ |
Dennis J. Dirks (1948) |
Year of Election or Appointment: 2005 Trustee |
| Mr. Dirks also serves as Trustee of other Fidelity funds. Prior to his retirement in May 2003, Mr. Dirks was Chief Operating Officer and a member of the Board of The Depository Trust & Clearing Corporation (DTCC). He also served as President, Chief Operating Officer, and Board member of The Depository Trust Company (DTC) and President and Board member of the National Securities Clearing Corporation (NSCC). In addition, Mr. Dirks served as Chief Executive Officer and Board member of the Government Securities Clearing Corporation, Chief Executive Officer and Board member of the Mortgage-Backed Securities Clearing Corporation, as a Trustee and a member of the Finance Committee of Manhattan College (2005-2008), as a Trustee and a member of the Finance Committee of AHRC of Nassau County (2006-2008), and as a member of the Independent Directors Council (IDC) Governing Council (2010-2015). Mr. Dirks is a member of the Board of Directors for The Brookville Center for Children's Services, Inc. (2009-present). |
Alan J. Lacy (1953) |
Year of Election or Appointment: 2008 Trustee |
| Mr. Lacy also serves as Trustee of other Fidelity funds. Mr. Lacy serves as a member of the Board of Directors of Dave & Buster's Entertainment, Inc. (restaurant and entertainment complexes, 2010-present) and Bristol-Myers Squibb Company (global pharmaceuticals, 2008-present). In addition, Mr. Lacy served as Senior Adviser (2007-2014) of Oak Hill Capital Partners, L.P. (private equity) and also served as Chief Executive Officer (2000-2005) and Vice Chairman (2005-2006) of Sears Holdings Corporation and Sears, Roebuck and Co. (retail). Mr. Lacy is a member of the Board of Trustees of The National Parks Conservation Association (2006-present). Previously, Mr. Lacy served as Chairman of the Board of Trustees of the National Parks Conservation Association (2008-2011) and as a member of the Board of Directors for The Western Union Company (global money transfer, 2006-2011), The Hillman Companies, Inc. (hardware wholesalers, 2010-2014), and Earth Fare, Inc. (retail grocery, 2010-2014). |
Ned C. Lautenbach (1944) |
Year of Election or Appointment: 2000 Trustee Chairman of the Independent Trustees |
| Mr. Lautenbach also serves as Trustee of other Fidelity funds. Mr. Lautenbach currently serves as the Lead Director of the Eaton Corporation Board of Directors (diversified industrial, 1997-present). Mr. Lautenbach is Chairman of the Board of Directors of Artis-Naples in Naples, Florida (2012-present), a member of the Council on Foreign Relations (1994-present), and a member of the Board of Governors, State University System of Florida (2013-present). Previously, Mr. Lautenbach was a Partner/Advisory Partner at Clayton, Dubilier & Rice, LLC (private equity investment, 1998-2010), as well as a Director of Sony Corporation (2006-2007). |
Joseph Mauriello (1944) |
Year of Election or Appointment: 2008 Trustee |
| Mr. Mauriello also serves as Trustee of other Fidelity funds. Prior to his retirement in January 2006, Mr. Mauriello served in numerous senior management positions including Deputy Chairman and Chief Operating Officer (2004-2005), and Vice Chairman of Financial Services (2002-2004) of KPMG LLP US (professional services, 1965-2005). Mr. Mauriello currently serves as a member of the Board of Directors of XL Group plc. (global insurance and re-insurance, 2006-present) and the Independent Directors Council (IDC) Governing Council (2015-present). Previously, Mr. Mauriello served as a Director of the Hamilton Funds of the Bank of New York (2006-2007) and of Arcadia Resources Inc. (health care services and products, 2007-2012). |
Robert W. Selander (1950) |
Year of Election or Appointment: 2011 Trustee |
| Mr. Selander also serves as Trustee of other Fidelity funds. Mr. Selander serves as a Director of The Western Union Company (global money transfer, 2014-present). Previously, Mr. Selander served as a Member of the Advisory Board of other Fidelity funds (2011), and Executive Vice Chairman (2010), Chief Executive Officer (2009-2010), and President and Chief Executive Officer (1997-2009) of Mastercard, Inc. |
Cornelia M. Small (1944) |
Year of Election or Appointment: 2005 Trustee |
| Ms. Small also serves as Trustee of other Fidelity funds. Ms. Small is a member of the Board of Directors (2009-present) and Chair of the Investment Committee (2010-present) of the Teagle Foundation. Ms. Small also serves on the Investment Committee of the Berkshire Taconic Community Foundation (2008-present). Previously, Ms. Small served as Chairperson (2002-2008) and a member of the Investment Committee and Chairperson (2008-2012) and a member of the Board of Trustees of Smith College. In addition, Ms. Small served as Chief Investment Officer, Director of Global Equity Investments, and a member of the Board of Directors of Scudder, Stevens & Clark and Scudder Kemper Investments. |
William S. Stavropoulos (1939) |
Year of Election or Appointment: 2001 Trustee Vice Chairman of the Independent Trustees |
| Mr. Stavropoulos also serves as Trustee of other Fidelity funds. Mr. Stavropoulos serves as President and Founder of the Michigan Baseball Foundation, the Great Lakes Loons (2007-present). Mr. Stavropoulos is Chairman Emeritus of the Board of Directors of The Dow Chemical Company, where he previously served in numerous senior management positions, including President, CEO (1995-2000; 2002-2004), Chairman of the Executive Committee (2000-2006), and as a member of the Board of Directors (1990-2006). Currently, Mr. Stavropoulos is Chairman of the Board of Directors of Univar Inc. (global distributor of commodity and specialty chemicals), a Director of Teradata Corporation (data warehousing and technology solutions), and Maersk Inc. (industrial conglomerate), and a member of the Advisory Board for Metalmark Capital LLC (private equity investment, 2005-present). Mr. Stavropoulos is an operating advisor to Clayton, Dubilier & Rice, LLC (private equity investment). In addition, Mr. Stavropoulos is a member of the University of Notre Dame Advisory Council for the College of Science, a Trustee of the Rollin L. Gerstacker Foundation, and a Director of the Naples Philharmonic Center for the Arts. Previously, Mr. Stavropoulos served as a Director of Chemical Financial Corporation (bank holding company, 1993-2012) and Tyco International, Ltd. (multinational manufacturing and services, 2007-2012). |
David M. Thomas (1949) |
Year of Election or Appointment: 2008 Trustee |
| Mr. Thomas also serves as Trustee of other Fidelity funds. Mr. Thomas serves as Non-Executive Chairman of the Board of Directors of Fortune Brands Home and Security (home and security products, 2011-present), as a member of the Board of Directors (2004-present) and Presiding Director (2013-present) of Interpublic Group of Companies, Inc. (marketing communication), and as a member of the Board of Trustees of the University of Florida (2013-present). Previously, Mr. Thomas served as Executive Chairman (2005-2006) and Chairman and Chief Executive Officer (2000-2005) of IMS Health, Inc. (pharmaceutical and healthcare information solutions), and a Director of Fortune Brands, Inc. (consumer products, 2000-2011). |
+ The information above includes each Trustee's principal occupation during the last five years and other information relating to the experience, attributes, and skills relevant to each Trustee's qualifications to serve as a Trustee, which led to the conclusion that each Trustee should serve as a Trustee for the fund.
Advisory Board Member and Officers:
Correspondence intended for each officer and Peter S. Lynch may be sent to Fidelity Investments, 245 Summer Street, Boston, Massachusetts 02210. Officers appear below in alphabetical order.
Name, Year of Birth; Principal Occupation |
Peter S. Lynch (1944) |
Year of Election or Appointment: 2003 Member of the Advisory Board |
| Mr. Lynch also serves as Member of the Advisory Board of other Fidelity funds. Mr. Lynch is Vice Chairman and a Director of FMR (investment adviser firm) and FMR Co., Inc. (investment adviser firm). In addition, Mr. Lynch serves as a Trustee of Boston College and as the Chairman of the Inner-City Scholarship Fund. Previously, Mr. Lynch served on the Special Olympics International Board of Directors (1997-2006). |
Elizabeth Paige Baumann (1968) |
Year of Election or Appointment: 2012 Anti-Money Laundering (AML) Officer |
| Ms. Baumann also serves as AML Officer of other funds. She is Chief AML Officer of FMR LLC (diversified financial services company, 2012-present) and is an employee of Fidelity Investments. Previously, Ms. Baumann served as Vice President and Deputy Anti-Money Laundering Officer (2007-2012). |
Marc R. Bryant (1966) |
Year of Election or Appointment: 2015 Secretary and Chief Legal Officer (CLO) |
| Mr. Bryant also serves as Secretary and CLO of other funds. Mr. Bryant serves as CLO, Secretary, and Senior Vice President of Fidelity Management & Research Company (investment adviser firm, 2015-present) and FMR Co., Inc. (investment adviser firm, 2015-present); Secretary of Fidelity SelectCo, LLC (investment adviser firm, 2015-present) and Fidelity Investments Money Management, Inc. (investment adviser firm, 2015-present); and CLO of Fidelity Management & Research (Hong Kong) Limited (investment adviser firm, 2015-present). He is Senior Vice President and Deputy General Counsel of FMR LLC (diversified financial services company). Previously, Mr. Bryant served as Secretary and Chief Legal Officer of Fidelity Rutland Square Trust II (2010-2014) and Assistant Secretary of Fidelity's Fixed Income and Asset Allocation Funds (2013-2015). Prior to joining Fidelity Investments, Mr. Bryant served as a Senior Vice President and the Head of Global Retail Legal for AllianceBernstein L.P. (2006-2010), and as the General Counsel for ProFund Advisors LLC (2001-2006). |
William C. Coffey (1969) |
Year of Election or Appointment: 2009 Assistant Secretary |
| Mr. Coffey also serves as Assistant Secretary of other funds. He is Senior Vice President and Deputy General Counsel of FMR LLC (diversified financial services company, 2010-present), and is an employee of Fidelity Investments. Previously, Mr. Coffey served as Vice President and Associate General Counsel of FMR LLC (2005-2009). |
Jonathan Davis (1968) |
Year of Election or Appointment: 2010 Assistant Treasurer |
| Mr. Davis also serves as Assistant Treasurer of other funds, and is an employee of Fidelity Investments. Previously, Mr. Davis served as Vice President and Associate General Counsel of FMR LLC (diversified financial services company, 2003-2010). |
Adrien E. Deberghes (1967) |
Year of Election or Appointment: 2008 Deputy Treasurer |
| Mr. Deberghes also serves as an officer of other funds. He is an employee of Fidelity Investments (2008-present). Prior to joining Fidelity Investments, Mr. Deberghes was Senior Vice President of Mutual Fund Administration at State Street Corporation (2007-2008), Senior Director of Mutual Fund Administration at Investors Bank & Trust (2005-2007), and Director of Finance for Dunkin' Brands (2000-2005). |
Stephanie J. Dorsey (1969) |
Year of Election or Appointment: 2010 Assistant Treasurer |
| Ms. Dorsey also serves as an officer of other funds. She is an employee of Fidelity Investments (2008-present) and has served in other fund officer roles. Prior to joining Fidelity Investments, Ms. Dorsey served as Treasurer (2004-2008) of the JPMorgan Mutual Funds and Vice President (2004-2008) of JPMorgan Chase Bank. |
Howard J. Galligan III (1966) |
Year of Election or Appointment: 2014 Chief Financial Officer |
| Mr. Galligan also serves as Chief Financial Officer of other funds. Mr. Galligan serves as President of Fidelity Pricing and Cash Management Services (FPCMS) (2014-present) and as a Director of Strategic Advisers, Inc. (investment adviser firm, 2008-present). Previously, Mr. Galligan served as Chief Administrative Officer of Asset Management (2011-2014) and Chief Operating Officer and Senior Vice President of Investment Support for Strategic Advisers, Inc. (2003-2011). |
Scott C. Goebel (1968) |
Year of Election or Appointment: 2015 Vice President |
| Mr. Goebel serves as Vice President of other funds and is an employee of Fidelity Investments (2001-present). Previously, Mr. Goebel served as Secretary of Fidelity SelectCo, LLC (investment adviser firm, 2013-2015), Fidelity Investments Money Management, Inc. (FIMM) (investment adviser firm, 2010-2015), and Fidelity Research and Analysis Company (FRAC) (investment adviser firm, 2010-2015); General Counsel, Secretary, and Senior Vice President of Fidelity Management & Research Company (investment adviser firm, 2008-2015) and FMR Co., Inc. (investment adviser firm, 2008-2015); Assistant Secretary of Fidelity Management & Research (Japan) Limited (investment adviser firm, 2008-2015) and FMR Investment Management (U.K.) Limited (investment adviser firm, 2008-2015); Chief Legal Officer (CLO) of Fidelity Management & Research (Hong Kong) Limited (investment adviser firm, 2008-2015); Secretary and CLO of certain Fidelity funds (2008-2015); Assistant Secretary of FIMM (2008-2010), FRAC (2008-2010), and certain funds (2007-2008); and as Vice President and Secretary of Fidelity Distributors Corporation (FDC) (2005-2007). |
Thomas C. Hense (1964) |
Year of Election or Appointment: 2008, 2010, or 2015 Vice President |
| Mr. Hense serves as Vice President of Fidelity Advisor Multi-Asset Income Fund (2015) and other funds (High Income (2008), Small Cap (2008), and Value (2010) funds), and is an employee of Fidelity Investments (1993-present). Previously, Mr. Hense served as a portfolio manager for Fidelity's Institutional Money Management Group (Pyramis) (2003-2008). |
Brian B. Hogan (1964) |
Year of Election or Appointment: 2009 Vice President |
| Mr. Hogan also serves as Trustee or Vice President of other funds. Mr. Hogan serves as a Director of Fidelity SelectCo, LLC (investment adviser firm, 2014-present) and President of the Equity Division of FMR (investment adviser firm, 2009-present). Previously, Mr. Hogan served as Senior Vice President, Equity Research of FMR (2006-2009) and as a portfolio manager. |
Chris Maher (1972) |
Year of Election or Appointment: 2013 Assistant Treasurer |
| Mr. Maher serves as Assistant Treasurer of other funds. Mr. Maher is Vice President of Valuation Oversight and is an employee of Fidelity Investments. Previously, Mr. Maher served as Vice President of Asset Management Compliance (2013), Vice President of the Program Management Group of FMR (investment adviser firm, 2010-2013), and Vice President of Valuation Oversight (2008-2010). |
Kenneth B. Robins (1969) |
Year of Election or Appointment: 2008 President and Treasurer |
| Mr. Robins also serves as an officer of other funds. Mr. Robins serves as Executive Vice President of Fidelity Investments Money Management, Inc. (FIMM) (investment adviser firm, 2013-present) and is an employee of Fidelity Investments (2004-present). Previously, Mr. Robins served in other fund officer roles. |
Stacie M. Smith (1974) |
Year of Election or Appointment: 2013 Deputy Treasurer |
| Ms. Smith also serves as an officer of other funds. She is an employee of Fidelity Investments (2009-present) and has served in other fund officer roles. Prior to joining Fidelity Investments, Ms. Smith served as Senior Audit Manager of Ernst & Young LLP (1996-2009). |
Renee Stagnone (1975) |
Year of Election or Appointment: 2013 Deputy Treasurer |
| Ms. Stagnone also serves as Deputy Treasurer of other funds. Ms. Stagnone is an employee of Fidelity Investments (1997-present). |
Linda J. Wondrack (1964) |
Year of Election or Appointment: 2014 Chief Compliance Officer |
| Ms. Wondrack also serves as Chief Compliance Officer of other funds. Ms. Wondrack is Executive Vice President and head of the Ethics Office and Asset Management Compliance for Fidelity Investments (2012-present). Ms. Wondrack also serves as Chief Compliance Officer of Fidelity SelectCo, LLC (investment adviser firm, 2014-present); Chief Compliance Officer of Impresa Management LLC (2013-present); and Chief Compliance Officer of FMR Co., Inc. (investment adviser firm), Fidelity Investments Money Management, Inc. (investment adviser firm), Fidelity Management & Research (Japan) Limited (investment adviser firm), FMR Investment Management (U.K.) Limited (investment adviser firm), Fidelity Management & Research (Hong Kong) (investment adviser firm), Fidelity Management & Research Company (investment adviser firm), FIAM LLC (investment adviser firm), and Strategic Advisers, Inc. (investment adviser firm), Ballyrock Investment Advisors LLC, and Northern Neck Investors LLC (2012-present). Previously, Ms. Wondrack served as Senior Vice President and Chief Compliance Officer for Columbia Management Investment Advisers, LLC (2005-2012); Chief Compliance Officer for certain funds within the Columbia Family of Funds (2007-2012); and Senior Vice President of Compliance Risk Management at Bank of America (2005-2010). |
Joseph F. Zambello (1957) |
Year of Election or Appointment: 2011 Deputy Treasurer |
| Mr. Zambello also serves as Deputy Treasurer of other funds. Mr. Zambello is an employee of Fidelity Investments (1991-present). Previously, Mr. Zambello served as Vice President of the Program Management Group of FMR (investment adviser firm, 2009-2011) and Vice President of the Transfer Agent Oversight Group (2005-2009). |
Annual Report
The Board of Trustees of Advisor International Small Cap Fund voted to pay to shareholders of record at the opening of business on record date, the following distributions per share derived from capital gains realized from sales of portfolio securities, and dividends derived from net investment income:
| Pay Date | Record Date | Dividends | Capital Gains |
Class A | 12/07/15 | 12/04/15 | $0.251 | $0.620 |
Class T | 12/07/15 | 12/04/15 | $0.194 | $0.620 |
Class B | 12/07/15 | 12/04/15 | $0.060 | $0.620 |
Class C | 12/07/15 | 12/04/15 | $0.125 | $0.620 |
The fund hereby designates as a capital gain dividend with respect to the taxable year ended October 2015, $19,117,976, or, if subsequently determined to be different, the net capital gain of such year.
Class A designates 3% and Class T designates 5% of the dividends distributed during the fiscal year as qualifying for the dividends-received deduction for corporate shareholders.
Class A and Class T designate 100% of the dividends distributed during the fiscal year as amounts which may be taken into account as a dividend for purposes of the maximum rate under section 1(h)(11) of the Internal Revenue Code.
The amounts per share which represent income derived from sources within, and taxes paid to, foreign countries or possessions of the United States are as follows:
| Pay Date | Income | Taxes |
Class A | 12/08/2014 | $0.2425 | $0.0515 |
Class T | 12/08/2014 | $0.1395 | $0.0515 |
Class B | 12/08/2014 | $0.0000 | $0.0000 |
Class C | 12/08/2014 | $0.0000 | $0.0000 |
The fund will notify shareholders in January 2016 of amounts for use in preparing 2015 income tax returns.
Annual Report
Fidelity International Small Cap Fund
Each year, the Board of Trustees, including the Independent Trustees (together, the Board), votes on the renewal of the management contract with Fidelity Management & Research Company (FMR) and the sub-advisory agreements (together, the Advisory Contracts) for the fund. The Board, assisted by the advice of fund counsel and Independent Trustees' counsel, requests and considers a broad range of information relevant to the renewal of the Advisory Contracts throughout the year.
The Board meets regularly and, at each of its meetings, covers an extensive agenda of topics and materials and considers factors that are relevant to its annual consideration of the renewal of the fund's Advisory Contracts, including the services and support provided to the fund and its shareholders. The Board has established various standing committees (Committees), each composed of and chaired by Independent Trustees with varying backgrounds, to which the Board has assigned specific subject matter responsibilities in order to enhance effective decision-making by the Board. The Board, acting directly and through its Committees, requests and receives information concerning the annual consideration of the renewal of the fund's Advisory Contracts. The Board also meets as needed to consider matters specifically related to the Board's annual consideration of the renewal of the Advisory Contracts. Members of the Board may also meet with trustees of other Fidelity funds through ad hoc joint committees to discuss certain matters relevant to all of the Fidelity funds.
At its July 2015 meeting, the Board unanimously determined to renew the fund's Advisory Contracts. In reaching its determination, the Board considered all factors it believed relevant, including (i) the nature, extent, and quality of the services to be provided to the fund and its shareholders (including the investment performance of the fund); (ii) the competitiveness of the fund's management fee and total expense ratio relative to peer funds; (iii) the total costs of the services to be provided by and the profits to be realized by Fidelity from its relationship with the fund; and (iv) the extent to which (if any) economies of scale exist and would be realized as the fund grows, and whether any economies of scale are appropriately shared with fund shareholders.
In considering whether to renew the Advisory Contracts for the fund, the Board reached a determination, with the assistance of fund counsel and Independent Trustees' counsel and through the exercise of its business judgment, that the renewal of the Advisory Contracts was in the best interests of the fund and its shareholders and that the compensation payable under the Advisory Contracts was fair and reasonable. The Board's decision to renew the Advisory Contracts was not based on any single factor, but rather was based on a comprehensive consideration of all the information provided to the Board at its meetings throughout the year. The Board, in reaching its determination to renew the Advisory Contracts, was aware that shareholders of the fund have a broad range of investment choices available to them, including a wide choice among funds offered by Fidelity's competitors, and that the fund's shareholders, who have the opportunity to review and weigh the disclosure provided by the fund in its prospectus and other public disclosures, have chosen to invest in this fund, which is part of the Fidelity family of funds.
Annual Report
Nature, Extent, and Quality of Services Provided. The Board considered Fidelity's staffing as it relates to the fund, including the backgrounds of investment personnel of Fidelity, and also considered the fund's investment objective, strategies, and related investment philosophy. The Independent Trustees also had discussions with senior management of Fidelity's investment operations and investment groups. The Board considered the structure of the portfolio manager compensation program and whether this structure provides appropriate incentives to act in the best interests of the fund. Additionally, the Board considered the portfolio managers' investments, if any, in the funds that they manage.
Resources Dedicated to Investment Management and Support Services. The Board and the Fund Oversight and Research Committees reviewed the general qualifications and capabilities of Fidelity's investment staff, including its size, education, experience, and resources, as well as Fidelity's approach to recruiting, training, managing, and compensating investment personnel. The Board noted that Fidelity has continued to increase the resources devoted to non-U.S. offices, including expansion of Fidelity's global investment organization. The Board also noted that Fidelity's analysts have extensive resources, tools and capabilities that allow them to conduct sophisticated quantitative and fundamental analysis, as well as credit analysis of issuers, counterparties and guarantors. Further, the Board considered that Fidelity's investment professionals have sufficient access to global information and data so as to provide competitive investment results over time, and that those professionals also have access to sophisticated tools that permit them to assess portfolio construction and risk and performance attribution characteristics continuously, as well as to transmit new information and research conclusions rapidly around the world. Additionally, in its deliberations, the Board considered Fidelity's trading, risk management, and compliance capabilities and resources, which are integral parts of the investment management process.
Shareholder and Administrative Services. The Board considered (i) the nature, extent, quality, and cost of advisory, administrative, and shareholder services performed by FMR, the sub-advisers (together with FMR, the Investment Advisers), and their affiliates under the Advisory Contracts and under separate agreements covering transfer agency, pricing and bookkeeping, and securities lending services for the fund; (ii) the nature and extent of the supervision of third party service providers, principally custodians and subcustodians; and (iii) the resources devoted to, and the record of compliance with, the fund's compliance policies and procedures. The Board also reviewed the allocation of fund brokerage, including allocations to brokers affiliated with the Investment Advisers, the use of brokerage commissions to pay fund expenses, and the use of "soft" commission dollars to pay for research services.
Annual Report
Board Approval of Investment Advisory Contracts and
Management Fees - continued
The Board noted that the growth of fund assets over time across the complex allows Fidelity to reinvest in the development of services designed to enhance the value or convenience of the Fidelity funds as investment vehicles. These services include 24-hour access to account information and market information through telephone representatives and over the Internet, investor education materials and asset allocation tools, and the expanded availability of Fidelity Investor Centers.
In 2014, the Board formed an ad hoc Committee on Transfer Agency Fees to review the variety of transfer agency fee structures throughout the industry and Fidelity's competitive positioning with respect to industry participants.
Investment in a Large Fund Family. The Board considered the benefits to shareholders of investing in a Fidelity fund, including the benefits of investing in a fund that is part of a large family of funds offering a variety of investment disciplines and providing a large variety of mutual fund investor services. The Board noted that Fidelity had taken, or had made recommendations that resulted in the Fidelity funds taking, a number of actions over the previous year that benefited particular funds, including (i) continuing to dedicate additional resources to investment research and to the support of the senior management team that oversees asset management; (ii) continuing efforts to enhance Fidelity's global research capabilities; (iii) launching new funds and making other enhancements to meet client needs; (iv) reducing management fees and total expenses for certain index funds and diversified international funds; (v) continuing to launch dedicated lower cost underlying funds to meet portfolio construction needs related to expanding underlying fund options for Fidelity funds of funds, specifically for the Freedom Fund product lines; (vi) rationalizing product lines and gaining increased efficiencies through fund mergers; (vii) launching active fixed-income exchange-traded funds; (viii) continuing to develop, acquire and implement systems and technology to improve services to the funds and information security and to increase efficiency; (ix) implementing investment enhancements to further strengthen Fidelity's target date product line to increase investors' probability of success in achieving their goals; (x) modifying the eligibility criteria for certain share classes to accommodate roll-over assets from employer-sponsored retirement plans; (xi) launching a new Class W of the Freedom Index Funds to attract and retain Fidelity record-kept retirement plan assets; and (xii) implementing changes to Fidelity's money market product line in response to recent money market regulatory reforms.
Investment Performance. The Board considered whether the fund has operated in accordance with its investment objective, as well as its record of compliance with its investment restrictions and its performance history. The Board noted that there was a portfolio management change for the fund in March 2014.
Annual Report
The Board took into account discussions with representatives of the Investment Advisers about fund investment performance that occur at Board meetings throughout the year. In this regard the Board noted that as part of regularly scheduled fund reviews and other reports to the Board on fund performance, the Board considers annualized return information for the fund, for different time periods, measured against a securities market index ("benchmark index") and a peer group of funds with similar objectives ("peer group"), if any. In its evaluation of fund investment performance, the Board gave particular attention to information indicating changes in performance of certain Fidelity funds for specific time periods and discussed with the Investment Advisers the reasons for any overperformance or underperformance.
In addition to reviewing absolute and relative fund performance, the Independent Trustees periodically consider the appropriateness of fund performance metrics in evaluating the results achieved. In general, the Independent Trustees believe that fund performance should be evaluated based on net performance (after fees and expenses) of both the highest performing and lowest performing fund share classes, where applicable, compared to appropriate benchmark indices, over appropriate time periods that may include full market cycles, and compared to peer groups, as applicable, over the same periods, taking into account relevant factors including the following: general market conditions; issuer-specific information; and fund cash flows and other factors.
The Independent Trustees recognize that shareholders evaluate performance on a net basis over their own holding periods, for which one-, three-, and five-year periods are often used as a proxy. For this reason, the performance information reviewed by the Board also included net cumulative calendar year total return information for the fund and an appropriate benchmark index and peer group for the most recent one-, three-, and five-year periods, as shown below. Returns are shown compared to the 25th percentile (top of box, 75% beaten) and 75th percentile (bottom of box, 25% beaten) of the peer universe. Returns of the benchmark index are "net MA," i.e., adjusted for tax withholding rates applicable to U.S.-based funds organized as Massachusetts business trusts.
Annual Report
Board Approval of Investment Advisory Contracts and
Management Fees - continued
Fidelity International Small Cap Fund
The Board also considered that the fund's management fee is subject to upward or downward adjustment depending upon whether, and to what extent, the fund's investment performance for the performance period exceeds, or is exceeded by, a securities index, thus leading to a performance adjustment for the same period. The Board noted that the performance adjustment provides FMR with a strong economic incentive to seek to achieve superior performance for the fund's shareholders and helps to more closely align the interests of FMR and the shareholders of the fund.
Based on its review, the Board concluded that the nature, extent, and quality of services provided to the fund under the Advisory Contracts should benefit the shareholders of the fund.
Competitiveness of Management Fee and Total Expense Ratio. The Board considered the fund's management fee and total expense ratio compared to "mapped groups" of competitive funds and classes created for the purpose of facilitating the Trustees' competitive analysis of management fees and total expenses. Fidelity creates "mapped groups" by combining similar Lipper investment objective categories that have comparable investment mandates. Combining Lipper investment objective categories aids the Board's management fee and total expense ratio comparisons by broadening the competitive group used for comparison.
Management Fee. The Board considered two proprietary management fee comparisons for the 12-month periods shown in basis points (BP) in the chart below. The group of Lipper funds used by the Board for management fee comparisons is referred to below as the "Total Mapped Group." The Total Mapped Group is broader than the Lipper peer group used by the Board for performance comparisons because the Total Mapped Group combines several Lipper investment objective categories while the Lipper peer group does not. The Total Mapped Group comparison focuses on a fund's standing in terms of gross management fees before expense reimbursements or caps, and without giving effect to the fund's performance adjustment, relative to the total universe of funds with comparable investment mandates, regardless of whether their management fee structures also are comparable. Funds with comparable investment mandates offer exposure to similar types of securities. Funds with comparable management fee structures have similar management fee contractual arrangements (e.g., flat rate charged for advisory services, all-inclusive fee rate, etc.). "TMG %" represents the percentage of funds in the Total Mapped Group that had management fees that were lower than the fund's. For example, a hypothetical TMG % of 20% would mean that 80% of the funds in the Total Mapped Group had higher, and 20% had lower, management fees than the fund. The fund's actual TMG %s and the number of funds in the Total Mapped Group are in the chart below. The "Asset-Size Peer Group" (ASPG) comparison focuses on a fund's standing relative to a subset of non-Fidelity funds within the Total Mapped Group that are similar in size and management fee structure without taking into account performance adjustments, if any. For example, if a fund is in the first quartile of the ASPG, the fund's management fee ranks in the least expensive or lowest 25% of funds in the ASPG. The ASPG represents at least 15% of the funds in the Total Mapped Group with comparable asset size and management fee structures, subject to a minimum of 50 funds (or all funds in the Total Mapped Group if fewer than 50). Additional information, such as the ASPG quartile in which the fund's management fee rate ranked and the impact of the fund's performance adjustment, is also included in the chart and considered by the Board.
Annual Report
Fidelity International Small Cap Fund
Annual Report

The Board noted that the fund's management fee rate ranked below the median of its Total Mapped Group and below the median of its ASPG for 2014. The Board also noted the effect of the fund's performance adjustment, if any, on the fund's management fee ranking.
Furthermore, the Board considered that shareholders approved a prospective change in the index used to calculate the fund's performance adjustment, beginning April 1, 2014. The Board also considered that, because the performance adjustment is based on a rolling 36-month measurement period, during a transition period the fund's performance is compared to a blended index return that reflects the performance of the former index for the portion of the measurement period prior to April 1, 2014 and the performance of the current index for the remainder of the measurement period. The Board noted that the fund's performance adjustment for 2014 shown in the chart above reflects the effect of using the blended index return to calculate the fund's performance adjustment.
Board Approval of Investment Advisory Contracts and
Management Fees - continued
The Board noted that, in 2014, the ad hoc Committee on Group Fee was formed by it and other Fidelity fund boards to conduct an in-depth review of the "group fee" component of the management fee of funds with such management fee structures. Committee focus included the mechanics of the group fee, the competitive landscape of group fee structures, Fidelity funds with no group fee component and investment products not included in group fee assets. The Board also considered that, for funds subject to the group fee, FMR agreed to voluntarily waive fees over a specified period of time in amounts designed to account for assets converted from certain funds to certain collective investment trusts.
Annual Report
The Board also noted that, in 2013, the ad hoc Committee on Management Fees was formed to conduct an in-depth review of the management fee rates of Fidelity's active equity mutual funds. The Committee focused on the following areas: (i) standard fee structures; (ii) research consumption and trading evolution; (iii) management fee competitiveness/profitability by category; and (iv) factors that drive institutional pricing.
Based on its review, the Board concluded that the fund's management fee is fair and reasonable in light of the services that the fund receives and the other factors considered.
Total Expense Ratio. In its review of each class's total expense ratio, the Board considered the fund's management fee as well as other fund or class expenses, as applicable, such as transfer agent fees, pricing and bookkeeping fees, fund-paid 12b-1 fees, and custodial, legal, and audit fees. The Board noted the impact of the fund's performance adjustment. The Board also noted that Fidelity may agree to waive fees and expenses from time to time, and the extent to which, if any, it has done so for the fund. As part of its review, the Board also considered the current and historical total expense ratios of each class of the fund compared to competitive fund median expenses. Each class of the fund is compared to those funds and classes in the Total Mapped Group (used by the Board for management fee comparisons) that have a similar sales load structure.
The Board noted that the total expense ratio of each of Class A, Class B, Class C, Class I, and the retail class ranked below its competitive median for 2014 and the total expense ratio of Class T ranked above its competitive median for 2014. The Board considered that, in general, various factors can affect total expense ratios. The Board noted that the total expense ratio of Class T was above the competitive median primarily because of higher 12b-1 fees on Class T as compared to most competitor funds. Class T has a higher 12b-1 fee, but a lower front-end sales charge, than traditionally priced front-end sales charge classes. The Board considered that Class T is primarily sold load-waived in the retirement plan market where its 0.50% 12b-1 fee is comparable to competing no-load, higher 12b-1 fee classes designed specifically for retirement plans. The Board noted that the fund offers multiple classes, each of which has a different sales load and 12b-1 fee structure, and that the multiple structures are intended to offer a range of pricing options for the intermediary market. The Board also noted that the total expense ratios of the classes vary primarily by the level of their 12b-1 fees, although differences in transfer agent fees may also cause expenses to vary from class to class.
Fees Charged to Other Fidelity Clients. The Board also considered Fidelity fee structures and other information with respect to clients of Fidelity, such as other funds advised or subadvised by Fidelity, pension plan clients, and other institutional clients with similar mandates. The Board noted the findings of the 2013 ad hoc joint committee (created with the board of other Fidelity funds), which reviewed and compared Fidelity's institutional investment advisory business with its business of providing services to the Fidelity funds, including the differences in services provided, fees charged, and costs incurred, as well as competition in their respective marketplaces.
Annual Report
Board Approval of Investment Advisory Contracts and
Management Fees - continued
Based on its review of total expense ratios and fees charged to other Fidelity clients, the Board concluded that, although Class T was above the median of the universe presented for comparison, the total expense ratio of each class of the fund was reasonable in light of the services that the fund and its shareholders receive and the other factors considered.
Costs of the Services and Profitability. The Board considered the revenues earned and the expenses incurred by Fidelity in conducting the business of developing, marketing, distributing, managing, administering and servicing the fund and servicing the fund's shareholders. The Board also considered the level of Fidelity's profits in respect of all the Fidelity funds.
On an annual basis, Fidelity presents to the Board information about the profitability of its relationship with the fund. Fidelity calculates profitability information for each fund, as well as aggregate profitability information for groups of Fidelity funds and all Fidelity funds, using a series of detailed revenue and cost allocation methodologies which originate with the books and records of Fidelity on which Fidelity's audited financial statements are based. The Audit Committee of the Board reviews any significant changes from the prior year's methodologies.
PricewaterhouseCoopers LLP (PwC), independent registered public accounting firm and auditor to Fidelity and certain Fidelity funds, has been engaged annually by the Board as part of the Board's assessment of Fidelity's profitability analysis. PwC's engagement includes the review and assessment of the methodologies used by Fidelity in determining the revenues and expenses attributable to Fidelity's mutual fund business, and completion of agreed-upon procedures in respect of the mathematical accuracy of fund profitability and its conformity to established allocation methodologies. After considering PwC's reports issued under the engagement and information provided by Fidelity, the Board concluded that while other allocation methods may also be reasonable, Fidelity's profitability methodologies are reasonable in all material respects.
The Board also reviewed Fidelity's non-fund businesses and fall-out benefits related to the mutual fund business as well as cases where Fidelity's affiliates may benefit from or be related to the fund's business.
The Board considered the costs of the services provided by and the profits realized by Fidelity in connection with the operation of the fund and was satisfied that the profitability was not excessive.
Economies of Scale. The Board considered whether there have been economies of scale in respect of the management of the Fidelity funds, whether the Fidelity funds (including the fund) have appropriately benefited from any such economies of scale, and whether there is potential for realization of any further economies of scale. The Board considered the extent to which the fund will benefit from economies of scale as assets grow through increased services to the fund, through waivers or reimbursements, or through fee or expense ratio reductions. The Board also noted that in 2013, it and the boards of other Fidelity funds created an ad hoc committee (the Economies of Scale Committee) to analyze whether Fidelity attains economies of scale in respect of the management and servicing of the Fidelity funds, whether the Fidelity funds have appropriately benefited from such economies of scale, and whether there is potential for realization of any further economies of scale.
Annual Report
The Board recognized that the fund's management contract incorporates a "group fee" structure, which provides for lower group fee rates as total group assets increase, and for higher group fee rates as total group assets decrease (with "group assets" defined to include fund assets under FMR's management plus sector fund assets previously under FMR's management and currently managed by Fidelity SelectCo, LLC). FMR calculates the group fee rates based on a tiered asset "breakpoint" schedule that varies based on asset class. The Board considered that the group fee is designed to deliver the benefits of economies of scale to fund shareholders when total Fidelity fund assets increase, even if assets of any particular fund are unchanged or have declined, because some portion of Fidelity's costs are attributable to services provided to all Fidelity funds, and all funds benefit if those costs can be allocated among more assets. The Board concluded that, given the group fee structure, fund shareholders will benefit from lower management fees as group assets increase at the fund complex level, regardless of whether Fidelity achieves any such economies of scale.
The Board concluded, taking into account the analysis of the Economies of Scale Committee, that economies of scale, if any, are being appropriately shared between fund shareholders and Fidelity.
Additional Information Requested by the Board. In order to develop fully the factual basis for consideration of the Fidelity funds' Advisory Contracts, the Board requested and received additional information on certain topics, including: (i) fund performance trends and Fidelity's long-term strategies for certain funds; (ii) the various share classes employed by Fidelity and the attributes of each class, together with similar information on the distribution and servicing payments made by Fidelity or the funds to third-party participants in the distribution channels; (iii) fund profitability, and fund performance in relation to fund profitability; (iv) the methodology with respect to evaluating competitive fund data and peer group classifications and fee comparisons; (v) annual fund profitability margins, with particular focus on certain funds with negative margins; (vi) the realization of fall-out benefits in certain Fidelity business units; (vii) economies of scale and the way in which they are shared with fund shareholders; (viii) Fidelity's group fee structures, including the group fee schedule of breakpoints; (ix) the impact of cost containment measures on the funds; and (x) the transfer agent fee structure.
Annual Report
Board Approval of Investment Advisory Contracts and
Management Fees - continued
Based on its evaluation of all of the conclusions noted above, and after considering all factors it believed relevant, the Board concluded that the advisory fee structures are fair and reasonable, and that the fund's Advisory Contracts should be renewed.
Annual Report
Investment Adviser
Fidelity Management & Research Company
Boston, MA
Investment Sub-Advisers
FMR Co., Inc.
FMR Investment Management
(U.K.) Limited
Fidelity Management & Research
(Hong Kong) Limited
Fidelity Management & Research
(Japan) Limited
FIL Investment Advisors
FIL Investments (Japan) Limited
FIL Investment Advisors (UK) Limited
General Distributor
Fidelity Distributors Corporation
Smithfield, RI
Transfer and Service Agents
Fidelity Investments Institutional Operations Company, Inc.
Boston, MA
Fidelity Service Company, Inc.
Boston, MA
Custodian
The Bank of New York Mellon
New York, NY
(Fidelity Investment logo)(registered trademark)
AISC-UANN-1215
1.793568.112
(Fidelity Investment logo)(registered trademark)
Fidelity Advisor®
International Small Cap
Fund - Class I
(formerly Institutional Class)
Annual Report
October 31, 2015
(Fidelity Cover Art)
Class I is a class of
Fidelity® International Small Cap Fund
Contents
Performance | (Click Here) | How the fund has done over time. |
Management's Discussion of Fund Performance | (Click Here) | The Portfolio Manager's review of fund performance and strategy. |
Shareholder Expense Example | (Click Here) | An example of shareholder expenses. |
Investment Changes | (Click Here) | A summary of major shifts in the fund's investments over the past six months. |
Investments | (Click Here) | A complete list of the fund's investments with their market values. |
Financial Statements | (Click Here) | Statements of assets and liabilities, operations, and changes in net assets, as well as financial highlights. |
Notes | (Click Here) | Notes to financial statements. |
Report of Independent Registered Public Accounting Firm | (Click Here) | |
Trustees and Officers | (Click Here) | |
Distributions | (Click Here) | |
Board Approval of Investment Advisory Contracts and Management Fees | (Click Here) | |
To view a fund's proxy voting guidelines and proxy voting record for the 12-month period ended June 30, visit http://www.fidelity.com/proxyvotingresults or visit the Securities and Exchange Commission's (SEC) web site at http://www.sec.gov. You may also call 1-877-208-0098 to request a free copy of the proxy voting guidelines.
Standard & Poor's, S&P and S&P 500 are registered service marks of The McGraw-Hill Companies, Inc. and have been licensed for use by Fidelity Distributors Corporation.
Other third-party marks appearing herein are the property of their respective owners.
All other marks appearing herein are registered or unregistered trademarks or service marks of FMR LLC or an affiliated company. © 2015 FMR LLC. All rights reserved.
Annual Report
This report and the financial statements contained herein are submitted for the general information of the shareholders of the fund. This report is not authorized for distribution to prospective investors in the fund unless preceded or accompanied by an effective prospectus.
A fund files its complete schedule of portfolio holdings with the SEC for the first and third quarters of each fiscal year on Form N-Q. Forms N-Q are available on the SEC's web site at http://www.sec.gov. A fund's Forms N-Q may be reviewed and copied at the SEC's Public Reference Room in Washington, DC. Information regarding the operation of the SEC's Public Reference Room may be obtained by calling 1-800-SEC-0330. For a complete list of a fund's portfolio holdings, view the most recent holdings listing, semiannual report, or annual report on Fidelity's web site at http://www.fidelity.com, http://www.advisor.fidelity.com, or http://www.401k.com, as applicable.
NOT FDIC INSURED • MAY LOSE VALUE • NO BANK GUARANTEE
Neither the fund nor Fidelity Distributors Corporation is a bank.
Annual Report
Average annual total return reflects the change in the value of an investment, assuming reinvestment of the class' distributions from dividend income and capital gains (the profits earned upon the sale of securities that have grown in value, if any) and assuming a constant rate of performance each year. The $10,000 table and the fund's returns do not reflect the deduction of taxes that a shareholder would pay on fund distributions or the redemption of fund shares. During periods of reimbursement by Fidelity, a fund's total return will be greater than it would be had the reimbursement not occurred. How a fund did yesterday is no guarantee of how it will do tomorrow.
Average Annual Total Returns
Periods ended October 31, 2015 | Past 1
year | Past 5
years | Past 10
years |
Class I † | 6.60% | 7.90% | 6.89% |
† Prior to April 1, 2014, the fund compared its performance to a different benchmark. The fund's historical performance may not represent its current investment policies.
$10,000 Over 10 Years
Let's say hypothetically that $10,000 was invested in Fidelity Advisor® International Small Cap Fund - Class I on October 31, 2005. The chart shows how the value of your investment would have changed, and also shows how the MSCI ACWI (All Country World Index) ex USA Small Cap Index performed over the same period.
Annual Report
Market Recap: International equities suffered a moderate setback for the 12 months ending October 31, 2015, held back by a collapse in commodities prices that hurt resources-related sectors and geographies. The MSCI ACWI (All Country World Index) ex USA Index returned -4.55% for the period, affected also by concerns about global economic growth. Commodity producers remained under pressure for much of the past year, largely related to economic deceleration in China (-1%), the world's second-largest economy and a leading consumer of raw materials. This effect was exacerbated by U.S. dollar strength relative to global currencies, which weighed on commodities priced in dollars and acutely impacted equity returns within regions most exposed to resources prices. The emerging-markets group, for example, returned about -15% this period. Canada, a significant energy producer, returned roughly -17%. Net energy consumer Japan (+9%) was the best-performing region by far. Only about a quarter of the nearly 50 index countries managed a gain this period: Ireland (+19%) - the EU's fastest-growing economy - and Israel (+17%) proved top performers; Greece (-56%) and Brazil (-46%), among the worst. As for sectors, energy (-25%) and materials (-16%) declined sharply, whereas the two consumer sectors each gained about 6%.
Comments from Portfolio Manager Samuel Chamovitz: For the year, the fund's share classes (excluding sales charges, if applicable) posted mid-single-digit gains and considerably outdistanced the 1.62% return of the benchmark MSCI ACWI (All Country World Index) ex USA Small Cap Index. Stock selection in information technology, financials and consumer staples was especially beneficial to performance versus the benchmark. Geographically, stock picking in Japan, Switzerland, Israel and New Zealand stood out as positives. The top contributor was VZ Holding, a Switzerland-based provider of financial advisory and asset management services. VZ grew its market share on the strength of its asset management products and investor education initiatives. Other contributors included BGF Retail, a South Korean operator of convenience stores employing a franchise model, Israel-based flavors and fragrances maker Frutarom Industries, and Japanese drug-store chain Tsuruha Holdings. Conversely, stock selection in the United Kingdom and Ireland, as well as non-benchmark exposure to the U.S., were negatives. Relative results also were affected by a downward fair-value pricing adjustment of 0.56 percentage points. Our largest relative detractor was BW Offshore, listed on the Oslo Stock Exchange. This firm builds and operates Floating Production Storage and Offloading (FPSO) vessels used in offshore oil production. Another meaningful detractor was Petra Diamonds, a supplier of rough diamonds to the international market.
The views expressed above reflect those of the portfolio manager(s) only through the end of the period as stated on the cover of this report and do not necessarily represent the views of Fidelity or any other person in the Fidelity organization. Any such views are subject to change at any time based upon market or other conditions and Fidelity disclaims any responsibility to update such views. These views may not be relied on as investment advice and, because investment decisions for a Fidelity fund are based on numerous factors, may not be relied on as an indication of trading intent on behalf of any Fidelity fund.
Annual Report
Shareholder Expense Example
As a shareholder of the Fund, you incur two types of costs: (1) transaction costs, including sales charges (loads) on purchase payments or redemption proceeds, redemption fees and (2) ongoing costs, including management fees, distribution and/or service (12b-1) fees and other Fund expenses. This Example is intended to help you understand your ongoing costs (in dollars) of investing in the Fund and to compare these costs with the ongoing costs of investing in other mutual funds.
The Example is based on an investment of $1,000 invested at the beginning of the period and held for the entire period (May 1, 2015 to October 31, 2015).
Actual Expenses
The first line of the accompanying table for each class of the Fund provides information about actual account values and actual expenses. You may use the information in this line, together with the amount you invested, to estimate the expenses that you paid over the period. Simply divide your account value by $1,000.00 (for example, an $8,600 account value divided by $1,000.00 = 8.6), then multiply the result by the number in the first line for a class of the Fund under the heading entitled "Expenses Paid During Period" to estimate the expenses you paid on your account during this period. A small balance maintenance fee of $12.00 that is charged once a year may apply for certain accounts with a value of less than $2,000. This fee is not included in the table below. If it was, the estimate of expenses you paid during the period would be higher, and your ending account value lower, by this amount. In addition, the Fund, as a shareholder in the underlying Fidelity Central Funds, will indirectly bear its pro-rata share of the fees and expenses incurred by the underlying Fidelity Central Funds. These fees and expenses are not included in the Fund's annualized expense ratio used to calculate the expense estimate in the table below.
Hypothetical Example for Comparison Purposes
The second line of the accompanying table for each class of the Fund provides information about hypothetical account values and hypothetical expenses based on a Class' actual expense ratio and an assumed rate of return of 5% per year before expenses, which is not the Class' actual return. The hypothetical account values and expenses may not be used to estimate the actual ending account balance or expenses you paid for the period. You may use this information to compare the ongoing costs of investing in the Fund and other funds. To do so, compare this 5% hypothetical example with the 5% hypothetical examples that appear in the shareholder reports of the other funds. A small balance maintenance fee of $12.00 that is charged once a year may apply for certain accounts with a value of less than $2,000. This fee is not included in the table below. If it was, the estimate of expenses you paid during the period would be higher, and your ending account value lower, by this amount. In addition, the Fund, as a shareholder in the underlying Fidelity Central Funds, will indirectly bear its pro-rata share of the fees and expenses incurred by the underlying Fidelity Central Funds. These fees and expenses are not included in the Fund's annualized expense ratio used to calculate the expense estimate in the table below.
Annual Report
Shareholder Expense Example - continued
Please note that the expenses shown in the table are meant to highlight your ongoing costs only and do not reflect any transaction costs. Therefore, the second line of the table is useful in comparing ongoing costs only, and will not help you determine the relative total costs of owning different funds. In addition, if these transactional costs were included, your costs would have been higher.
| Annualized
Expense RatioB | Beginning
Account Value
May 1, 2015 | Ending
Account Value
October 31, 2015 | Expenses Paid
During PeriodC
May 1, 2015
to October 31, 2015 |
Class A | 1.63% | | | |
Actual | | $ 1,000.00 | $ 955.00 | $ 8.03 |
HypotheticalA | | $ 1,000.00 | $ 1,016.99 | $ 8.29 |
Class T | 1.92% | | | |
Actual | | $ 1,000.00 | $ 953.90 | $ 9.46 |
HypotheticalA | | $ 1,000.00 | $ 1,015.53 | $ 9.75 |
Class B | 2.42% | | | |
Actual | | $ 1,000.00 | $ 951.60 | $ 11.90 |
HypotheticalA | | $ 1,000.00 | $ 1,013.01 | $ 12.28 |
Class C | 2.41% | | | |
Actual | | $ 1,000.00 | $ 951.50 | $ 11.85 |
HypotheticalA | | $ 1,000.00 | $ 1,013.06 | $ 12.23 |
International Small Cap | 1.37% | | | |
Actual | | $ 1,000.00 | $ 956.80 | $ 6.76 |
HypotheticalA | | $ 1,000.00 | $ 1,018.30 | $ 6.97 |
Class I | 1.28% | | | |
Actual | | $ 1,000.00 | $ 957.20 | $ 6.31 |
HypotheticalA | | $ 1,000.00 | $ 1,018.75 | $ 6.51 |
A 5% return per year before expenses
B Annualized expense ratio reflects expenses net of applicable fee waivers.
C Expenses are equal to each Class' annualized expense ratio, multiplied by the average account value over the period, multiplied by 184/365 (to reflect the one-half year period).
Annual Report
Investment Changes (Unaudited)
Asset Allocation as of October 31, 2015 |
| % of fund's
net assets | % of fund's net assets
6 months ago |
Stocks | 94.6 | 94.6 |
Short-Term Investments and Net Other Assets (Liabilities) | 5.4 | 5.4 |
Top Ten Stocks as of October 31, 2015 |
| % of fund's
net assets | % of fund's net assets
6 months ago |
EBOS Group Ltd. (New Zealand, Health Care Providers & Services) | 1.1 | 1.2 |
Vontobel Holdings AG (Switzerland, Capital Markets) | 1.1 | 1.2 |
Frutarom Industries Ltd. (Israel, Chemicals) | 1.1 | 1.1 |
VZ Holding AG (Switzerland, Capital Markets) | 1.1 | 0.9 |
Micro Focus International PLC (United Kingdom, Software) | 1.1 | 1.0 |
United Drug PLC (United Kingdom) (Ireland, Health Care Providers & Services) | 1.0 | 1.2 |
Regus PLC (Bailiwick of Jersey, Commercial Services & Supplies) | 1.0 | 0.9 |
Hiscox Ltd. (Bermuda, Insurance) | 1.0 | 0.8 |
Amer Group PLC (A Shares) (Finland, Leisure Products) | 1.0 | 0.9 |
JSR Corp. (Japan, Chemicals) | 1.0 | 0.9 |
| 10.5 | |
Market Sectors as of October 31, 2015 |
| % of fund's
net assets | % of fund's net assets
6 months ago |
Financials | 22.6 | 21.9 |
Industrials | 18.9 | 17.9 |
Consumer Discretionary | 16.3 | 17.2 |
Information Technology | 10.0 | 9.0 |
Health Care | 8.5 | 8.8 |
Consumer Staples | 7.5 | 7.0 |
Materials | 6.9 | 7.9 |
Energy | 3.5 | 4.3 |
Utilities | 0.4 | 0.4 |
Telecommunication Services | 0.0 | 0.2 |
Annual Report
Investments October 31, 2015
Showing Percentage of Net Assets
Common Stocks - 94.4% |
| Shares | | Value |
Australia - 2.9% |
Austal Ltd. | 1,589,594 | | $ 2,562,477 |
Bradken Ltd. (a) | 1,226,491 | | 840,387 |
Challenger Ltd. | 960,083 | | 5,598,467 |
Charter Hall Group unit | 426,508 | | 1,356,865 |
GUD Holdings Ltd. | 726,825 | | 4,145,011 |
Imdex Ltd. (a) | 7,817,399 | | 1,246,756 |
Life Healthcare Group Ltd. | 1,826,612 | | 3,987,804 |
Nanosonics Ltd. (a) | 1,719,782 | | 1,953,007 |
RCG Corp. Ltd. | 2,822,812 | | 2,877,480 |
SomnoMed Ltd. (a)(d) | 584,445 | | 1,110,367 |
TOTAL AUSTRALIA | | 25,678,621 |
Austria - 1.6% |
Andritz AG | 115,532 | | 5,818,650 |
IMMOFINANZ Immobilien Anlagen AG (a) | 1,461,643 | | 3,748,214 |
RHI AG | 208,140 | | 4,708,085 |
TOTAL AUSTRIA | | 14,274,949 |
Bailiwick of Jersey - 1.4% |
Kennedy Wilson Europe Real Estate PLC | 193,806 | | 3,573,305 |
Regus PLC | 1,702,000 | | 8,779,246 |
TOTAL BAILIWICK OF JERSEY | | 12,352,551 |
Belgium - 0.9% |
Barco NV | 55,883 | | 3,672,356 |
Econocom Group SA (d) | 434,901 | | 3,888,082 |
TOTAL BELGIUM | | 7,560,438 |
Bermuda - 1.9% |
BW Offshore Ltd. | 6,094,227 | | 2,539,037 |
Hiscox Ltd. | 571,855 | | 8,529,206 |
Petra Diamonds Ltd. | 2,544,174 | | 2,927,847 |
Travelport Worldwide Ltd. | 222,200 | | 3,010,810 |
TOTAL BERMUDA | | 17,006,900 |
Brazil - 0.3% |
Banco ABC Brasil SA | 31,937 | | 69,976 |
MAHLE Metal Leve SA | 349,000 | | 2,118,497 |
TOTAL BRAZIL | | 2,188,473 |
British Virgin Islands - 0.2% |
Gem Diamonds Ltd. | 967,662 | | 1,476,830 |
Common Stocks - continued |
| Shares | | Value |
Canada - 4.0% |
AutoCanada, Inc. (d) | 132,484 | | $ 3,209,768 |
Constellation Software, Inc. | 4,766 | | 2,059,338 |
Dorel Industries, Inc. Class B (sub. vtg.) | 113,703 | | 2,891,270 |
Genesis Land Development Corp. (a) | 965,422 | | 2,178,032 |
Jean Coutu Group, Inc. Class A (sub. vtg.) | 291,013 | | 4,435,522 |
Lassonde Industries, Inc. Class A (sub. vtg.) | 31,269 | | 3,707,753 |
McCoy Global, Inc. | 1,335,870 | | 3,023,994 |
Open Text Corp. | 132,548 | | 6,143,878 |
ShawCor Ltd. Class A | 114,685 | | 2,433,855 |
Whitecap Resources, Inc. (d) | 563,453 | | 5,002,821 |
TOTAL CANADA | | 35,086,231 |
Cayman Islands - 3.7% |
AMVIG Holdings Ltd. | 14,266,000 | | 6,536,782 |
Bonjour Holdings Ltd. (d) | 44,460,800 | | 1,745,995 |
China High Precision Automation Group Ltd. (a) | 712,000 | | 1 |
China Metal Recycling (Holdings) Ltd. (a) | 436,800 | | 1 |
Greatview Aseptic Pack Co. Ltd. | 5,391,000 | | 2,530,849 |
Haitian International Holdings Ltd. | 1,491,000 | | 2,608,802 |
Lifestyle International Holdings Ltd. | 3,212,500 | | 4,645,766 |
Pico Far East Holdings Ltd. | 18,482,000 | | 4,906,092 |
SITC International Holdings Co. Ltd. | 11,482,000 | | 5,893,585 |
Value Partners Group Ltd. | 3,286,000 | | 3,479,602 |
TOTAL CAYMAN ISLANDS | | 32,347,475 |
Chile - 0.8% |
Quinenco SA | 2,409,395 | | 4,773,149 |
Vina San Pedro SA | 335,133,168 | | 2,642,103 |
TOTAL CHILE | | 7,415,252 |
Denmark - 1.0% |
Jyske Bank A/S (Reg.) (a) | 171,303 | | 8,362,651 |
Finland - 2.4% |
Amer Group PLC (A Shares) | 301,945 | | 8,473,503 |
Asiakastieto Group Oyj (a) | 181,623 | | 2,800,099 |
Cramo Oyj (B Shares) | 182,510 | | 3,351,642 |
Olvi PLC (A Shares) | 100,438 | | 2,435,349 |
Tikkurila Oyj | 230,646 | | 4,233,083 |
TOTAL FINLAND | | 21,293,676 |
France - 3.3% |
ALTEN | 108,019 | | 5,606,562 |
Common Stocks - continued |
| Shares | | Value |
France - continued |
Coface SA | 319,302 | | $ 2,585,300 |
Rexel SA | 251,900 | | 3,443,133 |
The Lisi Group | 143,009 | | 3,491,169 |
The Vicat Group (d) | 85,756 | | 5,497,782 |
Thermador Groupe SA | 26,557 | | 2,482,289 |
Wendel SA | 46,435 | | 5,573,444 |
TOTAL FRANCE | | 28,679,679 |
Germany - 3.4% |
AURELIUS AG | 103,235 | | 4,606,738 |
CompuGroup Medical AG | 199,249 | | 5,871,992 |
GEA Group AG | 72,166 | | 2,893,765 |
LEG Immobilien AG | 27,307 | | 2,178,542 |
LEONI AG | 125,097 | | 5,107,711 |
mutares AG | 113,000 | | 2,218,049 |
OSRAM Licht AG | 88,435 | | 5,203,716 |
SHW Group | 62,339 | | 1,633,230 |
TOTAL GERMANY | | 29,713,743 |
Greece - 0.4% |
Metka SA | 394,216 | | 3,784,452 |
Hong Kong - 1.9% |
Dah Sing Banking Group Ltd. | 2,745,600 | | 5,209,923 |
Far East Horizon Ltd. | 3,735,000 | | 3,106,680 |
Magnificent Estates Ltd. | 105,926,000 | | 3,000,694 |
Shun Ho Technology Holdings Ltd. (a) | 1,650,033 | | 563,312 |
Techtronic Industries Co. Ltd. | 1,264,000 | | 4,620,776 |
TOTAL HONG KONG | | 16,501,385 |
India - 0.6% |
Edelweiss Financial Services Ltd. | 3,486,519 | | 3,164,299 |
McLeod Russel India Ltd. (a) | 883,018 | | 2,317,244 |
TOTAL INDIA | | 5,481,543 |
Indonesia - 0.5% |
PT ACE Hardware Indonesia Tbk | 43,202,200 | | 2,103,157 |
PT Media Nusantara Citra Tbk | 16,013,700 | | 2,077,798 |
TOTAL INDONESIA | | 4,180,955 |
Ireland - 1.8% |
C&C Group PLC | 895,002 | | 3,572,606 |
Common Stocks - continued |
| Shares | | Value |
Ireland - continued |
Mincon Group PLC | 4,787,945 | | $ 3,474,942 |
United Drug PLC (United Kingdom) | 1,222,449 | | 8,955,274 |
TOTAL IRELAND | | 16,002,822 |
Isle of Man - 0.6% |
Optimal Payments PLC (a) | 1,050,400 | | 4,922,662 |
Israel - 1.1% |
Frutarom Industries Ltd. | 225,289 | | 9,735,555 |
Italy - 1.6% |
Banco di Desio e della Brianza SpA | 669,139 | | 2,289,868 |
Cerved Information Solutions SpA | 379,661 | | 2,880,710 |
Danieli & C. Officine Meccaniche SpA | 163,567 | | 3,500,201 |
Recordati SpA | 214,361 | | 5,329,676 |
TOTAL ITALY | | 14,000,455 |
Japan - 21.6% |
A/S One Corp. | 135,700 | | 4,816,903 |
Aeon Delight Co. Ltd. | 187,700 | | 5,407,309 |
Ain Holdings, Inc. | 97,300 | | 4,606,063 |
Arc Land Sakamoto Co. Ltd. | 180,700 | | 3,955,591 |
Broadleaf Co. Ltd. | 394,900 | | 4,523,418 |
Central Automotive Products Ltd. | 203,000 | | 1,477,932 |
Daiwa Industries Ltd. | 495,600 | | 3,278,728 |
Dexerials Corp. (d) | 292,400 | | 3,347,971 |
Fuji Corp. | 147,800 | | 2,784,103 |
Fukuda Denshi Co. Ltd. | 124,800 | | 6,089,695 |
Funai Soken Holdings, Inc. | 158,600 | | 2,433,164 |
GMO Internet, Inc. | 328,900 | | 4,658,251 |
Iida Group Holdings Co. Ltd. | 214,851 | | 4,026,924 |
JSR Corp. | 532,400 | | 8,408,353 |
KAWAI Musical Instruments Manufacturing Co. Ltd. | 203,600 | | 3,763,336 |
Kinugawa Rubber Industrial Co. Ltd. | 733,000 | | 4,088,732 |
Konica Minolta, Inc. | 228,400 | | 2,346,678 |
Kotobuki Spirits Co. Ltd. (d) | 79,100 | | 2,759,513 |
Leopalace21 Corp. (a) | 966,500 | | 5,149,440 |
Meitec Corp. | 145,700 | | 5,291,485 |
Message Co. Ltd. | 150,079 | | 3,699,108 |
Miraca Holdings, Inc. | 117,900 | | 5,247,173 |
Mitani Shoji Co. Ltd. | 244,700 | | 6,061,666 |
Monex Group, Inc. | 699,100 | | 1,965,183 |
Nihon House Holdings Co. Ltd. (d) | 1,020,700 | | 4,107,595 |
Nitori Holdings Co. Ltd. | 100,000 | | 7,797,893 |
Common Stocks - continued |
| Shares | | Value |
Japan - continued |
Paramount Bed Holdings Co. Ltd. | 195,000 | | $ 6,254,656 |
Ricoh Leasing Co. Ltd. | 232,900 | | 7,055,445 |
S Foods, Inc. (d) | 318,800 | | 5,541,613 |
San-Ai Oil Co. Ltd. | 589,000 | | 4,498,828 |
Shinsei Bank Ltd. | 2,824,000 | | 5,921,288 |
Ship Healthcare Holdings, Inc. | 202,200 | | 4,897,936 |
TKC Corp. | 336,500 | | 7,931,814 |
Toshiba Plant Systems & Services Corp. | 582,700 | | 6,241,559 |
Toyo Suisan Kaisha Ltd. | 116,900 | | 4,307,506 |
Tsuruha Holdings, Inc. | 104,800 | | 8,302,681 |
VT Holdings Co. Ltd. | 1,047,600 | | 6,478,390 |
Welcia Holdings Co. Ltd. | 77,700 | | 3,829,463 |
Yamada Consulting Group Co. Ltd. | 174,600 | | 5,110,414 |
TOTAL JAPAN | | 188,463,800 |
Korea (South) - 1.8% |
BGFretail Co. Ltd. | 17,709 | | 2,636,722 |
DGB Financial Group Co. Ltd. | 207,259 | | 1,924,158 |
Fila Korea Ltd. | 38,617 | | 3,382,205 |
Hy-Lok Corp. | 125,792 | | 3,514,512 |
Nice Information & Telecom, Inc. | 77,649 | | 2,920,925 |
NS Shopping Co. Ltd. | 7,760 | | 1,321,912 |
TOTAL KOREA (SOUTH) | | 15,700,434 |
Luxembourg - 0.8% |
Grand City Properties SA | 347,584 | | 6,941,129 |
Netherlands - 1.5% |
Amsterdam Commodities NV | 196,055 | | 4,934,898 |
BinckBank NV | 282,659 | | 2,493,446 |
IMCD Group BV | 142,000 | | 5,312,233 |
TOTAL NETHERLANDS | | 12,740,577 |
New Zealand - 2.0% |
EBOS Group Ltd. | 1,083,656 | | 10,016,335 |
Nuplex Industries Ltd. | 2,586,561 | | 7,461,346 |
TOTAL NEW ZEALAND | | 17,477,681 |
Norway - 1.9% |
ABG Sundal Collier ASA | 6,615,910 | | 4,983,296 |
Ekornes A/S | 331,597 | | 3,531,883 |
Common Stocks - continued |
| Shares | | Value |
Norway - continued |
Kongsberg Gruppen ASA | 329,633 | | $ 5,159,760 |
Spectrum ASA | 809,572 | | 2,810,766 |
TOTAL NORWAY | | 16,485,705 |
Portugal - 0.6% |
NOS SGPS SA | 624,100 | | 5,187,678 |
Romania - 0.4% |
Banca Transilvania SA (a) | 5,501,626 | | 3,458,855 |
Singapore - 2.3% |
Boustead Projects Pte Ltd. (a) | 618,906 | | 373,131 |
Boustead Singapore Ltd. | 2,099,820 | | 1,435,462 |
Hour Glass Ltd. | 7,926,700 | | 4,133,891 |
Interplex Holdings Ltd. | 6,290,400 | | 3,167,667 |
Mapletree Industrial (REIT) | 2,939,230 | | 3,197,260 |
OSIM International Ltd. | 3,306,600 | | 3,206,109 |
Wing Tai Holdings Ltd. | 3,973,100 | | 4,944,223 |
TOTAL SINGAPORE | | 20,457,743 |
South Africa - 0.8% |
Clicks Group Ltd. | 977,850 | | 7,143,626 |
Spain - 0.5% |
Hispania Activos Inmobiliarios SA (a) | 315,800 | | 4,757,592 |
Sweden - 0.9% |
AddTech AB (B Shares) | 198,619 | | 2,824,611 |
Coor Service Management Holding AB (a) | 474,600 | | 1,938,719 |
Ratos AB (B Shares) | 582,000 | | 3,406,078 |
TOTAL SWEDEN | | 8,169,408 |
Switzerland - 3.9% |
Allied World Assurance Co. Holdings AG | 214,004 | | 7,781,185 |
Daetwyler Holdings AG | 18,222 | | 2,556,924 |
Pargesa Holding SA | 75,506 | | 4,797,184 |
Vontobel Holdings AG | 199,296 | | 9,829,207 |
VZ Holding AG | 30,391 | | 9,469,804 |
TOTAL SWITZERLAND | | 34,434,304 |
Taiwan - 2.0% |
King's Town Bank | 3,141,000 | | 2,505,834 |
Sunspring Metal Corp. | 3,075,000 | | 4,418,566 |
Tripod Technology Corp. | 2,498,000 | | 3,862,609 |
Common Stocks - continued |
| Shares | | Value |
Taiwan - continued |
Vanguard International Semiconductor Corp. | 3,124,000 | | $ 4,036,710 |
Yung Chi Paint & Varnish Manufacturing Co. Ltd. | 1,109,000 | | 2,281,879 |
TOTAL TAIWAN | | 17,105,598 |
Thailand - 1.0% |
Delta Electronics PCL (For. Reg.) | 2,473,600 | | 5,877,746 |
TISCO Financial Group PCL | 2,495,800 | | 2,649,779 |
TOTAL THAILAND | | 8,527,525 |
Turkey - 0.4% |
Aygaz A/S | 864,000 | | 3,245,112 |
United Kingdom - 14.5% |
Aberdeen Asset Management PLC | 715,349 | | 3,823,345 |
AEW UK REIT PLC (a) | 2,258,268 | | 3,516,159 |
Alliance Pharma PLC | 1,734,982 | | 1,430,937 |
Amec Foster Wheeler PLC | 453,315 | | 4,968,684 |
Ashmore Group PLC (d) | 1,036,507 | | 4,314,274 |
BBA Aviation PLC | 2,224,598 | | 6,539,943 |
Bond International Software PLC | 899,666 | | 1,407,729 |
Brammer PLC (d) | 584,028 | | 2,073,027 |
Brewin Dolphin Holding PLC | 881,475 | | 3,668,981 |
Cineworld Group PLC | 695,276 | | 5,916,543 |
Close Brothers Group PLC | 290,880 | | 6,564,878 |
Countrywide PLC | 1,008,607 | | 7,230,139 |
Diploma PLC | 363,251 | | 3,592,321 |
Elementis PLC | 1,017,200 | | 3,678,799 |
Empiric Student Property PLC | 1,607,263 | | 2,713,144 |
Exova Group Ltd. PLC | 887,869 | | 2,035,999 |
Informa PLC | 842,548 | | 7,377,593 |
ITE Group PLC | 1,632,554 | | 3,529,735 |
James Fisher and Sons PLC | 120,505 | | 1,782,468 |
Luxfer Holdings PLC sponsored ADR | 428,009 | | 4,635,337 |
McColl's Retail Group PLC | 1,571,774 | | 3,561,879 |
Mears Group PLC | 1,047,710 | | 6,686,720 |
Meggitt PLC | 519,830 | | 2,833,644 |
Melrose PLC | 796,270 | | 3,267,684 |
Micro Focus International PLC | 476,044 | | 9,217,400 |
Moneysupermarket.com Group PLC | 778,475 | | 4,010,724 |
Sinclair Pharma PLC (a) | 6,551,214 | | 3,963,995 |
Spectris PLC | 189,347 | | 4,865,929 |
Ultra Electronics Holdings PLC | 278,425 | | 7,223,772 |
TOTAL UNITED KINGDOM | | 126,431,782 |
Common Stocks - continued |
| Shares | | Value |
United States of America - 1.2% |
Dillard's, Inc. Class A (d) | 89,894 | | $ 8,043,715 |
Hornbeck Offshore Services, Inc. (a)(d) | 152,170 | | 2,055,817 |
YOU On Demand Holdings, Inc. warrants 8/30/17 (a)(e) | 27,500 | | 3,207 |
TOTAL UNITED STATES OF AMERICA | | 10,102,739 |
TOTAL COMMON STOCKS (Cost $824,215,309) |
824,878,586
|
Nonconvertible Preferred Stocks - 0.2% |
| | | |
Brazil - 0.2% |
Banco ABC Brasil SA
(Cost $3,684,071) | 998,200 | |
2,200,075
|
Money Market Funds - 6.7% |
| | | |
Fidelity Cash Central Fund, 0.18% (b) | 45,030,641 | | 45,030,641 |
Fidelity Securities Lending Cash Central Fund, 0.19% (b)(c) | 13,666,537 | | 13,666,537 |
TOTAL MONEY MARKET FUNDS (Cost $58,697,178) |
58,697,178
|
TOTAL INVESTMENT PORTFOLIO - 101.3% (Cost $886,596,558) | | 885,775,839 |
NET OTHER ASSETS (LIABILITIES) - (1.3)% | | (11,784,036) |
NET ASSETS - 100% | $ 873,991,803 |
Legend |
(a) Non-income producing |
(b) Affiliated fund that is generally available only to investment companies and other accounts managed by Fidelity Investments. The rate quoted is the annualized seven-day yield of the fund at period end. A complete unaudited listing of the fund's holdings as of its most recent quarter end is available upon request. In addition, each Fidelity Central Fund's financial statements, which are not covered by the Fund's Report of Independent Registered Public Accounting Firm, are available on the SEC's website or upon request. |
(c) Investment made with cash collateral received from securities on loan. |
(d) Security or a portion of the security is on loan at period end. |
(e) Restricted securities - Investment in securities not registered under the Securities Act of 1933 (excluding 144A issues). At the end of the period, the value of restricted securities (excluding 144A issues) amounted to $3,207 or 0.0% of net assets. |
Additional information on each restricted holding is as follows: |
Security | Acquisition Date | Acquisition Cost |
YOU On Demand Holdings, Inc. warrants 8/30/17 | 9/14/12 | $ 0 |
Affiliated Central Funds |
Information regarding fiscal year to date income earned by the Fund from investments in Fidelity Central Funds is as follows: |
Fund | Income earned |
Fidelity Cash Central Fund | $ 61,602 |
Fidelity Securities Lending Cash Central Fund | 186,310 |
Total | $ 247,912 |
Other Information |
Categorizations in the Schedule of Investments are based on country or territory of incorporation. |
The following is a summary of the inputs used, as of October 31, 2015, involving the Fund's assets and liabilities carried at fair value. The inputs or methodology used for valuing securities may not be an indication of the risk associated with investing in those securities. For more information on valuation inputs, and their aggregation into the levels used in the table below, please refer to the Investment Valuation section in the accompanying Notes to Financial Statements. |
Valuation Inputs at Reporting Date: |
Description | Total | Level 1 | Level 2 | Level 3 |
Investments in Securities: | | | | |
Equities: | | | | |
Consumer Discretionary | $ 141,245,837 | $ 64,736,053 | $ 76,509,784 | $ - |
Consumer Staples | 66,734,541 | 35,070,458 | 31,664,083 | - |
Energy | 30,551,732 | 24,617,442 | 5,934,290 | - |
Financials | 197,971,252 | 145,172,798 | 52,798,454 | - |
Health Care | 73,624,858 | 35,568,209 | 38,056,649 | - |
Industrials | 167,680,599 | 118,410,225 | 49,270,374 | - |
Information Technology | 85,300,783 | 56,614,904 | 28,685,878 | 1 |
Materials | 60,723,947 | 42,001,206 | 18,722,740 | 1 |
Utilities | 3,245,112 | 3,245,112 | - | - |
Money Market Funds | 58,697,178 | 58,697,178 | - | - |
Total Investments in Securities: | $ 885,775,839 | $ 584,133,585 | $ 301,642,252 | $ 2 |
See accompanying notes which are an integral part of the financial statements.
Annual Report
Statement of Assets and Liabilities
| | October 31, 2015 |
| | |
Assets | | |
Investment in securities, at value (including securities loaned of $13,124,402) - See accompanying schedule: Unaffiliated issuers (cost $827,899,380) | $ 827,078,661 | |
Fidelity Central Funds (cost $58,697,178) | 58,697,178 | |
Total Investments (cost $886,596,558) | | $ 885,775,839 |
Foreign currency held at value (cost $115,306) | | 115,322 |
Receivable for investments sold | | 948,925 |
Receivable for fund shares sold | | 837,702 |
Dividends receivable | | 2,340,869 |
Distributions receivable from Fidelity Central Funds | | 31,829 |
Prepaid expenses | | 2,402 |
Other receivables | | 19,677 |
Total assets | | 890,072,565 |
| | |
Liabilities | | |
Payable for investments purchased | $ 376,272 | |
Payable for fund shares redeemed | 907,673 | |
Accrued management fee | 738,433 | |
Distribution and service plan fees payable | 20,677 | |
Other affiliated payables | 222,027 | |
Other payables and accrued expenses | 149,143 | |
Collateral on securities loaned, at value | 13,666,537 | |
Total liabilities | | 16,080,762 |
| | |
Net Assets | | $ 873,991,803 |
Net Assets consist of: | | |
Paid in capital | | $ 847,993,485 |
Undistributed net investment income | | 10,946,744 |
Accumulated undistributed net realized gain (loss) on investments and foreign currency transactions | | 15,943,085 |
Net unrealized appreciation (depreciation) on investments and assets and liabilities in foreign currencies | | (891,511) |
Net Assets | | $ 873,991,803 |
See accompanying notes which are an integral part of the financial statements.
Annual Report
Financial Statements - continued
Statement of Assets and Liabilities - continued
| | October 31, 2015 |
| | |
Calculation of Maximum Offering Price | | |
Class A: | | |
Net Asset Value and redemption price per share ($28,237,702 ÷ 1,244,283 shares) | | $ 22.69 |
| | |
Maximum offering price per share (100/94.25 of $22.69) | | $ 24.07 |
Class T: | | |
Net Asset Value and redemption price per share ($12,400,336 ÷ 549,894 shares) | | $ 22.55 |
| | |
Maximum offering price per share (100/96.50 of $22.55) | | $ 23.37 |
Class B: | | |
Net Asset Value and offering price per share ($390,361 ÷ 17,567 shares)A | | $ 22.22 |
| | |
Class C: | | |
Net Asset Value and offering price per share ($11,358,829 ÷ 517,141 shares)A | | $ 21.96 |
| | |
International Small Cap: | | |
Net Asset Value, offering price and redemption price per share ($811,534,198 ÷ 35,197,499 shares) | | $ 23.06 |
| | |
Class I: | | |
Net Asset Value, offering price and redemption price per share ($10,070,377 ÷ 433,304 shares) | | $ 23.24 |
A Redemption price per share is equal to net asset value less any applicable contingent deferred sales charge.
See accompanying notes which are an integral part of the financial statements.
Annual Report
Statement of Operations
| Year ended October 31, 2015 |
| | |
Investment Income | | |
Dividends | | $ 24,896,176 |
Interest | | 1,298 |
Income from Fidelity Central Funds | | 247,912 |
Income before foreign taxes withheld | | 25,145,386 |
Less foreign taxes withheld | | (1,896,045) |
Total income | | 23,249,341 |
| | |
Expenses | | |
Management fee | | |
Basic fee | $ 7,137,575 | |
Performance adjustment | 971,956 | |
Transfer agent fees | 2,147,993 | |
Distribution and service plan fees | 233,938 | |
Accounting and security lending fees | 403,900 | |
Custodian fees and expenses | 150,183 | |
Independent trustees' compensation | 3,595 | |
Registration fees | 91,083 | |
Audit | 156,053 | |
Legal | 2,634 | |
Miscellaneous | 8,119 | |
Total expenses before reductions | 11,307,029 | |
Expense reductions | (56,111) | 11,250,918 |
Net investment income (loss) | | 11,998,423 |
Realized and Unrealized Gain (Loss) | | |
Net realized gain (loss) on: | | |
Investment securities: | | |
Unaffiliated issuers (net of foreign taxes of $109,783) | 26,169,495 | |
Foreign currency transactions | (331,089) | |
Total net realized gain (loss) | | 25,838,406 |
Change in net unrealized appreciation (depreciation) on: Investment securities (net of decrease in deferred foreign taxes of $51,983) | 6,843,800 | |
Assets and liabilities in foreign currencies | (19,076) | |
Total change in net unrealized appreciation (depreciation) | | 6,824,724 |
Net gain (loss) | | 32,663,130 |
Net increase (decrease) in net assets resulting from operations | | $ 44,661,553 |
See accompanying notes which are an integral part of the financial statements.
Annual Report
Financial Statements - continued
Statement of Changes in Net Assets
| Year ended
October 31,
2015 | Year ended
October 31,
2014 |
Increase (Decrease) in Net Assets | | |
Operations | | |
Net investment income (loss) | $ 11,998,423 | $ 10,368,645 |
Net realized gain (loss) | 25,838,406 | 226,736,010 |
Change in net unrealized appreciation (depreciation) | 6,824,724 | (253,669,311) |
Net increase (decrease) in net assets resulting from operations | 44,661,553 | (16,564,656) |
Distributions to shareholders from net investment income | (7,662,528) | (4,012,676) |
Distributions to shareholders from net realized gain | (116,906,834) | (26,257,450) |
Total distributions | (124,569,362) | (30,270,126) |
Share transactions - net increase (decrease) | 53,722,708 | (201,807,331) |
Redemption fees | 103,111 | 276,780 |
Total increase (decrease) in net assets | (26,081,990) | (248,365,333) |
| | |
Net Assets | | |
Beginning of period | 900,073,793 | 1,148,439,126 |
End of period (including undistributed net investment income of $10,946,744 and undistributed net investment income of $7,150,729, respectively) | $ 873,991,803 | $ 900,073,793 |
See accompanying notes which are an integral part of the financial statements.
Annual Report
Financial Highlights - Fidelity International Small Cap Fund Class A
Years ended October 31, | 2015 | 2014 | 2013 | 2012 | 2011 |
Selected Per-Share Data | | | | | |
Net asset value, beginning of period | $ 24.98 | $ 26.34 | $ 19.74 | $ 18.97 | $ 20.42 |
Income from Investment Operations | | | | | |
Net investment income (loss)C | .27 | .17 | .06 | .06 | .10 |
Net realized and unrealized gain (loss) | 1.05 | (.89) | 6.94 | 1.09 | (.88) |
Total from investment operations | 1.32 | (.72) | 7.00 | 1.15 | (.78) |
Distributions from net investment income | (.16) | (.05) | (.07) | (.11) | (.02) |
Distributions from net realized gain | (3.45) | (.60) | (.33) | (.27) | (.66) |
Total distributions | (3.61) | (.65) | (.40) | (.38) | (.68) |
Redemption fees added to paid in capitalC | - G | .01 | - G | - G | .01 |
Net asset value, end of period | $ 22.69 | $ 24.98 | $ 26.34 | $ 19.74 | $ 18.97 |
Total ReturnA, B | 6.21% | (2.79)% | 36.18% | 6.28% | (4.00)% |
Ratios to Average Net AssetsE, F | | | | | |
Expenses before reductions | 1.59% | 1.50% | 1.61% | 1.63% | 1.56% |
Expenses net of fee waivers, if any | 1.58% | 1.50% | 1.61% | 1.63% | 1.55% |
Expenses net of all reductions | 1.58% | 1.50% | 1.60% | 1.60% | 1.54% |
Net investment income (loss) | 1.18% | .65% | .25% | .32% | .49% |
Supplemental Data | | | | | |
Net assets, end of period (000 omitted) | $ 28,238 | $ 24,572 | $ 24,020 | $ 14,125 | $ 17,185 |
Portfolio turnover rateD | 36% | 102% | 54% | 68% | 47% |
A Total returns would have been lower if certain expenses had not been reduced during the applicable periods shown.
B Total returns do not include the effect of the sales charges.
C Calculated based on average shares outstanding during the period.
D Amounts do not include the activity of the Underlying Funds.
E Fees and expenses of any underlying Fidelity Central Funds are not included in the Fund's expense ratio. The Fund indirectly bears its proportionate share of the expenses of any underlying Fidelity Central Funds.
F Expense ratios reflect operating expenses of the class. Expenses before reductions do not reflect amounts reimbursed by the investment adviser or reductions from brokerage service arrangements or reductions from other expense offset arrangements and do not represent the amount paid by the class during periods when reimbursements or reductions occur. Expenses net of fee waivers reflect expenses after reimbursement by the investment adviser but prior to reductions from brokerage service arrangements or other expense offset arrangements. Expenses net of all reductions represent the net expenses paid by the class.
G Amount represents less than $.005 per share.
See accompanying notes which are an integral part of the financial statements.
Annual Report
Financial Highlights - Fidelity International Small Cap Fund Class T
Years ended October 31, | 2015 | 2014 | 2013 | 2012 | 2011 |
Selected Per-Share Data | | | | | |
Net asset value, beginning of period | $ 24.81 | $ 26.17 | $ 19.59 | $ 18.80 | $ 20.23 |
Income from Investment Operations | | | | | |
Net investment income (loss)C | .21 | .10 | - G | .01 | .05 |
Net realized and unrealized gain (loss) | 1.04 | (.87) | 6.90 | 1.08 | (.86) |
Total from investment operations | 1.25 | (.77) | 6.90 | 1.09 | (.81) |
Distributions from net investment income | (.06) | - | - | (.03) | - |
Distributions from net realized gain | (3.45) | (.60) | (.32) | (.27) | (.63) |
Total distributions | (3.51) | (.60) | (.32) | (.30) | (.63) |
Redemption fees added to paid in capitalC | - G | .01 | - G | - G | .01 |
Net asset value, end of period | $ 22.55 | $ 24.81 | $ 26.17 | $ 19.59 | $ 18.80 |
Total ReturnA, B | 5.90% | (3.00)% | 35.80% | 5.97% | (4.18)% |
Ratios to Average Net AssetsE, F | | | | | |
Expenses before reductions | 1.87% | 1.77% | 1.87% | 1.88% | 1.82% |
Expenses net of fee waivers, if any | 1.86% | 1.77% | 1.87% | 1.88% | 1.81% |
Expenses net of all reductions | 1.86% | 1.76% | 1.85% | 1.85% | 1.79% |
Net investment income (loss) | .90% | .38% | (.01)% | .07% | .24% |
Supplemental Data | | | | | |
Net assets, end of period (000 omitted) | $ 12,400 | $ 12,296 | $ 13,530 | $ 9,262 | $ 13,744 |
Portfolio turnover rateD | 36% | 102% | 54% | 68% | 47% |
A Total returns would have been lower if certain expenses had not been reduced during the applicable periods shown.
B Total returns do not include the effect of the sales charges.
C Calculated based on average shares outstanding during the period.
D Amounts do not include the activity of the Underlying Funds.
E Fees and expenses of any underlying Fidelity Central Funds are not included in the Fund's expense ratio. The Fund indirectly bears its proportionate share of the expenses of any underlying Fidelity Central Funds.
F Expense ratios reflect operating expenses of the class. Expenses before reductions do not reflect amounts reimbursed by the investment adviser or reductions from brokerage service arrangements or reductions from other expense offset arrangements and do not represent the amount paid by the class during periods when reimbursements or reductions occur. Expenses net of fee waivers reflect expenses after reimbursement by the investment adviser but prior to reductions from brokerage service arrangements or other expense offset arrangements. Expenses net of all reductions represent the net expenses paid by the class.
G Amount represents less than $.005 per share.
See accompanying notes which are an integral part of the financial statements.
Annual Report
Financial Highlights - Fidelity International Small Cap Fund Class B
Years ended October 31, | 2015 | 2014 | 2013 | 2012 | 2011 |
Selected Per-Share Data | | | | | |
Net asset value, beginning of period | $ 24.51 | $ 25.87 | $ 19.22 | $ 18.38 | $ 19.79 |
Income from Investment Operations | | | | | |
Net investment income (loss)C | .09 | (.03) | (.11) | (.08) | (.05) |
Net realized and unrealized gain (loss) | 1.04 | (.87) | 6.84 | 1.07 | (.85) |
Total from investment operations | 1.13 | (.90) | 6.73 | .99 | (.90) |
Distributions from net realized gain | (3.42) | (.47) | (.08) | (.15) | (.52) |
Redemption fees added to paid in capitalC | - G | .01 | - G | - G | .01 |
Net asset value, end of period | $ 22.22 | $ 24.51 | $ 25.87 | $ 19.22 | $ 18.38 |
Total ReturnA, B | 5.40% | (3.52)% | 35.14% | 5.45% | (4.68)% |
Ratios to Average Net AssetsE, F | | | | | |
Expenses before reductions | 2.36% | 2.28% | 2.37% | 2.38% | 2.32% |
Expenses net of fee waivers, if any | 2.36% | 2.28% | 2.36% | 2.38% | 2.30% |
Expenses net of all reductions | 2.36% | 2.27% | 2.35% | 2.35% | 2.29% |
Net investment income (loss) | .41% | (.13)% | (.51)% | (.43)% | (.26)% |
Supplemental Data | | | | | |
Net assets, end of period (000 omitted) | $ 390 | $ 507 | $ 795 | $ 790 | $ 2,067 |
Portfolio turnover rateD | 36% | 102% | 54% | 68% | 47% |
A Total returns would have been lower if certain expenses had not been reduced during the applicable periods shown.
B Total returns do not include the effect of the contingent deferred sales charge.
C Calculated based on average shares outstanding during the period.
D Amounts do not include the activity of the Underlying Funds.
E Fees and expenses of any underlying Fidelity Central Funds are not included in the Fund's expense ratio. The Fund indirectly bears its proportionate share of the expenses of any underlying Fidelity Central Funds.
F Expense ratios reflect operating expenses of the class. Expenses before reductions do not reflect amounts reimbursed by the investment adviser or reductions from brokerage service arrangements or reductions from other expense offset arrangements and do not represent the amount paid by the class during periods when reimbursements or reductions occur. Expenses net of fee waivers reflect expenses after reimbursement by the investment adviser but prior to reductions from brokerage service arrangements or other expense offset arrangements. Expenses net of all reductions represent the net expenses paid by the class.
G Amount represents less than $.005 per share.
See accompanying notes which are an integral part of the financial statements.
Annual Report
Financial Highlights - Fidelity International Small Cap Fund Class C
Years ended October 31, | 2015 | 2014 | 2013 | 2012 | 2011 |
Selected Per-Share Data | | | | | |
Net asset value, beginning of period | $ 24.27 | $ 25.68 | $ 19.18 | $ 18.38 | $ 19.85 |
Income from Investment Operations | | | | | |
Net investment income (loss)C | .09 | (.02) | (.11) | (.08) | (.04) |
Net realized and unrealized gain (loss) | 1.02 | (.85) | 6.79 | 1.07 | (.85) |
Total from investment operations | 1.11 | (.87) | 6.68 | .99 | (.89) |
Distributions from net realized gain | (3.42) | (.55) | (.18) | (.19) | (.59) |
Redemption fees added to paid in capitalC | - G | .01 | - G | - G | .01 |
Net asset value, end of period | $ 21.96 | $ 24.27 | $ 25.68 | $ 19.18 | $ 18.38 |
Total ReturnA, B | 5.37% | (3.43)% | 35.15% | 5.46% | (4.64)% |
Ratios to Average Net AssetsE, F | | | | | |
Expenses before reductions | 2.36% | 2.23% | 2.33% | 2.38% | 2.27% |
Expenses net of fee waivers, if any | 2.35% | 2.22% | 2.33% | 2.38% | 2.26% |
Expenses net of all reductions | 2.35% | 2.22% | 2.32% | 2.35% | 2.24% |
Net investment income (loss) | .41% | (.07)% | (.47)% | (.43)% | (.21)% |
Supplemental Data | | | | | |
Net assets, end of period (000 omitted) | $ 11,359 | $ 12,576 | $ 13,426 | $ 6,799 | $ 9,545 |
Portfolio turnover rateD | 36% | 102% | 54% | 68% | 47% |
A Total returns would have been lower if certain expenses had not been reduced during the applicable periods shown.
B Total returns do not include the effect of the contingent deferred sales charge.
C Calculated based on average shares outstanding during the period.
D Amounts do not include the activity of the Underlying Funds.
E Fees and expenses of any underlying Fidelity Central Funds are not included in the Fund's expense ratio. The Fund indirectly bears its proportionate share of the expenses of any underlying Fidelity Central Funds.
F Expense ratios reflect operating expenses of the class. Expenses before reductions do not reflect amounts reimbursed by the investment adviser or reductions from brokerage service arrangements or reductions from other expense offset arrangements and do not represent the amount paid by the class during periods when reimbursements or reductions occur. Expenses net of fee waivers reflect expenses after reimbursement by the investment adviser but prior to reductions from brokerage service arrangements or other expense offset arrangements. Expenses net of all reductions represent the net expenses paid by the class.
G Amount represents less than $.005 per share.
See accompanying notes which are an integral part of the financial statements.
Annual Report
Financial Highlights - Fidelity International Small Cap Fund
Years ended October 31, | 2015 | 2014 | 2013 | 2012 | 2011 |
Selected Per-Share Data | | | | | |
Net asset value, beginning of period | $ 25.34 | $ 26.67 | $ 19.99 | $ 19.23 | $ 20.66 |
Income from Investment Operations | | | | | |
Net investment income (loss)B | .34 | .25 | .12 | .11 | .17 |
Net realized and unrealized gain (loss) | 1.07 | (.90) | 7.02 | 1.10 | (.89) |
Total from investment operations | 1.41 | (.65) | 7.14 | 1.21 | (.72) |
Distributions from net investment income | (.24) | (.09) | (.14) | (.18) | (.06) |
Distributions from net realized gain | (3.45) | (.60) | (.33) | (.27) | (.66) |
Total distributions | (3.69) | (.69) | (.46) G | (.45) | (.72) |
Redemption fees added to paid in capitalB | - F | .01 | - F | - F | .01 |
Net asset value, end of period | $ 23.06 | $ 25.34 | $ 26.67 | $ 19.99 | $ 19.23 |
Total ReturnA | 6.53% | (2.48)% | 36.56% | 6.55% | (3.65)% |
Ratios to Average Net AssetsD, E | | | | | |
Expenses before reductions | 1.31% | 1.21% | 1.33% | 1.35% | 1.26% |
Expenses net of fee waivers, if any | 1.31% | 1.20% | 1.32% | 1.35% | 1.25% |
Expenses net of all reductions | 1.31% | 1.20% | 1.31% | 1.33% | 1.23% |
Net investment income (loss) | 1.45% | .95% | .53% | .59% | .80% |
Supplemental Data | | | | | |
Net assets, end of period (000 omitted) | $ 811,534 | $ 842,031 | $ 1,029,629 | $ 692,769 | $ 856,692 |
Portfolio turnover rateC | 36% | 102% | 54% | 68% | 47% |
A Total returns would have been lower if certain expenses had not been reduced during the applicable periods shown.
B Calculated based on average shares outstanding during the period.
C Amounts do not include the activity of the Underlying Funds.
D Fees and expenses of any underlying Fidelity Central Funds are not included in the Fund's expense ratio. The Fund indirectly bears its proportionate share of the expenses of any underlying Fidelity Central Funds.
E Expense ratios reflect operating expenses of the class. Expenses before reductions do not reflect amounts reimbursed by the investment adviser or reductions from brokerage service arrangements or reductions from other expense offset arrangements and do not represent the amount paid by the class during periods when reimbursements or reductions occur. Expenses net of fee waivers reflect expenses after reimbursement by the investment adviser but prior to reductions from brokerage service arrangements or other expense offset arrangements. Expenses net of all reductions represent the net expenses paid by the class.
F Amount represents less than $.005 per share.
G Total distributions of $.46 per share is comprised of distributions from net investment income of $.136 and distributions from net realized gain of $.327 per share.
See accompanying notes which are an integral part of the financial statements.
Annual Report
Financial Highlights - Fidelity International Small Cap Fund Class I
Years ended October 31, | 2015 | 2014 | 2013 | 2012 | 2011 |
Selected Per-Share Data | | | | | |
Net asset value, beginning of period | $ 25.34 | $ 26.67 | $ 20.00 | $ 19.24 | $ 20.66 |
Income from Investment Operations | | | | | |
Net investment income (loss)B | .36 | .29 | .16 | .13 | .18 |
Net realized and unrealized gain (loss) | 1.07 | (.90) | 7.00 | 1.10 | (.89) |
Total from investment operations | 1.43 | (.61) | 7.16 | 1.23 | (.71) |
Distributions from net investment income | (.08) | (.13) | (.16) | (.20) | (.06) |
Distributions from net realized gain | (3.45) | (.60) | (.33) | (.27) | (.66) |
Total distributions | (3.53) | (.73) | (.49) | (.47) | (.72) |
Redemption fees added to paid in capitalB | - F | .01 | - F | - F | .01 |
Net asset value, end of period | $ 23.24 | $ 25.34 | $ 26.67 | $ 20.00 | $ 19.24 |
Total ReturnA | 6.60% | (2.35)% | 36.68% | 6.65% | (3.62)% |
Ratios to Average Net AssetsD, E | | | | | |
Expenses before reductions | 1.24% | 1.08% | 1.20% | 1.25% | 1.22% |
Expenses net of fee waivers, if any | 1.23% | 1.08% | 1.20% | 1.25% | 1.21% |
Expenses net of all reductions | 1.23% | 1.08% | 1.18% | 1.22% | 1.19% |
Net investment income (loss) | 1.53% | 1.07% | .66% | .70% | .84% |
Supplemental Data | | | | | |
Net assets, end of period (000 omitted) | $ 10,070 | $ 8,092 | $ 67,038 | $ 9,503 | $ 15,752 |
Portfolio turnover rateC | 36% | 102% | 54% | 68% | 47% |
A Total returns would have been lower if certain expenses had not been reduced during the applicable periods shown.
B Calculated based on average shares outstanding during the period.
C Amounts do not include the activity of the Underlying Funds.
D Fees and expenses of any underlying Fidelity Central Funds are not included in the Fund's expense ratio. The Fund indirectly bears its proportionate share of the expenses of any underlying Fidelity Central Funds.
E Expense ratios reflect operating expenses of the class. Expenses before reductions do not reflect amounts reimbursed by the investment adviser or reductions from brokerage service arrangements or reductions from other expense offset arrangements and do not represent the amount paid by the class during periods when reimbursements or reductions occur. Expenses net of fee waivers reflect expenses after reimbursement by the investment adviser but prior to reductions from brokerage service arrangements or other expense offset arrangements. Expenses net of all reductions represent the net expenses paid by the class.
F Amount represents less than $.005 per share.
See accompanying notes which are an integral part of the financial statements.
Annual Report
For the period ended October 31, 2015
1. Organization.
Fidelity International Small Cap Fund (the Fund) is a fund of Fidelity Investment Trust (the Trust) and is authorized to issue an unlimited number of shares. The Trust is registered under the Investment Company Act of 1940, as amended (the 1940 Act), as an open-end management investment company organized as a Massachusetts business trust. The Fund offers Class A, Class T, Class C, International Small Cap and Class I (formerly Institutional Class) shares, each of which, along with Class B shares, has equal rights as to assets and voting privileges. Class B shares are closed to new accounts and additional purchases, except for exchanges and reinvestments. Each class has exclusive voting rights with respect to matters that affect that class. Class B shares will automatically convert to Class A shares after a holding period of seven years from the initial date of purchase. The Fund's investments in emerging markets can be subject to social, economic, regulatory, and political uncertainties and can be extremely volatile.
2. Investments in Fidelity Central Funds.
The Fund invests in Fidelity Central Funds, which are open-end investment companies generally available only to other investment companies and accounts managed by the investment adviser and its affiliates. The Fund's Schedule of Investments lists each of the Fidelity Central Funds held as of period end, if any, as an investment of the Fund, but does not include the underlying holdings of each Fidelity Central Fund. As an Investing Fund, the Fund indirectly bears its proportionate share of the expenses of the underlying Fidelity Central Funds.
The Money Market Central Funds seek preservation of capital and current income and are managed by Fidelity Investments Money Management, Inc. (FIMM), an affiliate of the investment adviser. Annualized expenses of the Money Market Central Funds as of their most recent shareholder report date are less than .005%.
A complete unaudited list of holdings for each Fidelity Central Fund is available upon request or at the Securities and Exchange Commission (the SEC) website at www.sec.gov. In addition, the financial statements of the Fidelity Central Funds, which are not covered by the Fund's Report of Independent Registered Public Accounting Firm, are available on the SEC website or upon request.
3. Significant Accounting Policies.
The financial statements have been prepared in conformity with accounting principles generally accepted in the United States of America (GAAP), which require management to make certain estimates and assumptions at the date of the financial statements. Actual results could differ from those estimates. Subsequent events, if any, through the date that the financial statements were issued have been evaluated in the preparation of
Annual Report
Notes to Financial Statements - continued
3. Significant Accounting Policies - continued
the financial statements. The following summarizes the significant accounting policies of the Fund:
Investment Valuation. Investments are valued as of 4:00 p.m. Eastern time on the last calendar day of the period. The Board of Trustees (the Board) has delegated the day to day responsibility for the valuation of the Fund's investments to the Fidelity Management & Research Company (FMR) Fair Value Committee (the Committee). In accordance with valuation policies and procedures approved by the Board, the Fund attempts to obtain prices from one or more third party pricing vendors or brokers to value its investments. When current market prices, quotations or currency exchange rates are not readily available or reliable, investments will be fair valued in good faith by the Committee, in accordance with procedures adopted by the Board. Factors used in determining fair value vary by investment type and may include market or investment specific events. The frequency with which these procedures are used cannot be predicted and they may be utilized to a significant extent. The Committee oversees the Fund's valuation policies and procedures and reports to the Board on the Committee's activities and fair value determinations. The Board monitors the appropriateness of the procedures used in valuing the Fund's investments and ratifies the fair value determinations of the Committee.
The Fund categorizes the inputs to valuation techniques used to value its investments into a disclosure hierarchy consisting of three levels as shown below:
Level 1 - quoted prices in active markets for identical investments
Level 2 - other significant observable inputs (including quoted prices for similar investments, interest rates, prepayment speeds, etc.)
Level 3 - unobservable inputs (including the Fund's own assumptions based on the best information available)
Valuation techniques used to value the Fund's investments by major category are as follows:
Equity securities, including restricted securities, for which market quotations are readily available, are valued at the last reported sale price or official closing price as reported by a third party pricing vendor on the primary market or exchange on which they are traded and are categorized as Level 1 in the hierarchy. In the event there were no sales during the day or closing prices are not available, securities are valued at the last quoted bid price or may be valued using the last available price and are generally categorized as Level 2 in the hierarchy. For foreign equity securities, when market or security specific events arise, comparisons to the valuation of American Depositary Receipts (ADRs), futures contracts, Exchange-Traded Funds (ETFs) and certain indexes as well as quoted
Annual Report
3. Significant Accounting Policies - continued
Investment Valuation - continued
prices for similar securities may be used and would be categorized as Level 2 in the hierarchy. Utilizing these techniques may result in transfers between Level 1 and Level 2. For equity securities, including restricted securities, where observable inputs are limited, assumptions about market activity and risk are used and these securities may be categorized as Level 3 in the hierarchy.
Investments in open-end mutual funds, including the Fidelity Central Funds, are valued at their closing net asset value (NAV) each business day and are categorized as Level 1 in the hierarchy.
Changes in valuation techniques may result in transfers in or out of an assigned level within the disclosure hierarchy. The aggregate value of investments by input level as of October 31, 2015 is included at the end of the Fund's Schedule of Investments.
Foreign Currency. The Fund may use foreign currency contracts to facilitate transactions in foreign-denominated securities. Gains and losses from these transactions may arise from changes in the value of the foreign currency or if the counterparties do not perform under the contracts' terms.
Foreign-denominated assets, including investment securities, and liabilities are translated into U.S. dollars at the exchange rates at period end. Purchases and sales of investment securities, income and dividends received and expenses denominated in foreign currencies are translated into U.S. dollars at the exchange rate in effect on the transaction date.
The effects of exchange rate fluctuations on investments are included with the net realized and unrealized gain (loss) on investment securities. Other foreign currency transactions resulting in realized and unrealized gain (loss) are disclosed separately.
Investment Transactions and Income. For financial reporting purposes, the Fund's investment holdings and NAV include trades executed through the end of the last business day of the period. The NAV per share for processing shareholder transactions is calculated as of the close of business of the New York Stock Exchange (NYSE), normally 4:00 p.m. Eastern time and includes trades executed through the end of the prior business day. Gains and losses on securities sold are determined on the basis of identified cost and may include proceeds received from litigation. Dividend income is recorded on the ex-dividend date, except for certain dividends from foreign securities where the ex-dividend date may have passed, which are recorded as soon as the Fund is informed of the ex-dividend date. Non-cash dividends included in dividend income, if any, are recorded at the fair market value of the securities received. Income and capital gain distributions from Fidelity Central Funds, if any, are recorded on the ex-dividend date.
Annual Report
Notes to Financial Statements - continued
3. Significant Accounting Policies - continued
Investment Transactions and Income - continued
Distributions received on securities that represent a return of capital or capital gain are recorded as a reduction of cost of investments and/or as a realized gain. Subsequent to ex-dividend date the Fund determines the components of these distributions, based upon receipt of tax filings or other correspondence relating to the underlying investment. Interest income is accrued as earned and includes coupon interest and amortization of premium and accretion of discount on debt securities as applicable. Investment income is recorded net of foreign taxes withheld where recovery of such taxes is uncertain.
Class Allocations and Expenses. Investment income, realized and unrealized capital gains and losses, common expenses of the Fund, and certain fund-level expense reductions, if any, are allocated daily on a pro-rata basis to each class based on the relative net assets of each class to the total net assets of the Fund. Each class differs with respect to transfer agent and distribution and service plan fees incurred. Certain expense reductions may also differ by class. For the reporting period, the allocated portion of income and expenses to each class as a percent of its average net assets may vary due to the timing of recording these transactions in relation to fluctuating net assets of the classes. Expenses directly attributable to a fund are charged to that fund. Expenses attributable to more than one fund are allocated among the respective funds on the basis of relative net assets or other appropriate methods. Expense estimates are accrued in the period to which they relate and adjustments are made when actual amounts are known.
Income Tax Information and Distributions to Shareholders. Each year, the Fund intends to qualify as a regulated investment company under Subchapter M of the Internal Revenue Code, including distributing substantially all of its taxable income and realized gains. As a result, no provision for U.S. Federal income taxes is required. As of October 31, 2015, the Fund did not have any unrecognized tax benefits in the financial statements; nor is the Fund aware of any tax positions for which it is reasonably possible that the total amounts of unrecognized tax benefits will significantly change in the next twelve months. The Fund files a U.S. federal tax return, in addition to state and local tax returns as required. The Fund's federal income tax returns are subject to examination by the Internal Revenue Service (IRS) for a period of three fiscal years after they are filed. State and local tax returns may be subject to examination for an additional fiscal year depending on the jurisdiction. Foreign taxes are provided for based on the Fund's understanding of the tax rules and rates that exist in the foreign markets in which it invests. The Fund is subject to a tax imposed on capital gains by certain countries in which it invests.
Distributions are declared and recorded on the ex-dividend date. Income dividends and capital gain distributions are declared separately for each class. Income and capital gain distributions are determined in accordance with income tax regulations, which may
Annual Report
3. Significant Accounting Policies - continued
Income Tax Information and Distributions to Shareholders - continued
differ from GAAP. In addition, the Fund claimed a portion of the payment made to redeeming shareholders as a distribution for income tax purposes.
Capital accounts within the financial statements are adjusted for permanent book-tax differences. These adjustments have no impact on net assets or the results of operations. Capital accounts are not adjusted for temporary book-tax differences which will reverse in a subsequent period.
Book-tax differences are primarily due to foreign currency transactions, certain foreign taxes, passive foreign investment companies (PFIC) and losses deferred due to wash sales.
The federal tax cost of investment securities and unrealized appreciation (depreciation) as of period end were as follows:
Gross unrealized appreciation | $ 102,373,068 |
Gross unrealized depreciation | (110,741,632) |
Net unrealized appreciation (depreciation) on securities | $ (8,368,564) |
Tax Cost | $ 894,144,403 |
The tax-based components of distributable earnings as of period end were as follows:
Undistributed ordinary income | $ 15,328,717 |
Undistributed long-term capital gain | $ 19,111,574 |
Net unrealized appreciation (depreciation) on securities and other investments | $ (8,441,972) |
The tax character of distributions paid was as follows:
| October 31, 2015 | October 31, 2014 |
Ordinary Income | $ 8,729,905 | $ 30,270,126 |
Long-term Capital Gains | 115,839,457 | - |
Total | $ 124,569,362 | $ 30,270,126 |
Short-Term Trading (Redemption) Fees. Shares held by investors in the Fund less than 90 days may have been subject to a redemption fee equal to 2.00% of the NAV of shares redeemed. All redemption fees, which reduce the proceeds of the shareholder redemption, are retained by the Fund and accounted for as an addition to paid in capital.
Restricted Securities. The Fund may invest in securities that are subject to legal or contractual restrictions on resale. These securities generally may be resold in transactions exempt from registration or to the public if the securities are registered. Disposal of these securities may involve time-consuming negotiations and expense, and prompt sale
Annual Report
Notes to Financial Statements - continued
3. Significant Accounting Policies - continued
Restricted Securities - continued
at an acceptable price may be difficult. Information regarding restricted securities is included at the end of the Fund's Schedule of Investments.
4. Purchases and Sales of Investments.
Purchases and sales of securities, other than short-term securities, aggregated $286,769,775 and $355,615,175, respectively.
5. Fees and Other Transactions with Affiliates.
Management Fee. Fidelity Management & Research Company (the investment adviser) and its affiliates provide the Fund with investment management related services for which the Fund pays a monthly management fee. The management fee is the sum of an individual fund fee rate that is based on an annual rate of .60% of the Fund's average net assets and an annualized group fee rate that averaged .25% during the period. The group fee rate is based upon the average net assets of all the mutual funds advised by the investment adviser, including any mutual funds previously advised by the investment adviser that are currently advised by Fidelity SelectCo, LLC, an affiliate of the investment adviser. The group fee rate decreases as assets under management increase and increases as assets under management decrease. In addition, the management fee is subject to a performance adjustment (up to a maximum of ± .20% of the Fund's average net assets over a 36 month performance period). The upward or downward adjustment to the management fee is based on the relative investment performance of International Small Cap as compared to its benchmark index, the MSCI All Country World ex USA Small Cap Index effective April 1, 2014 (the MSCI EAFE Small Cap Index prior to April 1, 2014), over the same 36 month performance period. For the reporting period, the total annual management fee rate, including the performance adjustment, was .96% of the Fund's average net assets. The performance adjustment included in the management fee rate may be higher or lower than the maximum performance adjustment rate due to the difference between the average net assets for the reporting and performance periods.
Distribution and Service Plan Fees. In accordance with Rule 12b-1 of the 1940 Act, the Fund has adopted separate Distribution and Service Plans for each class of shares. Certain classes pay Fidelity Distributors Corporation (FDC), an affiliate of the investment adviser, separate Distribution and Service Fees, each of which is based on an annual percentage of each class' average net assets. In addition, FDC may pay financial intermediaries for selling shares of the Fund and providing shareholder support services.
Annual Report
5. Fees and Other Transactions with Affiliates - continued
Distribution and Service Plan Fees - continued
For the period, the Distribution and Service Fee rates, total fees and amounts retained by FDC were as follows:
| Distribution
Fee | Service
Fee | Total Fees | Retained
by FDC |
Class A | -% | .25% | $ 63,486 | $ 789 |
Class T | .25% | .25% | 59,620 | - |
Class B | .75% | .25% | 4,412 | 3,318 |
Class C | .75% | .25% | 106,420 | 13,666 |
| | | $ 233,938 | $ 17,773 |
Sales Load. FDC may receive a front-end sales charge of up to 5.75% for selling Class A shares and 3.50% for selling Class T shares, some of which is paid to financial intermediaries for selling shares of the Fund. Depending on the holding period, FDC may receive contingent deferred sales charges levied on Class A, Class T, Class B, and Class C redemptions. The deferred sales charges range from 5.00% to 1.00% for Class B shares, 1.00% for Class C shares, 1.00% for certain purchases of Class A shares and .25% for certain purchases of Class T shares.
For the period, sales charge amounts retained by FDC were as follows:
| Retained
by FDC |
Class A | $ 15,223 |
Class T | 3,172 |
Class BA | 74 |
Class C A | 2,729 |
| $ 21,198 |
A When Class B and Class C shares are initially sold, FDC pays commissions from its own resources to financial intermediaries through which the sales are made.
Transfer Agent Fees. Fidelity Investments Institutional Operations Company, Inc., (FIIOC), an affiliate of the investment adviser, is the transfer, dividend disbursing and shareholder servicing agent for each class of the Fund. FIIOC receives account fees and asset-based fees that vary according to the account size and type of account of the shareholders of the respective classes of the Fund. FIIOC pays for typesetting, printing and mailing of shareholder reports, except proxy statements.
Annual Report
Notes to Financial Statements - continued
5. Fees and Other Transactions with Affiliates - continued
Transfer Agent Fees - continued
For the period, transfer agent fees for each class were as follows:
| Amount | % of
Class-Level
Average
Net Assets |
Class A | $ 69,900 | .27 |
Class T | 36,352 | .30 |
Class B | 1,323 | .30 |
Class C | 31,483 | .30 |
International Small Cap | 1,992,868 | .25 |
Class I | 16,067 | .18 |
| $ 2,147,993 | |
Accounting and Security Lending Fees. Fidelity Service Company, Inc. (FSC), an affiliate of the investment adviser, maintains the Fund's accounting records. The accounting fee is based on the level of average net assets for each month. Under a separate contract, FSC administers the security lending program. The security lending fee is based on the number and duration of lending transactions.
Brokerage Commissions. The Fund placed a portion of its portfolio transactions with brokerage firms which are affiliates of the investment adviser. Brokerage commissions are included in net realized gain (loss) and change in net unrealized appreciation (depreciation) in the Statement of Operations. The commissions paid to these affiliated firms were $340 for the period.
Other. During the period, the investment adviser reimbursed the Fund for certain losses in the amount of $1,975.
6. Committed Line of Credit.
The Fund participates with other funds managed by the investment adviser or an affiliate in a $4.25 billion credit facility (the "line of credit") to be utilized for temporary or emergency purposes to fund shareholder redemptions or for other short-term liquidity purposes. The Fund has agreed to pay commitment fees on its pro-rata portion of the line of credit, which amounted to $1,210 and is reflected in Miscellaneous expenses on the Statement of Operations. During the period, the Fund did not borrow on this line of credit.
7. Security Lending.
The Fund lends portfolio securities through a lending agent from time to time in order to earn additional income. For equity securities, a lending agent is used and may loan securities to certain qualified borrowers, including Fidelity Capital Markets (FCM), a
Annual Report
7. Security Lending - continued
broker-dealer affiliated with the Fund. On the settlement date of the loan, the Fund receives collateral (in the form of U.S. Treasury obligations, letters of credit and/or cash) against the loaned securities and maintains collateral in an amount not less than 100% ofthe market value of the loaned securities during the period of the loan. The market value of the loaned securities is determined at the close of business of the Fund and any additional required collateral is delivered to the Fund on the next business day. The Fund or borrower may terminate the loan at any time, and if the borrower defaults on its obligation to return the securities loaned because of insolvency or other reasons, the Fund may apply collateral received from the borrower against the obligation. The Fund may experience delays and costs in recovering the securities loaned. Any cash collateral received is invested in the Fidelity Securities Lending Cash Central Fund. The value of loaned securities and cash collateral at period end are disclosed on the Fund's Statement of Assets and Liabilities. The value of securities loaned to FCM at period end was $363,206. Security lending income represents the income earned on investing cash collateral, less rebates paid to borrowers and any lending agent fees associated with the loan, plus any premium payments received for lending certain types of securities. Security lending income is presented in the Statement of Operations as a component of income from Fidelity Central Funds. Total security lending income during the period amounted to $186,310, including $3,174 from securities loaned to FCM.
8. Expense Reductions.
Commissions paid to certain brokers with whom the investment adviser, or its affiliates, places trades on behalf of the Fund include an amount in addition to trade execution, which may be rebated back to the Fund to offset certain expenses. This amount totaled $28,404 for the period.
Through arrangements with the Fund's custodian, credits realized as a result of certain uninvested cash balances were used to reduce the Fund's expenses. During the period, these credits reduced the Fund's custody expenses by $41.
In addition, during the period the investment adviser reimbursed and/or waived a portion of fund-level operating expenses in the amount of $3,507 and a portion of class-level operating expenses as follows:
| Amount |
Class A | $ 414 |
Class T | 191 |
Class B | 1 |
Class C | 281 |
International Small Cap | 22,441 |
Class I | 831 |
| $ 24,159 |
Annual Report
Notes to Financial Statements - continued
9. Distributions to Shareholders.
Distributions to shareholders of each class were as follows:
Years ended October 31, | 2015 | 2014 |
From net investment income | | |
Class A | $ 155,785 | $ 48,210 |
Class T | 27,108 | - |
International Small Cap | 7,454,709 | 3,601,146 |
Class I | 24,926 | 363,320 |
Total | $ 7,662,528 | $ 4,012,676 |
From net realized gain | | |
Class A | $ 3,382,206 | $ 564,345 |
Class T | 1,671,017 | 310,220 |
Class B | 66,002 | 14,343 |
Class C | 1,697,539 | 305,689 |
International Small Cap | 109,040,767 | 23,368,303 |
Class I | 1,049,303 | 1,694,550 |
Total | $ 116,906,834 | $ 26,257,450 |
10. Share Transactions.
Share transactions for each class were as follows and may contain automatic conversions between classes or exchanges between funds:
| Shares | Dollars |
Years ended October 31, | 2015 | 2014 | 2015 | 2014 |
Class A | | | | |
Shares sold | 432,152 | 355,842 | $ 9,990,970 | $ 9,376,508 |
Reinvestment of distributions | 159,613 | 22,103 | 3,404,539 | 571,356 |
Shares redeemed | (331,016) | (306,489) | (7,450,558) | (8,061,522) |
Net increase (decrease) | 260,749 | 71,456 | $ 5,944,951 | $ 1,886,342 |
Class T | | | | |
Shares sold | 124,085 | 115,645 | $ 2,869,552 | $ 3,022,509 |
Reinvestment of distributions | 77,005 | 11,686 | 1,636,354 | 300,676 |
Shares redeemed | (146,828) | (148,659) | (3,289,706) | (3,861,942) |
Net increase (decrease) | 54,262 | (21,328) | $ 1,216,200 | $ (538,757) |
Class B | | | | |
Shares sold | 4,667 | 3,137 | $ 108,058 | $ 80,198 |
Reinvestment of distributions | 2,954 | 538 | 62,128 | 13,734 |
Shares redeemed | (10,732) | (13,726) | (240,945) | (356,690) |
Net increase (decrease) | (3,111) | (10,051) | $ (70,759) | $ (262,758) |
Annual Report
10. Share Transactions - continued
| Shares | Dollars |
Years ended October 31, | 2015 | 2014 | 2015 | 2014 |
Class C | | | | |
Shares sold | 196,292 | 207,733 | $ 4,379,607 | $ 5,326,341 |
Reinvestment of distributions | 71,584 | 10,499 | 1,488,229 | 265,425 |
Shares redeemed | (268,981) | (222,725) | (5,818,752) | (5,644,059) |
Net increase (decrease) | (1,105) | (4,493) | $ 49,084 | $ (52,293) |
International Small Cap | | | | |
Shares sold | 7,876,402 | 7,158,603 | $ 184,799,928 | $ 190,711,642 |
Reinvestment of distributions | 5,231,399 | 988,313 | 113,102,853 | 25,844,388 |
Shares redeemed | (11,138,439) | (13,529,838) | (253,855,534) | (360,297,655) |
Net increase (decrease) | 1,969,362 | (5,382,922) | $ 44,047,247 | $ (143,741,625) |
Class I | | | | |
Shares sold | 256,693 | 1,844,038 | $ 5,987,647 | $ 48,462,558 |
Reinvestment of distributions | 46,102 | 61,170 | 1,003,648 | 1,598,368 |
Shares redeemed | (188,812) | (4,099,284) | (4,455,310) | (109,159,166) |
Net increase (decrease) | 113,983 | (2,194,076) | $ 2,535,985 | $ (59,098,240) |
11. Other.
The Fund's organizational documents provide former and current trustees and officers with a limited indemnification against liabilities arising in connection with the performance of their duties to the Fund. In the normal course of business, the Fund may also enter into contracts that provide general indemnifications. The Fund's maximum exposure under these arrangements is unknown as this would be dependent on future claims that may be made against the Fund. The risk of material loss from such claims is considered remote.
At the end of the period, the investment adviser or its affiliates were the owner of record of 15% of the total outstanding shares of the Fund.
Annual Report
To the Trustees of Fidelity Investment Trust and Shareholders of Fidelity International Small Cap Fund:
We have audited the accompanying statement of assets and liabilities of Fidelity International Small Cap Fund (the Fund), a fund of Fidelity Investment Trust, including the schedule of investments, as of October 31, 2015, and the related statement of operations for the year then ended, the statement of changes in net assets for each of the two years in the period then ended, and the financial highlights for each of the five years in the period then ended. These financial statements and financial highlights are the responsibility of the Fund's management. Our responsibility is to express an opinion on these financial statements and financial highlights based on our audits.
We conducted our audits in accordance with the standards of the Public Company Accounting Oversight Board (United States). Those standards require that we plan and perform the audit to obtain reasonable assurance about whether the financial statements and financial highlights are free of material misstatement. The Fund is not required to have, nor were we engaged to perform, an audit of its internal control over financial reporting. Our audits included consideration of internal control over financial reporting as a basis for designing audit procedures that are appropriate in the circumstances, but not for the purpose of expressing an opinion on the effectiveness of the Fund's internal control over financial reporting. Accordingly, we express no such opinion. An audit also includes examining, on a test basis, evidence supporting the amounts and disclosures in the financial statements, assessing the accounting principles used and significant estimates made by management, as well as evaluating the overall financial statement presentation. Our procedures included confirmation of securities owned as of October 31, 2015, by correspondence with the custodians and brokers; when replies were not received from brokers, we performed other auditing procedures. We believe that our audits provide a reasonable basis for our opinion.
In our opinion, such financial statements and financial highlights referred to above present fairly, in all material respects, the financial position of Fidelity International Small Cap Fund as of October 31, 2015, the results of its operations for the year then ended, the changes in its net assets for each of the two years in the period then ended, and the financial highlights for each of the five years in the period then ended, in conformity with accounting principles generally accepted in the United States of America.
DELOITTE & TOUCHE LLP
Boston, Massachusetts
December 18, 2015
Annual Report
The Trustees, Member of the Advisory Board, and officers of the trust and fund, as applicable, are listed below. The Board of Trustees governs the fund and is responsible for protecting the interests of shareholders. The Trustees are experienced executives who meet periodically throughout the year to oversee the fund's activities, review contractual arrangements with companies that provide services to the fund, oversee management of the risks associated with such activities and contractual arrangements, and review the fund's performance. Each of the Trustees oversees 170 funds.
The Trustees hold office without limit in time except that (a) any Trustee may resign; (b) any Trustee may be removed by written instrument, signed by at least two-thirds of the number of Trustees prior to such removal; (c) any Trustee who requests to be retired or who has become incapacitated by illness or injury may be retired by written instrument signed by a majority of the other Trustees; and (d) any Trustee may be removed at any special meeting of shareholders by a two-thirds vote of the outstanding voting securities of the trust. Each Trustee who is not an interested person (as defined in the 1940 Act) of the trust and the fund (Independent Trustee), shall retire not later than the last day of the calendar year in which his or her 75th birthday occurs. The Independent Trustees may waive this mandatory retirement age policy with respect to individual Trustees. The officers and Advisory Board Member hold office without limit in time, except that any officer and Advisory Board Member may resign or may be removed by a vote of a majority of the Trustees at any regular meeting or any special meeting of the Trustees. Except as indicated, each individual has held the office shown or other offices in the same company for the past five years.
Experience, Skills, Attributes, and Qualifications of the Fund's Trustees. The Governance and Nominating Committee has adopted a statement of policy that describes the experience, qualifications, attributes, and skills that are necessary and desirable for potential Independent Trustee candidates (Statement of Policy). The Board believes that each Trustee satisfied at the time he or she was initially elected or appointed a Trustee, and continues to satisfy, the standards contemplated by the Statement of Policy. The Governance and Nominating Committee also engages professional search firms to help identify potential Independent Trustee candidates who have the experience, qualifications, attributes, and skills consistent with the Statement of Policy. From time to time, additional criteria based on the composition and skills of the current Independent Trustees, as well as experience or skills that may be appropriate in light of future changes to board composition, business conditions, and regulatory or other developments, have also been considered by the professional search firms and the Governance and Nominating Committee. In addition, the Board takes into account the Trustees' commitment and participation in Board and committee meetings, as well as their leadership of standing and ad hoc committees throughout their tenure.
In determining that a particular Trustee was and continues to be qualified to serve as a Trustee, the Board has considered a variety of criteria, none of which, in isolation, was controlling. The Board believes that, collectively, the Trustees have balanced and diverse experience, qualifications, attributes, and skills, which allow the Board to operate effectively in governing the fund and protecting the interests of shareholders. Information about the specific experience, skills, attributes, and qualifications of each Trustee, which in each case led to the Board's conclusion that the Trustee should serve (or continue to serve) as a trustee of the fund, is provided below.
Annual Report
Trustees and Officers - continued
Board Structure and Oversight Function. James C. Curvey is an interested person (as defined in the 1940 Act) and currently serves as Chairman. The Trustees have determined that an interested Chairman is appropriate and benefits shareholders because an interested Chairman has a personal and professional stake in the quality and continuity of services provided to the fund. Independent Trustees exercise their informed business judgment to appoint an individual of their choosing to serve as Chairman, regardless of whether the Trustee happens to be independent or a member of management. The Independent Trustees have determined that they can act independently and effectively without having an Independent Trustee serve as Chairman and that a key structural component for assuring that they are in a position to do so is for the Independent Trustees to constitute a substantial majority for the Board. The Independent Trustees also regularly meet in executive session. Ned C. Lautenbach serves as Chairman of the Independent Trustees and as such (i) acts as a liaison between the Independent Trustees and management with respect to matters important to the Independent Trustees and (ii) with management prepares agendas for Board meetings.
Fidelity funds are overseen by different Boards of Trustees. The fund's Board oversees Fidelity's high income and certain equity funds, and other Boards oversee Fidelity's investment-grade bond, money market, asset allocation, and sector funds. The asset allocation funds may invest in Fidelity funds overseen by the fund's Board. The use of separate Boards, each with its own committee structure, allows the Trustees of each group of Fidelity funds to focus on the unique issues of the funds they oversee, including common research, investment, and operational issues. On occasion, the separate Boards establish joint committees to address issues of overlapping consequences for the Fidelity funds overseen by each Board.
The Trustees operate using a system of committees to facilitate the timely and efficient consideration of all matters of importance to the Trustees, the fund, and fund shareholders and to facilitate compliance with legal and regulatory requirements and oversight of the fund's activities and associated risks. The Board, acting through its committees, has charged FMR and its affiliates with (i) identifying events or circumstances the occurrence of which could have demonstrably adverse effects on the fund's business and/or reputation; (ii) implementing processes and controls to lessen the possibility that such events or circumstances occur or to mitigate the effects of such events or circumstances if they do occur; and (iii) creating and maintaining a system designed to evaluate continuously business and market conditions in order to facilitate the identification and implementation processes described in (i) and (ii) above. Because the day-to-day operations and activities of the fund are carried out by or through FMR, its affiliates and other service providers, the fund's exposure to risks is mitigated but not eliminated by the processes overseen by the Trustees. While each of the Board's committees has responsibility for overseeing different aspects of the fund's activities, oversight is exercised primarily through the Operations, Audit, and Compliance Committees. In addition, the Independent Trustees have worked with FMR to enhance the Board's oversight of investment and financial risks, legal and regulatory risks, technology risks, and operational risks, including the development of additional risk reporting to the Board. For example, a working group comprised of Independent Trustees and FMR has worked and continues to work to review the Fidelity funds' valuation-related activities, reporting and risk management. Appropriate personnel, including but not limited to the fund's Chief Compliance Officer (CCO), FMR's internal auditor, the independent accountants, the fund's Treasurer and portfolio management personnel, make periodic reports to the Board's committees, as appropriate, including an annual review of Fidelity's risk management program for the Fidelity funds. The responsibilities of each standing committee, including their oversight responsibilities, are described further under "Standing Committees of the Fund's Trustees."
Annual Report
The fund's Statement of Additional Information (SAI) includes more information about the Trustees. To request a free copy, call Fidelity at 1-877-208-0098.
Interested Trustees*:
Correspondence intended for each Trustee who is an interested person may be sent to Fidelity Investments, 245 Summer Street, Boston, Massachusetts 02210.
Name, Year of Birth; Principal Occupations and Other Relevant Experience+ |
James C. Curvey (1935) |
Year of Election or Appointment: 2007 Trustee Chairman of the Board of Trustees |
| Mr. Curvey also serves as Trustee of other Fidelity funds. Mr. Curvey is a Director of Fidelity Research & Analysis Co. (investment adviser firm, 2009-present), and Vice Chairman (2007-present) and Director of FMR LLC (diversified financial services company). In addition, Mr. Curvey serves as an Overseer for the Boston Symphony Orchestra and a member of the board of Artis-Naples, Naples, Florida, and as a Trustee for Brewster Academy, Wolfeboro, New Hampshire. Previously, Mr. Curvey served as a Director of Fidelity Investments Money Management, Inc. (investment adviser firm, 2009-2014) and a Director of FMR and FMR Co., Inc. (investment adviser firms 2007-2014). |
Charles S. Morrison (1960) |
Year of Election or Appointment: 2014 Trustee |
| Mr. Morrison also serves as Trustee of other funds. He serves as a Director of Fidelity Investments Money Management, Inc. (FIMM) (investment adviser firm, 2014-present), Director of Fidelity SelectCo, LLC (investment adviser firm, 2014-present), President, Asset Management (2014-present), and is an employee of Fidelity Investments. Previously, Mr. Morrison served as Vice President of Fidelity's Fixed Income and Asset Allocation Funds (2012-2014), President, Fixed Income (2011-2014), Vice President of Fidelity's Money Market Funds (2005-2009), President, Money Market Group Leader of FMR (investment adviser firm, 2009), and Senior Vice President, Money Market Group of FMR (2004-2009). Mr. Morrison also served as Vice President of Fidelity's Bond Funds (2002-2005), certain Balanced Funds (2002-2005), and certain Asset Allocation Funds (2002-2007), and as Senior Vice President (2002-2005) of Fidelity's Bond Division. |
* Trustees have been determined to be "Interested Trustees" by virtue of, among other things, their affiliation with the trust or various entities under common control with FMR.
+ The information above includes each Trustee's principal occupation during the last five years and other information relating to the experience, attributes, and skills relevant to each Trustee's qualifications to serve as a Trustee, which led to the conclusion that each Trustee should serve as a Trustee for the fund.
Annual Report
Independent Trustees:
Correspondence intended for each Independent Trustee (that is, the Trustees other than the Interested Trustees) may be sent to Fidelity Investments, P.O. Box 55235, Boston, Massachusetts 02205-5235.
Name, Year of Birth; Principal Occupations and Other Relevant Experience+ |
Dennis J. Dirks (1948) |
Year of Election or Appointment: 2005 Trustee |
| Mr. Dirks also serves as Trustee of other Fidelity funds. Prior to his retirement in May 2003, Mr. Dirks was Chief Operating Officer and a member of the Board of The Depository Trust & Clearing Corporation (DTCC). He also served as President, Chief Operating Officer, and Board member of The Depository Trust Company (DTC) and President and Board member of the National Securities Clearing Corporation (NSCC). In addition, Mr. Dirks served as Chief Executive Officer and Board member of the Government Securities Clearing Corporation, Chief Executive Officer and Board member of the Mortgage-Backed Securities Clearing Corporation, as a Trustee and a member of the Finance Committee of Manhattan College (2005-2008), as a Trustee and a member of the Finance Committee of AHRC of Nassau County (2006-2008), and as a member of the Independent Directors Council (IDC) Governing Council (2010-2015). Mr. Dirks is a member of the Board of Directors for The Brookville Center for Children's Services, Inc. (2009-present). |
Alan J. Lacy (1953) |
Year of Election or Appointment: 2008 Trustee |
| Mr. Lacy also serves as Trustee of other Fidelity funds. Mr. Lacy serves as a member of the Board of Directors of Dave & Buster's Entertainment, Inc. (restaurant and entertainment complexes, 2010-present) and Bristol-Myers Squibb Company (global pharmaceuticals, 2008-present). In addition, Mr. Lacy served as Senior Adviser (2007-2014) of Oak Hill Capital Partners, L.P. (private equity) and also served as Chief Executive Officer (2000-2005) and Vice Chairman (2005-2006) of Sears Holdings Corporation and Sears, Roebuck and Co. (retail). Mr. Lacy is a member of the Board of Trustees of The National Parks Conservation Association (2006-present). Previously, Mr. Lacy served as Chairman of the Board of Trustees of the National Parks Conservation Association (2008-2011) and as a member of the Board of Directors for The Western Union Company (global money transfer, 2006-2011), The Hillman Companies, Inc. (hardware wholesalers, 2010-2014), and Earth Fare, Inc. (retail grocery, 2010-2014). |
Ned C. Lautenbach (1944) |
Year of Election or Appointment: 2000 Trustee Chairman of the Independent Trustees |
| Mr. Lautenbach also serves as Trustee of other Fidelity funds. Mr. Lautenbach currently serves as the Lead Director of the Eaton Corporation Board of Directors (diversified industrial, 1997-present). Mr. Lautenbach is Chairman of the Board of Directors of Artis-Naples in Naples, Florida (2012-present), a member of the Council on Foreign Relations (1994-present), and a member of the Board of Governors, State University System of Florida (2013-present). Previously, Mr. Lautenbach was a Partner/Advisory Partner at Clayton, Dubilier & Rice, LLC (private equity investment, 1998-2010), as well as a Director of Sony Corporation (2006-2007). |
Joseph Mauriello (1944) |
Year of Election or Appointment: 2008 Trustee |
| Mr. Mauriello also serves as Trustee of other Fidelity funds. Prior to his retirement in January 2006, Mr. Mauriello served in numerous senior management positions including Deputy Chairman and Chief Operating Officer (2004-2005), and Vice Chairman of Financial Services (2002-2004) of KPMG LLP US (professional services, 1965-2005). Mr. Mauriello currently serves as a member of the Board of Directors of XL Group plc. (global insurance and re-insurance, 2006-present) and the Independent Directors Council (IDC) Governing Council (2015-present). Previously, Mr. Mauriello served as a Director of the Hamilton Funds of the Bank of New York (2006-2007) and of Arcadia Resources Inc. (health care services and products, 2007-2012). |
Robert W. Selander (1950) |
Year of Election or Appointment: 2011 Trustee |
| Mr. Selander also serves as Trustee of other Fidelity funds. Mr. Selander serves as a Director of The Western Union Company (global money transfer, 2014-present). Previously, Mr. Selander served as a Member of the Advisory Board of other Fidelity funds (2011), and Executive Vice Chairman (2010), Chief Executive Officer (2009-2010), and President and Chief Executive Officer (1997-2009) of Mastercard, Inc. |
Cornelia M. Small (1944) |
Year of Election or Appointment: 2005 Trustee |
| Ms. Small also serves as Trustee of other Fidelity funds. Ms. Small is a member of the Board of Directors (2009-present) and Chair of the Investment Committee (2010-present) of the Teagle Foundation. Ms. Small also serves on the Investment Committee of the Berkshire Taconic Community Foundation (2008-present). Previously, Ms. Small served as Chairperson (2002-2008) and a member of the Investment Committee and Chairperson (2008-2012) and a member of the Board of Trustees of Smith College. In addition, Ms. Small served as Chief Investment Officer, Director of Global Equity Investments, and a member of the Board of Directors of Scudder, Stevens & Clark and Scudder Kemper Investments. |
William S. Stavropoulos (1939) |
Year of Election or Appointment: 2001 Trustee Vice Chairman of the Independent Trustees |
| Mr. Stavropoulos also serves as Trustee of other Fidelity funds. Mr. Stavropoulos serves as President and Founder of the Michigan Baseball Foundation, the Great Lakes Loons (2007-present). Mr. Stavropoulos is Chairman Emeritus of the Board of Directors of The Dow Chemical Company, where he previously served in numerous senior management positions, including President, CEO (1995-2000; 2002-2004), Chairman of the Executive Committee (2000-2006), and as a member of the Board of Directors (1990-2006). Currently, Mr. Stavropoulos is Chairman of the Board of Directors of Univar Inc. (global distributor of commodity and specialty chemicals), a Director of Teradata Corporation (data warehousing and technology solutions), and Maersk Inc. (industrial conglomerate), and a member of the Advisory Board for Metalmark Capital LLC (private equity investment, 2005-present). Mr. Stavropoulos is an operating advisor to Clayton, Dubilier & Rice, LLC (private equity investment). In addition, Mr. Stavropoulos is a member of the University of Notre Dame Advisory Council for the College of Science, a Trustee of the Rollin L. Gerstacker Foundation, and a Director of the Naples Philharmonic Center for the Arts. Previously, Mr. Stavropoulos served as a Director of Chemical Financial Corporation (bank holding company, 1993-2012) and Tyco International, Ltd. (multinational manufacturing and services, 2007-2012). |
David M. Thomas (1949) |
Year of Election or Appointment: 2008 Trustee |
| Mr. Thomas also serves as Trustee of other Fidelity funds. Mr. Thomas serves as Non-Executive Chairman of the Board of Directors of Fortune Brands Home and Security (home and security products, 2011-present), as a member of the Board of Directors (2004-present) and Presiding Director (2013-present) of Interpublic Group of Companies, Inc. (marketing communication), and as a member of the Board of Trustees of the University of Florida (2013-present). Previously, Mr. Thomas served as Executive Chairman (2005-2006) and Chairman and Chief Executive Officer (2000-2005) of IMS Health, Inc. (pharmaceutical and healthcare information solutions), and a Director of Fortune Brands, Inc. (consumer products, 2000-2011). |
+ The information above includes each Trustee's principal occupation during the last five years and other information relating to the experience, attributes, and skills relevant to each Trustee's qualifications to serve as a Trustee, which led to the conclusion that each Trustee should serve as a Trustee for the fund.
Advisory Board Member and Officers:
Correspondence intended for each officer and Peter S. Lynch may be sent to Fidelity Investments, 245 Summer Street, Boston, Massachusetts 02210. Officers appear below in alphabetical order.
Name, Year of Birth; Principal Occupation |
Peter S. Lynch (1944) |
Year of Election or Appointment: 2003 Member of the Advisory Board |
| Mr. Lynch also serves as Member of the Advisory Board of other Fidelity funds. Mr. Lynch is Vice Chairman and a Director of FMR (investment adviser firm) and FMR Co., Inc. (investment adviser firm). In addition, Mr. Lynch serves as a Trustee of Boston College and as the Chairman of the Inner-City Scholarship Fund. Previously, Mr. Lynch served on the Special Olympics International Board of Directors (1997-2006). |
Elizabeth Paige Baumann (1968) |
Year of Election or Appointment: 2012 Anti-Money Laundering (AML) Officer |
| Ms. Baumann also serves as AML Officer of other funds. She is Chief AML Officer of FMR LLC (diversified financial services company, 2012-present) and is an employee of Fidelity Investments. Previously, Ms. Baumann served as Vice President and Deputy Anti-Money Laundering Officer (2007-2012). |
Marc R. Bryant (1966) |
Year of Election or Appointment: 2015 Secretary and Chief Legal Officer (CLO) |
| Mr. Bryant also serves as Secretary and CLO of other funds. Mr. Bryant serves as CLO, Secretary, and Senior Vice President of Fidelity Management & Research Company (investment adviser firm, 2015-present) and FMR Co., Inc. (investment adviser firm, 2015-present); Secretary of Fidelity SelectCo, LLC (investment adviser firm, 2015-present) and Fidelity Investments Money Management, Inc. (investment adviser firm, 2015-present); and CLO of Fidelity Management & Research (Hong Kong) Limited (investment adviser firm, 2015-present). He is Senior Vice President and Deputy General Counsel of FMR LLC (diversified financial services company). Previously, Mr. Bryant served as Secretary and Chief Legal Officer of Fidelity Rutland Square Trust II (2010-2014) and Assistant Secretary of Fidelity's Fixed Income and Asset Allocation Funds (2013-2015). Prior to joining Fidelity Investments, Mr. Bryant served as a Senior Vice President and the Head of Global Retail Legal for AllianceBernstein L.P. (2006-2010), and as the General Counsel for ProFund Advisors LLC (2001-2006). |
William C. Coffey (1969) |
Year of Election or Appointment: 2009 Assistant Secretary |
| Mr. Coffey also serves as Assistant Secretary of other funds. He is Senior Vice President and Deputy General Counsel of FMR LLC (diversified financial services company, 2010-present), and is an employee of Fidelity Investments. Previously, Mr. Coffey served as Vice President and Associate General Counsel of FMR LLC (2005-2009). |
Jonathan Davis (1968) |
Year of Election or Appointment: 2010 Assistant Treasurer |
| Mr. Davis also serves as Assistant Treasurer of other funds, and is an employee of Fidelity Investments. Previously, Mr. Davis served as Vice President and Associate General Counsel of FMR LLC (diversified financial services company, 2003-2010). |
Adrien E. Deberghes (1967) |
Year of Election or Appointment: 2008 Deputy Treasurer |
| Mr. Deberghes also serves as an officer of other funds. He is an employee of Fidelity Investments (2008-present). Prior to joining Fidelity Investments, Mr. Deberghes was Senior Vice President of Mutual Fund Administration at State Street Corporation (2007-2008), Senior Director of Mutual Fund Administration at Investors Bank & Trust (2005-2007), and Director of Finance for Dunkin' Brands (2000-2005). |
Stephanie J. Dorsey (1969) |
Year of Election or Appointment: 2010 Assistant Treasurer |
| Ms. Dorsey also serves as an officer of other funds. She is an employee of Fidelity Investments (2008-present) and has served in other fund officer roles. Prior to joining Fidelity Investments, Ms. Dorsey served as Treasurer (2004-2008) of the JPMorgan Mutual Funds and Vice President (2004-2008) of JPMorgan Chase Bank. |
Howard J. Galligan III (1966) |
Year of Election or Appointment: 2014 Chief Financial Officer |
| Mr. Galligan also serves as Chief Financial Officer of other funds. Mr. Galligan serves as President of Fidelity Pricing and Cash Management Services (FPCMS) (2014-present) and as a Director of Strategic Advisers, Inc. (investment adviser firm, 2008-present). Previously, Mr. Galligan served as Chief Administrative Officer of Asset Management (2011-2014) and Chief Operating Officer and Senior Vice President of Investment Support for Strategic Advisers, Inc. (2003-2011). |
Scott C. Goebel (1968) |
Year of Election or Appointment: 2015 Vice President |
| Mr. Goebel serves as Vice President of other funds and is an employee of Fidelity Investments (2001-present). Previously, Mr. Goebel served as Secretary of Fidelity SelectCo, LLC (investment adviser firm, 2013-2015), Fidelity Investments Money Management, Inc. (FIMM) (investment adviser firm, 2010-2015), and Fidelity Research and Analysis Company (FRAC) (investment adviser firm, 2010-2015); General Counsel, Secretary, and Senior Vice President of Fidelity Management & Research Company (investment adviser firm, 2008-2015) and FMR Co., Inc. (investment adviser firm, 2008-2015); Assistant Secretary of Fidelity Management & Research (Japan) Limited (investment adviser firm, 2008-2015) and FMR Investment Management (U.K.) Limited (investment adviser firm, 2008-2015); Chief Legal Officer (CLO) of Fidelity Management & Research (Hong Kong) Limited (investment adviser firm, 2008-2015); Secretary and CLO of certain Fidelity funds (2008-2015); Assistant Secretary of FIMM (2008-2010), FRAC (2008-2010), and certain funds (2007-2008); and as Vice President and Secretary of Fidelity Distributors Corporation (FDC) (2005-2007). |
Thomas C. Hense (1964) |
Year of Election or Appointment: 2008, 2010, or 2015 Vice President |
| Mr. Hense serves as Vice President of Fidelity Advisor Multi-Asset Income Fund (2015) and other funds (High Income (2008), Small Cap (2008), and Value (2010) funds), and is an employee of Fidelity Investments (1993-present). Previously, Mr. Hense served as a portfolio manager for Fidelity's Institutional Money Management Group (Pyramis) (2003-2008). |
Brian B. Hogan (1964) |
Year of Election or Appointment: 2009 Vice President |
| Mr. Hogan also serves as Trustee or Vice President of other funds. Mr. Hogan serves as a Director of Fidelity SelectCo, LLC (investment adviser firm, 2014-present) and President of the Equity Division of FMR (investment adviser firm, 2009-present). Previously, Mr. Hogan served as Senior Vice President, Equity Research of FMR (2006-2009) and as a portfolio manager. |
Chris Maher (1972) |
Year of Election or Appointment: 2013 Assistant Treasurer |
| Mr. Maher serves as Assistant Treasurer of other funds. Mr. Maher is Vice President of Valuation Oversight and is an employee of Fidelity Investments. Previously, Mr. Maher served as Vice President of Asset Management Compliance (2013), Vice President of the Program Management Group of FMR (investment adviser firm, 2010-2013), and Vice President of Valuation Oversight (2008-2010). |
Kenneth B. Robins (1969) |
Year of Election or Appointment: 2008 President and Treasurer |
| Mr. Robins also serves as an officer of other funds. Mr. Robins serves as Executive Vice President of Fidelity Investments Money Management, Inc. (FIMM) (investment adviser firm, 2013-present) and is an employee of Fidelity Investments (2004-present). Previously, Mr. Robins served in other fund officer roles. |
Stacie M. Smith (1974) |
Year of Election or Appointment: 2013 Deputy Treasurer |
| Ms. Smith also serves as an officer of other funds. She is an employee of Fidelity Investments (2009-present) and has served in other fund officer roles. Prior to joining Fidelity Investments, Ms. Smith served as Senior Audit Manager of Ernst & Young LLP (1996-2009). |
Renee Stagnone (1975) |
Year of Election or Appointment: 2013 Deputy Treasurer |
| Ms. Stagnone also serves as Deputy Treasurer of other funds. Ms. Stagnone is an employee of Fidelity Investments (1997-present). |
Linda J. Wondrack (1964) |
Year of Election or Appointment: 2014 Chief Compliance Officer |
| Ms. Wondrack also serves as Chief Compliance Officer of other funds. Ms. Wondrack is Executive Vice President and head of the Ethics Office and Asset Management Compliance for Fidelity Investments (2012-present). Ms. Wondrack also serves as Chief Compliance Officer of Fidelity SelectCo, LLC (investment adviser firm, 2014-present); Chief Compliance Officer of Impresa Management LLC (2013-present); and Chief Compliance Officer of FMR Co., Inc. (investment adviser firm), Fidelity Investments Money Management, Inc. (investment adviser firm), Fidelity Management & Research (Japan) Limited (investment adviser firm), FMR Investment Management (U.K.) Limited (investment adviser firm), Fidelity Management & Research (Hong Kong) (investment adviser firm), Fidelity Management & Research Company (investment adviser firm), FIAM LLC (investment adviser firm), and Strategic Advisers, Inc. (investment adviser firm), Ballyrock Investment Advisors LLC, and Northern Neck Investors LLC (2012-present). Previously, Ms. Wondrack served as Senior Vice President and Chief Compliance Officer for Columbia Management Investment Advisers, LLC (2005-2012); Chief Compliance Officer for certain funds within the Columbia Family of Funds (2007-2012); and Senior Vice President of Compliance Risk Management at Bank of America (2005-2010). |
Joseph F. Zambello (1957) |
Year of Election or Appointment: 2011 Deputy Treasurer |
| Mr. Zambello also serves as Deputy Treasurer of other funds. Mr. Zambello is an employee of Fidelity Investments (1991-present). Previously, Mr. Zambello served as Vice President of the Program Management Group of FMR (investment adviser firm, 2009-2011) and Vice President of the Transfer Agent Oversight Group (2005-2009). |
Annual Report
The Board of Trustees of Advisor International Small Cap Fund voted to pay to shareholders of record at the opening of business on record date, the following distributions per share derived from capital gains realized from sales of portfolio securities, and dividends derived from net investment income:
| Pay Date | Record Date | Dividends | Capital Gains |
Class I | 12/07/15 | 12/04/15 | $0.308 | $0.620 |
The fund hereby designates as a capital gain dividend with respect to the taxable year ended October 2015, $19,117,976, or, if subsequently determined to be different, the net capital gain of such year.
Class I designates 4% of the dividends distributed during the fiscal year as qualifying for the dividends-received deduction for corporate shareholders.
Class I designates 100% of the dividend distributed during the fiscal year as amounts which may be taken into account as a dividend for purposes of the maximum rate under section 1(h)(11) of the Internal Revenue Code.
The amounts per share which represent income derived from sources within, and taxes paid to, foreign countries or possessions of the United States are as follows:
| Pay Date | Income | Taxes |
Class I | 12/08/2014 | $0.1655 | $0.0515 |
The fund will notify shareholders in January 2016 of amounts for use in preparing 2015 income tax returns.
Annual Report
Fidelity International Small Cap Fund
Each year, the Board of Trustees, including the Independent Trustees (together, the Board), votes on the renewal of the management contract with Fidelity Management & Research Company (FMR) and the sub-advisory agreements (together, the Advisory Contracts) for the fund. The Board, assisted by the advice of fund counsel and Independent Trustees' counsel, requests and considers a broad range of information relevant to the renewal of the Advisory Contracts throughout the year.
The Board meets regularly and, at each of its meetings, covers an extensive agenda of topics and materials and considers factors that are relevant to its annual consideration of the renewal of the fund's Advisory Contracts, including the services and support provided to the fund and its shareholders. The Board has established various standing committees (Committees), each composed of and chaired by Independent Trustees with varying backgrounds, to which the Board has assigned specific subject matter responsibilities in order to enhance effective decision-making by the Board. The Board, acting directly and through its Committees, requests and receives information concerning the annual consideration of the renewal of the fund's Advisory Contracts. The Board also meets as needed to consider matters specifically related to the Board's annual consideration of the renewal of the Advisory Contracts. Members of the Board may also meet with trustees of other Fidelity funds through ad hoc joint committees to discuss certain matters relevant to all of the Fidelity funds.
At its July 2015 meeting, the Board unanimously determined to renew the fund's Advisory Contracts. In reaching its determination, the Board considered all factors it believed relevant, including (i) the nature, extent, and quality of the services to be provided to the fund and its shareholders (including the investment performance of the fund); (ii) the competitiveness of the fund's management fee and total expense ratio relative to peer funds; (iii) the total costs of the services to be provided by and the profits to be realized by Fidelity from its relationship with the fund; and (iv) the extent to which (if any) economies of scale exist and would be realized as the fund grows, and whether any economies of scale are appropriately shared with fund shareholders.
In considering whether to renew the Advisory Contracts for the fund, the Board reached a determination, with the assistance of fund counsel and Independent Trustees' counsel and through the exercise of its business judgment, that the renewal of the Advisory Contracts was in the best interests of the fund and its shareholders and that the compensation payable under the Advisory Contracts was fair and reasonable. The Board's decision to renew the Advisory Contracts was not based on any single factor, but rather was based on a comprehensive consideration of all the information provided to the Board at its meetings throughout the year. The Board, in reaching its determination to renew the Advisory Contracts, was aware that shareholders of the fund have a broad range of investment choices available to them, including a wide choice among funds offered by Fidelity's competitors, and that the fund's shareholders, who have the opportunity to review and weigh the disclosure provided by the fund in its prospectus and other public disclosures, have chosen to invest in this fund, which is part of the Fidelity family of funds.
Annual Report
Board Approval of Investment Advisory Contracts and
Management Fees - continued
Nature, Extent, and Quality of Services Provided. The Board considered Fidelity's staffing as it relates to the fund, including the backgrounds of investment personnel of Fidelity, and also considered the fund's investment objective, strategies, and related investment philosophy. The Independent Trustees also had discussions with senior management of Fidelity's investment operations and investment groups. The Board considered the structure of the portfolio manager compensation program and whether this structure provides appropriate incentives to act in the best interests of the fund. Additionally, the Board considered the portfolio managers' investments, if any, in the funds that they manage.
Resources Dedicated to Investment Management and Support Services. The Board and the Fund Oversight and Research Committees reviewed the general qualifications and capabilities of Fidelity's investment staff, including its size, education, experience, and resources, as well as Fidelity's approach to recruiting, training, managing, and compensating investment personnel. The Board noted that Fidelity has continued to increase the resources devoted to non-U.S. offices, including expansion of Fidelity's global investment organization. The Board also noted that Fidelity's analysts have extensive resources, tools and capabilities that allow them to conduct sophisticated quantitative and fundamental analysis, as well as credit analysis of issuers, counterparties and guarantors. Further, the Board considered that Fidelity's investment professionals have sufficient access to global information and data so as to provide competitive investment results over time, and that those professionals also have access to sophisticated tools that permit them to assess portfolio construction and risk and performance attribution characteristics continuously, as well as to transmit new information and research conclusions rapidly around the world. Additionally, in its deliberations, the Board considered Fidelity's trading, risk management, and compliance capabilities and resources, which are integral parts of the investment management process.
Shareholder and Administrative Services. The Board considered (i) the nature, extent, quality, and cost of advisory, administrative, and shareholder services performed by FMR, the sub-advisers (together with FMR, the Investment Advisers), and their affiliates under the Advisory Contracts and under separate agreements covering transfer agency, pricing and bookkeeping, and securities lending services for the fund; (ii) the nature and extent of the supervision of third party service providers, principally custodians and subcustodians; and (iii) the resources devoted to, and the record of compliance with, the fund's compliance policies and procedures. The Board also reviewed the allocation of fund brokerage, including allocations to brokers affiliated with the Investment Advisers, the use of brokerage commissions to pay fund expenses, and the use of "soft" commission dollars to pay for research services.
Annual Report
The Board noted that the growth of fund assets over time across the complex allows Fidelity to reinvest in the development of services designed to enhance the value or convenience of the Fidelity funds as investment vehicles. These services include 24-hour access to account information and market information through telephone representatives and over the Internet, investor education materials and asset allocation tools, and the expanded availability of Fidelity Investor Centers.
In 2014, the Board formed an ad hoc Committee on Transfer Agency Fees to review the variety of transfer agency fee structures throughout the industry and Fidelity's competitive positioning with respect to industry participants.
Investment in a Large Fund Family. The Board considered the benefits to shareholders of investing in a Fidelity fund, including the benefits of investing in a fund that is part of a large family of funds offering a variety of investment disciplines and providing a large variety of mutual fund investor services. The Board noted that Fidelity had taken, or had made recommendations that resulted in the Fidelity funds taking, a number of actions over the previous year that benefited particular funds, including (i) continuing to dedicate additional resources to investment research and to the support of the senior management team that oversees asset management; (ii) continuing efforts to enhance Fidelity's global research capabilities; (iii) launching new funds and making other enhancements to meet client needs; (iv) reducing management fees and total expenses for certain index funds and diversified international funds; (v) continuing to launch dedicated lower cost underlying funds to meet portfolio construction needs related to expanding underlying fund options for Fidelity funds of funds, specifically for the Freedom Fund product lines; (vi) rationalizing product lines and gaining increased efficiencies through fund mergers; (vii) launching active fixed-income exchange-traded funds; (viii) continuing to develop, acquire and implement systems and technology to improve services to the funds and information security and to increase efficiency; (ix) implementing investment enhancements to further strengthen Fidelity's target date product line to increase investors' probability of success in achieving their goals; (x) modifying the eligibility criteria for certain share classes to accommodate roll-over assets from employer-sponsored retirement plans; (xi) launching a new Class W of the Freedom Index Funds to attract and retain Fidelity record-kept retirement plan assets; and (xii) implementing changes to Fidelity's money market product line in response to recent money market regulatory reforms.
Investment Performance. The Board considered whether the fund has operated in accordance with its investment objective, as well as its record of compliance with its investment restrictions and its performance history. The Board noted that there was a portfolio management change for the fund in March 2014.
Annual Report
Board Approval of Investment Advisory Contracts and
Management Fees - continued
The Board took into account discussions with representatives of the Investment Advisers about fund investment performance that occur at Board meetings throughout the year. In this regard the Board noted that as part of regularly scheduled fund reviews and other reports to the Board on fund performance, the Board considers annualized return information for the fund, for different time periods, measured against a securities market index ("benchmark index") and a peer group of funds with similar objectives ("peer group"), if any. In its evaluation of fund investment performance, the Board gave particular attention to information indicating changes in performance of certain Fidelity funds for specific time periods and discussed with the Investment Advisers the reasons for any overperformance or underperformance.
In addition to reviewing absolute and relative fund performance, the Independent Trustees periodically consider the appropriateness of fund performance metrics in evaluating the results achieved. In general, the Independent Trustees believe that fund performance should be evaluated based on net performance (after fees and expenses) of both the highest performing and lowest performing fund share classes, where applicable, compared to appropriate benchmark indices, over appropriate time periods that may include full market cycles, and compared to peer groups, as applicable, over the same periods, taking into account relevant factors including the following: general market conditions; issuer-specific information; and fund cash flows and other factors.
The Independent Trustees recognize that shareholders evaluate performance on a net basis over their own holding periods, for which one-, three-, and five-year periods are often used as a proxy. For this reason, the performance information reviewed by the Board also included net cumulative calendar year total return information for the fund and an appropriate benchmark index and peer group for the most recent one-, three-, and five-year periods, as shown below. Returns are shown compared to the 25th percentile (top of box, 75% beaten) and 75th percentile (bottom of box, 25% beaten) of the peer universe. Returns of the benchmark index are "net MA," i.e., adjusted for tax withholding rates applicable to U.S.-based funds organized as Massachusetts business trusts.
Annual Report
Fidelity International Small Cap Fund

The Board also considered that the fund's management fee is subject to upward or downward adjustment depending upon whether, and to what extent, the fund's investment performance for the performance period exceeds, or is exceeded by, a securities index, thus leading to a performance adjustment for the same period. The Board noted that the performance adjustment provides FMR with a strong economic incentive to seek to achieve superior performance for the fund's shareholders and helps to more closely align the interests of FMR and the shareholders of the fund.
Based on its review, the Board concluded that the nature, extent, and quality of services provided to the fund under the Advisory Contracts should benefit the shareholders of the fund.
Competitiveness of Management Fee and Total Expense Ratio. The Board considered the fund's management fee and total expense ratio compared to "mapped groups" of competitive funds and classes created for the purpose of facilitating the Trustees' competitive analysis of management fees and total expenses. Fidelity creates "mapped groups" by combining similar Lipper investment objective categories that have comparable investment mandates. Combining Lipper investment objective categories aids the Board's management fee and total expense ratio comparisons by broadening the competitive group used for comparison.
Management Fee. The Board considered two proprietary management fee comparisons for the 12-month periods shown in basis points (BP) in the chart below. The group of Lipper funds used by the Board for management fee comparisons is referred to below as the "Total Mapped Group." The Total Mapped Group is broader than the Lipper peer group used by the Board for performance comparisons because the Total Mapped Group combines several Lipper investment objective categories while the Lipper peer group does not. The Total Mapped Group comparison focuses on a fund's standing in terms of gross management fees before expense reimbursements or caps, and without giving effect to the fund's performance adjustment, relative to the total universe of funds with comparable investment mandates, regardless of whether their management fee structures also are comparable. Funds with comparable investment mandates offer exposure to similar types of securities. Funds with comparable management fee structures have similar management fee contractual arrangements (e.g., flat rate charged for advisory services, all-inclusive fee rate, etc.). "TMG %" represents the percentage of funds in the Total Mapped Group that had management fees that were lower than the fund's. For example, a hypothetical TMG % of 20% would mean that 80% of the funds in the Total Mapped Group had higher, and 20% had lower, management fees than the fund. The fund's actual TMG %s and the number of funds in the Total Mapped Group are in the chart below. The "Asset-Size Peer Group" (ASPG) comparison focuses on a fund's standing relative to a subset of non-Fidelity funds within the Total Mapped Group that are similar in size and management fee structure without taking into account performance adjustments, if any. For example, if a fund is in the first quartile of the ASPG, the fund's management fee ranks in the least expensive or lowest 25% of funds in the ASPG. The ASPG represents at least 15% of the funds in the Total Mapped Group with comparable asset size and management fee structures, subject to a minimum of 50 funds (or all funds in the Total Mapped Group if fewer than 50). Additional information, such as the ASPG quartile in which the fund's management fee rate ranked and the impact of the fund's performance adjustment, is also included in the chart and considered by the Board.
Annual Report
Board Approval of Investment Advisory Contracts and
Management Fees - continued
Fidelity International Small Cap Fund
Annual Report

The Board noted that the fund's management fee rate ranked below the median of its Total Mapped Group and below the median of its ASPG for 2014. The Board also noted the effect of the fund's performance adjustment, if any, on the fund's management fee ranking.
Furthermore, the Board considered that shareholders approved a prospective change in the index used to calculate the fund's performance adjustment, beginning April 1, 2014. The Board also considered that, because the performance adjustment is based on a rolling 36-month measurement period, during a transition period the fund's performance is compared to a blended index return that reflects the performance of the former index for the portion of the measurement period prior to April 1, 2014 and the performance of the current index for the remainder of the measurement period. The Board noted that the fund's performance adjustment for 2014 shown in the chart above reflects the effect of using the blended index return to calculate the fund's performance adjustment.
The Board noted that, in 2014, the ad hoc Committee on Group Fee was formed by it and other Fidelity fund boards to conduct an in-depth review of the "group fee" component of the management fee of funds with such management fee structures. Committee focus included the mechanics of the group fee, the competitive landscape of group fee structures, Fidelity funds with no group fee component and investment products not included in group fee assets. The Board also considered that, for funds subject to the group fee, FMR agreed to voluntarily waive fees over a specified period of time in amounts designed to account for assets converted from certain funds to certain collective investment trusts.
Annual Report
Board Approval of Investment Advisory Contracts and
Management Fees - continued
The Board also noted that, in 2013, the ad hoc Committee on Management Fees was formed to conduct an in-depth review of the management fee rates of Fidelity's active equity mutual funds. The Committee focused on the following areas: (i) standard fee structures; (ii) research consumption and trading evolution; (iii) management fee competitiveness/profitability by category; and (iv) factors that drive institutional pricing.
Based on its review, the Board concluded that the fund's management fee is fair and reasonable in light of the services that the fund receives and the other factors considered.
Total Expense Ratio. In its review of each class's total expense ratio, the Board considered the fund's management fee as well as other fund or class expenses, as applicable, such as transfer agent fees, pricing and bookkeeping fees, fund-paid 12b-1 fees, and custodial, legal, and audit fees. The Board noted the impact of the fund's performance adjustment. The Board also noted that Fidelity may agree to waive fees and expenses from time to time, and the extent to which, if any, it has done so for the fund. As part of its review, the Board also considered the current and historical total expense ratios of each class of the fund compared to competitive fund median expenses. Each class of the fund is compared to those funds and classes in the Total Mapped Group (used by the Board for management fee comparisons) that have a similar sales load structure.
The Board noted that the total expense ratio of each of Class A, Class B, Class C, Class I, and the retail class ranked below its competitive median for 2014 and the total expense ratio of Class T ranked above its competitive median for 2014. The Board considered that, in general, various factors can affect total expense ratios. The Board noted that the total expense ratio of Class T was above the competitive median primarily because of higher 12b-1 fees on Class T as compared to most competitor funds. Class T has a higher 12b-1 fee, but a lower front-end sales charge, than traditionally priced front-end sales charge classes. The Board considered that Class T is primarily sold load-waived in the retirement plan market where its 0.50% 12b-1 fee is comparable to competing no-load, higher 12b-1 fee classes designed specifically for retirement plans. The Board noted that the fund offers multiple classes, each of which has a different sales load and 12b-1 fee structure, and that the multiple structures are intended to offer a range of pricing options for the intermediary market. The Board also noted that the total expense ratios of the classes vary primarily by the level of their 12b-1 fees, although differences in transfer agent fees may also cause expenses to vary from class to class.
Fees Charged to Other Fidelity Clients. The Board also considered Fidelity fee structures and other information with respect to clients of Fidelity, such as other funds advised or subadvised by Fidelity, pension plan clients, and other institutional clients with similar mandates. The Board noted the findings of the 2013 ad hoc joint committee (created with the board of other Fidelity funds), which reviewed and compared Fidelity's institutional investment advisory business with its business of providing services to the Fidelity funds, including the differences in services provided, fees charged, and costs incurred, as well as competition in their respective marketplaces.
Annual Report
Based on its review of total expense ratios and fees charged to other Fidelity clients, the Board concluded that, although Class T was above the median of the universe presented for comparison, the total expense ratio of each class of the fund was reasonable in light of the services that the fund and its shareholders receive and the other factors considered.
Costs of the Services and Profitability. The Board considered the revenues earned and the expenses incurred by Fidelity in conducting the business of developing, marketing, distributing, managing, administering and servicing the fund and servicing the fund's shareholders. The Board also considered the level of Fidelity's profits in respect of all the Fidelity funds.
On an annual basis, Fidelity presents to the Board information about the profitability of its relationship with the fund. Fidelity calculates profitability information for each fund, as well as aggregate profitability information for groups of Fidelity funds and all Fidelity funds, using a series of detailed revenue and cost allocation methodologies which originate with the books and records of Fidelity on which Fidelity's audited financial statements are based. The Audit Committee of the Board reviews any significant changes from the prior year's methodologies.
PricewaterhouseCoopers LLP (PwC), independent registered public accounting firm and auditor to Fidelity and certain Fidelity funds, has been engaged annually by the Board as part of the Board's assessment of Fidelity's profitability analysis. PwC's engagement includes the review and assessment of the methodologies used by Fidelity in determining the revenues and expenses attributable to Fidelity's mutual fund business, and completion of agreed-upon procedures in respect of the mathematical accuracy of fund profitability and its conformity to established allocation methodologies. After considering PwC's reports issued under the engagement and information provided by Fidelity, the Board concluded that while other allocation methods may also be reasonable, Fidelity's profitability methodologies are reasonable in all material respects.
The Board also reviewed Fidelity's non-fund businesses and fall-out benefits related to the mutual fund business as well as cases where Fidelity's affiliates may benefit from or be related to the fund's business.
The Board considered the costs of the services provided by and the profits realized by Fidelity in connection with the operation of the fund and was satisfied that the profitability was not excessive.
Economies of Scale. The Board considered whether there have been economies of scale in respect of the management of the Fidelity funds, whether the Fidelity funds (including the fund) have appropriately benefited from any such economies of scale, and whether there is potential for realization of any further economies of scale. The Board considered the extent to which the fund will benefit from economies of scale as assets grow through increased services to the fund, through waivers or reimbursements, or through fee or expense ratio reductions. The Board also noted that in 2013, it and the boards of other Fidelity funds created an ad hoc committee (the Economies of Scale Committee) to analyze whether Fidelity attains economies of scale in respect of the management and servicing of the Fidelity funds, whether the Fidelity funds have appropriately benefited from such economies of scale, and whether there is potential for realization of any further economies of scale.
Annual Report
Board Approval of Investment Advisory Contracts and
Management Fees - continued
The Board recognized that the fund's management contract incorporates a "group fee" structure, which provides for lower group fee rates as total group assets increase, and for higher group fee rates as total group assets decrease (with "group assets" defined to include fund assets under FMR's management plus sector fund assets previously under FMR's management and currently managed by Fidelity SelectCo, LLC). FMR calculates the group fee rates based on a tiered asset "breakpoint" schedule that varies based on asset class. The Board considered that the group fee is designed to deliver the benefits of economies of scale to fund shareholders when total Fidelity fund assets increase, even if assets of any particular fund are unchanged or have declined, because some portion of Fidelity's costs are attributable to services provided to all Fidelity funds, and all funds benefit if those costs can be allocated among more assets. The Board concluded that, given the group fee structure, fund shareholders will benefit from lower management fees as group assets increase at the fund complex level, regardless of whether Fidelity achieves any such economies of scale.
The Board concluded, taking into account the analysis of the Economies of Scale Committee, that economies of scale, if any, are being appropriately shared between fund shareholders and Fidelity.
Additional Information Requested by the Board. In order to develop fully the factual basis for consideration of the Fidelity funds' Advisory Contracts, the Board requested and received additional information on certain topics, including: (i) fund performance trends and Fidelity's long-term strategies for certain funds; (ii) the various share classes employed by Fidelity and the attributes of each class, together with similar information on the distribution and servicing payments made by Fidelity or the funds to third-party participants in the distribution channels; (iii) fund profitability, and fund performance in relation to fund profitability; (iv) the methodology with respect to evaluating competitive fund data and peer group classifications and fee comparisons; (v) annual fund profitability margins, with particular focus on certain funds with negative margins; (vi) the realization of fall-out benefits in certain Fidelity business units; (vii) economies of scale and the way in which they are shared with fund shareholders; (viii) Fidelity's group fee structures, including the group fee schedule of breakpoints; (ix) the impact of cost containment measures on the funds; and (x) the transfer agent fee structure.
Annual Report
Based on its evaluation of all of the conclusions noted above, and after considering all factors it believed relevant, the Board concluded that the advisory fee structures are fair and reasonable, and that the fund's Advisory Contracts should be renewed.
Annual Report
Investment Adviser
Fidelity Management & Research Company
Boston, MA
Investment Sub-Advisers
FMR Co., Inc.
FMR Investment Management
(U.K.) Limited
Fidelity Management & Research
(Hong Kong) Limited
Fidelity Management & Research
(Japan) Limited
FIL Investment Advisors
FIL Investments (Japan) Limited
FIL Investment Advisors (UK) Limited
General Distributor
Fidelity Distributors Corporation
Smithfield, RI
Transfer and Service Agents
Fidelity Investments Institutional Operations Company, Inc.
Boston, MA
Fidelity Service Company, Inc.
Boston, MA
Custodian
The Bank of New York Mellon
New York, NY
(Fidelity Investment logo)(registered trademark)
AISCI-UANN-1215
1.793572.112
ContentsPerformance: The Bottom LineManagement's Discussion of Fund PerformanceShareholder Expense ExampleInvestment Changes (Unaudited)Investments October 31, 2015Financial StatementsNotes to Financial StatementsReport of Independent Registered Public Accounting FirmTrustees and OfficersDistributions (Unaudited)Board Approval of Investment Advisory Contracts and Management FeesContentsPerformance: The Bottom LineManagement's Discussion of Fund PerformanceShareholder Expense ExampleInvestment Changes (Unaudited)Investments October 31, 2015Financial StatementsNotes to Financial StatementsReport of Independent Registered Public Accounting FirmTrustees and OfficersDistributions (Unaudited)Board Approval of Investment Advisory Contracts and Management FeesContentsPerformance: The Bottom LineManagement's Discussion of Fund PerformanceShareholder Expense ExampleInvestment Changes (Unaudited)Investments October 31, 2015Financial StatementsNotes to Financial StatementsReport of Independent Registered Public Accounting FirmTrustees and OfficersDistributions (Unaudited)Board Approval of Investment Advisory Contracts and Management Fees
Fidelity®
Total International Equity
Fund
Annual Report
October 31, 2015
(Fidelity Cover Art)
Contents
Performance | (Click Here) | How the fund has done over time. |
Management's Discussion of Fund Performance | (Click Here) | The Portfolio Manager's review of fund performance and strategy. |
Shareholder Expense Example | (Click Here) | An example of shareholder expenses. |
Investment Changes | (Click Here) | A summary of major shifts in the fund's investments over the past six months. |
Investments | (Click Here) | A complete list of the fund's investments with their market values. |
Financial Statements | (Click Here) | Statements of assets and liabilities, operations, and changes in net assets, as well as financial highlights. |
Notes | (Click Here) | Notes to the financial statements. |
Report of Independent Registered Public Accounting Firm | (Click Here) | |
Trustees and Officers | (Click Here) | |
Distributions | (Click Here) | |
Board Approval of Investment Advisory Contracts and Management Fees | (Click Here) | |
To view a fund's proxy voting guidelines and proxy voting record for the 12-month period ended June 30, visit http://www.fidelity.com/proxyvotingresults or visit the Securities and Exchange Commission's (SEC) web site at http://www.sec.gov. You may also call 1-800-544-8544 to request a free copy of the proxy voting guidelines.
Standard & Poor's, S&P and S&P 500 are registered service marks of The McGraw-Hill Companies, Inc. and have been licensed for use by Fidelity Distributors Corporation.
Other third-party marks appearing herein are the property of their respective owners.
All other marks appearing herein are registered or unregistered trademarks or service marks of FMR LLC or an affiliated company. © 2015 FMR LLC. All rights reserved.
Annual Report
This report and the financial statements contained herein are submitted for the general information of the shareholders of the fund. This report is not authorized for distribution to prospective investors in the fund unless preceded or accompanied by an effective prospectus.
A fund files its complete schedule of portfolio holdings with the SEC for the first and third quarters of each fiscal year on Form N-Q. Forms N-Q are available on the SEC's web site at http://www.sec.gov. A fund's Forms N-Q may be reviewed and copied at the SEC's Public Reference Room in Washington, DC. Information regarding the operation of the SEC's Public Reference Room may be obtained by calling 1-800-SEC-0330. For a complete list of a fund's portfolio holdings, view the most recent holdings listing, semiannual report, or annual report on Fidelity's web site at http://www.fidelity.com, http://www.advisor.fidelity.com, or http://www.401k.com, as applicable.
NOT FDIC INSURED • MAY LOSE VALUE • NO BANK GUARANTEE
Neither the fund nor Fidelity Distributors Corporation is a bank.
Annual Report
Average annual total return reflects the change in the value of an investment, assuming reinvestment of the class' distributions from dividend income and capital gains (the profits earned upon the sale of securities that have grown in value, if any) and assuming a constant rate of performance each year. The $10,000 table and the fund's returns do not reflect the deduction of taxes that a shareholder would pay on fund distributions or the redemption of fund shares. During periods of reimbursement by Fidelity, a fund's total return will be greater than it would be had the reimbursement not occurred. How a fund did yesterday is no guarantee of how it will do tomorrow.
Average Annual Total Returns
Periods ended October 31, 2015 | Past 1
year | Past 5
years | Life of
fund A |
Fidelity® Total International Equity Fund | -0.51% | 4.14% | -0.76% |
A From November 1, 2007.
$10,000 Over Life of Fund
Let's say hypothetically that $10,000 was invested in Fidelity® Total International Equity Fund, a class of the fund, on November 1, 2007, when the fund started. The chart shows how the value of your investment would have changed, and also shows how the MSCI ACWI (All Country World Index) ex USA Index performed over the same period.
Annual Report
Market Recap: International equities suffered a moderate setback for the 12 months ending October 31, 2015, held back by a collapse in commodities prices that hurt resources-related sectors and geographies. The MSCI ACWI (All Country World Index) ex USA Index returned -4.55% for the period, affected also by concerns about global economic growth. Commodity producers remained under pressure for much of the past year, largely related to economic deceleration in China (-1%), the world's second-largest economy and a leading consumer of raw materials. This effect was exacerbated by U.S. dollar strength relative to global currencies, which weighed on commodities priced in dollars and acutely impacted equity returns within regions most exposed to resources prices. The emerging-markets group, for example, returned about -15% this period. Canada, a significant energy producer, returned roughly -17%. Net energy consumer Japan (+9%) was the best-performing region by far. Only about a quarter of the nearly 50 index countries managed a gain this period: Ireland (+19%) - the EU's fastest-growing economy - and Israel (+17%) proved top performers; Greece (-56%) and Brazil (-46%), among the worst. As for sectors, energy (-25%) and materials (-16%) declined sharply, whereas the two consumer sectors each gained about 6%.
Comments from Co-Portfolio Manager Alex Zavratsky: For the year, the fund's share classes (excluding sales charges, if applicable) declined modestly but significantly outpaced the benchmark MSCI ACWI (All Country World Index) ex USA Index. Among sectors, performance versus the benchmark was helped by a substantial underweighting in the struggling energy sector. Security selection in financials, information technology and materials also were notable positives. In country terms, stock picking in various European countries added value, whereas an underweighting in Japan was a modest negative. A fair-value pricing adjustment detracted by 0.59 percentage points. Visa and Mastercard, two U.S.-based payment processors listed within the software & services industry, contributed, as did BGF Retail, a South Korean convenience-store retailer. The fund's underweighting and eventual sale of U.K.-based oil giant and index component Royal Dutch Shell further added value. In contrast, relative detractors included Sands China and Wynn Macau, which encountered significant business challenges. We sold both names in the first half of the period. Also hampering results was Turkey-based Coca-Cola Icecek Sanayi, which owns the Coca-Cola bottling franchise in various emerging markets. Anticipating a worse outlook for the company, we sold the fund's investment.
The views expressed above reflect those of the portfolio manager(s) only through the end of the period as stated on the cover of this report and do not necessarily represent the views of Fidelity or any other person in the Fidelity organization. Any such views are subject to change at any time based upon market or other conditions and Fidelity disclaims any responsibility to update such views. These views may not be relied on as investment advice and, because investment decisions for a Fidelity fund are based on numerous factors, may not be relied on as an indication of trading intent on behalf of any Fidelity fund.
Annual Report
Shareholder Expense Example
As a shareholder of the Fund, you incur two types of costs: (1) transaction costs, including sales charges (loads) on purchase payments or redemption proceeds, redemption fees and (2) ongoing costs, including management fees, distribution and/or service (12b-1) fees and other Fund expenses. This Example is intended to help you understand your ongoing costs (in dollars) of investing in the Fund and to compare these costs with the ongoing costs of investing in other mutual funds.
The Example is based on an investment of $1,000 invested at the beginning of the period and held for the entire period (May 1, 2015 to October 31, 2015).
Actual Expenses
The first line of the accompanying table for each class of the Fund provides information about actual account values and actual expenses. You may use the information in this line, together with the amount you invested, to estimate the expenses that you paid over the period. Simply divide your account value by $1,000.00 (for example, an $8,600 account value divided by $1,000.00 = 8.6), then multiply the result by the number in the first line for a class of the Fund under the heading entitled "Expenses Paid During Period" to estimate the expenses you paid on your account during this period. A small balance maintenance fee of $12.00 that is charged once a year may apply for certain accounts with a value of less than $2,000. This fee is not included in the table below. If it was, the estimate of expenses you paid during the period would be higher, and your ending account value lower, by this amount.
Hypothetical Example for Comparison Purposes
The second line of the accompanying table for each class of the Fund provides information about hypothetical account values and hypothetical expenses based on a Class' actual expense ratio and an assumed rate of return of 5% per year before expenses, which is not the Class' actual return. The hypothetical account values and expenses may not be used to estimate the actual ending account balance or expenses you paid for the period. You may use this information to compare the ongoing costs of investing in the Fund and other funds. To do so, compare this 5% hypothetical example with the 5% hypothetical examples that appear in the shareholder reports of the other funds. A small balance maintenance fee of $12.00 that is charged once a year may apply for certain accounts with a value of less than $2,000. This fee is not included in the table below. If it was, the estimate of expenses you paid during the period would be higher, and your ending account value lower, by this amount. In addition, the Fund, as a shareholder in the underlying Fidelity Central Funds, will indirectly bear its pro-rata share of the fees and expenses incurred by the underlying Fidelity Central Funds. These fees and expenses are not included in the Fund's annualized expense ratio used to calculate the expense estimate in the table below.
Please note that the expenses shown in the table are meant to highlight your ongoing costs only and do not reflect any transaction costs. Therefore, the second line of the table is useful in comparing ongoing costs only, and will not help you determine the relative total costs of owning different funds. In addition, if these transactional costs were included, your costs would have been higher.
Annual Report
Shareholder Expense Example - continued
| Annualized
Expense RatioB | Beginning
Account Value
May 1, 2015 | Ending
Account Value
October 31, 2015 | Expenses Paid
During PeriodC
May 1, 2015
to October 31, 2015 |
Class A | 1.45% | | | |
Actual | | $ 1,000.00 | $ 942.00 | $ 7.10 |
HypotheticalA | | $ 1,000.00 | $ 1,017.90 | $ 7.38 |
Class T | 1.70% | | | |
Actual | | $ 1,000.00 | $ 939.80 | $ 8.31 |
HypotheticalA | | $ 1,000.00 | $ 1,016.64 | $ 8.64 |
Class B | 2.20% | | | |
Actual | | $ 1,000.00 | $ 938.90 | $ 10.75 |
HypotheticalA | | $ 1,000.00 | $ 1,014.12 | $ 11.17 |
Class C | 2.20% | | | |
Actual | | $ 1,000.00 | $ 938.40 | $ 10.75 |
HypotheticalA | | $ 1,000.00 | $ 1,014.12 | $ 11.17 |
Total International Equity | 1.06% | | | |
Actual | | $ 1,000.00 | $ 943.30 | $ 5.19 |
HypotheticalA | | $ 1,000.00 | $ 1,019.86 | $ 5.40 |
Class I | 1.16% | | | |
Actual | | $ 1,000.00 | $ 943.00 | $ 5.68 |
HypotheticalA | | $ 1,000.00 | $ 1,019.36 | $ 5.90 |
A 5% return per year before expenses
B Annualized expense ratio reflects expenses net of applicable fee waivers.
C Expenses are equal to each Class' annualized expense ratio, multiplied by the average account value over the period, multiplied by 184/365 (to reflect the one-half year period).
Annual Report
Investment Changes (Unaudited)
Asset Allocation as of October 31, 2015 |
| % of fund's
net assets | % of fund's net assets
6 months ago |
Stocks | 99.0 | 98.1 |
Short-Term Investments and Net Other Assets (Liabilities) | 1.0 | 1.9 |
Top Ten Stocks as of October 31, 2015 |
| % of fund's
net assets | % of fund's net assets
6 months ago |
Novartis AG (Switzerland, Pharmaceuticals) | 2.3 | 2.1 |
Nestle SA (Switzerland, Food Products) | 2.1 | 2.0 |
Roche Holding AG (participation certificate) (Switzerland, Pharmaceuticals) | 1.3 | 1.6 |
Anheuser-Busch InBev SA NV (Belgium, Beverages) | 1.2 | 1.3 |
Total SA (France, Oil, Gas & Consumable Fuels) | 1.2 | 1.0 |
Taiwan Semiconductor Manufacturing Co. Ltd. (Taiwan, Semiconductors & Semiconductor Equipment) | 1.1 | 1.0 |
Astellas Pharma, Inc. (Japan, Pharmaceuticals) | 1.1 | 0.9 |
Reckitt Benckiser Group PLC (United Kingdom, Household Products) | 1.0 | 0.8 |
Novo Nordisk A/S Series B sponsored ADR (Denmark, Pharmaceuticals) | 1.0 | 0.9 |
Samsung Electronics Co. Ltd. (Korea (South), Technology Hardware, Storage & Peripherals) | 1.0 | 1.1 |
| 13.3 | |
Market Sectors as of October 31, 2015 |
| % of fund's
net assets | % of fund's net assets
6 months ago |
Financials | 22.0 | 22.5 |
Consumer Discretionary | 16.1 | 15.3 |
Health Care | 14.7 | 13.6 |
Consumer Staples | 11.4 | 9.9 |
Information Technology | 11.3 | 11.2 |
Industrials | 11.1 | 11.8 |
Materials | 4.9 | 5.7 |
Energy | 2.9 | 3.4 |
Telecommunication Services | 2.7 | 3.4 |
Utilities | 1.9 | 1.3 |
Annual Report
Investments October 31, 2015
Showing Percentage of Net Assets
Common Stocks - 98.5% |
| Shares | | Value |
Australia - 2.7% |
Amcor Ltd. | 31,976 | | $ 308,850 |
Ansell Ltd. | 36,338 | | 517,089 |
CSL Ltd. | 41,325 | | 2,746,885 |
DuluxGroup Ltd. | 21,387 | | 89,416 |
Imdex Ltd. (a) | 84,227 | | 13,433 |
Macquarie Group Ltd. | 11,325 | | 685,716 |
RCG Corp. Ltd. | 97,518 | | 99,407 |
Sydney Airport unit | 250,875 | | 1,146,526 |
Telstra Corp. Ltd. | 73,830 | | 282,890 |
TFS Corp. Ltd. | 55,935 | | 69,823 |
Transurban Group unit | 177,778 | | 1,317,343 |
Westpac Banking Corp. | 81,623 | | 1,818,073 |
TOTAL AUSTRALIA | | 9,095,451 |
Austria - 0.4% |
Andritz AG | 23,972 | | 1,207,325 |
Zumtobel AG | 2,900 | | 66,012 |
TOTAL AUSTRIA | | 1,273,337 |
Bailiwick of Jersey - 1.1% |
Integrated Diagnostics Holdings PLC (a) | 71,300 | | 392,863 |
Shire PLC | 30,080 | | 2,277,985 |
Wolseley PLC | 18,076 | | 1,061,266 |
TOTAL BAILIWICK OF JERSEY | | 3,732,114 |
Belgium - 1.9% |
Anheuser-Busch InBev SA NV | 33,671 | | 4,017,779 |
Gimv NV | 1,019 | | 47,881 |
KBC Ancora | 4,781 | | 189,898 |
KBC Groep NV | 33,317 | | 2,029,692 |
TOTAL BELGIUM | | 6,285,250 |
Bermuda - 0.5% |
China Gas Holdings Ltd. | 248,000 | | 394,696 |
China Resource Gas Group Ltd. | 124,000 | | 340,138 |
Credicorp Ltd. (United States) | 4,600 | | 520,628 |
PAX Global Technology Ltd. | 303,000 | | 396,221 |
Petra Diamonds Ltd. | 21,800 | | 25,088 |
Vostok New Ventures Ltd. SDR (a) | 9,260 | | 59,070 |
TOTAL BERMUDA | | 1,735,841 |
Brazil - 1.2% |
BB Seguridade Participacoes SA | 64,000 | | 441,431 |
Common Stocks - continued |
| Shares | | Value |
Brazil - continued |
Brasil Foods SA | 36,900 | | $ 575,045 |
Cetip SA - Mercados Organizado | 40,100 | | 354,568 |
Cielo SA | 51,480 | | 488,697 |
FPC Par Corretora de Seguros | 25,500 | | 71,345 |
Kroton Educacional SA | 178,800 | | 457,136 |
Qualicorp SA | 99,500 | | 417,964 |
Smiles SA | 40,400 | | 315,318 |
Ultrapar Participacoes SA | 25,700 | | 446,487 |
Weg SA | 94,900 | | 354,348 |
TOTAL BRAZIL | | 3,922,339 |
British Virgin Islands - 0.1% |
Gem Diamonds Ltd. | 14,373 | | 21,936 |
Mail.Ru Group Ltd. GDR (Reg. S) (a) | 18,700 | | 364,650 |
TOTAL BRITISH VIRGIN ISLANDS | | 386,586 |
Canada - 0.5% |
Cara Operations Ltd. | 3,700 | | 100,338 |
Imperial Oil Ltd. | 17,900 | | 595,617 |
McCoy Global, Inc. | 15,800 | | 35,766 |
New Look Vision Group, Inc. | 2,600 | | 59,651 |
Pason Systems, Inc. | 37,100 | | 545,889 |
Potash Corp. of Saskatchewan, Inc. | 20,100 | | 407,042 |
ShawCor Ltd. Class A | 1,400 | | 29,711 |
TOTAL CANADA | | 1,774,014 |
Cayman Islands - 2.1% |
58.com, Inc. ADR (a) | 8,200 | | 430,418 |
Alibaba Group Holding Ltd. sponsored ADR (a) | 16,100 | | 1,349,663 |
ENN Energy Holdings Ltd. | 78,000 | | 446,834 |
Fu Shou Yuan International Group Ltd. | 494,000 | | 336,826 |
Hengan International Group Co. Ltd. | 48,500 | | 523,724 |
Shenzhou International Group Holdings Ltd. | 79,000 | | 389,310 |
Sino Biopharmaceutical Ltd. | 340,000 | | 422,518 |
TAL Education Group ADR (a) | 10,100 | | 388,345 |
Tencent Holdings Ltd. | 127,600 | | 2,405,181 |
Value Partners Group Ltd. | 48,000 | | 50,828 |
Vipshop Holdings Ltd. ADR (a) | 18,400 | | 377,568 |
TOTAL CAYMAN ISLANDS | | 7,121,215 |
China - 1.8% |
Beijing Capital International Airport Co. Ltd. (H Shares) | 378,000 | | 404,592 |
China Life Insurance Co. Ltd. (H Shares) | 121,000 | | 436,336 |
Common Stocks - continued |
| Shares | | Value |
China - continued |
China Pacific Insurance (Group) Co. Ltd. (H Shares) | 159,400 | | $ 634,953 |
Fuyao Glass Industries Group Co. Ltd. (a) | 146,400 | | 312,977 |
Inner Mongoli Yili Industries Co. Ltd. | 138,900 | | 349,387 |
Jiangsu Hengrui Medicine Co. Ltd. | 47,430 | | 393,525 |
Kweichow Moutai Co. Ltd. | 11,840 | | 399,763 |
PICC Property & Casualty Co. Ltd. (H Shares) | 233,340 | | 529,465 |
Ping An Insurance (Group) Co. of China Ltd. (H Shares) | 182,500 | | 1,024,418 |
Shanghai International Airport Co. Ltd. | 81,800 | | 390,218 |
Weifu High-Technology Co. Ltd. (B Shares) | 108,467 | | 276,545 |
Zhengzhou Yutong Bus Co. Ltd. | 109,150 | | 375,945 |
Zhuzhou CSR Times Electric Co. Ltd. (H Shares) | 62,000 | | 401,353 |
TOTAL CHINA | | 5,929,477 |
Denmark - 1.4% |
Jyske Bank A/S (Reg.) (a) | 20,654 | | 1,008,285 |
Novo Nordisk A/S Series B sponsored ADR | 62,760 | | 3,337,577 |
Spar Nord Bank A/S | 12,631 | | 121,052 |
Topdanmark A/S (a) | 12,300 | | 327,304 |
TOTAL DENMARK | | 4,794,218 |
Egypt - 0.1% |
Commercial International Bank SAE sponsored GDR | 72,000 | | 421,200 |
Finland - 0.6% |
Sampo Oyj (A Shares) | 29,153 | | 1,425,944 |
Tikkurila Oyj | 21,880 | | 401,567 |
TOTAL FINLAND | | 1,827,511 |
France - 6.6% |
Atos Origin SA | 14,974 | | 1,194,620 |
AXA SA | 69,506 | | 1,854,984 |
Capgemini SA | 16,802 | | 1,497,136 |
Havas SA | 85,186 | | 739,094 |
Laurent-Perrier Group SA | 759 | | 65,761 |
LVMH Moet Hennessy - Louis Vuitton SA | 1,925 | | 358,376 |
Orange SA | 71,800 | | 1,265,955 |
Renault SA | 6,811 | | 642,093 |
Safran SA | 20,714 | | 1,573,312 |
Sanofi SA | 30,785 | | 3,105,463 |
Societe Generale Series A | 28,000 | | 1,300,410 |
Total SA (d) | 80,020 | | 3,869,674 |
Unibail-Rodamco | 5,100 | | 1,425,047 |
Vetoquinol SA | 1,500 | | 62,927 |
Common Stocks - continued |
| Shares | | Value |
France - continued |
VINCI SA | 24,800 | | $ 1,673,914 |
Virbac SA | 730 | | 145,578 |
Vivendi SA | 60,352 | | 1,451,877 |
TOTAL FRANCE | | 22,226,221 |
Germany - 3.5% |
alstria office REIT-AG | 4,700 | | 65,612 |
Axel Springer Verlag AG | 9,300 | | 522,996 |
BASF AG | 25,907 | | 2,122,401 |
Bayer AG | 23,512 | | 3,137,501 |
CompuGroup Medical AG | 6,146 | | 181,126 |
Continental AG | 2,483 | | 597,145 |
CTS Eventim AG | 8,680 | | 339,848 |
Fielmann AG | 2,358 | | 165,302 |
Fresenius SE & Co. KGaA | 19,200 | | 1,410,862 |
GEA Group AG | 6,958 | | 279,007 |
Linde AG | 10,749 | | 1,864,627 |
SAP AG | 7,272 | | 573,289 |
Wirecard AG | 7,400 | | 382,499 |
TOTAL GERMANY | | 11,642,215 |
Greece - 0.0% |
Titan Cement Co. SA (Reg.) | 3,144 | | 68,973 |
Hong Kong - 1.3% |
AIA Group Ltd. | 440,600 | | 2,583,384 |
CSPC Pharmaceutical Group Ltd. | 414,000 | | 385,453 |
Guangdong Investment Ltd. | 272,000 | | 382,530 |
Power Assets Holdings Ltd. | 52,500 | | 522,187 |
Techtronic Industries Co. Ltd. | 98,000 | | 358,256 |
TOTAL HONG KONG | | 4,231,810 |
India - 2.6% |
Adani Ports & Special Economic Zone (a) | 85,692 | | 386,907 |
Amara Raja Batteries Ltd. (a) | 23,398 | | 322,574 |
Asian Paints India Ltd. | 31,860 | | 403,764 |
Axis Bank Ltd. (a) | 43,505 | | 315,084 |
Bharti Infratel Ltd. (a) | 63,942 | | 379,772 |
Colgate-Palmolive (India) | 21,164 | | 308,526 |
Exide Industries Ltd. (a) | 132,621 | | 302,551 |
HCL Technologies Ltd. | 40,668 | | 541,301 |
HDFC Bank Ltd. (a) | 20,325 | | 407,652 |
Housing Development Finance Corp. Ltd. | 97,642 | | 1,870,341 |
Common Stocks - continued |
| Shares | | Value |
India - continued |
IndusInd Bank Ltd. | 23,714 | | $ 329,947 |
Jyothy Laboratories Ltd. | 20,417 | | 95,766 |
LIC Housing Finance Ltd. (a) | 49,289 | | 359,884 |
Lupin Ltd. | 15,199 | | 447,510 |
Maruti Suzuki India Ltd. (a) | 4,873 | | 331,429 |
Sun Pharmaceutical Industries Ltd. (a) | 45,647 | | 620,302 |
Tata Consultancy Services Ltd. | 19,367 | | 737,882 |
Titan Co. Ltd. (a) | 64,860 | | 351,863 |
Zee Entertainment Enterprises Ltd. | 59,051 | | 368,008 |
TOTAL INDIA | | 8,881,063 |
Indonesia - 0.9% |
PT ACE Hardware Indonesia Tbk | 7,719,100 | | 375,779 |
PT Bank Central Asia Tbk | 641,500 | | 602,643 |
PT Bank Rakyat Indonesia Tbk | 732,100 | | 560,317 |
PT Matahari Department Store Tbk | 325,700 | | 392,139 |
PT Media Nusantara Citra Tbk | 2,620,000 | | 339,948 |
PT Surya Citra Media Tbk | 1,657,100 | | 352,389 |
PT Tower Bersama Infrastructure Tbk (a) | 719,600 | | 374,775 |
TOTAL INDONESIA | | 2,997,990 |
Ireland - 1.6% |
Allergan PLC (a) | 3,100 | | 956,257 |
CRH PLC sponsored ADR | 55,829 | | 1,527,481 |
Dalata Hotel Group PLC (a) | 9,900 | | 49,207 |
FBD Holdings PLC | 5,372 | | 41,056 |
James Hardie Industries PLC: | | | |
CDI | 15,656 | | 202,668 |
sponsored ADR | 132,225 | | 1,738,759 |
Medtronic PLC | 10,100 | | 746,592 |
TOTAL IRELAND | | 5,262,020 |
Isle of Man - 0.1% |
Playtech Ltd. | 35,552 | | 469,148 |
Israel - 0.9% |
Azrieli Group | 11,596 | | 454,351 |
Check Point Software Technologies Ltd. (a) | 4,100 | | 348,254 |
Ituran Location & Control Ltd. | 1,661 | | 33,884 |
Sarine Technologies Ltd. | 30,200 | | 33,568 |
Strauss Group Ltd. (a) | 6,659 | | 95,398 |
Teva Pharmaceutical Industries Ltd. sponsored ADR | 34,109 | | 2,018,912 |
TOTAL ISRAEL | | 2,984,367 |
Common Stocks - continued |
| Shares | | Value |
Italy - 1.1% |
Azimut Holding SpA | 22,414 | | $ 539,535 |
Banco di Desio e della Brianza SpA | 19,000 | | 65,020 |
Beni Stabili SpA SIIQ | 255,326 | | 210,296 |
Interpump Group SpA | 53,691 | | 791,154 |
Intesa Sanpaolo SpA | 273,300 | | 952,093 |
Mediaset SpA | 120,600 | | 612,694 |
Telecom Italia SpA (a) | 361,000 | | 503,625 |
TOTAL ITALY | | 3,674,417 |
Japan - 14.0% |
Aoki Super Co. Ltd. | 6,000 | | 63,459 |
Artnature, Inc. | 12,000 | | 115,385 |
Asahi Co. Ltd. | 7,500 | | 73,666 |
Asia Securities Printing Co. Ltd. | 11,000 | | 81,075 |
Astellas Pharma, Inc. | 241,900 | | 3,511,053 |
Autobacs Seven Co. Ltd. | 5,300 | | 92,939 |
Azbil Corp. | 7,500 | | 189,219 |
Broadleaf Co. Ltd. | 2,800 | | 32,073 |
Coca-Cola Central Japan Co. Ltd. | 27,200 | | 382,279 |
Daiichikosho Co. Ltd. | 3,100 | | 103,391 |
Daikokutenbussan Co. Ltd. | 5,000 | | 171,761 |
DENSO Corp. | 56,500 | | 2,634,182 |
Dentsu, Inc. | 21,800 | | 1,225,555 |
East Japan Railway Co. | 23,900 | | 2,272,307 |
Fast Retailing Co. Ltd. | 2,600 | | 949,734 |
GCA Savvian Group Corp. | 6,400 | | 75,145 |
Glory Ltd. | 4,900 | | 123,967 |
Goldcrest Co. Ltd. | 7,460 | | 139,580 |
Hoya Corp. | 61,000 | | 2,517,273 |
Itochu Corp. | 79,000 | | 988,526 |
Iwatsuka Confectionary Co. Ltd. | 800 | | 41,351 |
Japan Digital Laboratory Co. | 5,700 | | 72,884 |
Japan Tobacco, Inc. | 73,900 | | 2,557,811 |
KDDI Corp. | 50,500 | | 1,222,016 |
Keyence Corp. | 2,921 | | 1,520,697 |
Kobayashi Pharmaceutical Co. Ltd. | 2,000 | | 155,057 |
Koshidaka Holdings Co. Ltd. | 4,000 | | 72,412 |
Lasertec Corp. | 6,200 | | 67,661 |
Makita Corp. | 12,900 | | 706,828 |
Medikit Co. Ltd. | 2,100 | | 62,618 |
Meiko Network Japan Co. Ltd. | 2,700 | | 32,055 |
Miraial Co. Ltd. | 2,400 | | 23,282 |
Common Stocks - continued |
| Shares | | Value |
Japan - continued |
Mitsubishi UFJ Financial Group, Inc. | 372,800 | | $ 2,411,097 |
Mitsui Fudosan Co. Ltd. | 55,000 | | 1,496,751 |
Nagaileben Co. Ltd. | 8,100 | | 138,063 |
ND Software Co. Ltd. | 6,000 | | 69,259 |
Nihon Parkerizing Co. Ltd. | 18,500 | | 164,562 |
Nintendo Co. Ltd. | 3,900 | | 623,480 |
Nippon Prologis REIT, Inc. | 253 | | 444,921 |
Nippon Seiki Co. Ltd. | 2,000 | | 41,912 |
Nippon Telegraph & Telephone Corp. | 43,400 | | 1,591,105 |
NS Tool Co. Ltd. | 3,800 | | 65,977 |
OBIC Co. Ltd. | 19,800 | | 1,044,984 |
Olympus Corp. | 23,900 | | 806,179 |
ORIX Corp. | 72,100 | | 1,052,933 |
OSG Corp. | 26,500 | | 498,470 |
Paramount Bed Holdings Co. Ltd. | 3,200 | | 102,641 |
San-Ai Oil Co. Ltd. | 11,000 | | 84,019 |
Seven & i Holdings Co. Ltd. | 23,200 | | 1,053,856 |
Seven Bank Ltd. | 464,800 | | 2,117,887 |
Shinsei Bank Ltd. | 386,000 | | 809,354 |
SHO-BOND Holdings Co. Ltd. | 22,100 | | 877,702 |
Shoei Co. Ltd. | 5,800 | | 100,171 |
SK Kaken Co. Ltd. | 1,000 | | 97,395 |
Software Service, Inc. | 1,600 | | 60,309 |
Sony Corp. | 29,700 | | 844,235 |
Sony Financial Holdings, Inc. | 47,800 | | 856,700 |
Sumitomo Mitsui Financial Group, Inc. | 45,700 | | 1,823,141 |
Techno Medica Co. Ltd. | 1,800 | | 41,100 |
The Monogatari Corp. | 1,500 | | 63,769 |
The Nippon Synthetic Chemical Industry Co. Ltd. | 10,000 | | 74,067 |
TKC Corp. | 4,000 | | 94,286 |
Tocalo Co. Ltd. | 2,800 | | 56,205 |
Toyota Motor Corp. | 46,600 | | 2,854,923 |
Tsutsumi Jewelry Co. Ltd. | 2,100 | | 41,738 |
USS Co. Ltd. | 122,900 | | 2,169,662 |
Workman Co. Ltd. | 1,900 | | 117,092 |
Yamada Consulting Group Co. Ltd. | 2,000 | | 58,539 |
Yamato Kogyo Co. Ltd. | 3,000 | | 79,911 |
TOTAL JAPAN | | 47,205,636 |
Kenya - 0.2% |
Safaricom Ltd. | 4,194,300 | | 589,791 |
Common Stocks - continued |
| Shares | | Value |
Korea (South) - 2.3% |
AMOREPACIFIC Corp. | 1,794 | | $ 593,145 |
BGFretail Co. Ltd. | 4,899 | | 729,420 |
Coway Co. Ltd. | 5,899 | | 440,189 |
KEPCO Plant Service & Engineering Co. Ltd. | 3,867 | | 352,232 |
Leeno Industrial, Inc. | 1,159 | | 44,410 |
LG Chemical Ltd. | 2,282 | | 608,589 |
LG Household & Health Care Ltd. | 639 | | 529,996 |
NAVER Corp. | 2,349 | | 1,234,399 |
Samsung Electronics Co. Ltd. | 2,749 | | 3,303,317 |
TOTAL KOREA (SOUTH) | | 7,835,697 |
Luxembourg - 0.4% |
Eurofins Scientific SA | 1,000 | | 362,060 |
RTL Group SA | 7,027 | | 607,361 |
Samsonite International SA | 112,800 | | 333,125 |
TOTAL LUXEMBOURG | | 1,302,546 |
Mexico - 1.7% |
Banregio Grupo Financiero S.A.B. de CV | 53,600 | | 289,161 |
Consorcio ARA S.A.B. de CV (a) | 249,855 | | 93,632 |
Fomento Economico Mexicano S.A.B. de CV: unit | 66,500 | | 656,916 |
sponsored ADR | 6,633 | | 657,264 |
Gruma S.A.B. de CV Series B | 26,500 | | 408,944 |
Grupo Aeroportuario del Pacifico SA de CV Series B | 43,100 | | 388,187 |
Grupo Aeroportuario del Sureste SA de CV Series B | 25,935 | | 401,669 |
Grupo Aeroportuario Norte S.A.B. de CV | 66,700 | | 343,074 |
Grupo Financiero Banorte S.A.B. de CV Series O | 118,900 | | 640,288 |
Grupo GICSA SA de CV (a) | 333,500 | | 325,064 |
Infraestructura Energetica Nova S.A.B. de CV | 67,300 | | 324,525 |
Megacable Holdings S.A.B. de CV unit | 96,000 | | 365,860 |
Promotora y Operadora de Infraestructura S.A.B. de CV (a) | 33,700 | | 422,551 |
Tenedora Nemak SA de CV (a) | 275,600 | | 398,605 |
TOTAL MEXICO | | 5,715,740 |
Netherlands - 2.0% |
Aalberts Industries NV | 7,600 | | 247,085 |
Hangzhou Hikvision Digital Technology Co. Ltd. ELS (BNP Paribas Arbitrage Warrant Program) warrants 10/21/16 (a) | 58,600 | | 319,201 |
Heijmans NV (Certificaten Van Aandelen) (a) | 5,881 | | 49,473 |
ING Groep NV (Certificaten Van Aandelen) | 198,723 | | 2,892,188 |
Koninklijke KPN NV | 141,019 | | 516,722 |
Common Stocks - continued |
| Shares | | Value |
Netherlands - continued |
Mylan N.V. | 8,700 | | $ 383,583 |
PostNL NV (a) | 74,300 | | 306,880 |
RELX NV | 108,169 | | 1,849,642 |
VastNed Retail NV | 4,790 | | 233,079 |
TOTAL NETHERLANDS | | 6,797,853 |
Norway - 0.0% |
Kongsberg Gruppen ASA | 4,100 | | 64,177 |
Philippines - 0.9% |
Ayala Corp. | 23,490 | | 391,201 |
GT Capital Holdings, Inc. | 12,765 | | 358,216 |
International Container Terminal Services, Inc. | 214,290 | | 377,807 |
Jollibee Food Corp. | 100,120 | | 440,038 |
Robinsons Land Corp. | 541,800 | | 354,176 |
SM Investments Corp. | 20,660 | | 385,704 |
SM Prime Holdings, Inc. | 874,700 | | 402,756 |
Universal Robina Corp. | 93,880 | | 402,271 |
TOTAL PHILIPPINES | | 3,112,169 |
Russia - 0.2% |
Magnit OJSC (a) | 3,230 | | 563,451 |
Singapore - 0.1% |
UOL Group Ltd. | 82,092 | | 383,104 |
South Africa - 2.1% |
Alexander Forbes Group Holding | 72,146 | | 45,459 |
Aspen Pharmacare Holdings Ltd. | 21,100 | | 473,885 |
Bidvest Group Ltd. | 18,532 | | 474,046 |
Clicks Group Ltd. | 60,379 | | 441,095 |
Discovery Ltd. | 38,167 | | 408,174 |
FirstRand Ltd. | 159,700 | | 586,109 |
Mr Price Group Ltd. | 26,300 | | 403,841 |
Naspers Ltd. Class N | 17,900 | | 2,621,815 |
Sanlam Ltd. | 111,700 | | 504,630 |
Steinhoff International Holdings Ltd. | 96,300 | | 589,463 |
Woolworths Holdings Ltd. | 62,400 | | 462,262 |
TOTAL SOUTH AFRICA | | 7,010,779 |
Spain - 2.6% |
Amadeus IT Holding SA Class A | 37,700 | | 1,606,866 |
Hispania Activos Inmobiliarios SA (a) | 38,400 | | 578,504 |
Iberdrola SA | 263,720 | | 1,884,128 |
Inditex SA | 85,664 | | 3,212,705 |
Common Stocks - continued |
| Shares | | Value |
Spain - continued |
Mediaset Espana Comunicacion SA | 52,300 | | $ 635,792 |
Merlin Properties Socimi SA | 36,100 | | 462,871 |
Prosegur Compania de Seguridad SA (Reg.) | 92,476 | | 411,849 |
TOTAL SPAIN | | 8,792,715 |
Sweden - 2.9% |
ASSA ABLOY AB (B Shares) | 118,500 | | 2,357,330 |
Atlas Copco AB (A Shares) (d) | 40,659 | | 1,061,263 |
Fagerhult AB | 50,855 | | 869,057 |
H&M Hennes & Mauritz AB (B Shares) | 32,638 | | 1,269,450 |
Intrum Justitia AB | 23,463 | | 843,109 |
Nordea Bank AB | 130,467 | | 1,443,092 |
Sandvik AB | 57,900 | | 541,486 |
Svenska Handelsbanken AB (A Shares) | 107,845 | | 1,464,695 |
TOTAL SWEDEN | | 9,849,482 |
Switzerland - 8.4% |
Compagnie Financiere Richemont SA Series A | 4,136 | | 354,652 |
Credit Suisse Group AG (e)(f) | 66,373 | | 1,527,630 |
Nestle SA | 92,983 | | 7,101,483 |
Novartis AG | 86,316 | | 7,819,260 |
Roche Holding AG (participation certificate) | 16,701 | | 4,534,303 |
Schindler Holding AG: | | | |
(participation certificate) | 6,011 | | 976,647 |
(Reg.) | 2,251 | | 366,190 |
Sika AG (Bearer) | 90 | | 295,372 |
Syngenta AG (Switzerland) | 2,018 | | 677,988 |
Tecan Group AG | 600 | | 81,825 |
UBS Group AG | 144,815 | | 2,900,644 |
Zurich Insurance Group AG | 5,815 | | 1,534,579 |
TOTAL SWITZERLAND | | 28,170,573 |
Taiwan - 1.8% |
Addcn Technology Co. Ltd. | 6,500 | | 63,168 |
Advantech Co. Ltd. | 52,000 | | 374,003 |
Catcher Technology Co. Ltd. | 46,000 | | 453,411 |
ECLAT Textile Co. Ltd. | 26,000 | | 383,613 |
Giant Manufacturing Co. Ltd. | 46,000 | | 347,852 |
Largan Precision Co. Ltd. | 6,870 | | 536,438 |
Merida Industry Co. Ltd. | 62,500 | | 366,741 |
Taiwan Semiconductor Manufacturing Co. Ltd. | 853,035 | | 3,594,241 |
TOTAL TAIWAN | | 6,119,467 |
Common Stocks - continued |
| Shares | | Value |
Thailand - 0.3% |
Airports of Thailand PCL (For. Reg.) | 51,200 | | $ 427,983 |
Bangkok Dusit Medical Services PCL (For. Reg.) | 627,000 | | 334,320 |
Thai Beverage PCL | 666,200 | | 320,355 |
TOTAL THAILAND | | 1,082,658 |
Turkey - 0.5% |
Koc Holding A/S | 91,000 | | 410,990 |
TAV Havalimanlari Holding A/S | 49,000 | | 384,887 |
Tofas Turk Otomobil Fabrikasi A/S | 49,916 | | 329,589 |
Tupras Turkiye Petrol Rafinelleri A/S (a) | 15,000 | | 396,172 |
TOTAL TURKEY | | 1,521,638 |
United Arab Emirates - 0.2% |
DP World Ltd. | 19,778 | | 399,713 |
First Gulf Bank PJSC | 103,339 | | 347,464 |
TOTAL UNITED ARAB EMIRATES | | 747,177 |
United Kingdom - 15.7% |
AA PLC | 19,973 | | 85,259 |
Al Noor Hospitals Group PLC | 1,200 | | 21,755 |
Associated British Foods PLC | 26,500 | | 1,411,450 |
AstraZeneca PLC (United Kingdom) | 33,388 | | 2,127,903 |
Aviva PLC | 183,905 | | 1,374,428 |
Babcock International Group PLC | 57,323 | | 851,878 |
BAE Systems PLC | 291,421 | | 1,971,315 |
Barclays PLC | 484,356 | | 1,725,655 |
Bellway PLC | 6,328 | | 253,246 |
Berendsen PLC | 61,555 | | 972,655 |
BG Group PLC | 48,500 | | 766,229 |
BP PLC sponsored ADR | 68,828 | | 2,457,160 |
Britvic PLC | 13,817 | | 148,889 |
Bunzl PLC | 43,632 | | 1,250,421 |
Compass Group PLC | 76,607 | | 1,316,944 |
Dechra Pharmaceuticals PLC | 9,100 | | 136,007 |
Derwent London PLC | 1,600 | | 95,703 |
DP Poland PLC (a) | 200,000 | | 69,757 |
Elementis PLC | 39,508 | | 142,884 |
Great Portland Estates PLC | 13,972 | | 191,592 |
H&T Group PLC | 10,000 | | 30,215 |
Hilton Food Group PLC | 5,400 | | 38,710 |
Howden Joinery Group PLC | 22,200 | | 158,660 |
HSBC Holdings PLC sponsored ADR | 58,966 | | 2,303,802 |
Imperial Tobacco Group PLC | 40,224 | | 2,169,706 |
Common Stocks - continued |
| Shares | | Value |
United Kingdom - continued |
Informa PLC | 217,724 | | $ 1,906,454 |
InterContinental Hotel Group PLC | 8,700 | | 347,647 |
InterContinental Hotel Group PLC ADR | 67,196 | | 2,679,776 |
ITE Group PLC | 29,900 | | 64,647 |
ITV PLC | 398,719 | | 1,551,415 |
Johnson Matthey PLC | 16,090 | | 641,192 |
JUST EAT Ltd. (a) | 14,240 | | 93,517 |
Liberty Global PLC LiLAC: | | | |
Class A (a) | 13,900 | | 618,828 |
Class A (a) | 4,450 | | 171,859 |
Lloyds Banking Group PLC | 2,410,900 | | 2,736,401 |
Meggitt PLC | 60,187 | | 328,085 |
Micro Focus International PLC | 34,100 | | 660,261 |
Mondi PLC | 18,300 | | 424,298 |
National Grid PLC | 119,880 | | 1,707,677 |
NMC Health PLC | 24,000 | | 281,928 |
Prudential PLC | 130,848 | | 3,056,151 |
Reckitt Benckiser Group PLC | 35,751 | | 3,488,959 |
Rightmove PLC | 7,500 | | 443,865 |
Rio Tinto PLC | 55,584 | | 2,025,774 |
Rolls-Royce Group PLC | 43,252 | | 457,369 |
SABMiller PLC | 39,863 | | 2,455,039 |
Shaftesbury PLC | 41,837 | | 606,584 |
Spectris PLC | 7,170 | | 184,258 |
Spirax-Sarco Engineering PLC | 6,199 | | 290,609 |
Taylor Wimpey PLC | 29,400 | | 89,740 |
Ted Baker PLC | 3,375 | | 157,492 |
Topps Tiles PLC | 29,400 | | 65,945 |
Ultra Electronics Holdings PLC | 5,901 | | 153,102 |
Unite Group PLC | 67,977 | | 696,876 |
Vodafone Group PLC sponsored ADR | 66,926 | | 2,206,550 |
TOTAL UNITED KINGDOM | | 52,664,521 |
United States of America - 9.2% |
A.O. Smith Corp. | 4,900 | | 376,418 |
Alphabet, Inc.: | | | |
Class A (a) | 2,180 | | 1,607,510 |
Class C | 542 | | 385,259 |
Altria Group, Inc. | 13,200 | | 798,204 |
ANSYS, Inc. (a) | 500 | | 47,655 |
Apple, Inc. | 3,300 | | 394,350 |
Autoliv, Inc. | 13,854 | | 1,679,659 |
Common Stocks - continued |
| Shares | | Value |
United States of America - continued |
Berkshire Hathaway, Inc. Class B (a) | 8,216 | | $ 1,117,540 |
BorgWarner, Inc. | 17,694 | | 757,657 |
Broadridge Financial Solutions, Inc. | 1,340 | | 79,837 |
Chevron Corp. | 7,400 | | 672,512 |
China Biologic Products, Inc. (a) | 10,700 | | 1,219,158 |
Cognizant Technology Solutions Corp. Class A (a) | 5,100 | | 347,361 |
Constellation Brands, Inc. Class A (sub. vtg.) | 9,100 | | 1,226,680 |
Domino's Pizza, Inc. | 4,000 | | 426,680 |
Ecolab, Inc. | 3,000 | | 361,050 |
Edgewell Personal Care Co. (a) | 5,600 | | 474,376 |
Facebook, Inc. Class A (a) | 3,100 | | 316,107 |
International Flavors & Fragrances, Inc. | 3,000 | | 348,180 |
Kennedy-Wilson Holdings, Inc. | 7,473 | | 183,238 |
Martin Marietta Materials, Inc. | 4,870 | | 755,581 |
MasterCard, Inc. Class A | 27,690 | | 2,741,033 |
McGraw Hill Financial, Inc. | 19,500 | | 1,806,480 |
MercadoLibre, Inc. (d) | 3,600 | | 354,132 |
Mettler-Toledo International, Inc. (a) | 1,220 | | 379,408 |
Mohawk Industries, Inc. (a) | 8,715 | | 1,703,783 |
Moody's Corp. | 9,200 | | 884,672 |
NIKE, Inc. Class B | 2,500 | | 327,575 |
Philip Morris International, Inc. | 17,300 | | 1,529,320 |
PPG Industries, Inc. | 3,500 | | 364,910 |
PriceSmart, Inc. | 8,685 | | 746,736 |
ResMed, Inc. | 11,220 | | 646,384 |
ResMed, Inc. CDI | 83,728 | | 475,587 |
Sherwin-Williams Co. | 2,700 | | 720,441 |
SS&C Technologies Holdings, Inc. | 21,954 | | 1,627,889 |
Visa, Inc. Class A | 39,424 | | 3,058,514 |
TOTAL UNITED STATES OF AMERICA | | 30,941,876 |
TOTAL COMMON STOCKS (Cost $282,399,968) |
331,207,827
|
Nonconvertible Preferred Stocks - 0.5% |
| | | |
Brazil - 0.2% |
Ambev SA sponsored ADR | 157,100 | | 765,077 |
Nonconvertible Preferred Stocks - continued |
| Shares | | Value |
Germany - 0.3% |
Sartorius AG (non-vtg.) | 1,150 | | $ 260,254 |
Volkswagen AG | 4,790 | | 574,968 |
TOTAL GERMANY | | 835,222 |
United Kingdom - 0.0% |
Rolls-Royce Group PLC | 4,009,460 | | 6,181 |
TOTAL NONCONVERTIBLE PREFERRED STOCKS (Cost $2,079,611) |
1,606,480
|
Money Market Funds - 1.8% |
| | | |
Fidelity Cash Central Fund, 0.18% (b) | 4,847,966 | | 4,847,966 |
Fidelity Securities Lending Cash Central Fund, 0.19% (b)(c) | 1,178,838 | | 1,178,838 |
TOTAL MONEY MARKET FUNDS (Cost $6,026,804) |
6,026,804
|
TOTAL INVESTMENT PORTFOLIO - 100.8% (Cost $290,506,383) | | 338,841,111 |
NET OTHER ASSETS (LIABILITIES) - (0.8)% | | (2,647,738) |
NET ASSETS - 100% | $ 336,193,373 |
Legend |
(a) Non-income producing |
(b) Affiliated fund that is generally available only to investment companies and other accounts managed by Fidelity Investments. The rate quoted is the annualized seven-day yield of the fund at period end. A complete unaudited listing of the fund's holdings as of its most recent quarter end is available upon request. In addition, each Fidelity Central Fund's financial statements, which are not covered by the Fund's Report of Independent Registered Public Accounting Firm, are available on the SEC's website or upon request. |
(c) Investment made with cash collateral received from securities on loan. |
(d) Security or a portion of the security is on loan at period end. |
(e) Security or a portion of the security purchased on a delayed delivery or when-issued basis. |
(f) Restricted securities - Investment in securities not registered under the Securities Act of 1933 (excluding 144A issues). At the end of the period, the value of restricted securities (excluding 144A issues) amounted to $1,527,630 or 0.5% of net assets. |
Additional information on each restricted holding is as follows: |
Security | Acquisition Date | Acquisition Cost |
Credit Suisse Group AG | 10/21/15 | $ 1,573,804 |
Affiliated Central Funds |
Information regarding fiscal year to date income earned by the Fund from investments in Fidelity Central Funds is as follows: |
Fund | Income earned |
Fidelity Cash Central Fund | $ 6,824 |
Fidelity Securities Lending Cash Central Fund | 66,496 |
Total | $ 73,320 |
Other Information |
Categorizations in the Schedule of Investments are based on country or territory of incorporation. |
The following is a summary of the inputs used, as of October 31, 2015, involving the Fund's assets and liabilities carried at fair value. The inputs or methodology used for valuing securities may not be an indication of the risk associated with investing in those securities. For more information on valuation inputs, and their aggregation into the levels used in the tables below, please refer to the Investment Valuation section in the accompanying Notes to Financial Statements. |
Valuation Inputs at Reporting Date: |
Description | Total | Level 1 | Level 2 | Level 3 |
Investments in Securities: | | | | |
Equities: | | | | |
Consumer Discretionary | $ 54,054,675 | $ 32,872,185 | $ 21,182,490 | $ - |
Consumer Staples | 38,629,594 | 17,080,622 | 21,548,972 | - |
Energy | 9,899,236 | 5,179,314 | 4,719,922 | - |
Financials | 72,564,874 | 29,512,803 | 43,052,071 | - |
Health Care | 50,571,004 | 15,643,544 | 34,927,460 | - |
Industrials | 37,121,641 | 17,589,943 | 19,531,698 | - |
Information Technology | 37,989,345 | 26,072,664 | 11,916,681 | - |
Materials | 17,048,022 | 10,717,970 | 6,330,052 | - |
Telecommunication Services | 8,933,201 | 2,796,341 | 6,136,860 | - |
Utilities | 6,002,715 | 2,208,653 | 3,794,062 | - |
Money Market Funds | 6,026,804 | 6,026,804 | - | - |
Total Investments in Securities: | $ 338,841,111 | $ 165,700,843 | $ 173,140,268 | $ - |
The following is a summary of transfers between Level 1 and Level 2 for the period ended October 31, 2015. Transfers are assumed to have occurred at the beginning of the period, and are primarily attributable to the valuation techniques used for foreign equity securities, as discussed in the accompanying Notes to Financial Statements: |
Transfers | Total |
Level 1 to Level 2 | $ 21,750,246 |
Level 2 to Level 1 | $ 5,233,388 |
See accompanying notes which are an integral part of the financial statements.
Annual Report
Statement of Assets and Liabilities
| | October 31, 2015 |
| | |
Assets | | |
Investment in securities, at value (including securities loaned of $1,139,521) - See accompanying schedule: Unaffiliated issuers (cost $284,479,579) | $ 332,814,307 | |
Fidelity Central Funds (cost $6,026,804) | 6,026,804 | |
Total Investments (cost $290,506,383) | | $ 338,841,111 |
Cash | | 1,590 |
Foreign currency held at value (cost $175,669) | | 175,634 |
Receivable for investments sold | | 1,013,105 |
Receivable for fund shares sold | | 44,564 |
Dividends receivable | | 857,236 |
Distributions receivable from Fidelity Central Funds | | 1,951 |
Prepaid expenses | | 952 |
Receivable from investment adviser for expense reductions | | 1,548 |
Other receivables | | 19,861 |
Total assets | | 340,957,552 |
| | |
Liabilities | | |
Payable for investments purchased | | |
Regular delivery | $ 1,536,109 | |
Delayed delivery | 1,527,630 | |
Payable for fund shares redeemed | 123,606 | |
Accrued management fee | 222,046 | |
Distribution and service plan fees payable | 10,393 | |
Other affiliated payables | 48,898 | |
Other payables and accrued expenses | 116,659 | |
Collateral on securities loaned, at value | 1,178,838 | |
Total liabilities | | 4,764,179 |
| | |
Net Assets | | $ 336,193,373 |
Net Assets consist of: | | |
Paid in capital | | $ 314,144,944 |
Undistributed net investment income | | 3,560,437 |
Accumulated undistributed net realized gain (loss) on investments and foreign currency transactions | | (29,842,964) |
Net unrealized appreciation (depreciation) on investments and assets and liabilities in foreign currencies | | 48,330,956 |
Net Assets | | $ 336,193,373 |
See accompanying notes which are an integral part of the financial statements.
Annual Report
Financial Statements - continued
Statement of Assets and Liabilities - continued
| | October 31, 2015 |
| | |
Calculation of Maximum Offering Price | | |
Class A: | | |
Net Asset Value and redemption price per share ($9,162,555 ÷ 1,176,591 shares) | | $ 7.79 |
| | |
Maximum offering price per share (100/94.25 of $7.79) | | $ 8.27 |
Class T: | | |
Net Asset Value and redemption price per share ($13,961,648 ÷ 1,786,816 shares) | | $ 7.81 |
| | |
Maximum offering price per share (100/96.50 of $7.81) | | $ 8.09 |
Class B: | | |
Net Asset Value and offering price per share ($120,373 ÷ 15,363 shares)A | | $ 7.84 |
| | |
Class C: | | |
Net Asset Value and offering price per share ($3,311,463 ÷ 426,307 shares)A | | $ 7.77 |
| | |
Total International Equity: | | |
Net Asset Value, offering price and redemption price per share ($307,035,025 ÷ 39,274,070 shares) | | $ 7.82 |
| | |
Class I: | | |
Net Asset Value, offering price and redemption price per share ($2,602,309 ÷ 334,453 shares) | | $ 7.78 |
A Redemption price per share is equal to net asset value less any applicable contingent deferred sales charge.
See accompanying notes which are an integral part of the financial statements.
Annual Report
Statement of Operations
| Year ended October 31, 2015 |
| | |
Investment Income | | |
Dividends | | $ 8,666,142 |
Interest | | 9 |
Income from Fidelity Central Funds | | 73,320 |
Income before foreign taxes withheld | | 8,739,471 |
Less foreign taxes withheld | | (693,695) |
Total income | | 8,045,776 |
| | |
Expenses | | |
Management fee | | |
Basic fee | $ 2,445,747 | |
Performance adjustment | 351,396 | |
Transfer agent fees | 439,574 | |
Distribution and service plan fees | 123,737 | |
Accounting and security lending fees | 181,662 | |
Custodian fees and expenses | 211,850 | |
Independent trustees' compensation | 1,490 | |
Registration fees | 75,502 | |
Audit | 84,991 | |
Legal | 902 | |
Miscellaneous | 2,736 | |
Total expenses before reductions | 3,919,587 | |
Expense reductions | (44,429) | 3,875,158 |
Net investment income (loss) | | 4,170,618 |
Realized and Unrealized Gain (Loss) | | |
Net realized gain (loss) on: | | |
Investment securities: | | |
Unaffiliated issuers (net of foreign taxes of $103,574) | (5,650,183) | |
Foreign currency transactions | (202,557) | |
Total net realized gain (loss) | | (5,852,740) |
Change in net unrealized appreciation (depreciation) on: Investment securities (net of decrease in deferred foreign taxes of $193,627) | (608,996) | |
Assets and liabilities in foreign currencies | 50,417 | |
Total change in net unrealized appreciation (depreciation) | | (558,579) |
Net gain (loss) | | (6,411,319) |
Net increase (decrease) in net assets resulting from operations | | $ (2,240,701) |
See accompanying notes which are an integral part of the financial statements.
Annual Report
Financial Statements - continued
Statement of Changes in Net Assets
| Year ended
October 31,
2015 | Year ended
October 31,
2014 |
Increase (Decrease) in Net Assets | | |
Operations | | |
Net investment income (loss) | $ 4,170,618 | $ 7,173,996 |
Net realized gain (loss) | (5,852,740) | 5,639,847 |
Change in net unrealized appreciation (depreciation) | (558,579) | (11,137,910) |
Net increase (decrease) in net assets resulting from operations | (2,240,701) | 1,675,933 |
Distributions to shareholders from net investment income | (5,482,469) | (5,090,375) |
Distributions to shareholders from net realized gain | (1,726,810) | (7,679,276) |
Total distributions | (7,209,279) | (12,769,651) |
Share transactions - net increase (decrease) | (4,678,824) | 13,925,925 |
Redemption fees | 1,289 | 3,247 |
Total increase (decrease) in net assets | (14,127,515) | 2,835,454 |
| | |
Net Assets | | |
Beginning of period | 350,320,888 | 347,485,434 |
End of period (including undistributed net investment income of $3,560,437 and undistributed net investment income of $5,238,848, respectively) | $ 336,193,373 | $ 350,320,888 |
See accompanying notes which are an integral part of the financial statements.
Annual Report
Financial Highlights - Fidelity Total International Equity Fund Class A
Years ended October 31, | 2015 | 2014 | 2013 | 2012 | 2011 |
Selected Per-Share Data | | | | | |
Net asset value, beginning of period | $ 8.00 | $ 8.27 | $ 7.31 | $ 6.67 | $ 7.36 |
Income from Investment Operations | | | | | |
Net investment income (loss)C | .07 | .13 | .09 | .13 | .11 |
Net realized and unrealized gain (loss) | (.14) | (.12) | 1.24 | .59 | (.69) |
Total from investment operations | (.07) | .01 | 1.33 | .72 | (.58) |
Distributions from net investment income | (.10) | (.10) | (.13) | (.08) | (.09) |
Distributions from net realized gain | (.04) | (.18) | (.25) | - | (.02) |
Total distributions | (.14) | (.28) | (.37) H | (.08) | (.11) |
Redemption fees added to paid in capitalC, G | - | - | - | - | - |
Net asset value, end of period | $ 7.79 | $ 8.00 | $ 8.27 | $ 7.31 | $ 6.67 |
Total ReturnA, B | (.89)% | .19% | 19.00% | 10.88% | (8.03)% |
Ratios to Average Net AssetsD, F | | | | | |
Expenses before reductions | 1.48% | 1.44% | 1.50% | 1.57% | 1.73% |
Expenses net of fee waivers, if any | 1.45% | 1.44% | 1.45% | 1.45% | 1.45% |
Expenses net of all reductions | 1.44% | 1.44% | 1.43% | 1.42% | 1.42% |
Net investment income (loss) | .86% | 1.63% | 1.21% | 1.88% | 1.44% |
Supplemental Data | | | | | |
Net assets, end of period (000 omitted) | $ 9,163 | $ 9,164 | $ 9,034 | $ 5,767 | $ 4,307 |
Portfolio turnover rateE | 53% | 85% | 89% | 110% | 75% |
A Total returns would have been lower if certain expenses had not been reduced during the applicable periods shown.
B Total returns do not include the effect of the sales charges.
C Calculated based on average shares outstanding during the period.
D Fees and expenses of any underlying Fidelity Central Funds are not included in the Fund's expense ratio. The Fund indirectly bears its proportionate share of the expenses of any underlying Fidelity Central Funds.
E Amount does not include the portfolio activity of any underlying Fidelity Central Funds.
F Expense ratios reflect operating expenses of the class. Expenses before reductions do not reflect amounts reimbursed by the investment adviser or reductions from brokerage service arrangements or reductions from other expense offset arrangements and do not represent the amount paid by the class during periods when reimbursements or reductions occur. Expenses net of fee waivers reflect expenses after reimbursement by the investment adviser but prior to reductions from brokerage service arrangements or other expense offset arrangements. Expenses net of all reductions represent the net expenses paid by the class.
G Amount represents less than $.005 per share.
H Total distributions of $.37 per share is comprised of distributions from net investment income of $.126 and distributions from net realized gain of $.245 per share.
See accompanying notes which are an integral part of the financial statements.
Annual Report
Financial Highlights - Fidelity Total International Equity Fund Class T
Years ended October 31, | 2015 | 2014 | 2013 | 2012 | 2011 |
Selected Per-Share Data | | | | | |
Net asset value, beginning of period | $ 8.04 | $ 8.32 | $ 7.37 | $ 6.73 | $ 7.41 |
Income from Investment Operations | | | | | |
Net investment income (loss) C | .05 | .11 | .07 | .11 | .09 |
Net realized and unrealized gain (loss) | (.15) | (.12) | 1.25 | .59 | (.68) |
Total from investment operations | (.10) | (.01) | 1.32 | .70 | (.59) |
Distributions from net investment income | (.09) | (.09) | (.13) | (.06) | (.07) |
Distributions from net realized gain | (.04) | (.18) | (.25) | - | (.02) |
Total distributions | (.13) | (.27) | (.37) H | (.06) | (.09) |
Redemption fees added to paid in capitalC, G | - | - | - | - | - |
Net asset value, end of period | $ 7.81 | $ 8.04 | $ 8.32 | $ 7.37 | $ 6.73 |
Total ReturnA, B | (1.26)% | (.06)% | 18.73% | 10.52% | (8.08)% |
Ratios to Average Net AssetsD, F | | | | | |
Expenses before reductions | 1.70% | 1.68% | 1.75% | 1.84% | 2.02% |
Expenses net of fee waivers, if any | 1.70% | 1.68% | 1.70% | 1.70% | 1.70% |
Expenses net of all reductions | 1.69% | 1.68% | 1.67% | 1.67% | 1.67% |
Net investment income (loss) | .61% | 1.38% | .96% | 1.63% | 1.19% |
Supplemental Data | | | | | |
Net assets, end of period (000 omitted) | $ 13,962 | $ 10,282 | $ 7,909 | $ 2,348 | $ 997 |
Portfolio turnover rateE | 53% | 85% | 89% | 110% | 75% |
A Total returns would have been lower if certain expenses had not been reduced during the applicable periods shown.
B Total returns do not include the effect of the sales charges.
C Calculated based on average shares outstanding during the period.
D Fees and expenses of any underlying Fidelity Central Funds are not included in the Fund's expense ratio. The Fund indirectly bears its proportionate share of the expenses of any underlying Fidelity Central Funds.
E Amount does not include the portfolio activity of any underlying Fidelity Central Funds.
F Expense ratios reflect operating expenses of the class. Expenses before reductions do not reflect amounts reimbursed by the investment adviser or reductions from brokerage service arrangements or reductions from other expense offset arrangements and do not represent the amount paid by the class during periods when reimbursements or reductions occur. Expenses net of fee waivers reflect expenses after reimbursement by the investment adviser but prior to reductions from brokerage service arrangements or other expense offset arrangements. Expenses net of all reductions represent the net expenses paid by the class.
G Amount represents less than $.005 per share.
H Total distributions of $.37 per share is comprised of distributions from net investment income of $.128 and distributions from net realized gain of $.245 per share.
See accompanying notes which are an integral part of the financial statements.
Annual Report
Financial Highlights - Fidelity Total International Equity Fund Class B
Years ended October 31, | 2015 | 2014 | 2013 | 2012 | 2011 |
Selected Per-Share Data | | | | | |
Net asset value, beginning of period | $ 8.05 | $ 8.31 | $ 7.33 | $ 6.68 | $ 7.37 |
Income from Investment Operations | | | | | |
Net investment income (loss) C | .01 | .07 | .04 | .08 | .05 |
Net realized and unrealized gain (loss) | (.14) | (.12) | 1.24 | .59 | (.68) |
Total from investment operations | (.13) | (.05) | 1.28 | .67 | (.63) |
Distributions from net investment income | (.04) | (.03) | (.05) | (.02) | (.04) |
Distributions from net realized gain | (.04) | (.18) | (.25) | - | (.02) |
Total distributions | (.08) | (.21) | (.30) | (.02) | (.06) |
Redemption fees added to paid in capitalC, G | - | - | - | - | - |
Net asset value, end of period | $ 7.84 | $ 8.05 | $ 8.31 | $ 7.33 | $ 6.68 |
Total ReturnA, B | (1.62)% | (.56)% | 18.05% | 10.05% | (8.66)% |
Ratios to Average Net AssetsD, F | | | | | |
Expenses before reductions | 2.26% | 2.22% | 2.26% | 2.34% | 2.51% |
Expenses net of fee waivers, if any | 2.20% | 2.20% | 2.20% | 2.20% | 2.20% |
Expenses net of all reductions | 2.19% | 2.20% | 2.18% | 2.17% | 2.17% |
Net investment income (loss) | .11% | .87% | .46% | 1.13% | .69% |
Supplemental Data | | | | | |
Net assets, end of period (000 omitted) | $ 120 | $ 168 | $ 192 | $ 220 | $ 254 |
Portfolio turnover rateE | 53% | 85% | 89% | 110% | 75% |
A Total returns would have been lower if certain expenses had not been reduced during the applicable periods shown.
B Total returns do not include the effect of the contingent deferred sales charge.
C Calculated based on average shares outstanding during the period.
D Fees and expenses of any underlying Fidelity Central Funds are not included in the Fund's expense ratio. The Fund indirectly bears its proportionate share of the expenses of any underlying Fidelity Central Funds.
E Amount does not include the portfolio activity of any underlying Fidelity Central Funds.
F Expense ratios reflect operating expenses of the class. Expenses before reductions do not reflect amounts reimbursed by the investment adviser or reductions from brokerage service arrangements or reductions from other expense offset arrangements and do not represent the amount paid by the class during periods when reimbursements or reductions occur. Expenses net of fee waivers reflect expenses after reimbursement by the investment adviser but prior to reductions from brokerage service arrangements or other expense offset arrangements. Expenses net of all reductions represent the net expenses paid by the class.
G Amount represents less than $.005 per share.
See accompanying notes which are an integral part of the financial statements.
Annual Report
Financial Highlights - Fidelity Total International Equity Fund Class C
Years ended October 31, | 2015 | 2014 | 2013 | 2012 | 2011 |
Selected Per-Share Data | | | | | |
Net asset value, beginning of period | $ 8.00 | $ 8.28 | $ 7.31 | $ 6.67 | $ 7.36 |
Income from Investment Operations | | | | | |
Net investment income (loss) C | .01 | .07 | .04 | .08 | .05 |
Net realized and unrealized gain (loss) | (.15) | (.12) | 1.25 | .58 | (.69) |
Total from investment operations | (.14) | (.05) | 1.29 | .66 | (.64) |
Distributions from net investment income | (.05) | (.05) | (.08) | (.02) | (.03) |
Distributions from net realized gain | (.04) | (.18) | (.25) | - | (.02) |
Total distributions | (.09) | (.23) | (.32) H | (.02) | (.05) |
Redemption fees added to paid in capitalC, G | - | - | - | - | - |
Net asset value, end of period | $ 7.77 | $ 8.00 | $ 8.28 | $ 7.31 | $ 6.67 |
Total ReturnA, B | (1.73)% | (.57)% | 18.30% | 9.98% | (8.72)% |
Ratios to Average Net AssetsD, F | | | | | |
Expenses before reductions | 2.26% | 2.22% | 2.26% | 2.31% | 2.51% |
Expenses net of fee waivers, if any | 2.20% | 2.20% | 2.20% | 2.20% | 2.20% |
Expenses net of all reductions | 2.19% | 2.20% | 2.18% | 2.17% | 2.17% |
Net investment income (loss) | .11% | .87% | .46% | 1.13% | .69% |
Supplemental Data | | | | | |
Net assets, end of period (000 omitted) | $ 3,311 | $ 4,028 | $ 3,584 | $ 2,737 | $ 1,396 |
Portfolio turnover rateE | 53% | 85% | 89% | 110% | 75% |
A Total returns would have been lower if certain expenses had not been reduced during the applicable periods shown.
B Total returns do not include the effect of the contingent deferred sales charge.
C Calculated based on average shares outstanding during the period.
D Fees and expenses of any underlying Fidelity Central Funds are not included in the Fund's expense ratio. The Fund indirectly bears its proportionate share of the expenses of any underlying Fidelity Central Funds.
E Amount does not include the portfolio activity of any underlying Fidelity Central Funds.
F Expense ratios reflect operating expenses of the class. Expenses before reductions do not reflect amounts reimbursed by the investment adviser or reductions from brokerage service arrangements or reductions from other expense offset arrangements and do not represent the amount paid by the class during periods when reimbursements or reductions occur. Expenses net of fee waivers reflect expenses after reimbursement by the investment adviser but prior to reductions from brokerage service arrangements or other expense offset arrangements. Expenses net of all reductions represent the net expenses paid by the class.
G Amount represents less than $.005 per share.
H Total distributions of $.32 per share is comprised of distributions from net investment income of $.075 and distributions from net realized gain of $.245 per share.
See accompanying notes which are an integral part of the financial statements.
Annual Report
Financial Highlights - Fidelity Total International Equity Fund
Years ended October 31, | 2015 | 2014 | 2013 | 2012 | 2011 |
Selected Per-Share Data | | | | | |
Net asset value, beginning of period | $ 8.03 | $ 8.29 | $ 7.32 | $ 6.69 | $ 7.37 |
Income from Investment Operations | | | | | |
Net investment income (loss) B | .10 | .16 | .12 | .15 | .12 |
Net realized and unrealized gain (loss) | (.14) | (.12) | 1.24 | .58 | (.68) |
Total from investment operations | (.04) | .04 | 1.36 | .73 | (.56) |
Distributions from net investment income | (.13) | (.12) | (.15) | (.10) | (.10) |
Distributions from net realized gain | (.04) | (.18) | (.25) | - | (.02) |
Total distributions | (.17) | (.30) | (.39)G | (.10) | (.12) |
Redemption fees added to paid in capitalB, F | - | - | - | - | - |
Net asset value, end of period | $ 7.82 | $ 8.03 | $ 8.29 | $ 7.32 | $ 6.69 |
Total ReturnA | (.51)% | .55% | 19.48% | 11.03% | (7.70)% |
Ratios to Average Net AssetsC, E | | | | | |
Expenses before reductions | 1.07% | 1.04% | 1.09% | 1.16% | 1.42% |
Expenses net of fee waivers, if any | 1.07% | 1.04% | 1.09% | 1.16% | 1.20% |
Expenses net of all reductions | 1.06% | 1.04% | 1.07% | 1.13% | 1.17% |
Net investment income (loss) | 1.24% | 2.03% | 1.57% | 2.16% | 1.69% |
Supplemental Data | | | | | |
Net assets, end of period (000 omitted) | $ 307,035 | $ 324,438 | $ 324,395 | $ 281,979 | $ 131,338 |
Portfolio turnover rateD | 53% | 85% | 89% | 110% | 75% |
A Total returns would have been lower if certain expenses had not been reduced during the applicable periods shown.
B Calculated based on average shares outstanding during the period.
C Fees and expenses of any underlying Fidelity Central Funds are not included in the Fund's expense ratio. The Fund indirectly bears its proportionate share of the expenses of any underlying Fidelity Central Funds.
D Amount does not include the portfolio activity of any underlying Fidelity Central Funds.
E Expense ratios reflect operating expenses of the class. Expenses before reductions do not reflect amounts reimbursed by the investment adviser or reductions from brokerage service arrangements or reductions from other expense offset arrangements and do not represent the amount paid by the class during periods when reimbursements or reductions occur. Expenses net of fee waivers reflect expenses after reimbursement by the investment adviser but prior to reductions from brokerage service arrangements or other expense offset arrangements. Expenses net of all reductions represent the net expenses paid by the class.
F Amount represents less than $.005 per share.
G Total distributions of $.39 per share is comprised of distributions from net investment income of $.148 and distributions from net realized gain of $.245 per share.
See accompanying notes which are an integral part of the financial statements.
Annual Report
Financial Highlights - Fidelity Total International Equity Fund Class I
Years ended October 31, | 2015 | 2014 | 2013 | 2012 | 2011 |
Selected Per-Share Data | | | | | |
Net asset value, beginning of period | $ 7.99 | $ 8.26 | $ 7.30 | $ 6.67 | $ 7.35 |
Income from Investment Operations | | | | | |
Net investment income (loss) B | .09 | .15 | .11 | .14 | .12 |
Net realized and unrealized gain (loss) | (.14) | (.12) | 1.24 | .59 | (.68) |
Total from investment operations | (.05) | .03 | 1.35 | .73 | (.56) |
Distributions from net investment income | (.12) | (.12) | (.15) | (.10) | (.10) |
Distributions from net realized gain | (.04) | (.18) | (.25) | - | (.02) |
Total distributions | (.16) | (.30) | (.39) G | (.10) | (.12) |
Redemption fees added to paid in capitalB, F | - | - | - | - | - |
Net asset value, end of period | $ 7.78 | $ 7.99 | $ 8.26 | $ 7.30 | $ 6.67 |
Total ReturnA | (.64)% | .37% | 19.40% | 11.06% | (7.72)% |
Ratios to Average Net AssetsC, E | | | | | |
Expenses before reductions | 1.17% | 1.15% | 1.21% | 1.27% | 1.48% |
Expenses net of fee waivers, if any | 1.17% | 1.15% | 1.20% | 1.20% | 1.20% |
Expenses net of all reductions | 1.16% | 1.15% | 1.18% | 1.17% | 1.17% |
Net investment income (loss) | 1.14% | 1.91% | 1.46% | 2.13% | 1.69% |
Supplemental Data | | | | | |
Net assets, end of period (000 omitted) | $ 2,602 | $ 2,240 | $ 2,372 | $ 1,514 | $ 197 |
Portfolio turnover rateD | 53% | 85% | 89% | 110% | 75% |
A Total returns would have been lower if certain expenses had not been reduced during the applicable periods shown.
B Calculated based on average shares outstanding during the period.
C Fees and expenses of any underlying Fidelity Central Funds are not included in the Fund's expense ratio. The Fund indirectly bears its proportionate share of the expenses of any underlying Fidelity Central Funds.
D Amount does not include the portfolio activity of any underlying Fidelity Central Funds.
E Expense ratios reflect operating expenses of the class. Expenses before reductions do not reflect amounts reimbursed by the investment adviser or reductions from brokerage service arrangements or reductions from other expense offset arrangements and do not represent the amount paid by the class during periods when reimbursements or reductions occur. Expenses net of fee waivers reflect expenses after reimbursement by the investment adviser but prior to reductions from brokerage service arrangements or other expense offset arrangements. Expenses net of all reductions represent the net expenses paid by the class.
F Amount represents less than $.005 per share.
G Total distributions of $.39 per share is comprised of distributions from net investment income of $.148 and distributions from net realized gain of $.245 per share.
See accompanying notes which are an integral part of the financial statements.
Annual Report
For the period ended October 31, 2015
1. Organization.
Fidelity Total International Equity Fund (the Fund) is a fund of Fidelity Investment Trust (the Trust) and is authorized to issue an unlimited number of shares. The Trust is registered under the Investment Company Act of 1940, as amended (the 1940 Act), as an open-end management investment company organized as a Massachusetts business trust. The Fund offers Class A, Class T, Class C, Total International Equity and Class I shares (formerly Institutional Class), each of which, along with Class B shares, has equal rights as to assets and voting privileges. Class B shares are closed to new accounts and additional purchases, except for exchanges and reinvestments. Each class has exclusive voting rights with respect to matters that affect that class. Class B shares will automatically convert to Class A shares after a holding period of seven years from the initial date of purchase. The Fund's investments in emerging markets can be subject to social, economic, regulatory, and political uncertainties and can be extremely volatile.
2. Investments in Fidelity Central Funds.
The Fund invests in Fidelity Central Funds, which are open-end investment companies generally available only to other investment companies and accounts managed by the investment adviser and its affiliates. The Fund's Schedule of Investments lists each of the Fidelity Central Funds held as of period end, if any, as an investment of the Fund, but does not include the underlying holdings of each Fidelity Central Fund. As an Investing Fund, the Fund indirectly bears its proportionate share of the expenses of the underlying Fidelity Central Funds.
The Money Market Central Funds seek preservation of capital and current income and are managed by Fidelity Investments Money Management, Inc. (FIMM), an affiliate of the investment adviser. Annualized expenses of the Money Market Central Funds as of their most recent shareholder report date are less than .005%.
A complete unaudited list of holdings for each Fidelity Central Fund is available upon request or at the Securities and Exchange Commission (the SEC) website at www.sec.gov. In addition, the financial statements of the Fidelity Central Funds, which are not covered by the Fund's Report of Independent Registered Public Accounting Firm, are available on the SEC website or upon request.
3. Significant Accounting Policies.
The financial statements have been prepared in conformity with accounting principles generally accepted in the United States of America (GAAP), which require management to make certain estimates and assumptions at the date of the financial statements. Actual results could differ from those estimates. Subsequent events, if any, through the date that the financial statements were issued have been evaluated in the preparation of
Annual Report
3. Significant Accounting Policies - continued
the financial statements. The following summarizes the significant accounting policies of the Fund:
Investment Valuation. Investments are valued as of 4:00 p.m. Eastern time on the last calendar day of the period. The Board of Trustees (the Board) has delegated the day to day responsibility for the valuation of the Fund's investments to the Fidelity Management & Research Company (FMR) Fair Value Committee (the Committee). In accordance with valuation policies and procedures approved by the Board, the Fund attempts to obtain prices from one or more third party pricing vendors or brokers to value its investments. When current market prices, quotations or currency exchange rates are not readily available or reliable, investments will be fair valued in good faith by the Committee, in accordance with procedures adopted by the Board. Factors used in determining fair value vary by investment type and may include market or investment specific events. The frequency with which these procedures are used cannot be predicted and they may be utilized to a significant extent. The Committee oversees the Fund's valuation policies and procedures and reports to the Board on the Committee's activities and fair value determinations. The Board monitors the appropriateness of the procedures used in valuing the Fund's investments and ratifies the fair value determinations of the Committee.
The Fund categorizes the inputs to valuation techniques used to value its investments into a disclosure hierarchy consisting of three levels as shown below:
Level 1 - quoted prices in active markets for identical investments
Level 2 - other significant observable inputs (including quoted prices for similar investments, interest rates, prepayment speeds, etc.)
Level 3 - unobservable inputs (including the Fund's own assumptions based on the best information available)
Valuation techniques used to value the Fund's investments by major category are as follows:
Equity securities, including restricted securities, for which market quotations are readily available, are valued at the last reported sale price or official closing price as reported by a third party pricing vendor on the primary market or exchange on which they are traded and are categorized as Level 1 in the hierarchy. In the event there were no sales during the day or closing prices are not available, securities are valued at the last quoted bid price or may be valued using the last available price and are generally categorized as Level 2 in the hierarchy. For foreign equity securities, when market or security specific events arise, comparisons to the valuation of American Depositary Receipts (ADRs), futures contracts, Exchange-Traded Funds (ETFs) and certain indexes as well as quoted prices for similar securities may be used and would be categorized as Level 2 in the hierarchy. Utilizing these techniques may result in transfers between Level 1 and Level 2.
Annual Report
Notes to Financial Statements - continued
3. Significant Accounting Policies - continued
Investment Valuation - continued
For equity securities, including restricted securities, where observable inputs are limited, assumptions about market activity and risk are used and these securities may be categorized as Level 3 in the hierarchy.
Investments in open-end mutual funds, including the Fidelity Central Funds, are valued at their closing net asset value (NAV) each business day and are categorized as Level 1 in the hierarchy.
Changes in valuation techniques may result in transfers in or out of an assigned level within the disclosure hierarchy. The aggregate value of investments by input level as of October 31, 2015 , including information on transfers between Levels 1 and 2 is included at the end of the Fund's Schedule of Investments.
Foreign Currency. The Fund may use foreign currency contracts to facilitate transactions in foreign-denominated securities. Gains and losses from these transactions may arise from changes in the value of the foreign currency or if the counterparties do not perform under the contracts' terms.
Foreign-denominated assets, including investment securities, and liabilities are translated into U.S. dollars at the exchange rates at period end. Purchases and sales of investment securities, income and dividends received and expenses denominated in foreign currencies are translated into U.S. dollars at the exchange rate in effect on the transaction date.
The effects of exchange rate fluctuations on investments are included with the net realized and unrealized gain (loss) on investment securities. Other foreign currency transactions resulting in realized and unrealized gain (loss) are disclosed separately.
Investment Transactions and Income. For financial reporting purposes, the Fund's investment holdings and NAV include trades executed through the end of the last business day of the period. The NAV per share for processing shareholder transactions is calculated as of the close of business of the New York Stock Exchange (NYSE), normally 4:00 p.m. Eastern time and includes trades executed through the end of the prior business day. Gains and losses on securities sold are determined on the basis of identified cost and may include proceeds received from litigation. Dividend income is recorded on the ex-dividend date, except for certain dividends from foreign securities where the ex-dividend date may have passed, which are recorded as soon as the Fund is informed of the ex-dividend date. Non-cash dividends included in dividend income, if any, are recorded at the fair market value of the securities received. Income and capital gain distributions from Fidelity Central Funds, if any, are recorded on the ex-dividend date.
Annual Report
3. Significant Accounting Policies - continued
Investment Transactions and Income - continued
Distributions received on securities that represent a return of capital or capital gain are recorded as a reduction of cost of investments and/or as a realized gain. Subsequent to ex-dividend date the Fund determines the components of these distributions, based upon receipt of tax filings or other correspondence relating to the underlying investment. Interest income is accrued as earned and includes coupon interest and amortization of premium and accretion of discount on debt securities as applicable. Investment income is recorded net of foreign taxes withheld where recovery of such taxes is uncertain.
Class Allocations and Expenses. Investment income, realized and unrealized capital gains and losses, common expenses of the Fund, and certain fund-level expense reductions, if any, are allocated daily on a pro-rata basis to each class based on the relative net assets of each class to the total net assets of the Fund. Each class differs with respect to transfer agent and distribution and service plan fees incurred. Certain expense reductions may also differ by class. For the reporting period, the allocated portion of income and expenses to each class as a percent of its average net assets may vary due to the timing of recording these transactions in relation to fluctuating net assets of the classes. Expenses directly attributable to a fund are charged to that fund. Expenses attributable to more than one fund are allocated among the respective funds on the basis of relative net assets or other appropriate methods. Expense estimates are accrued in the period to which they relate and adjustments are made when actual amounts are known.
Income Tax Information and Distributions to Shareholders. Each year, the Fund intends to qualify as a regulated investment company under Subchapter M of the Internal Revenue Code, including distributing substantially all of its taxable income and realized gains. As a result, no provision for U.S. Federal income taxes is required. As of October 31, 2015, the Fund did not have any unrecognized tax benefits in the financial statements; nor is the Fund aware of any tax positions for which it is reasonably possible that the total amounts of unrecognized tax benefits will significantly change in the next twelve months. The Fund files a U.S. federal tax return, in addition to state and local tax returns as required. The Fund's federal income tax returns are subject to examination by the Internal Revenue Service (IRS) for a period of three fiscal years after they are filed. State and local tax returns may be subject to examination for an additional fiscal year depending on the jurisdiction. Foreign taxes are provided for based on the Fund's understanding of the tax rules and rates that exist in the foreign markets in which it invests. The Fund is subject to a tax imposed on capital gains by certain countries in which it invests. An estimated deferred tax liability for net unrealized appreciation on the applicable securities is included in Other payables and accrued expenses on the Statement of Assets & Liabilities.
Annual Report
Notes to Financial Statements - continued
3. Significant Accounting Policies - continued
Income Tax Information and Distributions to Shareholders - continued
Distributions are declared and recorded on the ex-dividend date. Income dividends and capital gain distributions are declared separately for each class. Income and capital gain distributions are determined in accordance with income tax regulations, which may differ from GAAP. In addition, the Fund claimed a portion of the payment made to redeeming shareholders as a distribution for income tax purposes.
Capital accounts within the financial statements are adjusted for permanent book-tax differences. These adjustments have no impact on net assets or the results of operations. Capital accounts are not adjusted for temporary book-tax differences which will reverse in a subsequent period.
Book-tax differences are primarily due to foreign currency transactions, partnerships, certain foreign taxes, passive foreign investment companies (PFIC), capital loss carryforwards and losses deferred due to wash sales.
The federal tax cost of investment securities and unrealized appreciation (depreciation) as of period end were as follows:
Gross unrealized appreciation | $ 61,829,134 |
Gross unrealized depreciation | (15,260,483) |
Net unrealized appreciation (depreciation) on securities | $ 46,568,651 |
Tax Cost | $ 292,272,460 |
The tax-based components of distributable earnings as of period end were as follows:
Undistributed ordinary income | $ 3,561,043 |
Capital loss carryforward | $ (28,076,887) |
Net unrealized appreciation (depreciation) on securities and other investments | $ 46,594,811 |
Capital loss carryforwards are only available to offset future capital gains of the Fund to the extent provided by regulations and may be limited. Under the Regulated Investment Company Modernization Act of 2010 (the Act), the Fund is permitted to carry forward capital losses incurred in taxable years beginning after December 22, 2010 for an unlimited period and such capital losses are required to be used prior to any losses that expire. The capital loss carryforward information presented below, including any applicable limitation, is estimated as of fiscal period end and is subject to adjustment.
Fiscal year of expiration | |
2017 | $ (13,607,298) |
2019 | (8,855,997) |
Total with expiration | $ (22,463,295) |
No expiration Short-term | (5,613,592) |
Total Capital Loss carryforward | $ (28,076,887) |
Annual Report
3. Significant Accounting Policies - continued
Income Tax Information and Distributions to Shareholders - continued
Due to large subscriptions in a prior period, $22,463,295 of capital losses that will be available to offset future capital gains of the fund will be limited by approximately $4,535,766 per year.
The tax character of distributions paid was as follows:
| October 31, 2015 | October 31, 2014 |
Ordinary Income | $ 5,482,470 | $ 9,375,496 |
Long-term Capital Gains | 1,726,809 | 3,394,155 |
Total | $ 7,209,279 | $ 12,769,651 |
Short-Term Trading (Redemption) Fees. Shares held by investors in the Fund less than 30 days may have been subject to a redemption fee equal to 1.00% of the NAV of shares redeemed. All redemption fees, which reduce the proceeds of the shareholder redemption, are retained by the Fund and accounted for as an addition to paid in capital.
Delayed Delivery Transactions and When-Issued Securities. During the period, the Fund transacted in securities on a delayed delivery or when-issued basis. Payment and delivery may take place after the customary settlement period for that security. The price of the underlying securities and the date when the securities will be delivered and paid for are fixed at the time the transaction is negotiated. The securities purchased on a delayed delivery or when-issued basis are identified as such in the Fund's Schedule of Investments. With respect to purchase commitments, the Fund identifies securities as segregated in its records with a value at least equal to the amount of the commitment. Losses may arise due to changes in the value of the underlying securities or if the counterparty does not perform under the contract's terms, or if the issuer does not issue the securities due to political, economic, or other factors.
Restricted Securities. The Fund may invest in securities that are subject to legal or contractual restrictions on resale. These securities generally may be resold in transactions exempt from registration or to the public if the securities are registered. Disposal of these securities may involve time-consuming negotiations and expense, and prompt sale at an acceptable price may be difficult. Information regarding restricted securities is included at the end of the Fund's Schedule of Investments.
4. Purchases and Sales of Investments.
Purchases and sales of securities, other than short-term securities, aggregated $182,056,661 and $189,209,209, respectively.
Annual Report
Notes to Financial Statements - continued
5. Fees and Other Transactions with Affiliates.
Management Fee. Fidelity Management & Research Company (the investment adviser) and its affiliates provide the Fund with investment management related services for which the Fund pays a monthly management fee. The management fee is the sum of an individual fund fee rate that is based on an annual rate of .45% of the Fund's average net assets and an annualized group fee rate that averaged .25% during the period. The group fee rate is based upon the average net assets of all the mutual funds advised by the investment adviser, including any mutual funds previously advised by the investment adviser that are currently advised by Fidelity SelectCo, LLC, an affiliate of the investment adviser. The group fee rate decreases as assets under management increase and increases as assets under management decrease. In addition, the management fee is subject to a performance adjustment (up to a maximum of ± .20% of the Fund's average net assets over a 36 month performance period). The upward or downward adjustment to the management fee is based on the relative investment performance of Total International Equity as compared to its benchmark index, the MSCI All Country World ex USA Index, over the same 36 month performance period. For the reporting period, the total annual management fee rate, including the performance adjustment, was .80% of the Fund's average net assets. The performance adjustment included in the management fee rate may be higher or lower than the maximum performance adjustment rate due to the difference between the average net assets for the reporting and performance periods.
Distribution and Service Plan Fees. In accordance with Rule 12b-1 of the 1940 Act, the Fund has adopted separate Distribution and Service Plans for each class of shares. Certain classes pay Fidelity Distributors Corporation (FDC), an affiliate of the investment adviser, separate Distribution and Service Fees, each of which is based on an annual percentage of each class' average net assets. In addition, FDC may pay financial intermediaries for selling shares of the Fund and providing shareholder support services. For the period, the Distribution and Service Fee rates, total fees and amounts retained by FDC were as follows:
| Distribution
Fee | Service
Fee | Total Fees | Retained
by FDC |
Class A | -% | .25% | $ 22,038 | $ 1,374 |
Class T | .25% | .25% | 63,171 | - |
Class B | .75% | .25% | 1,553 | 1,165 |
Class C | .75% | .25% | 36,975 | 5,847 |
| | | $ 123,737 | $ 8,386 |
Sales Load. FDC may receive a front-end sales charge of up to 5.75% for selling Class A shares and 3.50% for selling Class T shares, some of which is paid to financial intermediaries for selling shares of the Fund. Depending on the holding period, FDC may receive contingent deferred sales charges levied on Class A, Class T, Class B, and Class C redemptions. The deferred sales charges range from 5.00% to 1.00% for Class B shares, 1.00% for Class C shares, 1.00% for certain purchases of Class A shares and .25% for certain purchases of Class T shares.
Annual Report
5. Fees and Other Transactions with Affiliates - continued
Sales Load - continued
For the period, sales charge amounts retained by FDC were as follows:
| Retained
by FDC |
Class A | $ 3,738 |
Class T | 1,496 |
Class BA | 66 |
Class C A | 383 |
| $ 5,683 |
A When Class B and Class C shares are initially sold, FDC pays commissions from its own resources to financial intermediaries through which the sales are made.
Transfer Agent Fees. Fidelity Investments Institutional Operations Company, Inc., (FIIOC), an affiliate of the investment adviser, is the transfer, dividend disbursing and shareholder servicing agent for each class of the Fund. FIIOC receives account fees and asset-based fees that vary according to the account size and type of account of the shareholders of the respective classes of the Fund. FIIOC pays for typesetting, printing and mailing of shareholder reports, except proxy statements.
For the period, transfer agent fees for each class were as follows:
| Amount | % of
Class-Level Average
Net Assets |
Class A | $ 23,946 | .27 |
Class T | 30,834 | .24 |
Class B | 468 | .30 |
Class C | 11,173 | .30 |
Total International Equity | 367,738 | .11 |
Class I | 5,415 | .21 |
| $ 439,574 | |
Accounting and Security Lending Fees. Fidelity Service Company, Inc. (FSC), an affiliate of the investment adviser, maintains the Fund's accounting records. The accounting fee is based on the level of average net assets for each month. Under a separate contract, FSC administers the security lending program. The security lending fee is based on the number and duration of lending transactions.
Brokerage Commissions. The Fund placed a portion of its portfolio transactions with brokerage firms which are affiliates of the investment adviser. Brokerage commissions are included in net realized gain (loss) and change in net unrealized appreciation (depreciation) in the Statement of Operations. The commissions paid to these affiliated firms were $462 for the period.
Annual Report
Notes to Financial Statements - continued
6. Committed Line of Credit.
The Fund participates with other funds managed by the investment adviser or an affiliate in a $4.25 billion credit facility (the "line of credit") to be utilized for temporary or emergency purposes to fund shareholder redemptions or for other short-term liquidity purposes. The Fund has agreed to pay commitment fees on its pro-rata portion of the line of credit, which amounted to $504 and is reflected in Miscellaneous expenses on the Statement of Operations. During the period, the Fund did not borrow on this line of credit.
7. Security Lending.
The Fund lends portfolio securities through a lending agent from time to time in order to earn additional income. For equity securities, a lending agent is used and may loan securities to certain qualified borrowers, including Fidelity Capital Markets (FCM), a broker-dealer affiliated with the Fund. On the settlement date of the loan, the Fund receives collateral (in the form of U.S. Treasury obligations, letters of credit and/or cash) against the loaned securities and maintains collateral in an amount not less than 100% of the market value of the loaned securities during the period of the loan. The market value of the loaned securities is determined at the close of business of the Fund and any additional required collateral is delivered to the Fund on the next business day. The Fund or borrower may terminate the loan at any time, and if the borrower defaults on its obligation to return the securities loaned because of insolvency or other reasons, the Fund may apply collateral received from the borrower against the obligation. The Fund may experience delays and costs in recovering the securities loaned. Any cash collateral received is invested in the Fidelity Securities Lending Cash Central Fund. The value of loaned securities and cash collateral at period end are disclosed on the Fund's Statement of Assets and Liabilities. At period end, there were no security loans outstanding with FCM. Security lending income represents the income earned on investing cash collateral, less rebates paid to borrowers and any lending agent fees associated with the loan, plus any premium payments received for lending certain types of securities. Security lending income is presented in the Statement of Operations as a component of income from Fidelity Central Funds. Total security lending income during the period amounted to $66,496, including $53 from securities loaned to FCM.
8. Expense Reductions.
The investment adviser contractually agreed to reimburse each class to the extent annual operating expenses exceeded certain levels of average net assets as noted in the table below. This reimbursement will remain in place through December 31, 2016. Some expenses, for example interest expense, including commitment fees, are excluded from this reimbursement.
Annual Report
8. Expense Reductions - continued
The following classes were in reimbursement during the period:
| Expense
Limitations | Reimbursement |
Class A | 1.45% | $ 2,649 |
Class B | 2.20% | 93 |
Class C | 2.20% | 2,440 |
| | $ 5,182 |
Commissions paid to certain brokers with whom the investment adviser, or its affiliates, places trades on behalf of the Fund include an amount in addition to trade execution, which may be rebated back to the Fund to offset certain expenses. This amount totaled $29,729 for the period.
In addition, during the period the investment adviser reimbursed and/or waived a portion of fund-level operating expenses in the amount of $1,440 and a portion of class-level operating expenses as follows:
| Amount |
Class A | $ 195 |
Class T | 195 |
Class C | 10 |
Total International Equity | 7,625 |
Class I | 53 |
| $ 8,078 |
9. Distributions to Shareholders.
Distributions to shareholders of each class were as follows:
Years ended October 31, | 2015 | 2014 |
From net investment income | | |
Class A | $ 113,499 | $ 114,661 |
Class T | 118,041 | 92,140 |
Class B | 852 | 757 |
Class C | 26,493 | 24,034 |
Total International Equity | 5,189,901 | 4,825,256 |
Class I | 33,683 | 33,527 |
Total | $ 5,482,469 | $ 5,090,375 |
Annual Report
Notes to Financial Statements - continued
9. Distributions to Shareholders - continued
Years ended October 31, | 2015 | 2014 |
From net realized gain | | |
Class A | $ 45,400 | $ 201,491 |
Class T | 52,463 | 179,326 |
Class B | 832 | 4,154 |
Class C | 19,994 | 83,657 |
Total International Equity | 1,596,893 | 7,158,781 |
Class I | 11,228 | 51,867 |
Total | $ 1,726,810 | $ 7,679,276 |
10. Share Transactions.
Share transactions for each class were as follows and may contain automatic conversions between classes or exchanges between funds:
| Shares | Dollars |
Years ended October 31, | 2015 | 2014 | 2015 | 2014 |
Class A | | | | |
Shares sold | 302,437 | 232,039 | $ 2,413,258 | $ 1,877,334 |
Reinvestment of distributions | 20,115 | 38,586 | 158,306 | 306,762 |
Shares redeemed | (290,995) | (217,382) | (2,277,557) | (1,752,622) |
Net increase (decrease) | 31,557 | 53,243 | $ 294,007 | $ 431,474 |
Class T | | | | |
Shares sold | 824,018 | 525,401 | $ 6,637,966 | $ 4,252,382 |
Reinvestment of distributions | 21,537 | 33,829 | 170,355 | 270,968 |
Shares redeemed | (337,655) | (230,852) | (2,691,540) | (1,883,437) |
Net increase (decrease) | 507,900 | 328,378 | $ 4,116,781 | $ 2,639,913 |
Class B | | | | |
Shares sold | 2,293 | 2,568 | $ 19,363 | $ 21,032 |
Reinvestment of distributions | 210 | 604 | 1,675 | 4,866 |
Shares redeemed | (7,999) | (5,357) | (62,934) | (43,506) |
Net increase (decrease) | (5,496) | (2,185) | $ (41,896) | $ (17,608) |
Class C | | | | |
Shares sold | 142,460 | 174,035 | $ 1,136,553 | $ 1,421,548 |
Reinvestment of distributions | 4,767 | 10,201 | 37,661 | 81,608 |
Shares redeemed | (224,769) | (113,485) | (1,823,746) | (922,884) |
Net increase (decrease) | (77,542) | 70,751 | $ (649,532) | $ 580,272 |
Total International Equity | | | | |
Shares sold | 6,834,390 | 7,329,051 | $ 54,586,662 | $ 59,640,689 |
Reinvestment of distributions | 851,193 | 1,486,031 | 6,698,889 | 11,828,806 |
Shares redeemed | (8,793,992) | (7,554,096) | (70,164,751) | (61,144,473) |
Net increase (decrease) | (1,108,409) | 1,260,986 | $ (8,879,200) | $ 10,325,022 |
Annual Report
10. Share Transactions - continued
| Shares | Dollars |
Years ended October 31, | 2015 | 2014 | 2015 | 2014 |
Class I | | | | |
Shares sold | 149,022 | 127,536 | $ 1,222,878 | $ 1,054,194 |
Reinvestment of distributions | 5,728 | 10,120 | 44,910 | 80,252 |
Shares redeemed | (100,501) | (144,685) | (786,772) | (1,167,594) |
Net increase (decrease) | 54,249 | (7,029) | $ 481,016 | $ (33,148) |
11. Other.
The Fund's organizational documents provide former and current trustees and officers with a limited indemnification against liabilities arising in connection with the performance of their duties to the Fund. In the normal course of business, the Fund may also enter into contracts that provide general indemnifications. The Fund's maximum exposure under these arrangements is unknown as this would be dependent on future claims that may be made against the Fund. The risk of material loss from such claims is considered remote.
At the end of the period, a shareholder of record owned approximately 71% of the total outstanding shares of the Fund.
Annual Report
To the Trustees of Fidelity Investment Trust and Shareholders of Fidelity Total International Equity Fund:
We have audited the accompanying statement of assets and liabilities of Fidelity Total International Equity Fund (the Fund), a fund of Fidelity Investment Trust, including the schedule of investments, as of October 31, 2015, and the related statement of operations for the year then ended, the statement of changes in net assets for each of the two years in the period then ended, and the financial highlights for each of the five years in the period then ended. These financial statements and financial highlights are the responsibility of the Fund's management. Our responsibility is to express an opinion on these financial statements and financial highlights based on our audits.
We conducted our audits in accordance with the standards of the Public Company Accounting Oversight Board (United States). Those standards require that we plan and perform the audit to obtain reasonable assurance about whether the financial statements and financial highlights are free of material misstatement. The Fund is not required to have, nor were we engaged to perform, an audit of its internal control over financial reporting. Our audits included consideration of internal control over financial reporting as a basis for designing audit procedures that are appropriate in the circumstances, but not for the purpose of expressing an opinion on the effectiveness of the Fund's internal control over financial reporting. Accordingly, we express no such opinion. An audit also includes examining, on a test basis, evidence supporting the amounts and disclosures in the financial statements, assessing the accounting principles used and significant estimates made by management, as well as evaluating the overall financial statement presentation. Our procedures included confirmation of securities owned as of October 31, 2015, by correspondence with the custodians and brokers; when replies were not received from brokers, we performed other auditing procedures. We believe that our audits provide a reasonable basis for our opinion.
In our opinion, such financial statements and financial highlights referred to above present fairly, in all material respects, the financial position of Fidelity Total International Equity Fund as of October 31, 2015, the results of its operations for the year then ended, the changes in its net assets for each of the two years in the period then ended, and the financial highlights for each of the five years in the period then ended, in conformity with accounting principles generally accepted in the United States of America.
DELOITTE & TOUCHE LLP
Boston, Massachusetts
December 16, 2015
Annual Report
The Trustees, Member of the Advisory Board, and officers of the trust and fund, as applicable, are listed below. The Board of Trustees governs the fund and is responsible for protecting the interests of shareholders. The Trustees are experienced executives who meet periodically throughout the year to oversee the fund's activities, review contractual arrangements with companies that provide services to the fund, oversee management of the risks associated with such activities and contractual arrangements, and review the fund's performance. Each of the Trustees oversees 170 funds.
The Trustees hold office without limit in time except that (a) any Trustee may resign; (b) any Trustee may be removed by written instrument, signed by at least two-thirds of the number of Trustees prior to such removal; (c) any Trustee who requests to be retired or who has become incapacitated by illness or injury may be retired by written instrument signed by a majority of the other Trustees; and (d) any Trustee may be removed at any special meeting of shareholders by a two-thirds vote of the outstanding voting securities of the trust. Each Trustee who is not an interested person (as defined in the 1940 Act) of the trust and the fund (Independent Trustee), shall retire not later than the last day of the calendar year in which his or her 75th birthday occurs. The Independent Trustees may waive this mandatory retirement age policy with respect to individual Trustees. The officers and Advisory Board Member hold office without limit in time, except that any officer and Advisory Board Member may resign or may be removed by a vote of a majority of the Trustees at any regular meeting or any special meeting of the Trustees. Except as indicated, each individual has held the office shown or other offices in the same company for the past five years.
Experience, Skills, Attributes, and Qualifications of the Fund's Trustees. The Governance and Nominating Committee has adopted a statement of policy that describes the experience, qualifications, attributes, and skills that are necessary and desirable for potential Independent Trustee candidates (Statement of Policy). The Board believes that each Trustee satisfied at the time he or she was initially elected or appointed a Trustee, and continues to satisfy, the standards contemplated by the Statement of Policy. The Governance and Nominating Committee also engages professional search firms to help identify potential Independent Trustee candidates who have the experience, qualifications, attributes, and skills consistent with the Statement of Policy. From time to time, additional criteria based on the composition and skills of the current Independent Trustees, as well as experience or skills that may be appropriate in light of future changes to board composition, business conditions, and regulatory or other developments, have also been considered by the professional search firms and the Governance and Nominating Committee. In addition, the Board takes into account the Trustees' commitment and participation in Board and committee meetings, as well as their leadership of standing and ad hoc committees throughout their tenure.
In determining that a particular Trustee was and continues to be qualified to serve as a Trustee, the Board has considered a variety of criteria, none of which, in isolation, was controlling. The Board believes that, collectively, the Trustees have balanced and diverse experience, qualifications, attributes, and skills, which allow the Board to operate effectively in governing the fund and protecting the interests of shareholders. Information about the specific experience, skills, attributes, and qualifications of each Trustee, which in each case led to the Board's conclusion that the Trustee should serve (or continue to serve) as a trustee of the fund, is provided below.
Annual Report
Trustees and Officers - continued
Board Structure and Oversight Function. James C. Curvey is an interested person (as defined in the 1940 Act) and currently serves as Chairman. The Trustees have determined that an interested Chairman is appropriate and benefits shareholders because an interested Chairman has a personal and professional stake in the quality and continuity of services provided to the fund. Independent Trustees exercise their informed business judgment to appoint an individual of their choosing to serve as Chairman, regardless of whether the Trustee happens to be independent or a member of management. The Independent Trustees have determined that they can act independently and effectively without having an Independent Trustee serve as Chairman and that a key structural component for assuring that they are in a position to do so is for the Independent Trustees to constitute a substantial majority for the Board. The Independent Trustees also regularly meet in executive session. Ned C. Lautenbach serves as Chairman of the Independent Trustees and as such (i) acts as a liaison between the Independent Trustees and management with respect to matters important to the Independent Trustees and (ii) with management prepares agendas for Board meetings.
Fidelity funds are overseen by different Boards of Trustees. The fund's Board oversees Fidelity's high income and certain equity funds, and other Boards oversee Fidelity's investment-grade bond, money market, asset allocation, and sector funds. The asset allocation funds may invest in Fidelity funds overseen by the fund's Board. The use of separate Boards, each with its own committee structure, allows the Trustees of each group of Fidelity funds to focus on the unique issues of the funds they oversee, including common research, investment, and operational issues. On occasion, the separate Boards establish joint committees to address issues of overlapping consequences for the Fidelity funds overseen by each Board.
The Trustees operate using a system of committees to facilitate the timely and efficient consideration of all matters of importance to the Trustees, the fund, and fund shareholders and to facilitate compliance with legal and regulatory requirements and oversight of the fund's activities and associated risks. The Board, acting through its committees, has charged FMR and its affiliates with (i) identifying events or circumstances the occurrence of which could have demonstrably adverse effects on the fund's business and/or reputation; (ii) implementing processes and controls to lessen the possibility that such events or circumstances occur or to mitigate the effects of such events or circumstances if they do occur; and (iii) creating and maintaining a system designed to evaluate continuously business and market conditions in order to facilitate the identification and implementation processes described in (i) and (ii) above. Because the day-to-day operations and activities of the fund are carried out by or through FMR, its affiliates and other service providers, the fund's exposure to risks is mitigated but not eliminated by the processes overseen by the Trustees. While each of the Board's committees has responsibility for overseeing different aspects of the fund's activities, oversight is exercised primarily through the Operations, Audit, and Compliance Committees. In addition, the Independent Trustees have worked with FMR to enhance the Board's oversight of investment and financial risks, legal and regulatory risks, technology risks, and operational risks, including the development of additional risk reporting to the Board. For example, a working group comprised of Independent Trustees and FMR has worked and continues to work to review the Fidelity funds' valuation-related activities, reporting and risk management. Appropriate personnel, including but not limited to the fund's Chief Compliance Officer (CCO), FMR's internal auditor, the independent accountants, the fund's Treasurer and portfolio management personnel, make periodic reports to the Board's committees, as appropriate, including an annual review of Fidelity's risk management program for the Fidelity funds. The responsibilities of each standing committee, including their oversight responsibilities, are described further under "Standing Committees of the Fund's Trustees."
Annual Report
The fund's Statement of Additional Information (SAI) includes more information about the Trustees. To request a free copy, call Fidelity at 1-800-544-8544.
Interested Trustees*:
Correspondence intended for each Trustee who is an interested person may be sent to Fidelity Investments, 245 Summer Street, Boston, Massachusetts 02210.
Name, Year of Birth; Principal Occupations and Other Relevant Experience+ |
James C. Curvey (1935) |
Year of Election or Appointment: 2007 Trustee Chairman of the Board of Trustees |
| Mr. Curvey also serves as Trustee of other Fidelity funds. Mr. Curvey is a Director of Fidelity Research & Analysis Co. (investment adviser firm, 2009-present), and Vice Chairman (2007-present) and Director of FMR LLC (diversified financial services company). In addition, Mr. Curvey serves as an Overseer for the Boston Symphony Orchestra and a member of the board of Artis-Naples, Naples, Florida, and as a Trustee for Brewster Academy, Wolfeboro, New Hampshire. Previously, Mr. Curvey served as a Director of Fidelity Investments Money Management, Inc. (investment adviser firm, 2009-2014) and a Director of FMR and FMR Co., Inc. (investment adviser firms, 2007-2014). |
Charles S. Morrison (1960) |
Year of Election or Appointment: 2014 Trustee |
| Mr. Morrison also serves as Trustee of other funds. He serves as a Director of Fidelity Investments Money Management, Inc. (FIMM) (investment adviser firm, 2014-present), Director of Fidelity SelectCo, LLC (investment adviser firm, 2014-present), President, Asset Management (2014-present), and is an employee of Fidelity Investments. Previously, Mr. Morrison served as Vice President of Fidelity's Fixed Income and Asset Allocation Funds (2012-2014), President, Fixed Income (2011-2014), Vice President of Fidelity's Money Market Funds (2005-2009), President, Money Market Group Leader of FMR (investment adviser firm, 2009), and Senior Vice President, Money Market Group of FMR (2004-2009). Mr. Morrison also served as Vice President of Fidelity's Bond Funds (2002-2005), certain Balanced Funds (2002-2005), and certain Asset Allocation Funds (2002-2007), and as Senior Vice President (2002-2005) of Fidelity's Bond Division. |
* Trustees have been determined to be "Interested Trustees" by virtue of, among other things, their affiliation with the trust or various entities under common control with FMR.
+ The information above includes each Trustee's principal occupation during the last five years and other information relating to the experience, attributes, and skills relevant to each Trustee's qualifications to serve as a Trustee, which led to the conclusion that each Trustee should serve as a Trustee for the fund.
Annual Report
Independent Trustees:
Correspondence intended for each Independent Trustee (that is, the Trustees other than the Interested Trustees) may be sent to Fidelity Investments, P.O. Box 55235, Boston, Massachusetts 02205-5235.
Name, Year of Birth; Principal Occupations and Other Relevant Experience+ |
Dennis J. Dirks (1948) |
Year of Election or Appointment: 2005 Trustee |
| Mr. Dirks also serves as Trustee of other Fidelity funds. Prior to his retirement in May 2003, Mr. Dirks was Chief Operating Officer and a member of the Board of The Depository Trust & Clearing Corporation (DTCC). He also served as President, Chief Operating Officer, and Board member of The Depository Trust Company (DTC) and President and Board member of the National Securities Clearing Corporation (NSCC). In addition, Mr. Dirks served as Chief Executive Officer and Board member of the Government Securities Clearing Corporation, Chief Executive Officer and Board member of the Mortgage-Backed Securities Clearing Corporation, as a Trustee and a member of the Finance Committee of Manhattan College (2005-2008), as a Trustee and a member of the Finance Committee of AHRC of Nassau County (2006-2008), and as a member of the Independent Directors Council (IDC) Governing Council (2010-2015). Mr. Dirks is a member of the Board of Directors for The Brookville Center for Children's Services, Inc. (2009-present). |
Alan J. Lacy (1953) |
Year of Election or Appointment: 2008 Trustee |
| Mr. Lacy also serves as Trustee of other Fidelity funds. Mr. Lacy serves as a member of the Board of Directors of Dave & Buster's Entertainment, Inc. (restaurant and entertainment complexes, 2010-present) and Bristol-Myers Squibb Company (global pharmaceuticals, 2008-present). In addition, Mr. Lacy served as Senior Adviser (2007-2014) of Oak Hill Capital Partners, L.P. (private equity) and also served as Chief Executive Officer (2000-2005) and Vice Chairman (2005-2006) of Sears Holdings Corporation and Sears, Roebuck and Co. (retail). Mr. Lacy is a member of the Board of Trustees of The National Parks Conservation Association (2006-present). Previously, Mr. Lacy served as Chairman of the Board of Trustees of the National Parks Conservation Association (2008-2011) and as a member of the Board of Directors for The Western Union Company (global money transfer, 2006-2011), The Hillman Companies, Inc. (hardware wholesalers, 2010-2014), and Earth Fare, Inc. (retail grocery, 2010-2014). |
Ned C. Lautenbach (1944) |
Year of Election or Appointment: 2000 Trustee Chairman of the Independent Trustees |
| Mr. Lautenbach also serves as Trustee of other Fidelity funds. Mr. Lautenbach currently serves as the Lead Director of the Eaton Corporation Board of Directors (diversified industrial, 1997-present). Mr. Lautenbach is Chairman of the Board of Directors of Artis-Naples in Naples, Florida (2012-present), a member of the Council on Foreign Relations (1994-present), and a member of the Board of Governors, State University System of Florida (2013-present). Previously, Mr. Lautenbach was a Partner/Advisory Partner at Clayton, Dubilier & Rice, LLC (private equity investment, 1998-2010), as well as a Director of Sony Corporation (2006-2007). |
Joseph Mauriello (1944) |
Year of Election or Appointment: 2008 Trustee |
| Mr. Mauriello also serves as Trustee of other Fidelity funds. Prior to his retirement in January 2006, Mr. Mauriello served in numerous senior management positions including Deputy Chairman and Chief Operating Officer (2004-2005), and Vice Chairman of Financial Services (2002-2004) of KPMG LLP US (professional services, 1965-2005). Mr. Mauriello currently serves as a member of the Board of Directors of XL Group plc. (global insurance and re-insurance, 2006-present) and the Independent Directors Council (IDC) Governing Council (2015-present). Previously, Mr. Mauriello served as a Director of the Hamilton Funds of the Bank of New York (2006-2007) and of Arcadia Resources Inc. (health care services and products, 2007-2012). |
Robert W. Selander (1950) |
Year of Election or Appointment: 2011 Trustee |
| Mr. Selander also serves as Trustee of other Fidelity funds. Mr. Selander serves as a Director of The Western Union Company (global money transfer, 2014-present). Previously, Mr. Selander served as a Member of the Advisory Board of other Fidelity funds (2011), and Executive Vice Chairman (2010), Chief Executive Officer (2009-2010), and President and Chief Executive Officer (1997-2009) of Mastercard, Inc. |
Cornelia M. Small (1944) |
Year of Election or Appointment: 2005 Trustee |
| Ms. Small also serves as Trustee of other Fidelity funds. Ms. Small is a member of the Board of Directors (2009-present) and Chair of the Investment Committee (2010-present) of the Teagle Foundation. Ms. Small also serves on the Investment Committee of the Berkshire Taconic Community Foundation (2008-present). Previously, Ms. Small served as Chairperson (2002-2008) and a member of the Investment Committee and Chairperson (2008-2012) and a member of the Board of Trustees of Smith College. In addition, Ms. Small served as Chief Investment Officer, Director of Global Equity Investments, and a member of the Board of Directors of Scudder, Stevens & Clark and Scudder Kemper Investments. |
William S. Stavropoulos (1939) |
Year of Election or Appointment: 2001 Trustee Vice Chairman of the Independent Trustees |
| Mr. Stavropoulos also serves as Trustee of other Fidelity funds. Mr. Stavropoulos serves as President and Founder of the Michigan Baseball Foundation, the Great Lakes Loons (2007-present). Mr. Stavropoulos is Chairman Emeritus of the Board of Directors of The Dow Chemical Company, where he previously served in numerous senior management positions, including President, CEO (1995-2000; 2002-2004), Chairman of the Executive Committee (2000-2006), and as a member of the Board of Directors (1990-2006). Currently, Mr. Stavropoulos is Chairman of the Board of Directors of Univar Inc. (global distributor of commodity and specialty chemicals), a Director of Teradata Corporation (data warehousing and technology solutions), and Maersk Inc. (industrial conglomerate), and a member of the Advisory Board for Metalmark Capital LLC (private equity investment, 2005-present). Mr. Stavropoulos is an operating advisor to Clayton, Dubilier & Rice, LLC (private equity investment). In addition, Mr. Stavropoulos is a member of the University of Notre Dame Advisory Council for the College of Science, a Trustee of the Rollin L. Gerstacker Foundation, and a Director of the Naples Philharmonic Center for the Arts. Previously, Mr. Stavropoulos served as a Director of Chemical Financial Corporation (bank holding company, 1993-2012) and Tyco International, Ltd. (multinational manufacturing and services, 2007-2012). |
David M. Thomas (1949) |
Year of Election or Appointment: 2008 Trustee |
| Mr. Thomas also serves as Trustee of other Fidelity funds. Mr. Thomas serves as Non-Executive Chairman of the Board of Directors of Fortune Brands Home and Security (home and security products, 2011-present), as a member of the Board of Directors (2004-present) and Presiding Director (2013-present) of Interpublic Group of Companies, Inc. (marketing communication), and as a member of the Board of Trustees of the University of Florida (2013-present). Previously, Mr. Thomas served as Executive Chairman (2005-2006) and Chairman and Chief Executive Officer (2000-2005) of IMS Health, Inc. (pharmaceutical and healthcare information solutions), and a Director of Fortune Brands, Inc. (consumer products, 2000-2011). |
+ The information above includes each Trustee's principal occupation during the last five years and other information relating to the experience, attributes, and skills relevant to each Trustee's qualifications to serve as a Trustee, which led to the conclusion that each Trustee should serve as a Trustee for the fund.
Advisory Board Member and Officers:
Correspondence intended for each officer and Peter S. Lynch may be sent to Fidelity Investments, 245 Summer Street, Boston, Massachusetts 02210. Officers appear below in alphabetical order.
Name, Year of Birth; Principal Occupation |
Peter S. Lynch (1944) |
Year of Election or Appointment: 2003 Member of the Advisory Board |
| Mr. Lynch also serves as Member of the Advisory Board of other Fidelity funds. Mr. Lynch is Vice Chairman and a Director of FMR (investment adviser firm) and FMR Co., Inc. (investment adviser firm). In addition, Mr. Lynch serves as a Trustee of Boston College and as the Chairman of the Inner-City Scholarship Fund. Previously, Mr. Lynch served on the Special Olympics International Board of Directors (1997-2006). |
Elizabeth Paige Baumann (1968) |
Year of Election or Appointment: 2012 Anti-Money Laundering (AML) Officer |
| Ms. Baumann also serves as AML Officer of other funds. She is Chief AML Officer of FMR LLC (diversified financial services company, 2012-present) and is an employee of Fidelity Investments. Previously, Ms. Baumann served as Vice President and Deputy Anti-Money Laundering Officer (2007-2012). |
Marc R. Bryant (1966) |
Year of Election or Appointment: 2015 Secretary and Chief Legal Officer (CLO) |
| Mr. Bryant also serves as Secretary and CLO of other funds. Mr. Bryant serves as CLO, Secretary, and Senior Vice President of Fidelity Management & Research Company (investment adviser firm, 2015-present) and FMR Co., Inc. (investment adviser firm, 2015-present); Secretary of Fidelity SelectCo, LLC (investment adviser firm, 2015-present) and Fidelity Investments Money Management, Inc. (investment adviser firm, 2015-present); and CLO of Fidelity Management & Research (Hong Kong) Limited (investment adviser firm, 2015-present). He is Senior Vice President and Deputy General Counsel of FMR LLC (diversified financial services company). Previously, Mr. Bryant served as Secretary and Chief Legal Officer of Fidelity Rutland Square Trust II (2010-2014) and Assistant Secretary of Fidelity's Fixed Income and Asset Allocation Funds (2013-2015). Prior to joining Fidelity Investments, Mr. Bryant served as a Senior Vice President and the Head of Global Retail Legal for AllianceBernstein L.P. (2006-2010), and as the General Counsel for ProFund Advisors LLC (2001-2006). |
William C. Coffey (1969) |
Year of Election or Appointment: 2009 Assistant Secretary |
| Mr. Coffey also serves as Assistant Secretary of other funds. He is Senior Vice President and Deputy General Counsel of FMR LLC (diversified financial services company, 2010-present), and is an employee of Fidelity Investments. Previously, Mr. Coffey served as Vice President and Associate General Counsel of FMR LLC (2005-2009). |
Timothy M. Cohen (1969) |
Year of Election or Appointment: 2014 Vice President of certain Equity Funds |
| Mr. Cohen also serves as Vice President of other funds. Mr. Cohen serves as Chief Compliance Officer of FMR Investment Management (U.K.) Limited (investment adviser firm, 2013-present) and is an employee of Fidelity Investments. Previously, Mr. Cohen served as a Director of FMR Investment Management (U.K.) Limited (2013-2015). |
Jonathan Davis (1968) |
Year of Election or Appointment: 2010 Assistant Treasurer |
| Mr. Davis also serves as Assistant Treasurer of other funds, and is an employee of Fidelity Investments. Previously, Mr. Davis served as Vice President and Associate General Counsel of FMR LLC (diversified financial services company, 2003-2010). |
Adrien E. Deberghes (1967) |
Year of Election or Appointment: 2008 Deputy Treasurer |
| Mr. Deberghes also serves as an officer of other funds. He is an employee of Fidelity Investments (2008-present). Prior to joining Fidelity Investments, Mr. Deberghes was Senior Vice President of Mutual Fund Administration at State Street Corporation (2007-2008), Senior Director of Mutual Fund Administration at Investors Bank & Trust (2005-2007), and Director of Finance for Dunkin' Brands (2000-2005). |
Stephanie J. Dorsey (1969) |
Year of Election or Appointment: 2010 Assistant Treasurer |
| Ms. Dorsey also serves as an officer of other funds. She is an employee of Fidelity Investments (2008-present) and has served in other fund officer roles. Prior to joining Fidelity Investments, Ms. Dorsey served as Treasurer (2004-2008) of the JPMorgan Mutual Funds and Vice President (2004-2008) of JPMorgan Chase Bank. |
Howard J. Galligan III (1966) |
Year of Election or Appointment: 2014 Chief Financial Officer |
| Mr. Galligan also serves as Chief Financial Officer of other funds. Mr. Galligan serves as President of Fidelity Pricing and Cash Management Services (FPCMS) (2014-present) and as a Director of Strategic Advisers, Inc. (investment adviser firm, 2008-present). Previously, Mr. Galligan served as Chief Administrative Officer of Asset Management (2011-2014) and Chief Operating Officer and Senior Vice President of Investment Support for Strategic Advisers, Inc. (2003-2011). |
Scott C. Goebel (1968) |
Year of Election or Appointment: 2015 Vice President |
| Mr. Goebel serves as Vice President of other funds and is an employee of Fidelity Investments (2001-present). Previously, Mr. Goebel served as Secretary of Fidelity SelectCo, LLC (investment adviser firm, 2013-2015), Fidelity Investments Money Management, Inc. (FIMM) (investment adviser firm, 2010-2015), and Fidelity Research and Analysis Company (FRAC) (investment adviser firm, 2010-2015); General Counsel, Secretary, and Senior Vice President of Fidelity Management & Research Company (investment adviser firm, 2008-2015) and FMR Co., Inc. (investment adviser firm, 2008-2015); Assistant Secretary of Fidelity Management & Research (Japan) Limited (investment adviser firm, 2008-2015) and FMR Investment Management (U.K.) Limited (investment adviser firm, 2008-2015); Chief Legal Officer (CLO) of Fidelity Management & Research (Hong Kong) Limited (investment adviser firm, 2008-2015) Secretary and CLO of certain Fidelity funds (2008-2015); Assistant Secretary of FIMM (2008-2010), FRAC (2008-2010), and certain funds (2007-2008); and as Vice President and Secretary of Fidelity Distributors Corporation (FDC) (2005-2007). |
Brian B. Hogan (1964) |
Year of Election or Appointment: 2009 Vice President |
| Mr. Hogan also serves as Trustee or Vice President of other funds. Mr. Hogan serves as a Director of Fidelity SelectCo, LLC (investment adviser firm, 2014-present) and President of the Equity Division of FMR (investment adviser firm, 2009-present). Previously, Mr. Hogan served as Senior Vice President, Equity Research of FMR (2006-2009) and as a portfolio manager. |
Chris Maher (1972) |
Year of Election or Appointment: 2013 Assistant Treasurer |
| Mr. Maher serves as Assistant Treasurer of other funds. Mr. Maher is Vice President of Valuation Oversight and is an employee of Fidelity Investments. Previously, Mr. Maher served as Vice President of Asset Management Compliance (2013), Vice President of the Program Management Group of FMR (investment adviser firm, 2010-2013), and Vice President of Valuation Oversight (2008-2010). |
Kenneth B. Robins (1969) |
Year of Election or Appointment: 2008 President and Treasurer |
| Mr. Robins also serves as an officer of other funds. Mr. Robins serves as Executive Vice President of Fidelity Investments Money Management, Inc. (FIMM) (investment adviser firm, 2013-present) and is an employee of Fidelity Investments (2004-present). Previously, Mr. Robins served in other fund officer roles. |
Stacie M. Smith (1974) |
Year of Election or Appointment: 2013 Deputy Treasurer |
| Ms. Smith also serves as an officer of other funds. She is an employee of Fidelity Investments (2009-present) and has served in other fund officer roles. Prior to joining Fidelity Investments, Ms. Smith served as Senior Audit Manager of Ernst & Young LLP (1996-2009). |
Renee Stagnone (1975) |
Year of Election or Appointment: 2013 Deputy Treasurer |
| Ms. Stagnone also serves as Deputy Treasurer of other funds. Ms. Stagnone is an employee of Fidelity Investments (1997-present). |
Linda J. Wondrack (1964) |
Year of Election or Appointment: 2014 Chief Compliance Officer |
| Ms. Wondrack also serves as Chief Compliance Officer of other funds. Ms. Wondrack is Executive Vice President and head of the Ethics Office and Asset Management Compliance for Fidelity Investments (2012-present). Ms. Wondrack also serves as Chief Compliance Officer of Fidelity SelectCo, LLC (investment adviser firm, 2014-present); Chief Compliance Officer of Impresa Management LLC (2013-present); and Chief Compliance Officer of FMR Co., Inc. (investment adviser firm), Fidelity Investments Money Management, Inc. (investment adviser firm), Fidelity Management & Research (Japan) Limited (investment adviser firm), FMR Investment Management (U.K.) Limited (investment adviser firm), Fidelity Management & Research (Hong Kong) (investment adviser firm), Fidelity Management & Research Company (investment adviser firm), FIAM LLC (investment adviser firm), and Strategic Advisers, Inc. (investment adviser firm), Ballyrock Investment Advisors LLC, and Northern Neck Investors LLC (2012-present). Previously, Ms. Wondrack served as Senior Vice President and Chief Compliance Officer for Columbia Management Investment Advisers, LLC (2005-2012); Chief Compliance Officer for certain funds within the Columbia Family of Funds (2007-2012); and Senior Vice President of Compliance Risk Management at Bank of America (2005-2010). |
Joseph F. Zambello (1957) |
Year of Election or Appointment: 2011 Deputy Treasurer |
| Mr. Zambello also serves as Deputy Treasurer of other funds. Mr. Zambello is an employee of Fidelity Investments (1991-present). Previously, Mr. Zambello served as Vice President of the Program Management Group of FMR (investment adviser firm, 2009-2011) and Vice President of the Transfer Agent Oversight Group (2005-2009). |
Annual Report
The fund designates 5% of the dividends distributed during the fiscal year as qualifying for the dividends-received deduction for corporate shareholders.
The fund designates 100% of the dividends distributed in December 2014 during the fiscal year as amounts which may be taken into account as a dividend for the purposes of the maximum rate under section 1(h)(11) of the Internal Revenue Code.
The amounts per share which represent income derived from sources within, and taxes paid to, foreign countries or possessions of the United States are as follows:
| Pay Date | Income | Taxes |
International Value Fund | 12/08/2014 | 0.1563 | 0.0263 |
The fund will notify shareholders in January 2016 of amounts for use in preparing 2015 income tax returns.
Annual Report
Fidelity Total International Equity Fund
Each year, the Board of Trustees, including the Independent Trustees (together, the Board), votes on the renewal of the management contract with Fidelity Management & Research Company (FMR) and the sub-advisory agreements (together, the Advisory Contracts) for the fund. The Board, assisted by the advice of fund counsel and Independent Trustees' counsel, requests and considers a broad range of information relevant to the renewal of the Advisory Contracts throughout the year.
The Board meets regularly and, at each of its meetings, covers an extensive agenda of topics and materials and considers factors that are relevant to its annual consideration of the renewal of the fund's Advisory Contracts, including the services and support provided to the fund and its shareholders. The Board has established various standing committees (Committees), each composed of and chaired by Independent Trustees with varying backgrounds, to which the Board has assigned specific subject matter responsibilities in order to enhance effective decision-making by the Board. The Board, acting directly and through its Committees, requests and receives information concerning the annual consideration of the renewal of the fund's Advisory Contracts. The Board also meets as needed to consider matters specifically related to the Board's annual consideration of the renewal of the Advisory Contracts. Members of the Board may also meet with trustees of other Fidelity funds through ad hoc joint committees to discuss certain matters relevant to all of the Fidelity funds.
At its July 2015 meeting, the Board unanimously determined to renew the fund's Advisory Contracts. In reaching its determination, the Board considered all factors it believed relevant, including (i) the nature, extent, and quality of the services to be provided to the fund and its shareholders (including the investment performance of the fund); (ii) the competitiveness of the fund's management fee and total expense ratio relative to peer funds; (iii) the total costs of the services to be provided by and the profits to be realized by Fidelity from its relationship with the fund; and (iv) the extent to which (if any) economies of scale exist and would be realized as the fund grows, and whether any economies of scale are appropriately shared with fund shareholders.
In considering whether to renew the Advisory Contracts for the fund, the Board reached a determination, with the assistance of fund counsel and Independent Trustees' counsel and through the exercise of its business judgment, that the renewal of the Advisory Contracts was in the best interests of the fund and its shareholders and that the compensation payable under the Advisory Contracts was fair and reasonable. The Board's decision to renew the Advisory Contracts was not based on any single factor, but rather was based on a comprehensive consideration of all the information provided to the Board at its meetings throughout the year. The Board, in reaching its determination to renew the Advisory Contracts, was aware that shareholders of the fund have a broad range of investment choices available to them, including a wide choice among funds offered by Fidelity's competitors, and that the fund's shareholders, who have the opportunity to review and weigh the disclosure provided by the fund in its prospectus and other public disclosures, have chosen to invest in this fund, which is part of the Fidelity family of funds.
Annual Report
Board Approval of Investment Advisory Contracts and
Management Fees - continued
Nature, Extent, and Quality of Services Provided. The Board considered Fidelity's staffing as it relates to the fund, including the backgrounds of investment personnel of Fidelity, and also considered the fund's investment objective, strategies, and related investment philosophy. The Independent Trustees also had discussions with senior management of Fidelity's investment operations and investment groups. The Board considered the structure of the portfolio manager compensation program and whether this structure provides appropriate incentives to act in the best interests of the fund. Additionally, the Board considered the portfolio managers' investments, if any, in the funds that they manage.
Resources Dedicated to Investment Management and Support Services. The Board and the Fund Oversight and Research Committees reviewed the general qualifications and capabilities of Fidelity's investment staff, including its size, education, experience, and resources, as well as Fidelity's approach to recruiting, training, managing, and compensating investment personnel. The Board noted that Fidelity has continued to increase the resources devoted to non-U.S. offices, including expansion of Fidelity's global investment organization. The Board also noted that Fidelity's analysts have extensive resources, tools and capabilities that allow them to conduct sophisticated quantitative and fundamental analysis, as well as credit analysis of issuers, counterparties and guarantors. Further, the Board considered that Fidelity's investment professionals have sufficient access to global information and data so as to provide competitive investment results over time, and that those professionals also have access to sophisticated tools that permit them to assess portfolio construction and risk and performance attribution characteristics continuously, as well as to transmit new information and research conclusions rapidly around the world. Additionally, in its deliberations, the Board considered Fidelity's trading, risk management, and compliance capabilities and resources, which are integral parts of the investment management process.
Shareholder and Administrative Services. The Board considered (i) the nature, extent, quality, and cost of advisory, administrative, and shareholder services performed by FMR, the sub-advisers (together with FMR, the Investment Advisers), and their affiliates under the Advisory Contracts and under separate agreements covering transfer agency, pricing and bookkeeping, and securities lending services for the fund; (ii) the nature and extent of the supervision of third party service providers, principally custodians and subcustodians; and (iii) the resources devoted to, and the record of compliance with, the fund's compliance policies and procedures. The Board also reviewed the allocation of fund brokerage, including allocations to brokers affiliated with the Investment Advisers, the use of brokerage commissions to pay fund expenses, and the use of "soft" commission dollars to pay for research services.
Annual Report
The Board noted that the growth of fund assets over time across the complex allows Fidelity to reinvest in the development of services designed to enhance the value or convenience of the Fidelity funds as investment vehicles. These services include 24-hour access to account information and market information through telephone representatives and over the Internet, investor education materials and asset allocation tools, and the expanded availability of Fidelity Investor Centers.
In 2014, the Board formed an ad hoc Committee on Transfer Agency Fees to review the variety of transfer agency fee structures throughout the industry and Fidelity's competitive positioning with respect to industry participants.
Investment in a Large Fund Family. The Board considered the benefits to shareholders of investing in a Fidelity fund, including the benefits of investing in a fund that is part of a large family of funds offering a variety of investment disciplines and providing a large variety of mutual fund investor services. The Board noted that Fidelity had taken, or had made recommendations that resulted in the Fidelity funds taking, a number of actions over the previous year that benefited particular funds, including (i) continuing to dedicate additional resources to investment research and to the support of the senior management team that oversees asset management; (ii) continuing efforts to enhance Fidelity's global research capabilities; (iii) launching new funds and making other enhancements to meet client needs; (iv) reducing management fees and total expenses for certain index funds and diversified international funds; (v) continuing to launch dedicated lower cost underlying funds to meet portfolio construction needs related to expanding underlying fund options for Fidelity funds of funds, specifically for the Freedom Fund product lines; (vi) rationalizing product lines and gaining increased efficiencies through fund mergers; (vii) launching active fixed-income exchange-traded funds; (viii) continuing to develop, acquire and implement systems and technology to improve services to the funds and information security and to increase efficiency; (ix) implementing investment enhancements to further strengthen Fidelity's target date product line to increase investors' probability of success in achieving their goals; (x) modifying the eligibility criteria for certain share classes to accommodate roll-over assets from employer-sponsored retirement plans; (xi) launching a new Class W of the Freedom Index Funds to attract and retain Fidelity record-kept retirement plan assets; and (xii) implementing changes to Fidelity's money market product line in response to recent money market regulatory reforms.
Investment Performance. The Board considered whether the fund has operated in accordance with its investment objective, as well as its record of compliance with its investment restrictions and its performance history.
Annual Report
Board Approval of Investment Advisory Contracts and
Management Fees - continued
The Board took into account discussions with representatives of the Investment Advisers about fund investment performance that occur at Board meetings throughout the year. In this regard the Board noted that as part of regularly scheduled fund reviews and other reports to the Board on fund performance, the Board considers annualized return information for the fund, for different time periods, measured against a securities market index ("benchmark index") and a peer group of funds with similar objectives ("peer group"), if any. In its evaluation of fund investment performance, the Board gave particular attention to information indicating changes in performance of certain Fidelity funds for specific time periods and discussed with the Investment Advisers the reasons for any overperformance or underperformance.
In addition to reviewing absolute and relative fund performance, the Independent Trustees periodically consider the appropriateness of fund performance metrics in evaluating the results achieved. In general, the Independent Trustees believe that fund performance should be evaluated based on net performance (after fees and expenses) of both the highest performing and lowest performing fund share classes, where applicable, compared to appropriate benchmark indices, over appropriate time periods that may include full market cycles, and compared to peer groups, as applicable, over the same periods, taking into account relevant factors including the following: general market conditions; issuer-specific information; and fund cash flows and other factors.
The Independent Trustees recognize that shareholders evaluate performance on a net basis over their own holding periods, for which one-, three-, and five-year periods are often used as a proxy. For this reason, the performance information reviewed by the Board also included net cumulative calendar year total return information for the fund and an appropriate benchmark index and peer group for the most recent one-, three-, and five-year periods, as shown below. Returns are shown compared to the 25th percentile (top of box, 75% beaten) and 75th percentile (bottom of box, 25% beaten) of the peer universe. Returns of the benchmark index are "net MA," i.e., adjusted for tax withholding rates applicable to U.S.-based funds organized as Massachusetts business trusts.
Annual Report
Fidelity Total International Equity Fund
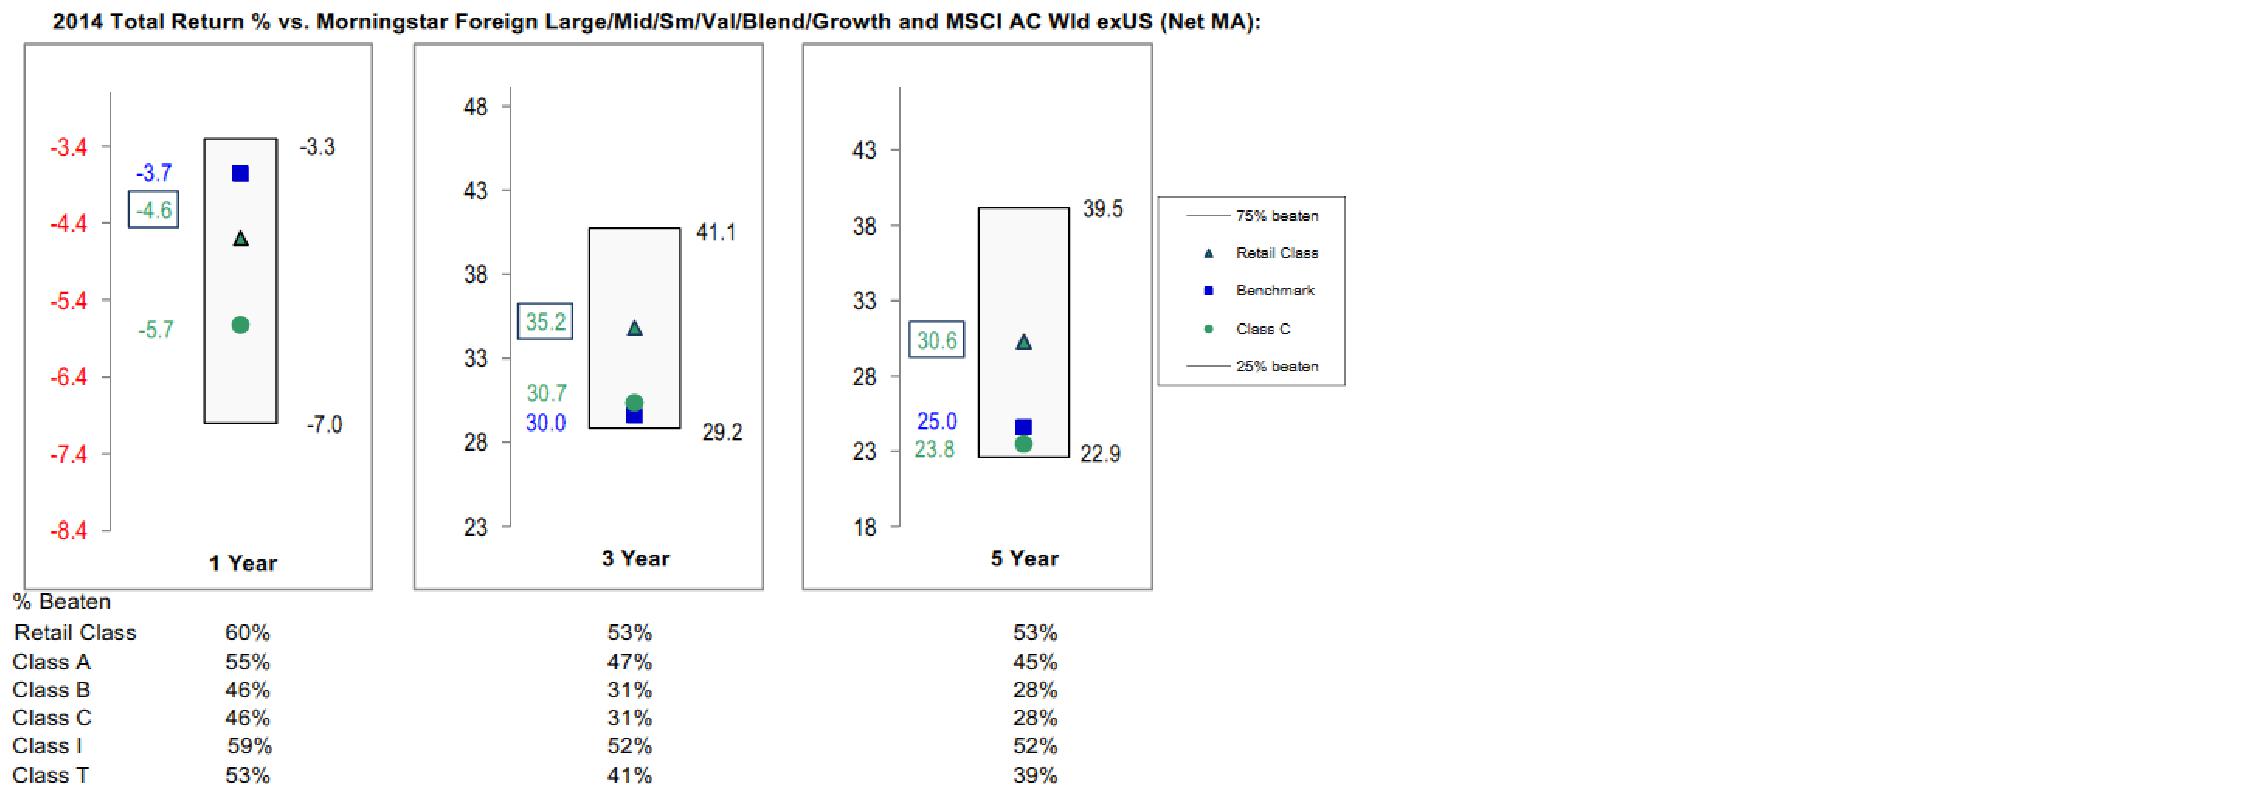
The Board also considered that the fund's management fee is subject to upward or downward adjustment depending upon whether, and to what extent, the fund's investment performance for the performance period exceeds, or is exceeded by, a securities index, thus leading to a performance adjustment for the same period. The Board noted that the performance adjustment provides FMR with a strong economic incentive to seek to achieve superior performance for the fund's shareholders and helps to more closely align the interests of FMR and the shareholders of the fund.
Based on its review, the Board concluded that the nature, extent, and quality of services provided to the fund under the Advisory Contracts should benefit the shareholders of the fund.
Competitiveness of Management Fee and Total Expense Ratio. The Board considered the fund's management fee and total expense ratio compared to "mapped groups" of competitive funds and classes created for the purpose of facilitating the Trustees' competitive analysis of management fees and total expenses. Fidelity creates "mapped groups" by combining similar Lipper investment objective categories that have comparable investment mandates. Combining Lipper investment objective categories aids the Board's management fee and total expense ratio comparisons by broadening the competitive group used for comparison.
Management Fee. The Board considered two proprietary management fee comparisons for the 12-month periods shown in basis points (BP) in the chart below. The group of Lipper funds used by the Board for management fee comparisons is referred to below as the "Total Mapped Group." The Total Mapped Group comparison focuses on a fund's standing in terms of gross management fees before expense reimbursements or caps, and without giving effect to the fund's performance adjustment, relative to the total universe of funds with comparable investment mandates, regardless of whether their management fee structures also are comparable. Funds with comparable investment mandates offer exposure to similar types of securities. Funds with comparable management fee structures have similar management fee contractual arrangements (e.g., flat rate charged for advisory services, all-inclusive fee rate, etc.). "TMG %" represents the percentage of funds in the Total Mapped Group that had management fees that were lower than the fund's. For example, a hypothetical TMG % of 20% would mean that 80% of the funds in the Total Mapped Group had higher, and 20% had lower, management fees than the fund. The fund's actual TMG %s and the number of funds in the Total Mapped Group are in the chart below. The "Asset-Size Peer Group" (ASPG) comparison focuses on a fund's standing relative to a subset of non-Fidelity funds within the Total Mapped Group that are similar in size and management fee structure without taking into account performance adjustments, if any. For example, if a fund is in the first quartile of the ASPG, the fund's management fee ranks in the least expensive or lowest 25% of funds in the ASPG. The ASPG represents at least 15% of the funds in the Total Mapped Group with comparable asset size and management fee structures, subject to a minimum of 50 funds (or all funds in the Total Mapped Group if fewer than 50). Additional information, such as the ASPG quartile in which the fund's management fee rate ranked and the impact of the fund's performance adjustment, is also included in the chart and considered by the Board.
Annual Report
Board Approval of Investment Advisory Contracts and
Management Fees - continued
Fidelity Total International Equity Fund

Annual Report
The Board noted that the fund's management fee rate ranked below the median of its Total Mapped Group and below the median of its ASPG for 2014. The Board also noted the effect of the fund's performance adjustment, if any, on the fund's management fee ranking.
The Board noted that, in 2014, the ad hoc Committee on Group Fee was formed by it and other Fidelity fund boards to conduct an in-depth review of the "group fee" component of the management fee of funds with such management fee structures. Committee focus included the mechanics of the group fee, the competitive landscape of group fee structures, Fidelity funds with no group fee component and investment products not included in group fee assets. The Board also considered that, for funds subject to the group fee, FMR agreed to voluntarily waive fees over a specified period of time in amounts designed to account for assets converted from certain funds to certain collective investment trusts.
The Board also noted that, in 2013, the ad hoc Committee on Management Fees was formed to conduct an in-depth review of the management fee rates of Fidelity's active equity mutual funds. The Committee focused on the following areas: (i) standard fee structures; (ii) research consumption and trading evolution; (iii) management fee competitiveness/profitability by category; and (iv) factors that drive institutional pricing.
Based on its review, the Board concluded that the fund's management fee is fair and reasonable in light of the services that the fund receives and the other factors considered.
Total Expense Ratio. In its review of each class's total expense ratio, the Board considered the fund's management fee as well as other fund or class expenses, as applicable, such as transfer agent fees, pricing and bookkeeping fees, fund-paid 12b-1 fees, and custodial, legal, and audit fees. The Board noted the impact of the fund's performance adjustment. The Board also noted that Fidelity may agree to waive fees and expenses from time to time, and the extent to which, if any, it has done so for the fund. As part of its review, the Board also considered the current and historical total expense ratios of each class of the fund compared to competitive fund median expenses. Each class of the fund is compared to those funds and classes in the Total Mapped Group (used by the Board for management fee comparisons) that have a similar sales load structure.
The Board noted that the total expense ratio of the retail class ranked below its competitive median for 2014 and the total expense ratio of each of Class A, Class T, Class B, Class C, and Class I ranked above its competitive median for 2014. The Board considered that, in general, various factors can affect total expense ratios. The Board noted that the total expense ratio of Class T was above the competitive median primarily because of higher 12b-1 fees on Class T as compared to most competitor funds. Class T has a higher 12b-1 fee, but a lower front-end sales charge, than traditionally priced front-end sales charge classes. The Board considered that Class T is primarily sold load-waived in the retirement plan market where its 0.50% 12b-1 fee is comparable to competing no-load, higher 12b-1 fee classes designed specifically for retirement plans. The Board noted that the fund offers multiple classes, each of which has a different sales load and 12b-1 fee structure, and that the multiple structures are intended to offer a range of pricing options for the intermediary market. The Board also noted that the total expense ratios of the classes vary primarily by the level of their 12b-1 fees, although differences in transfer agent fees may also cause expenses to vary from class to class.
Annual Report
Board Approval of Investment Advisory Contracts and
Management Fees - continued
The Board further considered that FMR contractually agreed to reimburse Class A, Class T, Class B, Class C, Class I, and the retail class of the fund to the extent that total operating expenses (excluding interest, certain taxes, certain securities lending costs, brokerage commissions, extraordinary expenses, and acquired fund fees and expenses, if any), as a percentage of their respective average net assets, exceed 1.45%, 1.70%, 2.20%, 2.20%, 1.20%, and 1.20% through December 31, 2015.
Fees Charged to Other Fidelity Clients. The Board also considered Fidelity fee structures and other information with respect to clients of Fidelity, such as other funds advised or subadvised by Fidelity, pension plan clients, and other institutional clients with similar mandates. The Board noted the findings of the 2013 ad hoc joint committee (created with the board of other Fidelity funds), which reviewed and compared Fidelity's institutional investment advisory business with its business of providing services to the Fidelity funds, including the differences in services provided, fees charged, and costs incurred, as well as competition in their respective marketplaces.
Based on its review of total expense ratios and fees charged to other Fidelity clients, the Board concluded that, although in some cases above the median of the universe presented for comparison, the total expense ratio of each class of the fund was reasonable in light of the services that the fund and its shareholders receive and the other factors considered.
Costs of the Services and Profitability. The Board considered the revenues earned and the expenses incurred by Fidelity in conducting the business of developing, marketing, distributing, managing, administering and servicing the fund and servicing the fund's shareholders. The Board also considered the level of Fidelity's profits in respect of all the Fidelity funds.
On an annual basis, Fidelity presents to the Board information about the profitability of its relationship with the fund. Fidelity calculates profitability information for each fund, as well as aggregate profitability information for groups of Fidelity funds and all Fidelity funds, using a series of detailed revenue and cost allocation methodologies which originate with the books and records of Fidelity on which Fidelity's audited financial statements are based. The Audit Committee of the Board reviews any significant changes from the prior year's methodologies.
Annual Report
PricewaterhouseCoopers LLP (PwC), independent registered public accounting firm and auditor to Fidelity and certain Fidelity funds, has been engaged annually by the Board as part of the Board's assessment of Fidelity's profitability analysis. PwC's engagement includes the review and assessment of the methodologies used by Fidelity in determining the revenues and expenses attributable to Fidelity's mutual fund business, and completion of agreed-upon procedures in respect of the mathematical accuracy of fund profitability and its conformity to established allocation methodologies. After considering PwC's reports issued under the engagement and information provided by Fidelity, the Board concluded that while other allocation methods may also be reasonable, Fidelity's profitability methodologies are reasonable in all material respects.
The Board also reviewed Fidelity's non-fund businesses and fall-out benefits related to the mutual fund business as well as cases where Fidelity's affiliates may benefit from or be related to the fund's business.
The Board considered the costs of the services provided by and the profits realized by Fidelity in connection with the operation of the fund and was satisfied that the profitability was not excessive.
Economies of Scale. The Board considered whether there have been economies of scale in respect of the management of the Fidelity funds, whether the Fidelity funds (including the fund) have appropriately benefited from any such economies of scale, and whether there is potential for realization of any further economies of scale. The Board considered the extent to which the fund will benefit from economies of scale as assets grow through increased services to the fund, through waivers or reimbursements, or through fee or expense ratio reductions. The Board also noted that in 2013, it and the boards of other Fidelity funds created an ad hoc committee (the Economies of Scale Committee) to analyze whether Fidelity attains economies of scale in respect of the management and servicing of the Fidelity funds, whether the Fidelity funds have appropriately benefited from such economies of scale, and whether there is potential for realization of any further economies of scale.
The Board recognized that the fund's management contract incorporates a "group fee" structure, which provides for lower group fee rates as total group assets increase, and for higher group fee rates as total group assets decrease (with "group assets" defined to include fund assets under FMR's management plus sector fund assets previously under FMR's management and currently managed by Fidelity SelectCo, LLC). FMR calculates the group fee rates based on a tiered asset "breakpoint" schedule that varies based on asset class. The Board considered that the group fee is designed to deliver the benefits of economies of scale to fund shareholders when total Fidelity fund assets increase, even if assets of any particular fund are unchanged or have declined, because some portion of Fidelity's costs are attributable to services provided to all Fidelity funds, and all funds benefit if those costs can be allocated among more assets. The Board concluded that, given the group fee structure, fund shareholders will benefit from lower management fees as group assets increase at the fund complex level, regardless of whether Fidelity achieves any such economies of scale.
Annual Report
Board Approval of Investment Advisory Contracts and
Management Fees - continued
The Board concluded, taking into account the analysis of the Economies of Scale Committee, that economies of scale, if any, are being appropriately shared between fund shareholders and Fidelity.
Additional Information Requested by the Board. In order to develop fully the factual basis for consideration of the Fidelity funds' Advisory Contracts, the Board requested and received additional information on certain topics, including: (i) fund performance trends and Fidelity's long-term strategies for certain funds; (ii) the various share classes employed by Fidelity and the attributes of each class, together with similar information on the distribution and servicing payments made by Fidelity or the funds to third-party participants in the distribution channels; (iii) fund profitability, and fund performance in relation to fund profitability; (iv) the methodology with respect to evaluating competitive fund data and peer group classifications and fee comparisons; (v) annual fund profitability margins, with particular focus on certain funds with negative margins; (vi) the realization of fall-out benefits in certain Fidelity business units; (vii) economies of scale and the way in which they are shared with fund shareholders; (viii) Fidelity's group fee structures, including the group fee schedule of breakpoints; (ix) the impact of cost containment measures on the funds; and (x) the transfer agent fee structure.
Based on its evaluation of all of the conclusions noted above, and after considering all factors it believed relevant, the Board concluded that the advisory fee structures are fair and reasonable, and that the fund's Advisory Contracts should be renewed.
Annual Report
Investment Adviser
Fidelity Management & Research Company
Boston, MA
Investment Sub-Advisers
FMR Co., Inc.
FMR Investment Management
(U.K.) Limited
Fidelity Management & Research
(Hong Kong) Limited
Fidelity Management & Research
(Japan) Limited
FIL Investment Advisors
FIL Investments (Japan) Limited
FIL Investment Advisors (UK)
Limited
General Distributor
Fidelity Distributors Corporation
Smithfield, RI
Transfer and Service Agents
Fidelity Investments Institutional
Operations Company, Inc.
Boston, MA
Fidelity Service Company, Inc.
Boston, MA
Custodian
State Street Bank and Trust Company
Quincy, MA
The Fidelity Telephone Connection
Mutual Fund 24-Hour Service
Exchanges/Redemptions
and Account Assistance 1-800-544-6666
Product Information 1-800-544-8888
Retirement Accounts 1-800-544-4774
(8 a.m. - 9 p.m.)
TDD Service 1-800-544-0118
for the deaf and hearing impaired
(9 a.m. - 9 p.m. Eastern time)
Fidelity Automated Service
Telephone (FAST®)
1-800-544-5555

Automated line for quickest service
(Fidelity Investment logo)(registered trademark)
Corporate Headquarters
245 Summer St., Boston, MA 02210
www.fidelity.com
TIE-UANN-1215
1.912357.105
(Fidelity Investment logo)(registered trademark)
Fidelity Advisor®
Total International Equity
Fund - Class A, Class T, Class B,
and Class C
Annual Report
October 31, 2015
(Fidelity Cover Art)
Class A, Class T,
Class B, and Class C are
classes of Fidelity® Total
International Equity Fund
Contents
Performance | (Click Here) | How the fund has done over time. |
Management's Discussion of Fund Performance | (Click Here) | The Portfolio Manager's review of fund performance and strategy. |
Shareholder Expense Example | (Click Here) | An example of shareholder expenses. |
Investment Changes | (Click Here) | A summary of major shifts in the fund's investments over the past six months. |
Investments | (Click Here) | A complete list of the fund's investments with their market values. |
Financial Statements | (Click Here) | Statements of assets and liabilities, operations, and changes in net assets, as well as financial highlights. |
Notes | (Click Here) | Notes to the financial statements. |
Report of Independent Registered Public Accounting Firm | (Click Here) | |
Trustees and Officers | (Click Here) | |
Distributions | (Click Here) | |
Board Approval of Investment Advisory Contracts and Management Fees | (Click Here) | |
To view a fund's proxy voting guidelines and proxy voting record for the 12-month period ended June 30, visit http://www.fidelity.com/proxyvotingresults or visit the Securities and Exchange Commission's (SEC) web site at http://www.sec.gov. You may also call 1-877-208-0098 to request a free copy of the proxy voting guidelines.
Standard & Poor's, S&P and S&P 500 are registered service marks of The McGraw-Hill Companies, Inc. and have been licensed for use by Fidelity Distributors Corporation.
Other third-party marks appearing herein are the property of their respective owners.
All other marks appearing herein are registered or unregistered trademarks or service marks of FMR LLC or an affiliated company. © 2015 FMR LLC. All rights reserved.
Annual Report
This report and the financial statements contained herein are submitted for the general information of the shareholders of the fund. This report is not authorized for distribution to prospective investors in the fund unless preceded or accompanied by an effective prospectus.
A fund files its complete schedule of portfolio holdings with the SEC for the first and third quarters of each fiscal year on Form N-Q. Forms N-Q are available on the SEC's web site at http://www.sec.gov. A fund's Forms N-Q may be reviewed and copied at the SEC's Public Reference Room in Washington, DC. Information regarding the operation of the SEC's Public Reference Room may be obtained by calling 1-800-SEC-0330. For a complete list of a fund's portfolio holdings, view the most recent holdings listing, semiannual report, or annual report on Fidelity's web site at http://www.fidelity.com, http://www.advisor.fidelity.com, or http://www.401k.com, as applicable.
NOT FDIC INSURED • MAY LOSE VALUE • NO BANK GUARANTEE
Neither the fund nor Fidelity Distributors Corporation is a bank.
Annual Report
Average annual total return reflects the change in the value of an investment, assuming reinvestment of the class' distributions from dividend income and capital gains (the profits earned upon the sale of securities that have grown in value, if any) and assuming a constant rate of performance each year. The $10,000 table and the fund's returns do not reflect the deduction of taxes that a shareholder would pay on fund distributions or the redemption of fund shares. During periods of reimbursement by Fidelity, a fund's total return will be greater than it would be had the reimbursement not occurred. How a fund did yesterday is no guarantee of how it will do tomorrow. Returns reflect the conversion of Class B shares to Class A shares after a maximum of seven years.
Average Annual Total Returns
Periods ended October 31, 2015 | Past 1
year | Past 5
years | Life of
fund A |
Class A (incl. 5.75% sales charge) | -6.59% | 2.58% | -1.79% |
Class T (incl. 3.50% sales charge) | -4.72% | 2.81% | -1.76% |
Class B (incl. contingent deferred sales charge) B | -6.49% | 2.67% | -1.70% |
Class C (incl. contingent deferred sales charge) C | -2.70% | 3.02% | -1.80% |
A From November 1, 2007.
B Class B shares' contingent deferred sales charges included in the past one year, past five years, and life of fund total return figures are 5%, 2%, and 0%, respectively.
C Class C shares' contingent deferred sales charges included in the past one year, past five years, and life of fund total return figures are 1%, 0%, and 0%, respectively.
Annual Report
$10,000 Over Life of Fund
Let's say hypothetically that $10,000 was invested in Fidelity Advisor® Total International Equity Fund - Class A on November 1, 2007, when the fund started, and the current 5.75% sales charge was paid. The chart shows how the value of your investment would have changed, and also shows how the MSCI ACWI (All Country World Index) ex USA Index performed over the same period.
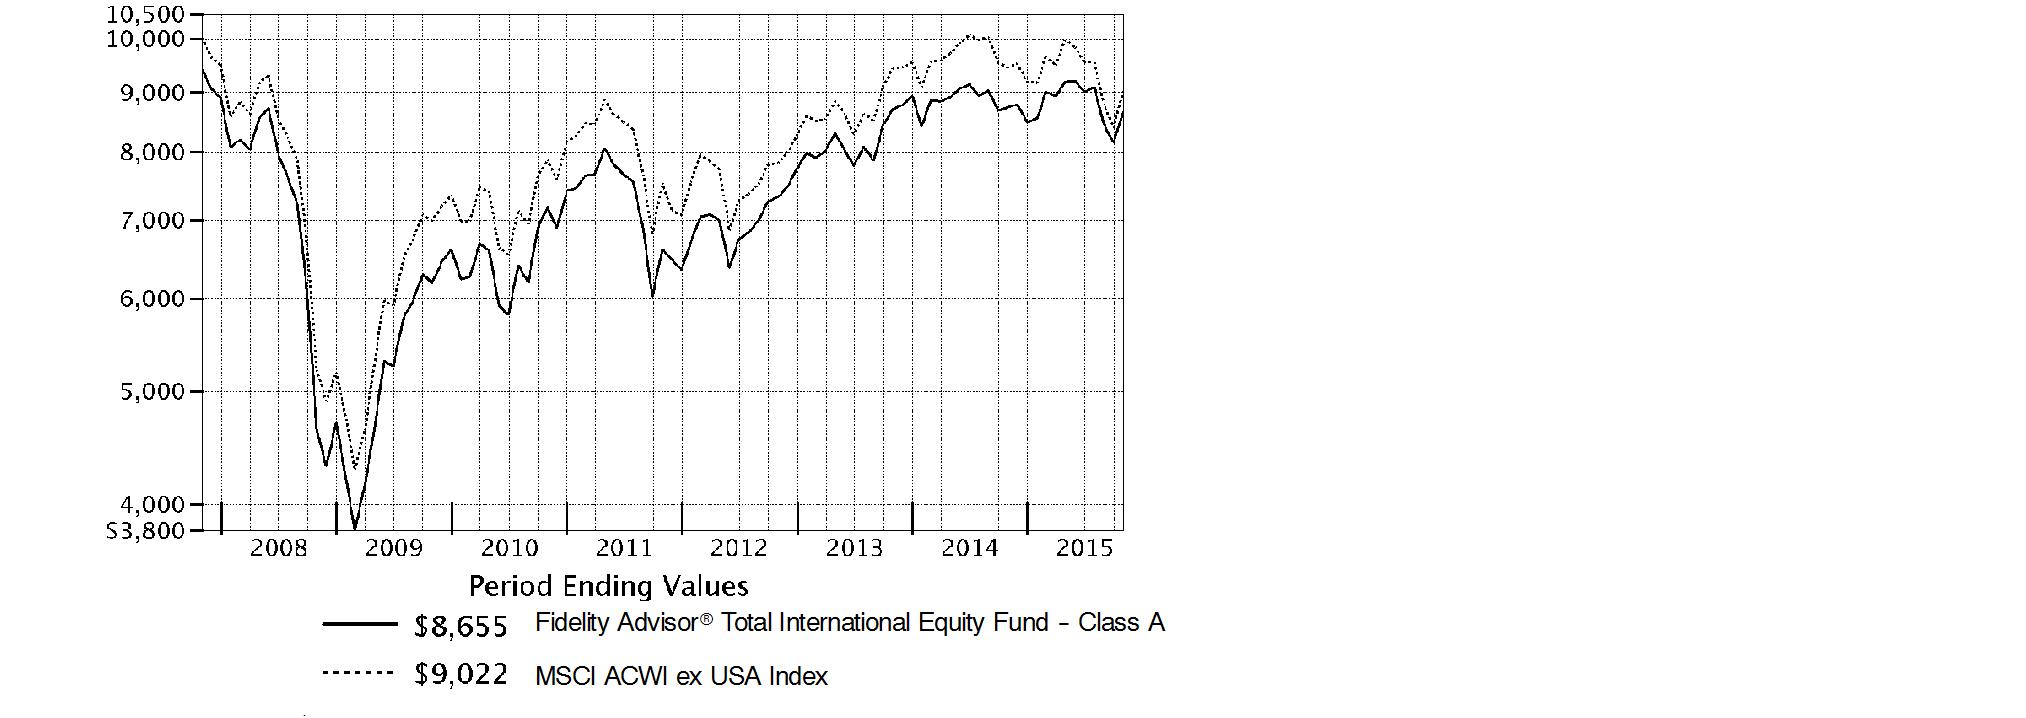
Annual Report
Market Recap: International equities suffered a moderate setback for the 12 months ending October 31, 2015, held back by a collapse in commodities prices that hurt resources-related sectors and geographies. The MSCI ACWI (All Country World Index) ex USA Index returned -4.55% for the period, affected also by concerns about global economic growth. Commodity producers remained under pressure for much of the past year, largely related to economic deceleration in China (-1%), the world's second-largest economy and a leading consumer of raw materials. This effect was exacerbated by U.S. dollar strength relative to global currencies, which weighed on commodities priced in dollars and acutely impacted equity returns within regions most exposed to resources prices. The emerging-markets group, for example, returned about -15% this period. Canada, a significant energy producer, returned roughly -17%. Net energy consumer Japan (+9%) was the best-performing region by far. Only about a quarter of the nearly 50 index countries managed a gain this period: Ireland (+19%) - the EU's fastest-growing economy - and Israel (+17%) proved top performers; Greece (-56%) and Brazil (-46%), among the worst. As for sectors, energy (-25%) and materials (-16%) declined sharply, whereas the two consumer sectors each gained about 6%.
Comments from Co-Portfolio Manager Alex Zavratsky: For the year, the fund's share classes (excluding sales charges, if applicable) declined modestly but significantly outpaced the benchmark MSCI ACWI (All Country World Index) ex USA Index. Among sectors, performance versus the benchmark was helped by a substantial underweighting in the struggling energy sector. Security selection in financials, information technology and materials also were notable positives. In country terms, stock picking in various European countries added value, whereas an underweighting in Japan was a modest negative. A fair-value pricing adjustment detracted by 0.59 percentage points. Visa and Mastercard, two U.S.-based payment processors listed within the software & services industry, contributed, as did BGF Retail, a South Korean convenience-store retailer. The fund's underweighting and eventual sale of U.K.-based oil giant and index component Royal Dutch Shell further added value. In contrast, relative detractors included Sands China and Wynn Macau, which encountered significant business challenges. We sold both names in the first half of the period. Also hampering results was Turkey-based Coca-Cola Icecek Sanayi, which owns the Coca-Cola bottling franchise in various emerging markets. Anticipating a worse outlook for the company, we sold the fund's investment.
The views expressed above reflect those of the portfolio manager(s) only through the end of the period as stated on the cover of this report and do not necessarily represent the views of Fidelity or any other person in the Fidelity organization. Any such views are subject to change at any time based upon market or other conditions and Fidelity disclaims any responsibility to update such views. These views may not be relied on as investment advice and, because investment decisions for a Fidelity fund are based on numerous factors, may not be relied on as an indication of trading intent on behalf of any Fidelity fund.
Annual Report
Shareholder Expense Example
As a shareholder of the Fund, you incur two types of costs: (1) transaction costs, including sales charges (loads) on purchase payments or redemption proceeds, redemption fees and (2) ongoing costs, including management fees, distribution and/or service (12b-1) fees and other Fund expenses. This Example is intended to help you understand your ongoing costs (in dollars) of investing in the Fund and to compare these costs with the ongoing costs of investing in other mutual funds.
The Example is based on an investment of $1,000 invested at the beginning of the period and held for the entire period (May 1, 2015 to October 31, 2015).
Actual Expenses
The first line of the accompanying table for each class of the Fund provides information about actual account values and actual expenses. You may use the information in this line, together with the amount you invested, to estimate the expenses that you paid over the period. Simply divide your account value by $1,000.00 (for example, an $8,600 account value divided by $1,000.00 = 8.6), then multiply the result by the number in the first line for a class of the Fund under the heading entitled "Expenses Paid During Period" to estimate the expenses you paid on your account during this period. A small balance maintenance fee of $12.00 that is charged once a year may apply for certain accounts with a value of less than $2,000. This fee is not included in the table below. If it was, the estimate of expenses you paid during the period would be higher, and your ending account value lower, by this amount.
Hypothetical Example for Comparison Purposes
The second line of the accompanying table for each class of the Fund provides information about hypothetical account values and hypothetical expenses based on a Class' actual expense ratio and an assumed rate of return of 5% per year before expenses, which is not the Class' actual return. The hypothetical account values and expenses may not be used to estimate the actual ending account balance or expenses you paid for the period. You may use this information to compare the ongoing costs of investing in the Fund and other funds. To do so, compare this 5% hypothetical example with the 5% hypothetical examples that appear in the shareholder reports of the other funds. A small balance maintenance fee of $12.00 that is charged once a year may apply for certain accounts with a value of less than $2,000. This fee is not included in the table below. If it was, the estimate of expenses you paid during the period would be higher, and your ending account value lower, by this amount. In addition, the Fund, as a shareholder in the underlying Fidelity Central Funds, will indirectly bear its pro-rata share of the fees and expenses incurred by the underlying Fidelity Central Funds. These fees and expenses are not included in the Fund's annualized expense ratio used to calculate the expense estimate in the table below.
Please note that the expenses shown in the table are meant to highlight your ongoing costs only and do not reflect any transaction costs. Therefore, the second line of the table is useful in comparing ongoing costs only, and will not help you determine the relative total costs of owning different funds. In addition, if these transactional costs were included, your costs would have been higher.
Annual Report
| Annualized
Expense RatioB | Beginning
Account Value
May 1, 2015 | Ending
Account Value
October 31, 2015 | Expenses Paid
During PeriodC
May 1, 2015
to October 31, 2015 |
Class A | 1.45% | | | |
Actual | | $ 1,000.00 | $ 942.00 | $ 7.10 |
HypotheticalA | | $ 1,000.00 | $ 1,017.90 | $ 7.38 |
Class T | 1.70% | | | |
Actual | | $ 1,000.00 | $ 939.80 | $ 8.31 |
HypotheticalA | | $ 1,000.00 | $ 1,016.64 | $ 8.64 |
Class B | 2.20% | | | |
Actual | | $ 1,000.00 | $ 938.90 | $ 10.75 |
HypotheticalA | | $ 1,000.00 | $ 1,014.12 | $ 11.17 |
Class C | 2.20% | | | |
Actual | | $ 1,000.00 | $ 938.40 | $ 10.75 |
HypotheticalA | | $ 1,000.00 | $ 1,014.12 | $ 11.17 |
Total International Equity | 1.06% | | | |
Actual | | $ 1,000.00 | $ 943.30 | $ 5.19 |
HypotheticalA | | $ 1,000.00 | $ 1,019.86 | $ 5.40 |
Class I | 1.16% | | | |
Actual | | $ 1,000.00 | $ 943.00 | $ 5.68 |
HypotheticalA | | $ 1,000.00 | $ 1,019.36 | $ 5.90 |
A 5% return per year before expenses
B Annualized expense ratio reflects expenses net of applicable fee waivers.
C Expenses are equal to each Class' annualized expense ratio, multiplied by the average account value over the period, multiplied by 184/365 (to reflect the one-half year period).
Annual Report
Investment Changes (Unaudited)
Asset Allocation as of October 31, 2015 |
| % of fund's
net assets | % of fund's net assets
6 months ago |
Stocks | 99.0 | 98.1 |
Short-Term Investments and Net Other Assets (Liabilities) | 1.0 | 1.9 |
Top Ten Stocks as of October 31, 2015 |
| % of fund's
net assets | % of fund's net assets
6 months ago |
Novartis AG (Switzerland, Pharmaceuticals) | 2.3 | 2.1 |
Nestle SA (Switzerland, Food Products) | 2.1 | 2.0 |
Roche Holding AG (participation certificate) (Switzerland, Pharmaceuticals) | 1.3 | 1.6 |
Anheuser-Busch InBev SA NV (Belgium, Beverages) | 1.2 | 1.3 |
Total SA (France, Oil, Gas & Consumable Fuels) | 1.2 | 1.0 |
Taiwan Semiconductor Manufacturing Co. Ltd. (Taiwan, Semiconductors & Semiconductor Equipment) | 1.1 | 1.0 |
Astellas Pharma, Inc. (Japan, Pharmaceuticals) | 1.1 | 0.9 |
Reckitt Benckiser Group PLC (United Kingdom, Household Products) | 1.0 | 0.8 |
Novo Nordisk A/S Series B sponsored ADR (Denmark, Pharmaceuticals) | 1.0 | 0.9 |
Samsung Electronics Co. Ltd. (Korea (South), Technology Hardware, Storage & Peripherals) | 1.0 | 1.1 |
| 13.3 | |
Market Sectors as of October 31, 2015 |
| % of fund's
net assets | % of fund's net assets
6 months ago |
Financials | 22.0 | 22.5 |
Consumer Discretionary | 16.1 | 15.3 |
Health Care | 14.7 | 13.6 |
Consumer Staples | 11.4 | 9.9 |
Information Technology | 11.3 | 11.2 |
Industrials | 11.1 | 11.8 |
Materials | 4.9 | 5.7 |
Energy | 2.9 | 3.4 |
Telecommunication Services | 2.7 | 3.4 |
Utilities | 1.9 | 1.3 |
Annual Report
Investments October 31, 2015
Showing Percentage of Net Assets
Common Stocks - 98.5% |
| Shares | | Value |
Australia - 2.7% |
Amcor Ltd. | 31,976 | | $ 308,850 |
Ansell Ltd. | 36,338 | | 517,089 |
CSL Ltd. | 41,325 | | 2,746,885 |
DuluxGroup Ltd. | 21,387 | | 89,416 |
Imdex Ltd. (a) | 84,227 | | 13,433 |
Macquarie Group Ltd. | 11,325 | | 685,716 |
RCG Corp. Ltd. | 97,518 | | 99,407 |
Sydney Airport unit | 250,875 | | 1,146,526 |
Telstra Corp. Ltd. | 73,830 | | 282,890 |
TFS Corp. Ltd. | 55,935 | | 69,823 |
Transurban Group unit | 177,778 | | 1,317,343 |
Westpac Banking Corp. | 81,623 | | 1,818,073 |
TOTAL AUSTRALIA | | 9,095,451 |
Austria - 0.4% |
Andritz AG | 23,972 | | 1,207,325 |
Zumtobel AG | 2,900 | | 66,012 |
TOTAL AUSTRIA | | 1,273,337 |
Bailiwick of Jersey - 1.1% |
Integrated Diagnostics Holdings PLC (a) | 71,300 | | 392,863 |
Shire PLC | 30,080 | | 2,277,985 |
Wolseley PLC | 18,076 | | 1,061,266 |
TOTAL BAILIWICK OF JERSEY | | 3,732,114 |
Belgium - 1.9% |
Anheuser-Busch InBev SA NV | 33,671 | | 4,017,779 |
Gimv NV | 1,019 | | 47,881 |
KBC Ancora | 4,781 | | 189,898 |
KBC Groep NV | 33,317 | | 2,029,692 |
TOTAL BELGIUM | | 6,285,250 |
Bermuda - 0.5% |
China Gas Holdings Ltd. | 248,000 | | 394,696 |
China Resource Gas Group Ltd. | 124,000 | | 340,138 |
Credicorp Ltd. (United States) | 4,600 | | 520,628 |
PAX Global Technology Ltd. | 303,000 | | 396,221 |
Petra Diamonds Ltd. | 21,800 | | 25,088 |
Vostok New Ventures Ltd. SDR (a) | 9,260 | | 59,070 |
TOTAL BERMUDA | | 1,735,841 |
Brazil - 1.2% |
BB Seguridade Participacoes SA | 64,000 | | 441,431 |
Common Stocks - continued |
| Shares | | Value |
Brazil - continued |
Brasil Foods SA | 36,900 | | $ 575,045 |
Cetip SA - Mercados Organizado | 40,100 | | 354,568 |
Cielo SA | 51,480 | | 488,697 |
FPC Par Corretora de Seguros | 25,500 | | 71,345 |
Kroton Educacional SA | 178,800 | | 457,136 |
Qualicorp SA | 99,500 | | 417,964 |
Smiles SA | 40,400 | | 315,318 |
Ultrapar Participacoes SA | 25,700 | | 446,487 |
Weg SA | 94,900 | | 354,348 |
TOTAL BRAZIL | | 3,922,339 |
British Virgin Islands - 0.1% |
Gem Diamonds Ltd. | 14,373 | | 21,936 |
Mail.Ru Group Ltd. GDR (Reg. S) (a) | 18,700 | | 364,650 |
TOTAL BRITISH VIRGIN ISLANDS | | 386,586 |
Canada - 0.5% |
Cara Operations Ltd. | 3,700 | | 100,338 |
Imperial Oil Ltd. | 17,900 | | 595,617 |
McCoy Global, Inc. | 15,800 | | 35,766 |
New Look Vision Group, Inc. | 2,600 | | 59,651 |
Pason Systems, Inc. | 37,100 | | 545,889 |
Potash Corp. of Saskatchewan, Inc. | 20,100 | | 407,042 |
ShawCor Ltd. Class A | 1,400 | | 29,711 |
TOTAL CANADA | | 1,774,014 |
Cayman Islands - 2.1% |
58.com, Inc. ADR (a) | 8,200 | | 430,418 |
Alibaba Group Holding Ltd. sponsored ADR (a) | 16,100 | | 1,349,663 |
ENN Energy Holdings Ltd. | 78,000 | | 446,834 |
Fu Shou Yuan International Group Ltd. | 494,000 | | 336,826 |
Hengan International Group Co. Ltd. | 48,500 | | 523,724 |
Shenzhou International Group Holdings Ltd. | 79,000 | | 389,310 |
Sino Biopharmaceutical Ltd. | 340,000 | | 422,518 |
TAL Education Group ADR (a) | 10,100 | | 388,345 |
Tencent Holdings Ltd. | 127,600 | | 2,405,181 |
Value Partners Group Ltd. | 48,000 | | 50,828 |
Vipshop Holdings Ltd. ADR (a) | 18,400 | | 377,568 |
TOTAL CAYMAN ISLANDS | | 7,121,215 |
China - 1.8% |
Beijing Capital International Airport Co. Ltd. (H Shares) | 378,000 | | 404,592 |
China Life Insurance Co. Ltd. (H Shares) | 121,000 | | 436,336 |
Common Stocks - continued |
| Shares | | Value |
China - continued |
China Pacific Insurance (Group) Co. Ltd. (H Shares) | 159,400 | | $ 634,953 |
Fuyao Glass Industries Group Co. Ltd. (a) | 146,400 | | 312,977 |
Inner Mongoli Yili Industries Co. Ltd. | 138,900 | | 349,387 |
Jiangsu Hengrui Medicine Co. Ltd. | 47,430 | | 393,525 |
Kweichow Moutai Co. Ltd. | 11,840 | | 399,763 |
PICC Property & Casualty Co. Ltd. (H Shares) | 233,340 | | 529,465 |
Ping An Insurance (Group) Co. of China Ltd. (H Shares) | 182,500 | | 1,024,418 |
Shanghai International Airport Co. Ltd. | 81,800 | | 390,218 |
Weifu High-Technology Co. Ltd. (B Shares) | 108,467 | | 276,545 |
Zhengzhou Yutong Bus Co. Ltd. | 109,150 | | 375,945 |
Zhuzhou CSR Times Electric Co. Ltd. (H Shares) | 62,000 | | 401,353 |
TOTAL CHINA | | 5,929,477 |
Denmark - 1.4% |
Jyske Bank A/S (Reg.) (a) | 20,654 | | 1,008,285 |
Novo Nordisk A/S Series B sponsored ADR | 62,760 | | 3,337,577 |
Spar Nord Bank A/S | 12,631 | | 121,052 |
Topdanmark A/S (a) | 12,300 | | 327,304 |
TOTAL DENMARK | | 4,794,218 |
Egypt - 0.1% |
Commercial International Bank SAE sponsored GDR | 72,000 | | 421,200 |
Finland - 0.6% |
Sampo Oyj (A Shares) | 29,153 | | 1,425,944 |
Tikkurila Oyj | 21,880 | | 401,567 |
TOTAL FINLAND | | 1,827,511 |
France - 6.6% |
Atos Origin SA | 14,974 | | 1,194,620 |
AXA SA | 69,506 | | 1,854,984 |
Capgemini SA | 16,802 | | 1,497,136 |
Havas SA | 85,186 | | 739,094 |
Laurent-Perrier Group SA | 759 | | 65,761 |
LVMH Moet Hennessy - Louis Vuitton SA | 1,925 | | 358,376 |
Orange SA | 71,800 | | 1,265,955 |
Renault SA | 6,811 | | 642,093 |
Safran SA | 20,714 | | 1,573,312 |
Sanofi SA | 30,785 | | 3,105,463 |
Societe Generale Series A | 28,000 | | 1,300,410 |
Total SA (d) | 80,020 | | 3,869,674 |
Unibail-Rodamco | 5,100 | | 1,425,047 |
Vetoquinol SA | 1,500 | | 62,927 |
Common Stocks - continued |
| Shares | | Value |
France - continued |
VINCI SA | 24,800 | | $ 1,673,914 |
Virbac SA | 730 | | 145,578 |
Vivendi SA | 60,352 | | 1,451,877 |
TOTAL FRANCE | | 22,226,221 |
Germany - 3.5% |
alstria office REIT-AG | 4,700 | | 65,612 |
Axel Springer Verlag AG | 9,300 | | 522,996 |
BASF AG | 25,907 | | 2,122,401 |
Bayer AG | 23,512 | | 3,137,501 |
CompuGroup Medical AG | 6,146 | | 181,126 |
Continental AG | 2,483 | | 597,145 |
CTS Eventim AG | 8,680 | | 339,848 |
Fielmann AG | 2,358 | | 165,302 |
Fresenius SE & Co. KGaA | 19,200 | | 1,410,862 |
GEA Group AG | 6,958 | | 279,007 |
Linde AG | 10,749 | | 1,864,627 |
SAP AG | 7,272 | | 573,289 |
Wirecard AG | 7,400 | | 382,499 |
TOTAL GERMANY | | 11,642,215 |
Greece - 0.0% |
Titan Cement Co. SA (Reg.) | 3,144 | | 68,973 |
Hong Kong - 1.3% |
AIA Group Ltd. | 440,600 | | 2,583,384 |
CSPC Pharmaceutical Group Ltd. | 414,000 | | 385,453 |
Guangdong Investment Ltd. | 272,000 | | 382,530 |
Power Assets Holdings Ltd. | 52,500 | | 522,187 |
Techtronic Industries Co. Ltd. | 98,000 | | 358,256 |
TOTAL HONG KONG | | 4,231,810 |
India - 2.6% |
Adani Ports & Special Economic Zone (a) | 85,692 | | 386,907 |
Amara Raja Batteries Ltd. (a) | 23,398 | | 322,574 |
Asian Paints India Ltd. | 31,860 | | 403,764 |
Axis Bank Ltd. (a) | 43,505 | | 315,084 |
Bharti Infratel Ltd. (a) | 63,942 | | 379,772 |
Colgate-Palmolive (India) | 21,164 | | 308,526 |
Exide Industries Ltd. (a) | 132,621 | | 302,551 |
HCL Technologies Ltd. | 40,668 | | 541,301 |
HDFC Bank Ltd. (a) | 20,325 | | 407,652 |
Housing Development Finance Corp. Ltd. | 97,642 | | 1,870,341 |
Common Stocks - continued |
| Shares | | Value |
India - continued |
IndusInd Bank Ltd. | 23,714 | | $ 329,947 |
Jyothy Laboratories Ltd. | 20,417 | | 95,766 |
LIC Housing Finance Ltd. (a) | 49,289 | | 359,884 |
Lupin Ltd. | 15,199 | | 447,510 |
Maruti Suzuki India Ltd. (a) | 4,873 | | 331,429 |
Sun Pharmaceutical Industries Ltd. (a) | 45,647 | | 620,302 |
Tata Consultancy Services Ltd. | 19,367 | | 737,882 |
Titan Co. Ltd. (a) | 64,860 | | 351,863 |
Zee Entertainment Enterprises Ltd. | 59,051 | | 368,008 |
TOTAL INDIA | | 8,881,063 |
Indonesia - 0.9% |
PT ACE Hardware Indonesia Tbk | 7,719,100 | | 375,779 |
PT Bank Central Asia Tbk | 641,500 | | 602,643 |
PT Bank Rakyat Indonesia Tbk | 732,100 | | 560,317 |
PT Matahari Department Store Tbk | 325,700 | | 392,139 |
PT Media Nusantara Citra Tbk | 2,620,000 | | 339,948 |
PT Surya Citra Media Tbk | 1,657,100 | | 352,389 |
PT Tower Bersama Infrastructure Tbk (a) | 719,600 | | 374,775 |
TOTAL INDONESIA | | 2,997,990 |
Ireland - 1.6% |
Allergan PLC (a) | 3,100 | | 956,257 |
CRH PLC sponsored ADR | 55,829 | | 1,527,481 |
Dalata Hotel Group PLC (a) | 9,900 | | 49,207 |
FBD Holdings PLC | 5,372 | | 41,056 |
James Hardie Industries PLC: | | | |
CDI | 15,656 | | 202,668 |
sponsored ADR | 132,225 | | 1,738,759 |
Medtronic PLC | 10,100 | | 746,592 |
TOTAL IRELAND | | 5,262,020 |
Isle of Man - 0.1% |
Playtech Ltd. | 35,552 | | 469,148 |
Israel - 0.9% |
Azrieli Group | 11,596 | | 454,351 |
Check Point Software Technologies Ltd. (a) | 4,100 | | 348,254 |
Ituran Location & Control Ltd. | 1,661 | | 33,884 |
Sarine Technologies Ltd. | 30,200 | | 33,568 |
Strauss Group Ltd. (a) | 6,659 | | 95,398 |
Teva Pharmaceutical Industries Ltd. sponsored ADR | 34,109 | | 2,018,912 |
TOTAL ISRAEL | | 2,984,367 |
Common Stocks - continued |
| Shares | | Value |
Italy - 1.1% |
Azimut Holding SpA | 22,414 | | $ 539,535 |
Banco di Desio e della Brianza SpA | 19,000 | | 65,020 |
Beni Stabili SpA SIIQ | 255,326 | | 210,296 |
Interpump Group SpA | 53,691 | | 791,154 |
Intesa Sanpaolo SpA | 273,300 | | 952,093 |
Mediaset SpA | 120,600 | | 612,694 |
Telecom Italia SpA (a) | 361,000 | | 503,625 |
TOTAL ITALY | | 3,674,417 |
Japan - 14.0% |
Aoki Super Co. Ltd. | 6,000 | | 63,459 |
Artnature, Inc. | 12,000 | | 115,385 |
Asahi Co. Ltd. | 7,500 | | 73,666 |
Asia Securities Printing Co. Ltd. | 11,000 | | 81,075 |
Astellas Pharma, Inc. | 241,900 | | 3,511,053 |
Autobacs Seven Co. Ltd. | 5,300 | | 92,939 |
Azbil Corp. | 7,500 | | 189,219 |
Broadleaf Co. Ltd. | 2,800 | | 32,073 |
Coca-Cola Central Japan Co. Ltd. | 27,200 | | 382,279 |
Daiichikosho Co. Ltd. | 3,100 | | 103,391 |
Daikokutenbussan Co. Ltd. | 5,000 | | 171,761 |
DENSO Corp. | 56,500 | | 2,634,182 |
Dentsu, Inc. | 21,800 | | 1,225,555 |
East Japan Railway Co. | 23,900 | | 2,272,307 |
Fast Retailing Co. Ltd. | 2,600 | | 949,734 |
GCA Savvian Group Corp. | 6,400 | | 75,145 |
Glory Ltd. | 4,900 | | 123,967 |
Goldcrest Co. Ltd. | 7,460 | | 139,580 |
Hoya Corp. | 61,000 | | 2,517,273 |
Itochu Corp. | 79,000 | | 988,526 |
Iwatsuka Confectionary Co. Ltd. | 800 | | 41,351 |
Japan Digital Laboratory Co. | 5,700 | | 72,884 |
Japan Tobacco, Inc. | 73,900 | | 2,557,811 |
KDDI Corp. | 50,500 | | 1,222,016 |
Keyence Corp. | 2,921 | | 1,520,697 |
Kobayashi Pharmaceutical Co. Ltd. | 2,000 | | 155,057 |
Koshidaka Holdings Co. Ltd. | 4,000 | | 72,412 |
Lasertec Corp. | 6,200 | | 67,661 |
Makita Corp. | 12,900 | | 706,828 |
Medikit Co. Ltd. | 2,100 | | 62,618 |
Meiko Network Japan Co. Ltd. | 2,700 | | 32,055 |
Miraial Co. Ltd. | 2,400 | | 23,282 |
Common Stocks - continued |
| Shares | | Value |
Japan - continued |
Mitsubishi UFJ Financial Group, Inc. | 372,800 | | $ 2,411,097 |
Mitsui Fudosan Co. Ltd. | 55,000 | | 1,496,751 |
Nagaileben Co. Ltd. | 8,100 | | 138,063 |
ND Software Co. Ltd. | 6,000 | | 69,259 |
Nihon Parkerizing Co. Ltd. | 18,500 | | 164,562 |
Nintendo Co. Ltd. | 3,900 | | 623,480 |
Nippon Prologis REIT, Inc. | 253 | | 444,921 |
Nippon Seiki Co. Ltd. | 2,000 | | 41,912 |
Nippon Telegraph & Telephone Corp. | 43,400 | | 1,591,105 |
NS Tool Co. Ltd. | 3,800 | | 65,977 |
OBIC Co. Ltd. | 19,800 | | 1,044,984 |
Olympus Corp. | 23,900 | | 806,179 |
ORIX Corp. | 72,100 | | 1,052,933 |
OSG Corp. | 26,500 | | 498,470 |
Paramount Bed Holdings Co. Ltd. | 3,200 | | 102,641 |
San-Ai Oil Co. Ltd. | 11,000 | | 84,019 |
Seven & i Holdings Co. Ltd. | 23,200 | | 1,053,856 |
Seven Bank Ltd. | 464,800 | | 2,117,887 |
Shinsei Bank Ltd. | 386,000 | | 809,354 |
SHO-BOND Holdings Co. Ltd. | 22,100 | | 877,702 |
Shoei Co. Ltd. | 5,800 | | 100,171 |
SK Kaken Co. Ltd. | 1,000 | | 97,395 |
Software Service, Inc. | 1,600 | | 60,309 |
Sony Corp. | 29,700 | | 844,235 |
Sony Financial Holdings, Inc. | 47,800 | | 856,700 |
Sumitomo Mitsui Financial Group, Inc. | 45,700 | | 1,823,141 |
Techno Medica Co. Ltd. | 1,800 | | 41,100 |
The Monogatari Corp. | 1,500 | | 63,769 |
The Nippon Synthetic Chemical Industry Co. Ltd. | 10,000 | | 74,067 |
TKC Corp. | 4,000 | | 94,286 |
Tocalo Co. Ltd. | 2,800 | | 56,205 |
Toyota Motor Corp. | 46,600 | | 2,854,923 |
Tsutsumi Jewelry Co. Ltd. | 2,100 | | 41,738 |
USS Co. Ltd. | 122,900 | | 2,169,662 |
Workman Co. Ltd. | 1,900 | | 117,092 |
Yamada Consulting Group Co. Ltd. | 2,000 | | 58,539 |
Yamato Kogyo Co. Ltd. | 3,000 | | 79,911 |
TOTAL JAPAN | | 47,205,636 |
Kenya - 0.2% |
Safaricom Ltd. | 4,194,300 | | 589,791 |
Common Stocks - continued |
| Shares | | Value |
Korea (South) - 2.3% |
AMOREPACIFIC Corp. | 1,794 | | $ 593,145 |
BGFretail Co. Ltd. | 4,899 | | 729,420 |
Coway Co. Ltd. | 5,899 | | 440,189 |
KEPCO Plant Service & Engineering Co. Ltd. | 3,867 | | 352,232 |
Leeno Industrial, Inc. | 1,159 | | 44,410 |
LG Chemical Ltd. | 2,282 | | 608,589 |
LG Household & Health Care Ltd. | 639 | | 529,996 |
NAVER Corp. | 2,349 | | 1,234,399 |
Samsung Electronics Co. Ltd. | 2,749 | | 3,303,317 |
TOTAL KOREA (SOUTH) | | 7,835,697 |
Luxembourg - 0.4% |
Eurofins Scientific SA | 1,000 | | 362,060 |
RTL Group SA | 7,027 | | 607,361 |
Samsonite International SA | 112,800 | | 333,125 |
TOTAL LUXEMBOURG | | 1,302,546 |
Mexico - 1.7% |
Banregio Grupo Financiero S.A.B. de CV | 53,600 | | 289,161 |
Consorcio ARA S.A.B. de CV (a) | 249,855 | | 93,632 |
Fomento Economico Mexicano S.A.B. de CV: unit | 66,500 | | 656,916 |
sponsored ADR | 6,633 | | 657,264 |
Gruma S.A.B. de CV Series B | 26,500 | | 408,944 |
Grupo Aeroportuario del Pacifico SA de CV Series B | 43,100 | | 388,187 |
Grupo Aeroportuario del Sureste SA de CV Series B | 25,935 | | 401,669 |
Grupo Aeroportuario Norte S.A.B. de CV | 66,700 | | 343,074 |
Grupo Financiero Banorte S.A.B. de CV Series O | 118,900 | | 640,288 |
Grupo GICSA SA de CV (a) | 333,500 | | 325,064 |
Infraestructura Energetica Nova S.A.B. de CV | 67,300 | | 324,525 |
Megacable Holdings S.A.B. de CV unit | 96,000 | | 365,860 |
Promotora y Operadora de Infraestructura S.A.B. de CV (a) | 33,700 | | 422,551 |
Tenedora Nemak SA de CV (a) | 275,600 | | 398,605 |
TOTAL MEXICO | | 5,715,740 |
Netherlands - 2.0% |
Aalberts Industries NV | 7,600 | | 247,085 |
Hangzhou Hikvision Digital Technology Co. Ltd. ELS (BNP Paribas Arbitrage Warrant Program) warrants 10/21/16 (a) | 58,600 | | 319,201 |
Heijmans NV (Certificaten Van Aandelen) (a) | 5,881 | | 49,473 |
ING Groep NV (Certificaten Van Aandelen) | 198,723 | | 2,892,188 |
Koninklijke KPN NV | 141,019 | | 516,722 |
Common Stocks - continued |
| Shares | | Value |
Netherlands - continued |
Mylan N.V. | 8,700 | | $ 383,583 |
PostNL NV (a) | 74,300 | | 306,880 |
RELX NV | 108,169 | | 1,849,642 |
VastNed Retail NV | 4,790 | | 233,079 |
TOTAL NETHERLANDS | | 6,797,853 |
Norway - 0.0% |
Kongsberg Gruppen ASA | 4,100 | | 64,177 |
Philippines - 0.9% |
Ayala Corp. | 23,490 | | 391,201 |
GT Capital Holdings, Inc. | 12,765 | | 358,216 |
International Container Terminal Services, Inc. | 214,290 | | 377,807 |
Jollibee Food Corp. | 100,120 | | 440,038 |
Robinsons Land Corp. | 541,800 | | 354,176 |
SM Investments Corp. | 20,660 | | 385,704 |
SM Prime Holdings, Inc. | 874,700 | | 402,756 |
Universal Robina Corp. | 93,880 | | 402,271 |
TOTAL PHILIPPINES | | 3,112,169 |
Russia - 0.2% |
Magnit OJSC (a) | 3,230 | | 563,451 |
Singapore - 0.1% |
UOL Group Ltd. | 82,092 | | 383,104 |
South Africa - 2.1% |
Alexander Forbes Group Holding | 72,146 | | 45,459 |
Aspen Pharmacare Holdings Ltd. | 21,100 | | 473,885 |
Bidvest Group Ltd. | 18,532 | | 474,046 |
Clicks Group Ltd. | 60,379 | | 441,095 |
Discovery Ltd. | 38,167 | | 408,174 |
FirstRand Ltd. | 159,700 | | 586,109 |
Mr Price Group Ltd. | 26,300 | | 403,841 |
Naspers Ltd. Class N | 17,900 | | 2,621,815 |
Sanlam Ltd. | 111,700 | | 504,630 |
Steinhoff International Holdings Ltd. | 96,300 | | 589,463 |
Woolworths Holdings Ltd. | 62,400 | | 462,262 |
TOTAL SOUTH AFRICA | | 7,010,779 |
Spain - 2.6% |
Amadeus IT Holding SA Class A | 37,700 | | 1,606,866 |
Hispania Activos Inmobiliarios SA (a) | 38,400 | | 578,504 |
Iberdrola SA | 263,720 | | 1,884,128 |
Inditex SA | 85,664 | | 3,212,705 |
Common Stocks - continued |
| Shares | | Value |
Spain - continued |
Mediaset Espana Comunicacion SA | 52,300 | | $ 635,792 |
Merlin Properties Socimi SA | 36,100 | | 462,871 |
Prosegur Compania de Seguridad SA (Reg.) | 92,476 | | 411,849 |
TOTAL SPAIN | | 8,792,715 |
Sweden - 2.9% |
ASSA ABLOY AB (B Shares) | 118,500 | | 2,357,330 |
Atlas Copco AB (A Shares) (d) | 40,659 | | 1,061,263 |
Fagerhult AB | 50,855 | | 869,057 |
H&M Hennes & Mauritz AB (B Shares) | 32,638 | | 1,269,450 |
Intrum Justitia AB | 23,463 | | 843,109 |
Nordea Bank AB | 130,467 | | 1,443,092 |
Sandvik AB | 57,900 | | 541,486 |
Svenska Handelsbanken AB (A Shares) | 107,845 | | 1,464,695 |
TOTAL SWEDEN | | 9,849,482 |
Switzerland - 8.4% |
Compagnie Financiere Richemont SA Series A | 4,136 | | 354,652 |
Credit Suisse Group AG (e)(f) | 66,373 | | 1,527,630 |
Nestle SA | 92,983 | | 7,101,483 |
Novartis AG | 86,316 | | 7,819,260 |
Roche Holding AG (participation certificate) | 16,701 | | 4,534,303 |
Schindler Holding AG: | | | |
(participation certificate) | 6,011 | | 976,647 |
(Reg.) | 2,251 | | 366,190 |
Sika AG (Bearer) | 90 | | 295,372 |
Syngenta AG (Switzerland) | 2,018 | | 677,988 |
Tecan Group AG | 600 | | 81,825 |
UBS Group AG | 144,815 | | 2,900,644 |
Zurich Insurance Group AG | 5,815 | | 1,534,579 |
TOTAL SWITZERLAND | | 28,170,573 |
Taiwan - 1.8% |
Addcn Technology Co. Ltd. | 6,500 | | 63,168 |
Advantech Co. Ltd. | 52,000 | | 374,003 |
Catcher Technology Co. Ltd. | 46,000 | | 453,411 |
ECLAT Textile Co. Ltd. | 26,000 | | 383,613 |
Giant Manufacturing Co. Ltd. | 46,000 | | 347,852 |
Largan Precision Co. Ltd. | 6,870 | | 536,438 |
Merida Industry Co. Ltd. | 62,500 | | 366,741 |
Taiwan Semiconductor Manufacturing Co. Ltd. | 853,035 | | 3,594,241 |
TOTAL TAIWAN | | 6,119,467 |
Common Stocks - continued |
| Shares | | Value |
Thailand - 0.3% |
Airports of Thailand PCL (For. Reg.) | 51,200 | | $ 427,983 |
Bangkok Dusit Medical Services PCL (For. Reg.) | 627,000 | | 334,320 |
Thai Beverage PCL | 666,200 | | 320,355 |
TOTAL THAILAND | | 1,082,658 |
Turkey - 0.5% |
Koc Holding A/S | 91,000 | | 410,990 |
TAV Havalimanlari Holding A/S | 49,000 | | 384,887 |
Tofas Turk Otomobil Fabrikasi A/S | 49,916 | | 329,589 |
Tupras Turkiye Petrol Rafinelleri A/S (a) | 15,000 | | 396,172 |
TOTAL TURKEY | | 1,521,638 |
United Arab Emirates - 0.2% |
DP World Ltd. | 19,778 | | 399,713 |
First Gulf Bank PJSC | 103,339 | | 347,464 |
TOTAL UNITED ARAB EMIRATES | | 747,177 |
United Kingdom - 15.7% |
AA PLC | 19,973 | | 85,259 |
Al Noor Hospitals Group PLC | 1,200 | | 21,755 |
Associated British Foods PLC | 26,500 | | 1,411,450 |
AstraZeneca PLC (United Kingdom) | 33,388 | | 2,127,903 |
Aviva PLC | 183,905 | | 1,374,428 |
Babcock International Group PLC | 57,323 | | 851,878 |
BAE Systems PLC | 291,421 | | 1,971,315 |
Barclays PLC | 484,356 | | 1,725,655 |
Bellway PLC | 6,328 | | 253,246 |
Berendsen PLC | 61,555 | | 972,655 |
BG Group PLC | 48,500 | | 766,229 |
BP PLC sponsored ADR | 68,828 | | 2,457,160 |
Britvic PLC | 13,817 | | 148,889 |
Bunzl PLC | 43,632 | | 1,250,421 |
Compass Group PLC | 76,607 | | 1,316,944 |
Dechra Pharmaceuticals PLC | 9,100 | | 136,007 |
Derwent London PLC | 1,600 | | 95,703 |
DP Poland PLC (a) | 200,000 | | 69,757 |
Elementis PLC | 39,508 | | 142,884 |
Great Portland Estates PLC | 13,972 | | 191,592 |
H&T Group PLC | 10,000 | | 30,215 |
Hilton Food Group PLC | 5,400 | | 38,710 |
Howden Joinery Group PLC | 22,200 | | 158,660 |
HSBC Holdings PLC sponsored ADR | 58,966 | | 2,303,802 |
Imperial Tobacco Group PLC | 40,224 | | 2,169,706 |
Common Stocks - continued |
| Shares | | Value |
United Kingdom - continued |
Informa PLC | 217,724 | | $ 1,906,454 |
InterContinental Hotel Group PLC | 8,700 | | 347,647 |
InterContinental Hotel Group PLC ADR | 67,196 | | 2,679,776 |
ITE Group PLC | 29,900 | | 64,647 |
ITV PLC | 398,719 | | 1,551,415 |
Johnson Matthey PLC | 16,090 | | 641,192 |
JUST EAT Ltd. (a) | 14,240 | | 93,517 |
Liberty Global PLC LiLAC: | | | |
Class A (a) | 13,900 | | 618,828 |
Class A (a) | 4,450 | | 171,859 |
Lloyds Banking Group PLC | 2,410,900 | | 2,736,401 |
Meggitt PLC | 60,187 | | 328,085 |
Micro Focus International PLC | 34,100 | | 660,261 |
Mondi PLC | 18,300 | | 424,298 |
National Grid PLC | 119,880 | | 1,707,677 |
NMC Health PLC | 24,000 | | 281,928 |
Prudential PLC | 130,848 | | 3,056,151 |
Reckitt Benckiser Group PLC | 35,751 | | 3,488,959 |
Rightmove PLC | 7,500 | | 443,865 |
Rio Tinto PLC | 55,584 | | 2,025,774 |
Rolls-Royce Group PLC | 43,252 | | 457,369 |
SABMiller PLC | 39,863 | | 2,455,039 |
Shaftesbury PLC | 41,837 | | 606,584 |
Spectris PLC | 7,170 | | 184,258 |
Spirax-Sarco Engineering PLC | 6,199 | | 290,609 |
Taylor Wimpey PLC | 29,400 | | 89,740 |
Ted Baker PLC | 3,375 | | 157,492 |
Topps Tiles PLC | 29,400 | | 65,945 |
Ultra Electronics Holdings PLC | 5,901 | | 153,102 |
Unite Group PLC | 67,977 | | 696,876 |
Vodafone Group PLC sponsored ADR | 66,926 | | 2,206,550 |
TOTAL UNITED KINGDOM | | 52,664,521 |
United States of America - 9.2% |
A.O. Smith Corp. | 4,900 | | 376,418 |
Alphabet, Inc.: | | | |
Class A (a) | 2,180 | | 1,607,510 |
Class C | 542 | | 385,259 |
Altria Group, Inc. | 13,200 | | 798,204 |
ANSYS, Inc. (a) | 500 | | 47,655 |
Apple, Inc. | 3,300 | | 394,350 |
Autoliv, Inc. | 13,854 | | 1,679,659 |
Common Stocks - continued |
| Shares | | Value |
United States of America - continued |
Berkshire Hathaway, Inc. Class B (a) | 8,216 | | $ 1,117,540 |
BorgWarner, Inc. | 17,694 | | 757,657 |
Broadridge Financial Solutions, Inc. | 1,340 | | 79,837 |
Chevron Corp. | 7,400 | | 672,512 |
China Biologic Products, Inc. (a) | 10,700 | | 1,219,158 |
Cognizant Technology Solutions Corp. Class A (a) | 5,100 | | 347,361 |
Constellation Brands, Inc. Class A (sub. vtg.) | 9,100 | | 1,226,680 |
Domino's Pizza, Inc. | 4,000 | | 426,680 |
Ecolab, Inc. | 3,000 | | 361,050 |
Edgewell Personal Care Co. (a) | 5,600 | | 474,376 |
Facebook, Inc. Class A (a) | 3,100 | | 316,107 |
International Flavors & Fragrances, Inc. | 3,000 | | 348,180 |
Kennedy-Wilson Holdings, Inc. | 7,473 | | 183,238 |
Martin Marietta Materials, Inc. | 4,870 | | 755,581 |
MasterCard, Inc. Class A | 27,690 | | 2,741,033 |
McGraw Hill Financial, Inc. | 19,500 | | 1,806,480 |
MercadoLibre, Inc. (d) | 3,600 | | 354,132 |
Mettler-Toledo International, Inc. (a) | 1,220 | | 379,408 |
Mohawk Industries, Inc. (a) | 8,715 | | 1,703,783 |
Moody's Corp. | 9,200 | | 884,672 |
NIKE, Inc. Class B | 2,500 | | 327,575 |
Philip Morris International, Inc. | 17,300 | | 1,529,320 |
PPG Industries, Inc. | 3,500 | | 364,910 |
PriceSmart, Inc. | 8,685 | | 746,736 |
ResMed, Inc. | 11,220 | | 646,384 |
ResMed, Inc. CDI | 83,728 | | 475,587 |
Sherwin-Williams Co. | 2,700 | | 720,441 |
SS&C Technologies Holdings, Inc. | 21,954 | | 1,627,889 |
Visa, Inc. Class A | 39,424 | | 3,058,514 |
TOTAL UNITED STATES OF AMERICA | | 30,941,876 |
TOTAL COMMON STOCKS (Cost $282,399,968) |
331,207,827
|
Nonconvertible Preferred Stocks - 0.5% |
| | | |
Brazil - 0.2% |
Ambev SA sponsored ADR | 157,100 | | 765,077 |
Nonconvertible Preferred Stocks - continued |
| Shares | | Value |
Germany - 0.3% |
Sartorius AG (non-vtg.) | 1,150 | | $ 260,254 |
Volkswagen AG | 4,790 | | 574,968 |
TOTAL GERMANY | | 835,222 |
United Kingdom - 0.0% |
Rolls-Royce Group PLC | 4,009,460 | | 6,181 |
TOTAL NONCONVERTIBLE PREFERRED STOCKS (Cost $2,079,611) |
1,606,480
|
Money Market Funds - 1.8% |
| | | |
Fidelity Cash Central Fund, 0.18% (b) | 4,847,966 | | 4,847,966 |
Fidelity Securities Lending Cash Central Fund, 0.19% (b)(c) | 1,178,838 | | 1,178,838 |
TOTAL MONEY MARKET FUNDS (Cost $6,026,804) |
6,026,804
|
TOTAL INVESTMENT PORTFOLIO - 100.8% (Cost $290,506,383) | | 338,841,111 |
NET OTHER ASSETS (LIABILITIES) - (0.8)% | | (2,647,738) |
NET ASSETS - 100% | $ 336,193,373 |
Legend |
(a) Non-income producing |
(b) Affiliated fund that is generally available only to investment companies and other accounts managed by Fidelity Investments. The rate quoted is the annualized seven-day yield of the fund at period end. A complete unaudited listing of the fund's holdings as of its most recent quarter end is available upon request. In addition, each Fidelity Central Fund's financial statements, which are not covered by the Fund's Report of Independent Registered Public Accounting Firm, are available on the SEC's website or upon request. |
(c) Investment made with cash collateral received from securities on loan. |
(d) Security or a portion of the security is on loan at period end. |
(e) Security or a portion of the security purchased on a delayed delivery or when-issued basis. |
(f) Restricted securities - Investment in securities not registered under the Securities Act of 1933 (excluding 144A issues). At the end of the period, the value of restricted securities (excluding 144A issues) amounted to $1,527,630 or 0.5% of net assets. |
Additional information on each restricted holding is as follows: |
Security | Acquisition Date | Acquisition Cost |
Credit Suisse Group AG | 10/21/15 | $ 1,573,804 |
Affiliated Central Funds |
Information regarding fiscal year to date income earned by the Fund from investments in Fidelity Central Funds is as follows: |
Fund | Income earned |
Fidelity Cash Central Fund | $ 6,824 |
Fidelity Securities Lending Cash Central Fund | 66,496 |
Total | $ 73,320 |
Other Information |
Categorizations in the Schedule of Investments are based on country or territory of incorporation. |
The following is a summary of the inputs used, as of October 31, 2015, involving the Fund's assets and liabilities carried at fair value. The inputs or methodology used for valuing securities may not be an indication of the risk associated with investing in those securities. For more information on valuation inputs, and their aggregation into the levels used in the tables below, please refer to the Investment Valuation section in the accompanying Notes to Financial Statements. |
Valuation Inputs at Reporting Date: |
Description | Total | Level 1 | Level 2 | Level 3 |
Investments in Securities: | | | | |
Equities: | | | | |
Consumer Discretionary | $ 54,054,675 | $ 32,872,185 | $ 21,182,490 | $ - |
Consumer Staples | 38,629,594 | 17,080,622 | 21,548,972 | - |
Energy | 9,899,236 | 5,179,314 | 4,719,922 | - |
Financials | 72,564,874 | 29,512,803 | 43,052,071 | - |
Health Care | 50,571,004 | 15,643,544 | 34,927,460 | - |
Industrials | 37,121,641 | 17,589,943 | 19,531,698 | - |
Information Technology | 37,989,345 | 26,072,664 | 11,916,681 | - |
Materials | 17,048,022 | 10,717,970 | 6,330,052 | - |
Telecommunication Services | 8,933,201 | 2,796,341 | 6,136,860 | - |
Utilities | 6,002,715 | 2,208,653 | 3,794,062 | - |
Money Market Funds | 6,026,804 | 6,026,804 | - | - |
Total Investments in Securities: | $ 338,841,111 | $ 165,700,843 | $ 173,140,268 | $ - |
The following is a summary of transfers between Level 1 and Level 2 for the period ended October 31, 2015. Transfers are assumed to have occurred at the beginning of the period, and are primarily attributable to the valuation techniques used for foreign equity securities, as discussed in the accompanying Notes to Financial Statements: |
Transfers | Total |
Level 1 to Level 2 | $ 21,750,246 |
Level 2 to Level 1 | $ 5,233,388 |
See accompanying notes which are an integral part of the financial statements.
Annual Report
Statement of Assets and Liabilities
| | October 31, 2015 |
| | |
Assets | | |
Investment in securities, at value (including securities loaned of $1,139,521) - See accompanying schedule: Unaffiliated issuers (cost $284,479,579) | $ 332,814,307 | |
Fidelity Central Funds (cost $6,026,804) | 6,026,804 | |
Total Investments (cost $290,506,383) | | $ 338,841,111 |
Cash | | 1,590 |
Foreign currency held at value (cost $175,669) | | 175,634 |
Receivable for investments sold | | 1,013,105 |
Receivable for fund shares sold | | 44,564 |
Dividends receivable | | 857,236 |
Distributions receivable from Fidelity Central Funds | | 1,951 |
Prepaid expenses | | 952 |
Receivable from investment adviser for expense reductions | | 1,548 |
Other receivables | | 19,861 |
Total assets | | 340,957,552 |
| | |
Liabilities | | |
Payable for investments purchased | | |
Regular delivery | $ 1,536,109 | |
Delayed delivery | 1,527,630 | |
Payable for fund shares redeemed | 123,606 | |
Accrued management fee | 222,046 | |
Distribution and service plan fees payable | 10,393 | |
Other affiliated payables | 48,898 | |
Other payables and accrued expenses | 116,659 | |
Collateral on securities loaned, at value | 1,178,838 | |
Total liabilities | | 4,764,179 |
| | |
Net Assets | | $ 336,193,373 |
Net Assets consist of: | | |
Paid in capital | | $ 314,144,944 |
Undistributed net investment income | | 3,560,437 |
Accumulated undistributed net realized gain (loss) on investments and foreign currency transactions | | (29,842,964) |
Net unrealized appreciation (depreciation) on investments and assets and liabilities in foreign currencies | | 48,330,956 |
Net Assets | | $ 336,193,373 |
See accompanying notes which are an integral part of the financial statements.
Annual Report
Statement of Assets and Liabilities - continued
| | October 31, 2015 |
| | |
Calculation of Maximum Offering Price | | |
Class A: | | |
Net Asset Value and redemption price per share ($9,162,555 ÷ 1,176,591 shares) | | $ 7.79 |
| | |
Maximum offering price per share (100/94.25 of $7.79) | | $ 8.27 |
Class T: | | |
Net Asset Value and redemption price per share ($13,961,648 ÷ 1,786,816 shares) | | $ 7.81 |
| | |
Maximum offering price per share (100/96.50 of $7.81) | | $ 8.09 |
Class B: | | |
Net Asset Value and offering price per share ($120,373 ÷ 15,363 shares)A | | $ 7.84 |
| | |
Class C: | | |
Net Asset Value and offering price per share ($3,311,463 ÷ 426,307 shares)A | | $ 7.77 |
| | |
Total International Equity: | | |
Net Asset Value, offering price and redemption price per share ($307,035,025 ÷ 39,274,070 shares) | | $ 7.82 |
| | |
Class I: | | |
Net Asset Value, offering price and redemption price per share ($2,602,309 ÷ 334,453 shares) | | $ 7.78 |
A Redemption price per share is equal to net asset value less any applicable contingent deferred sales charge.
See accompanying notes which are an integral part of the financial statements.
Annual Report
Financial Statements - continued
Statement of Operations
| Year ended October 31, 2015 |
| | |
Investment Income | | |
Dividends | | $ 8,666,142 |
Interest | | 9 |
Income from Fidelity Central Funds | | 73,320 |
Income before foreign taxes withheld | | 8,739,471 |
Less foreign taxes withheld | | (693,695) |
Total income | | 8,045,776 |
| | |
Expenses | | |
Management fee | | |
Basic fee | $ 2,445,747 | |
Performance adjustment | 351,396 | |
Transfer agent fees | 439,574 | |
Distribution and service plan fees | 123,737 | |
Accounting and security lending fees | 181,662 | |
Custodian fees and expenses | 211,850 | |
Independent trustees' compensation | 1,490 | |
Registration fees | 75,502 | |
Audit | 84,991 | |
Legal | 902 | |
Miscellaneous | 2,736 | |
Total expenses before reductions | 3,919,587 | |
Expense reductions | (44,429) | 3,875,158 |
Net investment income (loss) | | 4,170,618 |
Realized and Unrealized Gain (Loss) | | |
Net realized gain (loss) on: | | |
Investment securities: | | |
Unaffiliated issuers (net of foreign taxes of $103,574) | (5,650,183) | |
Foreign currency transactions | (202,557) | |
Total net realized gain (loss) | | (5,852,740) |
Change in net unrealized appreciation (depreciation) on: Investment securities (net of decrease in deferred foreign taxes of $193,627) | (608,996) | |
Assets and liabilities in foreign currencies | 50,417 | |
Total change in net unrealized appreciation (depreciation) | | (558,579) |
Net gain (loss) | | (6,411,319) |
Net increase (decrease) in net assets resulting from operations | | $ (2,240,701) |
See accompanying notes which are an integral part of the financial statements.
Annual Report
Statement of Changes in Net Assets
| Year ended
October 31,
2015 | Year ended
October 31,
2014 |
Increase (Decrease) in Net Assets | | |
Operations | | |
Net investment income (loss) | $ 4,170,618 | $ 7,173,996 |
Net realized gain (loss) | (5,852,740) | 5,639,847 |
Change in net unrealized appreciation (depreciation) | (558,579) | (11,137,910) |
Net increase (decrease) in net assets resulting from operations | (2,240,701) | 1,675,933 |
Distributions to shareholders from net investment income | (5,482,469) | (5,090,375) |
Distributions to shareholders from net realized gain | (1,726,810) | (7,679,276) |
Total distributions | (7,209,279) | (12,769,651) |
Share transactions - net increase (decrease) | (4,678,824) | 13,925,925 |
Redemption fees | 1,289 | 3,247 |
Total increase (decrease) in net assets | (14,127,515) | 2,835,454 |
| | |
Net Assets | | |
Beginning of period | 350,320,888 | 347,485,434 |
End of period (including undistributed net investment income of $3,560,437 and undistributed net investment income of $5,238,848, respectively) | $ 336,193,373 | $ 350,320,888 |
See accompanying notes which are an integral part of the financial statements.
Annual Report
Financial Highlights - Fidelity Total International Equity Fund Class A
Years ended October 31, | 2015 | 2014 | 2013 | 2012 | 2011 |
Selected Per-Share Data | | | | | |
Net asset value, beginning of period | $ 8.00 | $ 8.27 | $ 7.31 | $ 6.67 | $ 7.36 |
Income from Investment Operations | | | | | |
Net investment income (loss)C | .07 | .13 | .09 | .13 | .11 |
Net realized and unrealized gain (loss) | (.14) | (.12) | 1.24 | .59 | (.69) |
Total from investment operations | (.07) | .01 | 1.33 | .72 | (.58) |
Distributions from net investment income | (.10) | (.10) | (.13) | (.08) | (.09) |
Distributions from net realized gain | (.04) | (.18) | (.25) | - | (.02) |
Total distributions | (.14) | (.28) | (.37) H | (.08) | (.11) |
Redemption fees added to paid in capitalC, G | - | - | - | - | - |
Net asset value, end of period | $ 7.79 | $ 8.00 | $ 8.27 | $ 7.31 | $ 6.67 |
Total ReturnA, B | (.89)% | .19% | 19.00% | 10.88% | (8.03)% |
Ratios to Average Net AssetsD, F | | | | | |
Expenses before reductions | 1.48% | 1.44% | 1.50% | 1.57% | 1.73% |
Expenses net of fee waivers, if any | 1.45% | 1.44% | 1.45% | 1.45% | 1.45% |
Expenses net of all reductions | 1.44% | 1.44% | 1.43% | 1.42% | 1.42% |
Net investment income (loss) | .86% | 1.63% | 1.21% | 1.88% | 1.44% |
Supplemental Data | | | | | |
Net assets, end of period (000 omitted) | $ 9,163 | $ 9,164 | $ 9,034 | $ 5,767 | $ 4,307 |
Portfolio turnover rateE | 53% | 85% | 89% | 110% | 75% |
A Total returns would have been lower if certain expenses had not been reduced during the applicable periods shown.
B Total returns do not include the effect of the sales charges.
C Calculated based on average shares outstanding during the period.
D Fees and expenses of any underlying Fidelity Central Funds are not included in the Fund's expense ratio. The Fund indirectly bears its proportionate share of the expenses of any underlying Fidelity Central Funds.
E Amount does not include the portfolio activity of any underlying Fidelity Central Funds.
F Expense ratios reflect operating expenses of the class. Expenses before reductions do not reflect amounts reimbursed by the investment adviser or reductions from brokerage service arrangements or reductions from other expense offset arrangements and do not represent the amount paid by the class during periods when reimbursements or reductions occur. Expenses net of fee waivers reflect expenses after reimbursement by the investment adviser but prior to reductions from brokerage service arrangements or other expense offset arrangements. Expenses net of all reductions represent the net expenses paid by the class.
G Amount represents less than $.005 per share.
H Total distributions of $.37 per share is comprised of distributions from net investment income of $.126 and distributions from net realized gain of $.245 per share.
See accompanying notes which are an integral part of the financial statements.
Annual Report
Financial Highlights - Fidelity Total International Equity Fund Class T
Years ended October 31, | 2015 | 2014 | 2013 | 2012 | 2011 |
Selected Per-Share Data | | | | | |
Net asset value, beginning of period | $ 8.04 | $ 8.32 | $ 7.37 | $ 6.73 | $ 7.41 |
Income from Investment Operations | | | | | |
Net investment income (loss) C | .05 | .11 | .07 | .11 | .09 |
Net realized and unrealized gain (loss) | (.15) | (.12) | 1.25 | .59 | (.68) |
Total from investment operations | (.10) | (.01) | 1.32 | .70 | (.59) |
Distributions from net investment income | (.09) | (.09) | (.13) | (.06) | (.07) |
Distributions from net realized gain | (.04) | (.18) | (.25) | - | (.02) |
Total distributions | (.13) | (.27) | (.37) H | (.06) | (.09) |
Redemption fees added to paid in capitalC, G | - | - | - | - | - |
Net asset value, end of period | $ 7.81 | $ 8.04 | $ 8.32 | $ 7.37 | $ 6.73 |
Total ReturnA, B | (1.26)% | (.06)% | 18.73% | 10.52% | (8.08)% |
Ratios to Average Net AssetsD, F | | | | | |
Expenses before reductions | 1.70% | 1.68% | 1.75% | 1.84% | 2.02% |
Expenses net of fee waivers, if any | 1.70% | 1.68% | 1.70% | 1.70% | 1.70% |
Expenses net of all reductions | 1.69% | 1.68% | 1.67% | 1.67% | 1.67% |
Net investment income (loss) | .61% | 1.38% | .96% | 1.63% | 1.19% |
Supplemental Data | | | | | |
Net assets, end of period (000 omitted) | $ 13,962 | $ 10,282 | $ 7,909 | $ 2,348 | $ 997 |
Portfolio turnover rateE | 53% | 85% | 89% | 110% | 75% |
A Total returns would have been lower if certain expenses had not been reduced during the applicable periods shown.
B Total returns do not include the effect of the sales charges.
C Calculated based on average shares outstanding during the period.
D Fees and expenses of any underlying Fidelity Central Funds are not included in the Fund's expense ratio. The Fund indirectly bears its proportionate share of the expenses of any underlying Fidelity Central Funds.
E Amount does not include the portfolio activity of any underlying Fidelity Central Funds.
F Expense ratios reflect operating expenses of the class. Expenses before reductions do not reflect amounts reimbursed by the investment adviser or reductions from brokerage service arrangements or reductions from other expense offset arrangements and do not represent the amount paid by the class during periods when reimbursements or reductions occur. Expenses net of fee waivers reflect expenses after reimbursement by the investment adviser but prior to reductions from brokerage service arrangements or other expense offset arrangements. Expenses net of all reductions represent the net expenses paid by the class.
G Amount represents less than $.005 per share.
H Total distributions of $.37 per share is comprised of distributions from net investment income of $.128 and distributions from net realized gain of $.245 per share.
See accompanying notes which are an integral part of the financial statements.
Annual Report
Financial Highlights - Fidelity Total International Equity Fund Class B
Years ended October 31, | 2015 | 2014 | 2013 | 2012 | 2011 |
Selected Per-Share Data | | | | | |
Net asset value, beginning of period | $ 8.05 | $ 8.31 | $ 7.33 | $ 6.68 | $ 7.37 |
Income from Investment Operations | | | | | |
Net investment income (loss) C | .01 | .07 | .04 | .08 | .05 |
Net realized and unrealized gain (loss) | (.14) | (.12) | 1.24 | .59 | (.68) |
Total from investment operations | (.13) | (.05) | 1.28 | .67 | (.63) |
Distributions from net investment income | (.04) | (.03) | (.05) | (.02) | (.04) |
Distributions from net realized gain | (.04) | (.18) | (.25) | - | (.02) |
Total distributions | (.08) | (.21) | (.30) | (.02) | (.06) |
Redemption fees added to paid in capitalC, G | - | - | - | - | - |
Net asset value, end of period | $ 7.84 | $ 8.05 | $ 8.31 | $ 7.33 | $ 6.68 |
Total ReturnA, B | (1.62)% | (.56)% | 18.05% | 10.05% | (8.66)% |
Ratios to Average Net AssetsD, F | | | | | |
Expenses before reductions | 2.26% | 2.22% | 2.26% | 2.34% | 2.51% |
Expenses net of fee waivers, if any | 2.20% | 2.20% | 2.20% | 2.20% | 2.20% |
Expenses net of all reductions | 2.19% | 2.20% | 2.18% | 2.17% | 2.17% |
Net investment income (loss) | .11% | .87% | .46% | 1.13% | .69% |
Supplemental Data | | | | | |
Net assets, end of period (000 omitted) | $ 120 | $ 168 | $ 192 | $ 220 | $ 254 |
Portfolio turnover rateE | 53% | 85% | 89% | 110% | 75% |
A Total returns would have been lower if certain expenses had not been reduced during the applicable periods shown.
B Total returns do not include the effect of the contingent deferred sales charge.
C Calculated based on average shares outstanding during the period.
D Fees and expenses of any underlying Fidelity Central Funds are not included in the Fund's expense ratio. The Fund indirectly bears its proportionate share of the expenses of any underlying Fidelity Central Funds.
E Amount does not include the portfolio activity of any underlying Fidelity Central Funds.
F Expense ratios reflect operating expenses of the class. Expenses before reductions do not reflect amounts reimbursed by the investment adviser or reductions from brokerage service arrangements or reductions from other expense offset arrangements and do not represent the amount paid by the class during periods when reimbursements or reductions occur. Expenses net of fee waivers reflect expenses after reimbursement by the investment adviser but prior to reductions from brokerage service arrangements or other expense offset arrangements. Expenses net of all reductions represent the net expenses paid by the class.
G Amount represents less than $.005 per share.
See accompanying notes which are an integral part of the financial statements.
Annual Report
Financial Highlights - Fidelity Total International Equity Fund Class C
Years ended October 31, | 2015 | 2014 | 2013 | 2012 | 2011 |
Selected Per-Share Data | | | | | |
Net asset value, beginning of period | $ 8.00 | $ 8.28 | $ 7.31 | $ 6.67 | $ 7.36 |
Income from Investment Operations | | | | | |
Net investment income (loss) C | .01 | .07 | .04 | .08 | .05 |
Net realized and unrealized gain (loss) | (.15) | (.12) | 1.25 | .58 | (.69) |
Total from investment operations | (.14) | (.05) | 1.29 | .66 | (.64) |
Distributions from net investment income | (.05) | (.05) | (.08) | (.02) | (.03) |
Distributions from net realized gain | (.04) | (.18) | (.25) | - | (.02) |
Total distributions | (.09) | (.23) | (.32) H | (.02) | (.05) |
Redemption fees added to paid in capitalC, G | - | - | - | - | - |
Net asset value, end of period | $ 7.77 | $ 8.00 | $ 8.28 | $ 7.31 | $ 6.67 |
Total ReturnA, B | (1.73)% | (.57)% | 18.30% | 9.98% | (8.72)% |
Ratios to Average Net AssetsD, F | | | | | |
Expenses before reductions | 2.26% | 2.22% | 2.26% | 2.31% | 2.51% |
Expenses net of fee waivers, if any | 2.20% | 2.20% | 2.20% | 2.20% | 2.20% |
Expenses net of all reductions | 2.19% | 2.20% | 2.18% | 2.17% | 2.17% |
Net investment income (loss) | .11% | .87% | .46% | 1.13% | .69% |
Supplemental Data | | | | | |
Net assets, end of period (000 omitted) | $ 3,311 | $ 4,028 | $ 3,584 | $ 2,737 | $ 1,396 |
Portfolio turnover rateE | 53% | 85% | 89% | 110% | 75% |
A Total returns would have been lower if certain expenses had not been reduced during the applicable periods shown.
B Total returns do not include the effect of the contingent deferred sales charge.
C Calculated based on average shares outstanding during the period.
D Fees and expenses of any underlying Fidelity Central Funds are not included in the Fund's expense ratio. The Fund indirectly bears its proportionate share of the expenses of any underlying Fidelity Central Funds.
E Amount does not include the portfolio activity of any underlying Fidelity Central Funds.
F Expense ratios reflect operating expenses of the class. Expenses before reductions do not reflect amounts reimbursed by the investment adviser or reductions from brokerage service arrangements or reductions from other expense offset arrangements and do not represent the amount paid by the class during periods when reimbursements or reductions occur. Expenses net of fee waivers reflect expenses after reimbursement by the investment adviser but prior to reductions from brokerage service arrangements or other expense offset arrangements. Expenses net of all reductions represent the net expenses paid by the class.
G Amount represents less than $.005 per share.
H Total distributions of $.32 per share is comprised of distributions from net investment income of $.075 and distributions from net realized gain of $.245 per share.
See accompanying notes which are an integral part of the financial statements.
Annual Report
Financial Highlights - Fidelity Total International Equity Fund
Years ended October 31, | 2015 | 2014 | 2013 | 2012 | 2011 |
Selected Per-Share Data | | | | | |
Net asset value, beginning of period | $ 8.03 | $ 8.29 | $ 7.32 | $ 6.69 | $ 7.37 |
Income from Investment Operations | | | | | |
Net investment income (loss) B | .10 | .16 | .12 | .15 | .12 |
Net realized and unrealized gain (loss) | (.14) | (.12) | 1.24 | .58 | (.68) |
Total from investment operations | (.04) | .04 | 1.36 | .73 | (.56) |
Distributions from net investment income | (.13) | (.12) | (.15) | (.10) | (.10) |
Distributions from net realized gain | (.04) | (.18) | (.25) | - | (.02) |
Total distributions | (.17) | (.30) | (.39)G | (.10) | (.12) |
Redemption fees added to paid in capitalB, F | - | - | - | - | - |
Net asset value, end of period | $ 7.82 | $ 8.03 | $ 8.29 | $ 7.32 | $ 6.69 |
Total ReturnA | (.51)% | .55% | 19.48% | 11.03% | (7.70)% |
Ratios to Average Net AssetsC, E | | | | | |
Expenses before reductions | 1.07% | 1.04% | 1.09% | 1.16% | 1.42% |
Expenses net of fee waivers, if any | 1.07% | 1.04% | 1.09% | 1.16% | 1.20% |
Expenses net of all reductions | 1.06% | 1.04% | 1.07% | 1.13% | 1.17% |
Net investment income (loss) | 1.24% | 2.03% | 1.57% | 2.16% | 1.69% |
Supplemental Data | | | | | |
Net assets, end of period (000 omitted) | $ 307,035 | $ 324,438 | $ 324,395 | $ 281,979 | $ 131,338 |
Portfolio turnover rateD | 53% | 85% | 89% | 110% | 75% |
A Total returns would have been lower if certain expenses had not been reduced during the applicable periods shown.
B Calculated based on average shares outstanding during the period.
C Fees and expenses of any underlying Fidelity Central Funds are not included in the Fund's expense ratio. The Fund indirectly bears its proportionate share of the expenses of any underlying Fidelity Central Funds.
D Amount does not include the portfolio activity of any underlying Fidelity Central Funds.
E Expense ratios reflect operating expenses of the class. Expenses before reductions do not reflect amounts reimbursed by the investment adviser or reductions from brokerage service arrangements or reductions from other expense offset arrangements and do not represent the amount paid by the class during periods when reimbursements or reductions occur. Expenses net of fee waivers reflect expenses after reimbursement by the investment adviser but prior to reductions from brokerage service arrangements or other expense offset arrangements. Expenses net of all reductions represent the net expenses paid by the class.
F Amount represents less than $.005 per share.
G Total distributions of $.39 per share is comprised of distributions from net investment income of $.148 and distributions from net realized gain of $.245 per share.
See accompanying notes which are an integral part of the financial statements.
Annual Report
Financial Highlights - Fidelity Total International Equity Fund Class I
Years ended October 31, | 2015 | 2014 | 2013 | 2012 | 2011 |
Selected Per-Share Data | | | | | |
Net asset value, beginning of period | $ 7.99 | $ 8.26 | $ 7.30 | $ 6.67 | $ 7.35 |
Income from Investment Operations | | | | | |
Net investment income (loss) B | .09 | .15 | .11 | .14 | .12 |
Net realized and unrealized gain (loss) | (.14) | (.12) | 1.24 | .59 | (.68) |
Total from investment operations | (.05) | .03 | 1.35 | .73 | (.56) |
Distributions from net investment income | (.12) | (.12) | (.15) | (.10) | (.10) |
Distributions from net realized gain | (.04) | (.18) | (.25) | - | (.02) |
Total distributions | (.16) | (.30) | (.39) G | (.10) | (.12) |
Redemption fees added to paid in capitalB, F | - | - | - | - | - |
Net asset value, end of period | $ 7.78 | $ 7.99 | $ 8.26 | $ 7.30 | $ 6.67 |
Total ReturnA | (.64)% | .37% | 19.40% | 11.06% | (7.72)% |
Ratios to Average Net AssetsC, E | | | | | |
Expenses before reductions | 1.17% | 1.15% | 1.21% | 1.27% | 1.48% |
Expenses net of fee waivers, if any | 1.17% | 1.15% | 1.20% | 1.20% | 1.20% |
Expenses net of all reductions | 1.16% | 1.15% | 1.18% | 1.17% | 1.17% |
Net investment income (loss) | 1.14% | 1.91% | 1.46% | 2.13% | 1.69% |
Supplemental Data | | | | | |
Net assets, end of period (000 omitted) | $ 2,602 | $ 2,240 | $ 2,372 | $ 1,514 | $ 197 |
Portfolio turnover rateD | 53% | 85% | 89% | 110% | 75% |
A Total returns would have been lower if certain expenses had not been reduced during the applicable periods shown.
B Calculated based on average shares outstanding during the period.
C Fees and expenses of any underlying Fidelity Central Funds are not included in the Fund's expense ratio. The Fund indirectly bears its proportionate share of the expenses of any underlying Fidelity Central Funds.
D Amount does not include the portfolio activity of any underlying Fidelity Central Funds.
E Expense ratios reflect operating expenses of the class. Expenses before reductions do not reflect amounts reimbursed by the investment adviser or reductions from brokerage service arrangements or reductions from other expense offset arrangements and do not represent the amount paid by the class during periods when reimbursements or reductions occur. Expenses net of fee waivers reflect expenses after reimbursement by the investment adviser but prior to reductions from brokerage service arrangements or other expense offset arrangements. Expenses net of all reductions represent the net expenses paid by the class.
F Amount represents less than $.005 per share.
G Total distributions of $.39 per share is comprised of distributions from net investment income of $.148 and distributions from net realized gain of $.245 per share.
See accompanying notes which are an integral part of the financial statements.
Annual Report
For the period ended October 31, 2015
1. Organization.
Fidelity Total International Equity Fund (the Fund) is a fund of Fidelity Investment Trust (the Trust) and is authorized to issue an unlimited number of shares. The Trust is registered under the Investment Company Act of 1940, as amended (the 1940 Act), as an open-end management investment company organized as a Massachusetts business trust. The Fund offers Class A, Class T, Class C, Total International Equity and Class I shares (formerly Institutional Class), each of which, along with Class B shares, has equal rights as to assets and voting privileges. Class B shares are closed to new accounts and additional purchases, except for exchanges and reinvestments. Each class has exclusive voting rights with respect to matters that affect that class. Class B shares will automatically convert to Class A shares after a holding period of seven years from the initial date of purchase. The Fund's investments in emerging markets can be subject to social, economic, regulatory, and political uncertainties and can be extremely volatile.
2. Investments in Fidelity Central Funds.
The Fund invests in Fidelity Central Funds, which are open-end investment companies generally available only to other investment companies and accounts managed by the investment adviser and its affiliates. The Fund's Schedule of Investments lists each of the Fidelity Central Funds held as of period end, if any, as an investment of the Fund, but does not include the underlying holdings of each Fidelity Central Fund. As an Investing Fund, the Fund indirectly bears its proportionate share of the expenses of the underlying Fidelity Central Funds.
The Money Market Central Funds seek preservation of capital and current income and are managed by Fidelity Investments Money Management, Inc. (FIMM), an affiliate of the investment adviser. Annualized expenses of the Money Market Central Funds as of their most recent shareholder report date are less than .005%.
A complete unaudited list of holdings for each Fidelity Central Fund is available upon request or at the Securities and Exchange Commission (the SEC) website at www.sec.gov. In addition, the financial statements of the Fidelity Central Funds, which are not covered by the Fund's Report of Independent Registered Public Accounting Firm, are available on the SEC website or upon request.
3. Significant Accounting Policies.
The financial statements have been prepared in conformity with accounting principles generally accepted in the United States of America (GAAP), which require management to make certain estimates and assumptions at the date of the financial statements. Actual results could differ from those estimates. Subsequent events, if any, through the date that the financial statements were issued have been evaluated in the preparation of
Annual Report
Notes to Financial Statements - continued
3. Significant Accounting Policies - continued
the financial statements. The following summarizes the significant accounting policies of the Fund:
Investment Valuation. Investments are valued as of 4:00 p.m. Eastern time on the last calendar day of the period. The Board of Trustees (the Board) has delegated the day to day responsibility for the valuation of the Fund's investments to the Fidelity Management & Research Company (FMR) Fair Value Committee (the Committee). In accordance with valuation policies and procedures approved by the Board, the Fund attempts to obtain prices from one or more third party pricing vendors or brokers to value its investments. When current market prices, quotations or currency exchange rates are not readily available or reliable, investments will be fair valued in good faith by the Committee, in accordance with procedures adopted by the Board. Factors used in determining fair value vary by investment type and may include market or investment specific events. The frequency with which these procedures are used cannot be predicted and they may be utilized to a significant extent. The Committee oversees the Fund's valuation policies and procedures and reports to the Board on the Committee's activities and fair value determinations. The Board monitors the appropriateness of the procedures used in valuing the Fund's investments and ratifies the fair value determinations of the Committee.
The Fund categorizes the inputs to valuation techniques used to value its investments into a disclosure hierarchy consisting of three levels as shown below:
Level 1 - quoted prices in active markets for identical investments
Level 2 - other significant observable inputs (including quoted prices for similar investments, interest rates, prepayment speeds, etc.)
Level 3 - unobservable inputs (including the Fund's own assumptions based on the best information available)
Valuation techniques used to value the Fund's investments by major category are as follows:
Equity securities, including restricted securities, for which market quotations are readily available, are valued at the last reported sale price or official closing price as reported by a third party pricing vendor on the primary market or exchange on which they are traded and are categorized as Level 1 in the hierarchy. In the event there were no sales during the day or closing prices are not available, securities are valued at the last quoted bid price or may be valued using the last available price and are generally categorized as Level 2 in the hierarchy. For foreign equity securities, when market or security specific events arise, comparisons to the valuation of American Depositary Receipts (ADRs), futures contracts, Exchange-Traded Funds (ETFs) and certain indexes as well as quoted prices for similar securities may be used and would be categorized as Level 2 in the hierarchy. Utilizing these techniques may result in transfers between Level 1 and Level 2.
Annual Report
3. Significant Accounting Policies - continued
Investment Valuation - continued
For equity securities, including restricted securities, where observable inputs are limited, assumptions about market activity and risk are used and these securities may be categorized as Level 3 in the hierarchy.
Investments in open-end mutual funds, including the Fidelity Central Funds, are valued at their closing net asset value (NAV) each business day and are categorized as Level 1 in the hierarchy.
Changes in valuation techniques may result in transfers in or out of an assigned level within the disclosure hierarchy. The aggregate value of investments by input level as of October 31, 2015 , including information on transfers between Levels 1 and 2 is included at the end of the Fund's Schedule of Investments.
Foreign Currency. The Fund may use foreign currency contracts to facilitate transactions in foreign-denominated securities. Gains and losses from these transactions may arise from changes in the value of the foreign currency or if the counterparties do not perform under the contracts' terms.
Foreign-denominated assets, including investment securities, and liabilities are translated into U.S. dollars at the exchange rates at period end. Purchases and sales of investment securities, income and dividends received and expenses denominated in foreign currencies are translated into U.S. dollars at the exchange rate in effect on the transaction date.
The effects of exchange rate fluctuations on investments are included with the net realized and unrealized gain (loss) on investment securities. Other foreign currency transactions resulting in realized and unrealized gain (loss) are disclosed separately.
Investment Transactions and Income. For financial reporting purposes, the Fund's investment holdings and NAV include trades executed through the end of the last business day of the period. The NAV per share for processing shareholder transactions is calculated as of the close of business of the New York Stock Exchange (NYSE), normally 4:00 p.m. Eastern time and includes trades executed through the end of the prior business day. Gains and losses on securities sold are determined on the basis of identified cost and may include proceeds received from litigation. Dividend income is recorded on the ex-dividend date, except for certain dividends from foreign securities where the ex-dividend date may have passed, which are recorded as soon as the Fund is informed of the ex-dividend date. Non-cash dividends included in dividend income, if any, are recorded at the fair market value of the securities received. Income and capital gain distributions from Fidelity Central Funds, if any, are recorded on the ex-dividend date.
Annual Report
Notes to Financial Statements - continued
3. Significant Accounting Policies - continued
Investment Transactions and Income - continued
Distributions received on securities that represent a return of capital or capital gain are recorded as a reduction of cost of investments and/or as a realized gain. Subsequent to ex-dividend date the Fund determines the components of these distributions, based upon receipt of tax filings or other correspondence relating to the underlying investment. Interest income is accrued as earned and includes coupon interest and amortization of premium and accretion of discount on debt securities as applicable. Investment income is recorded net of foreign taxes withheld where recovery of such taxes is uncertain.
Class Allocations and Expenses. Investment income, realized and unrealized capital gains and losses, common expenses of the Fund, and certain fund-level expense reductions, if any, are allocated daily on a pro-rata basis to each class based on the relative net assets of each class to the total net assets of the Fund. Each class differs with respect to transfer agent and distribution and service plan fees incurred. Certain expense reductions may also differ by class. For the reporting period, the allocated portion of income and expenses to each class as a percent of its average net assets may vary due to the timing of recording these transactions in relation to fluctuating net assets of the classes. Expenses directly attributable to a fund are charged to that fund. Expenses attributable to more than one fund are allocated among the respective funds on the basis of relative net assets or other appropriate methods. Expense estimates are accrued in the period to which they relate and adjustments are made when actual amounts are known.
Income Tax Information and Distributions to Shareholders. Each year, the Fund intends to qualify as a regulated investment company under Subchapter M of the Internal Revenue Code, including distributing substantially all of its taxable income and realized gains. As a result, no provision for U.S. Federal income taxes is required. As of October 31, 2015, the Fund did not have any unrecognized tax benefits in the financial statements; nor is the Fund aware of any tax positions for which it is reasonably possible that the total amounts of unrecognized tax benefits will significantly change in the next twelve months. The Fund files a U.S. federal tax return, in addition to state and local tax returns as required. The Fund's federal income tax returns are subject to examination by the Internal Revenue Service (IRS) for a period of three fiscal years after they are filed. State and local tax returns may be subject to examination for an additional fiscal year depending on the jurisdiction. Foreign taxes are provided for based on the Fund's understanding of the tax rules and rates that exist in the foreign markets in which it invests. The Fund is subject to a tax imposed on capital gains by certain countries in which it invests. An estimated deferred tax liability for net unrealized appreciation on the applicable securities is included in Other payables and accrued expenses on the Statement of Assets & Liabilities.
Annual Report
3. Significant Accounting Policies - continued
Income Tax Information and Distributions to Shareholders - continued
Distributions are declared and recorded on the ex-dividend date. Income dividends and capital gain distributions are declared separately for each class. Income and capital gain distributions are determined in accordance with income tax regulations, which may differ from GAAP. In addition, the Fund claimed a portion of the payment made to redeeming shareholders as a distribution for income tax purposes.
Capital accounts within the financial statements are adjusted for permanent book-tax differences. These adjustments have no impact on net assets or the results of operations. Capital accounts are not adjusted for temporary book-tax differences which will reverse in a subsequent period.
Book-tax differences are primarily due to foreign currency transactions, partnerships, certain foreign taxes, passive foreign investment companies (PFIC), capital loss carryforwards and losses deferred due to wash sales.
The federal tax cost of investment securities and unrealized appreciation (depreciation) as of period end were as follows:
Gross unrealized appreciation | $ 61,829,134 |
Gross unrealized depreciation | (15,260,483) |
Net unrealized appreciation (depreciation) on securities | $ 46,568,651 |
Tax Cost | $ 292,272,460 |
The tax-based components of distributable earnings as of period end were as follows:
Undistributed ordinary income | $ 3,561,043 |
Capital loss carryforward | $ (28,076,887) |
Net unrealized appreciation (depreciation) on securities and other investments | $ 46,594,811 |
Capital loss carryforwards are only available to offset future capital gains of the Fund to the extent provided by regulations and may be limited. Under the Regulated Investment Company Modernization Act of 2010 (the Act), the Fund is permitted to carry forward capital losses incurred in taxable years beginning after December 22, 2010 for an unlimited period and such capital losses are required to be used prior to any losses that expire. The capital loss carryforward information presented below, including any applicable limitation, is estimated as of fiscal period end and is subject to adjustment.
Fiscal year of expiration | |
2017 | $ (13,607,298) |
2019 | (8,855,997) |
Total with expiration | $ (22,463,295) |
No expiration Short-term | (5,613,592) |
Total Capital Loss carryforward | $ (28,076,887) |
Annual Report
Notes to Financial Statements - continued
3. Significant Accounting Policies - continued
Income Tax Information and Distributions to Shareholders - continued
Due to large subscriptions in a prior period, $22,463,295 of capital losses that will be available to offset future capital gains of the fund will be limited by approximately $4,535,766 per year.
The tax character of distributions paid was as follows:
| October 31, 2015 | October 31, 2014 |
Ordinary Income | $ 5,482,470 | $ 9,375,496 |
Long-term Capital Gains | 1,726,809 | 3,394,155 |
Total | $ 7,209,279 | $ 12,769,651 |
Short-Term Trading (Redemption) Fees. Shares held by investors in the Fund less than 30 days may have been subject to a redemption fee equal to 1.00% of the NAV of shares redeemed. All redemption fees, which reduce the proceeds of the shareholder redemption, are retained by the Fund and accounted for as an addition to paid in capital.
Delayed Delivery Transactions and When-Issued Securities. During the period, the Fund transacted in securities on a delayed delivery or when-issued basis. Payment and delivery may take place after the customary settlement period for that security. The price of the underlying securities and the date when the securities will be delivered and paid for are fixed at the time the transaction is negotiated. The securities purchased on a delayed delivery or when-issued basis are identified as such in the Fund's Schedule of Investments. With respect to purchase commitments, the Fund identifies securities as segregated in its records with a value at least equal to the amount of the commitment. Losses may arise due to changes in the value of the underlying securities or if the counterparty does not perform under the contract's terms, or if the issuer does not issue the securities due to political, economic, or other factors.
Restricted Securities. The Fund may invest in securities that are subject to legal or contractual restrictions on resale. These securities generally may be resold in transactions exempt from registration or to the public if the securities are registered. Disposal of these securities may involve time-consuming negotiations and expense, and prompt sale at an acceptable price may be difficult. Information regarding restricted securities is included at the end of the Fund's Schedule of Investments.
4. Purchases and Sales of Investments.
Purchases and sales of securities, other than short-term securities, aggregated $182,056,661 and $189,209,209, respectively.
Annual Report
5. Fees and Other Transactions with Affiliates.
Management Fee. Fidelity Management & Research Company (the investment adviser) and its affiliates provide the Fund with investment management related services for which the Fund pays a monthly management fee. The management fee is the sum of an individual fund fee rate that is based on an annual rate of .45% of the Fund's average net assets and an annualized group fee rate that averaged .25% during the period. The group fee rate is based upon the average net assets of all the mutual funds advised by the investment adviser, including any mutual funds previously advised by the investment adviser that are currently advised by Fidelity SelectCo, LLC, an affiliate of the investment adviser. The group fee rate decreases as assets under management increase and increases as assets under management decrease. In addition, the management fee is subject to a performance adjustment (up to a maximum of ± .20% of the Fund's average net assets over a 36 month performance period). The upward or downward adjustment to the management fee is based on the relative investment performance of Total International Equity as compared to its benchmark index, the MSCI All Country World ex USA Index, over the same 36 month performance period. For the reporting period, the total annual management fee rate, including the performance adjustment, was .80% of the Fund's average net assets. The performance adjustment included in the management fee rate may be higher or lower than the maximum performance adjustment rate due to the difference between the average net assets for the reporting and performance periods.
Distribution and Service Plan Fees. In accordance with Rule 12b-1 of the 1940 Act, the Fund has adopted separate Distribution and Service Plans for each class of shares. Certain classes pay Fidelity Distributors Corporation (FDC), an affiliate of the investment adviser, separate Distribution and Service Fees, each of which is based on an annual percentage of each class' average net assets. In addition, FDC may pay financial intermediaries for selling shares of the Fund and providing shareholder support services. For the period, the Distribution and Service Fee rates, total fees and amounts retained by FDC were as follows:
| Distribution
Fee | Service
Fee | Total Fees | Retained
by FDC |
Class A | -% | .25% | $ 22,038 | $ 1,374 |
Class T | .25% | .25% | 63,171 | - |
Class B | .75% | .25% | 1,553 | 1,165 |
Class C | .75% | .25% | 36,975 | 5,847 |
| | | $ 123,737 | $ 8,386 |
Sales Load. FDC may receive a front-end sales charge of up to 5.75% for selling Class A shares and 3.50% for selling Class T shares, some of which is paid to financial intermediaries for selling shares of the Fund. Depending on the holding period, FDC may receive contingent deferred sales charges levied on Class A, Class T, Class B, and Class C redemptions. The deferred sales charges range from 5.00% to 1.00% for Class B shares, 1.00% for Class C shares, 1.00% for certain purchases of Class A shares and .25% for certain purchases of Class T shares.
Annual Report
Notes to Financial Statements - continued
5. Fees and Other Transactions with Affiliates - continued
Sales Load - continued
For the period, sales charge amounts retained by FDC were as follows:
| Retained
by FDC |
Class A | $ 3,738 |
Class T | 1,496 |
Class BA | 66 |
Class C A | 383 |
| $ 5,683 |
A When Class B and Class C shares are initially sold, FDC pays commissions from its own resources to financial intermediaries through which the sales are made.
Transfer Agent Fees. Fidelity Investments Institutional Operations Company, Inc., (FIIOC), an affiliate of the investment adviser, is the transfer, dividend disbursing and shareholder servicing agent for each class of the Fund. FIIOC receives account fees and asset-based fees that vary according to the account size and type of account of the shareholders of the respective classes of the Fund. FIIOC pays for typesetting, printing and mailing of shareholder reports, except proxy statements.
For the period, transfer agent fees for each class were as follows:
| Amount | % of
Class-Level Average
Net Assets |
Class A | $ 23,946 | .27 |
Class T | 30,834 | .24 |
Class B | 468 | .30 |
Class C | 11,173 | .30 |
Total International Equity | 367,738 | .11 |
Class I | 5,415 | .21 |
| $ 439,574 | |
Accounting and Security Lending Fees. Fidelity Service Company, Inc. (FSC), an affiliate of the investment adviser, maintains the Fund's accounting records. The accounting fee is based on the level of average net assets for each month. Under a separate contract, FSC administers the security lending program. The security lending fee is based on the number and duration of lending transactions.
Brokerage Commissions. The Fund placed a portion of its portfolio transactions with brokerage firms which are affiliates of the investment adviser. Brokerage commissions are included in net realized gain (loss) and change in net unrealized appreciation (depreciation) in the Statement of Operations. The commissions paid to these affiliated firms were $462 for the period.
Annual Report
6. Committed Line of Credit.
The Fund participates with other funds managed by the investment adviser or an affiliate in a $4.25 billion credit facility (the "line of credit") to be utilized for temporary or emergency purposes to fund shareholder redemptions or for other short-term liquidity purposes. The Fund has agreed to pay commitment fees on its pro-rata portion of the line of credit, which amounted to $504 and is reflected in Miscellaneous expenses on the Statement of Operations. During the period, the Fund did not borrow on this line of credit.
7. Security Lending.
The Fund lends portfolio securities through a lending agent from time to time in order to earn additional income. For equity securities, a lending agent is used and may loan securities to certain qualified borrowers, including Fidelity Capital Markets (FCM), a broker-dealer affiliated with the Fund. On the settlement date of the loan, the Fund receives collateral (in the form of U.S. Treasury obligations, letters of credit and/or cash) against the loaned securities and maintains collateral in an amount not less than 100% of the market value of the loaned securities during the period of the loan. The market value of the loaned securities is determined at the close of business of the Fund and any additional required collateral is delivered to the Fund on the next business day. The Fund or borrower may terminate the loan at any time, and if the borrower defaults on its obligation to return the securities loaned because of insolvency or other reasons, the Fund may apply collateral received from the borrower against the obligation. The Fund may experience delays and costs in recovering the securities loaned. Any cash collateral received is invested in the Fidelity Securities Lending Cash Central Fund. The value of loaned securities and cash collateral at period end are disclosed on the Fund's Statement of Assets and Liabilities. At period end, there were no security loans outstanding with FCM. Security lending income represents the income earned on investing cash collateral, less rebates paid to borrowers and any lending agent fees associated with the loan, plus any premium payments received for lending certain types of securities. Security lending income is presented in the Statement of Operations as a component of income from Fidelity Central Funds. Total security lending income during the period amounted to $66,496, including $53 from securities loaned to FCM.
8. Expense Reductions.
The investment adviser contractually agreed to reimburse each class to the extent annual operating expenses exceeded certain levels of average net assets as noted in the table below. This reimbursement will remain in place through December 31, 2016. Some expenses, for example interest expense, including commitment fees, are excluded from this reimbursement.
Annual Report
Notes to Financial Statements - continued
8. Expense Reductions - continued
The following classes were in reimbursement during the period:
| Expense
Limitations | Reimbursement |
Class A | 1.45% | $ 2,649 |
Class B | 2.20% | 93 |
Class C | 2.20% | 2,440 |
| | $ 5,182 |
Commissions paid to certain brokers with whom the investment adviser, or its affiliates, places trades on behalf of the Fund include an amount in addition to trade execution, which may be rebated back to the Fund to offset certain expenses. This amount totaled $29,729 for the period.
In addition, during the period the investment adviser reimbursed and/or waived a portion of fund-level operating expenses in the amount of $1,440 and a portion of class-level operating expenses as follows:
| Amount |
Class A | $ 195 |
Class T | 195 |
Class C | 10 |
Total International Equity | 7,625 |
Class I | 53 |
| $ 8,078 |
9. Distributions to Shareholders.
Distributions to shareholders of each class were as follows:
Years ended October 31, | 2015 | 2014 |
From net investment income | | |
Class A | $ 113,499 | $ 114,661 |
Class T | 118,041 | 92,140 |
Class B | 852 | 757 |
Class C | 26,493 | 24,034 |
Total International Equity | 5,189,901 | 4,825,256 |
Class I | 33,683 | 33,527 |
Total | $ 5,482,469 | $ 5,090,375 |
Annual Report
9. Distributions to Shareholders - continued
Years ended October 31, | 2015 | 2014 |
From net realized gain | | |
Class A | $ 45,400 | $ 201,491 |
Class T | 52,463 | 179,326 |
Class B | 832 | 4,154 |
Class C | 19,994 | 83,657 |
Total International Equity | 1,596,893 | 7,158,781 |
Class I | 11,228 | 51,867 |
Total | $ 1,726,810 | $ 7,679,276 |
10. Share Transactions.
Share transactions for each class were as follows and may contain automatic conversions between classes or exchanges between funds:
| Shares | Dollars |
Years ended October 31, | 2015 | 2014 | 2015 | 2014 |
Class A | | | | |
Shares sold | 302,437 | 232,039 | $ 2,413,258 | $ 1,877,334 |
Reinvestment of distributions | 20,115 | 38,586 | 158,306 | 306,762 |
Shares redeemed | (290,995) | (217,382) | (2,277,557) | (1,752,622) |
Net increase (decrease) | 31,557 | 53,243 | $ 294,007 | $ 431,474 |
Class T | | | | |
Shares sold | 824,018 | 525,401 | $ 6,637,966 | $ 4,252,382 |
Reinvestment of distributions | 21,537 | 33,829 | 170,355 | 270,968 |
Shares redeemed | (337,655) | (230,852) | (2,691,540) | (1,883,437) |
Net increase (decrease) | 507,900 | 328,378 | $ 4,116,781 | $ 2,639,913 |
Class B | | | | |
Shares sold | 2,293 | 2,568 | $ 19,363 | $ 21,032 |
Reinvestment of distributions | 210 | 604 | 1,675 | 4,866 |
Shares redeemed | (7,999) | (5,357) | (62,934) | (43,506) |
Net increase (decrease) | (5,496) | (2,185) | $ (41,896) | $ (17,608) |
Class C | | | | |
Shares sold | 142,460 | 174,035 | $ 1,136,553 | $ 1,421,548 |
Reinvestment of distributions | 4,767 | 10,201 | 37,661 | 81,608 |
Shares redeemed | (224,769) | (113,485) | (1,823,746) | (922,884) |
Net increase (decrease) | (77,542) | 70,751 | $ (649,532) | $ 580,272 |
Total International Equity | | | | |
Shares sold | 6,834,390 | 7,329,051 | $ 54,586,662 | $ 59,640,689 |
Reinvestment of distributions | 851,193 | 1,486,031 | 6,698,889 | 11,828,806 |
Shares redeemed | (8,793,992) | (7,554,096) | (70,164,751) | (61,144,473) |
Net increase (decrease) | (1,108,409) | 1,260,986 | $ (8,879,200) | $ 10,325,022 |
Annual Report
Notes to Financial Statements - continued
10. Share Transactions - continued
| Shares | Dollars |
Years ended October 31, | 2015 | 2014 | 2015 | 2014 |
Class I | | | | |
Shares sold | 149,022 | 127,536 | $ 1,222,878 | $ 1,054,194 |
Reinvestment of distributions | 5,728 | 10,120 | 44,910 | 80,252 |
Shares redeemed | (100,501) | (144,685) | (786,772) | (1,167,594) |
Net increase (decrease) | 54,249 | (7,029) | $ 481,016 | $ (33,148) |
11. Other.
The Fund's organizational documents provide former and current trustees and officers with a limited indemnification against liabilities arising in connection with the performance of their duties to the Fund. In the normal course of business, the Fund may also enter into contracts that provide general indemnifications. The Fund's maximum exposure under these arrangements is unknown as this would be dependent on future claims that may be made against the Fund. The risk of material loss from such claims is considered remote.
At the end of the period, a shareholder of record owned approximately 71% of the total outstanding shares of the Fund.
Annual Report
To the Trustees of Fidelity Investment Trust and Shareholders of Fidelity Total International Equity Fund:
We have audited the accompanying statement of assets and liabilities of Fidelity Total International Equity Fund (the Fund), a fund of Fidelity Investment Trust, including the schedule of investments, as of October 31, 2015, and the related statement of operations for the year then ended, the statement of changes in net assets for each of the two years in the period then ended, and the financial highlights for each of the five years in the period then ended. These financial statements and financial highlights are the responsibility of the Fund's management. Our responsibility is to express an opinion on these financial statements and financial highlights based on our audits.
We conducted our audits in accordance with the standards of the Public Company Accounting Oversight Board (United States). Those standards require that we plan and perform the audit to obtain reasonable assurance about whether the financial statements and financial highlights are free of material misstatement. The Fund is not required to have, nor were we engaged to perform, an audit of its internal control over financial reporting. Our audits included consideration of internal control over financial reporting as a basis for designing audit procedures that are appropriate in the circumstances, but not for the purpose of expressing an opinion on the effectiveness of the Fund's internal control over financial reporting. Accordingly, we express no such opinion. An audit also includes examining, on a test basis, evidence supporting the amounts and disclosures in the financial statements, assessing the accounting principles used and significant estimates made by management, as well as evaluating the overall financial statement presentation. Our procedures included confirmation of securities owned as of October 31, 2015, by correspondence with the custodians and brokers; when replies were not received from brokers, we performed other auditing procedures. We believe that our audits provide a reasonable basis for our opinion.
In our opinion, such financial statements and financial highlights referred to above present fairly, in all material respects, the financial position of Fidelity Total International Equity Fund as of October 31, 2015, the results of its operations for the year then ended, the changes in its net assets for each of the two years in the period then ended, and the financial highlights for each of the five years in the period then ended, in conformity with accounting principles generally accepted in the United States of America.
DELOITTE & TOUCHE LLP
Boston, Massachusetts
December 16, 2015
Annual Report
The Trustees, Member of the Advisory Board, and officers of the trust and fund, as applicable, are listed below. The Board of Trustees governs the fund and is responsible for protecting the interests of shareholders. The Trustees are experienced executives who meet periodically throughout the year to oversee the fund's activities, review contractual arrangements with companies that provide services to the fund, oversee management of the risks associated with such activities and contractual arrangements, and review the fund's performance. Each of the Trustees oversees 170 funds.
The Trustees hold office without limit in time except that (a) any Trustee may resign; (b) any Trustee may be removed by written instrument, signed by at least two-thirds of the number of Trustees prior to such removal; (c) any Trustee who requests to be retired or who has become incapacitated by illness or injury may be retired by written instrument signed by a majority of the other Trustees; and (d) any Trustee may be removed at any special meeting of shareholders by a two-thirds vote of the outstanding voting securities of the trust. Each Trustee who is not an interested person (as defined in the 1940 Act) of the trust and the fund (Independent Trustee), shall retire not later than the last day of the calendar year in which his or her 75th birthday occurs. The Independent Trustees may waive this mandatory retirement age policy with respect to individual Trustees. The officers and Advisory Board Member hold office without limit in time, except that any officer and Advisory Board Member may resign or may be removed by a vote of a majority of the Trustees at any regular meeting or any special meeting of the Trustees. Except as indicated, each individual has held the office shown or other offices in the same company for the past five years.
Experience, Skills, Attributes, and Qualifications of the Fund's Trustees. The Governance and Nominating Committee has adopted a statement of policy that describes the experience, qualifications, attributes, and skills that are necessary and desirable for potential Independent Trustee candidates (Statement of Policy). The Board believes that each Trustee satisfied at the time he or she was initially elected or appointed a Trustee, and continues to satisfy, the standards contemplated by the Statement of Policy. The Governance and Nominating Committee also engages professional search firms to help identify potential Independent Trustee candidates who have the experience, qualifications, attributes, and skills consistent with the Statement of Policy. From time to time, additional criteria based on the composition and skills of the current Independent Trustees, as well as experience or skills that may be appropriate in light of future changes to board composition, business conditions, and regulatory or other developments, have also been considered by the professional search firms and the Governance and Nominating Committee. In addition, the Board takes into account the Trustees' commitment and participation in Board and committee meetings, as well as their leadership of standing and ad hoc committees throughout their tenure.
In determining that a particular Trustee was and continues to be qualified to serve as a Trustee, the Board has considered a variety of criteria, none of which, in isolation, was controlling. The Board believes that, collectively, the Trustees have balanced and diverse experience, qualifications, attributes, and skills, which allow the Board to operate effectively in governing the fund and protecting the interests of shareholders. Information about the specific experience, skills, attributes, and qualifications of each Trustee, which in each case led to the Board's conclusion that the Trustee should serve (or continue to serve) as a trustee of the fund, is provided below.
Annual Report
Trustees and Officers - continued
Board Structure and Oversight Function. James C. Curvey is an interested person (as defined in the 1940 Act) and currently serves as Chairman. The Trustees have determined that an interested Chairman is appropriate and benefits shareholders because an interested Chairman has a personal and professional stake in the quality and continuity of services provided to the fund. Independent Trustees exercise their informed business judgment to appoint an individual of their choosing to serve as Chairman, regardless of whether the Trustee happens to be independent or a member of management. The Independent Trustees have determined that they can act independently and effectively without having an Independent Trustee serve as Chairman and that a key structural component for assuring that they are in a position to do so is for the Independent Trustees to constitute a substantial majority for the Board. The Independent Trustees also regularly meet in executive session. Ned C. Lautenbach serves as Chairman of the Independent Trustees and as such (i) acts as a liaison between the Independent Trustees and management with respect to matters important to the Independent Trustees and (ii) with management prepares agendas for Board meetings.
Fidelity funds are overseen by different Boards of Trustees. The fund's Board oversees Fidelity's high income and certain equity funds, and other Boards oversee Fidelity's investment-grade bond, money market, asset allocation, and sector funds. The asset allocation funds may invest in Fidelity funds overseen by the fund's Board. The use of separate Boards, each with its own committee structure, allows the Trustees of each group of Fidelity funds to focus on the unique issues of the funds they oversee, including common research, investment, and operational issues. On occasion, the separate Boards establish joint committees to address issues of overlapping consequences for the Fidelity funds overseen by each Board.
The Trustees operate using a system of committees to facilitate the timely and efficient consideration of all matters of importance to the Trustees, the fund, and fund shareholders and to facilitate compliance with legal and regulatory requirements and oversight of the fund's activities and associated risks. The Board, acting through its committees, has charged FMR and its affiliates with (i) identifying events or circumstances the occurrence of which could have demonstrably adverse effects on the fund's business and/or reputation; (ii) implementing processes and controls to lessen the possibility that such events or circumstances occur or to mitigate the effects of such events or circumstances if they do occur; and (iii) creating and maintaining a system designed to evaluate continuously business and market conditions in order to facilitate the identification and implementation processes described in (i) and (ii) above. Because the day-to-day operations and activities of the fund are carried out by or through FMR, its affiliates and other service providers, the fund's exposure to risks is mitigated but not eliminated by the processes overseen by the Trustees. While each of the Board's committees has responsibility for overseeing different aspects of the fund's activities, oversight is exercised primarily through the Operations, Audit, and Compliance Committees. In addition, the Independent Trustees have worked with FMR to enhance the Board's oversight of investment and financial risks, legal and regulatory risks, technology risks, and operational risks, including the development of additional risk reporting to the Board. For example, a working group comprised of Independent Trustees and FMR has worked and continues to work to review the Fidelity funds' valuation-related activities, reporting and risk management. Appropriate personnel, including but not limited to the fund's Chief Compliance Officer (CCO), FMR's internal auditor, the independent accountants, the fund's Treasurer and portfolio management personnel, make periodic reports to the Board's committees, as appropriate, including an annual review of Fidelity's risk management program for the Fidelity funds. The responsibilities of each standing committee, including their oversight responsibilities, are described further under "Standing Committees of the Fund's Trustees."
Annual Report
The fund's Statement of Additional Information (SAI) includes more information about the Trustees. To request a free copy, call Fidelity at 1-877-208-0098.
Interested Trustees*:
Correspondence intended for each Trustee who is an interested person may be sent to Fidelity Investments, 245 Summer Street, Boston, Massachusetts 02210.
Name, Year of Birth; Principal Occupations and Other Relevant Experience+ |
James C. Curvey (1935) |
Year of Election or Appointment: 2007 Trustee Chairman of the Board of Trustees |
| Mr. Curvey also serves as Trustee of other Fidelity funds. Mr. Curvey is a Director of Fidelity Research & Analysis Co. (investment adviser firm, 2009-present), and Vice Chairman (2007-present) and Director of FMR LLC (diversified financial services company). In addition, Mr. Curvey serves as an Overseer for the Boston Symphony Orchestra and a member of the board of Artis-Naples, Naples, Florida, and as a Trustee for Brewster Academy, Wolfeboro, New Hampshire. Previously, Mr. Curvey served as a Director of Fidelity Investments Money Management, Inc. (investment adviser firm, 2009-2014) and a Director of FMR and FMR Co., Inc. (investment adviser firms, 2007-2014). |
Charles S. Morrison (1960) |
Year of Election or Appointment: 2014 Trustee |
| Mr. Morrison also serves as Trustee of other funds. He serves as a Director of Fidelity Investments Money Management, Inc. (FIMM) (investment adviser firm, 2014-present), Director of Fidelity SelectCo, LLC (investment adviser firm, 2014-present), President, Asset Management (2014-present), and is an employee of Fidelity Investments. Previously, Mr. Morrison served as Vice President of Fidelity's Fixed Income and Asset Allocation Funds (2012-2014), President, Fixed Income (2011-2014), Vice President of Fidelity's Money Market Funds (2005-2009), President, Money Market Group Leader of FMR (investment adviser firm, 2009), and Senior Vice President, Money Market Group of FMR (2004-2009). Mr. Morrison also served as Vice President of Fidelity's Bond Funds (2002-2005), certain Balanced Funds (2002-2005), and certain Asset Allocation Funds (2002-2007), and as Senior Vice President (2002-2005) of Fidelity's Bond Division. |
* Trustees have been determined to be "Interested Trustees" by virtue of, among other things, their affiliation with the trust or various entities under common control with FMR.
+ The information above includes each Trustee's principal occupation during the last five years and other information relating to the experience, attributes, and skills relevant to each Trustee's qualifications to serve as a Trustee, which led to the conclusion that each Trustee should serve as a Trustee for the fund.
Annual Report
Independent Trustees:
Correspondence intended for each Independent Trustee (that is, the Trustees other than the Interested Trustees) may be sent to Fidelity Investments, P.O. Box 55235, Boston, Massachusetts 02205-5235.
Name, Year of Birth; Principal Occupations and Other Relevant Experience+ |
Dennis J. Dirks (1948) |
Year of Election or Appointment: 2005 Trustee |
| Mr. Dirks also serves as Trustee of other Fidelity funds. Prior to his retirement in May 2003, Mr. Dirks was Chief Operating Officer and a member of the Board of The Depository Trust & Clearing Corporation (DTCC). He also served as President, Chief Operating Officer, and Board member of The Depository Trust Company (DTC) and President and Board member of the National Securities Clearing Corporation (NSCC). In addition, Mr. Dirks served as Chief Executive Officer and Board member of the Government Securities Clearing Corporation, Chief Executive Officer and Board member of the Mortgage-Backed Securities Clearing Corporation, as a Trustee and a member of the Finance Committee of Manhattan College (2005-2008), as a Trustee and a member of the Finance Committee of AHRC of Nassau County (2006-2008), and as a member of the Independent Directors Council (IDC) Governing Council (2010-2015). Mr. Dirks is a member of the Board of Directors for The Brookville Center for Children's Services, Inc. (2009-present). |
Alan J. Lacy (1953) |
Year of Election or Appointment: 2008 Trustee |
| Mr. Lacy also serves as Trustee of other Fidelity funds. Mr. Lacy serves as a member of the Board of Directors of Dave & Buster's Entertainment, Inc. (restaurant and entertainment complexes, 2010-present) and Bristol-Myers Squibb Company (global pharmaceuticals, 2008-present). In addition, Mr. Lacy served as Senior Adviser (2007-2014) of Oak Hill Capital Partners, L.P. (private equity) and also served as Chief Executive Officer (2000-2005) and Vice Chairman (2005-2006) of Sears Holdings Corporation and Sears, Roebuck and Co. (retail). Mr. Lacy is a member of the Board of Trustees of The National Parks Conservation Association (2006-present). Previously, Mr. Lacy served as Chairman of the Board of Trustees of the National Parks Conservation Association (2008-2011) and as a member of the Board of Directors for The Western Union Company (global money transfer, 2006-2011), The Hillman Companies, Inc. (hardware wholesalers, 2010-2014), and Earth Fare, Inc. (retail grocery, 2010-2014). |
Ned C. Lautenbach (1944) |
Year of Election or Appointment: 2000 Trustee Chairman of the Independent Trustees |
| Mr. Lautenbach also serves as Trustee of other Fidelity funds. Mr. Lautenbach currently serves as the Lead Director of the Eaton Corporation Board of Directors (diversified industrial, 1997-present). Mr. Lautenbach is Chairman of the Board of Directors of Artis-Naples in Naples, Florida (2012-present), a member of the Council on Foreign Relations (1994-present), and a member of the Board of Governors, State University System of Florida (2013-present). Previously, Mr. Lautenbach was a Partner/Advisory Partner at Clayton, Dubilier & Rice, LLC (private equity investment, 1998-2010), as well as a Director of Sony Corporation (2006-2007). |
Joseph Mauriello (1944) |
Year of Election or Appointment: 2008 Trustee |
| Mr. Mauriello also serves as Trustee of other Fidelity funds. Prior to his retirement in January 2006, Mr. Mauriello served in numerous senior management positions including Deputy Chairman and Chief Operating Officer (2004-2005), and Vice Chairman of Financial Services (2002-2004) of KPMG LLP US (professional services, 1965-2005). Mr. Mauriello currently serves as a member of the Board of Directors of XL Group plc. (global insurance and re-insurance, 2006-present) and the Independent Directors Council (IDC) Governing Council (2015-present). Previously, Mr. Mauriello served as a Director of the Hamilton Funds of the Bank of New York (2006-2007) and of Arcadia Resources Inc. (health care services and products, 2007-2012). |
Robert W. Selander (1950) |
Year of Election or Appointment: 2011 Trustee |
| Mr. Selander also serves as Trustee of other Fidelity funds. Mr. Selander serves as a Director of The Western Union Company (global money transfer, 2014-present). Previously, Mr. Selander served as a Member of the Advisory Board of other Fidelity funds (2011), and Executive Vice Chairman (2010), Chief Executive Officer (2009-2010), and President and Chief Executive Officer (1997-2009) of Mastercard, Inc. |
Cornelia M. Small (1944) |
Year of Election or Appointment: 2005 Trustee |
| Ms. Small also serves as Trustee of other Fidelity funds. Ms. Small is a member of the Board of Directors (2009-present) and Chair of the Investment Committee (2010-present) of the Teagle Foundation. Ms. Small also serves on the Investment Committee of the Berkshire Taconic Community Foundation (2008-present). Previously, Ms. Small served as Chairperson (2002-2008) and a member of the Investment Committee and Chairperson (2008-2012) and a member of the Board of Trustees of Smith College. In addition, Ms. Small served as Chief Investment Officer, Director of Global Equity Investments, and a member of the Board of Directors of Scudder, Stevens & Clark and Scudder Kemper Investments. |
William S. Stavropoulos (1939) |
Year of Election or Appointment: 2001 Trustee Vice Chairman of the Independent Trustees |
| Mr. Stavropoulos also serves as Trustee of other Fidelity funds. Mr. Stavropoulos serves as President and Founder of the Michigan Baseball Foundation, the Great Lakes Loons (2007-present). Mr. Stavropoulos is Chairman Emeritus of the Board of Directors of The Dow Chemical Company, where he previously served in numerous senior management positions, including President, CEO (1995-2000; 2002-2004), Chairman of the Executive Committee (2000-2006), and as a member of the Board of Directors (1990-2006). Currently, Mr. Stavropoulos is Chairman of the Board of Directors of Univar Inc. (global distributor of commodity and specialty chemicals), a Director of Teradata Corporation (data warehousing and technology solutions), and Maersk Inc. (industrial conglomerate), and a member of the Advisory Board for Metalmark Capital LLC (private equity investment, 2005-present). Mr. Stavropoulos is an operating advisor to Clayton, Dubilier & Rice, LLC (private equity investment). In addition, Mr. Stavropoulos is a member of the University of Notre Dame Advisory Council for the College of Science, a Trustee of the Rollin L. Gerstacker Foundation, and a Director of the Naples Philharmonic Center for the Arts. Previously, Mr. Stavropoulos served as a Director of Chemical Financial Corporation (bank holding company, 1993-2012) and Tyco International, Ltd. (multinational manufacturing and services, 2007-2012). |
David M. Thomas (1949) |
Year of Election or Appointment: 2008 Trustee |
| Mr. Thomas also serves as Trustee of other Fidelity funds. Mr. Thomas serves as Non-Executive Chairman of the Board of Directors of Fortune Brands Home and Security (home and security products, 2011-present), as a member of the Board of Directors (2004-present) and Presiding Director (2013-present) of Interpublic Group of Companies, Inc. (marketing communication), and as a member of the Board of Trustees of the University of Florida (2013-present). Previously, Mr. Thomas served as Executive Chairman (2005-2006) and Chairman and Chief Executive Officer (2000-2005) of IMS Health, Inc. (pharmaceutical and healthcare information solutions), and a Director of Fortune Brands, Inc. (consumer products, 2000-2011). |
+ The information above includes each Trustee's principal occupation during the last five years and other information relating to the experience, attributes, and skills relevant to each Trustee's qualifications to serve as a Trustee, which led to the conclusion that each Trustee should serve as a Trustee for the fund.
Advisory Board Member and Officers:
Correspondence intended for each officer and Peter S. Lynch may be sent to Fidelity Investments, 245 Summer Street, Boston, Massachusetts 02210. Officers appear below in alphabetical order.
Name, Year of Birth; Principal Occupation |
Peter S. Lynch (1944) |
Year of Election or Appointment: 2003 Member of the Advisory Board |
| Mr. Lynch also serves as Member of the Advisory Board of other Fidelity funds. Mr. Lynch is Vice Chairman and a Director of FMR (investment adviser firm) and FMR Co., Inc. (investment adviser firm). In addition, Mr. Lynch serves as a Trustee of Boston College and as the Chairman of the Inner-City Scholarship Fund. Previously, Mr. Lynch served on the Special Olympics International Board of Directors (1997-2006). |
Elizabeth Paige Baumann (1968) |
Year of Election or Appointment: 2012 Anti-Money Laundering (AML) Officer |
| Ms. Baumann also serves as AML Officer of other funds. She is Chief AML Officer of FMR LLC (diversified financial services company, 2012-present) and is an employee of Fidelity Investments. Previously, Ms. Baumann served as Vice President and Deputy Anti-Money Laundering Officer (2007-2012). |
Marc R. Bryant (1966) |
Year of Election or Appointment: 2015 Secretary and Chief Legal Officer (CLO) |
| Mr. Bryant also serves as Secretary and CLO of other funds. Mr. Bryant serves as CLO, Secretary, and Senior Vice President of Fidelity Management & Research Company (investment adviser firm, 2015-present) and FMR Co., Inc. (investment adviser firm, 2015-present); Secretary of Fidelity SelectCo, LLC (investment adviser firm, 2015-present) and Fidelity Investments Money Management, Inc. (investment adviser firm, 2015-present); and CLO of Fidelity Management & Research (Hong Kong) Limited (investment adviser firm, 2015-present). He is Senior Vice President and Deputy General Counsel of FMR LLC (diversified financial services company). Previously, Mr. Bryant served as Secretary and Chief Legal Officer of Fidelity Rutland Square Trust II (2010-2014) and Assistant Secretary of Fidelity's Fixed Income and Asset Allocation Funds (2013-2015). Prior to joining Fidelity Investments, Mr. Bryant served as a Senior Vice President and the Head of Global Retail Legal for AllianceBernstein L.P. (2006-2010), and as the General Counsel for ProFund Advisors LLC (2001-2006). |
William C. Coffey (1969) |
Year of Election or Appointment: 2009 Assistant Secretary |
| Mr. Coffey also serves as Assistant Secretary of other funds. He is Senior Vice President and Deputy General Counsel of FMR LLC (diversified financial services company, 2010-present), and is an employee of Fidelity Investments. Previously, Mr. Coffey served as Vice President and Associate General Counsel of FMR LLC (2005-2009). |
Timothy M. Cohen (1969) |
Year of Election or Appointment: 2014 Vice President of certain Equity Funds |
| Mr. Cohen also serves as Vice President of other funds. Mr. Cohen serves as Chief Compliance Officer of FMR Investment Management (U.K.) Limited (investment adviser firm, 2013-present) and is an employee of Fidelity Investments. Previously, Mr. Cohen served as a Director of FMR Investment Management (U.K.) Limited (2013-2015). |
Jonathan Davis (1968) |
Year of Election or Appointment: 2010 Assistant Treasurer |
| Mr. Davis also serves as Assistant Treasurer of other funds, and is an employee of Fidelity Investments. Previously, Mr. Davis served as Vice President and Associate General Counsel of FMR LLC (diversified financial services company, 2003-2010). |
Adrien E. Deberghes (1967) |
Year of Election or Appointment: 2008 Deputy Treasurer |
| Mr. Deberghes also serves as an officer of other funds. He is an employee of Fidelity Investments (2008-present). Prior to joining Fidelity Investments, Mr. Deberghes was Senior Vice President of Mutual Fund Administration at State Street Corporation (2007-2008), Senior Director of Mutual Fund Administration at Investors Bank & Trust (2005-2007), and Director of Finance for Dunkin' Brands (2000-2005). |
Stephanie J. Dorsey (1969) |
Year of Election or Appointment: 2010 Assistant Treasurer |
| Ms. Dorsey also serves as an officer of other funds. She is an employee of Fidelity Investments (2008-present) and has served in other fund officer roles. Prior to joining Fidelity Investments, Ms. Dorsey served as Treasurer (2004-2008) of the JPMorgan Mutual Funds and Vice President (2004-2008) of JPMorgan Chase Bank. |
Howard J. Galligan III (1966) |
Year of Election or Appointment: 2014 Chief Financial Officer |
| Mr. Galligan also serves as Chief Financial Officer of other funds. Mr. Galligan serves as President of Fidelity Pricing and Cash Management Services (FPCMS) (2014-present) and as a Director of Strategic Advisers, Inc. (investment adviser firm, 2008-present). Previously, Mr. Galligan served as Chief Administrative Officer of Asset Management (2011-2014) and Chief Operating Officer and Senior Vice President of Investment Support for Strategic Advisers, Inc. (2003-2011). |
Scott C. Goebel (1968) |
Year of Election or Appointment: 2015 Vice President |
| Mr. Goebel serves as Vice President of other funds and is an employee of Fidelity Investments (2001-present). Previously, Mr. Goebel served as Secretary of Fidelity SelectCo, LLC (investment adviser firm, 2013-2015), Fidelity Investments Money Management, Inc. (FIMM) (investment adviser firm, 2010-2015), and Fidelity Research and Analysis Company (FRAC) (investment adviser firm, 2010-2015); General Counsel, Secretary, and Senior Vice President of Fidelity Management & Research Company (investment adviser firm, 2008-2015) and FMR Co., Inc. (investment adviser firm, 2008-2015); Assistant Secretary of Fidelity Management & Research (Japan) Limited (investment adviser firm, 2008-2015) and FMR Investment Management (U.K.) Limited (investment adviser firm, 2008-2015); Chief Legal Officer (CLO) of Fidelity Management & Research (Hong Kong) Limited (investment adviser firm, 2008-2015); Secretary and CLO of certain Fidelity funds (2008-2015); Assistant Secretary of FIMM (2008-2010), FRAC (2008-2010), and certain funds (2007-2008); and as Vice President and Secretary of Fidelity Distributors Corporation (FDC) (2005-2007). |
Brian B. Hogan (1964) |
Year of Election or Appointment: 2009 Vice President |
| Mr. Hogan also serves as Trustee or Vice President of other funds. Mr. Hogan serves as a Director of Fidelity SelectCo, LLC (investment adviser firm, 2014-present) and President of the Equity Division of FMR (investment adviser firm, 2009-present). Previously, Mr. Hogan served as Senior Vice President, Equity Research of FMR (2006-2009) and as a portfolio manager. |
Chris Maher (1972) |
Year of Election or Appointment: 2013 Assistant Treasurer |
| Mr. Maher serves as Assistant Treasurer of other funds. Mr. Maher is Vice President of Valuation Oversight and is an employee of Fidelity Investments. Previously, Mr. Maher served as Vice President of Asset Management Compliance (2013), Vice President of the Program Management Group of FMR (investment adviser firm, 2010-2013), and Vice President of Valuation Oversight (2008-2010). |
Kenneth B. Robins (1969) |
Year of Election or Appointment: 2008 President and Treasurer |
| Mr. Robins also serves as an officer of other funds. Mr. Robins serves as Executive Vice President of Fidelity Investments Money Management, Inc. (FIMM) (investment adviser firm, 2013-present) and is an employee of Fidelity Investments (2004-present). Previously, Mr. Robins served in other fund officer roles. |
Stacie M. Smith (1974) |
Year of Election or Appointment: 2013 Deputy Treasurer |
| Ms. Smith also serves as an officer of other funds. She is an employee of Fidelity Investments (2009-present) and has served in other fund officer roles. Prior to joining Fidelity Investments, Ms. Smith served as Senior Audit Manager of Ernst & Young LLP (1996-2009). |
Renee Stagnone (1975) |
Year of Election or Appointment: 2013 Deputy Treasurer |
| Ms. Stagnone also serves as Deputy Treasurer of other funds. Ms. Stagnone is an employee of Fidelity Investments (1997-present). |
Linda J. Wondrack (1964) |
Year of Election or Appointment: 2014 Chief Compliance Officer |
| Ms. Wondrack also serves as Chief Compliance Officer of other funds. Ms. Wondrack is Executive Vice President and head of the Ethics Office and Asset Management Compliance for Fidelity Investments (2012-present). Ms. Wondrack also serves as Chief Compliance Officer of Fidelity SelectCo, LLC (investment adviser firm, 2014-present); Chief Compliance Officer of Impresa Management LLC (2013-present); and Chief Compliance Officer of FMR Co., Inc. (investment adviser firm), Fidelity Investments Money Management, Inc. (investment adviser firm), Fidelity Management & Research (Japan) Limited (investment adviser firm), FMR Investment Management (U.K.) Limited (investment adviser firm), Fidelity Management & Research (Hong Kong) (investment adviser firm), Fidelity Management & Research Company (investment adviser firm), FIAM LLC (investment adviser firm), and Strategic Advisers, Inc. (investment adviser firm), Ballyrock Investment Advisors LLC, and Northern Neck Investors LLC (2012-present). Previously, Ms. Wondrack served as Senior Vice President and Chief Compliance Officer for Columbia Management Investment Advisers, LLC (2005-2012); Chief Compliance Officer for certain funds within the Columbia Family of Funds (2007-2012); and Senior Vice President of Compliance Risk Management at Bank of America (2005-2010). |
Joseph F. Zambello (1957) |
Year of Election or Appointment: 2011 Deputy Treasurer |
| Mr. Zambello also serves as Deputy Treasurer of other funds. Mr. Zambello is an employee of Fidelity Investments (1991-present). Previously, Mr. Zambello served as Vice President of the Program Management Group of FMR (investment adviser firm, 2009-2011) and Vice President of the Transfer Agent Oversight Group (2005-2009). |
Annual Report
Class A designates 6%; Class T designates 7%; Class B designates 11%; Class C designates 10%; of the dividends distributed in December 2014 as indicated in the Corporate Qualifying memo distributed by the Tax department, during the fiscal year as qualifying for the dividends-received deduction for corporate shareholders.
Class A, Class T, Class B, and Class C designates 100% of the dividends distributed during the fiscal year as amounts which may be taken into account as a dividend for purposes of the maximum rate under section 1(h)(11) of the Internal Revenue Code.
The amounts per share which represent income derived from sources within, and taxes paid to, foreign countries or possessions of the United States are as follows:
| Pay Date | Income | Taxes |
Class A | 12/08/2014 | 0.1263 | 0.0263 |
| | | |
Class T | 12/08/2014 | 0.1163 | 0.0263 |
| | | |
Class B | 12/08/2014 | 0.0673 | 0.0263 |
| | | |
Class C | 12/08/2014 | 0.0793 | 0.0263 |
The fund will notify shareholders in January 2016 of amounts for use in preparing 2015 income tax returns.
Annual Report
Fidelity Total International Equity Fund
Each year, the Board of Trustees, including the Independent Trustees (together, the Board), votes on the renewal of the management contract with Fidelity Management & Research Company (FMR) and the sub-advisory agreements (together, the Advisory Contracts) for the fund. The Board, assisted by the advice of fund counsel and Independent Trustees' counsel, requests and considers a broad range of information relevant to the renewal of the Advisory Contracts throughout the year.
The Board meets regularly and, at each of its meetings, covers an extensive agenda of topics and materials and considers factors that are relevant to its annual consideration of the renewal of the fund's Advisory Contracts, including the services and support provided to the fund and its shareholders. The Board has established various standing committees (Committees), each composed of and chaired by Independent Trustees with varying backgrounds, to which the Board has assigned specific subject matter responsibilities in order to enhance effective decision-making by the Board. The Board, acting directly and through its Committees, requests and receives information concerning the annual consideration of the renewal of the fund's Advisory Contracts. The Board also meets as needed to consider matters specifically related to the Board's annual consideration of the renewal of the Advisory Contracts. Members of the Board may also meet with trustees of other Fidelity funds through ad hoc joint committees to discuss certain matters relevant to all of the Fidelity funds.
At its July 2015 meeting, the Board unanimously determined to renew the fund's Advisory Contracts. In reaching its determination, the Board considered all factors it believed relevant, including (i) the nature, extent, and quality of the services to be provided to the fund and its shareholders (including the investment performance of the fund); (ii) the competitiveness of the fund's management fee and total expense ratio relative to peer funds; (iii) the total costs of the services to be provided by and the profits to be realized by Fidelity from its relationship with the fund; and (iv) the extent to which (if any) economies of scale exist and would be realized as the fund grows, and whether any economies of scale are appropriately shared with fund shareholders.
In considering whether to renew the Advisory Contracts for the fund, the Board reached a determination, with the assistance of fund counsel and Independent Trustees' counsel and through the exercise of its business judgment, that the renewal of the Advisory Contracts was in the best interests of the fund and its shareholders and that the compensation payable under the Advisory Contracts was fair and reasonable. The Board's decision to renew the Advisory Contracts was not based on any single factor, but rather was based on a comprehensive consideration of all the information provided to the Board at its meetings throughout the year. The Board, in reaching its determination to renew the Advisory Contracts, was aware that shareholders of the fund have a broad range of investment choices available to them, including a wide choice among funds offered by Fidelity's competitors, and that the fund's shareholders, who have the opportunity to review and weigh the disclosure provided by the fund in its prospectus and other public disclosures, have chosen to invest in this fund, which is part of the Fidelity family of funds.
Annual Report
Board Approval of Investment Advisory Contracts and
Management Fees - continued
Nature, Extent, and Quality of Services Provided. The Board considered Fidelity's staffing as it relates to the fund, including the backgrounds of investment personnel of Fidelity, and also considered the fund's investment objective, strategies, and related investment philosophy. The Independent Trustees also had discussions with senior management of Fidelity's investment operations and investment groups. The Board considered the structure of the portfolio manager compensation program and whether this structure provides appropriate incentives to act in the best interests of the fund. Additionally, the Board considered the portfolio managers' investments, if any, in the funds that they manage.
Resources Dedicated to Investment Management and Support Services. The Board and the Fund Oversight and Research Committees reviewed the general qualifications and capabilities of Fidelity's investment staff, including its size, education, experience, and resources, as well as Fidelity's approach to recruiting, training, managing, and compensating investment personnel. The Board noted that Fidelity has continued to increase the resources devoted to non-U.S. offices, including expansion of Fidelity's global investment organization. The Board also noted that Fidelity's analysts have extensive resources, tools and capabilities that allow them to conduct sophisticated quantitative and fundamental analysis, as well as credit analysis of issuers, counterparties and guarantors. Further, the Board considered that Fidelity's investment professionals have sufficient access to global information and data so as to provide competitive investment results over time, and that those professionals also have access to sophisticated tools that permit them to assess portfolio construction and risk and performance attribution characteristics continuously, as well as to transmit new information and research conclusions rapidly around the world. Additionally, in its deliberations, the Board considered Fidelity's trading, risk management, and compliance capabilities and resources, which are integral parts of the investment management process.
Shareholder and Administrative Services. The Board considered (i) the nature, extent, quality, and cost of advisory, administrative, and shareholder services performed by FMR, the sub-advisers (together with FMR, the Investment Advisers), and their affiliates under the Advisory Contracts and under separate agreements covering transfer agency, pricing and bookkeeping, and securities lending services for the fund; (ii) the nature and extent of the supervision of third party service providers, principally custodians and subcustodians; and (iii) the resources devoted to, and the record of compliance with, the fund's compliance policies and procedures. The Board also reviewed the allocation of fund brokerage, including allocations to brokers affiliated with the Investment Advisers, the use of brokerage commissions to pay fund expenses, and the use of "soft" commission dollars to pay for research services.
Annual Report
The Board noted that the growth of fund assets over time across the complex allows Fidelity to reinvest in the development of services designed to enhance the value or convenience of the Fidelity funds as investment vehicles. These services include 24-hour access to account information and market information through telephone representatives and over the Internet, investor education materials and asset allocation tools, and the expanded availability of Fidelity Investor Centers.
In 2014, the Board formed an ad hoc Committee on Transfer Agency Fees to review the variety of transfer agency fee structures throughout the industry and Fidelity's competitive positioning with respect to industry participants.
Investment in a Large Fund Family. The Board considered the benefits to shareholders of investing in a Fidelity fund, including the benefits of investing in a fund that is part of a large family of funds offering a variety of investment disciplines and providing a large variety of mutual fund investor services. The Board noted that Fidelity had taken, or had made recommendations that resulted in the Fidelity funds taking, a number of actions over the previous year that benefited particular funds, including (i) continuing to dedicate additional resources to investment research and to the support of the senior management team that oversees asset management; (ii) continuing efforts to enhance Fidelity's global research capabilities; (iii) launching new funds and making other enhancements to meet client needs; (iv) reducing management fees and total expenses for certain index funds and diversified international funds; (v) continuing to launch dedicated lower cost underlying funds to meet portfolio construction needs related to expanding underlying fund options for Fidelity funds of funds, specifically for the Freedom Fund product lines; (vi) rationalizing product lines and gaining increased efficiencies through fund mergers; (vii) launching active fixed-income exchange-traded funds; (viii) continuing to develop, acquire and implement systems and technology to improve services to the funds and information security and to increase efficiency; (ix) implementing investment enhancements to further strengthen Fidelity's target date product line to increase investors' probability of success in achieving their goals; (x) modifying the eligibility criteria for certain share classes to accommodate roll-over assets from employer-sponsored retirement plans; (xi) launching a new Class W of the Freedom Index Funds to attract and retain Fidelity record-kept retirement plan assets; and (xii) implementing changes to Fidelity's money market product line in response to recent money market regulatory reforms.
Investment Performance. The Board considered whether the fund has operated in accordance with its investment objective, as well as its record of compliance with its investment restrictions and its performance history.
Annual Report
Board Approval of Investment Advisory Contracts and
Management Fees - continued
The Board took into account discussions with representatives of the Investment Advisers about fund investment performance that occur at Board meetings throughout the year. In this regard the Board noted that as part of regularly scheduled fund reviews and other reports to the Board on fund performance, the Board considers annualized return information for the fund, for different time periods, measured against a securities market index ("benchmark index") and a peer group of funds with similar objectives ("peer group"), if any. In its evaluation of fund investment performance, the Board gave particular attention to information indicating changes in performance of certain Fidelity funds for specific time periods and discussed with the Investment Advisers the reasons for any overperformance or underperformance.
In addition to reviewing absolute and relative fund performance, the Independent Trustees periodically consider the appropriateness of fund performance metrics in evaluating the results achieved. In general, the Independent Trustees believe that fund performance should be evaluated based on net performance (after fees and expenses) of both the highest performing and lowest performing fund share classes, where applicable, compared to appropriate benchmark indices, over appropriate time periods that may include full market cycles, and compared to peer groups, as applicable, over the same periods, taking into account relevant factors including the following: general market conditions; issuer-specific information; and fund cash flows and other factors.
The Independent Trustees recognize that shareholders evaluate performance on a net basis over their own holding periods, for which one-, three-, and five-year periods are often used as a proxy. For this reason, the performance information reviewed by the Board also included net cumulative calendar year total return information for the fund and an appropriate benchmark index and peer group for the most recent one-, three-, and five-year periods, as shown below. Returns are shown compared to the 25th percentile (top of box, 75% beaten) and 75th percentile (bottom of box, 25% beaten) of the peer universe. Returns of the benchmark index are "net MA," i.e., adjusted for tax withholding rates applicable to U.S.-based funds organized as Massachusetts business trusts.
Annual Report
Fidelity Total International Equity Fund

The Board also considered that the fund's management fee is subject to upward or downward adjustment depending upon whether, and to what extent, the fund's investment performance for the performance period exceeds, or is exceeded by, a securities index, thus leading to a performance adjustment for the same period. The Board noted that the performance adjustment provides FMR with a strong economic incentive to seek to achieve superior performance for the fund's shareholders and helps to more closely align the interests of FMR and the shareholders of the fund.
Based on its review, the Board concluded that the nature, extent, and quality of services provided to the fund under the Advisory Contracts should benefit the shareholders of the fund.
Competitiveness of Management Fee and Total Expense Ratio. The Board considered the fund's management fee and total expense ratio compared to "mapped groups" of competitive funds and classes created for the purpose of facilitating the Trustees' competitive analysis of management fees and total expenses. Fidelity creates "mapped groups" by combining similar Lipper investment objective categories that have comparable investment mandates. Combining Lipper investment objective categories aids the Board's management fee and total expense ratio comparisons by broadening the competitive group used for comparison.
Management Fee. The Board considered two proprietary management fee comparisons for the 12-month periods shown in basis points (BP) in the chart below. The group of Lipper funds used by the Board for management fee comparisons is referred to below as the "Total Mapped Group." The Total Mapped Group comparison focuses on a fund's standing in terms of gross management fees before expense reimbursements or caps, and without giving effect to the fund's performance adjustment, relative to the total universe of funds with comparable investment mandates, regardless of whether their management fee structures also are comparable. Funds with comparable investment mandates offer exposure to similar types of securities. Funds with comparable management fee structures have similar management fee contractual arrangements (e.g., flat rate charged for advisory services, all-inclusive fee rate, etc.). "TMG %" represents the percentage of funds in the Total Mapped Group that had management fees that were lower than the fund's. For example, a hypothetical TMG % of 20% would mean that 80% of the funds in the Total Mapped Group had higher, and 20% had lower, management fees than the fund. The fund's actual TMG %s and the number of funds in the Total Mapped Group are in the chart below. The "Asset-Size Peer Group" (ASPG) comparison focuses on a fund's standing relative to a subset of non-Fidelity funds within the Total Mapped Group that are similar in size and management fee structure without taking into account performance adjustments, if any. For example, if a fund is in the first quartile of the ASPG, the fund's management fee ranks in the least expensive or lowest 25% of funds in the ASPG. The ASPG represents at least 15% of the funds in the Total Mapped Group with comparable asset size and management fee structures, subject to a minimum of 50 funds (or all funds in the Total Mapped Group if fewer than 50). Additional information, such as the ASPG quartile in which the fund's management fee rate ranked and the impact of the fund's performance adjustment, is also included in the chart and considered by the Board.
Annual Report
Board Approval of Investment Advisory Contracts and
Management Fees - continued
Fidelity Total International Equity Fund

Annual Report
The Board noted that the fund's management fee rate ranked below the median of its Total Mapped Group and below the median of its ASPG for 2014. The Board also noted the effect of the fund's performance adjustment, if any, on the fund's management fee ranking.
The Board noted that, in 2014, the ad hoc Committee on Group Fee was formed by it and other Fidelity fund boards to conduct an in-depth review of the "group fee" component of the management fee of funds with such management fee structures. Committee focus included the mechanics of the group fee, the competitive landscape of group fee structures, Fidelity funds with no group fee component and investment products not included in group fee assets. The Board also considered that, for funds subject to the group fee, FMR agreed to voluntarily waive fees over a specified period of time in amounts designed to account for assets converted from certain funds to certain collective investment trusts.
The Board also noted that, in 2013, the ad hoc Committee on Management Fees was formed to conduct an in-depth review of the management fee rates of Fidelity's active equity mutual funds. The Committee focused on the following areas: (i) standard fee structures; (ii) research consumption and trading evolution; (iii) management fee competitiveness/profitability by category; and (iv) factors that drive institutional pricing.
Based on its review, the Board concluded that the fund's management fee is fair and reasonable in light of the services that the fund receives and the other factors considered.
Total Expense Ratio. In its review of each class's total expense ratio, the Board considered the fund's management fee as well as other fund or class expenses, as applicable, such as transfer agent fees, pricing and bookkeeping fees, fund-paid 12b-1 fees, and custodial, legal, and audit fees. The Board noted the impact of the fund's performance adjustment. The Board also noted that Fidelity may agree to waive fees and expenses from time to time, and the extent to which, if any, it has done so for the fund. As part of its review, the Board also considered the current and historical total expense ratios of each class of the fund compared to competitive fund median expenses. Each class of the fund is compared to those funds and classes in the Total Mapped Group (used by the Board for management fee comparisons) that have a similar sales load structure.
The Board noted that the total expense ratio of the retail class ranked below its competitive median for 2014 and the total expense ratio of each of Class A, Class T, Class B, Class C, and Class I ranked above its competitive median for 2014. The Board considered that, in general, various factors can affect total expense ratios. The Board noted that the total expense ratio of Class T was above the competitive median primarily because of higher 12b-1 fees on Class T as compared to most competitor funds. Class T has a higher 12b-1 fee, but a lower front-end sales charge, than traditionally priced front-end sales charge classes. The Board considered that Class T is primarily sold load-waived in the retirement plan market where its 0.50% 12b-1 fee is comparable to competing no-load, higher 12b-1 fee classes designed specifically for retirement plans. The Board noted that the fund offers multiple classes, each of which has a different sales load and 12b-1 fee structure, and that the multiple structures are intended to offer a range of pricing options for the intermediary market. The Board also noted that the total expense ratios of the classes vary primarily by the level of their 12b-1 fees, although differences in transfer agent fees may also cause expenses to vary from class to class.
Annual Report
Board Approval of Investment Advisory Contracts and
Management Fees - continued
The Board further considered that FMR contractually agreed to reimburse Class A, Class T, Class B, Class C, Class I, and the retail class of the fund to the extent that total operating expenses (excluding interest, certain taxes, certain securities lending costs, brokerage commissions, extraordinary expenses, and acquired fund fees and expenses, if any), as a percentage of their respective average net assets, exceed 1.45%, 1.70%, 2.20%, 2.20%, 1.20%, and 1.20% through December 31, 2015.
Fees Charged to Other Fidelity Clients. The Board also considered Fidelity fee structures and other information with respect to clients of Fidelity, such as other funds advised or subadvised by Fidelity, pension plan clients, and other institutional clients with similar mandates. The Board noted the findings of the 2013 ad hoc joint committee (created with the board of other Fidelity funds), which reviewed and compared Fidelity's institutional investment advisory business with its business of providing services to the Fidelity funds, including the differences in services provided, fees charged, and costs incurred, as well as competition in their respective marketplaces.
Based on its review of total expense ratios and fees charged to other Fidelity clients, the Board concluded that, although in some cases above the median of the universe presented for comparison, the total expense ratio of each class of the fund was reasonable in light of the services that the fund and its shareholders receive and the other factors considered.
Costs of the Services and Profitability. The Board considered the revenues earned and the expenses incurred by Fidelity in conducting the business of developing, marketing, distributing, managing, administering and servicing the fund and servicing the fund's shareholders. The Board also considered the level of Fidelity's profits in respect of all the Fidelity funds.
On an annual basis, Fidelity presents to the Board information about the profitability of its relationship with the fund. Fidelity calculates profitability information for each fund, as well as aggregate profitability information for groups of Fidelity funds and all Fidelity funds, using a series of detailed revenue and cost allocation methodologies which originate with the books and records of Fidelity on which Fidelity's audited financial statements are based. The Audit Committee of the Board reviews any significant changes from the prior year's methodologies.
Annual Report
PricewaterhouseCoopers LLP (PwC), independent registered public accounting firm and auditor to Fidelity and certain Fidelity funds, has been engaged annually by the Board as part of the Board's assessment of Fidelity's profitability analysis. PwC's engagement includes the review and assessment of the methodologies used by Fidelity in determining the revenues and expenses attributable to Fidelity's mutual fund business, and completion of agreed-upon procedures in respect of the mathematical accuracy of fund profitability and its conformity to established allocation methodologies. After considering PwC's reports issued under the engagement and information provided by Fidelity, the Board concluded that while other allocation methods may also be reasonable, Fidelity's profitability methodologies are reasonable in all material respects.
The Board also reviewed Fidelity's non-fund businesses and fall-out benefits related to the mutual fund business as well as cases where Fidelity's affiliates may benefit from or be related to the fund's business.
The Board considered the costs of the services provided by and the profits realized by Fidelity in connection with the operation of the fund and was satisfied that the profitability was not excessive.
Economies of Scale. The Board considered whether there have been economies of scale in respect of the management of the Fidelity funds, whether the Fidelity funds (including the fund) have appropriately benefited from any such economies of scale, and whether there is potential for realization of any further economies of scale. The Board considered the extent to which the fund will benefit from economies of scale as assets grow through increased services to the fund, through waivers or reimbursements, or through fee or expense ratio reductions. The Board also noted that in 2013, it and the boards of other Fidelity funds created an ad hoc committee (the Economies of Scale Committee) to analyze whether Fidelity attains economies of scale in respect of the management and servicing of the Fidelity funds, whether the Fidelity funds have appropriately benefited from such economies of scale, and whether there is potential for realization of any further economies of scale.
The Board recognized that the fund's management contract incorporates a "group fee" structure, which provides for lower group fee rates as total group assets increase, and for higher group fee rates as total group assets decrease (with "group assets" defined to include fund assets under FMR's management plus sector fund assets previously under FMR's management and currently managed by Fidelity SelectCo, LLC). FMR calculates the group fee rates based on a tiered asset "breakpoint" schedule that varies based on asset class. The Board considered that the group fee is designed to deliver the benefits of economies of scale to fund shareholders when total Fidelity fund assets increase, even if assets of any particular fund are unchanged or have declined, because some portion of Fidelity's costs are attributable to services provided to all Fidelity funds, and all funds benefit if those costs can be allocated among more assets. The Board concluded that, given the group fee structure, fund shareholders will benefit from lower management fees as group assets increase at the fund complex level, regardless of whether Fidelity achieves any such economies of scale.
Annual Report
Board Approval of Investment Advisory Contracts and
Management Fees - continued
The Board concluded, taking into account the analysis of the Economies of Scale Committee, that economies of scale, if any, are being appropriately shared between fund shareholders and Fidelity.
Additional Information Requested by the Board. In order to develop fully the factual basis for consideration of the Fidelity funds' Advisory Contracts, the Board requested and received additional information on certain topics, including: (i) fund performance trends and Fidelity's long-term strategies for certain funds; (ii) the various share classes employed by Fidelity and the attributes of each class, together with similar information on the distribution and servicing payments made by Fidelity or the funds to third-party participants in the distribution channels; (iii) fund profitability, and fund performance in relation to fund profitability; (iv) the methodology with respect to evaluating competitive fund data and peer group classifications and fee comparisons; (v) annual fund profitability margins, with particular focus on certain funds with negative margins; (vi) the realization of fall-out benefits in certain Fidelity business units; (vii) economies of scale and the way in which they are shared with fund shareholders; (viii) Fidelity's group fee structures, including the group fee schedule of breakpoints; (ix) the impact of cost containment measures on the funds; and (x) the transfer agent fee structure.
Based on its evaluation of all of the conclusions noted above, and after considering all factors it believed relevant, the Board concluded that the advisory fee structures are fair and reasonable, and that the fund's Advisory Contracts should be renewed.
Annual Report
Investment Adviser
Fidelity Management & Research Company
Boston, MA
Investment Sub-Advisers
FMR Co., Inc.
FMR Investment Management
(U.K.) Limited
Fidelity Management & Research
(Hong Kong) Limited
Fidelity Management & Research
(Japan) Limited
FIL Investment Advisors
FIL Investments (Japan) Limited
FIL Investment Advisors
(UK) Limited
General Distributor
Fidelity Distributors Corporation
Smithfield, RI
Transfer and Service Agents
Fidelity Investments Institutional Operations Company, Inc.
Boston, MA
Fidelity Service Company, Inc.
Boston, MA
Custodian
State Street Bank & Trust Company
Quincy, MA
(Fidelity Investment logo)(registered trademark)
ATIE-UANN-1215
1.853363.107
(Fidelity Investment logo)(registered trademark)
Fidelity Advisor®
Total International Equity
Fund - Class I
(formerly Institutional Class)
Annual Report
October 31, 2015
(Fidelity Cover Art)
Class I is
a class of Fidelity®
Total International Equity Fund
Contents
Performance | (Click Here) | How the fund has done over time. |
Management's Discussion of Fund Performance | (Click Here) | The Portfolio Manager's review of fund performance and strategy. |
Shareholder Expense Example | (Click Here) | An example of shareholder expenses. |
Investment Changes | (Click Here) | A summary of major shifts in the fund's investments over the past six months. |
Investments | (Click Here) | A complete list of the fund's investments with their market values. |
Financial Statements | (Click Here) | Statements of assets and liabilities, operations, and changes in net assets, as well as financial highlights. |
Notes | (Click Here) | Notes to the financial statements. |
Report of Independent Registered Public Accounting Firm | (Click Here) | |
Trustees and Officers | (Click Here) | |
Distributions | (Click Here) | |
Board Approval of Investment Advisory Contracts and Management Fees | (Click Here) | |
To view a fund's proxy voting guidelines and proxy voting record for the 12-month period ended June 30, visit http://www.fidelity.com/proxyvotingresults or visit the Securities and Exchange Commission's (SEC) web site at http://www.sec.gov. You may also call 1-877-208-0098 to request a free copy of the proxy voting guidelines.
Standard & Poor's, S&P and S&P 500 are registered service marks of The McGraw-Hill Companies, Inc. and have been licensed for use by Fidelity Distributors Corporation.
Other third-party marks appearing herein are the property of their respective owners.
All other marks appearing herein are registered or unregistered trademarks or service marks of FMR LLC or an affiliated company. © 2015 FMR LLC. All rights reserved.
Annual Report
This report and the financial statements contained herein are submitted for the general information of the shareholders of the fund. This report is not authorized for distribution to prospective investors in the fund unless preceded or accompanied by an effective prospectus.
A fund files its complete schedule of portfolio holdings with the SEC for the first and third quarters of each fiscal year on Form N-Q. Forms N-Q are available on the SEC's web site at http://www.sec.gov. A fund's Forms N-Q may be reviewed and copied at the SEC's Public Reference Room in Washington, DC. Information regarding the operation of the SEC's Public Reference Room may be obtained by calling 1-800-SEC-0330. For a complete list of a fund's portfolio holdings, view the most recent holdings listing, semiannual report, or annual report on Fidelity's web site at http://www.fidelity.com, http://www.advisor.fidelity.com, or http://www.401k.com, as applicable.
NOT FDIC INSURED • MAY LOSE VALUE • NO BANK GUARANTEE
Neither the fund nor Fidelity Distributors Corporation is a bank.
Annual Report
Average annual total return reflects the change in the value of an investment, assuming reinvestment of the class' distributions from dividend income and capital gains (the profits earned upon the sale of securities that have grown in value, if any) and assuming a constant rate of performance each year. The $10,000 table and the fund's returns do not reflect the deduction of taxes that a shareholder would pay on fund distributions or the redemption of fund shares. During periods of reimbursement by Fidelity, a fund's total return will be greater than it would be had the reimbursement not occurred. How a fund did yesterday is no guarantee of how it will do tomorrow.
Average Annual Total Returns
Periods ended October 31, 2015 | Past 1
year | Past 5
years | Life of
fund A |
Class I | -0.64% | 4.06% | -0.81% |
A From November 1, 2007.
$10,000 Over Life of Fund
Let's say hypothetically that $10,000 was invested in Fidelity Advisor® Total International Equity Fund - Class I on November 1, 2007, when the fund started. The chart shows how the value of your investment would have changed, and also shows how the MSCI ACWI (All Country World Index) ex USA Index performed over the same period.
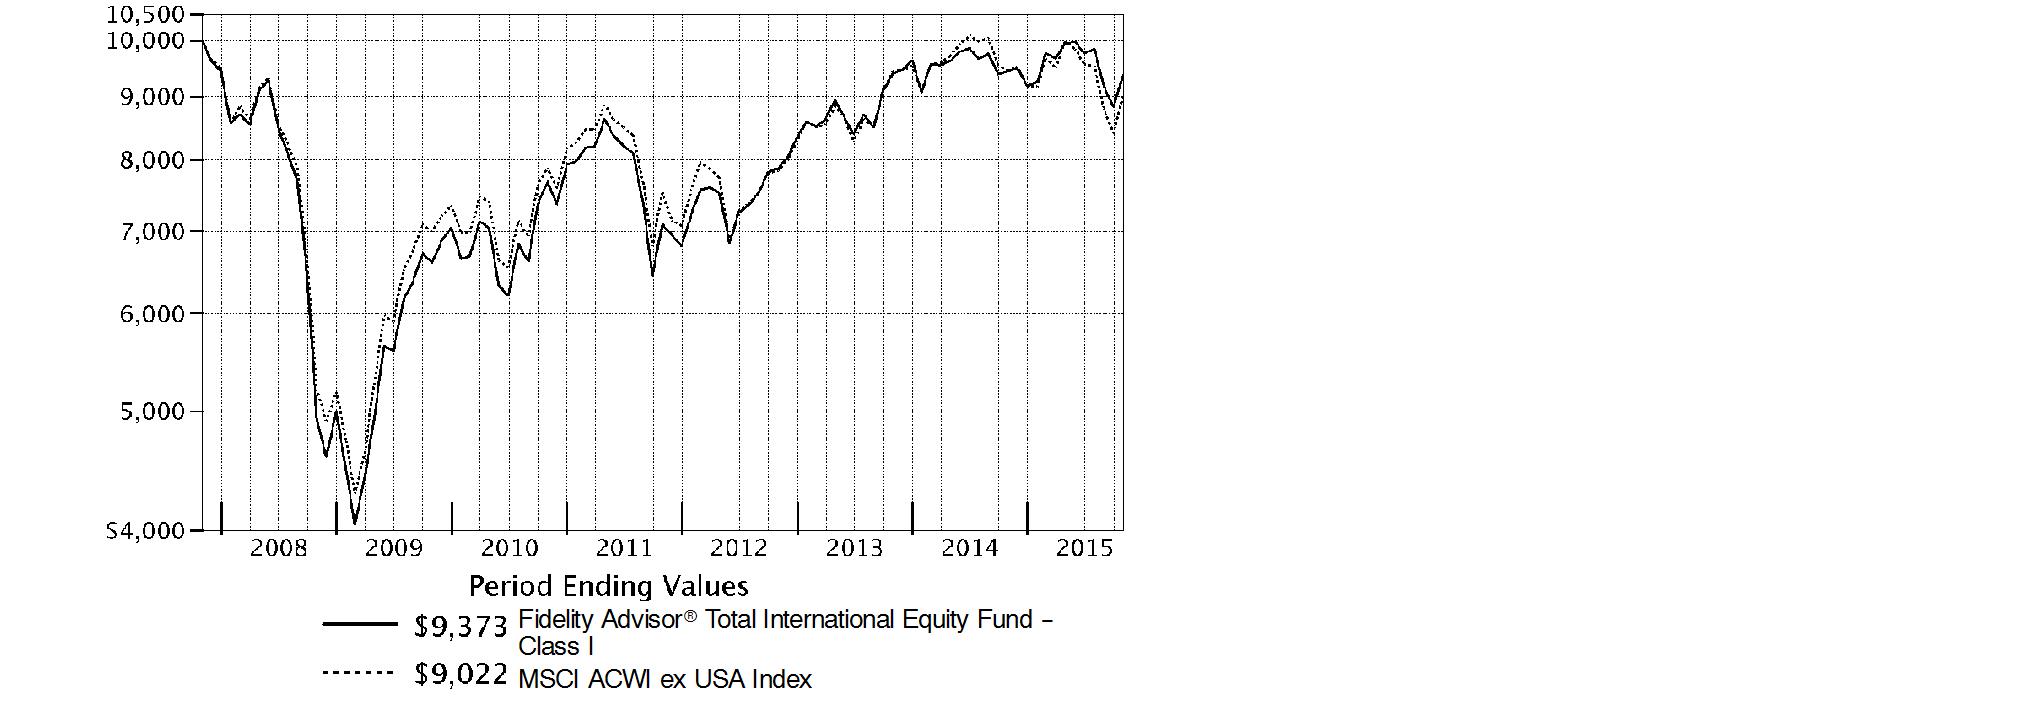
Annual Report
Market Recap: International equities suffered a moderate setback for the 12 months ending October 31, 2015, held back by a collapse in commodities prices that hurt resources-related sectors and geographies. The MSCI ACWI (All Country World Index) ex USA Index returned -4.55% for the period, affected also by concerns about global economic growth. Commodity producers remained under pressure for much of the past year, largely related to economic deceleration in China (-1%), the world's second-largest economy and a leading consumer of raw materials. This effect was exacerbated by U.S. dollar strength relative to global currencies, which weighed on commodities priced in dollars and acutely impacted equity returns within regions most exposed to resources prices. The emerging-markets group, for example, returned about -15% this period. Canada, a significant energy producer, returned roughly -17%. Net energy consumer Japan (+9%) was the best-performing region by far. Only about a quarter of the nearly 50 index countries managed a gain this period: Ireland (+19%) - the EU's fastest-growing economy - and Israel (+17%) proved top performers; Greece (-56%) and Brazil (-46%), among the worst. As for sectors, energy (-25%) and materials (-16%) declined sharply, whereas the two consumer sectors each gained about 6%.
Comments from Co-Portfolio Manager Alex Zavratsky: For the year, the fund's share classes (excluding sales charges, if applicable) declined modestly but significantly outpaced the benchmark MSCI ACWI (All Country World Index) ex USA Index. Among sectors, performance versus the benchmark was helped by a substantial underweighting in the struggling energy sector. Security selection in financials, information technology and materials also were notable positives. In country terms, stock picking in various European countries added value, whereas an underweighting in Japan was a modest negative. A fair-value pricing adjustment detracted by 0.59 percentage points. Visa and Mastercard, two U.S.-based payment processors listed within the software & services industry, contributed, as did BGF Retail, a South Korean convenience-store retailer. The fund's underweighting and eventual sale of U.K.-based oil giant and index component Royal Dutch Shell further added value. In contrast, relative detractors included Sands China and Wynn Macau, which encountered significant business challenges. We sold both names in the first half of the period. Also hampering results was Turkey-based Coca-Cola Icecek Sanayi, which owns the Coca-Cola bottling franchise in various emerging markets. Anticipating a worse outlook for the company, we sold the fund's investment.
The views expressed above reflect those of the portfolio manager(s) only through the end of the period as stated on the cover of this report and do not necessarily represent the views of Fidelity or any other person in the Fidelity organization. Any such views are subject to change at any time based upon market or other conditions and Fidelity disclaims any responsibility to update such views. These views may not be relied on as investment advice and, because investment decisions for a Fidelity fund are based on numerous factors, may not be relied on as an indication of trading intent on behalf of any Fidelity fund.
Annual Report
Shareholder Expense Example
As a shareholder of the Fund, you incur two types of costs: (1) transaction costs, including sales charges (loads) on purchase payments or redemption proceeds, redemption fees and (2) ongoing costs, including management fees, distribution and/or service (12b-1) fees and other Fund expenses. This Example is intended to help you understand your ongoing costs (in dollars) of investing in the Fund and to compare these costs with the ongoing costs of investing in other mutual funds.
The Example is based on an investment of $1,000 invested at the beginning of the period and held for the entire period (May 1, 2015 to October 31, 2015).
Actual Expenses
The first line of the accompanying table for each class of the Fund provides information about actual account values and actual expenses. You may use the information in this line, together with the amount you invested, to estimate the expenses that you paid over the period. Simply divide your account value by $1,000.00 (for example, an $8,600 account value divided by $1,000.00 = 8.6), then multiply the result by the number in the first line for a class of the Fund under the heading entitled "Expenses Paid During Period" to estimate the expenses you paid on your account during this period. A small balance maintenance fee of $12.00 that is charged once a year may apply for certain accounts with a value of less than $2,000. This fee is not included in the table below. If it was, the estimate of expenses you paid during the period would be higher, and your ending account value lower, by this amount.
Hypothetical Example for Comparison Purposes
The second line of the accompanying table for each class of the Fund provides information about hypothetical account values and hypothetical expenses based on a Class' actual expense ratio and an assumed rate of return of 5% per year before expenses, which is not the Class' actual return. The hypothetical account values and expenses may not be used to estimate the actual ending account balance or expenses you paid for the period. You may use this information to compare the ongoing costs of investing in the Fund and other funds. To do so, compare this 5% hypothetical example with the 5% hypothetical examples that appear in the shareholder reports of the other funds. A small balance maintenance fee of $12.00 that is charged once a year may apply for certain accounts with a value of less than $2,000. This fee is not included in the table below. If it was, the estimate of expenses you paid during the period would be higher, and your ending account value lower, by this amount. In addition, the Fund, as a shareholder in the underlying Fidelity Central Funds, will indirectly bear its pro-rata share of the fees and expenses incurred by the underlying Fidelity Central Funds. These fees and expenses are not included in the Fund's annualized expense ratio used to calculate the expense estimate in the table below.
Please note that the expenses shown in the table are meant to highlight your ongoing costs only and do not reflect any transaction costs. Therefore, the second line of the table is useful in comparing ongoing costs only, and will not help you determine the relative total costs of owning different funds. In addition, if these transactional costs were included, your costs would have been higher.
Annual Report
Shareholder Expense Example - continued
| Annualized
Expense RatioB | Beginning
Account Value
May 1, 2015 | Ending
Account Value
October 31, 2015 | Expenses Paid
During PeriodC
May 1, 2015
to October 31, 2015 |
Class A | 1.45% | | | |
Actual | | $ 1,000.00 | $ 942.00 | $ 7.10 |
HypotheticalA | | $ 1,000.00 | $ 1,017.90 | $ 7.38 |
Class T | 1.70% | | | |
Actual | | $ 1,000.00 | $ 939.80 | $ 8.31 |
HypotheticalA | | $ 1,000.00 | $ 1,016.64 | $ 8.64 |
Class B | 2.20% | | | |
Actual | | $ 1,000.00 | $ 938.90 | $ 10.75 |
HypotheticalA | | $ 1,000.00 | $ 1,014.12 | $ 11.17 |
Class C | 2.20% | | | |
Actual | | $ 1,000.00 | $ 938.40 | $ 10.75 |
HypotheticalA | | $ 1,000.00 | $ 1,014.12 | $ 11.17 |
Total International Equity | 1.06% | | | |
Actual | | $ 1,000.00 | $ 943.30 | $ 5.19 |
HypotheticalA | | $ 1,000.00 | $ 1,019.86 | $ 5.40 |
Class I | 1.16% | | | |
Actual | | $ 1,000.00 | $ 943.00 | $ 5.68 |
HypotheticalA | | $ 1,000.00 | $ 1,019.36 | $ 5.90 |
A 5% return per year before expenses
B Annualized expense ratio reflects expenses net of applicable fee waivers.
C Expenses are equal to each Class' annualized expense ratio, multiplied by the average account value over the period, multiplied by 184/365 (to reflect the one-half year period).
Annual Report
Investment Changes (Unaudited)
Asset Allocation as of October 31, 2015 |
| % of fund's
net assets | % of fund's net assets
6 months ago |
Stocks | 99.0 | 98.1 |
Short-Term Investments and Net Other Assets (Liabilities) | 1.0 | 1.9 |
Top Ten Stocks as of October 31, 2015 |
| % of fund's
net assets | % of fund's net assets
6 months ago |
Novartis AG (Switzerland, Pharmaceuticals) | 2.3 | 2.1 |
Nestle SA (Switzerland, Food Products) | 2.1 | 2.0 |
Roche Holding AG (participation certificate) (Switzerland, Pharmaceuticals) | 1.3 | 1.6 |
Anheuser-Busch InBev SA NV (Belgium, Beverages) | 1.2 | 1.3 |
Total SA (France, Oil, Gas & Consumable Fuels) | 1.2 | 1.0 |
Taiwan Semiconductor Manufacturing Co. Ltd. (Taiwan, Semiconductors & Semiconductor Equipment) | 1.1 | 1.0 |
Astellas Pharma, Inc. (Japan, Pharmaceuticals) | 1.1 | 0.9 |
Reckitt Benckiser Group PLC (United Kingdom, Household Products) | 1.0 | 0.8 |
Novo Nordisk A/S Series B sponsored ADR (Denmark, Pharmaceuticals) | 1.0 | 0.9 |
Samsung Electronics Co. Ltd. (Korea (South), Technology Hardware, Storage & Peripherals) | 1.0 | 1.1 |
| 13.3 | |
Market Sectors as of October 31, 2015 |
| % of fund's
net assets | % of fund's net assets
6 months ago |
Financials | 22.0 | 22.5 |
Consumer Discretionary | 16.1 | 15.3 |
Health Care | 14.7 | 13.6 |
Consumer Staples | 11.4 | 9.9 |
Information Technology | 11.3 | 11.2 |
Industrials | 11.1 | 11.8 |
Materials | 4.9 | 5.7 |
Energy | 2.9 | 3.4 |
Telecommunication Services | 2.7 | 3.4 |
Utilities | 1.9 | 1.3 |
Annual Report
Investments October 31, 2015
Showing Percentage of Net Assets
Common Stocks - 98.5% |
| Shares | | Value |
Australia - 2.7% |
Amcor Ltd. | 31,976 | | $ 308,850 |
Ansell Ltd. | 36,338 | | 517,089 |
CSL Ltd. | 41,325 | | 2,746,885 |
DuluxGroup Ltd. | 21,387 | | 89,416 |
Imdex Ltd. (a) | 84,227 | | 13,433 |
Macquarie Group Ltd. | 11,325 | | 685,716 |
RCG Corp. Ltd. | 97,518 | | 99,407 |
Sydney Airport unit | 250,875 | | 1,146,526 |
Telstra Corp. Ltd. | 73,830 | | 282,890 |
TFS Corp. Ltd. | 55,935 | | 69,823 |
Transurban Group unit | 177,778 | | 1,317,343 |
Westpac Banking Corp. | 81,623 | | 1,818,073 |
TOTAL AUSTRALIA | | 9,095,451 |
Austria - 0.4% |
Andritz AG | 23,972 | | 1,207,325 |
Zumtobel AG | 2,900 | | 66,012 |
TOTAL AUSTRIA | | 1,273,337 |
Bailiwick of Jersey - 1.1% |
Integrated Diagnostics Holdings PLC (a) | 71,300 | | 392,863 |
Shire PLC | 30,080 | | 2,277,985 |
Wolseley PLC | 18,076 | | 1,061,266 |
TOTAL BAILIWICK OF JERSEY | | 3,732,114 |
Belgium - 1.9% |
Anheuser-Busch InBev SA NV | 33,671 | | 4,017,779 |
Gimv NV | 1,019 | | 47,881 |
KBC Ancora | 4,781 | | 189,898 |
KBC Groep NV | 33,317 | | 2,029,692 |
TOTAL BELGIUM | | 6,285,250 |
Bermuda - 0.5% |
China Gas Holdings Ltd. | 248,000 | | 394,696 |
China Resource Gas Group Ltd. | 124,000 | | 340,138 |
Credicorp Ltd. (United States) | 4,600 | | 520,628 |
PAX Global Technology Ltd. | 303,000 | | 396,221 |
Petra Diamonds Ltd. | 21,800 | | 25,088 |
Vostok New Ventures Ltd. SDR (a) | 9,260 | | 59,070 |
TOTAL BERMUDA | | 1,735,841 |
Brazil - 1.2% |
BB Seguridade Participacoes SA | 64,000 | | 441,431 |
Common Stocks - continued |
| Shares | | Value |
Brazil - continued |
Brasil Foods SA | 36,900 | | $ 575,045 |
Cetip SA - Mercados Organizado | 40,100 | | 354,568 |
Cielo SA | 51,480 | | 488,697 |
FPC Par Corretora de Seguros | 25,500 | | 71,345 |
Kroton Educacional SA | 178,800 | | 457,136 |
Qualicorp SA | 99,500 | | 417,964 |
Smiles SA | 40,400 | | 315,318 |
Ultrapar Participacoes SA | 25,700 | | 446,487 |
Weg SA | 94,900 | | 354,348 |
TOTAL BRAZIL | | 3,922,339 |
British Virgin Islands - 0.1% |
Gem Diamonds Ltd. | 14,373 | | 21,936 |
Mail.Ru Group Ltd. GDR (Reg. S) (a) | 18,700 | | 364,650 |
TOTAL BRITISH VIRGIN ISLANDS | | 386,586 |
Canada - 0.5% |
Cara Operations Ltd. | 3,700 | | 100,338 |
Imperial Oil Ltd. | 17,900 | | 595,617 |
McCoy Global, Inc. | 15,800 | | 35,766 |
New Look Vision Group, Inc. | 2,600 | | 59,651 |
Pason Systems, Inc. | 37,100 | | 545,889 |
Potash Corp. of Saskatchewan, Inc. | 20,100 | | 407,042 |
ShawCor Ltd. Class A | 1,400 | | 29,711 |
TOTAL CANADA | | 1,774,014 |
Cayman Islands - 2.1% |
58.com, Inc. ADR (a) | 8,200 | | 430,418 |
Alibaba Group Holding Ltd. sponsored ADR (a) | 16,100 | | 1,349,663 |
ENN Energy Holdings Ltd. | 78,000 | | 446,834 |
Fu Shou Yuan International Group Ltd. | 494,000 | | 336,826 |
Hengan International Group Co. Ltd. | 48,500 | | 523,724 |
Shenzhou International Group Holdings Ltd. | 79,000 | | 389,310 |
Sino Biopharmaceutical Ltd. | 340,000 | | 422,518 |
TAL Education Group ADR (a) | 10,100 | | 388,345 |
Tencent Holdings Ltd. | 127,600 | | 2,405,181 |
Value Partners Group Ltd. | 48,000 | | 50,828 |
Vipshop Holdings Ltd. ADR (a) | 18,400 | | 377,568 |
TOTAL CAYMAN ISLANDS | | 7,121,215 |
China - 1.8% |
Beijing Capital International Airport Co. Ltd. (H Shares) | 378,000 | | 404,592 |
China Life Insurance Co. Ltd. (H Shares) | 121,000 | | 436,336 |
Common Stocks - continued |
| Shares | | Value |
China - continued |
China Pacific Insurance (Group) Co. Ltd. (H Shares) | 159,400 | | $ 634,953 |
Fuyao Glass Industries Group Co. Ltd. (a) | 146,400 | | 312,977 |
Inner Mongoli Yili Industries Co. Ltd. | 138,900 | | 349,387 |
Jiangsu Hengrui Medicine Co. Ltd. | 47,430 | | 393,525 |
Kweichow Moutai Co. Ltd. | 11,840 | | 399,763 |
PICC Property & Casualty Co. Ltd. (H Shares) | 233,340 | | 529,465 |
Ping An Insurance (Group) Co. of China Ltd. (H Shares) | 182,500 | | 1,024,418 |
Shanghai International Airport Co. Ltd. | 81,800 | | 390,218 |
Weifu High-Technology Co. Ltd. (B Shares) | 108,467 | | 276,545 |
Zhengzhou Yutong Bus Co. Ltd. | 109,150 | | 375,945 |
Zhuzhou CSR Times Electric Co. Ltd. (H Shares) | 62,000 | | 401,353 |
TOTAL CHINA | | 5,929,477 |
Denmark - 1.4% |
Jyske Bank A/S (Reg.) (a) | 20,654 | | 1,008,285 |
Novo Nordisk A/S Series B sponsored ADR | 62,760 | | 3,337,577 |
Spar Nord Bank A/S | 12,631 | | 121,052 |
Topdanmark A/S (a) | 12,300 | | 327,304 |
TOTAL DENMARK | | 4,794,218 |
Egypt - 0.1% |
Commercial International Bank SAE sponsored GDR | 72,000 | | 421,200 |
Finland - 0.6% |
Sampo Oyj (A Shares) | 29,153 | | 1,425,944 |
Tikkurila Oyj | 21,880 | | 401,567 |
TOTAL FINLAND | | 1,827,511 |
France - 6.6% |
Atos Origin SA | 14,974 | | 1,194,620 |
AXA SA | 69,506 | | 1,854,984 |
Capgemini SA | 16,802 | | 1,497,136 |
Havas SA | 85,186 | | 739,094 |
Laurent-Perrier Group SA | 759 | | 65,761 |
LVMH Moet Hennessy - Louis Vuitton SA | 1,925 | | 358,376 |
Orange SA | 71,800 | | 1,265,955 |
Renault SA | 6,811 | | 642,093 |
Safran SA | 20,714 | | 1,573,312 |
Sanofi SA | 30,785 | | 3,105,463 |
Societe Generale Series A | 28,000 | | 1,300,410 |
Total SA (d) | 80,020 | | 3,869,674 |
Unibail-Rodamco | 5,100 | | 1,425,047 |
Vetoquinol SA | 1,500 | | 62,927 |
Common Stocks - continued |
| Shares | | Value |
France - continued |
VINCI SA | 24,800 | | $ 1,673,914 |
Virbac SA | 730 | | 145,578 |
Vivendi SA | 60,352 | | 1,451,877 |
TOTAL FRANCE | | 22,226,221 |
Germany - 3.5% |
alstria office REIT-AG | 4,700 | | 65,612 |
Axel Springer Verlag AG | 9,300 | | 522,996 |
BASF AG | 25,907 | | 2,122,401 |
Bayer AG | 23,512 | | 3,137,501 |
CompuGroup Medical AG | 6,146 | | 181,126 |
Continental AG | 2,483 | | 597,145 |
CTS Eventim AG | 8,680 | | 339,848 |
Fielmann AG | 2,358 | | 165,302 |
Fresenius SE & Co. KGaA | 19,200 | | 1,410,862 |
GEA Group AG | 6,958 | | 279,007 |
Linde AG | 10,749 | | 1,864,627 |
SAP AG | 7,272 | | 573,289 |
Wirecard AG | 7,400 | | 382,499 |
TOTAL GERMANY | | 11,642,215 |
Greece - 0.0% |
Titan Cement Co. SA (Reg.) | 3,144 | | 68,973 |
Hong Kong - 1.3% |
AIA Group Ltd. | 440,600 | | 2,583,384 |
CSPC Pharmaceutical Group Ltd. | 414,000 | | 385,453 |
Guangdong Investment Ltd. | 272,000 | | 382,530 |
Power Assets Holdings Ltd. | 52,500 | | 522,187 |
Techtronic Industries Co. Ltd. | 98,000 | | 358,256 |
TOTAL HONG KONG | | 4,231,810 |
India - 2.6% |
Adani Ports & Special Economic Zone (a) | 85,692 | | 386,907 |
Amara Raja Batteries Ltd. (a) | 23,398 | | 322,574 |
Asian Paints India Ltd. | 31,860 | | 403,764 |
Axis Bank Ltd. (a) | 43,505 | | 315,084 |
Bharti Infratel Ltd. (a) | 63,942 | | 379,772 |
Colgate-Palmolive (India) | 21,164 | | 308,526 |
Exide Industries Ltd. (a) | 132,621 | | 302,551 |
HCL Technologies Ltd. | 40,668 | | 541,301 |
HDFC Bank Ltd. (a) | 20,325 | | 407,652 |
Housing Development Finance Corp. Ltd. | 97,642 | | 1,870,341 |
Common Stocks - continued |
| Shares | | Value |
India - continued |
IndusInd Bank Ltd. | 23,714 | | $ 329,947 |
Jyothy Laboratories Ltd. | 20,417 | | 95,766 |
LIC Housing Finance Ltd. (a) | 49,289 | | 359,884 |
Lupin Ltd. | 15,199 | | 447,510 |
Maruti Suzuki India Ltd. (a) | 4,873 | | 331,429 |
Sun Pharmaceutical Industries Ltd. (a) | 45,647 | | 620,302 |
Tata Consultancy Services Ltd. | 19,367 | | 737,882 |
Titan Co. Ltd. (a) | 64,860 | | 351,863 |
Zee Entertainment Enterprises Ltd. | 59,051 | | 368,008 |
TOTAL INDIA | | 8,881,063 |
Indonesia - 0.9% |
PT ACE Hardware Indonesia Tbk | 7,719,100 | | 375,779 |
PT Bank Central Asia Tbk | 641,500 | | 602,643 |
PT Bank Rakyat Indonesia Tbk | 732,100 | | 560,317 |
PT Matahari Department Store Tbk | 325,700 | | 392,139 |
PT Media Nusantara Citra Tbk | 2,620,000 | | 339,948 |
PT Surya Citra Media Tbk | 1,657,100 | | 352,389 |
PT Tower Bersama Infrastructure Tbk (a) | 719,600 | | 374,775 |
TOTAL INDONESIA | | 2,997,990 |
Ireland - 1.6% |
Allergan PLC (a) | 3,100 | | 956,257 |
CRH PLC sponsored ADR | 55,829 | | 1,527,481 |
Dalata Hotel Group PLC (a) | 9,900 | | 49,207 |
FBD Holdings PLC | 5,372 | | 41,056 |
James Hardie Industries PLC: | | | |
CDI | 15,656 | | 202,668 |
sponsored ADR | 132,225 | | 1,738,759 |
Medtronic PLC | 10,100 | | 746,592 |
TOTAL IRELAND | | 5,262,020 |
Isle of Man - 0.1% |
Playtech Ltd. | 35,552 | | 469,148 |
Israel - 0.9% |
Azrieli Group | 11,596 | | 454,351 |
Check Point Software Technologies Ltd. (a) | 4,100 | | 348,254 |
Ituran Location & Control Ltd. | 1,661 | | 33,884 |
Sarine Technologies Ltd. | 30,200 | | 33,568 |
Strauss Group Ltd. (a) | 6,659 | | 95,398 |
Teva Pharmaceutical Industries Ltd. sponsored ADR | 34,109 | | 2,018,912 |
TOTAL ISRAEL | | 2,984,367 |
Common Stocks - continued |
| Shares | | Value |
Italy - 1.1% |
Azimut Holding SpA | 22,414 | | $ 539,535 |
Banco di Desio e della Brianza SpA | 19,000 | | 65,020 |
Beni Stabili SpA SIIQ | 255,326 | | 210,296 |
Interpump Group SpA | 53,691 | | 791,154 |
Intesa Sanpaolo SpA | 273,300 | | 952,093 |
Mediaset SpA | 120,600 | | 612,694 |
Telecom Italia SpA (a) | 361,000 | | 503,625 |
TOTAL ITALY | | 3,674,417 |
Japan - 14.0% |
Aoki Super Co. Ltd. | 6,000 | | 63,459 |
Artnature, Inc. | 12,000 | | 115,385 |
Asahi Co. Ltd. | 7,500 | | 73,666 |
Asia Securities Printing Co. Ltd. | 11,000 | | 81,075 |
Astellas Pharma, Inc. | 241,900 | | 3,511,053 |
Autobacs Seven Co. Ltd. | 5,300 | | 92,939 |
Azbil Corp. | 7,500 | | 189,219 |
Broadleaf Co. Ltd. | 2,800 | | 32,073 |
Coca-Cola Central Japan Co. Ltd. | 27,200 | | 382,279 |
Daiichikosho Co. Ltd. | 3,100 | | 103,391 |
Daikokutenbussan Co. Ltd. | 5,000 | | 171,761 |
DENSO Corp. | 56,500 | | 2,634,182 |
Dentsu, Inc. | 21,800 | | 1,225,555 |
East Japan Railway Co. | 23,900 | | 2,272,307 |
Fast Retailing Co. Ltd. | 2,600 | | 949,734 |
GCA Savvian Group Corp. | 6,400 | | 75,145 |
Glory Ltd. | 4,900 | | 123,967 |
Goldcrest Co. Ltd. | 7,460 | | 139,580 |
Hoya Corp. | 61,000 | | 2,517,273 |
Itochu Corp. | 79,000 | | 988,526 |
Iwatsuka Confectionary Co. Ltd. | 800 | | 41,351 |
Japan Digital Laboratory Co. | 5,700 | | 72,884 |
Japan Tobacco, Inc. | 73,900 | | 2,557,811 |
KDDI Corp. | 50,500 | | 1,222,016 |
Keyence Corp. | 2,921 | | 1,520,697 |
Kobayashi Pharmaceutical Co. Ltd. | 2,000 | | 155,057 |
Koshidaka Holdings Co. Ltd. | 4,000 | | 72,412 |
Lasertec Corp. | 6,200 | | 67,661 |
Makita Corp. | 12,900 | | 706,828 |
Medikit Co. Ltd. | 2,100 | | 62,618 |
Meiko Network Japan Co. Ltd. | 2,700 | | 32,055 |
Miraial Co. Ltd. | 2,400 | | 23,282 |
Common Stocks - continued |
| Shares | | Value |
Japan - continued |
Mitsubishi UFJ Financial Group, Inc. | 372,800 | | $ 2,411,097 |
Mitsui Fudosan Co. Ltd. | 55,000 | | 1,496,751 |
Nagaileben Co. Ltd. | 8,100 | | 138,063 |
ND Software Co. Ltd. | 6,000 | | 69,259 |
Nihon Parkerizing Co. Ltd. | 18,500 | | 164,562 |
Nintendo Co. Ltd. | 3,900 | | 623,480 |
Nippon Prologis REIT, Inc. | 253 | | 444,921 |
Nippon Seiki Co. Ltd. | 2,000 | | 41,912 |
Nippon Telegraph & Telephone Corp. | 43,400 | | 1,591,105 |
NS Tool Co. Ltd. | 3,800 | | 65,977 |
OBIC Co. Ltd. | 19,800 | | 1,044,984 |
Olympus Corp. | 23,900 | | 806,179 |
ORIX Corp. | 72,100 | | 1,052,933 |
OSG Corp. | 26,500 | | 498,470 |
Paramount Bed Holdings Co. Ltd. | 3,200 | | 102,641 |
San-Ai Oil Co. Ltd. | 11,000 | | 84,019 |
Seven & i Holdings Co. Ltd. | 23,200 | | 1,053,856 |
Seven Bank Ltd. | 464,800 | | 2,117,887 |
Shinsei Bank Ltd. | 386,000 | | 809,354 |
SHO-BOND Holdings Co. Ltd. | 22,100 | | 877,702 |
Shoei Co. Ltd. | 5,800 | | 100,171 |
SK Kaken Co. Ltd. | 1,000 | | 97,395 |
Software Service, Inc. | 1,600 | | 60,309 |
Sony Corp. | 29,700 | | 844,235 |
Sony Financial Holdings, Inc. | 47,800 | | 856,700 |
Sumitomo Mitsui Financial Group, Inc. | 45,700 | | 1,823,141 |
Techno Medica Co. Ltd. | 1,800 | | 41,100 |
The Monogatari Corp. | 1,500 | | 63,769 |
The Nippon Synthetic Chemical Industry Co. Ltd. | 10,000 | | 74,067 |
TKC Corp. | 4,000 | | 94,286 |
Tocalo Co. Ltd. | 2,800 | | 56,205 |
Toyota Motor Corp. | 46,600 | | 2,854,923 |
Tsutsumi Jewelry Co. Ltd. | 2,100 | | 41,738 |
USS Co. Ltd. | 122,900 | | 2,169,662 |
Workman Co. Ltd. | 1,900 | | 117,092 |
Yamada Consulting Group Co. Ltd. | 2,000 | | 58,539 |
Yamato Kogyo Co. Ltd. | 3,000 | | 79,911 |
TOTAL JAPAN | | 47,205,636 |
Kenya - 0.2% |
Safaricom Ltd. | 4,194,300 | | 589,791 |
Common Stocks - continued |
| Shares | | Value |
Korea (South) - 2.3% |
AMOREPACIFIC Corp. | 1,794 | | $ 593,145 |
BGFretail Co. Ltd. | 4,899 | | 729,420 |
Coway Co. Ltd. | 5,899 | | 440,189 |
KEPCO Plant Service & Engineering Co. Ltd. | 3,867 | | 352,232 |
Leeno Industrial, Inc. | 1,159 | | 44,410 |
LG Chemical Ltd. | 2,282 | | 608,589 |
LG Household & Health Care Ltd. | 639 | | 529,996 |
NAVER Corp. | 2,349 | | 1,234,399 |
Samsung Electronics Co. Ltd. | 2,749 | | 3,303,317 |
TOTAL KOREA (SOUTH) | | 7,835,697 |
Luxembourg - 0.4% |
Eurofins Scientific SA | 1,000 | | 362,060 |
RTL Group SA | 7,027 | | 607,361 |
Samsonite International SA | 112,800 | | 333,125 |
TOTAL LUXEMBOURG | | 1,302,546 |
Mexico - 1.7% |
Banregio Grupo Financiero S.A.B. de CV | 53,600 | | 289,161 |
Consorcio ARA S.A.B. de CV (a) | 249,855 | | 93,632 |
Fomento Economico Mexicano S.A.B. de CV: unit | 66,500 | | 656,916 |
sponsored ADR | 6,633 | | 657,264 |
Gruma S.A.B. de CV Series B | 26,500 | | 408,944 |
Grupo Aeroportuario del Pacifico SA de CV Series B | 43,100 | | 388,187 |
Grupo Aeroportuario del Sureste SA de CV Series B | 25,935 | | 401,669 |
Grupo Aeroportuario Norte S.A.B. de CV | 66,700 | | 343,074 |
Grupo Financiero Banorte S.A.B. de CV Series O | 118,900 | | 640,288 |
Grupo GICSA SA de CV (a) | 333,500 | | 325,064 |
Infraestructura Energetica Nova S.A.B. de CV | 67,300 | | 324,525 |
Megacable Holdings S.A.B. de CV unit | 96,000 | | 365,860 |
Promotora y Operadora de Infraestructura S.A.B. de CV (a) | 33,700 | | 422,551 |
Tenedora Nemak SA de CV (a) | 275,600 | | 398,605 |
TOTAL MEXICO | | 5,715,740 |
Netherlands - 2.0% |
Aalberts Industries NV | 7,600 | | 247,085 |
Hangzhou Hikvision Digital Technology Co. Ltd. ELS (BNP Paribas Arbitrage Warrant Program) warrants 10/21/16 (a) | 58,600 | | 319,201 |
Heijmans NV (Certificaten Van Aandelen) (a) | 5,881 | | 49,473 |
ING Groep NV (Certificaten Van Aandelen) | 198,723 | | 2,892,188 |
Koninklijke KPN NV | 141,019 | | 516,722 |
Common Stocks - continued |
| Shares | | Value |
Netherlands - continued |
Mylan N.V. | 8,700 | | $ 383,583 |
PostNL NV (a) | 74,300 | | 306,880 |
RELX NV | 108,169 | | 1,849,642 |
VastNed Retail NV | 4,790 | | 233,079 |
TOTAL NETHERLANDS | | 6,797,853 |
Norway - 0.0% |
Kongsberg Gruppen ASA | 4,100 | | 64,177 |
Philippines - 0.9% |
Ayala Corp. | 23,490 | | 391,201 |
GT Capital Holdings, Inc. | 12,765 | | 358,216 |
International Container Terminal Services, Inc. | 214,290 | | 377,807 |
Jollibee Food Corp. | 100,120 | | 440,038 |
Robinsons Land Corp. | 541,800 | | 354,176 |
SM Investments Corp. | 20,660 | | 385,704 |
SM Prime Holdings, Inc. | 874,700 | | 402,756 |
Universal Robina Corp. | 93,880 | | 402,271 |
TOTAL PHILIPPINES | | 3,112,169 |
Russia - 0.2% |
Magnit OJSC (a) | 3,230 | | 563,451 |
Singapore - 0.1% |
UOL Group Ltd. | 82,092 | | 383,104 |
South Africa - 2.1% |
Alexander Forbes Group Holding | 72,146 | | 45,459 |
Aspen Pharmacare Holdings Ltd. | 21,100 | | 473,885 |
Bidvest Group Ltd. | 18,532 | | 474,046 |
Clicks Group Ltd. | 60,379 | | 441,095 |
Discovery Ltd. | 38,167 | | 408,174 |
FirstRand Ltd. | 159,700 | | 586,109 |
Mr Price Group Ltd. | 26,300 | | 403,841 |
Naspers Ltd. Class N | 17,900 | | 2,621,815 |
Sanlam Ltd. | 111,700 | | 504,630 |
Steinhoff International Holdings Ltd. | 96,300 | | 589,463 |
Woolworths Holdings Ltd. | 62,400 | | 462,262 |
TOTAL SOUTH AFRICA | | 7,010,779 |
Spain - 2.6% |
Amadeus IT Holding SA Class A | 37,700 | | 1,606,866 |
Hispania Activos Inmobiliarios SA (a) | 38,400 | | 578,504 |
Iberdrola SA | 263,720 | | 1,884,128 |
Inditex SA | 85,664 | | 3,212,705 |
Common Stocks - continued |
| Shares | | Value |
Spain - continued |
Mediaset Espana Comunicacion SA | 52,300 | | $ 635,792 |
Merlin Properties Socimi SA | 36,100 | | 462,871 |
Prosegur Compania de Seguridad SA (Reg.) | 92,476 | | 411,849 |
TOTAL SPAIN | | 8,792,715 |
Sweden - 2.9% |
ASSA ABLOY AB (B Shares) | 118,500 | | 2,357,330 |
Atlas Copco AB (A Shares) (d) | 40,659 | | 1,061,263 |
Fagerhult AB | 50,855 | | 869,057 |
H&M Hennes & Mauritz AB (B Shares) | 32,638 | | 1,269,450 |
Intrum Justitia AB | 23,463 | | 843,109 |
Nordea Bank AB | 130,467 | | 1,443,092 |
Sandvik AB | 57,900 | | 541,486 |
Svenska Handelsbanken AB (A Shares) | 107,845 | | 1,464,695 |
TOTAL SWEDEN | | 9,849,482 |
Switzerland - 8.4% |
Compagnie Financiere Richemont SA Series A | 4,136 | | 354,652 |
Credit Suisse Group AG (e)(f) | 66,373 | | 1,527,630 |
Nestle SA | 92,983 | | 7,101,483 |
Novartis AG | 86,316 | | 7,819,260 |
Roche Holding AG (participation certificate) | 16,701 | | 4,534,303 |
Schindler Holding AG: | | | |
(participation certificate) | 6,011 | | 976,647 |
(Reg.) | 2,251 | | 366,190 |
Sika AG (Bearer) | 90 | | 295,372 |
Syngenta AG (Switzerland) | 2,018 | | 677,988 |
Tecan Group AG | 600 | | 81,825 |
UBS Group AG | 144,815 | | 2,900,644 |
Zurich Insurance Group AG | 5,815 | | 1,534,579 |
TOTAL SWITZERLAND | | 28,170,573 |
Taiwan - 1.8% |
Addcn Technology Co. Ltd. | 6,500 | | 63,168 |
Advantech Co. Ltd. | 52,000 | | 374,003 |
Catcher Technology Co. Ltd. | 46,000 | | 453,411 |
ECLAT Textile Co. Ltd. | 26,000 | | 383,613 |
Giant Manufacturing Co. Ltd. | 46,000 | | 347,852 |
Largan Precision Co. Ltd. | 6,870 | | 536,438 |
Merida Industry Co. Ltd. | 62,500 | | 366,741 |
Taiwan Semiconductor Manufacturing Co. Ltd. | 853,035 | | 3,594,241 |
TOTAL TAIWAN | | 6,119,467 |
Common Stocks - continued |
| Shares | | Value |
Thailand - 0.3% |
Airports of Thailand PCL (For. Reg.) | 51,200 | | $ 427,983 |
Bangkok Dusit Medical Services PCL (For. Reg.) | 627,000 | | 334,320 |
Thai Beverage PCL | 666,200 | | 320,355 |
TOTAL THAILAND | | 1,082,658 |
Turkey - 0.5% |
Koc Holding A/S | 91,000 | | 410,990 |
TAV Havalimanlari Holding A/S | 49,000 | | 384,887 |
Tofas Turk Otomobil Fabrikasi A/S | 49,916 | | 329,589 |
Tupras Turkiye Petrol Rafinelleri A/S (a) | 15,000 | | 396,172 |
TOTAL TURKEY | | 1,521,638 |
United Arab Emirates - 0.2% |
DP World Ltd. | 19,778 | | 399,713 |
First Gulf Bank PJSC | 103,339 | | 347,464 |
TOTAL UNITED ARAB EMIRATES | | 747,177 |
United Kingdom - 15.7% |
AA PLC | 19,973 | | 85,259 |
Al Noor Hospitals Group PLC | 1,200 | | 21,755 |
Associated British Foods PLC | 26,500 | | 1,411,450 |
AstraZeneca PLC (United Kingdom) | 33,388 | | 2,127,903 |
Aviva PLC | 183,905 | | 1,374,428 |
Babcock International Group PLC | 57,323 | | 851,878 |
BAE Systems PLC | 291,421 | | 1,971,315 |
Barclays PLC | 484,356 | | 1,725,655 |
Bellway PLC | 6,328 | | 253,246 |
Berendsen PLC | 61,555 | | 972,655 |
BG Group PLC | 48,500 | | 766,229 |
BP PLC sponsored ADR | 68,828 | | 2,457,160 |
Britvic PLC | 13,817 | | 148,889 |
Bunzl PLC | 43,632 | | 1,250,421 |
Compass Group PLC | 76,607 | | 1,316,944 |
Dechra Pharmaceuticals PLC | 9,100 | | 136,007 |
Derwent London PLC | 1,600 | | 95,703 |
DP Poland PLC (a) | 200,000 | | 69,757 |
Elementis PLC | 39,508 | | 142,884 |
Great Portland Estates PLC | 13,972 | | 191,592 |
H&T Group PLC | 10,000 | | 30,215 |
Hilton Food Group PLC | 5,400 | | 38,710 |
Howden Joinery Group PLC | 22,200 | | 158,660 |
HSBC Holdings PLC sponsored ADR | 58,966 | | 2,303,802 |
Imperial Tobacco Group PLC | 40,224 | | 2,169,706 |
Common Stocks - continued |
| Shares | | Value |
United Kingdom - continued |
Informa PLC | 217,724 | | $ 1,906,454 |
InterContinental Hotel Group PLC | 8,700 | | 347,647 |
InterContinental Hotel Group PLC ADR | 67,196 | | 2,679,776 |
ITE Group PLC | 29,900 | | 64,647 |
ITV PLC | 398,719 | | 1,551,415 |
Johnson Matthey PLC | 16,090 | | 641,192 |
JUST EAT Ltd. (a) | 14,240 | | 93,517 |
Liberty Global PLC LiLAC: | | | |
Class A (a) | 13,900 | | 618,828 |
Class A (a) | 4,450 | | 171,859 |
Lloyds Banking Group PLC | 2,410,900 | | 2,736,401 |
Meggitt PLC | 60,187 | | 328,085 |
Micro Focus International PLC | 34,100 | | 660,261 |
Mondi PLC | 18,300 | | 424,298 |
National Grid PLC | 119,880 | | 1,707,677 |
NMC Health PLC | 24,000 | | 281,928 |
Prudential PLC | 130,848 | | 3,056,151 |
Reckitt Benckiser Group PLC | 35,751 | | 3,488,959 |
Rightmove PLC | 7,500 | | 443,865 |
Rio Tinto PLC | 55,584 | | 2,025,774 |
Rolls-Royce Group PLC | 43,252 | | 457,369 |
SABMiller PLC | 39,863 | | 2,455,039 |
Shaftesbury PLC | 41,837 | | 606,584 |
Spectris PLC | 7,170 | | 184,258 |
Spirax-Sarco Engineering PLC | 6,199 | | 290,609 |
Taylor Wimpey PLC | 29,400 | | 89,740 |
Ted Baker PLC | 3,375 | | 157,492 |
Topps Tiles PLC | 29,400 | | 65,945 |
Ultra Electronics Holdings PLC | 5,901 | | 153,102 |
Unite Group PLC | 67,977 | | 696,876 |
Vodafone Group PLC sponsored ADR | 66,926 | | 2,206,550 |
TOTAL UNITED KINGDOM | | 52,664,521 |
United States of America - 9.2% |
A.O. Smith Corp. | 4,900 | | 376,418 |
Alphabet, Inc.: | | | |
Class A (a) | 2,180 | | 1,607,510 |
Class C | 542 | | 385,259 |
Altria Group, Inc. | 13,200 | | 798,204 |
ANSYS, Inc. (a) | 500 | | 47,655 |
Apple, Inc. | 3,300 | | 394,350 |
Autoliv, Inc. | 13,854 | | 1,679,659 |
Common Stocks - continued |
| Shares | | Value |
United States of America - continued |
Berkshire Hathaway, Inc. Class B (a) | 8,216 | | $ 1,117,540 |
BorgWarner, Inc. | 17,694 | | 757,657 |
Broadridge Financial Solutions, Inc. | 1,340 | | 79,837 |
Chevron Corp. | 7,400 | | 672,512 |
China Biologic Products, Inc. (a) | 10,700 | | 1,219,158 |
Cognizant Technology Solutions Corp. Class A (a) | 5,100 | | 347,361 |
Constellation Brands, Inc. Class A (sub. vtg.) | 9,100 | | 1,226,680 |
Domino's Pizza, Inc. | 4,000 | | 426,680 |
Ecolab, Inc. | 3,000 | | 361,050 |
Edgewell Personal Care Co. (a) | 5,600 | | 474,376 |
Facebook, Inc. Class A (a) | 3,100 | | 316,107 |
International Flavors & Fragrances, Inc. | 3,000 | | 348,180 |
Kennedy-Wilson Holdings, Inc. | 7,473 | | 183,238 |
Martin Marietta Materials, Inc. | 4,870 | | 755,581 |
MasterCard, Inc. Class A | 27,690 | | 2,741,033 |
McGraw Hill Financial, Inc. | 19,500 | | 1,806,480 |
MercadoLibre, Inc. (d) | 3,600 | | 354,132 |
Mettler-Toledo International, Inc. (a) | 1,220 | | 379,408 |
Mohawk Industries, Inc. (a) | 8,715 | | 1,703,783 |
Moody's Corp. | 9,200 | | 884,672 |
NIKE, Inc. Class B | 2,500 | | 327,575 |
Philip Morris International, Inc. | 17,300 | | 1,529,320 |
PPG Industries, Inc. | 3,500 | | 364,910 |
PriceSmart, Inc. | 8,685 | | 746,736 |
ResMed, Inc. | 11,220 | | 646,384 |
ResMed, Inc. CDI | 83,728 | | 475,587 |
Sherwin-Williams Co. | 2,700 | | 720,441 |
SS&C Technologies Holdings, Inc. | 21,954 | | 1,627,889 |
Visa, Inc. Class A | 39,424 | | 3,058,514 |
TOTAL UNITED STATES OF AMERICA | | 30,941,876 |
TOTAL COMMON STOCKS (Cost $282,399,968) |
331,207,827
|
Nonconvertible Preferred Stocks - 0.5% |
| | | |
Brazil - 0.2% |
Ambev SA sponsored ADR | 157,100 | | 765,077 |
Nonconvertible Preferred Stocks - continued |
| Shares | | Value |
Germany - 0.3% |
Sartorius AG (non-vtg.) | 1,150 | | $ 260,254 |
Volkswagen AG | 4,790 | | 574,968 |
TOTAL GERMANY | | 835,222 |
United Kingdom - 0.0% |
Rolls-Royce Group PLC | 4,009,460 | | 6,181 |
TOTAL NONCONVERTIBLE PREFERRED STOCKS (Cost $2,079,611) |
1,606,480
|
Money Market Funds - 1.8% |
| | | |
Fidelity Cash Central Fund, 0.18% (b) | 4,847,966 | | 4,847,966 |
Fidelity Securities Lending Cash Central Fund, 0.19% (b)(c) | 1,178,838 | | 1,178,838 |
TOTAL MONEY MARKET FUNDS (Cost $6,026,804) |
6,026,804
|
TOTAL INVESTMENT PORTFOLIO - 100.8% (Cost $290,506,383) | | 338,841,111 |
NET OTHER ASSETS (LIABILITIES) - (0.8)% | | (2,647,738) |
NET ASSETS - 100% | $ 336,193,373 |
Legend |
(a) Non-income producing |
(b) Affiliated fund that is generally available only to investment companies and other accounts managed by Fidelity Investments. The rate quoted is the annualized seven-day yield of the fund at period end. A complete unaudited listing of the fund's holdings as of its most recent quarter end is available upon request. In addition, each Fidelity Central Fund's financial statements, which are not covered by the Fund's Report of Independent Registered Public Accounting Firm, are available on the SEC's website or upon request. |
(c) Investment made with cash collateral received from securities on loan. |
(d) Security or a portion of the security is on loan at period end. |
(e) Security or a portion of the security purchased on a delayed delivery or when-issued basis. |
(f) Restricted securities - Investment in securities not registered under the Securities Act of 1933 (excluding 144A issues). At the end of the period, the value of restricted securities (excluding 144A issues) amounted to $1,527,630 or 0.5% of net assets. |
Additional information on each restricted holding is as follows: |
Security | Acquisition Date | Acquisition Cost |
Credit Suisse Group AG | 10/21/15 | $ 1,573,804 |
Affiliated Central Funds |
Information regarding fiscal year to date income earned by the Fund from investments in Fidelity Central Funds is as follows: |
Fund | Income earned |
Fidelity Cash Central Fund | $ 6,824 |
Fidelity Securities Lending Cash Central Fund | 66,496 |
Total | $ 73,320 |
Other Information |
Categorizations in the Schedule of Investments are based on country or territory of incorporation. |
The following is a summary of the inputs used, as of October 31, 2015, involving the Fund's assets and liabilities carried at fair value. The inputs or methodology used for valuing securities may not be an indication of the risk associated with investing in those securities. For more information on valuation inputs, and their aggregation into the levels used in the tables below, please refer to the Investment Valuation section in the accompanying Notes to Financial Statements. |
Valuation Inputs at Reporting Date: |
Description | Total | Level 1 | Level 2 | Level 3 |
Investments in Securities: | | | | |
Equities: | | | | |
Consumer Discretionary | $ 54,054,675 | $ 32,872,185 | $ 21,182,490 | $ - |
Consumer Staples | 38,629,594 | 17,080,622 | 21,548,972 | - |
Energy | 9,899,236 | 5,179,314 | 4,719,922 | - |
Financials | 72,564,874 | 29,512,803 | 43,052,071 | - |
Health Care | 50,571,004 | 15,643,544 | 34,927,460 | - |
Industrials | 37,121,641 | 17,589,943 | 19,531,698 | - |
Information Technology | 37,989,345 | 26,072,664 | 11,916,681 | - |
Materials | 17,048,022 | 10,717,970 | 6,330,052 | - |
Telecommunication Services | 8,933,201 | 2,796,341 | 6,136,860 | - |
Utilities | 6,002,715 | 2,208,653 | 3,794,062 | - |
Money Market Funds | 6,026,804 | 6,026,804 | - | - |
Total Investments in Securities: | $ 338,841,111 | $ 165,700,843 | $ 173,140,268 | $ - |
The following is a summary of transfers between Level 1 and Level 2 for the period ended October 31, 2015. Transfers are assumed to have occurred at the beginning of the period, and are primarily attributable to the valuation techniques used for foreign equity securities, as discussed in the accompanying Notes to Financial Statements: |
Transfers | Total |
Level 1 to Level 2 | $ 21,750,246 |
Level 2 to Level 1 | $ 5,233,388 |
See accompanying notes which are an integral part of the financial statements.
Annual Report
Statement of Assets and Liabilities
| | October 31, 2015 |
| | |
Assets | | |
Investment in securities, at value (including securities loaned of $1,139,521) - See accompanying schedule: Unaffiliated issuers (cost $284,479,579) | $ 332,814,307 | |
Fidelity Central Funds (cost $6,026,804) | 6,026,804 | |
Total Investments (cost $290,506,383) | | $ 338,841,111 |
Cash | | 1,590 |
Foreign currency held at value (cost $175,669) | | 175,634 |
Receivable for investments sold | | 1,013,105 |
Receivable for fund shares sold | | 44,564 |
Dividends receivable | | 857,236 |
Distributions receivable from Fidelity Central Funds | | 1,951 |
Prepaid expenses | | 952 |
Receivable from investment adviser for expense reductions | | 1,548 |
Other receivables | | 19,861 |
Total assets | | 340,957,552 |
| | |
Liabilities | | |
Payable for investments purchased | | |
Regular delivery | $ 1,536,109 | |
Delayed delivery | 1,527,630 | |
Payable for fund shares redeemed | 123,606 | |
Accrued management fee | 222,046 | |
Distribution and service plan fees payable | 10,393 | |
Other affiliated payables | 48,898 | |
Other payables and accrued expenses | 116,659 | |
Collateral on securities loaned, at value | 1,178,838 | |
Total liabilities | | 4,764,179 |
| | |
Net Assets | | $ 336,193,373 |
Net Assets consist of: | | |
Paid in capital | | $ 314,144,944 |
Undistributed net investment income | | 3,560,437 |
Accumulated undistributed net realized gain (loss) on investments and foreign currency transactions | | (29,842,964) |
Net unrealized appreciation (depreciation) on investments and assets and liabilities in foreign currencies | | 48,330,956 |
Net Assets | | $ 336,193,373 |
See accompanying notes which are an integral part of the financial statements.
Annual Report
Financial Statements - continued
Statement of Assets and Liabilities - continued
| | October 31, 2015 |
| | |
Calculation of Maximum Offering Price | | |
Class A: | | |
Net Asset Value and redemption price per share ($9,162,555 ÷ 1,176,591 shares) | | $ 7.79 |
| | |
Maximum offering price per share (100/94.25 of $7.79) | | $ 8.27 |
Class T: | | |
Net Asset Value and redemption price per share ($13,961,648 ÷ 1,786,816 shares) | | $ 7.81 |
| | |
Maximum offering price per share (100/96.50 of $7.81) | | $ 8.09 |
Class B: | | |
Net Asset Value and offering price per share ($120,373 ÷ 15,363 shares)A | | $ 7.84 |
| | |
Class C: | | |
Net Asset Value and offering price per share ($3,311,463 ÷ 426,307 shares)A | | $ 7.77 |
| | |
Total International Equity: | | |
Net Asset Value, offering price and redemption price per share ($307,035,025 ÷ 39,274,070 shares) | | $ 7.82 |
| | |
Class I: | | |
Net Asset Value, offering price and redemption price per share ($2,602,309 ÷ 334,453 shares) | | $ 7.78 |
A Redemption price per share is equal to net asset value less any applicable contingent deferred sales charge.
See accompanying notes which are an integral part of the financial statements.
Annual Report
Statement of Operations
| Year ended October 31, 2015 |
| | |
Investment Income | | |
Dividends | | $ 8,666,142 |
Interest | | 9 |
Income from Fidelity Central Funds | | 73,320 |
Income before foreign taxes withheld | | 8,739,471 |
Less foreign taxes withheld | | (693,695) |
Total income | | 8,045,776 |
| | |
Expenses | | |
Management fee | | |
Basic fee | $ 2,445,747 | |
Performance adjustment | 351,396 | |
Transfer agent fees | 439,574 | |
Distribution and service plan fees | 123,737 | |
Accounting and security lending fees | 181,662 | |
Custodian fees and expenses | 211,850 | |
Independent trustees' compensation | 1,490 | |
Registration fees | 75,502 | |
Audit | 84,991 | |
Legal | 902 | |
Miscellaneous | 2,736 | |
Total expenses before reductions | 3,919,587 | |
Expense reductions | (44,429) | 3,875,158 |
Net investment income (loss) | | 4,170,618 |
Realized and Unrealized Gain (Loss) | | |
Net realized gain (loss) on: | | |
Investment securities: | | |
Unaffiliated issuers (net of foreign taxes of $103,574) | (5,650,183) | |
Foreign currency transactions | (202,557) | |
Total net realized gain (loss) | | (5,852,740) |
Change in net unrealized appreciation (depreciation) on: Investment securities (net of decrease in deferred foreign taxes of $193,627) | (608,996) | |
Assets and liabilities in foreign currencies | 50,417 | |
Total change in net unrealized appreciation (depreciation) | | (558,579) |
Net gain (loss) | | (6,411,319) |
Net increase (decrease) in net assets resulting from operations | | $ (2,240,701) |
See accompanying notes which are an integral part of the financial statements.
Annual Report
Financial Statements - continued
Statement of Changes in Net Assets
| Year ended
October 31,
2015 | Year ended
October 31,
2014 |
Increase (Decrease) in Net Assets | | |
Operations | | |
Net investment income (loss) | $ 4,170,618 | $ 7,173,996 |
Net realized gain (loss) | (5,852,740) | 5,639,847 |
Change in net unrealized appreciation (depreciation) | (558,579) | (11,137,910) |
Net increase (decrease) in net assets resulting from operations | (2,240,701) | 1,675,933 |
Distributions to shareholders from net investment income | (5,482,469) | (5,090,375) |
Distributions to shareholders from net realized gain | (1,726,810) | (7,679,276) |
Total distributions | (7,209,279) | (12,769,651) |
Share transactions - net increase (decrease) | (4,678,824) | 13,925,925 |
Redemption fees | 1,289 | 3,247 |
Total increase (decrease) in net assets | (14,127,515) | 2,835,454 |
| | |
Net Assets | | |
Beginning of period | 350,320,888 | 347,485,434 |
End of period (including undistributed net investment income of $3,560,437 and undistributed net investment income of $5,238,848, respectively) | $ 336,193,373 | $ 350,320,888 |
See accompanying notes which are an integral part of the financial statements.
Annual Report
Financial Highlights - Fidelity Total International Equity Fund Class A
Years ended October 31, | 2015 | 2014 | 2013 | 2012 | 2011 |
Selected Per-Share Data | | | | | |
Net asset value, beginning of period | $ 8.00 | $ 8.27 | $ 7.31 | $ 6.67 | $ 7.36 |
Income from Investment Operations | | | | | |
Net investment income (loss)C | .07 | .13 | .09 | .13 | .11 |
Net realized and unrealized gain (loss) | (.14) | (.12) | 1.24 | .59 | (.69) |
Total from investment operations | (.07) | .01 | 1.33 | .72 | (.58) |
Distributions from net investment income | (.10) | (.10) | (.13) | (.08) | (.09) |
Distributions from net realized gain | (.04) | (.18) | (.25) | - | (.02) |
Total distributions | (.14) | (.28) | (.37) H | (.08) | (.11) |
Redemption fees added to paid in capitalC, G | - | - | - | - | - |
Net asset value, end of period | $ 7.79 | $ 8.00 | $ 8.27 | $ 7.31 | $ 6.67 |
Total ReturnA, B | (.89)% | .19% | 19.00% | 10.88% | (8.03)% |
Ratios to Average Net AssetsD, F | | | | | |
Expenses before reductions | 1.48% | 1.44% | 1.50% | 1.57% | 1.73% |
Expenses net of fee waivers, if any | 1.45% | 1.44% | 1.45% | 1.45% | 1.45% |
Expenses net of all reductions | 1.44% | 1.44% | 1.43% | 1.42% | 1.42% |
Net investment income (loss) | .86% | 1.63% | 1.21% | 1.88% | 1.44% |
Supplemental Data | | | | | |
Net assets, end of period (000 omitted) | $ 9,163 | $ 9,164 | $ 9,034 | $ 5,767 | $ 4,307 |
Portfolio turnover rateE | 53% | 85% | 89% | 110% | 75% |
A Total returns would have been lower if certain expenses had not been reduced during the applicable periods shown.
B Total returns do not include the effect of the sales charges.
C Calculated based on average shares outstanding during the period.
D Fees and expenses of any underlying Fidelity Central Funds are not included in the Fund's expense ratio. The Fund indirectly bears its proportionate share of the expenses of any underlying Fidelity Central Funds.
E Amount does not include the portfolio activity of any underlying Fidelity Central Funds.
F Expense ratios reflect operating expenses of the class. Expenses before reductions do not reflect amounts reimbursed by the investment adviser or reductions from brokerage service arrangements or reductions from other expense offset arrangements and do not represent the amount paid by the class during periods when reimbursements or reductions occur. Expenses net of fee waivers reflect expenses after reimbursement by the investment adviser but prior to reductions from brokerage service arrangements or other expense offset arrangements. Expenses net of all reductions represent the net expenses paid by the class.
G Amount represents less than $.005 per share.
H Total distributions of $.37 per share is comprised of distributions from net investment income of $.126 and distributions from net realized gain of $.245 per share.
See accompanying notes which are an integral part of the financial statements.
Annual Report
Financial Highlights - Fidelity Total International Equity Fund Class T
Years ended October 31, | 2015 | 2014 | 2013 | 2012 | 2011 |
Selected Per-Share Data | | | | | |
Net asset value, beginning of period | $ 8.04 | $ 8.32 | $ 7.37 | $ 6.73 | $ 7.41 |
Income from Investment Operations | | | | | |
Net investment income (loss) C | .05 | .11 | .07 | .11 | .09 |
Net realized and unrealized gain (loss) | (.15) | (.12) | 1.25 | .59 | (.68) |
Total from investment operations | (.10) | (.01) | 1.32 | .70 | (.59) |
Distributions from net investment income | (.09) | (.09) | (.13) | (.06) | (.07) |
Distributions from net realized gain | (.04) | (.18) | (.25) | - | (.02) |
Total distributions | (.13) | (.27) | (.37) H | (.06) | (.09) |
Redemption fees added to paid in capitalC, G | - | - | - | - | - |
Net asset value, end of period | $ 7.81 | $ 8.04 | $ 8.32 | $ 7.37 | $ 6.73 |
Total ReturnA, B | (1.26)% | (.06)% | 18.73% | 10.52% | (8.08)% |
Ratios to Average Net AssetsD, F | | | | | |
Expenses before reductions | 1.70% | 1.68% | 1.75% | 1.84% | 2.02% |
Expenses net of fee waivers, if any | 1.70% | 1.68% | 1.70% | 1.70% | 1.70% |
Expenses net of all reductions | 1.69% | 1.68% | 1.67% | 1.67% | 1.67% |
Net investment income (loss) | .61% | 1.38% | .96% | 1.63% | 1.19% |
Supplemental Data | | | | | |
Net assets, end of period (000 omitted) | $ 13,962 | $ 10,282 | $ 7,909 | $ 2,348 | $ 997 |
Portfolio turnover rateE | 53% | 85% | 89% | 110% | 75% |
A Total returns would have been lower if certain expenses had not been reduced during the applicable periods shown.
B Total returns do not include the effect of the sales charges.
C Calculated based on average shares outstanding during the period.
D Fees and expenses of any underlying Fidelity Central Funds are not included in the Fund's expense ratio. The Fund indirectly bears its proportionate share of the expenses of any underlying Fidelity Central Funds.
E Amount does not include the portfolio activity of any underlying Fidelity Central Funds.
F Expense ratios reflect operating expenses of the class. Expenses before reductions do not reflect amounts reimbursed by the investment adviser or reductions from brokerage service arrangements or reductions from other expense offset arrangements and do not represent the amount paid by the class during periods when reimbursements or reductions occur. Expenses net of fee waivers reflect expenses after reimbursement by the investment adviser but prior to reductions from brokerage service arrangements or other expense offset arrangements. Expenses net of all reductions represent the net expenses paid by the class.
G Amount represents less than $.005 per share.
H Total distributions of $.37 per share is comprised of distributions from net investment income of $.128 and distributions from net realized gain of $.245 per share.
See accompanying notes which are an integral part of the financial statements.
Annual Report
Financial Highlights - Fidelity Total International Equity Fund Class B
Years ended October 31, | 2015 | 2014 | 2013 | 2012 | 2011 |
Selected Per-Share Data | | | | | |
Net asset value, beginning of period | $ 8.05 | $ 8.31 | $ 7.33 | $ 6.68 | $ 7.37 |
Income from Investment Operations | | | | | |
Net investment income (loss) C | .01 | .07 | .04 | .08 | .05 |
Net realized and unrealized gain (loss) | (.14) | (.12) | 1.24 | .59 | (.68) |
Total from investment operations | (.13) | (.05) | 1.28 | .67 | (.63) |
Distributions from net investment income | (.04) | (.03) | (.05) | (.02) | (.04) |
Distributions from net realized gain | (.04) | (.18) | (.25) | - | (.02) |
Total distributions | (.08) | (.21) | (.30) | (.02) | (.06) |
Redemption fees added to paid in capitalC, G | - | - | - | - | - |
Net asset value, end of period | $ 7.84 | $ 8.05 | $ 8.31 | $ 7.33 | $ 6.68 |
Total ReturnA, B | (1.62)% | (.56)% | 18.05% | 10.05% | (8.66)% |
Ratios to Average Net AssetsD, F | | | | | |
Expenses before reductions | 2.26% | 2.22% | 2.26% | 2.34% | 2.51% |
Expenses net of fee waivers, if any | 2.20% | 2.20% | 2.20% | 2.20% | 2.20% |
Expenses net of all reductions | 2.19% | 2.20% | 2.18% | 2.17% | 2.17% |
Net investment income (loss) | .11% | .87% | .46% | 1.13% | .69% |
Supplemental Data | | | | | |
Net assets, end of period (000 omitted) | $ 120 | $ 168 | $ 192 | $ 220 | $ 254 |
Portfolio turnover rateE | 53% | 85% | 89% | 110% | 75% |
A Total returns would have been lower if certain expenses had not been reduced during the applicable periods shown.
B Total returns do not include the effect of the contingent deferred sales charge.
C Calculated based on average shares outstanding during the period.
D Fees and expenses of any underlying Fidelity Central Funds are not included in the Fund's expense ratio. The Fund indirectly bears its proportionate share of the expenses of any underlying Fidelity Central Funds.
E Amount does not include the portfolio activity of any underlying Fidelity Central Funds.
F Expense ratios reflect operating expenses of the class. Expenses before reductions do not reflect amounts reimbursed by the investment adviser or reductions from brokerage service arrangements or reductions from other expense offset arrangements and do not represent the amount paid by the class during periods when reimbursements or reductions occur. Expenses net of fee waivers reflect expenses after reimbursement by the investment adviser but prior to reductions from brokerage service arrangements or other expense offset arrangements. Expenses net of all reductions represent the net expenses paid by the class.
G Amount represents less than $.005 per share.
See accompanying notes which are an integral part of the financial statements.
Annual Report
Financial Highlights - Fidelity Total International Equity Fund Class C
Years ended October 31, | 2015 | 2014 | 2013 | 2012 | 2011 |
Selected Per-Share Data | | | | | |
Net asset value, beginning of period | $ 8.00 | $ 8.28 | $ 7.31 | $ 6.67 | $ 7.36 |
Income from Investment Operations | | | | | |
Net investment income (loss) C | .01 | .07 | .04 | .08 | .05 |
Net realized and unrealized gain (loss) | (.15) | (.12) | 1.25 | .58 | (.69) |
Total from investment operations | (.14) | (.05) | 1.29 | .66 | (.64) |
Distributions from net investment income | (.05) | (.05) | (.08) | (.02) | (.03) |
Distributions from net realized gain | (.04) | (.18) | (.25) | - | (.02) |
Total distributions | (.09) | (.23) | (.32) H | (.02) | (.05) |
Redemption fees added to paid in capitalC, G | - | - | - | - | - |
Net asset value, end of period | $ 7.77 | $ 8.00 | $ 8.28 | $ 7.31 | $ 6.67 |
Total ReturnA, B | (1.73)% | (.57)% | 18.30% | 9.98% | (8.72)% |
Ratios to Average Net AssetsD, F | | | | | |
Expenses before reductions | 2.26% | 2.22% | 2.26% | 2.31% | 2.51% |
Expenses net of fee waivers, if any | 2.20% | 2.20% | 2.20% | 2.20% | 2.20% |
Expenses net of all reductions | 2.19% | 2.20% | 2.18% | 2.17% | 2.17% |
Net investment income (loss) | .11% | .87% | .46% | 1.13% | .69% |
Supplemental Data | | | | | |
Net assets, end of period (000 omitted) | $ 3,311 | $ 4,028 | $ 3,584 | $ 2,737 | $ 1,396 |
Portfolio turnover rateE | 53% | 85% | 89% | 110% | 75% |
A Total returns would have been lower if certain expenses had not been reduced during the applicable periods shown.
B Total returns do not include the effect of the contingent deferred sales charge.
C Calculated based on average shares outstanding during the period.
D Fees and expenses of any underlying Fidelity Central Funds are not included in the Fund's expense ratio. The Fund indirectly bears its proportionate share of the expenses of any underlying Fidelity Central Funds.
E Amount does not include the portfolio activity of any underlying Fidelity Central Funds.
F Expense ratios reflect operating expenses of the class. Expenses before reductions do not reflect amounts reimbursed by the investment adviser or reductions from brokerage service arrangements or reductions from other expense offset arrangements and do not represent the amount paid by the class during periods when reimbursements or reductions occur. Expenses net of fee waivers reflect expenses after reimbursement by the investment adviser but prior to reductions from brokerage service arrangements or other expense offset arrangements. Expenses net of all reductions represent the net expenses paid by the class.
G Amount represents less than $.005 per share.
H Total distributions of $.32 per share is comprised of distributions from net investment income of $.075 and distributions from net realized gain of $.245 per share.
See accompanying notes which are an integral part of the financial statements.
Annual Report
Financial Highlights - Fidelity Total International Equity Fund
Years ended October 31, | 2015 | 2014 | 2013 | 2012 | 2011 |
Selected Per-Share Data | | | | | |
Net asset value, beginning of period | $ 8.03 | $ 8.29 | $ 7.32 | $ 6.69 | $ 7.37 |
Income from Investment Operations | | | | | |
Net investment income (loss) B | .10 | .16 | .12 | .15 | .12 |
Net realized and unrealized gain (loss) | (.14) | (.12) | 1.24 | .58 | (.68) |
Total from investment operations | (.04) | .04 | 1.36 | .73 | (.56) |
Distributions from net investment income | (.13) | (.12) | (.15) | (.10) | (.10) |
Distributions from net realized gain | (.04) | (.18) | (.25) | - | (.02) |
Total distributions | (.17) | (.30) | (.39)G | (.10) | (.12) |
Redemption fees added to paid in capitalB, F | - | - | - | - | - |
Net asset value, end of period | $ 7.82 | $ 8.03 | $ 8.29 | $ 7.32 | $ 6.69 |
Total ReturnA | (.51)% | .55% | 19.48% | 11.03% | (7.70)% |
Ratios to Average Net AssetsC, E | | | | | |
Expenses before reductions | 1.07% | 1.04% | 1.09% | 1.16% | 1.42% |
Expenses net of fee waivers, if any | 1.07% | 1.04% | 1.09% | 1.16% | 1.20% |
Expenses net of all reductions | 1.06% | 1.04% | 1.07% | 1.13% | 1.17% |
Net investment income (loss) | 1.24% | 2.03% | 1.57% | 2.16% | 1.69% |
Supplemental Data | | | | | |
Net assets, end of period (000 omitted) | $ 307,035 | $ 324,438 | $ 324,395 | $ 281,979 | $ 131,338 |
Portfolio turnover rateD | 53% | 85% | 89% | 110% | 75% |
A Total returns would have been lower if certain expenses had not been reduced during the applicable periods shown.
B Calculated based on average shares outstanding during the period.
C Fees and expenses of any underlying Fidelity Central Funds are not included in the Fund's expense ratio. The Fund indirectly bears its proportionate share of the expenses of any underlying Fidelity Central Funds.
D Amount does not include the portfolio activity of any underlying Fidelity Central Funds.
E Expense ratios reflect operating expenses of the class. Expenses before reductions do not reflect amounts reimbursed by the investment adviser or reductions from brokerage service arrangements or reductions from other expense offset arrangements and do not represent the amount paid by the class during periods when reimbursements or reductions occur. Expenses net of fee waivers reflect expenses after reimbursement by the investment adviser but prior to reductions from brokerage service arrangements or other expense offset arrangements. Expenses net of all reductions represent the net expenses paid by the class.
F Amount represents less than $.005 per share.
G Total distributions of $.39 per share is comprised of distributions from net investment income of $.148 and distributions from net realized gain of $.245 per share.
See accompanying notes which are an integral part of the financial statements.
Annual Report
Financial Highlights - Fidelity Total International Equity Fund Class I
Years ended October 31, | 2015 | 2014 | 2013 | 2012 | 2011 |
Selected Per-Share Data | | | | | |
Net asset value, beginning of period | $ 7.99 | $ 8.26 | $ 7.30 | $ 6.67 | $ 7.35 |
Income from Investment Operations | | | | | |
Net investment income (loss) B | .09 | .15 | .11 | .14 | .12 |
Net realized and unrealized gain (loss) | (.14) | (.12) | 1.24 | .59 | (.68) |
Total from investment operations | (.05) | .03 | 1.35 | .73 | (.56) |
Distributions from net investment income | (.12) | (.12) | (.15) | (.10) | (.10) |
Distributions from net realized gain | (.04) | (.18) | (.25) | - | (.02) |
Total distributions | (.16) | (.30) | (.39) G | (.10) | (.12) |
Redemption fees added to paid in capitalB, F | - | - | - | - | - |
Net asset value, end of period | $ 7.78 | $ 7.99 | $ 8.26 | $ 7.30 | $ 6.67 |
Total ReturnA | (.64)% | .37% | 19.40% | 11.06% | (7.72)% |
Ratios to Average Net AssetsC, E | | | | | |
Expenses before reductions | 1.17% | 1.15% | 1.21% | 1.27% | 1.48% |
Expenses net of fee waivers, if any | 1.17% | 1.15% | 1.20% | 1.20% | 1.20% |
Expenses net of all reductions | 1.16% | 1.15% | 1.18% | 1.17% | 1.17% |
Net investment income (loss) | 1.14% | 1.91% | 1.46% | 2.13% | 1.69% |
Supplemental Data | | | | | |
Net assets, end of period (000 omitted) | $ 2,602 | $ 2,240 | $ 2,372 | $ 1,514 | $ 197 |
Portfolio turnover rateD | 53% | 85% | 89% | 110% | 75% |
A Total returns would have been lower if certain expenses had not been reduced during the applicable periods shown.
B Calculated based on average shares outstanding during the period.
C Fees and expenses of any underlying Fidelity Central Funds are not included in the Fund's expense ratio. The Fund indirectly bears its proportionate share of the expenses of any underlying Fidelity Central Funds.
D Amount does not include the portfolio activity of any underlying Fidelity Central Funds.
E Expense ratios reflect operating expenses of the class. Expenses before reductions do not reflect amounts reimbursed by the investment adviser or reductions from brokerage service arrangements or reductions from other expense offset arrangements and do not represent the amount paid by the class during periods when reimbursements or reductions occur. Expenses net of fee waivers reflect expenses after reimbursement by the investment adviser but prior to reductions from brokerage service arrangements or other expense offset arrangements. Expenses net of all reductions represent the net expenses paid by the class.
F Amount represents less than $.005 per share.
G Total distributions of $.39 per share is comprised of distributions from net investment income of $.148 and distributions from net realized gain of $.245 per share.
See accompanying notes which are an integral part of the financial statements.
Annual Report
For the period ended October 31, 2015
1. Organization.
Fidelity Total International Equity Fund (the Fund) is a fund of Fidelity Investment Trust (the Trust) and is authorized to issue an unlimited number of shares. The Trust is registered under the Investment Company Act of 1940, as amended (the 1940 Act), as an open-end management investment company organized as a Massachusetts business trust. The Fund offers Class A, Class T, Class C, Total International Equity and Class I shares (formerly Institutional Class), each of which, along with Class B shares, has equal rights as to assets and voting privileges. Class B shares are closed to new accounts and additional purchases, except for exchanges and reinvestments. Each class has exclusive voting rights with respect to matters that affect that class. Class B shares will automatically convert to Class A shares after a holding period of seven years from the initial date of purchase. The Fund's investments in emerging markets can be subject to social, economic, regulatory, and political uncertainties and can be extremely volatile.
2. Investments in Fidelity Central Funds.
The Fund invests in Fidelity Central Funds, which are open-end investment companies generally available only to other investment companies and accounts managed by the investment adviser and its affiliates. The Fund's Schedule of Investments lists each of the Fidelity Central Funds held as of period end, if any, as an investment of the Fund, but does not include the underlying holdings of each Fidelity Central Fund. As an Investing Fund, the Fund indirectly bears its proportionate share of the expenses of the underlying Fidelity Central Funds.
The Money Market Central Funds seek preservation of capital and current income and are managed by Fidelity Investments Money Management, Inc. (FIMM), an affiliate of the investment adviser. Annualized expenses of the Money Market Central Funds as of their most recent shareholder report date are less than .005%.
A complete unaudited list of holdings for each Fidelity Central Fund is available upon request or at the Securities and Exchange Commission (the SEC) website at www.sec.gov. In addition, the financial statements of the Fidelity Central Funds, which are not covered by the Fund's Report of Independent Registered Public Accounting Firm, are available on the SEC website or upon request.
3. Significant Accounting Policies.
The financial statements have been prepared in conformity with accounting principles generally accepted in the United States of America (GAAP), which require management to make certain estimates and assumptions at the date of the financial statements. Actual results could differ from those estimates. Subsequent events, if any, through the date that the financial statements were issued have been evaluated in the preparation of
Annual Report
3. Significant Accounting Policies - continued
the financial statements. The following summarizes the significant accounting policies of the Fund:
Investment Valuation. Investments are valued as of 4:00 p.m. Eastern time on the last calendar day of the period. The Board of Trustees (the Board) has delegated the day to day responsibility for the valuation of the Fund's investments to the Fidelity Management & Research Company (FMR) Fair Value Committee (the Committee). In accordance with valuation policies and procedures approved by the Board, the Fund attempts to obtain prices from one or more third party pricing vendors or brokers to value its investments. When current market prices, quotations or currency exchange rates are not readily available or reliable, investments will be fair valued in good faith by the Committee, in accordance with procedures adopted by the Board. Factors used in determining fair value vary by investment type and may include market or investment specific events. The frequency with which these procedures are used cannot be predicted and they may be utilized to a significant extent. The Committee oversees the Fund's valuation policies and procedures and reports to the Board on the Committee's activities and fair value determinations. The Board monitors the appropriateness of the procedures used in valuing the Fund's investments and ratifies the fair value determinations of the Committee.
The Fund categorizes the inputs to valuation techniques used to value its investments into a disclosure hierarchy consisting of three levels as shown below:
Level 1 - quoted prices in active markets for identical investments
Level 2 - other significant observable inputs (including quoted prices for similar investments, interest rates, prepayment speeds, etc.)
Level 3 - unobservable inputs (including the Fund's own assumptions based on the best information available)
Valuation techniques used to value the Fund's investments by major category are as follows:
Equity securities, including restricted securities, for which market quotations are readily available, are valued at the last reported sale price or official closing price as reported by a third party pricing vendor on the primary market or exchange on which they are traded and are categorized as Level 1 in the hierarchy. In the event there were no sales during the day or closing prices are not available, securities are valued at the last quoted bid price or may be valued using the last available price and are generally categorized as Level 2 in the hierarchy. For foreign equity securities, when market or security specific events arise, comparisons to the valuation of American Depositary Receipts (ADRs), futures contracts, Exchange-Traded Funds (ETFs) and certain indexes as well as quoted prices for similar securities may be used and would be categorized as Level 2 in the hierarchy. Utilizing these techniques may result in transfers between Level 1 and Level 2.
Annual Report
Notes to Financial Statements - continued
3. Significant Accounting Policies - continued
Investment Valuation - continued
For equity securities, including restricted securities, where observable inputs are limited, assumptions about market activity and risk are used and these securities may be categorized as Level 3 in the hierarchy.
Investments in open-end mutual funds, including the Fidelity Central Funds, are valued at their closing net asset value (NAV) each business day and are categorized as Level 1 in the hierarchy.
Changes in valuation techniques may result in transfers in or out of an assigned level within the disclosure hierarchy. The aggregate value of investments by input level as of October 31, 2015 , including information on transfers between Levels 1 and 2 is included at the end of the Fund's Schedule of Investments.
Foreign Currency. The Fund may use foreign currency contracts to facilitate transactions in foreign-denominated securities. Gains and losses from these transactions may arise from changes in the value of the foreign currency or if the counterparties do not perform under the contracts' terms.
Foreign-denominated assets, including investment securities, and liabilities are translated into U.S. dollars at the exchange rates at period end. Purchases and sales of investment securities, income and dividends received and expenses denominated in foreign currencies are translated into U.S. dollars at the exchange rate in effect on the transaction date.
The effects of exchange rate fluctuations on investments are included with the net realized and unrealized gain (loss) on investment securities. Other foreign currency transactions resulting in realized and unrealized gain (loss) are disclosed separately.
Investment Transactions and Income. For financial reporting purposes, the Fund's investment holdings and NAV include trades executed through the end of the last business day of the period. The NAV per share for processing shareholder transactions is calculated as of the close of business of the New York Stock Exchange (NYSE), normally 4:00 p.m. Eastern time and includes trades executed through the end of the prior business day. Gains and losses on securities sold are determined on the basis of identified cost and may include proceeds received from litigation. Dividend income is recorded on the ex-dividend date, except for certain dividends from foreign securities where the ex-dividend date may have passed, which are recorded as soon as the Fund is informed of the ex-dividend date. Non-cash dividends included in dividend income, if any, are recorded at the fair market value of the securities received. Income and capital gain distributions from Fidelity Central Funds, if any, are recorded on the ex-dividend date.
Annual Report
3. Significant Accounting Policies - continued
Investment Transactions and Income - continued
Distributions received on securities that represent a return of capital or capital gain are recorded as a reduction of cost of investments and/or as a realized gain. Subsequent to ex-dividend date the Fund determines the components of these distributions, based upon receipt of tax filings or other correspondence relating to the underlying investment. Interest income is accrued as earned and includes coupon interest and amortization of premium and accretion of discount on debt securities as applicable. Investment income is recorded net of foreign taxes withheld where recovery of such taxes is uncertain.
Class Allocations and Expenses. Investment income, realized and unrealized capital gains and losses, common expenses of the Fund, and certain fund-level expense reductions, if any, are allocated daily on a pro-rata basis to each class based on the relative net assets of each class to the total net assets of the Fund. Each class differs with respect to transfer agent and distribution and service plan fees incurred. Certain expense reductions may also differ by class. For the reporting period, the allocated portion of income and expenses to each class as a percent of its average net assets may vary due to the timing of recording these transactions in relation to fluctuating net assets of the classes. Expenses directly attributable to a fund are charged to that fund. Expenses attributable to more than one fund are allocated among the respective funds on the basis of relative net assets or other appropriate methods. Expense estimates are accrued in the period to which they relate and adjustments are made when actual amounts are known.
Income Tax Information and Distributions to Shareholders. Each year, the Fund intends to qualify as a regulated investment company under Subchapter M of the Internal Revenue Code, including distributing substantially all of its taxable income and realized gains. As a result, no provision for U.S. Federal income taxes is required. As of October 31, 2015, the Fund did not have any unrecognized tax benefits in the financial statements; nor is the Fund aware of any tax positions for which it is reasonably possible that the total amounts of unrecognized tax benefits will significantly change in the next twelve months. The Fund files a U.S. federal tax return, in addition to state and local tax returns as required. The Fund's federal income tax returns are subject to examination by the Internal Revenue Service (IRS) for a period of three fiscal years after they are filed. State and local tax returns may be subject to examination for an additional fiscal year depending on the jurisdiction. Foreign taxes are provided for based on the Fund's understanding of the tax rules and rates that exist in the foreign markets in which it invests. The Fund is subject to a tax imposed on capital gains by certain countries in which it invests. An estimated deferred tax liability for net unrealized appreciation on the applicable securities is included in Other payables and accrued expenses on the Statement of Assets & Liabilities.
Annual Report
Notes to Financial Statements - continued
3. Significant Accounting Policies - continued
Income Tax Information and Distributions to Shareholders - continued
Distributions are declared and recorded on the ex-dividend date. Income dividends and capital gain distributions are declared separately for each class. Income and capital gain distributions are determined in accordance with income tax regulations, which may differ from GAAP. In addition, the Fund claimed a portion of the payment made to redeeming shareholders as a distribution for income tax purposes.
Capital accounts within the financial statements are adjusted for permanent book-tax differences. These adjustments have no impact on net assets or the results of operations. Capital accounts are not adjusted for temporary book-tax differences which will reverse in a subsequent period.
Book-tax differences are primarily due to foreign currency transactions, partnerships, certain foreign taxes, passive foreign investment companies (PFIC), capital loss carryforwards and losses deferred due to wash sales.
The federal tax cost of investment securities and unrealized appreciation (depreciation) as of period end were as follows:
Gross unrealized appreciation | $ 61,829,134 |
Gross unrealized depreciation | (15,260,483) |
Net unrealized appreciation (depreciation) on securities | $ 46,568,651 |
Tax Cost | $ 292,272,460 |
The tax-based components of distributable earnings as of period end were as follows:
Undistributed ordinary income | $ 3,561,043 |
Capital loss carryforward | $ (28,076,887) |
Net unrealized appreciation (depreciation) on securities and other investments | $ 46,594,811 |
Capital loss carryforwards are only available to offset future capital gains of the Fund to the extent provided by regulations and may be limited. Under the Regulated Investment Company Modernization Act of 2010 (the Act), the Fund is permitted to carry forward capital losses incurred in taxable years beginning after December 22, 2010 for an unlimited period and such capital losses are required to be used prior to any losses that expire. The capital loss carryforward information presented below, including any applicable limitation, is estimated as of fiscal period end and is subject to adjustment.
Fiscal year of expiration | |
2017 | $ (13,607,298) |
2019 | (8,855,997) |
Total with expiration | $ (22,463,295) |
No expiration Short-term | (5,613,592) |
Total Capital Loss carryforward | $ (28,076,887) |
Annual Report
3. Significant Accounting Policies - continued
Income Tax Information and Distributions to Shareholders - continued
Due to large subscriptions in a prior period, $22,463,295 of capital losses that will be available to offset future capital gains of the fund will be limited by approximately $4,535,766 per year.
The tax character of distributions paid was as follows:
| October 31, 2015 | October 31, 2014 |
Ordinary Income | $ 5,482,470 | $ 9,375,496 |
Long-term Capital Gains | 1,726,809 | 3,394,155 |
Total | $ 7,209,279 | $ 12,769,651 |
Short-Term Trading (Redemption) Fees. Shares held by investors in the Fund less than 30 days may have been subject to a redemption fee equal to 1.00% of the NAV of shares redeemed. All redemption fees, which reduce the proceeds of the shareholder redemption, are retained by the Fund and accounted for as an addition to paid in capital.
Delayed Delivery Transactions and When-Issued Securities. During the period, the Fund transacted in securities on a delayed delivery or when-issued basis. Payment and delivery may take place after the customary settlement period for that security. The price of the underlying securities and the date when the securities will be delivered and paid for are fixed at the time the transaction is negotiated. The securities purchased on a delayed delivery or when-issued basis are identified as such in the Fund's Schedule of Investments. With respect to purchase commitments, the Fund identifies securities as segregated in its records with a value at least equal to the amount of the commitment. Losses may arise due to changes in the value of the underlying securities or if the counterparty does not perform under the contract's terms, or if the issuer does not issue the securities due to political, economic, or other factors.
Restricted Securities. The Fund may invest in securities that are subject to legal or contractual restrictions on resale. These securities generally may be resold in transactions exempt from registration or to the public if the securities are registered. Disposal of these securities may involve time-consuming negotiations and expense, and prompt sale at an acceptable price may be difficult. Information regarding restricted securities is included at the end of the Fund's Schedule of Investments.
4. Purchases and Sales of Investments.
Purchases and sales of securities, other than short-term securities, aggregated $182,056,661 and $189,209,209, respectively.
Annual Report
Notes to Financial Statements - continued
5. Fees and Other Transactions with Affiliates.
Management Fee. Fidelity Management & Research Company (the investment adviser) and its affiliates provide the Fund with investment management related services for which the Fund pays a monthly management fee. The management fee is the sum of an individual fund fee rate that is based on an annual rate of .45% of the Fund's average net assets and an annualized group fee rate that averaged .25% during the period. The group fee rate is based upon the average net assets of all the mutual funds advised by the investment adviser, including any mutual funds previously advised by the investment adviser that are currently advised by Fidelity SelectCo, LLC, an affiliate of the investment adviser. The group fee rate decreases as assets under management increase and increases as assets under management decrease. In addition, the management fee is subject to a performance adjustment (up to a maximum of ± .20% of the Fund's average net assets over a 36 month performance period). The upward or downward adjustment to the management fee is based on the relative investment performance of Total International Equity as compared to its benchmark index, the MSCI All Country World ex USA Index, over the same 36 month performance period. For the reporting period, the total annual management fee rate, including the performance adjustment, was .80% of the Fund's average net assets. The performance adjustment included in the management fee rate may be higher or lower than the maximum performance adjustment rate due to the difference between the average net assets for the reporting and performance periods.
Distribution and Service Plan Fees. In accordance with Rule 12b-1 of the 1940 Act, the Fund has adopted separate Distribution and Service Plans for each class of shares. Certain classes pay Fidelity Distributors Corporation (FDC), an affiliate of the investment adviser, separate Distribution and Service Fees, each of which is based on an annual percentage of each class' average net assets. In addition, FDC may pay financial intermediaries for selling shares of the Fund and providing shareholder support services. For the period, the Distribution and Service Fee rates, total fees and amounts retained by FDC were as follows:
| Distribution
Fee | Service
Fee | Total Fees | Retained
by FDC |
Class A | -% | .25% | $ 22,038 | $ 1,374 |
Class T | .25% | .25% | 63,171 | - |
Class B | .75% | .25% | 1,553 | 1,165 |
Class C | .75% | .25% | 36,975 | 5,847 |
| | | $ 123,737 | $ 8,386 |
Sales Load. FDC may receive a front-end sales charge of up to 5.75% for selling Class A shares and 3.50% for selling Class T shares, some of which is paid to financial intermediaries for selling shares of the Fund. Depending on the holding period, FDC may receive contingent deferred sales charges levied on Class A, Class T, Class B, and Class C redemptions. The deferred sales charges range from 5.00% to 1.00% for Class B shares, 1.00% for Class C shares, 1.00% for certain purchases of Class A shares and .25% for certain purchases of Class T shares.
Annual Report
5. Fees and Other Transactions with Affiliates - continued
Sales Load - continued
For the period, sales charge amounts retained by FDC were as follows:
| Retained
by FDC |
Class A | $ 3,738 |
Class T | 1,496 |
Class BA | 66 |
Class C A | 383 |
| $ 5,683 |
A When Class B and Class C shares are initially sold, FDC pays commissions from its own resources to financial intermediaries through which the sales are made.
Transfer Agent Fees. Fidelity Investments Institutional Operations Company, Inc., (FIIOC), an affiliate of the investment adviser, is the transfer, dividend disbursing and shareholder servicing agent for each class of the Fund. FIIOC receives account fees and asset-based fees that vary according to the account size and type of account of the shareholders of the respective classes of the Fund. FIIOC pays for typesetting, printing and mailing of shareholder reports, except proxy statements.
For the period, transfer agent fees for each class were as follows:
| Amount | % of
Class-Level Average
Net Assets |
Class A | $ 23,946 | .27 |
Class T | 30,834 | .24 |
Class B | 468 | .30 |
Class C | 11,173 | .30 |
Total International Equity | 367,738 | .11 |
Class I | 5,415 | .21 |
| $ 439,574 | |
Accounting and Security Lending Fees. Fidelity Service Company, Inc. (FSC), an affiliate of the investment adviser, maintains the Fund's accounting records. The accounting fee is based on the level of average net assets for each month. Under a separate contract, FSC administers the security lending program. The security lending fee is based on the number and duration of lending transactions.
Brokerage Commissions. The Fund placed a portion of its portfolio transactions with brokerage firms which are affiliates of the investment adviser. Brokerage commissions are included in net realized gain (loss) and change in net unrealized appreciation (depreciation) in the Statement of Operations. The commissions paid to these affiliated firms were $462 for the period.
Annual Report
Notes to Financial Statements - continued
6. Committed Line of Credit.
The Fund participates with other funds managed by the investment adviser or an affiliate in a $4.25 billion credit facility (the "line of credit") to be utilized for temporary or emergency purposes to fund shareholder redemptions or for other short-term liquidity purposes. The Fund has agreed to pay commitment fees on its pro-rata portion of the line of credit, which amounted to $504 and is reflected in Miscellaneous expenses on the Statement of Operations. During the period, the Fund did not borrow on this line of credit.
7. Security Lending.
The Fund lends portfolio securities through a lending agent from time to time in order to earn additional income. For equity securities, a lending agent is used and may loan securities to certain qualified borrowers, including Fidelity Capital Markets (FCM), a broker-dealer affiliated with the Fund. On the settlement date of the loan, the Fund receives collateral (in the form of U.S. Treasury obligations, letters of credit and/or cash) against the loaned securities and maintains collateral in an amount not less than 100% of the market value of the loaned securities during the period of the loan. The market value of the loaned securities is determined at the close of business of the Fund and any additional required collateral is delivered to the Fund on the next business day. The Fund or borrower may terminate the loan at any time, and if the borrower defaults on its obligation to return the securities loaned because of insolvency or other reasons, the Fund may apply collateral received from the borrower against the obligation. The Fund may experience delays and costs in recovering the securities loaned. Any cash collateral received is invested in the Fidelity Securities Lending Cash Central Fund. The value of loaned securities and cash collateral at period end are disclosed on the Fund's Statement of Assets and Liabilities. At period end, there were no security loans outstanding with FCM. Security lending income represents the income earned on investing cash collateral, less rebates paid to borrowers and any lending agent fees associated with the loan, plus any premium payments received for lending certain types of securities. Security lending income is presented in the Statement of Operations as a component of income from Fidelity Central Funds. Total security lending income during the period amounted to $66,496, including $53 from securities loaned to FCM.
8. Expense Reductions.
The investment adviser contractually agreed to reimburse each class to the extent annual operating expenses exceeded certain levels of average net assets as noted in the table below. This reimbursement will remain in place through December 31, 2016. Some expenses, for example interest expense, including commitment fees, are excluded from this reimbursement.
Annual Report
8. Expense Reductions - continued
The following classes were in reimbursement during the period:
| Expense
Limitations | Reimbursement |
Class A | 1.45% | $ 2,649 |
Class B | 2.20% | 93 |
Class C | 2.20% | 2,440 |
| | $ 5,182 |
Commissions paid to certain brokers with whom the investment adviser, or its affiliates, places trades on behalf of the Fund include an amount in addition to trade execution, which may be rebated back to the Fund to offset certain expenses. This amount totaled $29,729 for the period.
In addition, during the period the investment adviser reimbursed and/or waived a portion of fund-level operating expenses in the amount of $1,440 and a portion of class-level operating expenses as follows:
| Amount |
Class A | $ 195 |
Class T | 195 |
Class C | 10 |
Total International Equity | 7,625 |
Class I | 53 |
| $ 8,078 |
9. Distributions to Shareholders.
Distributions to shareholders of each class were as follows:
Years ended October 31, | 2015 | 2014 |
From net investment income | | |
Class A | $ 113,499 | $ 114,661 |
Class T | 118,041 | 92,140 |
Class B | 852 | 757 |
Class C | 26,493 | 24,034 |
Total International Equity | 5,189,901 | 4,825,256 |
Class I | 33,683 | 33,527 |
Total | $ 5,482,469 | $ 5,090,375 |
Annual Report
Notes to Financial Statements - continued
9. Distributions to Shareholders - continued
Years ended October 31, | 2015 | 2014 |
From net realized gain | | |
Class A | $ 45,400 | $ 201,491 |
Class T | 52,463 | 179,326 |
Class B | 832 | 4,154 |
Class C | 19,994 | 83,657 |
Total International Equity | 1,596,893 | 7,158,781 |
Class I | 11,228 | 51,867 |
Total | $ 1,726,810 | $ 7,679,276 |
10. Share Transactions.
Share transactions for each class were as follows and may contain automatic conversions between classes or exchanges between funds:
| Shares | Dollars |
Years ended October 31, | 2015 | 2014 | 2015 | 2014 |
Class A | | | | |
Shares sold | 302,437 | 232,039 | $ 2,413,258 | $ 1,877,334 |
Reinvestment of distributions | 20,115 | 38,586 | 158,306 | 306,762 |
Shares redeemed | (290,995) | (217,382) | (2,277,557) | (1,752,622) |
Net increase (decrease) | 31,557 | 53,243 | $ 294,007 | $ 431,474 |
Class T | | | | |
Shares sold | 824,018 | 525,401 | $ 6,637,966 | $ 4,252,382 |
Reinvestment of distributions | 21,537 | 33,829 | 170,355 | 270,968 |
Shares redeemed | (337,655) | (230,852) | (2,691,540) | (1,883,437) |
Net increase (decrease) | 507,900 | 328,378 | $ 4,116,781 | $ 2,639,913 |
Class B | | | | |
Shares sold | 2,293 | 2,568 | $ 19,363 | $ 21,032 |
Reinvestment of distributions | 210 | 604 | 1,675 | 4,866 |
Shares redeemed | (7,999) | (5,357) | (62,934) | (43,506) |
Net increase (decrease) | (5,496) | (2,185) | $ (41,896) | $ (17,608) |
Class C | | | | |
Shares sold | 142,460 | 174,035 | $ 1,136,553 | $ 1,421,548 |
Reinvestment of distributions | 4,767 | 10,201 | 37,661 | 81,608 |
Shares redeemed | (224,769) | (113,485) | (1,823,746) | (922,884) |
Net increase (decrease) | (77,542) | 70,751 | $ (649,532) | $ 580,272 |
Total International Equity | | | | |
Shares sold | 6,834,390 | 7,329,051 | $ 54,586,662 | $ 59,640,689 |
Reinvestment of distributions | 851,193 | 1,486,031 | 6,698,889 | 11,828,806 |
Shares redeemed | (8,793,992) | (7,554,096) | (70,164,751) | (61,144,473) |
Net increase (decrease) | (1,108,409) | 1,260,986 | $ (8,879,200) | $ 10,325,022 |
Annual Report
10. Share Transactions - continued
| Shares | Dollars |
Years ended October 31, | 2015 | 2014 | 2015 | 2014 |
Class I | | | | |
Shares sold | 149,022 | 127,536 | $ 1,222,878 | $ 1,054,194 |
Reinvestment of distributions | 5,728 | 10,120 | 44,910 | 80,252 |
Shares redeemed | (100,501) | (144,685) | (786,772) | (1,167,594) |
Net increase (decrease) | 54,249 | (7,029) | $ 481,016 | $ (33,148) |
11. Other.
The Fund's organizational documents provide former and current trustees and officers with a limited indemnification against liabilities arising in connection with the performance of their duties to the Fund. In the normal course of business, the Fund may also enter into contracts that provide general indemnifications. The Fund's maximum exposure under these arrangements is unknown as this would be dependent on future claims that may be made against the Fund. The risk of material loss from such claims is considered remote.
At the end of the period, a shareholder of record owned approximately 71% of the total outstanding shares of the Fund.
Annual Report
To the Trustees of Fidelity Investment Trust and Shareholders of Fidelity Total International Equity Fund:
We have audited the accompanying statement of assets and liabilities of Fidelity Total International Equity Fund (the Fund), a fund of Fidelity Investment Trust, including the schedule of investments, as of October 31, 2015, and the related statement of operations for the year then ended, the statement of changes in net assets for each of the two years in the period then ended, and the financial highlights for each of the five years in the period then ended. These financial statements and financial highlights are the responsibility of the Fund's management. Our responsibility is to express an opinion on these financial statements and financial highlights based on our audits.
We conducted our audits in accordance with the standards of the Public Company Accounting Oversight Board (United States). Those standards require that we plan and perform the audit to obtain reasonable assurance about whether the financial statements and financial highlights are free of material misstatement. The Fund is not required to have, nor were we engaged to perform, an audit of its internal control over financial reporting. Our audits included consideration of internal control over financial reporting as a basis for designing audit procedures that are appropriate in the circumstances, but not for the purpose of expressing an opinion on the effectiveness of the Fund's internal control over financial reporting. Accordingly, we express no such opinion. An audit also includes examining, on a test basis, evidence supporting the amounts and disclosures in the financial statements, assessing the accounting principles used and significant estimates made by management, as well as evaluating the overall financial statement presentation. Our procedures included confirmation of securities owned as of October 31, 2015, by correspondence with the custodians and brokers; when replies were not received from brokers, we performed other auditing procedures. We believe that our audits provide a reasonable basis for our opinion.
In our opinion, such financial statements and financial highlights referred to above present fairly, in all material respects, the financial position of Fidelity Total International Equity Fund as of October 31, 2015, the results of its operations for the year then ended, the changes in its net assets for each of the two years in the period then ended, and the financial highlights for each of the five years in the period then ended, in conformity with accounting principles generally accepted in the United States of America.
DELOITTE & TOUCHE LLP
Boston, Massachusetts
December 16, 2015
Annual Report
The Trustees, Member of the Advisory Board, and officers of the trust and fund, as applicable, are listed below. The Board of Trustees governs the fund and is responsible for protecting the interests of shareholders. The Trustees are experienced executives who meet periodically throughout the year to oversee the fund's activities, review contractual arrangements with companies that provide services to the fund, oversee management of the risks associated with such activities and contractual arrangements, and review the fund's performance. Each of the Trustees oversees 170 funds.
The Trustees hold office without limit in time except that (a) any Trustee may resign; (b) any Trustee may be removed by written instrument, signed by at least two-thirds of the number of Trustees prior to such removal; (c) any Trustee who requests to be retired or who has become incapacitated by illness or injury may be retired by written instrument signed by a majority of the other Trustees; and (d) any Trustee may be removed at any special meeting of shareholders by a two-thirds vote of the outstanding voting securities of the trust. Each Trustee who is not an interested person (as defined in the 1940 Act) of the trust and the fund (Independent Trustee), shall retire not later than the last day of the calendar year in which his or her 75th birthday occurs. The Independent Trustees may waive this mandatory retirement age policy with respect to individual Trustees. The officers and Advisory Board Member hold office without limit in time, except that any officer and Advisory Board Member may resign or may be removed by a vote of a majority of the Trustees at any regular meeting or any special meeting of the Trustees. Except as indicated, each individual has held the office shown or other offices in the same company for the past five years.
Experience, Skills, Attributes, and Qualifications of the Fund's Trustees. The Governance and Nominating Committee has adopted a statement of policy that describes the experience, qualifications, attributes, and skills that are necessary and desirable for potential Independent Trustee candidates (Statement of Policy). The Board believes that each Trustee satisfied at the time he or she was initially elected or appointed a Trustee, and continues to satisfy, the standards contemplated by the Statement of Policy. The Governance and Nominating Committee also engages professional search firms to help identify potential Independent Trustee candidates who have the experience, qualifications, attributes, and skills consistent with the Statement of Policy. From time to time, additional criteria based on the composition and skills of the current Independent Trustees, as well as experience or skills that may be appropriate in light of future changes to board composition, business conditions, and regulatory or other developments, have also been considered by the professional search firms and the Governance and Nominating Committee. In addition, the Board takes into account the Trustees' commitment and participation in Board and committee meetings, as well as their leadership of standing and ad hoc committees throughout their tenure.
In determining that a particular Trustee was and continues to be qualified to serve as a Trustee, the Board has considered a variety of criteria, none of which, in isolation, was controlling. The Board believes that, collectively, the Trustees have balanced and diverse experience, qualifications, attributes, and skills, which allow the Board to operate effectively in governing the fund and protecting the interests of shareholders. Information about the specific experience, skills, attributes, and qualifications of each Trustee, which in each case led to the Board's conclusion that the Trustee should serve (or continue to serve) as a trustee of the fund, is provided below.
Annual Report
Trustees and Officers - continued
Board Structure and Oversight Function. James C. Curvey is an interested person (as defined in the 1940 Act) and currently serves as Chairman. The Trustees have determined that an interested Chairman is appropriate and benefits shareholders because an interested Chairman has a personal and professional stake in the quality and continuity of services provided to the fund. Independent Trustees exercise their informed business judgment to appoint an individual of their choosing to serve as Chairman, regardless of whether the Trustee happens to be independent or a member of management. The Independent Trustees have determined that they can act independently and effectively without having an Independent Trustee serve as Chairman and that a key structural component for assuring that they are in a position to do so is for the Independent Trustees to constitute a substantial majority for the Board. The Independent Trustees also regularly meet in executive session. Ned C. Lautenbach serves as Chairman of the Independent Trustees and as such (i) acts as a liaison between the Independent Trustees and management with respect to matters important to the Independent Trustees and (ii) with management prepares agendas for Board meetings.
Fidelity funds are overseen by different Boards of Trustees. The fund's Board oversees Fidelity's high income and certain equity funds, and other Boards oversee Fidelity's investment-grade bond, money market, asset allocation, and sector funds. The asset allocation funds may invest in Fidelity funds overseen by the fund's Board. The use of separate Boards, each with its own committee structure, allows the Trustees of each group of Fidelity funds to focus on the unique issues of the funds they oversee, including common research, investment, and operational issues. On occasion, the separate Boards establish joint committees to address issues of overlapping consequences for the Fidelity funds overseen by each Board.
The Trustees operate using a system of committees to facilitate the timely and efficient consideration of all matters of importance to the Trustees, the fund, and fund shareholders and to facilitate compliance with legal and regulatory requirements and oversight of the fund's activities and associated risks. The Board, acting through its committees, has charged FMR and its affiliates with (i) identifying events or circumstances the occurrence of which could have demonstrably adverse effects on the fund's business and/or reputation; (ii) implementing processes and controls to lessen the possibility that such events or circumstances occur or to mitigate the effects of such events or circumstances if they do occur; and (iii) creating and maintaining a system designed to evaluate continuously business and market conditions in order to facilitate the identification and implementation processes described in (i) and (ii) above. Because the day-to-day operations and activities of the fund are carried out by or through FMR, its affiliates and other service providers, the fund's exposure to risks is mitigated but not eliminated by the processes overseen by the Trustees. While each of the Board's committees has responsibility for overseeing different aspects of the fund's activities, oversight is exercised primarily through the Operations, Audit, and Compliance Committees. In addition, the Independent Trustees have worked with FMR to enhance the Board's oversight of investment and financial risks, legal and regulatory risks, technology risks, and operational risks, including the development of additional risk reporting to the Board. For example, a working group comprised of Independent Trustees and FMR has worked and continues to work to review the Fidelity funds' valuation-related activities, reporting and risk management. Appropriate personnel, including but not limited to the fund's Chief Compliance Officer (CCO), FMR's internal auditor, the independent accountants, the fund's Treasurer and portfolio management personnel, make periodic reports to the Board's committees, as appropriate, including an annual review of Fidelity's risk management program for the Fidelity funds. The responsibilities of each standing committee, including their oversight responsibilities, are described further under "Standing Committees of the Fund's Trustees."
Annual Report
The fund's Statement of Additional Information (SAI) includes more information about the Trustees. To request a free copy, call Fidelity at 1-877-208-0098.
Interested Trustees*:
Correspondence intended for each Trustee who is an interested person may be sent to Fidelity Investments, 245 Summer Street, Boston, Massachusetts 02210.
Name, Year of Birth; Principal Occupations and Other Relevant Experience+ |
James C. Curvey (1935) |
Year of Election or Appointment: 2007 Trustee Chairman of the Board of Trustees |
| Mr. Curvey also serves as Trustee of other Fidelity funds. Mr. Curvey is a Director of Fidelity Research & Analysis Co. (investment adviser firm, 2009-present), and Vice Chairman (2007-present) and Director of FMR LLC (diversified financial services company). In addition, Mr. Curvey serves as an Overseer for the Boston Symphony Orchestra and a member of the board of Artis-Naples, Naples, Florida, and as a Trustee for Brewster Academy, Wolfeboro, New Hampshire. Previously, Mr. Curvey served as a Director of Fidelity Investments Money Management, Inc. (investment adviser firm, 2009-2014) and a Director of FMR and FMR Co., Inc. (investment adviser firms, 2007-2014). |
Charles S. Morrison (1960) |
Year of Election or Appointment: 2014 Trustee |
| Mr. Morrison also serves as Trustee of other funds. He serves as a Director of Fidelity Investments Money Management, Inc. (FIMM) (investment adviser firm, 2014-present), Director of Fidelity SelectCo, LLC (investment adviser firm, 2014-present), President, Asset Management (2014-present), and is an employee of Fidelity Investments. Previously, Mr. Morrison served as Vice President of Fidelity's Fixed Income and Asset Allocation Funds (2012-2014), President, Fixed Income (2011-2014), Vice President of Fidelity's Money Market Funds (2005-2009), President, Money Market Group Leader of FMR (investment adviser firm, 2009), and Senior Vice President, Money Market Group of FMR (2004-2009). Mr. Morrison also served as Vice President of Fidelity's Bond Funds (2002-2005), certain Balanced Funds (2002-2005), and certain Asset Allocation Funds (2002-2007), and as Senior Vice President (2002-2005) of Fidelity's Bond Division. |
* Trustees have been determined to be "Interested Trustees" by virtue of, among other things, their affiliation with the trust or various entities under common control with FMR.
+ The information above includes each Trustee's principal occupation during the last five years and other information relating to the experience, attributes, and skills relevant to each Trustee's qualifications to serve as a Trustee, which led to the conclusion that each Trustee should serve as a Trustee for the fund.
Annual Report
Independent Trustees:
Correspondence intended for each Independent Trustee (that is, the Trustees other than the Interested Trustees) may be sent to Fidelity Investments, P.O. Box 55235, Boston, Massachusetts 02205-5235.
Name, Year of Birth; Principal Occupations and Other Relevant Experience+ |
Dennis J. Dirks (1948) |
Year of Election or Appointment: 2005 Trustee |
| Mr. Dirks also serves as Trustee of other Fidelity funds. Prior to his retirement in May 2003, Mr. Dirks was Chief Operating Officer and a member of the Board of The Depository Trust & Clearing Corporation (DTCC). He also served as President, Chief Operating Officer, and Board member of The Depository Trust Company (DTC) and President and Board member of the National Securities Clearing Corporation (NSCC). In addition, Mr. Dirks served as Chief Executive Officer and Board member of the Government Securities Clearing Corporation, Chief Executive Officer and Board member of the Mortgage-Backed Securities Clearing Corporation, as a Trustee and a member of the Finance Committee of Manhattan College (2005-2008), as a Trustee and a member of the Finance Committee of AHRC of Nassau County (2006-2008), and as a member of the Independent Directors Council (IDC) Governing Council (2010-2015). Mr. Dirks is a member of the Board of Directors for The Brookville Center for Children's Services, Inc. (2009-present). |
Alan J. Lacy (1953) |
Year of Election or Appointment: 2008 Trustee |
| Mr. Lacy also serves as Trustee of other Fidelity funds. Mr. Lacy serves as a member of the Board of Directors of Dave & Buster's Entertainment, Inc. (restaurant and entertainment complexes, 2010-present) and Bristol-Myers Squibb Company (global pharmaceuticals, 2008-present). In addition, Mr. Lacy served as Senior Adviser (2007-2014) of Oak Hill Capital Partners, L.P. (private equity) and also served as Chief Executive Officer (2000-2005) and Vice Chairman (2005-2006) of Sears Holdings Corporation and Sears, Roebuck and Co. (retail). Mr. Lacy is a member of the Board of Trustees of The National Parks Conservation Association (2006-present). Previously, Mr. Lacy served as Chairman of the Board of Trustees of the National Parks Conservation Association (2008-2011) and as a member of the Board of Directors for The Western Union Company (global money transfer, 2006-2011), The Hillman Companies, Inc. (hardware wholesalers, 2010-2014), and Earth Fare, Inc. (retail grocery, 2010-2014). |
Ned C. Lautenbach (1944) |
Year of Election or Appointment: 2000 Trustee Chairman of the Independent Trustees |
| Mr. Lautenbach also serves as Trustee of other Fidelity funds. Mr. Lautenbach currently serves as the Lead Director of the Eaton Corporation Board of Directors (diversified industrial, 1997-present). Mr. Lautenbach is Chairman of the Board of Directors of Artis-Naples in Naples, Florida (2012-present), a member of the Council on Foreign Relations (1994-present), and a member of the Board of Governors, State University System of Florida (2013-present). Previously, Mr. Lautenbach was a Partner/Advisory Partner at Clayton, Dubilier & Rice, LLC (private equity investment, 1998-2010), as well as a Director of Sony Corporation (2006-2007). |
Joseph Mauriello (1944) |
Year of Election or Appointment: 2008 Trustee |
| Mr. Mauriello also serves as Trustee of other Fidelity funds. Prior to his retirement in January 2006, Mr. Mauriello served in numerous senior management positions including Deputy Chairman and Chief Operating Officer (2004-2005), and Vice Chairman of Financial Services (2002-2004) of KPMG LLP US (professional services, 1965-2005). Mr. Mauriello currently serves as a member of the Board of Directors of XL Group plc. (global insurance and re-insurance, 2006-present) and the Independent Directors Council (IDC) Governing Council (2015-present). Previously, Mr. Mauriello served as a Director of the Hamilton Funds of the Bank of New York (2006-2007) and of Arcadia Resources Inc. (health care services and products, 2007-2012). |
Robert W. Selander (1950) |
Year of Election or Appointment: 2011 Trustee |
| Mr. Selander also serves as Trustee of other Fidelity funds. Mr. Selander serves as a Director of The Western Union Company (global money transfer, 2014-present). Previously, Mr. Selander served as a Member of the Advisory Board of other Fidelity funds (2011), and Executive Vice Chairman (2010), Chief Executive Officer (2009-2010), and President and Chief Executive Officer (1997-2009) of Mastercard, Inc. |
Cornelia M. Small (1944) |
Year of Election or Appointment: 2005 Trustee |
| Ms. Small also serves as Trustee of other Fidelity funds. Ms. Small is a member of the Board of Directors (2009-present) and Chair of the Investment Committee (2010-present) of the Teagle Foundation. Ms. Small also serves on the Investment Committee of the Berkshire Taconic Community Foundation (2008-present). Previously, Ms. Small served as Chairperson (2002-2008) and a member of the Investment Committee and Chairperson (2008-2012) and a member of the Board of Trustees of Smith College. In addition, Ms. Small served as Chief Investment Officer, Director of Global Equity Investments, and a member of the Board of Directors of Scudder, Stevens & Clark and Scudder Kemper Investments. |
William S. Stavropoulos (1939) |
Year of Election or Appointment: 2001 Trustee Vice Chairman of the Independent Trustees |
| Mr. Stavropoulos also serves as Trustee of other Fidelity funds. Mr. Stavropoulos serves as President and Founder of the Michigan Baseball Foundation, the Great Lakes Loons (2007-present). Mr. Stavropoulos is Chairman Emeritus of the Board of Directors of The Dow Chemical Company, where he previously served in numerous senior management positions, including President, CEO (1995-2000; 2002-2004), Chairman of the Executive Committee (2000-2006), and as a member of the Board of Directors (1990-2006). Currently, Mr. Stavropoulos is Chairman of the Board of Directors of Univar Inc. (global distributor of commodity and specialty chemicals), a Director of Teradata Corporation (data warehousing and technology solutions), and Maersk Inc. (industrial conglomerate), and a member of the Advisory Board for Metalmark Capital LLC (private equity investment, 2005-present). Mr. Stavropoulos is an operating advisor to Clayton, Dubilier & Rice, LLC (private equity investment). In addition, Mr. Stavropoulos is a member of the University of Notre Dame Advisory Council for the College of Science, a Trustee of the Rollin L. Gerstacker Foundation, and a Director of the Naples Philharmonic Center for the Arts. Previously, Mr. Stavropoulos served as a Director of Chemical Financial Corporation (bank holding company, 1993-2012) and Tyco International, Ltd. (multinational manufacturing and services, 2007-2012). |
David M. Thomas (1949) |
Year of Election or Appointment: 2008 Trustee |
| Mr. Thomas also serves as Trustee of other Fidelity funds. Mr. Thomas serves as Non-Executive Chairman of the Board of Directors of Fortune Brands Home and Security (home and security products, 2011-present), as a member of the Board of Directors (2004-present) and Presiding Director (2013-present) of Interpublic Group of Companies, Inc. (marketing communication), and as a member of the Board of Trustees of the University of Florida (2013-present). Previously, Mr. Thomas served as Executive Chairman (2005-2006) and Chairman and Chief Executive Officer (2000-2005) of IMS Health, Inc. (pharmaceutical and healthcare information solutions), and a Director of Fortune Brands, Inc. (consumer products, 2000-2011). |
+ The information above includes each Trustee's principal occupation during the last five years and other information relating to the experience, attributes, and skills relevant to each Trustee's qualifications to serve as a Trustee, which led to the conclusion that each Trustee should serve as a Trustee for the fund.
Advisory Board Member and Officers:
Correspondence intended for each officer and Peter S. Lynch may be sent to Fidelity Investments, 245 Summer Street, Boston, Massachusetts 02210. Officers appear below in alphabetical order.
Name, Year of Birth; Principal Occupation |
Peter S. Lynch (1944) |
Year of Election or Appointment: 2003 Member of the Advisory Board |
| Mr. Lynch also serves as Member of the Advisory Board of other Fidelity funds. Mr. Lynch is Vice Chairman and a Director of FMR (investment adviser firm) and FMR Co., Inc. (investment adviser firm). In addition, Mr. Lynch serves as a Trustee of Boston College and as the Chairman of the Inner-City Scholarship Fund. Previously, Mr. Lynch served on the Special Olympics International Board of Directors (1997-2006). |
Elizabeth Paige Baumann (1968) |
Year of Election or Appointment: 2012 Anti-Money Laundering (AML) Officer |
| Ms. Baumann also serves as AML Officer of other funds. She is Chief AML Officer of FMR LLC (diversified financial services company, 2012-present) and is an employee of Fidelity Investments. Previously, Ms. Baumann served as Vice President and Deputy Anti-Money Laundering Officer (2007-2012). |
Marc R. Bryant (1966) |
Year of Election or Appointment: 2015 Secretary and Chief Legal Officer (CLO) |
| Mr. Bryant also serves as Secretary and CLO of other funds. Mr. Bryant serves as CLO, Secretary, and Senior Vice President of Fidelity Management & Research Company (investment adviser firm, 2015-present) and FMR Co., Inc. (investment adviser firm, 2015-present); Secretary of Fidelity SelectCo, LLC (investment adviser firm, 2015-present) and Fidelity Investments Money Management, Inc. (investment adviser firm, 2015-present); and CLO of Fidelity Management & Research (Hong Kong) Limited (investment adviser firm, 2015-present). He is Senior Vice President and Deputy General Counsel of FMR LLC (diversified financial services company). Previously, Mr. Bryant served as Secretary and Chief Legal Officer of Fidelity Rutland Square Trust II (2010-2014) and Assistant Secretary of Fidelity's Fixed Income and Asset Allocation Funds (2013-2015). Prior to joining Fidelity Investments, Mr. Bryant served as a Senior Vice President and the Head of Global Retail Legal for AllianceBernstein L.P. (2006-2010), and as the General Counsel for ProFund Advisors LLC (2001-2006). |
William C. Coffey (1969) |
Year of Election or Appointment: 2009 Assistant Secretary |
| Mr. Coffey also serves as Assistant Secretary of other funds. He is Senior Vice President and Deputy General Counsel of FMR LLC (diversified financial services company, 2010-present), and is an employee of Fidelity Investments. Previously, Mr. Coffey served as Vice President and Associate General Counsel of FMR LLC (2005-2009). |
Timothy M. Cohen (1969) |
Year of Election or Appointment: 2014 Vice President of certain Equity Funds |
| Mr. Cohen also serves as Vice President of other funds. Mr. Cohen serves as Chief Compliance Officer of FMR Investment Management (U.K.) Limited (investment adviser firm, 2013-present) and is an employee of Fidelity Investments. Previously, Mr. Cohen served as a Director of FMR Investment Management (U.K.) Limited (2013-2015). |
Jonathan Davis (1968) |
Year of Election or Appointment: 2010 Assistant Treasurer |
| Mr. Davis also serves as Assistant Treasurer of other funds, and is an employee of Fidelity Investments. Previously, Mr. Davis served as Vice President and Associate General Counsel of FMR LLC (diversified financial services company, 2003-2010). |
Adrien E. Deberghes (1967) |
Year of Election or Appointment: 2008 Deputy Treasurer |
| Mr. Deberghes also serves as an officer of other funds. He is an employee of Fidelity Investments (2008-present). Prior to joining Fidelity Investments, Mr. Deberghes was Senior Vice President of Mutual Fund Administration at State Street Corporation (2007-2008), Senior Director of Mutual Fund Administration at Investors Bank & Trust (2005-2007), and Director of Finance for Dunkin' Brands (2000-2005). |
Stephanie J. Dorsey (1969) |
Year of Election or Appointment: 2010 Assistant Treasurer |
| Ms. Dorsey also serves as an officer of other funds. She is an employee of Fidelity Investments (2008-present) and has served in other fund officer roles. Prior to joining Fidelity Investments, Ms. Dorsey served as Treasurer (2004-2008) of the JPMorgan Mutual Funds and Vice President (2004-2008) of JPMorgan Chase Bank. |
Howard J. Galligan III (1966) |
Year of Election or Appointment: 2014 Chief Financial Officer |
| Mr. Galligan also serves as Chief Financial Officer of other funds. Mr. Galligan serves as President of Fidelity Pricing and Cash Management Services (FPCMS) (2014-present) and as a Director of Strategic Advisers, Inc. (investment adviser firm, 2008-present). Previously, Mr. Galligan served as Chief Administrative Officer of Asset Management (2011-2014) and Chief Operating Officer and Senior Vice President of Investment Support for Strategic Advisers, Inc. (2003-2011). |
Scott C. Goebel (1968) |
Year of Election or Appointment: 2015 Vice President |
| Mr. Goebel serves as Vice President of other funds and is an employee of Fidelity Investments (2001-present). Previously, Mr. Goebel served as Secretary of Fidelity SelectCo, LLC (investment adviser firm, 2013-2015), Fidelity Investments Money Management, Inc. (FIMM) (investment adviser firm, 2010-2015), and Fidelity Research and Analysis Company (FRAC) (investment adviser firm, 2010-2015); General Counsel, Secretary, and Senior Vice President of Fidelity Management & Research Company (investment adviser firm, 2008-2015) and FMR Co., Inc. (investment adviser firm, 2008-2015); Assistant Secretary of Fidelity Management & Research (Japan) Limited (investment adviser firm, 2008-2015) and FMR Investment Management (U.K.) Limited (investment adviser firm, 2008-2015); Chief Legal Officer (CLO) of Fidelity Management & Research (Hong Kong) Limited (investment adviser firm, 2008-2015); Secretary and CLO of certain Fidelity funds (2008-2015); Assistant Secretary of FIMM (2008-2010), FRAC (2008-2010), and certain funds (2007-2008); and as Vice President and Secretary of Fidelity Distributors Corporation (FDC) (2005-2007). |
Brian B. Hogan (1964) |
Year of Election or Appointment: 2009 Vice President |
| Mr. Hogan also serves as Trustee or Vice President of other funds. Mr. Hogan serves as a Director of Fidelity SelectCo, LLC (investment adviser firm, 2014-present) and President of the Equity Division of FMR (investment adviser firm, 2009-present). Previously, Mr. Hogan served as Senior Vice President, Equity Research of FMR (2006-2009) and as a portfolio manager. |
Chris Maher (1972) |
Year of Election or Appointment: 2013 Assistant Treasurer |
| Mr. Maher serves as Assistant Treasurer of other funds. Mr. Maher is Vice President of Valuation Oversight and is an employee of Fidelity Investments. Previously, Mr. Maher served as Vice President of Asset Management Compliance (2013), Vice President of the Program Management Group of FMR (investment adviser firm, 2010-2013), and Vice President of Valuation Oversight (2008-2010). |
Kenneth B. Robins (1969) |
Year of Election or Appointment: 2008 President and Treasurer |
| Mr. Robins also serves as an officer of other funds. Mr. Robins serves as Executive Vice President of Fidelity Investments Money Management, Inc. (FIMM) (investment adviser firm, 2013-present) and is an employee of Fidelity Investments (2004-present). Previously, Mr. Robins served in other fund officer roles. |
Stacie M. Smith (1974) |
Year of Election or Appointment: 2013 Deputy Treasurer |
| Ms. Smith also serves as an officer of other funds. She is an employee of Fidelity Investments (2009-present) and has served in other fund officer roles. Prior to joining Fidelity Investments, Ms. Smith served as Senior Audit Manager of Ernst & Young LLP (1996-2009). |
Renee Stagnone (1975) |
Year of Election or Appointment: 2013 Deputy Treasurer |
| Ms. Stagnone also serves as Deputy Treasurer of other funds. Ms. Stagnone is an employee of Fidelity Investments (1997-present). |
Linda J. Wondrack (1964) |
Year of Election or Appointment: 2014 Chief Compliance Officer |
| Ms. Wondrack also serves as Chief Compliance Officer of other funds. Ms. Wondrack is Executive Vice President and head of the Ethics Office and Asset Management Compliance for Fidelity Investments (2012-present). Ms. Wondrack also serves as Chief Compliance Officer of Fidelity SelectCo, LLC (investment adviser firm, 2014-present); Chief Compliance Officer of Impresa Management LLC (2013-present); and Chief Compliance Officer of FMR Co., Inc. (investment adviser firm), Fidelity Investments Money Management, Inc. (investment adviser firm), Fidelity Management & Research (Japan) Limited (investment adviser firm), FMR Investment Management (U.K.) Limited (investment adviser firm), Fidelity Management & Research (Hong Kong) (investment adviser firm), Fidelity Management & Research Company (investment adviser firm), FIAM LLC (investment adviser firm), and Strategic Advisers, Inc. (investment adviser firm), Ballyrock Investment Advisors LLC, and Northern Neck Investors LLC (2012-present). Previously, Ms. Wondrack served as Senior Vice President and Chief Compliance Officer for Columbia Management Investment Advisers, LLC (2005-2012); Chief Compliance Officer for certain funds within the Columbia Family of Funds (2007-2012); and Senior Vice President of Compliance Risk Management at Bank of America (2005-2010). |
Joseph F. Zambello (1957) |
Year of Election or Appointment: 2011 Deputy Treasurer |
| Mr. Zambello also serves as Deputy Treasurer of other funds. Mr. Zambello is an employee of Fidelity Investments (1991-present). Previously, Mr. Zambello served as Vice President of the Program Management Group of FMR (investment adviser firm, 2009-2011) and Vice President of the Transfer Agent Oversight Group (2005-2009). |
Annual Report
Class I designates 5% of the dividends distributed in December 2014 as indicated in the Corporate Qualifying memo distributed by the Tax department, during the fiscal year as qualifying for the dividends-received deduction for corporate shareholders.
Class I designates 100% of the dividends distributed in December during the fiscal year as amounts which may be taken into account as a dividend for purposes of the maximum rate under section 1(h)(11) of the Internal Revenue Code.
The amounts per share which represent income derived from sources within, and taxes paid to, foreign countries or possessions of the United States are as follows:
| Pay Date | Income | Taxes |
Class I | 12/08/2014 | 0.1463 | 0.0263 |
The fund will notify shareholders in January 2016 of amounts for use in preparing 2015 income tax returns.
Annual Report
Fidelity Total International Equity Fund
Each year, the Board of Trustees, including the Independent Trustees (together, the Board), votes on the renewal of the management contract with Fidelity Management & Research Company (FMR) and the sub-advisory agreements (together, the Advisory Contracts) for the fund. The Board, assisted by the advice of fund counsel and Independent Trustees' counsel, requests and considers a broad range of information relevant to the renewal of the Advisory Contracts throughout the year.
The Board meets regularly and, at each of its meetings, covers an extensive agenda of topics and materials and considers factors that are relevant to its annual consideration of the renewal of the fund's Advisory Contracts, including the services and support provided to the fund and its shareholders. The Board has established various standing committees (Committees), each composed of and chaired by Independent Trustees with varying backgrounds, to which the Board has assigned specific subject matter responsibilities in order to enhance effective decision-making by the Board. The Board, acting directly and through its Committees, requests and receives information concerning the annual consideration of the renewal of the fund's Advisory Contracts. The Board also meets as needed to consider matters specifically related to the Board's annual consideration of the renewal of the Advisory Contracts. Members of the Board may also meet with trustees of other Fidelity funds through ad hoc joint committees to discuss certain matters relevant to all of the Fidelity funds.
At its July 2015 meeting, the Board unanimously determined to renew the fund's Advisory Contracts. In reaching its determination, the Board considered all factors it believed relevant, including (i) the nature, extent, and quality of the services to be provided to the fund and its shareholders (including the investment performance of the fund); (ii) the competitiveness of the fund's management fee and total expense ratio relative to peer funds; (iii) the total costs of the services to be provided by and the profits to be realized by Fidelity from its relationship with the fund; and (iv) the extent to which (if any) economies of scale exist and would be realized as the fund grows, and whether any economies of scale are appropriately shared with fund shareholders.
In considering whether to renew the Advisory Contracts for the fund, the Board reached a determination, with the assistance of fund counsel and Independent Trustees' counsel and through the exercise of its business judgment, that the renewal of the Advisory Contracts was in the best interests of the fund and its shareholders and that the compensation payable under the Advisory Contracts was fair and reasonable. The Board's decision to renew the Advisory Contracts was not based on any single factor, but rather was based on a comprehensive consideration of all the information provided to the Board at its meetings throughout the year. The Board, in reaching its determination to renew the Advisory Contracts, was aware that shareholders of the fund have a broad range of investment choices available to them, including a wide choice among funds offered by Fidelity's competitors, and that the fund's shareholders, who have the opportunity to review and weigh the disclosure provided by the fund in its prospectus and other public disclosures, have chosen to invest in this fund, which is part of the Fidelity family of funds.
Annual Report
Board Approval of Investment Advisory Contracts and
Management Fees - continued
Nature, Extent, and Quality of Services Provided. The Board considered Fidelity's staffing as it relates to the fund, including the backgrounds of investment personnel of Fidelity, and also considered the fund's investment objective, strategies, and related investment philosophy. The Independent Trustees also had discussions with senior management of Fidelity's investment operations and investment groups. The Board considered the structure of the portfolio manager compensation program and whether this structure provides appropriate incentives to act in the best interests of the fund. Additionally, the Board considered the portfolio managers' investments, if any, in the funds that they manage.
Resources Dedicated to Investment Management and Support Services. The Board and the Fund Oversight and Research Committees reviewed the general qualifications and capabilities of Fidelity's investment staff, including its size, education, experience, and resources, as well as Fidelity's approach to recruiting, training, managing, and compensating investment personnel. The Board noted that Fidelity has continued to increase the resources devoted to non-U.S. offices, including expansion of Fidelity's global investment organization. The Board also noted that Fidelity's analysts have extensive resources, tools and capabilities that allow them to conduct sophisticated quantitative and fundamental analysis, as well as credit analysis of issuers, counterparties and guarantors. Further, the Board considered that Fidelity's investment professionals have sufficient access to global information and data so as to provide competitive investment results over time, and that those professionals also have access to sophisticated tools that permit them to assess portfolio construction and risk and performance attribution characteristics continuously, as well as to transmit new information and research conclusions rapidly around the world. Additionally, in its deliberations, the Board considered Fidelity's trading, risk management, and compliance capabilities and resources, which are integral parts of the investment management process.
Shareholder and Administrative Services. The Board considered (i) the nature, extent, quality, and cost of advisory, administrative, and shareholder services performed by FMR, the sub-advisers (together with FMR, the Investment Advisers), and their affiliates under the Advisory Contracts and under separate agreements covering transfer agency, pricing and bookkeeping, and securities lending services for the fund; (ii) the nature and extent of the supervision of third party service providers, principally custodians and subcustodians; and (iii) the resources devoted to, and the record of compliance with, the fund's compliance policies and procedures. The Board also reviewed the allocation of fund brokerage, including allocations to brokers affiliated with the Investment Advisers, the use of brokerage commissions to pay fund expenses, and the use of "soft" commission dollars to pay for research services.
Annual Report
The Board noted that the growth of fund assets over time across the complex allows Fidelity to reinvest in the development of services designed to enhance the value or convenience of the Fidelity funds as investment vehicles. These services include 24-hour access to account information and market information through telephone representatives and over the Internet, investor education materials and asset allocation tools, and the expanded availability of Fidelity Investor Centers.
In 2014, the Board formed an ad hoc Committee on Transfer Agency Fees to review the variety of transfer agency fee structures throughout the industry and Fidelity's competitive positioning with respect to industry participants.
Investment in a Large Fund Family. The Board considered the benefits to shareholders of investing in a Fidelity fund, including the benefits of investing in a fund that is part of a large family of funds offering a variety of investment disciplines and providing a large variety of mutual fund investor services. The Board noted that Fidelity had taken, or had made recommendations that resulted in the Fidelity funds taking, a number of actions over the previous year that benefited particular funds, including (i) continuing to dedicate additional resources to investment research and to the support of the senior management team that oversees asset management; (ii) continuing efforts to enhance Fidelity's global research capabilities; (iii) launching new funds and making other enhancements to meet client needs; (iv) reducing management fees and total expenses for certain index funds and diversified international funds; (v) continuing to launch dedicated lower cost underlying funds to meet portfolio construction needs related to expanding underlying fund options for Fidelity funds of funds, specifically for the Freedom Fund product lines; (vi) rationalizing product lines and gaining increased efficiencies through fund mergers; (vii) launching active fixed-income exchange-traded funds; (viii) continuing to develop, acquire and implement systems and technology to improve services to the funds and information security and to increase efficiency; (ix) implementing investment enhancements to further strengthen Fidelity's target date product line to increase investors' probability of success in achieving their goals; (x) modifying the eligibility criteria for certain share classes to accommodate roll-over assets from employer-sponsored retirement plans; (xi) launching a new Class W of the Freedom Index Funds to attract and retain Fidelity record-kept retirement plan assets; and (xii) implementing changes to Fidelity's money market product line in response to recent money market regulatory reforms.
Investment Performance. The Board considered whether the fund has operated in accordance with its investment objective, as well as its record of compliance with its investment restrictions and its performance history.
Annual Report
Board Approval of Investment Advisory Contracts and
Management Fees - continued
The Board took into account discussions with representatives of the Investment Advisers about fund investment performance that occur at Board meetings throughout the year. In this regard the Board noted that as part of regularly scheduled fund reviews and other reports to the Board on fund performance, the Board considers annualized return information for the fund, for different time periods, measured against a securities market index ("benchmark index") and a peer group of funds with similar objectives ("peer group"), if any. In its evaluation of fund investment performance, the Board gave particular attention to information indicating changes in performance of certain Fidelity funds for specific time periods and discussed with the Investment Advisers the reasons for any overperformance or underperformance.
In addition to reviewing absolute and relative fund performance, the Independent Trustees periodically consider the appropriateness of fund performance metrics in evaluating the results achieved. In general, the Independent Trustees believe that fund performance should be evaluated based on net performance (after fees and expenses) of both the highest performing and lowest performing fund share classes, where applicable, compared to appropriate benchmark indices, over appropriate time periods that may include full market cycles, and compared to peer groups, as applicable, over the same periods, taking into account relevant factors including the following: general market conditions; issuer-specific information; and fund cash flows and other factors.
The Independent Trustees recognize that shareholders evaluate performance on a net basis over their own holding periods, for which one-, three-, and five-year periods are often used as a proxy. For this reason, the performance information reviewed by the Board also included net cumulative calendar year total return information for the fund and an appropriate benchmark index and peer group for the most recent one-, three-, and five-year periods, as shown below. Returns are shown compared to the 25th percentile (top of box, 75% beaten) and 75th percentile (bottom of box, 25% beaten) of the peer universe. Returns of the benchmark index are "net MA," i.e., adjusted for tax withholding rates applicable to U.S.-based funds organized as Massachusetts business trusts.
Annual Report
Fidelity Total International Equity Fund

The Board also considered that the fund's management fee is subject to upward or downward adjustment depending upon whether, and to what extent, the fund's investment performance for the performance period exceeds, or is exceeded by, a securities index, thus leading to a performance adjustment for the same period. The Board noted that the performance adjustment provides FMR with a strong economic incentive to seek to achieve superior performance for the fund's shareholders and helps to more closely align the interests of FMR and the shareholders of the fund.
Based on its review, the Board concluded that the nature, extent, and quality of services provided to the fund under the Advisory Contracts should benefit the shareholders of the fund.
Competitiveness of Management Fee and Total Expense Ratio. The Board considered the fund's management fee and total expense ratio compared to "mapped groups" of competitive funds and classes created for the purpose of facilitating the Trustees' competitive analysis of management fees and total expenses. Fidelity creates "mapped groups" by combining similar Lipper investment objective categories that have comparable investment mandates. Combining Lipper investment objective categories aids the Board's management fee and total expense ratio comparisons by broadening the competitive group used for comparison.
Management Fee. The Board considered two proprietary management fee comparisons for the 12-month periods shown in basis points (BP) in the chart below. The group of Lipper funds used by the Board for management fee comparisons is referred to below as the "Total Mapped Group." The Total Mapped Group comparison focuses on a fund's standing in terms of gross management fees before expense reimbursements or caps, and without giving effect to the fund's performance adjustment, relative to the total universe of funds with comparable investment mandates, regardless of whether their management fee structures also are comparable. Funds with comparable investment mandates offer exposure to similar types of securities. Funds with comparable management fee structures have similar management fee contractual arrangements (e.g., flat rate charged for advisory services, all-inclusive fee rate, etc.). "TMG %" represents the percentage of funds in the Total Mapped Group that had management fees that were lower than the fund's. For example, a hypothetical TMG % of 20% would mean that 80% of the funds in the Total Mapped Group had higher, and 20% had lower, management fees than the fund. The fund's actual TMG %s and the number of funds in the Total Mapped Group are in the chart below. The "Asset-Size Peer Group" (ASPG) comparison focuses on a fund's standing relative to a subset of non-Fidelity funds within the Total Mapped Group that are similar in size and management fee structure without taking into account performance adjustments, if any. For example, if a fund is in the first quartile of the ASPG, the fund's management fee ranks in the least expensive or lowest 25% of funds in the ASPG. The ASPG represents at least 15% of the funds in the Total Mapped Group with comparable asset size and management fee structures, subject to a minimum of 50 funds (or all funds in the Total Mapped Group if fewer than 50). Additional information, such as the ASPG quartile in which the fund's management fee rate ranked and the impact of the fund's performance adjustment, is also included in the chart and considered by the Board.
Annual Report
Board Approval of Investment Advisory Contracts and
Management Fees - continued
Fidelity Total International Equity Fund
Annual Report
The Board noted that the fund's management fee rate ranked below the median of its Total Mapped Group and below the median of its ASPG for 2014. The Board also noted the effect of the fund's performance adjustment, if any, on the fund's management fee ranking.
The Board noted that, in 2014, the ad hoc Committee on Group Fee was formed by it and other Fidelity fund boards to conduct an in-depth review of the "group fee" component of the management fee of funds with such management fee structures. Committee focus included the mechanics of the group fee, the competitive landscape of group fee structures, Fidelity funds with no group fee component and investment products not included in group fee assets. The Board also considered that, for funds subject to the group fee, FMR agreed to voluntarily waive fees over a specified period of time in amounts designed to account for assets converted from certain funds to certain collective investment trusts.
The Board also noted that, in 2013, the ad hoc Committee on Management Fees was formed to conduct an in-depth review of the management fee rates of Fidelity's active equity mutual funds. The Committee focused on the following areas: (i) standard fee structures; (ii) research consumption and trading evolution; (iii) management fee competitiveness/profitability by category; and (iv) factors that drive institutional pricing.
Based on its review, the Board concluded that the fund's management fee is fair and reasonable in light of the services that the fund receives and the other factors considered.
Total Expense Ratio. In its review of each class's total expense ratio, the Board considered the fund's management fee as well as other fund or class expenses, as applicable, such as transfer agent fees, pricing and bookkeeping fees, fund-paid 12b-1 fees, and custodial, legal, and audit fees. The Board noted the impact of the fund's performance adjustment. The Board also noted that Fidelity may agree to waive fees and expenses from time to time, and the extent to which, if any, it has done so for the fund. As part of its review, the Board also considered the current and historical total expense ratios of each class of the fund compared to competitive fund median expenses. Each class of the fund is compared to those funds and classes in the Total Mapped Group (used by the Board for management fee comparisons) that have a similar sales load structure.
The Board noted that the total expense ratio of the retail class ranked below its competitive median for 2014 and the total expense ratio of each of Class A, Class T, Class B, Class C, and Class I ranked above its competitive median for 2014. The Board considered that, in general, various factors can affect total expense ratios. The Board noted that the total expense ratio of Class T was above the competitive median primarily because of higher 12b-1 fees on Class T as compared to most competitor funds. Class T has a higher 12b-1 fee, but a lower front-end sales charge, than traditionally priced front-end sales charge classes. The Board considered that Class T is primarily sold load-waived in the retirement plan market where its 0.50% 12b-1 fee is comparable to competing no-load, higher 12b-1 fee classes designed specifically for retirement plans. The Board noted that the fund offers multiple classes, each of which has a different sales load and 12b-1 fee structure, and that the multiple structures are intended to offer a range of pricing options for the intermediary market. The Board also noted that the total expense ratios of the classes vary primarily by the level of their 12b-1 fees, although differences in transfer agent fees may also cause expenses to vary from class to class.
Annual Report
Board Approval of Investment Advisory Contracts and
Management Fees - continued
The Board further considered that FMR contractually agreed to reimburse Class A, Class T, Class B, Class C, Class I, and the retail class of the fund to the extent that total operating expenses (excluding interest, certain taxes, certain securities lending costs, brokerage commissions, extraordinary expenses, and acquired fund fees and expenses, if any), as a percentage of their respective average net assets, exceed 1.45%, 1.70%, 2.20%, 2.20%, 1.20%, and 1.20% through December 31, 2015.
Fees Charged to Other Fidelity Clients. The Board also considered Fidelity fee structures and other information with respect to clients of Fidelity, such as other funds advised or subadvised by Fidelity, pension plan clients, and other institutional clients with similar mandates. The Board noted the findings of the 2013 ad hoc joint committee (created with the board of other Fidelity funds), which reviewed and compared Fidelity's institutional investment advisory business with its business of providing services to the Fidelity funds, including the differences in services provided, fees charged, and costs incurred, as well as competition in their respective marketplaces.
Based on its review of total expense ratios and fees charged to other Fidelity clients, the Board concluded that, although in some cases above the median of the universe presented for comparison, the total expense ratio of each class of the fund was reasonable in light of the services that the fund and its shareholders receive and the other factors considered.
Costs of the Services and Profitability. The Board considered the revenues earned and the expenses incurred by Fidelity in conducting the business of developing, marketing, distributing, managing, administering and servicing the fund and servicing the fund's shareholders. The Board also considered the level of Fidelity's profits in respect of all the Fidelity funds.
On an annual basis, Fidelity presents to the Board information about the profitability of its relationship with the fund. Fidelity calculates profitability information for each fund, as well as aggregate profitability information for groups of Fidelity funds and all Fidelity funds, using a series of detailed revenue and cost allocation methodologies which originate with the books and records of Fidelity on which Fidelity's audited financial statements are based. The Audit Committee of the Board reviews any significant changes from the prior year's methodologies.
Annual Report
PricewaterhouseCoopers LLP (PwC), independent registered public accounting firm and auditor to Fidelity and certain Fidelity funds, has been engaged annually by the Board as part of the Board's assessment of Fidelity's profitability analysis. PwC's engagement includes the review and assessment of the methodologies used by Fidelity in determining the revenues and expenses attributable to Fidelity's mutual fund business, and completion of agreed-upon procedures in respect of the mathematical accuracy of fund profitability and its conformity to established allocation methodologies. After considering PwC's reports issued under the engagement and information provided by Fidelity, the Board concluded that while other allocation methods may also be reasonable, Fidelity's profitability methodologies are reasonable in all material respects.
The Board also reviewed Fidelity's non-fund businesses and fall-out benefits related to the mutual fund business as well as cases where Fidelity's affiliates may benefit from or be related to the fund's business.
The Board considered the costs of the services provided by and the profits realized by Fidelity in connection with the operation of the fund and was satisfied that the profitability was not excessive.
Economies of Scale. The Board considered whether there have been economies of scale in respect of the management of the Fidelity funds, whether the Fidelity funds (including the fund) have appropriately benefited from any such economies of scale, and whether there is potential for realization of any further economies of scale. The Board considered the extent to which the fund will benefit from economies of scale as assets grow through increased services to the fund, through waivers or reimbursements, or through fee or expense ratio reductions. The Board also noted that in 2013, it and the boards of other Fidelity funds created an ad hoc committee (the Economies of Scale Committee) to analyze whether Fidelity attains economies of scale in respect of the management and servicing of the Fidelity funds, whether the Fidelity funds have appropriately benefited from such economies of scale, and whether there is potential for realization of any further economies of scale.
The Board recognized that the fund's management contract incorporates a "group fee" structure, which provides for lower group fee rates as total group assets increase, and for higher group fee rates as total group assets decrease (with "group assets" defined to include fund assets under FMR's management plus sector fund assets previously under FMR's management and currently managed by Fidelity SelectCo, LLC). FMR calculates the group fee rates based on a tiered asset "breakpoint" schedule that varies based on asset class. The Board considered that the group fee is designed to deliver the benefits of economies of scale to fund shareholders when total Fidelity fund assets increase, even if assets of any particular fund are unchanged or have declined, because some portion of Fidelity's costs are attributable to services provided to all Fidelity funds, and all funds benefit if those costs can be allocated among more assets. The Board concluded that, given the group fee structure, fund shareholders will benefit from lower management fees as group assets increase at the fund complex level, regardless of whether Fidelity achieves any such economies of scale.
Annual Report
Board Approval of Investment Advisory Contracts and
Management Fees - continued
The Board concluded, taking into account the analysis of the Economies of Scale Committee, that economies of scale, if any, are being appropriately shared between fund shareholders and Fidelity.
Additional Information Requested by the Board. In order to develop fully the factual basis for consideration of the Fidelity funds' Advisory Contracts, the Board requested and received additional information on certain topics, including: (i) fund performance trends and Fidelity's long-term strategies for certain funds; (ii) the various share classes employed by Fidelity and the attributes of each class, together with similar information on the distribution and servicing payments made by Fidelity or the funds to third-party participants in the distribution channels; (iii) fund profitability, and fund performance in relation to fund profitability; (iv) the methodology with respect to evaluating competitive fund data and peer group classifications and fee comparisons; (v) annual fund profitability margins, with particular focus on certain funds with negative margins; (vi) the realization of fall-out benefits in certain Fidelity business units; (vii) economies of scale and the way in which they are shared with fund shareholders; (viii) Fidelity's group fee structures, including the group fee schedule of breakpoints; (ix) the impact of cost containment measures on the funds; and (x) the transfer agent fee structure.
Based on its evaluation of all of the conclusions noted above, and after considering all factors it believed relevant, the Board concluded that the advisory fee structures are fair and reasonable, and that the fund's Advisory Contracts should be renewed.
Annual Report
Investment Adviser
Fidelity Management & Research Company
Boston, MA
Investment Sub-Advisers
FMR Co., Inc.
FMR Investment Management
(U.K.) Limited
Fidelity Management & Research
(Hong Kong) Limited
Fidelity Management & Research
(Japan) Limited
FIL Investment Advisors
FIL Investments (Japan) Limited
FIL Investment Advisors
(UK) Limited
General Distributor
Fidelity Distributors Corporation
Smithfield, RI
Transfer and Service Agents
Fidelity Investments Institutional Operations Company, Inc.
Boston, MA
Fidelity Service Company, Inc.
Boston, MA
Custodian
State Street Bank & Trust Company
Quincy, MA
(Fidelity Investment logo)(registered trademark)
ATIEI-UANN-1215
1.853356.107
ContentsPerformance: The Bottom LineManagement's Discussion of Fund PerformanceShareholder Expense ExampleInvestment Changes (Unaudited)Investments October 31, 2015Financial StatementsNotes to Financial StatementsReport of Independent Registered Public Accounting FirmTrustees and OfficersDistributions (Unaudited)Board Approval of Investment Advisory Contracts and Management Fees
Fidelity®
Global Equity Income
Fund
Annual Report
October 31, 2015
(Fidelity Cover Art)
Contents
Performance | (Click Here) | How the fund has done over time. |
Management's Discussion of Fund Performance | (Click Here) | The Portfolio Manager's review of fund performance and strategy. |
Shareholder Expense Example | (Click Here) | An example of shareholder expenses. |
Investment Changes | (Click Here) | A summary of major shifts in the fund's investments over the past six months. |
Investments | (Click Here) | A complete list of the fund's investments with their market values. |
Financial Statements | (Click Here) | Statements of assets and liabilities, operations, and changes in net assets, as well as financial highlights. |
Notes | (Click Here) | Notes to the financial statements. |
Report of Independent Registered Public Accounting Firm | (Click Here) | |
Trustees and Officers | (Click Here) | |
Distributions | (Click Here) | |
Board Approval of Investment Advisory Contracts and Management Fees | (Click Here) | |
To view a fund's proxy voting guidelines and proxy voting record for the 12-month period ended June 30, visit http://www.fidelity.com/proxyvotingresults or visit the Securities and Exchange Commission's (SEC) web site at http://www.sec.gov. You may also call 1-800-544-8544 to request a free copy of the proxy voting guidelines.
Standard & Poor's, S&P and S&P 500 are registered service marks of The McGraw-Hill Companies, Inc. and have been licensed for use by Fidelity Distributors Corporation.
Other third-party marks appearing herein are the property of their respective owners.
All other marks appearing herein are registered or unregistered trademarks or service marks of FMR LLC or an affiliated company. © 2015 FMR LLC. All rights reserved.
Annual Report
This report and the financial statements contained herein are submitted for the general information of the shareholders of the fund. This report is not authorized for distribution to prospective investors in the fund unless preceded or accompanied by an effective prospectus.
A fund files its complete schedule of portfolio holdings with the SEC for the first and third quarters of each fiscal year on Form N-Q. Forms N-Q are available on the SEC's web site at http://www.sec.gov. A fund's Forms N-Q may be reviewed and copied at the SEC's Public Reference Room in Washington, DC. Information regarding the operation of the SEC's Public Reference Room may be obtained by calling 1-800-SEC-0330. For a complete list of a fund's portfolio holdings, view the most recent holdings listing, semiannual report, or annual report on Fidelity's web site at http://www.fidelity.com, http://www.advisor.fidelity.com, or http://www.401k.com, as applicable.
NOT FDIC INSURED • MAY LOSE VALUE • NO BANK GUARANTEE
Neither the fund nor Fidelity Distributors Corporation is a bank.
Annual Report
Average annual total return reflects the change in the value of an investment, assuming reinvestment of the fund's distributions from dividend income and capital gains (the profits earned upon the sale of securities that have grown in value, if any) and assuming a constant rate of performance each year. The $10,000 table and the fund's returns do not reflect the deduction of taxes that a shareholder would pay on fund distributions or the redemption of fund shares. During periods of reimbursement by Fidelity, a fund's total return will be greater than it would be had the reimbursement not occurred. How a fund did yesterday is no guarantee of how it will do tomorrow.
Average Annual Total Returns
Periods ended October 31, 2015 | Past 1
year | Life of fund A |
Fidelity® Global Equity Income | 2.93% | 10.59% |
A From May 2, 2012.
$10,000 Over Life of Fund
Let's say hypothetically that $10,000 was invested in Fidelity® Global Equity Income Fund, on May 2, 2012, when the fund started. The chart shows how the value of your investment would have changed, and also shows how the MSCI ACWI (All Country World Index) Index performed over the same period.
Annual Report
Market Recap: Following an August and September wherein a collapse in commodities prices hurt resources-related sectors and geographies, global equities rebounded in October to finish flat for the 12 months ending October 31, 2015. The MSCI ACWI (All Country World Index) Index returned 0.35% for the period. Commodity producers remained under pressure for much of the past year, largely related to economic deceleration in China (-1%), the world's second-largest economy and a leading consumer of raw materials. This effect was exacerbated by the strength of the U.S. dollar relative to global currencies, which weighed on commodities priced in dollars and acutely impacted equity returns within regions most exposed to resources prices. For example, the emerging-markets group returned -15% this period. Canada, a significant energy producer, returned about -17%. Conversely, net energy consumer Japan (+9%) proved the best-performing region by far. Only about a quarter of the nearly 50 countries in the index managed a gain: Israel (+17%) and fast-growing Ireland (+12%) performed best; Greece (-56%) and Brazil (-46%), among the worst. As for sectors, energy (-22%) and materials (-12%) declined sharply, while consumer discretionary (+13%) saw a gain driven largely by demand in the United States (+5%).
Comments from Portfolio Manager Ramona Persaud: For the year, the fund achieved a modest gain, outpacing the benchmark MSCI ACWI Index. Against an uptick in global macroeconomic volatility, investors generally favored the value- and quality-oriented investments pursued by the fund, which helped it to outperform. From a geographical perspective, positioning in emerging markets - China, Taiwan and South Africa, in particular - was a plus, as were stock picks in the United Kingdom. Stock picking in the U.S. was the biggest drag on results. Looking at individual names, a non-index stake in WH Smith was one of the biggest contributors. The U.K.-based chain of retail and online shops sells reading material, gifts and snacks to air and rail travelers on the go. The stock benefited from the firm's growing international-travel sales and improving overall business mix. On the flip side, an overweighting in integrated-oil giant Chevron proved a large detractor. Chevron, one of the fund's largest holdings, suffered along with the entire sector as energy prices collapsed.
The views expressed above reflect those of the portfolio manager(s) only through the end of the period as stated on the cover of this report and do not necessarily represent the views of Fidelity or any other person in the Fidelity organization. Any such views are subject to change at any time based upon market or other conditions and Fidelity disclaims any responsibility to update such views. These views may not be relied on as investment advice and, because investment decisions for a Fidelity fund are based on numerous factors, may not be relied on as an indication of trading intent on behalf of any Fidelity fund.
Annual Report
Shareholder Expense Example
As a shareholder of the Fund, you incur two types of costs: (1) transaction costs, including redemption fees and (2) ongoing costs, including management fees and other Fund expenses. This Example is intended to help you understand your ongoing costs (in dollars) of investing in the Fund and to compare these costs with the ongoing costs of investing in other mutual funds.
The Example is based on an investment of $1,000 invested at the beginning of the period and held for the entire period (May 1, 2015 to October 31, 2015).
Actual Expenses
The first line of the accompanying table provides information about actual account values and actual expenses. You may use the information in this line, together with the amount you invested, to estimate the expenses that you paid over the period. Simply divide your account value by $1,000.00 (for example, an $8,600 account value divided by $1,000.00 = 8.6), then multiply the result by the number in the first line under the heading entitled "Expenses Paid During Period" to estimate the expenses you paid on your account during this period. A small balance maintenance fee of $12.00 that is charged once a year may apply for certain accounts with a value of less than $2,000. This fee is not included in the table below. If it was, the estimate of expenses you paid during the period would be higher, and your ending account value lower, by this amount. In addition, the Fund, as a shareholder in the underlying Fidelity Central Funds, will indirectly bear its pro-rata share of the fees and expenses incurred by the underlying Fidelity Central Funds. These fees and expenses are not included in the Fund's annualized expense ratio used to calculate the expense estimate in the table below.
Hypothetical Example for Comparison Purposes
The second line of the accompanying table provides information about hypothetical account values and hypothetical expenses based on the Fund's actual expense ratio and an assumed rate of return of 5% per year before expenses, which is not the Fund's actual return. The hypothetical account values and expenses may not be used to estimate the actual ending account balance or expenses you paid for the period. You may use this information to compare the ongoing costs of investing in the Fund and other funds. To do so, compare this 5% hypothetical example with the 5% hypothetical examples that appear in the shareholder reports of the other funds. A small balance maintenance fee of $12.00 that is charged once a year may apply for certain accounts with a value of less than $2,000. This fee is not included in the table below. If it was, the estimate of expenses you paid during the period would be higher, and your ending account value lower, by this amount. In addition, the Fund, as a shareholder in the underlying Fidelity Central Funds, will indirectly bear its pro-rata share of the fees and expenses incurred by the underlying Fidelity Central Funds. These fees and expenses are not included in the Fund's annualized expense ratio used to calculate the expense estimate in the table below.
Please note that the expenses shown in the table are meant to highlight your ongoing costs only and do not reflect any transaction costs. Therefore, the second line of the table is useful in comparing ongoing costs only, and will not help you determine the relative total costs of owning different funds. In addition, if these transactional costs were included, your costs would have been higher.
Annual Report
Shareholder Expense Example - continued
| Annualized
Expense Ratio B | Beginning
Account Value
May 1, 2015 | Ending
Account Value
October 31, 2015 | Expenses Paid
During Period C
May 1, 2015
to October 31, 2015 |
Actual | 1.13% | $ 1,000.00 | $ 971.60 | $ 5.62 |
HypotheticalA | | $ 1,000.00 | $ 1,019.51 | $ 5.75 |
A 5% return per year before expenses
B Annualized expense ratio reflects expenses net of applicable fee waivers.
C Expenses are equal to the Fund's annualized expense ratio, multiplied by the average account value over the period, multiplied by 184/365 (to reflect the one-half year period).
Annual Report
Investment Changes (Unaudited)
Asset Allocation as of October 31, 2015 |
| % of fund's
net assets | % of fund's net assets
6 months ago |
Stocks | 95.7 | 94.7 |
Bonds | 0.0 | 0.0 |
Short-Term Investments and Net Other Assets (Liabilities) | 4.3 | 5.3 |
Top Ten Stocks as of October 31, 2015 |
| % of fund's
net assets | % of fund's net assets
6 months ago |
JPMorgan Chase & Co. (United States of America, Banks) | 2.7 | 2.0 |
Apple, Inc. (United States of America, Technology Hardware, Storage & Peripherals) | 2.6 | 2.1 |
Johnson & Johnson (United States of America, Pharmaceuticals) | 2.4 | 1.7 |
General Electric Co. (United States of America, Industrial Conglomerates) | 2.4 | 0.9 |
Accenture PLC Class A (Ireland, IT Services) | 1.8 | 1.3 |
Microsoft Corp. (United States of America, Software) | 1.8 | 1.4 |
Chevron Corp. (United States of America, Oil, Gas & Consumable Fuels) | 1.8 | 1.8 |
CVS Health Corp. (United States of America, Food & Staples Retailing) | 1.8 | 1.6 |
Wells Fargo & Co. (United States of America, Banks) | 1.8 | 1.6 |
Target Corp. (United States of America, Multiline Retail) | 1.8 | 1.1 |
| 20.9 | |
Market Sectors as of October 31, 2015 |
| % of fund's
net assets | % of fund's net assets
6 months ago |
Financials | 20.7 | 19.3 |
Information Technology | 17.0 | 13.7 |
Consumer Staples | 14.5 | 10.6 |
Health Care | 13.4 | 14.3 |
Consumer Discretionary | 13.3 | 16.9 |
Industrials | 6.6 | 7.4 |
Energy | 5.1 | 5.3 |
Telecommunication Services | 3.2 | 3.6 |
Materials | 1.9 | 2.7 |
Utilities | 0.0 | 0.9 |
Percentages shown as 0.0% may reflect amounts less than 0.05%. |
Annual Report
Investments October 31, 2015
Showing Percentage of Net Assets
Common Stocks - 95.5% |
| Shares | | Value |
Australia - 0.5% |
Telstra Corp. Ltd. | 82,158 | | $ 314,800 |
Bailiwick of Jersey - 1.9% |
Shire PLC | 8,800 | | 666,432 |
Wolseley PLC | 10,957 | | 643,300 |
TOTAL BAILIWICK OF JERSEY | | 1,309,732 |
Belgium - 0.6% |
Anheuser-Busch InBev SA NV | 3,600 | | 429,569 |
Canada - 3.3% |
Constellation Software, Inc. | 900 | | 388,880 |
Fairfax Financial Holdings Ltd. (sub. vtg.) | 741 | | 364,901 |
Potash Corp. of Saskatchewan, Inc. | 15,300 | | 309,838 |
PrairieSky Royalty Ltd. | 5,200 | | 102,322 |
Suncor Energy, Inc. | 36,800 | | 1,095,050 |
TOTAL CANADA | | 2,260,991 |
Cayman Islands - 0.3% |
SITC International Holdings Co. Ltd. | 465,000 | | 238,679 |
Chile - 0.4% |
Vina San Pedro SA | 31,442,848 | | 247,887 |
France - 2.9% |
Cegedim SA (a) | 6,000 | | 212,782 |
Renault SA | 6,500 | | 612,774 |
Sanofi SA | 11,233 | | 1,133,139 |
TOTAL FRANCE | | 1,958,695 |
Germany - 1.0% |
AURELIUS AG | 8,199 | | 365,871 |
Muenchener Rueckversicherungs AG | 1,500 | | 299,091 |
TOTAL GERMANY | | 664,962 |
Hong Kong - 1.9% |
HKT Trust/HKT Ltd. unit | 378,600 | | 451,074 |
Techtronic Industries Co. Ltd. | 224,000 | | 818,872 |
TOTAL HONG KONG | | 1,269,946 |
Indonesia - 0.5% |
PT Bank Central Asia Tbk | 381,200 | | 358,110 |
Ireland - 4.1% |
Accenture PLC Class A | 11,740 | | 1,258,528 |
Common Stocks - continued |
| Shares | | Value |
Ireland - continued |
Greencore Group PLC | 111,886 | | $ 520,900 |
Medtronic PLC | 13,500 | | 997,920 |
TOTAL IRELAND | | 2,777,348 |
Isle of Man - 1.2% |
Optimal Payments PLC (a) | 103,000 | | 482,706 |
Playtech Ltd. | 26,662 | | 351,834 |
TOTAL ISLE OF MAN | | 834,540 |
Israel - 3.2% |
Bezeq The Israel Telecommunication Corp. Ltd. | 251,000 | | 539,671 |
Cellcom Israel Ltd. (Israel) (a) | 33,580 | | 249,953 |
Partner Communications Co. Ltd. (a) | 13,106 | | 59,481 |
Rami Levi Chain Stores Hashikma Marketing 2006 Ltd. | 4,496 | | 211,486 |
Teva Pharmaceutical Industries Ltd. sponsored ADR | 18,450 | | 1,092,056 |
TOTAL ISRAEL | | 2,152,647 |
Italy - 0.2% |
Astaldi SpA (e) | 17,653 | | 142,097 |
Japan - 11.1% |
A/S One Corp. | 9,400 | | 333,669 |
Astellas Pharma, Inc. | 65,000 | | 943,441 |
Broadleaf Co. Ltd. | 7,400 | | 84,764 |
Daiichikosho Co. Ltd. | 18,400 | | 613,678 |
Daito Trust Construction Co. Ltd. | 4,800 | | 519,582 |
Hoya Corp. | 22,600 | | 932,629 |
Japan Tobacco, Inc. | 11,900 | | 411,880 |
KDDI Corp. | 20,200 | | 488,806 |
NEC Corp. | 155,000 | | 478,172 |
Olympus Corp. | 15,300 | | 516,089 |
ORIX Corp. | 15,600 | | 227,819 |
Shinsei Bank Ltd. | 245,000 | | 513,709 |
Sony Corp. | 15,300 | | 434,909 |
Suzuki Motor Corp. | 12,000 | | 392,922 |
Tsuruha Holdings, Inc. | 4,300 | | 340,663 |
United Arrows Ltd. | 7,400 | | 318,799 |
TOTAL JAPAN | | 7,551,531 |
Netherlands - 1.3% |
Altice NV Class A (a) | 16,500 | | 285,772 |
LyondellBasell Industries NV Class A | 6,500 | | 603,915 |
TOTAL NETHERLANDS | | 889,687 |
Common Stocks - continued |
| Shares | | Value |
Singapore - 0.6% |
United Overseas Bank Ltd. | 26,919 | | $ 390,885 |
South Africa - 1.2% |
Capitec Bank Holdings Ltd. | 9,500 | | 410,850 |
EOH Holdings Ltd. | 17,400 | | 192,369 |
Lewis Group Ltd. | 54,500 | | 235,816 |
TOTAL SOUTH AFRICA | | 839,035 |
Sweden - 0.9% |
Intrum Justitia AB | 400 | | 14,373 |
Nordea Bank AB | 26,000 | | 287,585 |
Sandvik AB | 31,600 | | 295,526 |
TOTAL SWEDEN | | 597,484 |
Switzerland - 1.7% |
ACE Ltd. | 3,700 | | 420,098 |
Banque Cantonale Vaudoise | 630 | | 388,153 |
Sika AG (Bearer) | 100 | | 328,191 |
TOTAL SWITZERLAND | | 1,136,442 |
Taiwan - 1.8% |
King's Town Bank | 120,000 | | 95,734 |
Taiwan Semiconductor Manufacturing Co. Ltd. | 268,000 | | 1,129,211 |
TOTAL TAIWAN | | 1,224,945 |
United Kingdom - 13.0% |
British American Tobacco PLC (United Kingdom) | 16,400 | | 974,318 |
Hilton Food Group PLC | 56,200 | | 402,866 |
Howden Joinery Group PLC | 22,600 | | 161,519 |
Imperial Tobacco Group PLC | 16,356 | | 882,252 |
ITV PLC | 201,300 | | 783,258 |
Lloyds Banking Group PLC | 824,800 | | 936,158 |
Micro Focus International PLC | 49,100 | | 950,699 |
Reckitt Benckiser Group PLC | 5,245 | | 511,862 |
SABMiller PLC | 6,000 | | 369,522 |
St. James's Place Capital PLC | 26,639 | | 396,088 |
Standard Chartered PLC (United Kingdom) | 175 | | 1,946 |
Tesco PLC | 91,535 | | 258,156 |
The Restaurant Group PLC | 16,100 | | 177,958 |
Vodafone Group PLC | 5,956 | | 19,601 |
WH Smith PLC | 44,352 | | 1,165,760 |
Common Stocks - continued |
| Shares | | Value |
United Kingdom - continued |
Whitbread PLC | 5,099 | | $ 390,358 |
William Hill PLC | 86,985 | | 424,424 |
TOTAL UNITED KINGDOM | | 8,806,745 |
United States of America - 41.9% |
American Tower Corp. | 6,460 | | 660,406 |
Amgen, Inc. | 3,620 | | 572,612 |
Apple, Inc. | 14,650 | | 1,750,675 |
Bank of America Corp. | 56,280 | | 944,378 |
BWX Technologies, Inc. | 21,500 | | 608,450 |
Chevron Corp. | 13,365 | | 1,214,611 |
Comcast Corp. Class A | 10,100 | | 632,462 |
Community Trust Bancorp, Inc. | 4,797 | | 165,353 |
CVB Financial Corp. | 26,810 | | 467,835 |
CVS Health Corp. | 12,200 | | 1,205,116 |
Danaher Corp. | 6,800 | | 634,508 |
Deere & Co. | 4,400 | | 343,200 |
Diamond Hill Investment Group, Inc. | 2,500 | | 500,125 |
Dr. Pepper Snapple Group, Inc. | 6,341 | | 566,695 |
EMC Corp. | 23,300 | | 610,926 |
Exxon Mobil Corp. | 12,830 | | 1,061,554 |
First NBC Bank Holding Co. (a) | 2,200 | | 81,818 |
General Electric Co. | 56,500 | | 1,633,980 |
HP, Inc. | 16,000 | | 431,360 |
IBM Corp. | 6,170 | | 864,294 |
Johnson & Johnson | 16,300 | | 1,646,789 |
JPMorgan Chase & Co. | 28,430 | | 1,826,628 |
Lakeland Financial Corp. | 8,488 | | 381,366 |
McGraw Hill Financial, Inc. | 5,740 | | 531,754 |
Microsoft Corp. | 23,464 | | 1,235,145 |
Oracle Corp. | 24,726 | | 960,358 |
PepsiCo, Inc. | 8,400 | | 858,396 |
PJT Partners, Inc. (a) | 222 | | 4,773 |
Procter & Gamble Co. | 11,900 | | 908,922 |
SunTrust Banks, Inc. | 12,600 | | 523,152 |
Target Corp. | 15,500 | | 1,196,290 |
The Coca-Cola Co. | 17,500 | | 741,125 |
U.S. Bancorp | 19,580 | | 825,884 |
VF Corp. | 3,820 | | 257,926 |
Common Stocks - continued |
| Shares | | Value |
United States of America - continued |
Wells Fargo & Co. | 22,157 | | $ 1,199,580 |
Western Digital Corp. | 6,500 | | 434,330 |
TOTAL UNITED STATES OF AMERICA | | 28,482,776 |
TOTAL COMMON STOCKS (Cost $60,596,033) |
64,879,533
|
Nonconvertible Preferred Stocks - 0.2% |
| | | |
Germany - 0.2% |
Volkswagen AG
(Cost $160,068) | 1,100 | |
132,039
|
Nonconvertible Bonds - 0.0% |
| Principal Amount (d) | | |
Canada - 0.0% |
Constellation Software, Inc. 8.5% 3/31/40 (f)
(Cost $2,060) | CAD | 2,400 | |
2,111
|
Money Market Funds - 4.2% |
| Shares | | |
Fidelity Cash Central Fund, 0.18% (b) | 2,833,416 | | 2,833,416 |
Fidelity Securities Lending Cash Central Fund, 0.19% (b)(c) | 37,840 | | 37,840 |
TOTAL MONEY MARKET FUNDS (Cost $2,871,256) |
2,871,256
|
TOTAL INVESTMENT PORTFOLIO - 99.9% (Cost $63,629,417) | | 67,884,939 |
NET OTHER ASSETS (LIABILITIES) - 0.1% | | 40,633 |
NET ASSETS - 100% | $ 67,925,572 |
Currency Abbreviations |
CAD | - | Canadian dollar |
Legend |
(a) Non-income producing |
(b) Affiliated fund that is generally available only to investment companies and other accounts managed by Fidelity Investments. The rate quoted is the annualized seven-day yield of the fund at period end. A complete unaudited listing of the fund's holdings as of its most recent quarter end is available upon request. In addition, each Fidelity Central Fund's financial statements, which are not covered by the Fund's Report of Independent Registered Public Accounting Firm, are available on the SEC's website or upon request. |
(c) Investment made with cash collateral received from securities on loan. |
(d) Amount is stated in United States dollars unless otherwise noted. |
(e) Security or a portion of the security is on loan at period end. |
(f) Coupon rates for floating and adjustable rate securities reflect the rates in effect at period end. |
Affiliated Central Funds |
Information regarding fiscal year to date income earned by the Fund from investments in Fidelity Central Funds is as follows: |
Fund | Income earned |
Fidelity Cash Central Fund | $ 4,814 |
Fidelity Securities Lending Cash Central Fund | 12,323 |
Total | $ 17,137 |
Other Information |
Categorizations in the Schedule of Investments are based on country or territory of incorporation. |
The following is a summary of the inputs used, as of October 31, 2015, involving the Fund's assets and liabilities carried at fair value. The inputs or methodology used for valuing securities may not be an indication of the risk associated with investing in those securities. For more information on valuation inputs, and their aggregation into the levels used in the table below, please refer to the Investment Valuation section in the accompanying Notes to Financial Statements. |
Valuation Inputs at Reporting Date: |
Description | Total | Level 1 | Level 2 | Level 3 |
Investments in Securities: | | | | |
Equities: | | | | |
Consumer Discretionary | $ 9,035,536 | $ 5,899,893 | $ 3,135,643 | $ - |
Consumer Staples | 9,841,615 | 6,915,167 | 2,926,448 | - |
Energy | 3,473,537 | 3,473,537 | - | - |
Financials | 14,089,632 | 10,844,278 | 3,245,354 | - |
Health Care | 9,047,558 | 4,522,159 | 4,525,399 | - |
Industrials | 4,554,113 | 3,672,134 | 881,979 | - |
Information Technology | 11,604,251 | 9,912,104 | 1,692,147 | - |
Materials | 1,241,944 | 1,241,944 | - | - |
Telecommunication Services | 2,123,386 | 849,105 | 1,274,281 | - |
Corporate Bonds | 2,111 | - | 2,111 | - |
Money Market Funds | 2,871,256 | 2,871,256 | - | - |
Total Investments in Securities: | $ 67,884,939 | $ 50,201,577 | $ 17,683,362 | $ - |
See accompanying notes which are an integral part of the financial statements.
Annual Report
Statement of Assets and Liabilities
| | October 31, 2015 |
| | |
Assets | | |
Investment in securities, at value (including securities loaned of $35,579) - See accompanying schedule: Unaffiliated issuers (cost $60,758,161) | $ 65,013,683 | |
Fidelity Central Funds (cost $2,871,256) | 2,871,256 | |
Total Investments (cost $63,629,417) | | $ 67,884,939 |
Foreign currency held at value (cost $11,442) | | 11,157 |
Receivable for investments sold | | 97,904 |
Receivable for fund shares sold | | 18,718 |
Dividends receivable | | 143,226 |
Interest receivable | | 14 |
Distributions receivable from Fidelity Central Funds | | 214 |
Prepaid expenses | | 189 |
Other receivables | | 7,096 |
Total assets | | 68,163,457 |
| | |
Liabilities | | |
Payable for fund shares redeemed | $ 93,700 | |
Accrued management fee | 38,969 | |
Transfer agent fee payable | 14,164 | |
Audit fee payable | 43,042 | |
Other affiliated payables | 2,885 | |
Other payables and accrued expenses | 7,285 | |
Collateral on securities loaned, at value | 37,840 | |
Total liabilities | | 237,885 |
| | |
Net Assets | | $ 67,925,572 |
Net Assets consist of: | | |
Paid in capital | | $ 62,762,271 |
Undistributed net investment income | | 89,501 |
Accumulated undistributed net realized gain (loss) on investments and foreign currency transactions | | 820,308 |
Net unrealized appreciation (depreciation) on investments and assets and liabilities in foreign currencies | | 4,253,492 |
Net Assets, for 5,602,450 shares outstanding | | $ 67,925,572 |
Net Asset Value, offering price and redemption price per share ($67,925,572 ÷ 5,602,450 shares) | | $ 12.12 |
See accompanying notes which are an integral part of the financial statements.
Annual Report
Financial Statements - continued
Statement of Operations
| Year ended October 31, 2015 |
| | |
Investment Income | | |
Dividends | | $ 1,619,986 |
Interest | | 169 |
Income from Fidelity Central Funds | | 17,137 |
Income before foreign taxes withheld | | 1,637,292 |
Less foreign taxes withheld | | (92,136) |
Total income | | 1,545,156 |
| | |
Expenses | | |
Management fee | $ 447,200 | |
Transfer agent fees | 141,706 | |
Accounting and security lending fees | 33,276 | |
Custodian fees and expenses | 17,372 | |
Independent trustees' compensation | 266 | |
Registration fees | 34,860 | |
Audit | 64,513 | |
Legal | 145 | |
Miscellaneous | 663 | |
Total expenses before reductions | 740,001 | |
Expense reductions | (7,826) | 732,175 |
Net investment income (loss) | | 812,981 |
Realized and Unrealized Gain (Loss) | | |
Net realized gain (loss) on: | | |
Investment securities: | | |
Unaffiliated issuers | 1,111,313 | |
Foreign currency transactions | (19,391) | |
Total net realized gain (loss) | | 1,091,922 |
Change in net unrealized appreciation (depreciation) on: Investment securities | (622,014) | |
Assets and liabilities in foreign currencies | (488) | |
Total change in net unrealized appreciation (depreciation) | | (622,502) |
Net gain (loss) | | 469,420 |
Net increase (decrease) in net assets resulting from operations | | $ 1,282,401 |
See accompanying notes which are an integral part of the financial statements.
Annual Report
Statement of Changes in Net Assets
| Year ended
October 31,
2015 | Year ended
October 31,
2014 |
Increase (Decrease) in Net Assets | | |
Operations | | |
Net investment income (loss) | $ 812,981 | $ 1,044,727 |
Net realized gain (loss) | 1,091,922 | 4,719,176 |
Change in net unrealized appreciation (depreciation) | (622,502) | (1,539,214) |
Net increase (decrease) in net assets resulting from operations | 1,282,401 | 4,224,689 |
Distributions to shareholders from net investment income | (855,399) | (913,090) |
Distributions to shareholders from net realized gain | (3,941,634) | (995,008) |
Total distributions | (4,797,033) | (1,908,098) |
Share transactions | | |
Proceeds from sales of shares | 33,328,285 | 24,314,257 |
Reinvestment of distributions | 4,498,152 | 1,764,689 |
Cost of shares redeemed | (18,426,196) | (18,632,872) |
Net increase (decrease) in net assets resulting from share transactions | 19,400,241 | 7,446,074 |
Redemption fees | 1,475 | 4,623 |
Total increase (decrease) in net assets | 15,887,084 | 9,767,288 |
| | |
Net Assets | | |
Beginning of period | 52,038,488 | 42,271,200 |
End of period (including undistributed net investment income of $89,501 and undistributed net investment income of $79,937, respectively) | $ 67,925,572 | $ 52,038,488 |
Other Information Shares | | |
Sold | 2,706,849 | 1,926,789 |
Issued in reinvestment of distributions | 370,373 | 143,562 |
Redeemed | (1,519,683) | (1,491,182) |
Net increase (decrease) | 1,557,539 | 579,169 |
See accompanying notes which are an integral part of the financial statements.
Annual Report
Financial Highlights - Fidelity Global Equity Income Fund
Years ended October 31, | 2015 | 2014 | 2013 | 2012 H |
Selected Per-Share Data | | | | |
Net asset value, beginning of period | $ 12.87 | $ 12.20 | $ 10.16 | $ 10.00 |
Income from Investment Operations | | | | |
Net investment income (loss) D | .16 | .28G | .22 | .08 |
Net realized and unrealized gain (loss) | .21 | .92 | 2.06 | .15 |
Total from investment operations | .37 | 1.20 | 2.28 | .23 |
Distributions from net investment income | (.16) | (.25) | (.21) | (.07) |
Distributions from net realized gain | (.95) | (.28) | (.03) | - |
Total distributions | (1.12) K | (.53) | (.24) | (.07) |
Redemption fees added to paid in capitalD, J | - | - | - | - |
Net asset value, end of period | $ 12.12 | $ 12.87 | $ 12.20 | $ 10.16 |
Total ReturnB, C | 2.93% | 10.10% | 22.73% | 2.25% |
Ratios to Average Net AssetsE, I | | | | |
Expenses before reductions | 1.15% | 1.16% | 1.28% | 2.18%A |
Expenses net of fee waivers, if any | 1.15% | 1.16% | 1.20% | 1.20%A |
Expenses net of all reductions | 1.14% | 1.16% | 1.19% | 1.17%A |
Net investment income (loss) | 1.27% | 2.21%G | 1.94% | 1.62%A |
Supplemental Data | | | | |
Net assets, end of period (000 omitted) | $ 67,926 | $ 52,038 | $ 42,271 | $ 26,838 |
Portfolio turnover rateF | 64% | 92% | 66% | 33%L |
A Annualized
B Total returns for periods of less than one year are not annualized.
C Total returns would have been lower if certain expenses had not been reduced during the applicable periods shown.
D Calculated based on average shares outstanding during the period.
E Fees and expenses of any underlying Fidelity Central Funds are not included in the Fund's expense ratio. The Fund indirectly bears its proportionate share of the expenses of any underlying Fidelity Central Funds.
F Amount does not include the portfolio activity of any underlying Fidelity Central Funds.
G Investment income per share reflects a large, non-recurring dividend which amounted to $.08 per share. Excluding this non-recurring dividend, the ratio of net investment income (loss) to average net assets would have been 1.56%.
H For the period May 2, 2012 (commencement of operations) to October 31, 2012.
I Expense ratios reflect operating expenses of the Fund. Expenses before reductions do not reflect amounts reimbursed by the investment adviser or reductions from brokerage service arrangements or reductions from other expense offset arrangements and do not represent the amount paid by the Fund during periods when reimbursements or reductions occur. Expense ratios before reductions for start-up periods may not be representative of longer term operating periods. Expenses net of fee waivers reflect expenses after reimbursement by the investment adviser but prior to reductions from brokerage service arrangements or other expense offset arrangements. Expenses net of all reductions represent the net expenses paid by the Fund.
J Amount represents less than $.005 per share.
K Total distributions of $1.12 per share is comprised of distributions from net investment income of $.164 and distributions from net realized gain of $.954 per share.
L Amount not annualized.
See accompanying notes which are an integral part of the financial statements.
Annual Report
For the period ended October 31, 2015
1. Organization.
Fidelity Global Equity Income Fund (the Fund) is a fund of Fidelity Investment Trust (the Trust) and is authorized to issue an unlimited number of shares. Share transactions on the Statement of Changes in Net Assets may contain exchanges between funds. The Trust is registered under the Investment Company Act of 1940, as amended (the 1940 Act), as an open-end management investment company organized as a Massachusetts business trust.
2. Investments in Fidelity Central Funds.
The Fund invests in Fidelity Central Funds, which are open-end investment companies generally available only to other investment companies and accounts managed by the investment adviser and its affiliates. The Fund's Schedule of Investments lists each of the Fidelity Central Funds held as of period end, if any, as an investment of the Fund, but does not include the underlying holdings of each Fidelity Central Fund. As an Investing Fund, the Fund indirectly bears its proportionate share of the expenses of the underlying Fidelity Central Funds.
The Money Market Central Funds seek preservation of capital and current income and are managed by Fidelity Investments Money Management, Inc. (FIMM), an affiliate of the investment adviser. Annualized expenses of the Money Market Central Funds as of their most recent shareholder report date are less than .005%.
A complete unaudited list of holdings for each Fidelity Central Fund is available upon request or at the Securities and Exchange Commission (the SEC) website at www.sec.gov. In addition, the financial statements of the Fidelity Central Funds, which are not covered by the Fund's Report of Independent Registered Public Accounting Firm, are available on the SEC website or upon request.
3. Significant Accounting Policies.
The financial statements have been prepared in conformity with accounting principles generally accepted in the United States of America (GAAP), which require management to make certain estimates and assumptions at the date of the financial statements. Actual results could differ from those estimates. Subsequent events, if any, through the date that the financial statements were issued have been evaluated in the preparation of the financial statements. The following summarizes the significant accounting policies of the Fund:
Investment Valuation. Investments are valued as of 4:00 p.m. Eastern time on the last calendar day of the period. The Board of Trustees (the Board) has delegated the day to day responsibility for the valuation of the Fund's investments to the Fidelity Management & Research Company (FMR) Fair Value Committee (the Committee). In accordance
Annual Report
3. Significant Accounting Policies - continued
Investment Valuation - continued
with valuation policies and procedures approved by the Board, the Fund attempts to obtain prices from one or more third party pricing vendors or brokers to value its investments. When current market prices, quotations or currency exchange rates are not readily available or reliable, investments will be fair valued in good faith by the Committee, in accordance with procedures adopted by the Board. Factors used in determining fair value vary by investment type and may include market or investment specific events, changes in interest rates and credit quality. The frequency with which these procedures are used cannot be predicted and they may be utilized to a significant extent. The Committee oversees the Fund's valuation policies and procedures and reports to the Board on the Committee's activities and fair value determinations. The Board monitors the appropriateness of the procedures used in valuing the Fund's investments and ratifies the fair value determinations of the Committee.
The Fund categorizes the inputs to valuation techniques used to value its investments into a disclosure hierarchy consisting of three levels as shown below:
Level 1 - quoted prices in active markets for identical investments
Level 2 - other significant observable inputs (including quoted prices for similar investments, interest rates, prepayment speeds, etc.)
Level 3 - unobservable inputs (including the Fund's own assumptions based on the best information available)
Valuation techniques used to value the Fund's investments by major category are as follows:
Equity securities, including restricted securities, for which market quotations are readily available, are valued at the last reported sale price or official closing price as reported by a third party pricing vendor on the primary market or exchange on which they are traded and are categorized as Level 1 in the hierarchy. In the event there were no sales during the day or closing prices are not available, securities are valued at the last quoted bid price or may be valued using the last available price and are generally categorized as Level 2 in the hierarchy. For foreign equity securities, when market or security specific events arise, comparisons to the valuation of American Depositary Receipts (ADRs), futures contracts, Exchange-Traded Funds (ETFs) and certain indexes as well as quoted prices for similar securities may be used and would be categorized as Level 2 in the hierarchy. Utilizing these techniques may result in transfers between Level 1 and Level 2. For equity securities, including restricted securities, where observable inputs are limited, assumptions about market activity and risk are used and these securities may be categorized as Level 3 in the hierarchy.
Annual Report
Notes to Financial Statements - continued
3. Significant Accounting Policies - continued
Investment Valuation - continued
Debt securities, including restricted securities, are valued based on evaluated prices received from third party pricing vendors or from brokers who make markets in such securities. Corporate bonds are valued by pricing vendors who utilize matrix pricing which considers yield or price of bonds of comparable quality, coupon, maturity and type or by broker-supplied prices. When independent prices are unavailable or unreliable, debt securities may be valued utilizing pricing methodologies which consider similar factors that would be used by third party pricing vendors. Debt securities are generally categorized as Level 2 in the hierarchy but may be Level 3 depending on the circumstances.
Investments in open-end mutual funds, including the Fidelity Central Funds, are valued at their closing net asset value (NAV) each business day and are categorized as Level 1 in the hierarchy.
Changes in valuation techniques may result in transfers in or out of an assigned level within the disclosure hierarchy. The aggregate value of investments by input level as of October 31, 2015 is included at the end of the Fund's Schedule of Investments.
Foreign Currency. The Fund may use foreign currency contracts to facilitate transactions in foreign-denominated securities. Gains and losses from these transactions may arise from changes in the value of the foreign currency or if the counterparties do not perform under the contracts' terms.
Foreign-denominated assets, including investment securities, and liabilities are translated into U.S. dollars at the exchange rates at period end. Purchases and sales of investment securities, income and dividends received and expenses denominated in foreign currencies are translated into U.S. dollars at the exchange rate in effect on the transaction date.
The effects of exchange rate fluctuations on investments are included with the net realized and unrealized gain (loss) on investment securities. Other foreign currency transactions resulting in realized and unrealized gain (loss) are disclosed separately.
Investment Transactions and Income. For financial reporting purposes, the Fund's investment holdings and NAV include trades executed through the end of the last business day of the period. The NAV per share for processing shareholder transactions is calculated as of the close of business of the New York Stock Exchange (NYSE), normally 4:00 p.m. Eastern time and includes trades executed through the end of the prior business day. Gains and losses on securities sold are determined on the basis of identified cost. Dividend income is recorded on the ex-dividend date, except for certain dividends from foreign securities where the ex-dividend date may have passed, which are recorded
Annual Report
3. Significant Accounting Policies - continued
Investment Transactions and Income - continued
as soon as the Fund is informed of the ex-dividend date. Non-cash dividends included in dividend income, if any, are recorded at the fair market value of the securities received. Income and capital gain distributions from Fidelity Central Funds, if any, are recorded on the ex-dividend date. Distributions received on securities that represent a return of capital or capital gain are recorded as a reduction of cost of investments and/or as a realized gain. Subsequent to ex-dividend date the Fund determines the components of these distributions, based upon receipt of tax filings or other correspondence relating to the underlying investment. Interest income is accrued as earned and includes coupon interest and amortization of premium and accretion of discount on debt securities as applicable. Investment income is recorded net of foreign taxes withheld where recovery of such taxes is uncertain.
Expenses. Expenses directly attributable to a fund are charged to that fund. Expenses attributable to more than one fund are allocated among the respective funds on the basis of relative net assets or other appropriate methods. Expense estimates are accrued in the period to which they relate and adjustments are made when actual amounts are known.
Income Tax Information and Distributions to Shareholders. Each year, the Fund intends to qualify as a regulated investment company under Subchapter M of the Internal Revenue Code, including distributing substantially all of its taxable income and realized gains. As a result, no provision for U.S. Federal income taxes is required. As of October 31, 2015, the Fund did not have any unrecognized tax benefits in the financial statements; nor is the Fund aware of any tax positions for which it is reasonably possible that the total amounts of unrecognized tax benefits will significantly change in the next twelve months. The Fund files a U.S. federal tax return, in addition to state and local tax returns as required. The Fund's federal income tax returns are subject to examination by the Internal Revenue Service (IRS) for a period of three fiscal years after they are filed. State and local tax returns may be subject to examination for an additional fiscal year depending on the jurisdiction. Foreign taxes are provided for based on the Fund's understanding of the tax rules and rates that exist in the foreign markets in which it invests.
Distributions are declared and recorded on the ex-dividend date. Income and capital gain distributions are determined in accordance with income tax regulations, which may differ from GAAP. In addition, the Fund claimed a portion of the payment made to redeeming shareholders as a distribution for income tax purposes.
Capital accounts within the financial statements are adjusted for permanent book-tax differences. These adjustments have no impact on net assets or the results of operations.
Annual Report
Notes to Financial Statements - continued
3. Significant Accounting Policies - continued
Income Tax Information and Distributions to Shareholders - continued
Capital accounts are not adjusted for temporary book-tax differences which will reverse in a subsequent period.
Book-tax differences are primarily due to foreign currency transactions, passive foreign investment companies (PFIC), partnerships and losses deferred due to wash sales.
The federal tax cost of investment securities and unrealized appreciation (depreciation) as of period end were as follows:
Gross unrealized appreciation | $ 7,073,295 |
Gross unrealized depreciation | (2,905,665) |
Net unrealized appreciation (depreciation) on securities | $ 4,167,630 |
Tax Cost | $ 63,717,309 |
The tax-based components of distributable earnings as of period end were as follows:
Undistributed ordinary income | $ 89,501 |
Undistributed long-term capital gain | $ 908,200 |
Net unrealized appreciation (depreciation) on securities and other investments | $ 4,165,600 |
The tax character of distributions paid was as follows:
| October 31, 2015 | October 31, 2014 |
Ordinary Income | $ 1,107,432 | $ 1,438,821 |
Long-term Capital Gains | 3,689,601 | 469,277 |
Total | $ 4,797,033 | $ 1,908,098 |
Short-Term Trading (Redemption) Fees. Shares held by investors in the Fund less than 30 days may have been subject to a redemption fee equal to 1.00% of the NAV of shares redeemed. All redemption fees, which reduce the proceeds of the shareholder redemption, are retained by the Fund and accounted for as an addition to paid in capital.
4. Purchases and Sales of Investments.
Purchases and sales of securities, other than short-term securities, aggregated $53,935,071 and $38,815,844, respectively.
5. Fees and Other Transactions with Affiliates.
Management Fee. Fidelity Management & Research Company (the investment adviser) and its affiliates provide the Fund with investment management related services for which the Fund pays a monthly management fee. The management fee is the
Annual Report
5. Fees and Other Transactions with Affiliates - continued
Management Fee - continued
sum of an individual fund fee rate that is based on an annual rate of .45% of the Fund's average net assets and an annualized group fee rate that averaged .25% during the period. The group fee rate is based upon the average net assets of all the mutual funds advised by the investment adviser, including any mutual funds previously advised by the investment adviser that are currently advised by Fidelity SelectCo, LLC, an affiliate of the investment adviser. The group fee rate decreases as assets under management increase and increases as assets under management decrease. For the reporting period, the total annual management fee rate was .70% of the Fund's average net assets.
Transfer Agent Fees. Fidelity Investments Institutional Operations Company, Inc. (FIIOC), an affiliate of the investment adviser, is the Fund's transfer, dividend disbursing and shareholder servicing agent. FIIOC receives account fees and asset-based fees that vary according to account size and type of account. FIIOC pays for typesetting, printing and mailing of shareholder reports, except proxy statements. For the period, the transfer agent fees were equivalent to an annual rate of .22% of average net assets.
Accounting and Security Lending Fees. Fidelity Service Company, Inc. (FSC), an affiliate of the investment adviser, maintains the Fund's accounting records. The accounting fee is based on the level of average net assets for each month. Under a separate contract, FSC administers the security lending program. The security lending fee is based on the number and duration of lending transactions.
Brokerage Commissions. The Fund placed a portion of its portfolio transactions with brokerage firms which are affiliates of the investment adviser. Brokerage commissions are included in net realized gain (loss) and change in net unrealized appreciation (depreciation) in the Statement of Operations. The commissions paid to these affiliated firms were $139 for the period.
6. Committed Line of Credit.
The Fund participates with other funds managed by the investment adviser or an affiliate in a $4.25 billion credit facility (the "line of credit") to be utilized for temporary or emergency purposes to fund shareholder redemptions or for other short-term liquidity purposes. The Fund has agreed to pay commitment fees on its pro-rata portion of the line of credit, which amounted to $89 and is reflected in Miscellaneous expenses on the Statement of Operations. During the period, the Fund did not borrow on this line of credit.
7. Security Lending.
The Fund lends portfolio securities through a lending agent from time to time in order to earn additional income. For equity securities, a lending agent is used and may loan
Annual Report
Notes to Financial Statements - continued
7. Security Lending - continued
securities to certain qualified borrowers, including Fidelity Capital Markets (FCM), a broker-dealer affiliated with the Fund. On the settlement date of the loan, the Fund receives collateral (in the form of U.S. Treasury obligations, letters of credit and/or cash) against the loaned securities and maintains collateral in an amount not less than 100% of the market value of the loaned securities during the period of the loan. The market value of the loaned securities is determined at the close of business of the Fund and any additional required collateral is delivered to the Fund on the next business day. The Fund or borrower may terminate the loan at any time, and if the borrower defaults on its obligation to return the securities loaned because of insolvency or other reasons, the Fund may apply collateral received from the borrower against the obligation. The Fund may experience delays and costs in recovering the securities loaned. Any cash collateral received is invested in the Fidelity Securities Lending Cash Central Fund. The value of loaned securities and cash collateral at period end are disclosed on the Fund's Statement of Assets and Liabilities. Security lending income represents the income earned on investing cash collateral, less rebates paid to borrowers and any lending agent fees associated with the loan, plus any premium payments received for lending certain types of securities. Security lending income is presented in the Statement of Operations as a component of income from Fidelity Central Funds. Total security lending income during the period amounted to $12,323. During the period, there were no securities loaned to FCM.
8. Expense Reductions.
Commissions paid to certain brokers with whom the investment adviser, or its affiliates, places trades on behalf of the Fund include an amount in addition to trade execution, which may be rebated back to the Fund to offset certain expenses. This amount totaled $6,412 for the period. Through arrangements with the Fund's custodian, credits realized as a result of certain uninvested cash balances were used to reduce the Fund's expenses. During the period, these credits reduced the Fund's custody expenses by $11.
In addition, during the period the investment adviser reimbursed and/or waived a portion of operating expenses in the amount of $1,403.
9. Other.
The Fund's organizational documents provide former and current trustees and officers with a limited indemnification against liabilities arising in connection with the performance of their duties to the Fund. In the normal course of business, the Fund may also enter into contracts that provide general indemnifications. The Fund's maximum exposure under these arrangements is unknown as this would be dependent on future claims that may be made against the Fund. The risk of material loss from such claims is considered remote.
Annual Report
To the Trustees of Fidelity Investment Trust and Shareholders of Fidelity Global Equity Income Fund:
We have audited the accompanying statement of assets and liabilities of Fidelity Global Equity Income Fund (the Fund), a fund of Fidelity Investment Trust, including the schedule of investments, as of October 31, 2015, and the related statement of operations for the year then ended, the statement of changes in net assets for each of the two years in the period then ended, and the financial highlights for each of the three years in the period then ended and for the period from May 2, 2012 (commencement of operations) to October 31, 2012. These financial statements and financial highlights are the responsibility of the Fund's management. Our responsibility is to express an opinion on these financial statements and financial highlights based on our audits.
We conducted our audits in accordance with the standards of the Public Company Accounting Oversight Board (United States). Those standards require that we plan and perform the audit to obtain reasonable assurance about whether the financial statements and financial highlights are free of material misstatement. The Fund is not required to have, nor were we engaged to perform, an audit of its internal control over financial reporting. Our audits included consideration of internal control over financial reporting as a basis for designing audit procedures that are appropriate in the circumstances, but not for the purpose of expressing an opinion on the effectiveness of the Fund's internal control over financial reporting. Accordingly, we express no such opinion. An audit also includes examining, on a test basis, evidence supporting the amounts and disclosures in the financial statements, assessing the accounting principles used and significant estimates made by management, as well as evaluating the overall financial statement presentation. Our procedures included confirmation of securities owned as of October 31, 2015, by correspondence with the custodians and brokers; when replies were not received from brokers, we performed other auditing procedures. We believe that our audits provide a reasonable basis for our opinion.
In our opinion, such financial statements and financial highlights referred to above present fairly, in all material respects, the financial position of Fidelity Global Equity Income Fund as of October 31, 2015, the results of its operations for the year then ended, the changes in its net assets for each of the two years in the period then ended, and the financial highlights for each of the three years in the period then ended and for the period from May 2, 2012 (commencement of operations) to October 31, 2012, in conformity with accounting principles generally accepted in the United States of America.
DELOITTE & TOUCHE LLP
Boston, Massachusetts
December 21, 2015
Annual Report
The Trustees, Member of the Advisory Board, and officers of the trust and fund, as applicable, are listed below. The Board of Trustees governs the fund and is responsible for protecting the interests of shareholders. The Trustees are experienced executives who meet periodically throughout the year to oversee the fund's activities, review contractual arrangements with companies that provide services to the fund, oversee management of the risks associated with such activities and contractual arrangements, and review the fund's performance. Each of the Trustees oversees 170 funds.
The Trustees hold office without limit in time except that (a) any Trustee may resign; (b) any Trustee may be removed by written instrument, signed by at least two-thirds of the number of Trustees prior to such removal; (c) any Trustee who requests to be retired or who has become incapacitated by illness or injury may be retired by written instrument signed by a majority of the other Trustees; and (d) any Trustee may be removed at any special meeting of shareholders by a two-thirds vote of the outstanding voting securities of the trust. Each Trustee who is not an interested person (as defined in the 1940 Act) of the trust and the fund (Independent Trustee), shall retire not later than the last day of the calendar year in which his or her 75th birthday occurs. The Independent Trustees may waive this mandatory retirement age policy with respect to individual Trustees. The officers and Advisory Board Member hold office without limit in time, except that any officer and Advisory Board Member may resign or may be removed by a vote of a majority of the Trustees at any regular meeting or any special meeting of the Trustees. Except as indicated, each individual has held the office shown or other offices in the same company for the past five years.
Experience, Skills, Attributes, and Qualifications of the Fund's Trustees. The Governance and Nominating Committee has adopted a statement of policy that describes the experience, qualifications, attributes, and skills that are necessary and desirable for potential Independent Trustee candidates (Statement of Policy). The Board believes that each Trustee satisfied at the time he or she was initially elected or appointed a Trustee, and continues to satisfy, the standards contemplated by the Statement of Policy. The Governance and Nominating Committee also engages professional search firms to help identify potential Independent Trustee candidates who have the experience, qualifications, attributes, and skills consistent with the Statement of Policy. From time to time, additional criteria based on the composition and skills of the current Independent Trustees, as well as experience or skills that may be appropriate in light of future changes to board composition, business conditions, and regulatory or other developments, have also been considered by the professional search firms and the Governance and Nominating Committee. In addition, the Board takes into account the Trustees' commitment and participation in Board and committee meetings, as well as their leadership of standing and ad hoc committees throughout their tenure.
In determining that a particular Trustee was and continues to be qualified to serve as a Trustee, the Board has considered a variety of criteria, none of which, in isolation, was controlling. The Board believes that, collectively, the Trustees have balanced and diverse experience, qualifications, attributes, and skills, which allow the Board to operate effectively in governing the fund and protecting the interests of shareholders. Information about the specific experience, skills, attributes, and qualifications of each Trustee, which in each case led to the Board's conclusion that the Trustee should serve (or continue to serve) as a trustee of the fund, is provided below.
Annual Report
Board Structure and Oversight Function. James C. Curvey is an interested person (as defined in the 1940 Act) and currently serves as Chairman. The Trustees have determined that an interested Chairman is appropriate and benefits shareholders because an interested Chairman has a personal and professional stake in the quality and continuity of services provided to the fund. Independent Trustees exercise their informed business judgment to appoint an individual of their choosing to serve as Chairman, regardless of whether the Trustee happens to be independent or a member of management. The Independent Trustees have determined that they can act independently and effectively without having an Independent Trustee serve as Chairman and that a key structural component for assuring that they are in a position to do so is for the Independent Trustees to constitute a substantial majority for the Board. The Independent Trustees also regularly meet in executive session. Ned C. Lautenbach serves as Chairman of the Independent Trustees and as such (i) acts as a liaison between the Independent Trustees and management with respect to matters important to the Independent Trustees and (ii) with management prepares agendas for Board meetings.
Fidelity funds are overseen by different Boards of Trustees. The fund's Board oversees Fidelity's high income and certain equity funds, and other Boards oversee Fidelity's investment-grade bond, money market, asset allocation, and sector funds. The asset allocation funds may invest in Fidelity funds overseen by the fund's Board. The use of separate Boards, each with its own committee structure, allows the Trustees of each group of Fidelity funds to focus on the unique issues of the funds they oversee, including common research, investment, and operational issues. On occasion, the separate Boards establish joint committees to address issues of overlapping consequences for the Fidelity funds overseen by each Board.
The Trustees operate using a system of committees to facilitate the timely and efficient consideration of all matters of importance to the Trustees, the fund, and fund shareholders and to facilitate compliance with legal and regulatory requirements and oversight of the fund's activities and associated risks. The Board, acting through its committees, has charged FMR and its affiliates with (i) identifying events or circumstances the occurrence of which could have demonstrably adverse effects on the fund's business and/or reputation; (ii) implementing processes and controls to lessen the possibility that such events or circumstances occur or to mitigate the effects of such events or circumstances if they do occur; and (iii) creating and maintaining a system designed to evaluate continuously business and market conditions in order to facilitate the identification and implementation processes described in (i) and (ii) above. Because the day-to-day operations and activities of the fund are carried out by or through FMR, its affiliates and other service providers, the fund's exposure to risks is mitigated but not eliminated by the processes overseen by the Trustees. While each of the Board's committees has responsibility for overseeing different aspects of the fund's activities, oversight is exercised primarily through the Operations, Audit, and Compliance Committees. In addition, the Independent Trustees have worked with FMR to enhance the Board's oversight of investment and financial risks, legal and regulatory risks, technology risks, and operational risks, including the development of additional risk reporting to the Board. For example, a working group comprised of Independent Trustees and FMR has worked and continues to work to review the Fidelity funds' valuation-related activities, reporting and risk management. Appropriate personnel, including but not limited to the fund's Chief Compliance Officer (CCO), FMR's internal auditor, the independent accountants, the fund's Treasurer and portfolio management personnel, make periodic reports to the Board's committees, as appropriate, including an annual review of Fidelity's risk management program for the Fidelity funds. The responsibilities of each standing committee, including their oversight responsibilities, are described further under "Standing Committees of the Fund's Trustees."
Annual Report
Trustees and Officers - continued
The fund's Statement of Additional Information (SAI) includes more information about the Trustees. To request a free copy, call Fidelity at 1-800-544-8544.
Interested Trustees*:
Correspondence intended for each Trustee who is an interested person may be sent to Fidelity Investments, 245 Summer Street, Boston, Massachusetts 02210.
Name, Year of Birth; Principal Occupations and Other Relevant Experience+ |
James C. Curvey (1935) |
Year of Election or Appointment: 2007 Trustee Chairman of the Board of Trustees |
| Mr. Curvey also serves as Trustee of other Fidelity funds. Mr. Curvey is a Director of Fidelity Research & Analysis Co. (investment adviser firm, 2009-present), and Vice Chairman (2007-present) and Director of FMR LLC (diversified financial services company). In addition, Mr. Curvey serves as an Overseer for the Boston Symphony Orchestra and a member of the board of Artis-Naples, Naples, Florida, and as a Trustee for Brewster Academy, Wolfeboro, New Hampshire. Previously, Mr. Curvey served as a Director of Fidelity Investments Money Management, Inc. (investment adviser firm, 2009-2014) and a Director of FMR and FMR Co., Inc. (investment adviser firms, 2007-2014). |
Charles S. Morrison (1960) |
Year of Election or Appointment: 2014 Trustee |
| Mr. Morrison also serves as Trustee of other funds. He serves as a Director of Fidelity Investments Money Management, Inc. (FIMM) (investment adviser firm, 2014-present), Director of Fidelity SelectCo, LLC (investment adviser firm, 2014-present), President, Asset Management (2014-present), and is an employee of Fidelity Investments. Previously, Mr. Morrison served as Vice President of Fidelity's Fixed Income and Asset Allocation Funds (2012-2014), President, Fixed Income (2011-2014), Vice President of Fidelity's Money Market Funds (2005-2009), President, Money Market Group Leader of FMR (investment adviser firm, 2009), and Senior Vice President, Money Market Group of FMR (2004-2009). Mr. Morrison also served as Vice President of Fidelity's Bond Funds (2002-2005), certain Balanced Funds (2002-2005), and certain Asset Allocation Funds (2002-2007), and as Senior Vice President (2002-2005) of Fidelity's Bond Division. |
* Trustees have been determined to be "Interested Trustees" by virtue of, among other things, their affiliation with the trust or various entities under common control with FMR.
+ The information above includes each Trustee's principal occupation during the last five years and other information relating to the experience, attributes, and skills relevant to each Trustee's qualifications to serve as a Trustee, which led to the conclusion that each Trustee should serve as a Trustee for the fund.
Annual Report
Trustees and Officers - continued
Independent Trustees:
Correspondence intended for each Independent Trustee (that is, the Trustees other than the Interested Trustees) may be sent to Fidelity Investments, P.O. Box 55235, Boston, Massachusetts 02205-5235.
Name, Year of Birth; Principal Occupations and Other Relevant Experience+ |
Dennis J. Dirks (1948) |
Year of Election or Appointment: 2005 Trustee |
| Mr. Dirks also serves as Trustee of other Fidelity funds. Prior to his retirement in May 2003, Mr. Dirks was Chief Operating Officer and a member of the Board of The Depository Trust & Clearing Corporation (DTCC). He also served as President, Chief Operating Officer, and Board member of The Depository Trust Company (DTC) and President and Board member of the National Securities Clearing Corporation (NSCC). In addition, Mr. Dirks served as Chief Executive Officer and Board member of the Government Securities Clearing Corporation, Chief Executive Officer and Board member of the Mortgage-Backed Securities Clearing Corporation, as a Trustee and a member of the Finance Committee of Manhattan College (2005-2008), as a Trustee and a member of the Finance Committee of AHRC of Nassau County (2006-2008), and as a member of the Independent Directors Council (IDC) Governing Council (2010-2015). Mr. Dirks is a member of the Board of Directors for The Brookville Center for Children's Services, Inc. (2009-present). |
Alan J. Lacy (1953) |
Year of Election or Appointment: 2008 Trustee |
| Mr. Lacy also serves as Trustee of other Fidelity funds. Mr. Lacy serves as a member of the Board of Directors of Dave & Buster's Entertainment, Inc. (restaurant and entertainment complexes, 2010-present) and Bristol-Myers Squibb Company (global pharmaceuticals, 2008-present). In addition, Mr. Lacy served as Senior Adviser (2007-2014) of Oak Hill Capital Partners, L.P. (private equity) and also served as Chief Executive Officer (2000-2005) and Vice Chairman (2005-2006) of Sears Holdings Corporation and Sears, Roebuck and Co. (retail). Mr. Lacy is a member of the Board of Trustees of The National Parks Conservation Association (2006-present). Previously, Mr. Lacy served as Chairman of the Board of Trustees of the National Parks Conservation Association (2008-2011) and as a member of the Board of Directors for The Western Union Company (global money transfer, 2006-2011), The Hillman Companies, Inc. (hardware wholesalers, 2010-2014), and Earth Fare, Inc. (retail grocery, 2010-2014). |
Ned C. Lautenbach (1944) |
Year of Election or Appointment: 2000 Trustee Chairman of the Independent Trustees |
| Mr. Lautenbach also serves as Trustee of other Fidelity funds. Mr. Lautenbach currently serves as the Lead Director of the Eaton Corporation Board of Directors (diversified industrial, 1997-present). Mr. Lautenbach is Chairman of the Board of Directors of Artis-Naples in Naples, Florida (2012-present), a member of the Council on Foreign Relations (1994-present), and a member of the Board of Governors, State University System of Florida (2013-present). Previously, Mr. Lautenbach was a Partner/Advisory Partner at Clayton, Dubilier & Rice, LLC (private equity investment, 1998-2010), as well as a Director of Sony Corporation (2006-2007). |
Joseph Mauriello (1944) |
Year of Election or Appointment: 2008 Trustee |
| Mr. Mauriello also serves as Trustee of other Fidelity funds. Prior to his retirement in January 2006, Mr. Mauriello served in numerous senior management positions including Deputy Chairman and Chief Operating Officer (2004-2005), and Vice Chairman of Financial Services (2002-2004) of KPMG LLP US (professional services, 1965-2005). Mr. Mauriello currently serves as a member of the Board of Directors of XL Group plc. (global insurance and re-insurance, 2006-present) and the Independent Directors Council (IDC) Governing Council (2015-present). Previously, Mr. Mauriello served as a Director of the Hamilton Funds of the Bank of New York (2006-2007) and of Arcadia Resources Inc. (health care services and products, 2007-2012). |
Robert W. Selander (1950) |
Year of Election or Appointment: 2011 Trustee |
| Mr. Selander also serves as Trustee of other Fidelity funds. Mr. Selander serves as a Director of The Western Union Company (global money transfer, 2014-present). Previously, Mr. Selander served as a Member of the Advisory Board of other Fidelity funds (2011), and Executive Vice Chairman (2010), Chief Executive Officer (2009-2010), and President and Chief Executive Officer (1997-2009) of Mastercard, Inc. |
Cornelia M. Small (1944) |
Year of Election or Appointment: 2005 Trustee |
| Ms. Small also serves as Trustee of other Fidelity funds. Ms. Small is a member of the Board of Directors (2009-present) and Chair of the Investment Committee (2010-present) of the Teagle Foundation. Ms. Small also serves on the Investment Committee of the Berkshire Taconic Community Foundation (2008-present). Previously, Ms. Small served as Chairperson (2002-2008) and a member of the Investment Committee and Chairperson (2008-2012) and a member of the Board of Trustees of Smith College. In addition, Ms. Small served as Chief Investment Officer, Director of Global Equity Investments, and a member of the Board of Directors of Scudder, Stevens & Clark and Scudder Kemper Investments. |
William S. Stavropoulos (1939) |
Year of Election or Appointment: 2001 Trustee Vice Chairman of the Independent Trustees |
| Mr. Stavropoulos also serves as Trustee of other Fidelity funds. Mr. Stavropoulos serves as President and Founder of the Michigan Baseball Foundation, the Great Lakes Loons (2007-present). Mr. Stavropoulos is Chairman Emeritus of the Board of Directors of The Dow Chemical Company, where he previously served in numerous senior management positions, including President, CEO (1995-2000; 2002-2004), Chairman of the Executive Committee (2000-2006), and as a member of the Board of Directors (1990-2006). Currently, Mr. Stavropoulos is Chairman of the Board of Directors of Univar Inc. (global distributor of commodity and specialty chemicals), a Director of Teradata Corporation (data warehousing and technology solutions), and Maersk Inc. (industrial conglomerate), and a member of the Advisory Board for Metalmark Capital LLC (private equity investment, 2005-present). Mr. Stavropoulos is an operating advisor to Clayton, Dubilier & Rice, LLC (private equity investment). In addition, Mr. Stavropoulos is a member of the University of Notre Dame Advisory Council for the College of Science, a Trustee of the Rollin L. Gerstacker Foundation, and a Director of the Naples Philharmonic Center for the Arts. Previously, Mr. Stavropoulos served as a Director of Chemical Financial Corporation (bank holding company, 1993-2012) and Tyco International, Ltd. (multinational manufacturing and services, 2007-2012). |
David M. Thomas (1949) |
Year of Election or Appointment: 2008 Trustee |
| Mr. Thomas also serves as Trustee of other Fidelity funds. Mr. Thomas serves as Non-Executive Chairman of the Board of Directors of Fortune Brands Home and Security (home and security products, 2011-present), as a member of the Board of Directors (2004-present) and Presiding Director (2013-present) of Interpublic Group of Companies, Inc. (marketing communication), and as a member of the Board of Trustees of the University of Florida (2013-present). Previously, Mr. Thomas served as Executive Chairman (2005-2006) and Chairman and Chief Executive Officer (2000-2005) of IMS Health, Inc. (pharmaceutical and healthcare information solutions), and a Director of Fortune Brands, Inc. (consumer products, 2000-2011). |
+ The information above includes each Trustee's principal occupation during the last five years and other information relating to the experience, attributes, and skills relevant to each Trustee's qualifications to serve as a Trustee, which led to the conclusion that each Trustee should serve as a Trustee for the fund.
Advisory Board Member and Officers:
Correspondence intended for each officer and Peter S. Lynch may be sent to Fidelity Investments, 245 Summer Street, Boston, Massachusetts 02210. Officers appear below in alphabetical order.
Name, Year of Birth; Principal Occupation |
Peter S. Lynch (1944) |
Year of Election or Appointment: 2003 Member of the Advisory Board |
| Mr. Lynch also serves as Member of the Advisory Board of other Fidelity funds. Mr. Lynch is Vice Chairman and a Director of FMR (investment adviser firm) and FMR Co., Inc. (investment adviser firm). In addition, Mr. Lynch serves as a Trustee of Boston College and as the Chairman of the Inner-City Scholarship Fund. Previously, Mr. Lynch served on the Special Olympics International Board of Directors (1997-2006). |
Elizabeth Paige Baumann (1968) |
Year of Election or Appointment: 2012 Anti-Money Laundering (AML) Officer |
| Ms. Baumann also serves as AML Officer of other funds. She is Chief AML Officer of FMR LLC (diversified financial services company, 2012-present) and is an employee of Fidelity Investments. Previously, Ms. Baumann served as Vice President and Deputy Anti-Money Laundering Officer (2007-2012). |
Marc R. Bryant (1966) |
Year of Election or Appointment: 2015 Secretary and Chief Legal Officer (CLO) |
| Mr. Bryant also serves as Secretary and CLO of other funds. Mr. Bryant serves as CLO, Secretary, and Senior Vice President of Fidelity Management & Research Company (investment adviser firm, 2015-present) and FMR Co., Inc. (investment adviser firm, 2015-present); Secretary of Fidelity SelectCo, LLC (investment adviser firm, 2015-present) and Fidelity Investments Money Management, Inc. (investment adviser firm, 2015-present); and CLO of Fidelity Management & Research (Hong Kong) Limited (investment adviser firm, 2015-present). He is Senior Vice President and Deputy General Counsel of FMR LLC (diversified financial services company). Previously, Mr. Bryant served as Secretary and Chief Legal Officer of Fidelity Rutland Square Trust II (2010-2014) and Assistant Secretary of Fidelity's Fixed Income and Asset Allocation Funds (2013-2015). Prior to joining Fidelity Investments, Mr. Bryant served as a Senior Vice President and the Head of Global Retail Legal for AllianceBernstein L.P. (2006-2010), and as the General Counsel for ProFund Advisors LLC (2001-2006). |
William C. Coffey (1969) |
Year of Election or Appointment: 2009 Assistant Secretary |
| Mr. Coffey also serves as Assistant Secretary of other funds. He is Senior Vice President and Deputy General Counsel of FMR LLC (diversified financial services company, 2010-present), and is an employee of Fidelity Investments. Previously, Mr. Coffey served as Vice President and Associate General Counsel of FMR LLC (2005-2009). |
Jonathan Davis (1968) |
Year of Election or Appointment: 2010 Assistant Treasurer |
| Mr. Davis also serves as Assistant Treasurer of other funds, and is an employee of Fidelity Investments. Previously, Mr. Davis served as Vice President and Associate General Counsel of FMR LLC (diversified financial services company, 2003-2010). |
Adrien E. Deberghes (1967) |
Year of Election or Appointment: 2008 Deputy Treasurer |
| Mr. Deberghes also serves as an officer of other funds. He is an employee of Fidelity Investments (2008-present). Prior to joining Fidelity Investments, Mr. Deberghes was Senior Vice President of Mutual Fund Administration at State Street Corporation (2007-2008), Senior Director of Mutual Fund Administration at Investors Bank & Trust (2005-2007), and Director of Finance for Dunkin' Brands (2000-2005). |
Stephanie J. Dorsey (1969) |
Year of Election or Appointment: 2010 Assistant Treasurer |
| Ms. Dorsey also serves as an officer of other funds. She is an employee of Fidelity Investments (2008-present) and has served in other fund officer roles. Prior to joining Fidelity Investments, Ms. Dorsey served as Treasurer (2004-2008) of the JPMorgan Mutual Funds and Vice President (2004-2008) of JPMorgan Chase Bank. |
Howard J. Galligan III (1966) |
Year of Election or Appointment: 2014 Chief Financial Officer |
| Mr. Galligan also serves as Chief Financial Officer of other funds. Mr. Galligan serves as President of Fidelity Pricing and Cash Management Services (FPCMS) (2014-present) and as a Director of Strategic Advisers, Inc. (investment adviser firm, 2008-present). Previously, Mr. Galligan served as Chief Administrative Officer of Asset Management (2011-2014) and Chief Operating Officer and Senior Vice President of Investment Support for Strategic Advisers, Inc. (2003-2011). |
Scott C. Goebel (1968) |
Year of Election or Appointment: 2015 Vice President |
| Mr. Goebel serves as Vice President of other funds and is an employee of Fidelity Investments (2001-present). Previously, Mr. Goebel served as Secretary of Fidelity SelectCo, LLC (investment adviser firm, 2013-2015), Fidelity Investments Money Management, Inc. (FIMM) (investment adviser firm, 2010-2015), and Fidelity Research and Analysis Company (FRAC) (investment adviser firm, 2010-2015); General Counsel, Secretary, and Senior Vice President of Fidelity Management & Research Company (investment adviser firm, 2008-2015) and FMR Co., Inc. (investment adviser firm, 2008-2015); Assistant Secretary of Fidelity Management & Research (Japan) Limited (investment adviser firm, 2008-2015) and FMR Investment Management (U.K.) Limited (investment adviser firm, 2008-2015); Chief Legal Officer (CLO) of Fidelity Management & Research (Hong Kong) Limited (investment adviser firm, 2008-2015); Secretary and CLO of certain Fidelity funds (2008-2015); Assistant Secretary of FIMM (2008-2010), FRAC (2008-2010), and certain funds (2007-2008); and as Vice President and Secretary of Fidelity Distributors Corporation (FDC) (2005-2007). |
Thomas C. Hense (1964) |
Year of Election or Appointment: 2008, 2010, or 2015 Vice President |
| Mr. Hense serves as Vice President of Fidelity Advisor Multi-Asset Income Fund (2015) and other funds (High Income (2008), Small Cap (2008), and Value (2010) funds), and is an employee of Fidelity Investments (1993-present). Previously, Mr. Hense served as a portfolio manager for Fidelity's Institutional Money Management Group (Pyramis) (2003-2008). |
Brian B. Hogan (1964) |
Year of Election or Appointment: 2009 Vice President |
| Mr. Hogan also serves as Trustee or Vice President of other funds. Mr. Hogan serves as a Director of Fidelity SelectCo, LLC (investment adviser firm, 2014-present) and President of the Equity Division of FMR (investment adviser firm, 2009-present). Previously, Mr. Hogan served as Senior Vice President, Equity Research of FMR (2006-2009) and as a portfolio manager. |
Chris Maher (1972) |
Year of Election or Appointment: 2013 Assistant Treasurer |
| Mr. Maher serves as Assistant Treasurer of other funds. Mr. Maher is Vice President of Valuation Oversight and is an employee of Fidelity Investments. Previously, Mr. Maher served as Vice President of Asset Management Compliance (2013), Vice President of the Program Management Group of FMR (investment adviser firm, 2010-2013), and Vice President of Valuation Oversight (2008-2010). |
Kenneth B. Robins (1969) |
Year of Election or Appointment: 2008 President and Treasurer |
| Mr. Robins also serves as an officer of other funds. Mr. Robins serves as Executive Vice President of Fidelity Investments Money Management, Inc. (FIMM) (investment adviser firm, 2013-present) and is an employee of Fidelity Investments (2004-present). Previously, Mr. Robins served in other fund officer roles. |
Stacie M. Smith (1974) |
Year of Election or Appointment: 2013 Deputy Treasurer |
| Ms. Smith also serves as an officer of other funds. She is an employee of Fidelity Investments (2009-present) and has served in other fund officer roles. Prior to joining Fidelity Investments, Ms. Smith served as Senior Audit Manager of Ernst & Young LLP (1996-2009). |
Renee Stagnone (1975) |
Year of Election or Appointment: 2013 Deputy Treasurer |
| Ms. Stagnone also serves as Deputy Treasurer of other funds. Ms. Stagnone is an employee of Fidelity Investments (1997-present). |
Linda J. Wondrack (1964) |
Year of Election or Appointment: 2014 Chief Compliance Officer |
| Ms. Wondrack also serves as Chief Compliance Officer of other funds. Ms. Wondrack is Executive Vice President and head of the Ethics Office and Asset Management Compliance for Fidelity Investments (2012-present). Ms. Wondrack also serves as Chief Compliance Officer of Fidelity SelectCo, LLC (investment adviser firm, 2014-present); Chief Compliance Officer of Impresa Management LLC (2013-present); and Chief Compliance Officer of FMR Co., Inc. (investment adviser firm), Fidelity Investments Money Management, Inc. (investment adviser firm), Fidelity Management & Research (Japan) Limited (investment adviser firm), FMR Investment Management (U.K.) Limited (investment adviser firm), Fidelity Management & Research (Hong Kong) (investment adviser firm), Fidelity Management & Research Company (investment adviser firm), FIAM LLC (investment adviser firm), and Strategic Advisers, Inc. (investment adviser firm), Ballyrock Investment Advisors LLC, and Northern Neck Investors LLC (2012-present). Previously, Ms. Wondrack served as Senior Vice President and Chief Compliance Officer for Columbia Management Investment Advisers, LLC (2005-2012); Chief Compliance Officer for certain funds within the Columbia Family of Funds (2007-2012); and Senior Vice President of Compliance Risk Management at Bank of America (2005-2010). |
Joseph F. Zambello (1957) |
Year of Election or Appointment: 2011 Deputy Treasurer |
| Mr. Zambello also serves as Deputy Treasurer of other funds. Mr. Zambello is an employee of Fidelity Investments (1991-present). Previously, Mr. Zambello served as Vice President of the Program Management Group of FMR (investment adviser firm, 2009-2011) and Vice President of the Transfer Agent Oversight Group (2005-2009). |
Annual Report
The Board of Trustees of Fidelity Global Equity Income Fund voted to pay on December 07, 2015, to shareholders of record at the opening of business on December 04, 2015, a distribution of $0.162 per share derived from capital gains realized from sales of portfolio securities and a dividend of $0.037 per share from net investment income.
The fund hereby designates as a capital gain dividend with respect to the taxable year ended October 31, 2015, $1,122,389, or, if subsequently determined to be different, the net capital gain of such year.
A total of 0.08% of the dividends distributed during the fiscal year was derived from interest on U.S. Government securities which is generally exempt from state income tax.
The fund designates 17%, 72%, 72% and 72% of the dividends distributed in December 2014, April 2015, July 2015 and October 2015 respectively during the fiscal year as qualifying for the dividends-received deduction for corporate shareholders.
The fund designates 100% of the dividends distributed in during the fiscal year as amounts which may be taken into account as a dividend for the purposes of the maximum rate under section 1(h)(11) of the Internal Revenue Code.
The amounts per share which represent income derived from sources within, and taxes paid to, foreign countries or possessions of the United States are as follows:
Pay Date | Income | Taxes |
12/08/2014 | 0.0865 | 0.0047 |
04/04/2015 | 0.0421 | 0.0036 |
07/04/2015 | 0.0552 | 0.0047 |
10/05/2015 | 0.0234 | 0.0020 |
The fund will notify shareholders in January 2016 of amounts for use in preparing 2015 income tax returns.
Annual Report
Fidelity Global Equity Income Fund
Each year, the Board of Trustees, including the Independent Trustees (together, the Board), votes on the renewal of the management contract with Fidelity Management & Research Company (FMR) and the sub-advisory agreements (together, the Advisory Contracts) for the fund. The Board, assisted by the advice of fund counsel and Independent Trustees' counsel, requests and considers a broad range of information relevant to the renewal of the Advisory Contracts throughout the year.
The Board meets regularly and, at each of its meetings, covers an extensive agenda of topics and materials and considers factors that are relevant to its annual consideration of the renewal of the fund's Advisory Contracts, including the services and support provided to the fund and its shareholders. The Board has established various standing committees (Committees), each composed of and chaired by Independent Trustees with varying backgrounds, to which the Board has assigned specific subject matter responsibilities in order to enhance effective decision-making by the Board. The Board, acting directly and through its Committees, requests and receives information concerning the annual consideration of the renewal of the fund's Advisory Contracts. The Board also meets as needed to consider matters specifically related to the Board's annual consideration of the renewal of the Advisory Contracts. Members of the Board may also meet with trustees of other Fidelity funds through ad hoc joint committees to discuss certain matters relevant to all of the Fidelity funds.
At its July 2015 meeting, the Board unanimously determined to renew the fund's Advisory Contracts. In reaching its determination, the Board considered all factors it believed relevant, including (i) the nature, extent, and quality of the services to be provided to the fund and its shareholders (including the investment performance of the fund); (ii) the competitiveness of the fund's management fee and total expense ratio relative to peer funds; (iii) the total costs of the services to be provided by and the profits to be realized by Fidelity from its relationship with the fund; and (iv) the extent to which (if any) economies of scale exist and would be realized as the fund grows, and whether any economies of scale are appropriately shared with fund shareholders.
In considering whether to renew the Advisory Contracts for the fund, the Board reached a determination, with the assistance of fund counsel and Independent Trustees' counsel and through the exercise of its business judgment, that the renewal of the Advisory Contracts was in the best interests of the fund and its shareholders and that the compensation payable under the Advisory Contracts was fair and reasonable. The Board's decision to renew the Advisory Contracts was not based on any single factor, but rather was based on a comprehensive consideration of all the information provided to the Board at its meetings throughout the year. The Board, in reaching its determination to renew the Advisory Contracts, was aware that shareholders of the fund have a broad range of investment choices available to them, including a wide choice among funds offered by Fidelity's competitors, and that the fund's shareholders, who have the opportunity to review and weigh the disclosure provided by the fund in its prospectus and other public disclosures, have chosen to invest in this fund, which is part of the Fidelity family of funds.
Annual Report
Nature, Extent, and Quality of Services Provided. The Board considered Fidelity's staffing as it relates to the fund, including the backgrounds of investment personnel of Fidelity, and also considered the fund's investment objective, strategies, and related investment philosophy. The Independent Trustees also had discussions with senior management of Fidelity's investment operations and investment groups. The Board considered the structure of the portfolio manager compensation program and whether this structure provides appropriate incentives to act in the best interests of the fund. Additionally, the Board considered the portfolio managers' investments, if any, in the funds that they manage.
Resources Dedicated to Investment Management and Support Services. The Board and the Fund Oversight and Research Committees reviewed the general qualifications and capabilities of Fidelity's investment staff, including its size, education, experience, and resources, as well as Fidelity's approach to recruiting, training, managing, and compensating investment personnel. The Board noted that Fidelity has continued to increase the resources devoted to non-U.S. offices, including expansion of Fidelity's global investment organization. The Board also noted that Fidelity's analysts have extensive resources, tools and capabilities that allow them to conduct sophisticated quantitative and fundamental analysis, as well as credit analysis of issuers, counterparties and guarantors. Further, the Board considered that Fidelity's investment professionals have sufficient access to global information and data so as to provide competitive investment results over time, and that those professionals also have access to sophisticated tools that permit them to assess portfolio construction and risk and performance attribution characteristics continuously, as well as to transmit new information and research conclusions rapidly around the world. Additionally, in its deliberations, the Board considered Fidelity's trading, risk management, and compliance capabilities and resources, which are integral parts of the investment management process.
Shareholder and Administrative Services. The Board considered (i) the nature, extent, quality, and cost of advisory, administrative, and shareholder services performed by FMR, the sub-advisers (together with FMR, the Investment Advisers), and their affiliates under the Advisory Contracts and under separate agreements covering transfer agency, pricing and bookkeeping, and securities lending services for the fund; (ii) the nature and extent of the supervision of third party service providers, principally custodians and subcustodians; and (iii) the resources devoted to, and the record of compliance with, the fund's compliance policies and procedures. The Board also reviewed the allocation of fund brokerage, including allocations to brokers affiliated with the Investment Advisers, the use of brokerage commissions to pay fund expenses, and the use of "soft" commission dollars to pay for research services.
Annual Report
Board Approval of Investment Advisory Contracts and
Management Fees - continued
The Board noted that the growth of fund assets over time across the complex allows Fidelity to reinvest in the development of services designed to enhance the value or convenience of the Fidelity funds as investment vehicles. These services include 24-hour access to account information and market information through telephone representatives and over the Internet, investor education materials and asset allocation tools, and the expanded availability of Fidelity Investor Centers.
In 2014, the Board formed an ad hoc Committee on Transfer Agency Fees to review the variety of transfer agency fee structures throughout the industry and Fidelity's competitive positioning with respect to industry participants.
Investment in a Large Fund Family. The Board considered the benefits to shareholders of investing in a Fidelity fund, including the benefits of investing in a fund that is part of a large family of funds offering a variety of investment disciplines and providing a large variety of mutual fund investor services. The Board noted that Fidelity had taken, or had made recommendations that resulted in the Fidelity funds taking, a number of actions over the previous year that benefited particular funds, including (i) continuing to dedicate additional resources to investment research and to the support of the senior management team that oversees asset management; (ii) continuing efforts to enhance Fidelity's global research capabilities; (iii) launching new funds and making other enhancements to meet client needs; (iv) reducing management fees and total expenses for certain index funds and diversified international funds; (v) continuing to launch dedicated lower cost underlying funds to meet portfolio construction needs related to expanding underlying fund options for Fidelity funds of funds, specifically for the Freedom Fund product lines; (vi) rationalizing product lines and gaining increased efficiencies through fund mergers; (vii) launching active fixed-income exchange-traded funds; (viii) continuing to develop, acquire and implement systems and technology to improve services to the funds and information security and to increase efficiency; (ix) implementing investment enhancements to further strengthen Fidelity's target date product line to increase investors' probability of success in achieving their goals; (x) modifying the eligibility criteria for certain share classes to accommodate roll-over assets from employer-sponsored retirement plans; (xi) launching a new Class W of the Freedom Index Funds to attract and retain Fidelity record-kept retirement plan assets; and (xii) implementing changes to Fidelity's money market product line in response to recent money market regulatory reforms.
Investment Performance. The Board considered whether the fund has operated in accordance with its investment objective, as well as its record of compliance with its investment restrictions and its performance history.
Annual Report
The Board took into account discussions with representatives of the Investment Advisers about fund investment performance that occur at Board meetings throughout the year. In this regard the Board noted that as part of regularly scheduled fund reviews and other reports to the Board on fund performance, the Board considers annualized return information for the fund, for different time periods, measured against a securities market index ("benchmark index") and a peer group of funds with similar objectives ("peer group"), if any. In its evaluation of fund investment performance, the Board gave particular attention to information indicating changes in performance of certain Fidelity funds for specific time periods and discussed with the Investment Advisers the reasons for any overperformance or underperformance.
In addition to reviewing absolute and relative fund performance, the Independent Trustees periodically consider the appropriateness of fund performance metrics in evaluating the results achieved. In general, the Independent Trustees believe that fund performance should be evaluated based on net performance (after fees and expenses) of both the highest performing and lowest performing fund share classes, where applicable, compared to appropriate benchmark indices, over appropriate time periods that may include full market cycles, and compared to peer groups, as applicable, over the same periods, taking into account relevant factors including the following: general market conditions; issuer-specific information; and fund cash flows and other factors.
The Independent Trustees recognize that shareholders evaluate performance on a net basis over their own holding periods, for which one-, three-, and five-year periods are often used as a proxy. For this reason, the performance information reviewed by the Board also included net cumulative calendar year total return information for the fund and an appropriate benchmark index and peer group for the most recent one-year period, as shown below. Returns are shown compared to the 25th percentile (top of box, 75% beaten) and 75th percentile (bottom of box, 25% beaten) of the peer universe. Returns of the benchmark index are "net MA," i.e., adjusted for tax withholding rates applicable to U.S.-based funds organized as Massachusetts business trusts.
Annual Report
Board Approval of Investment Advisory Contracts and
Management Fees - continued
Fidelity Global Equity Income Fund
Based on its review, the Board concluded that the nature, extent, and quality of services provided to the fund under the Advisory Contracts should benefit the shareholders of the fund.
Competitiveness of Management Fee and Total Expense Ratio. The Board considered the fund's management fee and total expense ratio compared to "mapped groups" of competitive funds and classes created for the purpose of facilitating the Trustees' competitive analysis of management fees and total expenses. Fidelity creates "mapped groups" by combining similar Lipper investment objective categories that have comparable investment mandates. Combining Lipper investment objective categories aids the Board's management fee and total expense ratio comparisons by broadening the competitive group used for comparison.
Management Fee. The Board considered two proprietary management fee comparisons for the 12-month (or shorter) periods shown in basis points (BP) in the chart below. The group of Lipper funds used by the Board for management fee comparisons is referred to below as the "Total Mapped Group." The Total Mapped Group is broader than the Lipper peer group used by the Board for performance comparisons because the Total Mapped Group combines several Lipper investment objective categories while the Lipper peer group does not. The Total Mapped Group comparison focuses on a fund's standing in terms of gross management fees before expense reimbursements or caps relative to the total universe of funds with comparable investment mandates, regardless of whether their management fee structures also are comparable. Funds with comparable investment mandates offer exposure to similar types of securities. Funds with comparable management fee structures have similar management fee contractual arrangements (e.g., flat rate charged for advisory services, all-inclusive fee rate, etc.). "TMG %" represents the percentage of funds in the Total Mapped Group that had management fees that were lower than the fund's. For example, a hypothetical TMG % of 20% would mean that 80% of the funds in the Total Mapped Group had higher, and 20% had lower, management fees than the fund. The fund's actual TMG %s and the number of funds in the Total Mapped Group are in the chart below. The "Asset-Size Peer Group" (ASPG) comparison focuses on a fund's standing relative to a subset of non-Fidelity funds within the Total Mapped Group that are similar in size and management fee structure without taking into account performance adjustments, if any. For example, if a fund is in the first quartile of the ASPG, the fund's management fee ranks in the least expensive or lowest 25% of funds in the ASPG. The ASPG represents at least 15% of the funds in the Total Mapped Group with comparable asset size and management fee structures, subject to a minimum of 50 funds (or all funds in the Total Mapped Group if fewer than 50). Additional information, such as the ASPG quartile in which the fund's management fee rate ranked, is also included in the chart and considered by the Board.
Annual Report
Fidelity Global Equity Income Fund
The Board noted that the fund's management fee rate ranked below the median of its Total Mapped Group and below the median of its ASPG for 2014.
The Board noted that, in 2014, the ad hoc Committee on Group Fee was formed by it and other Fidelity fund boards to conduct an in-depth review of the "group fee" component of the management fee of funds with such management fee structures. Committee focus included the mechanics of the group fee, the competitive landscape of group fee structures, Fidelity funds with no group fee component and investment products not included in group fee assets. The Board also considered that, for funds subject to the group fee, FMR agreed to voluntarily waive fees over a specified period of time in amounts designed to account for assets converted from certain funds to certain collective investment trusts.
Annual Report
Board Approval of Investment Advisory Contracts and
Management Fees - continued
The Board also noted that, in 2013, the ad hoc Committee on Management Fees was formed to conduct an in-depth review of the management fee rates of Fidelity's active equity mutual funds. The Committee focused on the following areas: (i) standard fee structures; (ii) research consumption and trading evolution; (iii) management fee competitiveness/profitability by category; and (iv) factors that drive institutional pricing.
Based on its review, the Board concluded that the fund's management fee is fair and reasonable in light of the services that the fund receives and the other factors considered.
Total Expense Ratio. In its review of the fund's total expense ratio, the Board considered the fund's management fee as well as other fund expenses, such as transfer agent fees, pricing and bookkeeping fees, and custodial, legal, and audit fees. The Board also noted that Fidelity may agree to waive fees and expenses from time to time, and the extent to which, if any, it has done so for the fund. As part of its review, the Board also considered the current and historical total expense ratios of the fund compared to competitive fund median expenses. The fund is compared to those funds and classes in the Total Mapped Group (used by the Board for management fee comparisons) that have a similar sales load structure.
The Board noted that the fund's total expense ratio ranked below its competitive median for 2014.
The Board further considered that FMR contractually agreed to reimburse the fund to the extent that total expenses (excluding interest, certain taxes, certain securities lending costs, brokerage commissions, extraordinary expenses, and acquired fund fees and expenses, if any), as a percentage of average net assets, exceed 1.20% through December 31, 2015.
Fees Charged to Other Fidelity Clients. The Board also considered Fidelity fee structures and other information with respect to clients of Fidelity, such as other funds advised or subadvised by Fidelity, pension plan clients, and other institutional clients with similar mandates. The Board noted the findings of the 2013 ad hoc joint committee (created with the board of other Fidelity funds), which reviewed and compared Fidelity's institutional investment advisory business with its business of providing services to the Fidelity funds, including the differences in services provided, fees charged, and costs incurred, as well as competition in their respective marketplaces.
Annual Report
Based on its review of total expense ratios and fees charged to other Fidelity clients, the Board concluded that the fund's total expense ratio was reasonable in light of the services that the fund and its shareholders receive and the other factors considered.
Costs of the Services and Profitability. The Board considered the revenues earned and the expenses incurred by Fidelity in conducting the business of developing, marketing, distributing, managing, administering and servicing the fund and servicing the fund's shareholders. The Board also considered the level of Fidelity's profits in respect of all the Fidelity funds.
On an annual basis, Fidelity presents to the Board information about the profitability of its relationship with the fund. Fidelity calculates profitability information for each fund, as well as aggregate profitability information for groups of Fidelity funds and all Fidelity funds, using a series of detailed revenue and cost allocation methodologies which originate with the books and records of Fidelity on which Fidelity's audited financial statements are based. The Audit Committee of the Board reviews any significant changes from the prior year's methodologies.
PricewaterhouseCoopers LLP (PwC), independent registered public accounting firm and auditor to Fidelity and certain Fidelity funds, has been engaged annually by the Board as part of the Board's assessment of Fidelity's profitability analysis. PwC's engagement includes the review and assessment of the methodologies used by Fidelity in determining the revenues and expenses attributable to Fidelity's mutual fund business, and completion of agreed-upon procedures in respect of the mathematical accuracy of fund profitability and its conformity to established allocation methodologies. After considering PwC's reports issued under the engagement and information provided by Fidelity, the Board concluded that while other allocation methods may also be reasonable, Fidelity's profitability methodologies are reasonable in all material respects.
The Board also reviewed Fidelity's non-fund businesses and fall-out benefits related to the mutual fund business as well as cases where Fidelity's affiliates may benefit from or be related to the fund's business.
The Board considered the costs of the services provided by and the profits realized by Fidelity in connection with the operation of the fund and was satisfied that the profitability was not excessive.
Economies of Scale. The Board considered whether there have been economies of scale in respect of the management of the Fidelity funds, whether the Fidelity funds (including the fund) have appropriately benefited from any such economies of scale, and whether there is potential for realization of any further economies of scale. The Board considered the extent to which the fund will benefit from economies of scale as assets grow through increased services to the fund, through waivers or reimbursements, or through fee or expense ratio reductions. The Board also noted that in 2013, it and the boards of other Fidelity funds created an ad hoc committee (the Economies of Scale Committee) to analyze whether Fidelity attains economies of scale in respect of the management and servicing of the Fidelity funds, whether the Fidelity funds have appropriately benefited from such economies of scale, and whether there is potential for realization of any further economies of scale.
Annual Report
Board Approval of Investment Advisory Contracts and
Management Fees - continued
The Board recognized that the fund's management contract incorporates a "group fee" structure, which provides for lower group fee rates as total group assets increase, and for higher group fee rates as total group assets decrease (with "group assets" defined to include fund assets under FMR's management plus sector fund assets previously under FMR's management and currently managed by Fidelity SelectCo, LLC). FMR calculates the group fee rates based on a tiered asset "breakpoint" schedule that varies based on asset class. The Board considered that the group fee is designed to deliver the benefits of economies of scale to fund shareholders when total Fidelity fund assets increase, even if assets of any particular fund are unchanged or have declined, because some portion of Fidelity's costs are attributable to services provided to all Fidelity funds, and all funds benefit if those costs can be allocated among more assets. The Board concluded that, given the group fee structure, fund shareholders will benefit from lower management fees as group assets increase at the fund complex level, regardless of whether Fidelity achieves any such economies of scale.
The Board concluded, taking into account the analysis of the Economies of Scale Committee, that economies of scale, if any, are being appropriately shared between fund shareholders and Fidelity.
Additional Information Requested by the Board. In order to develop fully the factual basis for consideration of the Fidelity funds' Advisory Contracts, the Board requested and received additional information on certain topics, including: (i) fund performance trends and Fidelity's long-term strategies for certain funds; (ii) the various share classes employed by Fidelity and the attributes of each class, together with similar information on the distribution and servicing payments made by Fidelity or the funds to third-party participants in the distribution channels; (iii) fund profitability, and fund performance in relation to fund profitability; (iv) the methodology with respect to evaluating competitive fund data and peer group classifications and fee comparisons; (v) annual fund profitability margins, with particular focus on certain funds with negative margins; (vi) the realization of fall-out benefits in certain Fidelity business units; (vii) economies of scale and the way in which they are shared with fund shareholders; (viii) Fidelity's group fee structures, including the group fee schedule of breakpoints; (ix) the impact of cost containment measures on the funds; and (x) the transfer agent fee structure.
Annual Report
Based on its evaluation of all of the conclusions noted above, and after considering all factors it believed relevant, the Board concluded that the advisory fee structures are fair and reasonable, and that the fund's Advisory Contracts should be renewed.
Annual Report
Investment Adviser
Fidelity Management & Research Company
Boston, MA
Investment Sub-Advisers
FMR Co., Inc.
FMR Investment Management
(U.K.) Limited
Fidelity Management & Research
(Japan) Limited
Fidelity Management & Research
(Hong Kong) Limited
FIL Investment Advisors
FIL Investment Advisors (UK) Limited
FIL Investments (Japan) Limited
General Distributor
Fidelity Distributors Corporation
Smithfield, RI
Transfer and Service Agents
Fidelity Investments Institutional
Operations Company, Inc.
Boston, MA
Fidelity Service Company, Inc.
Boston, MA
Custodian
JPMorgan Chase Bank
New York, NY
The Fidelity Telephone Connection
Mutual Fund 24-Hour Service
Exchanges/Redemptions
and Account Assistance 1-800-544-6666
Product Information 1-800-544-6666
Retirement Accounts 1-800-544-4774
(8 a.m. - 9 p.m.)
TDD Service 1-800-544-0118
for the deaf and hearing impaired
(9 a.m. - 9 p.m. Eastern time)
Fidelity Automated Service
Telephone (FAST®)
1-800-544-5555

Automated line for quickest service
(Fidelity Investment logo)(registered trademark)
Corporate Headquarters
245 Summer St., Boston, MA 02210
www.fidelity.com
GED-UANN-1215
1.938161.103
ContentsPerformance: The Bottom LineManagement's Discussion of Fund PerformanceShareholder Expense ExampleInvestment Changes (Unaudited)Investments October 31, 2015Financial StatementsNotes to Financial StatementsReport of Independent Registered Public Accounting FirmTrustees and OfficersDistributions (Unaudited)Board Approval of Investment Advisory Contracts and Management Fees
(Fidelity Investment logo)(registered trademark)
Fidelity Advisor®
Total Emerging Markets
Fund - Class I
(formerly Institutional Class)
Annual Report
October 31, 2015
(Fidelity Cover Art)
Class I is a
class of Fidelity® Total
Emerging Markets Fund
Contents
Performance | (Click Here) | How the fund has done over time. |
Management's Discussion of Fund Performance | (Click Here) | The Portfolio Manager's review of fund performance and strategy. |
Shareholder Expense Example | (Click Here) | An example of shareholder expenses. |
Investment Changes | (Click Here) | A summary of major shifts in the fund's investments over the past six months. |
Investments | (Click Here) | A complete list of the fund's investments with their market values. |
Financial Statements | (Click Here) | Statements of assets and liabilities, operations, and changes in net assets, as well as financial highlights. |
Notes | (Click Here) | Notes to the financial statements. |
Report of Independent Registered Public Accounting Firm | (Click Here) | |
Trustees and Officers | (Click Here) | |
Distributions | (Click Here) | |
Board Approval of Investment Advisory Contracts and Management Fees | (Click Here) | |
To view a fund's proxy voting guidelines and proxy voting record for the 12-month period ended June 30, visit http://www.fidelity.com/proxyvotingresults or visit the Securities and Exchange Commission's (SEC) web site at http://www.sec.gov. You may also call 1-877-208-0098 to request a free copy of the proxy voting guidelines.
Standard & Poor's, S&P and S&P 500 are registered service marks of The McGraw-Hill Companies, Inc. and have been licensed for use by Fidelity Distributors Corporation.
Other third-party marks appearing herein are the property of their respective owners.
All other marks appearing herein are registered or unregistered trademarks or service marks of FMR LLC or an affiliated company. © 2015 FMR LLC. All rights reserved.
Annual Report
This report and the financial statements contained herein are submitted for the general information of the shareholders of the fund. This report is not authorized for distribution to prospective investors in the fund unless preceded or accompanied by an effective prospectus.
A fund files its complete schedule of portfolio holdings with the SEC for the first and third quarters of each fiscal year on Form N-Q. Forms N-Q are available on the SEC's web site at http://www.sec.gov. A fund's Forms N-Q may be reviewed and copied at the SEC's Public Reference Room in Washington, DC. Information regarding the operation of the SEC's Public Reference Room may be obtained by calling 1-800-SEC-0330. For a complete list of a fund's portfolio holdings, view the most recent holdings listing, semiannual report, or annual report on Fidelity's web site at http://www.fidelity.com, http://www.advisor.fidelity.com, or http://www.401k.com, as applicable.
NOT FDIC INSURED • MAY LOSE VALUE • NO BANK GUARANTEE
Neither the fund nor Fidelity Distributors Corporation is a bank.
Annual Report
Average annual total return reflects the change in the value of an investment, assuming reinvestment of the class' distributions from dividend income and capital gains (the profits earned upon the sale of securities that have grown in value, if any) and assuming a constant rate of performance each year. The $10,000 table and the fund's returns do not reflect the deduction of taxes that a shareholder would pay on fund distributions or the redemption of fund shares. During periods of reimbursement by Fidelity, a fund's total return will be greater than it would be had the reimbursement not occurred. How a fund did yesterday is no guarantee of how it will do tomorrow.
Average Annual Total Returns
Periods ended October 31, 2015 | Past 1
year | Life of
fund A |
Class I | -8.74% | 2.35% |
A From November 1, 2011.
$10,000 Over Life of Fund
Let's say hypothetically that $10,000 was invested in Fidelity Advisor® Total Emerging Markets Fund - Class I on November 1, 2011, when the fund started. The chart shows how the value of your investment would have changed, and also shows how the MSCI Emerging Markets Index performed over the same period.
Annual Report
Fidelity Total Emerging Markets Fund
Market Recap: Following a tough time in August and September wherein a collapse in commodities prices hurt resources-related sectors and geographies, global equities rebounded in October to finish flat for the year ending October 31, 2015. The MSCI ACWI (All Country World Index) Index returned 0.35% for the period. Among market sectors, energy (-22%) and materials (-12%) declined sharply, whereas consumer discretionary (+13%) saw a gain driven largely by demand in the U.S. (+5%). Commodity prices and producers remained under pressure, largely from economic deceleration in China (-1%), a leading consumer of raw materials. This effect was exacerbated by U.S. dollar strength relative to global currencies, which weighed on commodities priced in dollars and acutely impacted equity returns within regions most exposed to resources prices. The emerging-markets (EM) group, for example, returned -15% this period. Canada, a significant energy producer, returned -17%. Net energy consumer Japan (+9%) proved the best-performing region by far. In fixed income, the Barclays Global Aggregate GDP Weighted Index returned -3.85% for the year, despite a modest gain from the U.S., the world's largest bond market. Investors continued to seek safe haven in U.S. bonds amid economic weakness throughout much of Europe and parts of Asia. EM and Canadian debt roughly paralleled equity underperformance.
Comments from Lead Portfolio Manager John Carlson: For the year, the fund's share classes (excluding sales charges, if applicable) turned in high-single-digit declines, straddling the -8.76% return of the Fidelity Total Emerging Markets Composite Index. For the full year, the fund held an overweighting, on average, in equity and a corresponding underweighting in debt versus the Composite index, which, in aggregate, had only a marginal positive influence on relative performance. Security selection within the fund's equity subportfolio was the biggest contributor. From a geographical perspective, equity investments in India, Malaysia and Mexico were helpful. Among sectors, picks in telecommunication services, consumer staples, information technology and materials lifted performance most, whereas choices in health care hurt. Looking at individual stocks, our substantial overweighting in China Life Insurance was the equity sleeve's top relative contributor this period. Conversely, an overweighting in underperforming Daewoo International, South Korea's largest trading company, was the fund's biggest individual detractor. The stock underperformed due to the businesses' link to global oil prices, which fell by nearly 50% during the period.
Note to shareholders: Xiatong Zhao was named Co-Manager of the fund, effective October 1, 2015.
The views expressed above reflect those of the portfolio manager(s) only through the end of the period as stated on the cover of this report and do not necessarily represent the views of Fidelity or any other person in the Fidelity organization. Any such views are subject to change at any time based upon market or other conditions and Fidelity disclaims any responsibility to update such views. These views may not be relied on as investment advice and, because investment decisions for a Fidelity fund are based on numerous factors, may not be relied on as an indication of trading intent on behalf of any Fidelity fund.
Annual Report
Fidelity Total Emerging Markets Fund
Shareholder Expense Example
As a shareholder of the Fund, you incur two types of costs: (1) transaction costs, including sales charges (loads) on purchase payments or redemption proceeds, redemption fees and (2) ongoing costs, including management fees, distribution and/or service (12b-1) fees and other Fund expenses. This Example is intended to help you understand your ongoing costs (in dollars) of investing in the Fund and to compare these costs with the ongoing costs of investing in other mutual funds.
The Example is based on an investment of $1,000 invested at the beginning of the period and held for the entire period (May 1, 2015 to October 31, 2015).
Actual Expenses
The first line of the accompanying table for each class of the Fund provides information about actual account values and actual expenses. You may use the information in this line, together with the amount you invested, to estimate the expenses that you paid over the period. Simply divide your account value by $1,000.00 (for example, an $8,600 account value divided by $1,000.00 = 8.6), then multiply the result by the number in the first line for a class of the Fund under the heading entitled "Expenses Paid During Period" to estimate the expenses you paid on your account during this period. A small balance maintenance fee of $12.00 that is charged once a year may apply for certain accounts with a value of less than $2,000. This fee is not included in the table below. If it was, the estimate of expenses you paid during the period would be higher, and your ending account value lower, by this amount. In addition, the Fund, as a shareholder in the underlying Fidelity Central Funds, will indirectly bear its pro-rata share of the fees and expenses incurred by the underlying Fidelity Central Funds. These fees and expenses are not included in the Fund's annualized expense ratio used to calculate the expense estimate in the table below.
Hypothetical Example for Comparison Purposes
The second line of the accompanying table for each class of the Fund provides information about hypothetical account values and hypothetical expenses based on a Class' actual expense ratio and an assumed rate of return of 5% per year before expenses, which is not the Class' actual return. The hypothetical account values and expenses may not be used to estimate the actual ending account balance or expenses you paid for the period. You may use this information to compare the ongoing costs of investing in the Fund and other funds. To do so, compare this 5% hypothetical example with the 5% hypothetical examples that appear in the shareholder reports of the other funds. A small balance maintenance fee of $12.00 that is charged once a year may apply for certain accounts with a value of less than $2,000. This fee is not included in the table below. If it was, the estimate of expenses you paid during the period would be higher, and your ending account value lower, by this amount. In addition, the Fund, as a shareholder in the underlying Fidelity Central Funds, will indirectly bear its pro-rata share of the fees and expenses incurred by the underlying Fidelity Central Funds. These fees and expenses are not included in the Fund's annualized expense ratio used to calculate the expense estimate in the table below.
Please note that the expenses shown in the table are meant to highlight your ongoing costs only and do not reflect any transaction costs. Therefore, the second line of the table is useful in comparing ongoing costs only, and will not help you determine the relative total costs of owning different funds. In addition, if these transactional costs were included, your costs would have been higher.
Annual Report
Shareholder Expense Example - continued
| Annualized
Expense RatioB | Beginning
Account Value
May 1, 2015 | Ending
Account Value
October 31, 2015 | Expenses Paid
During PeriodC
May 1, 2015 to
October 31, 2015 |
Class A | 1.65% | | | |
Actual | | $ 1,000.00 | $ 900.00 | $ 7.90 |
HypotheticalA | | $ 1,000.00 | $ 1,016.89 | $ 8.39 |
Class T | 1.90% | | | |
Actual | | $ 1,000.00 | $ 898.30 | $ 9.09 |
HypotheticalA | | $ 1,000.00 | $ 1,015.63 | $ 9.65 |
Class C | 2.40% | | | |
Actual | | $ 1,000.00 | $ 896.00 | $ 11.47 |
HypotheticalA | | $ 1,000.00 | $ 1,013.11 | $ 12.18 |
Total Emerging Markets | 1.40% | | | |
Actual | | $ 1,000.00 | $ 901.00 | $ 6.71 |
HypotheticalA | | $ 1,000.00 | $ 1,018.15 | $ 7.12 |
Class I | 1.40% | | | |
Actual | | $ 1,000.00 | $ 900.20 | $ 6.71 |
HypotheticalA | | $ 1,000.00 | $ 1,018.15 | $ 7.12 |
A 5% return per year before expenses
B Annualized expense ratio reflects expenses net of applicable fee waivers.
C Expenses are equal to each Class' annualized expense ratio, multiplied by the average account value over the period, multiplied by 184/365 (to reflect the one-half year period).
Annual Report
Fidelity Total Emerging Markets Fund
Investment Changes (Unaudited)
Top Five Stocks as of October 31, 2015 |
| % of fund's
net assets | % of fund's net assets
6 months ago |
Taiwan Semiconductor Manufacturing Co. Ltd. (Taiwan, Semiconductors & Semiconductor Equipment) | 2.0 | 2.2 |
Tencent Holdings Ltd. (Cayman Islands, Internet Software & Services) | 1.7 | 1.5 |
Samsung Electronics Co. Ltd. (Korea (South), Technology Hardware, Storage & Peripherals) | 1.4 | 2.4 |
Industrial & Commercial Bank of China Ltd. (H Shares) (China, Banks) | 1.2 | 1.3 |
Naspers Ltd. Class N (South Africa, Media) | 1.2 | 1.1 |
| 7.5 | |
Top Five Market Sectors as of October 31, 2015 |
| % of fund's
net assets | % of fund's net assets
6 months ago |
Financials | 17.5 | 19.0 |
Energy | 14.9 | 13.6 |
Information Technology | 10.9 | 12.5 |
Consumer Staples | 5.7 | 5.2 |
Consumer Discretionary | 5.7 | 5.5 |
Top Five Countries as of October 31, 2015 |
(excluding cash equivalents) | % of fund's
net assets | % of fund's net assets
6 months ago |
Korea (South) | 9.3 | 9.6 |
Cayman Islands | 7.0 | 6.0 |
China | 6.3 | 7.1 |
Mexico | 6.2 | 5.8 |
India | 5.3 | 6.3 |
Percentages are adjusted for the effect of open futures contracts, if applicable. |
Annual Report
Fidelity Total Emerging Markets Fund
Investments October 31, 2015
Showing Percentage of Net Assets
Common Stocks - 52.1% |
| Shares | | Value |
Argentina - 0.3% |
Telecom Argentina SA Class B sponsored ADR | 2,280 | | $ 44,483 |
YPF SA Class D sponsored ADR | 5,900 | | 126,024 |
TOTAL ARGENTINA | | 170,507 |
Austria - 0.1% |
Erste Group Bank AG (a) | 3,133 | | 91,884 |
Bermuda - 0.7% |
Aquarius Platinum Ltd. (Australia) (a) | 312,441 | | 54,187 |
China Resource Gas Group Ltd. | 24,000 | | 65,833 |
Credicorp Ltd. (United States) | 1,319 | | 149,284 |
GP Investments Ltd. Class A (depositary receipt) (a) | 30,222 | | 55,953 |
Shangri-La Asia Ltd. | 122,000 | | 111,650 |
TOTAL BERMUDA | | 436,907 |
Brazil - 1.6% |
B2W Companhia Global do Varejo (a) | 7,594 | | 28,710 |
BB Seguridade Participacoes SA | 15,070 | | 103,943 |
CCR SA | 33,000 | | 103,709 |
Cielo SA | 14,740 | | 139,926 |
Companhia de Saneamento de Minas Gerais | 13,546 | | 45,662 |
Cosan SA Industria e Comercio | 15,733 | | 100,806 |
Direcional Engenharia SA | 50,700 | | 46,538 |
Fibria Celulose SA | 15,200 | | 207,472 |
FPC Par Corretora de Seguros | 23,400 | | 65,469 |
Minerva SA (a) | 42,300 | | 139,956 |
Smiles SA | 8,400 | | 65,561 |
TOTAL BRAZIL | | 1,047,752 |
British Virgin Islands - 0.1% |
Mail.Ru Group Ltd. GDR (Reg. S) (a) | 2,586 | | 50,427 |
Canada - 0.3% |
Goldcorp, Inc. | 3,000 | | 38,383 |
Pan American Silver Corp. | 13,700 | | 103,709 |
Torex Gold Resources, Inc. (a) | 36,200 | | 34,329 |
TOTAL CANADA | | 176,421 |
Cayman Islands - 5.3% |
51job, Inc. sponsored ADR (a) | 2,500 | | 84,525 |
58.com, Inc. ADR (a) | 5,750 | | 301,818 |
AAC Technology Holdings, Inc. | 11,000 | | 69,760 |
Alibaba Group Holding Ltd. sponsored ADR (a) | 4,700 | | 394,001 |
Baidu.com, Inc. sponsored ADR (a) | 200 | | 37,494 |
Common Stocks - continued |
| Shares | | Value |
Cayman Islands - continued |
Bitauto Holdings Ltd. ADR (a) | 1,100 | | $ 35,090 |
China ZhengTong Auto Services Holdings Ltd. | 146,160 | | 65,410 |
Ctrip.com International Ltd. sponsored ADR (a) | 1,200 | | 111,564 |
ENN Energy Holdings Ltd. | 33,773 | | 193,473 |
Eurasia Drilling Co. Ltd. GDR (Reg. S) | 4,900 | | 55,615 |
Haitian International Holdings Ltd. | 28,000 | | 48,992 |
Hengan International Group Co. Ltd. | 16,500 | | 178,174 |
Leju Holdings Ltd. ADR | 6,448 | | 46,426 |
NetEase, Inc. sponsored ADR | 100 | | 14,453 |
Qunar Cayman Islands Ltd. sponsored ADR (a) | 4,500 | | 218,430 |
SINA Corp. (a) | 800 | | 38,112 |
Sino Biopharmaceutical Ltd. | 76,000 | | 94,445 |
SouFun Holdings Ltd. ADR | 4,500 | | 31,815 |
Sunny Optical Technology Group Co. Ltd. | 31,000 | | 72,079 |
Tencent Holdings Ltd. | 60,900 | | 1,147,927 |
Uni-President China Holdings Ltd. | 297,600 | | 243,742 |
TOTAL CAYMAN ISLANDS | | 3,483,345 |
Chile - 1.1% |
Compania Cervecerias Unidas SA sponsored ADR | 7,100 | | 170,187 |
Empresas CMPC SA | 50,670 | | 124,852 |
Enersis SA | 412,664 | | 109,200 |
Inversiones La Construccion SA | 8,038 | | 91,358 |
Vina Concha y Toro SA | 123,422 | | 210,239 |
TOTAL CHILE | | 705,836 |
China - 5.8% |
Anhui Conch Cement Co. Ltd. (H Shares) | 60,000 | | 183,078 |
BBMG Corp. (H Shares) | 267,500 | | 187,458 |
China Cinda Asset Management Co. Ltd. (H Shares) | 214,840 | | 83,529 |
China Life Insurance Co. Ltd. (H Shares) | 107,260 | | 386,789 |
China Longyuan Power Grid Corp. Ltd. (H Shares) | 69,970 | | 63,970 |
China Machinery Engineering Co. (H Shares) | 80,000 | | 69,432 |
China Pacific Insurance (Group) Co. Ltd. (H Shares) | 121,580 | | 484,301 |
China Petroleum & Chemical Corp. (H Shares) | 152,000 | | 109,568 |
China Suntien Green Energy Corp. Ltd. (H Shares) | 332,690 | | 59,316 |
China Telecom Corp. Ltd. (H Shares) | 433,059 | | 225,893 |
Daqin Railway Co. Ltd. (A Shares) | 60,300 | | 86,883 |
Industrial & Commercial Bank of China Ltd. (H Shares) | 1,271,260 | | 806,368 |
Inner Mongoli Yili Industries Co. Ltd. | 74,000 | | 186,138 |
Kweichow Moutai Co. Ltd. | 9,020 | | 304,549 |
Maanshan Iron & Steel Ltd. (H Shares) (a) | 244,000 | | 52,236 |
Common Stocks - continued |
| Shares | | Value |
China - continued |
PetroChina Co. Ltd. (H Shares) | 136,000 | | $ 106,475 |
Qingdao Haier Co. Ltd. | 143,700 | | 218,763 |
Zhengzhou Yutong Bus Co. Ltd. | 31,500 | | 108,495 |
Zhuzhou CSR Times Electric Co. Ltd. (H Shares) | 17,000 | | 110,049 |
TOTAL CHINA | | 3,833,290 |
Colombia - 0.2% |
Bancolombia SA sponsored ADR | 3,695 | | 127,921 |
Egypt - 0.1% |
Citadel Capital Corp. (a) | 170,400 | | 39,045 |
Greece - 0.3% |
Public Power Corp. of Greece | 2,506 | | 14,440 |
Titan Cement Co. SA (Reg.) | 7,400 | | 162,341 |
TOTAL GREECE | | 176,781 |
Hong Kong - 3.5% |
AIA Group Ltd. | 24,380 | | 142,948 |
China Mobile Ltd. | 15,110 | | 181,167 |
China Mobile Ltd. sponsored ADR | 9,480 | | 571,739 |
China Resources Beer Holdings Co. Ltd. | 74,000 | | 139,725 |
China Resources Power Holdings Co. Ltd. | 45,029 | | 101,863 |
China Unicom Ltd. | 10,990 | | 13,393 |
China Unicom Ltd. sponsored ADR | 5,406 | | 66,386 |
CNOOC Ltd. | 317,000 | | 358,055 |
CNOOC Ltd. sponsored ADR | 70 | | 7,958 |
Far East Horizon Ltd. | 392,564 | | 326,525 |
Lenovo Group Ltd. | 52,000 | | 48,315 |
Sinotruk Hong Kong Ltd. | 151,500 | | 63,060 |
Techtronic Industries Co. Ltd. | 66,000 | | 241,275 |
TOTAL HONG KONG | | 2,262,409 |
India - 5.3% |
Adani Ports & Special Economic Zone (a) | 26,087 | | 117,785 |
Axis Bank Ltd. (a) | 37,136 | | 268,957 |
Bharti Airtel Ltd. | 9,413 | | 50,142 |
Bharti Infratel Ltd. | 24,983 | | 148,382 |
Coal India Ltd. | 53,331 | | 260,304 |
Edelweiss Financial Services Ltd. | 62,457 | | 56,685 |
Eicher Motors Ltd. (a) | 450 | | 121,876 |
Grasim Industries Ltd. | 3,862 | | 219,209 |
ITC Ltd. | 69,734 | | 356,127 |
JK Cement Ltd. | 10,894 | | 113,885 |
Common Stocks - continued |
| Shares | | Value |
India - continued |
Larsen & Toubro Ltd. (a) | 5,849 | | $ 125,975 |
LIC Housing Finance Ltd. (a) | 14,923 | | 108,960 |
Lupin Ltd. | 9,017 | | 265,491 |
NTPC Ltd. | 13,829 | | 28,058 |
Oil & Natural Gas Corp. Ltd. | 31,237 | | 117,840 |
Petronet LNG Ltd. | 32,568 | | 96,522 |
Phoenix Mills Ltd. (a) | 21,082 | | 107,600 |
Power Grid Corp. of India Ltd. | 82,864 | | 162,892 |
SREI Infrastructure Finance Ltd. (a) | 136,028 | | 92,977 |
State Bank of India (a) | 66,221 | | 239,154 |
Tata Consultancy Services Ltd. | 8,565 | | 326,326 |
Yes Bank Ltd. (a) | 7,278 | | 84,114 |
TOTAL INDIA | | 3,469,261 |
Indonesia - 0.5% |
PT Bank Mandiri (Persero) Tbk | 196,000 | | 124,043 |
PT Bank Rakyat Indonesia Tbk | 174,900 | | 133,861 |
PT Kalbe Farma Tbk | 640,500 | | 66,705 |
PT Perusahaan Gas Negara Tbk Series B | 148,200 | | 32,370 |
TOTAL INDONESIA | | 356,979 |
Israel - 0.5% |
Bezeq The Israel Telecommunication Corp. Ltd. | 117,495 | | 252,624 |
Partner Communications Co. Ltd. (a) | 12,209 | | 55,410 |
TOTAL ISRAEL | | 308,034 |
Korea (South) - 8.3% |
AMOREPACIFIC Group, Inc. | 1,562 | | 220,256 |
BGFretail Co. Ltd. | 645 | | 96,035 |
Daewoo International Corp. | 3,552 | | 62,064 |
DOUBLEUGAMES Co. Ltd. | 472 | | 26,871 |
E-Mart Co. Ltd. | 1,406 | | 261,677 |
Fila Korea Ltd. | 2,319 | | 203,106 |
Hanon Systems | 1,976 | | 77,706 |
Hyundai Glovis Co. Ltd. | 1,418 | | 244,040 |
Hyundai Industrial Development & Construction Co. | 4,871 | | 196,458 |
Hyundai Mobis | 3,141 | | 660,238 |
KB Financial Group, Inc. | 5,866 | | 185,563 |
Korea Electric Power Corp. | 2,681 | | 120,529 |
Korea Zinc Co. Ltd. | 283 | | 117,486 |
Korean Reinsurance Co. | 19,619 | | 233,688 |
LG Chemical Ltd. | 1,413 | | 376,835 |
NAVER Corp. | 437 | | 229,643 |
Common Stocks - continued |
| Shares | | Value |
Korea (South) - continued |
NCSOFT Corp. | 317 | | $ 52,613 |
Samsung Electronics Co. Ltd. | 785 | | 943,290 |
Samsung Fire & Marine Insurance Co. Ltd. | 272 | | 76,113 |
Samsung Life Insurance Co. Ltd. | 1,434 | | 136,898 |
Samsung SDI Co. Ltd. | 360 | | 33,579 |
Shinhan Financial Group Co. Ltd. | 11,088 | | 422,539 |
SK Hynix, Inc. | 11,698 | | 314,537 |
SK Telecom Co. Ltd. | 80 | | 16,915 |
SK Telecom Co. Ltd. sponsored ADR | 4,960 | | 116,858 |
TOTAL KOREA (SOUTH) | | 5,425,537 |
Mauritius - 0.1% |
MakeMyTrip Ltd. (a) | 3,000 | | 47,880 |
Mexico - 3.5% |
America Movil S.A.B. de CV Series L sponsored ADR | 16,572 | | 295,147 |
Banregio Grupo Financiero S.A.B. de CV | 11,380 | | 61,393 |
El Puerto de Liverpool S.A.B. de CV Class C | 14,000 | | 194,424 |
Grupo Aeroportuario del Pacifico SA de CV Series B | 13,800 | | 124,292 |
Grupo Aeroportuario Norte S.A.B. de CV | 9,800 | | 50,407 |
Grupo Comercial Chedraui S.A.B. de CV | 34,576 | | 95,662 |
Grupo Financiero Banorte S.A.B. de CV Series O | 96,924 | | 521,945 |
Grupo Financiero Santander Mexico S.A.B. de CV | 44,200 | | 81,214 |
Infraestructura Energetica Nova S.A.B. de CV | 11,900 | | 57,383 |
Macquarie Mexican (REIT) | 227,130 | | 315,302 |
Promotora y Operadora de Infraestructura S.A.B. de CV (a) | 6,200 | | 77,739 |
Tenedora Nemak SA de CV (a) | 53,900 | | 77,957 |
Wal-Mart de Mexico SA de CV Series V | 137,800 | | 363,567 |
TOTAL MEXICO | | 2,316,432 |
Netherlands - 0.3% |
Cnova NV (a) | 6,600 | | 19,800 |
Hangzhou Hikvision Digital Technology Co. Ltd. ELS (BNP Paribas Arbitrage Warrant Program) warrants 10/21/16 (a) | 15,500 | | 84,430 |
Yandex NV (a) | 5,237 | | 84,316 |
TOTAL NETHERLANDS | | 188,546 |
Nigeria - 0.4% |
Guaranty Trust Bank PLC GDR (Reg. S) | 10,580 | | 60,835 |
Transnational Corp. of Nigeria PLC | 3,557,220 | | 32,346 |
Zenith Bank PLC | 1,780,503 | | 157,432 |
TOTAL NIGERIA | | 250,613 |
Common Stocks - continued |
| Shares | | Value |
Pakistan - 0.2% |
Habib Bank Ltd. | 66,300 | | $ 131,764 |
Panama - 0.1% |
Copa Holdings SA Class A | 2,000 | | 101,040 |
Philippines - 0.9% |
Alliance Global Group, Inc. | 321,850 | | 125,047 |
Metro Pacific Investments Corp. | 722,000 | | 80,328 |
Metropolitan Bank & Trust Co. | 80,721 | | 146,571 |
Robinsons Land Corp. | 410,280 | | 268,201 |
TOTAL PHILIPPINES | | 620,147 |
Russia - 1.6% |
E.ON Russia JSC (a) | 1,222,700 | | 58,169 |
Lukoil PJSC sponsored ADR | 9,600 | | 348,480 |
Mobile TeleSystems OJSC (a) | 24,172 | | 78,658 |
NOVATEK OAO GDR (Reg. S) | 2,600 | | 237,770 |
Sberbank of Russia (a) | 59,060 | | 83,738 |
Sberbank of Russia sponsored ADR | 32,984 | | 202,291 |
Sistema JSFC (a) | 169,200 | | 46,807 |
Sistema JSFC sponsored GDR | 3,860 | | 26,827 |
TOTAL RUSSIA | | 1,082,740 |
Singapore - 0.2% |
First Resources Ltd. | 90,100 | | 120,695 |
South Africa - 2.8% |
Aspen Pharmacare Holdings Ltd. | 8,021 | | 180,144 |
Barclays Africa Group Ltd. | 26,942 | | 345,755 |
Bidvest Group Ltd. | 6,756 | | 172,818 |
JSE Ltd. | 7,710 | | 74,376 |
Life Healthcare Group Holdings Ltd. | 46,600 | | 129,978 |
Naspers Ltd. Class N | 5,200 | | 761,645 |
Sasol Ltd. | 2,800 | | 89,717 |
Telkom SA Ltd. | 13,510 | | 70,972 |
TOTAL SOUTH AFRICA | | 1,825,405 |
Taiwan - 4.7% |
Advanced Semiconductor Engineering, Inc. | 44,000 | | 50,794 |
Advantech Co. Ltd. | 22,000 | | 158,232 |
ASUSTeK Computer, Inc. | 10,000 | | 89,635 |
Catcher Technology Co. Ltd. | 11,000 | | 108,424 |
E.SUN Financial Holdings Co. Ltd. | 368,946 | | 222,174 |
Hermes Microvision, Inc. | 1,000 | | 38,657 |
Hon Hai Precision Industry Co. Ltd. (Foxconn) | 39,555 | | 105,512 |
Common Stocks - continued |
| Shares | | Value |
Taiwan - continued |
Inotera Memories, Inc. (a) | 69,000 | | $ 53,347 |
King's Town Bank | 78,600 | | 62,706 |
Largan Precision Co. Ltd. | 2,000 | | 156,168 |
Taiwan Cement Corp. | 186,000 | | 207,399 |
Taiwan Fertilizer Co. Ltd. | 49,000 | | 62,712 |
Taiwan Semiconductor Manufacturing Co. Ltd. | 311,000 | | 1,310,382 |
Taiwan Semiconductor Manufacturing Co. Ltd. sponsored ADR | 1,542 | | 33,862 |
Unified-President Enterprises Corp. | 94,012 | | 159,269 |
Universal Cement Corp. | 97,654 | | 69,033 |
Vanguard International Semiconductor Corp. | 37,000 | | 47,810 |
Yuanta Financial Holding Co. Ltd. | 303,231 | | 119,555 |
TOTAL TAIWAN | | 3,055,671 |
Thailand - 1.5% |
Airports of Thailand PCL (For. Reg.) | 13,900 | | 116,191 |
Intouch Holdings PCL NVDR | 39,960 | | 84,214 |
Jasmine Broadband Internet Infrastructure Fund | 526,400 | | 153,998 |
Jasmine International Public Co. Ltd. | 84,500 | | 13,416 |
Kasikornbank PCL (For. Reg.) | 65,280 | | 315,778 |
PTT PCL (For. Reg.) | 22,900 | | 176,865 |
Thai Union Frozen Products PCL (For. Reg.) | 312,100 | | 155,058 |
TOTAL THAILAND | | 1,015,520 |
Turkey - 0.6% |
Aselsan A/S | 12,000 | | 57,419 |
Tupras Turkiye Petrol Rafinelleri A/S (a) | 7,000 | | 184,880 |
Turkiye Garanti Bankasi A/S | 47,864 | | 123,941 |
TOTAL TURKEY | | 366,240 |
United Arab Emirates - 0.6% |
DP World Ltd. | 4,418 | | 89,288 |
Emaar Properties PJSC | 53,120 | | 93,282 |
Emirates Telecommunications Corp. | 3,488 | | 14,529 |
First Gulf Bank PJSC | 63,878 | | 214,782 |
TOTAL UNITED ARAB EMIRATES | | 411,881 |
United Kingdom - 0.3% |
Fresnillo PLC | 8,200 | | 92,280 |
HSBC Holdings PLC (Hong Kong) | 16,000 | | 125,102 |
TOTAL UNITED KINGDOM | | 217,382 |
Common Stocks - continued |
| Shares | | Value |
United States of America - 0.3% |
Cognizant Technology Solutions Corp. Class A (a) | 2,620 | | $ 178,448 |
TOTAL COMMON STOCKS (Cost $31,801,701) |
34,092,740
|
Nonconvertible Preferred Stocks - 2.4% |
| | | |
Brazil - 1.2% |
Banco Bradesco SA (PN) sponsored ADR | 18,930 | | 102,979 |
Banco do Estado Rio Grande do Sul SA | 28,720 | | 44,608 |
Companhia Paranaense de Energia-Copel: | | | |
(PN-B) | 515 | | 4,340 |
(PN-B) sponsored | 8,502 | | 70,227 |
Itau Unibanco Holding SA sponsored ADR | 38,688 | | 265,013 |
Petroleo Brasileiro SA - Petrobras (PN) sponsored (non-vtg.) (a) | 37,506 | | 149,649 |
Telefonica Brasil SA | 4,890 | | 50,656 |
Vale SA (PN-A) sponsored ADR | 25,500 | | 91,800 |
TOTAL BRAZIL | | 779,272 |
Korea (South) - 1.0% |
Hyundai Motor Co. Series 2 | 2,535 | | 253,107 |
Samsung Electronics Co. Ltd. | 283 | | 296,194 |
Samsung Fire & Marine Insurance Co. Ltd. | 630 | | 110,631 |
TOTAL KOREA (SOUTH) | | 659,932 |
Russia - 0.2% |
Surgutneftegas OJSC (a) | 145,800 | | 99,386 |
TOTAL NONCONVERTIBLE PREFERRED STOCKS (Cost $2,121,719) |
1,538,590
|
Nonconvertible Bonds - 16.4% |
| Principal Amount | | |
Azerbaijan - 1.1% |
International Bank of Azerbaijan OJSC 5.625% 6/11/19 (Reg. S) | | $ 200,000 | | 184,016 |
State Oil Co. of Azerbaijan Republic: | | | | |
4.75% 3/13/23 (Reg. S) | | 325,000 | | 280,448 |
6.95% 3/18/30 (Reg. S) | | 275,000 | | 257,675 |
TOTAL AZERBAIJAN | | 722,139 |
Nonconvertible Bonds - continued |
| Principal Amount | | Value |
Brazil - 0.4% |
Caixa Economica Federal 3.5% 11/7/22 (d) | | $ 300,000 | | $ 241,500 |
Canada - 0.1% |
First Quantum Minerals Ltd. 7% 2/15/21 (d) | | 100,000 | | 74,000 |
Cayman Islands - 1.7% |
Lamar Funding Ltd. 3.958% 5/7/25 (d) | | 200,000 | | 187,340 |
Petrobras International Finance Co. Ltd.: | | | | |
3.5% 2/6/17 | | 200,000 | | 193,300 |
5.375% 1/27/21 | | 530,000 | | 431,288 |
8.375% 12/10/18 | | 300,000 | | 299,778 |
TOTAL CAYMAN ISLANDS | | 1,111,706 |
Chile - 0.3% |
Corporacion Nacional del Cobre de Chile (Codelco) 4.5% 9/16/25 (d) | | 200,000 | | 198,376 |
Indonesia - 1.9% |
PT Pertamina Persero: | | | | |
4.875% 5/3/22 (d) | | 275,000 | | 270,738 |
5.25% 5/23/21 (d) | | 200,000 | | 204,846 |
5.625% 5/20/43 (d) | | 200,000 | | 169,000 |
6% 5/3/42 (d) | | 400,000 | | 347,000 |
6.5% 5/27/41 (d) | | 275,000 | | 256,137 |
TOTAL INDONESIA | | 1,247,721 |
Ireland - 0.5% |
Vnesheconombank Via VEB Finance PLC: | | | | |
5.375% 2/13/17 (d) | | 250,000 | | 253,125 |
6.8% 11/22/25 (d) | | 100,000 | | 98,100 |
TOTAL IRELAND | | 351,225 |
Israel - 0.9% |
B Communications Ltd. 7.375% 2/15/21 (d) | | 300,000 | | 325,500 |
Israel Electric Corp. Ltd. 7.25% 1/15/19 (Reg. S) | | 250,000 | | 280,812 |
TOTAL ISRAEL | | 606,312 |
Kazakhstan - 1.9% |
Kazagro National Management Holding JSC 4.625% 5/24/23 (d) | | 400,000 | | 324,160 |
KazMunaiGaz Finance Sub BV: | | | | |
6% 11/7/44 (d) | | 200,000 | | 156,304 |
9.125% 7/2/18 (d) | | 200,000 | | 220,556 |
Nonconvertible Bonds - continued |
| Principal Amount | | Value |
Kazakhstan - continued |
KazMunaiGaz National Co. 5.75% 4/30/43 (d) | | $ 300,000 | | $ 230,926 |
Zhaikmunai International BV 7.125% 11/13/19 (d) | | 350,000 | | 285,250 |
TOTAL KAZAKHSTAN | | 1,217,196 |
Luxembourg - 0.9% |
RSHB Capital SA: | | | | |
5.1% 7/25/18 (d) | | 400,000 | | 398,500 |
6.299% 5/15/17 (Reg. S) | | 200,000 | | 204,152 |
TOTAL LUXEMBOURG | | 602,652 |
Mexico - 2.4% |
Pemex Project Funding Master Trust 6.625% 6/15/35 | | 350,000 | | 344,313 |
Petroleos Mexicanos: | | | | |
6.5% 6/2/41 | | 425,000 | | 407,915 |
6.625% (d)(e) | | 850,000 | | 838,525 |
TOTAL MEXICO | | 1,590,753 |
Netherlands - 0.6% |
Petrobras Global Finance BV: | | | | |
6.85% 6/5/2115 | | 215,000 | | 147,533 |
7.25% 3/17/44 | | 300,000 | | 223,200 |
TOTAL NETHERLANDS | | 370,733 |
South Africa - 0.4% |
Eskom Holdings SOC Ltd. 6.75% 8/6/23 (d) | | 300,000 | | 278,550 |
Trinidad & Tobago - 0.3% |
Petroleum Co. of Trinidad & Tobago Ltd. 9.75% 8/14/19 (d) | | 150,000 | | 160,500 |
Tunisia - 0.3% |
Banque Centrale de Tunisie 5.75% 1/30/25 (d) | | 200,000 | | 187,532 |
Turkey - 0.4% |
Arcelik A/S 5% 4/3/23 (d) | | 300,000 | | 280,860 |
United Kingdom - 0.2% |
Biz Finance PLC 9.625% 4/27/22 (d) | | 150,000 | | 136,088 |
Venezuela - 2.1% |
Petroleos de Venezuela SA: | | | | |
5.25% 4/12/17 | | 300,000 | | 168,750 |
5.5% 4/12/37 | | 500,000 | | 171,000 |
6% 11/15/26 (Reg. S) | | 700,000 | | 247,380 |
8.5% 11/2/17 (d) | | 250,000 | | 151,850 |
9% 11/17/21 (Reg. S) | | 550,000 | | 227,040 |
Nonconvertible Bonds - continued |
| Principal Amount | | Value |
Venezuela - continued |
Petroleos de Venezuela SA: - continued | | | | |
9.75% 5/17/35 (d) | | $ 300,000 | | $ 124,500 |
12.75% 2/17/22 (d) | | 600,000 | | 298,500 |
TOTAL VENEZUELA | | 1,389,020 |
TOTAL NONCONVERTIBLE BONDS (Cost $11,880,507) |
10,766,863
|
Government Obligations - 24.5% |
|
Armenia - 0.5% |
Republic of Armenia 6% 9/30/20 (d) | | 325,000 | | 321,250 |
Barbados - 0.5% |
Barbados Government 7% 8/4/22 (d) | | 350,000 | | 344,920 |
Belize - 0.4% |
Belize Government 5% 2/20/38 (c)(d) | | 332,500 | | 243,556 |
Bolivia - 0.3% |
Plurinational State of Bolivia 4.875% 10/29/22 (d) | | 200,000 | | 200,750 |
Brazil - 2.0% |
Brazilian Federative Republic: | | | | |
4.25% 1/7/25 | | 850,000 | | 753,313 |
7.125% 1/20/37 | | 100,000 | | 97,250 |
8.25% 1/20/34 | | 275,000 | | 293,563 |
12.25% 3/6/30 | | 100,000 | | 152,750 |
TOTAL BRAZIL | | 1,296,876 |
Colombia - 0.4% |
Colombian Republic 7.375% 9/18/37 | | 225,000 | | 261,000 |
Congo - 0.4% |
Congo Republic 4% 6/30/29 (c) | | 299,250 | | 245,385 |
Costa Rica - 0.8% |
Costa Rican Republic: | | | | |
4.375% 4/30/25 (d) | | 225,000 | | 194,625 |
7% 4/4/44 (d) | | 200,000 | | 180,000 |
7.158% 3/12/45 (d) | | 200,000 | | 180,500 |
TOTAL COSTA RICA | | 555,125 |
Government Obligations - continued |
| Principal Amount | | Value |
Dominican Republic - 0.5% |
Dominican Republic: | | | | |
6.6% 1/28/24 (d) | | $ 100,000 | | $ 106,250 |
7.45% 4/30/44 (d) | | 200,000 | | 211,000 |
TOTAL DOMINICAN REPUBLIC | | 317,250 |
Ecuador - 0.2% |
Ecuador Republic 7.95% 6/20/24 (d) | | 200,000 | | 152,000 |
Egypt - 0.2% |
Arab Republic of Egypt 6.875% 4/30/40 (d) | | 150,000 | | 134,400 |
El Salvador - 0.4% |
El Salvador Republic: | | | | |
7.375% 12/1/19 | | 100,000 | | 102,375 |
7.625% 2/1/41 (d) | | 150,000 | | 133,500 |
TOTAL EL SALVADOR | | 235,875 |
Ethiopia - 0.3% |
Federal Democratic Republic of Ethiopia 6.625% 12/11/24 (d) | | 200,000 | | 186,500 |
Gabon - 0.3% |
Gabonese Republic 6.375% 12/12/24 (d) | | 200,000 | | 172,000 |
Georgia - 0.3% |
Georgia Republic 6.875% 4/12/21 (d) | | 200,000 | | 213,350 |
Ghana - 0.8% |
Ghana Republic: | | | | |
7.875% 8/7/23 (Reg.S) | | 200,000 | | 171,564 |
8.125% 1/18/26 (d) | | 200,000 | | 169,850 |
10.75% 10/14/30 (d) | | 200,000 | | 211,800 |
TOTAL GHANA | | 553,214 |
Hungary - 0.3% |
Hungarian Republic 5.75% 11/22/23 | | 200,000 | | 225,250 |
Iraq - 0.3% |
Republic of Iraq 5.8% 1/15/28 (Reg. S) | | 250,000 | | 183,125 |
Ivory Coast - 0.6% |
Ivory Coast: | | | | |
5.375% 7/23/24 (d) | | 200,000 | | 178,000 |
5.75% 12/31/32 | | 275,000 | | 244,750 |
TOTAL IVORY COAST | | 422,750 |
Government Obligations - continued |
| Principal Amount | | Value |
Jamaica - 0.2% |
Jamaican Government 8% 6/24/19 | | $ 150,000 | | $ 163,500 |
Kenya - 0.3% |
Republic of Kenya 6.875% 6/24/24 (d) | | 200,000 | | 185,450 |
Lebanon - 1.0% |
Lebanese Republic: | | | | |
5% 10/12/17 | | 100,000 | | 99,864 |
6.1% 10/4/22 | | 150,000 | | 149,100 |
6.65% 2/26/30(Reg. S) | | 125,000 | | 123,750 |
11.625% 5/11/16 (Reg. S) | | 250,000 | | 259,008 |
TOTAL LEBANON | | 631,722 |
Mexico - 0.3% |
United Mexican States 5.75% 10/12/2110 | | 200,000 | | 195,500 |
Mongolia - 0.3% |
Mongolian People's Republic 5.125% 12/5/22 (Reg. S) | | 200,000 | | 166,737 |
Netherlands - 0.4% |
Republic of Angola 7% 8/16/19 (Issued by Northern Lights III BV for Republic of Angola) (Reg. S) | | 250,000 | | 243,125 |
Pakistan - 0.3% |
Islamic Republic of Pakistan 7.25% 4/15/19 (d) | | 200,000 | | 207,800 |
Panama - 0.4% |
Panamanian Republic 8.875% 9/30/27 | | 200,000 | | 282,500 |
Philippines - 0.9% |
Philippine Republic 9.5% 2/2/30 | | 350,000 | | 564,088 |
Qatar - 0.5% |
State of Qatar 5.75% 1/20/42 (d) | | 250,000 | | 310,625 |
Romania - 0.3% |
Romanian Republic 6.75% 2/7/22 (d) | | 170,000 | | 202,640 |
Russia - 2.9% |
Russian Federation: | | | | |
5% 4/29/20 (d) | | 225,000 | | 236,531 |
5.625% 4/4/42 (d) | | 200,000 | | 199,300 |
5.875% 9/16/43 (d) | | 200,000 | | 205,300 |
7.5% 3/31/30 (Reg. S) | | 490,875 | | 583,826 |
12.75% 6/24/28 (Reg. S) | | 425,000 | | 692,750 |
TOTAL RUSSIA | | 1,917,707 |
Senegal - 0.3% |
Republic of Senegal 8.75% 5/13/21 (d) | | 200,000 | | 214,800 |
Government Obligations - continued |
| Principal Amount | | Value |
Serbia - 0.5% |
Republic of Serbia 7.25% 9/28/21 (d) | | $ 260,000 | | $ 297,154 |
South Africa - 0.4% |
South African Republic 5.875% 9/16/25 | | 250,000 | | 271,688 |
Sri Lanka - 0.5% |
Democratic Socialist Republic of Sri Lanka 6.25% 10/4/20 (d) | | 300,000 | | 301,200 |
Tanzania - 0.3% |
United Republic of Tanzania 6.5375% 3/9/20 (g) | | 200,000 | | 193,750 |
Turkey - 1.7% |
Turkish Republic: | | | | |
6.25% 9/26/22 | | 200,000 | | 222,000 |
7% 6/5/20 | | 250,000 | | 283,238 |
7.375% 2/5/25 | | 300,000 | | 358,821 |
11.875% 1/15/30 | | 165,000 | | 275,550 |
TOTAL TURKEY | | 1,139,609 |
Ukraine - 1.1% |
Ukraine Government: | | | | |
6.58% 11/21/16 (d) | | 250,000 | | 190,052 |
6.75% 11/14/17 (d) | | 200,000 | | 151,413 |
7.5% 4/17/23 (Reg. S) | | 250,000 | | 197,292 |
9.25% 7/24/17 (d) | | 200,000 | | 151,413 |
TOTAL UKRAINE | | 690,170 |
United States of America - 0.1% |
U.S. Treasury Bills, yield at date of purchase 0.01% to 0.04% 12/3/15 (f) | | 60,000 | | 59,999 |
Venezuela - 1.5% |
Venezuelan Republic: | | | | |
7% 3/31/38 | | 650,000 | | 242,125 |
8.25% 10/13/24 | | 300,000 | | 114,000 |
9% 5/7/23 (Reg. S) | | 300,000 | | 117,750 |
9.25% 9/15/27 | | 650,000 | | 284,375 |
9.25% 5/7/28 (Reg. S) | | 250,000 | | 98,125 |
12.75% 8/23/22 | | 325,000 | | 154,375 |
TOTAL VENEZUELA | | 1,010,750 |
Vietnam - 0.3% |
Vietnamese Socialist Republic 6.75% 1/29/20 (d) | | 200,000 | | 221,557 |
Government Obligations - continued |
| Principal Amount | | Value |
Zambia - 0.5% |
Republic of Zambia: | | | | |
5.375% 9/20/22 (d) | | $ 200,000 | | $ 148,000 |
8.97% 7/30/27 (d) | | 200,000 | | 167,500 |
TOTAL ZAMBIA | | 315,500 |
TOTAL GOVERNMENT OBLIGATIONS (Cost $16,800,604) |
16,052,147
|
Preferred Securities - 0.6% |
|
China - 0.5% |
Sinochem Group 5% (d)(e)(f) | | 300,000 | | 312,349 |
Colombia - 0.1% |
Colombia Telecomunicacines SA 8.5% (d)(e)(f) | | 100,000 | | 90,122 |
TOTAL PREFERRED SECURITIES (Cost $403,473) |
402,471
|
Money Market Funds - 2.2% |
| Shares | | |
Fidelity Cash Central Fund, 0.18% (b)
(Cost $1,436,463) | 1,436,463 | |
1,436,463
|
TOTAL INVESTMENT PORTFOLIO - 98.2% (Cost $64,444,467) | | 64,289,274 |
NET OTHER ASSETS (LIABILITIES) - 1.8% | | 1,203,567 |
NET ASSETS - 100% | $ 65,492,841 |
Futures Contracts |
| Expiration Date | | Underlying Face Amount at Value | | Unrealized Appreciation/
(Depreciation) |
Purchased |
Equity Index Contracts |
12 ICE E-mini MSCI Emerging Markets Index Contracts (United States) | Dec. 2015 | | $ 506,220 | | $ 22,118 |
|
The face value of futures purchased as a percentage of net assets is 0.8% |
Security Type Abbreviations |
ELS | - | Equity-Linked Security |
Legend |
(a) Non-income producing |
(b) Affiliated fund that is generally available only to investment companies and other accounts managed by Fidelity Investments. The rate quoted is the annualized seven-day yield of the fund at period end. A complete unaudited listing of the fund's holdings as of its most recent quarter end is available upon request. In addition, each Fidelity Central Fund's financial statements, which are not covered by the Fund's Report of Independent Registered Public Accounting Firm, are available on the SEC's website or upon request. |
(c) Security initially issued at one coupon which converts to a higher coupon at a specified date. The rate shown is the rate at period end. |
(d) Security exempt from registration under Rule 144A of the Securities Act of 1933. These securities may be resold in transactions exempt from registration, normally to qualified institutional buyers. At the end of the period, the value of these securities amounted to $14,025,720 or 21.4% of net assets. |
(e) Security is perpetual in nature with no stated maturity date. |
(f) Security or a portion of the security was pledged to cover margin requirements for futures contracts. At period end, the value of securities pledged amounted to $59,999. |
(g) Coupon rates for floating and adjustable rate securities reflect the rates in effect at period end. |
Affiliated Central Funds |
Information regarding fiscal year to date income earned by the Fund from investments in Fidelity Central Funds is as follows: |
Fund | Income earned |
Fidelity Cash Central Fund | $ 2,500 |
Fidelity Securities Lending Cash Central Fund | 640 |
Total | $ 3,140 |
Other Information |
Categorizations in the Schedule of Investments are based on country or territory of incorporation. |
The following is a summary of the inputs used, as of October 31, 2015, involving the Fund's assets and liabilities carried at fair value. The inputs or methodology used for valuing securities may not be an indication of the risk associated with investing in those securities. For more information on valuation inputs, and their aggregation into the levels used in the tables below, please refer to the Investment Valuation section in the accompanying Notes to Financial Statements. |
Valuation Inputs at Reporting Date: |
Description | Total | Level 1 | Level 2 | Level 3 |
Investments in Securities: | | | | |
Equities: | | | | |
Consumer Discretionary | $ 3,430,635 | $ 2,766,666 | $ 445,206 | $ 218,763 |
Consumer Staples | 3,401,056 | 1,716,848 | 1,684,208 | - |
Energy | 2,685,230 | 1,211,182 | 1,474,048 | - |
Financials | 9,828,939 | 4,391,939 | 5,437,000 | - |
Health Care | 736,763 | 310,122 | 426,641 | - |
Industrials | 2,457,584 | 1,363,799 | 1,093,785 | - |
Information Technology | 7,039,412 | 4,013,829 | 3,025,583 | - |
Materials | 2,498,684 | 1,688,631 | 810,053 | - |
Telecommunication Services | 2,424,618 | 1,612,438 | 812,180 | - |
Utilities | 1,128,409 | 359,421 | 768,988 | - |
Corporate Bonds | 10,766,863 | - | 10,766,863 | - |
Government Obligations | 16,052,147 | - | 16,052,147 | - |
Preferred Securities | 402,471 | - | 402,471 | - |
Money Market Funds | 1,436,463 | 1,436,463 | - | - |
Total Investments in Securities: | $ 64,289,274 | $ 20,871,338 | $ 43,199,173 | $ 218,763 |
Derivative Instruments: | | | | |
Assets | | | | |
Futures Contracts | $ 22,118 | $ 22,118 | $ - | $ - |
The following is a summary of transfers between Level 1 and Level 2 for the period ended October 31, 2015. Transfers are assumed to have occurred at the beginning of the period, and are primarily attributable to the valuation techniques used for foreign equity securities, as discussed in the accompanying Notes to Financial Statements: |
Transfers | Total |
Level 1 to Level 2 | $ 695,622 |
Level 2 to Level 1 | $ 2,488,814 |
Value of Derivative Instruments |
The following table is a summary of the Fund's value of derivative instruments by primary risk exposure as of October 31, 2015. For additional information on derivative instruments, please refer to the Derivative Instruments section in the accompanying Notes to Financial Statements. |
Primary Risk Exposure /
Derivative Type | Value |
| Asset | Liability |
Equity Risk | | |
Futures Contracts (a) | $ 22,118 | $ - |
(a) Reflects gross cumulative appreciation (depreciation) on futures contracts as presented in the Schedule of Investments. Only the period end receivable or payable for daily variation margin and net unrealized appreciation (depreciation) are presented in the Statement of Assets and Liabilities. |
Other Information |
The composition of credit quality ratings as a percentage of net assets is as follows (Unaudited): |
AAA,AA,A | 3.8% |
BBB | 10.8% |
BB | 12.3% |
B | 7.4% |
CCC,CC,C | 5.1% |
Not Rated | 2.0% |
Equities | 54.5% |
Short-Term Investments and Net Other Assets | 4.1% |
| 100.0% |
We have used ratings from Moody's Investors Service, Inc. Where Moody's® ratings are not available, we have used S&P® ratings. All ratings are as of the date indicated and do not reflect subsequent changes. |
See accompanying notes which are an integral part of the financial statements.
Annual Report
Fidelity Total Emerging Markets Fund
Statement of Assets and Liabilities
| | October 31, 2015 |
| | |
Assets | | |
Investment in securities, at value - See accompanying schedule: Unaffiliated issuers (cost $63,008,004) | $ 62,852,811 | |
Fidelity Central Funds (cost $1,436,463) | 1,436,463 | |
Total Investments (cost $64,444,467) | | $ 64,289,274 |
Cash | | 362,836 |
Foreign currency held at value (cost $65,956) | | 65,977 |
Receivable for investments sold | | 555,312 |
Receivable for fund shares sold | | 101,694 |
Dividends receivable | | 12,507 |
Interest receivable | | 575,898 |
Distributions receivable from Fidelity Central Funds | | 286 |
Receivable for daily variation margin for derivative instruments | | 1,896 |
Prepaid expenses | | 183 |
Receivable from investment adviser for expense reductions | | 28,742 |
Other receivables | | 27,900 |
Total assets | | 66,022,505 |
| | |
Liabilities | | |
Payable for investments purchased | $ 313,888 | |
Payable for fund shares redeemed | 59,882 | |
Accrued management fee | 43,392 | |
Distribution and service plan fees payable | 10,104 | |
Other affiliated payables | 15,645 | |
Other payables and accrued expenses | 86,753 | |
Total liabilities | | 529,664 |
| | |
Net Assets | | $ 65,492,841 |
Net Assets consist of: | | |
Paid in capital | | $ 65,852,157 |
Undistributed net investment income | | 1,546,081 |
Accumulated undistributed net realized gain (loss) on investments and foreign currency transactions | | (1,767,162) |
Net unrealized appreciation (depreciation) on investments and assets and liabilities in foreign currencies | | (138,235) |
Net Assets | | $ 65,492,841 |
See accompanying notes which are an integral part of the financial statements.
Annual Report
Fidelity Total Emerging Markets Fund
Financial Statements - continued
Statement of Assets and Liabilities - continued
| | October 31, 2015 |
Calculation of Maximum Offering Price | | |
Class A: | | |
Net Asset Value and redemption price per share ($10,164,340 ÷ 982,497 shares) | | $ 10.35 |
| | |
Maximum offering price per share (100/94.25 of $10.35) | | $ 10.98 |
Class T: | | |
Net Asset Value and redemption price per share ($3,331,226 ÷ 322,484 shares) | | $ 10.33 |
| | |
Maximum offering price per share (100/96.50 of $10.33) | | $ 10.70 |
Class C: | | |
Net Asset Value and offering price per share ($7,735,733 ÷ 754,353 shares)A | | $ 10.25 |
| | |
Total Emerging Markets: | | |
Net Asset Value, offering price and redemption price per share ($37,918,319 ÷ 3,652,776 shares) | | $ 10.38 |
| | |
Class I: | | |
Net Asset Value, offering price and redemption price per share ($6,343,223 ÷ 611,457 shares) | | $ 10.37 |
A Redemption price per share is equal to net asset value less any applicable contingent deferred sales charge.
See accompanying notes which are an integral part of the financial statements.
Annual Report
Statement of Operations
| Year ended October 31, 2015 |
| | |
Investment Income | | |
Dividends | | $ 1,105,140 |
Interest | | 1,976,845 |
Income from Fidelity Central Funds | | 3,140 |
Income before foreign taxes withheld | | 3,085,125 |
Less foreign taxes withheld | | (111,245) |
Total income | | 2,973,880 |
| | |
Expenses | | |
Management fee | $ 564,291 | |
Transfer agent fees | 172,623 | |
Distribution and service plan fees | 148,766 | |
Accounting and security lending fees | 36,603 | |
Custodian fees and expenses | 262,557 | |
Independent trustees' compensation | 305 | |
Registration fees | 64,805 | |
Audit | 94,841 | |
Legal | 176 | |
Miscellaneous | 612 | |
Total expenses before reductions | 1,345,579 | |
Expense reductions | (217,505) | 1,128,074 |
Net investment income (loss) | | 1,845,806 |
Realized and Unrealized Gain (Loss) | | |
Net realized gain (loss) on: | | |
Investment securities: | | |
Unaffiliated issuers (net of foreign taxes of $51,537) | (1,335,001) | |
Foreign currency transactions | (33,466) | |
Futures contracts | 28,498 | |
Total net realized gain (loss) | | (1,339,969) |
Change in net unrealized appreciation (depreciation) on: Investment securities (net of decrease in deferred foreign taxes of $94,055) | (7,238,306) | |
Assets and liabilities in foreign currencies | 2,727 | |
Futures contracts | 21,984 | |
Total change in net unrealized appreciation (depreciation) | | (7,213,595) |
Net gain (loss) | | (8,553,564) |
Net increase (decrease) in net assets resulting from operations | | $ (6,707,758) |
See accompanying notes which are an integral part of the financial statements.
Annual Report
Fidelity Total Emerging Markets Fund
Financial Statements - continued
Statement of Changes in Net Assets
| Year ended
October 31,
2015 | Year ended
October 31,
2014 |
Increase (Decrease) in Net Assets | | |
Operations | | |
Net investment income (loss) | $ 1,845,806 | $ 1,316,375 |
Net realized gain (loss) | (1,339,969) | 3,140,986 |
Change in net unrealized appreciation (depreciation) | (7,213,595) | (2,656,389) |
Net increase (decrease) in net assets resulting from operations | (6,707,758) | 1,800,972 |
Distributions to shareholders from net investment income | (1,198,750) | (1,381,318) |
Distributions to shareholders from net realized gain | (136,019) | - |
Total distributions | (1,334,769) | (1,381,318) |
Share transactions - net increase (decrease) | (6,024,786) | (8,457,450) |
Redemption fees | 16,471 | 27,840 |
Total increase (decrease) in net assets | (14,050,842) | (8,009,956) |
| | |
Net Assets | | |
Beginning of period | 79,543,683 | 87,553,639 |
End of period (including undistributed net investment income of $1,546,081 and undistributed net investment income of $1,150,725, respectively) | $ 65,492,841 | $ 79,543,683 |
See accompanying notes which are an integral part of the financial statements.
Annual Report
Financial Highlights - Fidelity Total Emerging Markets Fund Class A
Years ended October 31, | 2015 | 2014 | 2013 | 2012 F |
Selected Per-Share Data | | | | |
Net asset value, beginning of period | $ 11.56 | $ 11.37 | $ 10.86 | $ 10.00 |
Income from Investment Operations | | | | |
Net investment income (loss) C | .28 | .18 | .18 | .20 |
Net realized and unrealized gain (loss) | (1.30) | .19 | .48 | .68 |
Total from investment operations | (1.02) | .37 | .66 | .88 |
Distributions from net investment income | (.17) | (.18) | (.15) | (.02) |
Distributions from net realized gain | (.02) | - | (.01) | - |
Total distributions | (.19) | (.18) | (.16) | (.02) |
Redemption fees added to paid in capitalC | - H | - H | .01 | -H |
Net asset value, end of period | $ 10.35 | $ 11.56 | $ 11.37 | $ 10.86 |
Total ReturnA, B | (8.92)% | 3.30% | 6.23% | 8.80% |
Ratios to Average Net AssetsD, G | | | | |
Expenses before reductions | 1.93% | 1.98% | 1.89% | 1.87% |
Expenses net of fee waivers, if any | 1.65% | 1.65% | 1.65% | 1.65% |
Expenses net of all reductions | 1.64% | 1.65% | 1.62% | 1.62% |
Net investment income (loss) | 2.58% | 1.61% | 1.61% | 1.92% |
Supplemental Data | | | | |
Net assets, end of period (000 omitted) | $ 10,164 | $ 13,627 | $ 18,837 | $ 7,675 |
Portfolio turnover rateE | 80% | 102% | 120% | 70% |
A Total returns would have been lower if certain expenses had not been reduced during the applicable periods shown.
B Total returns do not include the effect of the sales charges.
C Calculated based on average shares outstanding during the period.
D Fees and expenses of any underlying Fidelity Central Funds are not included in the Fund's expense ratio. The Fund indirectly bears its proportionate share of the expenses of any underlying Fidelity Central Funds.
E Amount does not include the portfolio activity of any underlying Fidelity Central Funds.
F For the period November 1, 2011 (commencement of operations) to October 31, 2012.
G Expense ratios reflect operating expenses of the class. Expenses before reductions do not reflect amounts reimbursed by the investment adviser or reductions from brokerage service arrangements or reductions from other expense offset arrangements and do not represent the amount paid by the class during periods when reimbursements or reductions occur. Expense ratios before reductions for start-up periods may not be representative of longer-term operating periods. Expenses net of fee waivers reflect expenses after reimbursement by the investment adviser but prior to reductions from brokerage service arrangements or other expense offset arrangements. Expenses net of all reductions represent the net expenses paid by the class.
H Amount represents less than $.005 per share.
See accompanying notes which are an integral part of the financial statements.
Annual Report
Financial Highlights - Fidelity Total Emerging Markets Fund Class T
Years ended October 31, | 2015 | 2014 | 2013 | 2012 G |
Selected Per-Share Data | | | | |
Net asset value, beginning of period | $ 11.54 | $ 11.34 | $ 10.84 | $ 10.00 |
Income from Investment Operations | | | | |
Net investment income (loss) C | .25 | .15 | .15 | .17 |
Net realized and unrealized gain (loss) | (1.30) | .19 | .48 | .68 |
Total from investment operations | (1.05) | .34 | .63 | .85 |
Distributions from net investment income | (.14) | (.14) | (.12) | (.01) |
Distributions from net realized gain | (.02) | - | (.01) | - |
Total distributions | (.16) | (.14) | (.14) F | (.01) |
Redemption fees added to paid in capitalC | -I | -I | .01 | -I |
Net asset value, end of period | $ 10.33 | $ 11.54 | $ 11.34 | $ 10.84 |
Total ReturnA, B | (9.18)% | 3.04% | 5.93% | 8.56% |
Ratios to Average Net AssetsD, H | | | | |
Expenses before reductions | 2.27% | 2.32% | 2.13% | 2.10% |
Expenses net of fee waivers, if any | 1.90% | 1.90% | 1.90% | 1.90% |
Expenses net of all reductions | 1.89% | 1.90% | 1.88% | 1.87% |
Net investment income (loss) | 2.33% | 1.36% | 1.36% | 1.67% |
Supplemental Data | | | | |
Net assets, end of period (000 omitted) | $ 3,331 | $ 5,277 | $ 5,967 | $ 5,823 |
Portfolio turnover rateE | 80% | 102% | 120% | 70% |
A Total returns would have been lower if certain expenses had not been reduced during the applicable periods shown.
B Total returns do not include the effect of the sales charges.
C Calculated based on average shares outstanding during the period.
D Fees and expenses of any underlying Fidelity Central Funds are not included in the Fund's expense ratio. The Fund indirectly bears its proportionate share of the expenses of any underlying Fidelity Central Funds.
E Amount does not include the portfolio activity of any underlying Fidelity Central Funds.
F Total distributions of $.14 per share is comprised of distributions from net investment income of $.124 and distributions from net realized gain of $.014 per share.
G For the period November 1, 2011 (commencement of operations) to October 31, 2012.
H Expense ratios reflect operating expenses of the class. Expenses before reductions do not reflect amounts reimbursed by the investment adviser or reductions from brokerage service arrangements or reductions from other expense offset arrangements and do not represent the amount paid by the class during periods when reimbursements or reductions occur. Expense ratios before reductions for start-up periods may not be representative of longer-term operating periods. Expenses net of fee waivers reflect expenses after reimbursement by the investment adviser but prior to reductions from brokerage service arrangements or other expense offset arrangements. Expenses net of all reductions represent the net expenses paid by the class.
I Amount represents less than $.005 per share.
See accompanying notes which are an integral part of the financial statements.
Annual Report
Financial Highlights - Fidelity Total Emerging Markets Fund Class C
Years ended October 31, | 2015 | 2014 | 2013 | 2012 F |
Selected Per-Share Data | | | | |
Net asset value, beginning of period | $ 11.47 | $ 11.29 | $ 10.80 | $ 10.00 |
Income from Investment Operations | | | | |
Net investment income (loss) C | .20 | .10 | .09 | .12 |
Net realized and unrealized gain (loss) | (1.30) | .19 | .47 | .69 |
Total from investment operations | (1.10) | .29 | .56 | .81 |
Distributions from net investment income | (.10) | (.11) | (.07) | (.01) |
Distributions from net realized gain | (.02) | - | (.01) | - |
Total distributions | (.12) | (.11) | (.08) | (.01) |
Redemption fees added to paid in capitalC | -H | -H | .01 | -H |
Net asset value, end of period | $ 10.25 | $ 11.47 | $ 11.29 | $ 10.80 |
Total ReturnA, B | (9.68)% | 2.56% | 5.31% | 8.07% |
Ratios to Average Net AssetsD, G | | | | |
Expenses before reductions | 2.68% | 2.72% | 2.65% | 2.63% |
Expenses net of fee waivers, if any | 2.40% | 2.40% | 2.40% | 2.40% |
Expenses net of all reductions | 2.39% | 2.40% | 2.37% | 2.37% |
Net investment income (loss) | 1.83% | .86% | .86% | 1.17% |
Supplemental Data | | | | |
Net assets, end of period (000 omitted) | $ 7,736 | $ 10,104 | $ 7,436 | $ 5,824 |
Portfolio turnover rateE | 80% | 102% | 120% | 70% |
A Total returns would have been lower if certain expenses had not been reduced during the applicable periods shown.
B Total returns do not include the effect of the contingent deferred sales charge.
C Calculated based on average shares outstanding during the period.
D Fees and expenses of any underlying Fidelity Central Funds are not included in the Fund's expense ratio. The Fund indirectly bears its proportionate share of the expenses of any underlying Fidelity Central Funds.
E Amount does not include the portfolio activity of any underlying Fidelity Central Funds.
F For the period November 1, 2011 (commencement of operations) to October 31, 2012.
G Expense ratios reflect operating expenses of the class. Expenses before reductions do not reflect amounts reimbursed by the investment adviser or reductions from brokerage service arrangements or reductions from other expense offset arrangements and do not represent the amount paid by the class during periods when reimbursements or reductions occur. Expense ratios before reductions for start-up periods may not be representative of longer-term operating periods. Expenses net of fee waivers reflect expenses after reimbursement by the investment adviser but prior to reductions from brokerage service arrangements or other expense offset arrangements. Expenses net of all reductions represent the net expenses paid by the class.
H Amount represents less than $.005 per share.
See accompanying notes which are an integral part of the financial statements.
Annual Report
Financial Highlights - Fidelity Total Emerging Markets Fund
Years ended October 31, | 2015 | 2014 | 2013 | 2012 E |
Selected Per-Share Data | | | | |
Net asset value, beginning of period | $ 11.60 | $ 11.40 | $ 10.89 | $ 10.00 |
Income from Investment Operations | | | | |
Net investment income (loss) B | .31 | .21 | .21 | .22 |
Net realized and unrealized gain (loss) | (1.31) | .19 | .47 | .69 |
Total from investment operations | (1.00) | .40 | .68 | .91 |
Distributions from net investment income | (.20) | (.20) | (.17) | (.02) |
Distributions from net realized gain | (.02) | - | (.01) | - |
Total distributions | (.22) | (.20) | (.18) | (.02) |
Redemption fees added to paid in capitalB | -G | -G | .01 | -G |
Net asset value, end of period | $ 10.38 | $ 11.60 | $ 11.40 | $ 10.89 |
Total ReturnA | (8.74)% | 3.56% | 6.44% | 9.15% |
Ratios to Average Net AssetsC, F | | | | |
Expenses before reductions | 1.72% | 1.73% | 1.56% | 1.60% |
Expenses net of fee waivers, if any | 1.40% | 1.40% | 1.40% | 1.40% |
Expenses net of all reductions | 1.39% | 1.40% | 1.38% | 1.38% |
Net investment income (loss) | 2.83% | 1.86% | 1.85% | 2.16% |
Supplemental Data | | | | |
Net assets, end of period (000 omitted) | $ 37,918 | $ 45,763 | $ 49,959 | $ 81,416 |
Portfolio turnover rateD | 80% | 102% | 120% | 70% |
A Total returns would have been lower if certain expenses had not been reduced during the applicable periods shown.
B Calculated based on average shares outstanding during the period.
C Fees and expenses of any underlying Fidelity Central Funds are not included in the Fund's expense ratio. The Fund indirectly bears its proportionate share of the expenses of any underlying Fidelity Central Funds.
D Amount does not include the portfolio activity of any underlying Fidelity Central Funds.
E For the period November 1, 2011 (commencement of operations) to October 31, 2012.
F Expense ratios reflect operating expenses of the class. Expenses before reductions do not reflect amounts reimbursed by the investment adviser or reductions from brokerage service arrangements or reductions from other expense offset arrangements and do not represent the amount paid by the class during periods when reimbursements or reductions occur. Expense ratios before reductions for start-up periods may not be representative of longer-term operating periods. Expenses net of fee waivers reflect expenses after reimbursement by the investment adviser but prior to reductions from brokerage service arrangements or other expense offset arrangements. Expenses net of all reductions represent the net expenses paid by the class.
G Amount represents less than $.005 per share.
See accompanying notes which are an integral part of the financial statements.
Annual Report
Financial Highlights - Fidelity Total Emerging Markets Fund Class I
Years ended October 31, | 2015 | 2014 | 2013 | 2012 E |
Selected Per-Share Data | | | | |
Net asset value, beginning of period | $ 11.59 | $ 11.40 | $ 10.89 | $ 10.00 |
Income from Investment Operations | | | | |
Net investment income (loss) B | .31 | .21 | .20 | .22 |
Net realized and unrealized gain (loss) | (1.31) | .18 | .48 | .69 |
Total from investment operations | (1.00) | .39 | .68 | .91 |
Distributions from net investment income | (.20) | (.20) | (.17) | (.02) |
Distributions from net realized gain | (.02) | - | (.01) | - |
Total distributions | (.22) | (.20) | (.18) | (.02) |
Redemption fees added to paid in capitalB | -G | -G | .01 | -G |
Net asset value, end of period | $ 10.37 | $ 11.59 | $ 11.40 | $ 10.89 |
Total ReturnA | (8.74)% | 3.51% | 6.44% | 9.15% |
Ratios to Average Net AssetsC, F | | | | |
Expenses before reductions | 1.58% | 1.71% | 1.63% | 1.62% |
Expenses net of fee waivers, if any | 1.40% | 1.40% | 1.40% | 1.40% |
Expenses net of all reductions | 1.39% | 1.40% | 1.37% | 1.37% |
Net investment income (loss) | 2.83% | 1.86% | 1.86% | 2.17% |
Supplemental Data | | | | |
Net assets, end of period (000 omitted) | $ 6,343 | $ 4,773 | $ 5,354 | $ 2,287 |
Portfolio turnover rateD | 80% | 102% | 120% | 70% |
A Total returns would have been lower if certain expenses had not been reduced during the applicable periods shown.
B Calculated based on average shares outstanding during the period.
C Fees and expenses of any underlying Fidelity Central Funds are not included in the Fund's expense ratio. The Fund indirectly bears its proportionate share of the expenses of any underlying Fidelity Central Funds.
D Amount does not include the portfolio activity of any underlying Fidelity Central Funds.
E For the period November 1, 2011 (commencement of operations) to October 31, 2012.
F Expense ratios reflect operating expenses of the class. Expenses before reductions do not reflect amounts reimbursed by the investment adviser or reductions from brokerage service arrangements or reductions from other expense offset arrangements and do not represent the amount paid by the class during periods when reimbursements or reductions occur. Expense ratios before reductions for start-up periods may not be representative of longer-term operating periods. Expenses net of fee waivers reflect expenses after reimbursement by the investment adviser but prior to reductions from brokerage service arrangements or other expense offset arrangements. Expenses net of all reductions represent the net expenses paid by the class.
G Amount represents less than $.005 per share.
See accompanying notes which are an integral part of the financial statements.
Annual Report
For the period ended October 31, 2015
1. Organization.
Fidelity Total Emerging Markets Fund (the Fund) is a fund of Fidelity Investment Trust (the Trust) and is authorized to issue an unlimited number of shares. The Trust is registered under the Investment Company Act of 1940, as amended (the 1940 Act), as an open-end management investment company organized as a Massachusetts business trust. The Fund offers Class A, Class T, Class C, Total Emerging Markets and Class I (formerly Institutional Class) shares, each of which has equal rights as to assets and voting privileges. Each class has exclusive voting rights with respect to matters that affect that class. The Fund's investments in emerging markets can be subject to social, economic, regulatory, and political uncertainties and can be extremely volatile.
2. Investments in Fidelity Central Funds.
The Fund invests in Fidelity Central Funds, which are open-end investment companies generally available only to other investment companies and accounts managed by the investment adviser and its affiliates. The Fund's Schedule of Investments lists each of the Fidelity Central Funds held as of period end, if any, as an investment of the Fund, but does not include the underlying holdings of each Fidelity Central Fund. As an Investing Fund, the Fund indirectly bears its proportionate share of the expenses of the underlying Fidelity Central Funds.
The Money Market Central Funds seek preservation of capital and current income and are managed by Fidelity Investments Money Management, Inc. (FIMM), an affiliate of the investment adviser. Annualized expenses of the Money Market Central Funds as of their most recent shareholder report date are less than .005%.
A complete unaudited list of holdings for each Fidelity Central Fund is available upon request or at the Securities and Exchange Commission (the SEC) website at www.sec.gov. In addition, the financial statements of the Fidelity Central Funds, which are not covered by the Fund's Report of Independent Registered Public Accounting Firm, are available on the SEC website or upon request.
3. Significant Accounting Policies.
The financial statements have been prepared in conformity with accounting principles generally accepted in the United States of America (GAAP), which require management to make certain estimates and assumptions at the date of the financial statements. Actual results could differ from those estimates. Subsequent events, if any, through the date that the financial statements were issued have been evaluated in the preparation of
Annual Report
Notes to Financial Statements - continued
3. Significant Accounting Policies - continued
the financial statements. The following summarizes the significant accounting policies of the Fund:
Investment Valuation. Investments are valued as of 4:00 p.m. Eastern time on the last calendar day of the period. The Board of Trustees (the Board) has delegated the day to day responsibility for the valuation of the Fund's investments to the Fidelity Management & Research Company (FMR) Fair Value Committee (the Committee). In accordance with valuation policies and procedures approved by the Board, the Fund attempts to obtain prices from one or more third party pricing vendors or brokers to value its investments. When current market prices, quotations or currency exchange rates are not readily available or reliable, investments will be fair valued in good faith by the Committee, in accordance with procedures adopted by the Board. Factors used in determining fair value vary by investment type and may include market or investment specific events, changes in interest rates and credit quality. The frequency with which these procedures are used cannot be predicted and they may be utilized to a significant extent. The Committee oversees the Fund's valuation policies and procedures and reports to the Board on the Committee's activities and fair value determinations. The Board monitors the appropriateness of the procedures used in valuing the Fund's investments and ratifies the fair value determinations of the Committee.
The Fund categorizes the inputs to valuation techniques used to value its investments into a disclosure hierarchy consisting of three levels as shown below:
Level 1 - quoted prices in active markets for identical investments
Level 2 - other significant observable inputs (including quoted prices for similar investments, interest rates, prepayment speeds, etc.)
Level 3 - unobservable inputs (including the Fund's own assumptions based on the best information available)
Valuation techniques used to value the Fund's investments by major category are as follows:
Equity securities, including restricted securities, for which market quotations are readily available, are valued at the last reported sale price or official closing price as reported by a third party pricing vendor on the primary market or exchange on which they are traded and are categorized as Level 1 in the hierarchy. In the event there were no sales during the day or closing prices are not available, securities are valued at the last quoted bid price or may be valued using the last available price and are generally categorized as Level 2 in the hierarchy. For foreign equity securities, when market or security specific events arise, comparisons to the valuation of American Depositary Receipts (ADRs), futures contracts, Exchange-Traded Funds (ETFs) and certain indexes as well as quoted prices for similar securities may be used and would be categorized as Level 2 in the hierarchy. Utilizing these techniques may result in transfers between Level 1 and Level 2.
Annual Report
3. Significant Accounting Policies - continued
Investment Valuation - continued
For equity securities, including restricted securities, where observable inputs are limited, assumptions about market activity and risk are used and these securities may be categorized as Level 3 in the hierarchy.
Debt securities, including restricted securities, are valued based on evaluated prices received from third party pricing vendors or from brokers who make markets in such securities. Corporate bonds, foreign government and government agency obligations, preferred securities and U.S. government and government agency obligations are valued by pricing vendors who utilize matrix pricing which considers yield or price of bonds of comparable quality, coupon, maturity and type or by broker-supplied prices. When independent prices are unavailable or unreliable, debt securities may be valued utilizing pricing methodologies which consider similar factors that would be used by third party pricing vendors. Debt securities are generally categorized as Level 2 in the hierarchy but may be Level 3 depending on the circumstances.
Futures contracts are valued at the settlement price established each day by the board of trade or exchange on which they are traded and are categorized as Level 1 in the hierarchy. Investments in open-end mutual funds, including the Fidelity Central Funds, are valued at their closing net asset value (NAV) each business day and are categorized as Level 1 in the hierarchy.
Changes in valuation techniques may result in transfers in or out of an assigned level within the disclosure hierarchy. The aggregate value of investments by input level as of October 31, 2015, including information on transfers between Levels 1 and 2, is included at the end of the Fund's Schedule of Investments.
Foreign Currency. The Fund may use foreign currency contracts to facilitate transactions in foreign-denominated securities. Gains and losses from these transactions may arise from changes in the value of the foreign currency or if the counterparties do not perform under the contracts' terms.
Foreign-denominated assets, including investment securities, and liabilities are translated into U.S. dollars at the exchange rates at period end. Purchases and sales of investment securities, income and dividends received and expenses denominated in foreign currencies are translated into U.S. dollars at the exchange rate in effect on the transaction date.
The effects of exchange rate fluctuations on investments are included with the net realized and unrealized gain (loss) on investment securities. Other foreign currency transactions resulting in realized and unrealized gain (loss) are disclosed separately.
Annual Report
Notes to Financial Statements - continued
3. Significant Accounting Policies - continued
Investment Transactions and Income. For financial reporting purposes, the Fund's investment holdings and NAV include trades executed through the end of the last business day of the period. The NAV per share for processing shareholder transactions is calculated as of the close of business of the New York Stock Exchange (NYSE), normally 4:00 p.m. Eastern time and includes trades executed through the end of the prior business day. Gains and losses on securities sold are determined on the basis of identified cost. Dividend income is recorded on the ex-dividend date, except for certain dividends from foreign securities where the ex-dividend date may have passed, which are recorded as soon as the Fund is informed of the ex-dividend date. Non-cash dividends included in dividend income, if any, are recorded at the fair market value of the securities received. Income and capital gain distributions from Fidelity Central Funds, if any, are recorded on the ex-dividend date. Distributions received on securities that represent a return of capital or capital gain are recorded as a reduction of cost of investments and/or as a realized gain. Subsequent to ex-dividend date the Fund determines the components of these distributions, based upon receipt of tax filings or other correspondence relating to the underlying investment. Interest income is accrued as earned and includes coupon interest and amortization of premium and accretion of discount on debt securities as applicable. Investment income is recorded net of foreign taxes withheld where recovery of such taxes is uncertain.
Class Allocations and Expenses. Investment income, realized and unrealized capital gains and losses, common expenses of the Fund, and certain fund-level expense reductions, if any, are allocated daily on a pro-rata basis to each class based on the relative net assets of each class to the total net assets of the Fund. Each class differs with respect to transfer agent and distribution and service plan fees incurred. Certain expense reductions may also differ by class. For the reporting period, the allocated portion of income and expenses to each class as a percent of its average net assets may vary due to the timing of recording these transactions in relation to fluctuating net assets of the classes. Expenses directly attributable to a fund are charged to that fund. Expenses attributable to more than one fund are allocated among the respective funds on the basis of relative net assets or other appropriate methods. Expense estimates are accrued in the period to which they relate and adjustments are made when actual amounts are known.
Income Tax Information and Distributions to Shareholders. Each year, the Fund intends to qualify as a regulated investment company under Subchapter M of the Internal Revenue Code, including distributing substantially all of its taxable income and realized gains. As a result, no provision for U.S. Federal income taxes is required. As of October 31, 2015, the Fund did not have any unrecognized tax benefits in the financial statements; nor is the Fund aware of any tax positions for which it is reasonably possible that the total amounts of unrecognized tax benefits will significantly change in the next twelve months. The Fund files a U.S. federal tax return, in addition to state and local tax
Annual Report
3. Significant Accounting Policies - continued
Income Tax Information and Distributions to Shareholders - continued
returns as required. The Fund's federal income tax returns are subject to examination by the Internal Revenue Service (IRS) for a period of three fiscal years after they are filed. State and local tax returns may be subject to examination for an additional fiscal year depending on the jurisdiction. Foreign taxes are provided for based on the Fund's understanding of the tax rules and rates that exist in the foreign markets in which it invests. The Fund is subject to a tax imposed on capital gains by certain countries in which it invests. An estimated deferred tax liability for net unrealized appreciation on the applicable securities is included in Other payables and accrued expenses on the Statement of Assets & Liabilities.
Distributions are declared and recorded on the ex-dividend date. Income dividends and capital gain distributions are declared separately for each class. Income and capital gain distributions are determined in accordance with income tax regulations, which may differ from GAAP. In addition, the Fund claimed a portion of the payment made to redeeming shareholders as a distribution for income tax purposes.
Capital accounts within the financial statements are adjusted for permanent book-tax differences. These adjustments have no impact on net assets or the results of operations. Capital accounts are not adjusted for temporary book-tax differences which will reverse in a subsequent period.
Book-tax differences are primarily due to foreign currency transactions, futures contracts, certain foreign taxes, market discount, passive foreign investment companies (PFIC), capital loss carryforward and losses deferred due to wash sales.
The federal tax cost of investment securities and unrealized appreciation (depreciation) as of period end were as follows:
Gross unrealized appreciation | $ 6,232,395 |
Gross unrealized depreciation | (6,504,580) |
Net unrealized appreciation (depreciation) on securities | $ (272,185) |
Tax Cost | $ 64,561,459 |
The tax-based components of distributable earnings as of period end were as follows:
Undistributed ordinary income | $ 1,285,899 |
Capital loss carryforward | $ (1,367,584) |
Net unrealized appreciation (depreciation) on securities and other investments | $ (274,699) |
Annual Report
Notes to Financial Statements - continued
3. Significant Accounting Policies - continued
Income Tax Information and Distributions to Shareholders - continued
Capital loss carryforwards are only available to offset future capital gains of the Fund to the extent provided by regulations and may be limited. Under the Regulated Investment Company Modernization Act of 2010 (the Act), the Fund is permitted to carry forward capital losses incurred in taxable years beginning after December 22, 2010 for an unlimited period and such capital losses are required to be used prior to any losses that expire. The capital loss carryforward information presented below, including any applicable limitation, is estimated as of fiscal period end and is subject to adjustment.
No expiration | |
Short-term | $ (1,367,584) |
The tax character of distributions paid was as follows:
| October 31, 2015 | October 31, 2014 |
Ordinary Income | $ 1,198,749 | $ 1,381,317 |
Long-term Capital Gain | 136,020 | - |
Total | $ 1,334,769 | $ 1,381,317 |
Short-Term Trading (Redemption) Fees. Shares held by investors in the Fund less than 90 days may have been subject to a redemption fee equal to 1.50% of the NAV of shares redeemed. All redemption fees, which reduce the proceeds of the shareholder redemption, are retained by the Fund and accounted for as an addition to paid in capital.
Restricted Securities. The Fund may invest in securities that are subject to legal or contractual restrictions on resale. These securities generally may be resold in transactions exempt from registration or to the public if the securities are registered. Disposal of these securities may involve time-consuming negotiations and expense, and prompt sale at an acceptable price may be difficult. Information regarding restricted securities is included at the end of the Fund's Schedule of Investments.
4. Derivative Instruments.
Risk Exposures and the Use of Derivative Instruments. The Fund's investment objective allows the Fund to enter into various types of derivative contracts, including futures contracts. Derivatives are investments whose value is primarily derived from underlying assets, indices or reference rates and may be transacted on an exchange or over-the-counter (OTC). Derivatives may involve a future commitment to buy or sell a specified asset based on specified terms, to exchange future cash flows at periodic intervals based on a notional principal amount, or for one party to make one or more payments upon the occurrence of specified events in exchange for periodic payments from the other party.
Annual Report
4. Derivative Instruments - continued
Risk Exposures and the Use of Derivative Instruments - continued
The Fund used derivatives to increase returns and to manage exposure to certain risks as defined below. The success of any strategy involving derivatives depends on analysis of numerous economic factors, and if the strategies for investment do not work as intended, the Fund may not achieve its objectives.
The Fund's use of derivatives increased or decreased its exposure to the following risks:
Equity Risk | Equity risk relates to the fluctuations in the value of financial instruments as a result of changes in market prices (other than those arising from interest rate risk or foreign exchange risk), whether caused by factors specific to an individual investment, its issuer, or all factors affecting all instruments traded in a market or market segment. |
The Fund is also exposed to additional risks from investing in derivatives, such as liquidity risk and counterparty credit risk. Liquidity risk is the risk that the Fund will be unable to close out the derivative in the open market in a timely manner. Counterparty credit risk is the risk that the counterparty will not be able to fulfill its obligation to the Fund. Counterparty credit risk related to exchange-traded futures contracts may be mitigated by the protection provided by the exchange on which they trade.
Investing in derivatives may involve greater risks than investing in the underlying assets directly and, to varying degrees, may involve risk of loss in excess of any initial investment and collateral received and amounts recognized in the Statement of Assets and Liabilities. In addition, there may be the risk that the change in value of the derivative contract does not correspond to the change in value of the underlying instrument.
Futures Contracts. A futures contract is an agreement between two parties to buy or sell a specified underlying instrument for a fixed price at a specified future date. The Fund used futures contracts to manage its exposure to the stock market.
Upon entering into a futures contract, a fund is required to deposit either cash or securities (initial margin) with a clearing broker in an amount equal to a certain percentage of the face value of the contract. Futures contracts are marked-to-market daily and subsequent daily payments (variation margin) are made or received by a fund depending on the daily fluctuations in the value of the futures contracts and are recorded as unrealized appreciation or (depreciation). This receivable and/or payable, if any, is included in daily variation margin for derivative instruments in the Statement of Assets and Liabilities. Realized gain or (loss) is recorded upon the expiration or closing of a futures contract.
Any open futures contracts at period end are presented in the Schedule of Investments under the caption "Futures Contracts." The underlying face amount at value reflects each contract's exposure to the underlying instrument or index at period end and is
Annual Report
Notes to Financial Statements - continued
4. Derivative Instruments - continued
Futures Contracts - continued
representative of volume of activity during the period. Securities deposited to meet initial margin requirements are identified in the Schedule of Investments.
During the period the Fund recognized net realized gain (loss) of $28,498 and a change in net unrealized appreciation (depreciation) of $21,984 related to its investment in futures contracts. These amounts are included in the Statement of Operations.
5. Purchases and Sales of Investments.
Purchases and sales of securities, other than short-term securities and U.S. government securities, aggregated $54,530,477 and $61,528,390, respectively.
6. Fees and Other Transactions with Affiliates.
Management Fee. Fidelity Management & Research Company (the investment adviser) and its affiliates provide the Fund with investment management related services for which the Fund pays a monthly management fee. The management fee is the sum of an individual fund fee rate that is based on an annual rate of .55% of the Fund's average net assets and an annualized group fee rate that averaged .25% during the period. The group fee rate is based upon the average net assets of all the mutual funds advised by the investment adviser, including any mutual funds previously advised by the investment adviser that are currently advised by Fidelity SelectCo, LLC, an affiliate of the investment adviser. The group fee rate decreases as assets under management increase and increases as assets under management decrease. For the reporting period, the total annual management fee rate was .80% of the Fund's average net assets.
Distribution and Service Plan Fees. In accordance with Rule 12b-1 of the 1940 Act, the Fund has adopted separate Distribution and Service Plans for each class of shares. Certain classes pay Fidelity Distributors Corporation (FDC), an affiliate of the investment adviser, separate Distribution and Service Fees, each of which is based on an annual percentage of each class' average net assets. In addition, FDC may pay financial intermediaries for selling shares of the Fund and providing shareholder support services. For the period, the Distribution and Service Fee rates, total fees and amounts retained by FDC were as follows:
| Distribution
Fee | Service
Fee | Total Fees | Retained
by FDC |
Class A | -% | .25% | $ 31,934 | $ 8,405 |
Class T | .25% | .25% | 22,488 | 8,147 |
Class C | .75% | .25% | 94,344 | 49,446 |
| | | $ 148,766 | $ 65,998 |
Annual Report
6. Fees and Other Transactions with Affiliates - continued
Sales Load. FDC may receive a front-end sales charge of up to 5.75% for selling Class A shares and 3.50% for selling Class T shares, some of which is paid to financial intermediaries for selling shares of the Fund. Depending on the holding period, FDC may receive contingent deferred sales charges levied on Class A, Class T, and Class C redemptions. The deferred sales charges are 1.00% for Class C shares, 1.00% for certain purchases of Class A shares and .25% for certain purchases of Class T shares.
For the period, sales charge amounts retained by FDC were as follows:
| Retained
by FDC |
Class A | $ 4,577 |
Class T | 1,143 |
Class CA | 5,625 |
| $ 11,345 |
A When Class C shares are initially sold, FDC pays commissions from its own resources to financial intermediaries through which the sales are made.
Transfer Agent Fees. Fidelity Investments Institutional Operations Company, Inc., (FIIOC), an affiliate of the investment adviser, is the transfer, dividend disbursing and shareholder servicing agent for each class of the Fund. FIIOC receives account fees and asset-based fees that vary according to the account size and type of account of the shareholders of the respective classes of the Fund. FIIOC pays for typesetting, printing and mailing of shareholder reports, except proxy statements.
For the period, transfer agent fees for each class were as follows:
| Amount | % of
Class-Level Average
Net Assets |
Class A | $ 29,046 | .23 |
Class T | 14,108 | .31 |
Class C | 21,328 | .23 |
Total Emerging Markets | 97,762 | .26 |
Class I | 10,379 | .16 |
| $ 172,623 | |
Accounting and Security Lending Fees. Fidelity Service Company, Inc. (FSC), an affiliate of the investment adviser, maintains the Fund's accounting records. The accounting fee is based on the level of average net assets for each month. Under a separate contract, FSC administers the security lending program. The security lending fee is based on the number and duration of lending transactions.
Annual Report
Notes to Financial Statements - continued
6. Fees and Other Transactions with Affiliates - continued
Brokerage Commissions. The Fund placed a portion of its portfolio transactions with brokerage firms which are affiliates of the investment adviser. Brokerage commissions are included in net realized gain (loss) and change in net unrealized appreciation (depreciation) in the Statement of Operations. The commissions paid to these affiliated firms were $434 for the period.
7. Committed Line of Credit.
The Fund participates with other funds managed by the investment adviser or an affiliate in a $4.25 billion credit facility (the "line of credit") to be utilized for temporary or emergency purposes to fund shareholder redemptions or for other short-term liquidity purposes. The Fund has agreed to pay commitment fees on its pro-rata portion of the line of credit, which amounted to $104 and is reflected in Miscellaneous expenses on the Statement of Operations. During the period, the Fund did not borrow on this line of credit.
8. Security Lending.
The Fund lends portfolio securities through a lending agent from time to time in order to earn additional income. For equity securities, a lending agent is used and may loan securities to certain qualified borrowers, including Fidelity Capital Markets (FCM), a broker-dealer affiliated with the Fund. On the settlement date of the loan, the Fund receives collateral (in the form of U.S. Treasury obligations, letters of credit and/or cash) against the loaned securities and maintains collateral in an amount not less than 100% of the market value of the loaned securities during the period of the loan. The market value of the loaned securities is determined at the close of business of the Fund and any additional required collateral is delivered to the Fund on the next business day. The Fund or borrower may terminate the loan at any time, and if the borrower defaults on its obligation to return the securities loaned because of insolvency or other reasons, the Fund may apply collateral received from the borrower against the obligation. The Fund may experience delays and costs in recovering the securities loaned. Any cash collateral received is invested in the Fidelity Securities Lending Cash Central Fund. At period end, there were no security loans outstanding. Security lending income represents the income earned on investing cash collateral, less rebates paid to borrowers and any lending agent fees associated with the loan, plus any premium payments received for lending certain types of securities. Security lending income is presented in the Statement of Operations as a component of income from Fidelity Central Funds. Total security lending income during the period amounted to $640. During the period, there were no securities loaned to FCM.
Annual Report
9. Expense Reductions.
The investment adviser contractually agreed to reimburse each class to the extent annual operating expenses exceeded certain levels of average net assets as noted in the table below. This reimbursement will remain in place through December 31, 2016. Some expenses, for example interest expense, including commitment fees, are excluded from this reimbursement.
The following classes were in reimbursement during the period:
| Expense
Limitations | Reimbursement |
Class A | 1.65% | $ 35,348 |
Class T | 1.90% | 16,501 |
Class C | 2.40% | 26,141 |
Total Emerging Markets | 1.40% | 119,637 |
Class I | 1.40% | 11,808 |
| | $ 209,435 |
Commissions paid to certain brokers with whom the investment adviser, or its affiliates, places trades on behalf of the Fund include an amount in addition to trade execution, which may be rebated back to the Fund to offset certain expenses. This amount totaled $5,745 for the period. In addition, through arrangements with the Fund's custodian, credits realized as a result of certain uninvested cash balances were used to reduce the Fund's expenses. During the period, these credits reduced the Fund's custody expenses by $199.
In addition, during the period the investment adviser reimbursed and/or waived a portion of fund-level operating expenses in the amount of $278 and a portion of class-level operating expenses as follows:
| Amount |
Class A | $ 359 |
Class T | 94 |
Class C | 192 |
Total Emerging Markets | 1,090 |
Class I | 113 |
| $ 1,848 |
Annual Report
Notes to Financial Statements - continued
10. Distributions to Shareholders.
Distributions to shareholders of each class were as follows:
Years ended October 31, | 2015 | 2014 |
From net investment income | | |
Class A | $ 211,944 | $ 298,475 |
Class T | 63,689 | 72,882 |
Class C | 88,937 | 71,691 |
Total Emerging Markets | 751,293 | 837,446 |
Class I | 82,887 | 100,824 |
Total | $ 1,198,750 | $ 1,381,318 |
From net realized gain | | |
Class A | $ 24,934 | $ - |
Class T | 9,098 | - |
Class C | 18,150 | - |
Total Emerging Markets | 75,507 | - |
Class I | 8,330 | - |
Total | $ 136,019 | $ - |
11. Share Transactions.
Share transactions for each class were as follows and may contain automatic conversions between classes or exchanges between funds:
| Shares | Dollars |
Years ended October 31, | 2015 | 2014 | 2015 | 2014 |
Class A | | | | |
Shares sold | 251,231 | 374,099 | $ 2,772,246 | $ 4,265,512 |
Reinvestment of distributions | 21,174 | 24,147 | 232,918 | 267,553 |
Shares redeemed | (469,131) | (876,261) | (4,963,727) | (9,758,391) |
Net increase (decrease) | (196,726) | (478,015) | $ (1,958,563) | $ (5,225,326) |
Class T | | | | |
Shares sold | 45,171 | 73,071 | $ 491,646 | $ 838,229 |
Reinvestment of distributions | 6,566 | 6,487 | 72,226 | 71,875 |
Shares redeemed | (186,633) | (148,531) | (1,964,687) | (1,659,489) |
Net increase (decrease) | (134,896) | (68,973) | $ (1,400,815) | $ (749,385) |
Class C | | | | |
Shares sold | 198,104 | 312,027 | $ 2,115,228 | $ 3,545,260 |
Reinvestment of distributions | 9,691 | 6,236 | 106,316 | 69,031 |
Shares redeemed | (334,580) | (95,617) | (3,520,139) | (1,079,948) |
Net increase (decrease) | (126,785) | 222,646 | $ (1,298,595) | $ 2,534,343 |
Annual Report
11. Share Transactions - continued
| Shares | Dollars |
Years ended October 31, | 2015 | 2014 | 2015 | 2014 |
Total Emerging Markets | | | | |
Shares sold | 1,772,167 | 1,227,986 | $ 18,534,579 | $ 14,240,572 |
Reinvestment of distributions | 70,595 | 69,851 | 777,256 | 774,644 |
Shares redeemed | (2,136,425) | (1,734,596) | (22,904,245) | (19,517,156) |
Net increase (decrease) | (293,663) | (436,759) | $ (3,592,410) | $ (4,501,940) |
Class I | | | | |
Shares sold | 421,240 | 216,506 | $ 4,563,340 | $ 2,508,322 |
Reinvestment of distributions | 8,237 | 8,910 | 90,609 | 98,814 |
Shares redeemed | (229,844) | (283,392) | (2,428,352) | (3,122,278) |
Net increase (decrease) | 199,633 | (57,976) | $ 2,225,597 | $ (515,142) |
12. Other.
The Fund's organizational documents provide former and current trustees and officers with a limited indemnification against liabilities arising in connection with the performance of their duties to the Fund. In the normal course of business, the Fund may also enter into contracts that provide general indemnifications. The Fund's maximum exposure under these arrangements is unknown as this would be dependent on future claims that may be made against the Fund. The risk of material loss from such claims is considered remote.
At the end of the period, the investment adviser or its affiliates were the owners of record of 13% of the total outstanding shares of the fund.
Annual Report
To the Trustees of Fidelity Investment Trust and the Shareholders of Fidelity Total Emerging Markets Fund:
In our opinion, the accompanying statement of assets and liabilities, including the schedule of investments, and the related statements of operations and of changes in net assets and the financial highlights present fairly, in all material respects, the financial position of Fidelity Total Emerging Markets Fund (a fund of Fidelity Investment Trust) at October 31, 2015, the results of its operations for the year then ended, the changes in its net assets for each of the two years in the period then ended and the financial highlights for each of the periods indicated, in conformity with accounting principles generally accepted in the United States of America. These financial statements and financial highlights (hereafter referred to as "financial statements") are the responsibility of the Fidelity Total Emerging Markets Fund's management. Our responsibility is to express an opinion on these financial statements based on our audits. We conducted our audits of these financial statements in accordance with the standards of the Public Company Accounting Oversight Board (United States). Those standards require that we plan and perform the audit to obtain reasonable assurance about whether the financial statements are free of material misstatement. An audit includes examining, on a test basis, evidence supporting the amounts and disclosures in the financial statements, assessing the accounting principles used and significant estimates made by management, and evaluating the overall financial statement presentation. We believe that our audits, which included confirmation of securities at October 31, 2015 by correspondence with the custodian and brokers, provide a reasonable basis for our opinion.
PricewaterhouseCoopers LLP
Boston, Massachusetts
December 18, 2015
Annual Report
The Trustees, Member of the Advisory Board, and officers of the trust and fund, as applicable, are listed below. The Board of Trustees governs the fund and is responsible for protecting the interests of shareholders. The Trustees are experienced executives who meet periodically throughout the year to oversee the fund's activities, review contractual arrangements with companies that provide services to the fund, oversee management of the risks associated with such activities and contractual arrangements, and review the fund's performance. Each of the Trustees oversees 170 funds.
The Trustees hold office without limit in time except that (a) any Trustee may resign; (b) any Trustee may be removed by written instrument, signed by at least two-thirds of the number of Trustees prior to such removal; (c) any Trustee who requests to be retired or who has become incapacitated by illness or injury may be retired by written instrument signed by a majority of the other Trustees; and (d) any Trustee may be removed at any special meeting of shareholders by a two-thirds vote of the outstanding voting securities of the trust. Each Trustee who is not an interested person (as defined in the 1940 Act) of the trust and the fund (Independent Trustee), shall retire not later than the last day of the calendar year in which his or her 75th birthday occurs. The Independent Trustees may waive this mandatory retirement age policy with respect to individual Trustees. The officers and Advisory Board Member hold office without limit in time, except that any officer and Advisory Board Member may resign or may be removed by a vote of a majority of the Trustees at any regular meeting or any special meeting of the Trustees. Except as indicated, each individual has held the office shown or other offices in the same company for the past five years.
Experience, Skills, Attributes, and Qualifications of the Fund's Trustees. The Governance and Nominating Committee has adopted a statement of policy that describes the experience, qualifications, attributes, and skills that are necessary and desirable for potential Independent Trustee candidates (Statement of Policy). The Board believes that each Trustee satisfied at the time he or she was initially elected or appointed a Trustee, and continues to satisfy, the standards contemplated by the Statement of Policy. The Governance and Nominating Committee also engages professional search firms to help identify potential Independent Trustee candidates who have the experience, qualifications, attributes, and skills consistent with the Statement of Policy. From time to time, additional criteria based on the composition and skills of the current Independent Trustees, as well as experience or skills that may be appropriate in light of future changes to board composition, business conditions, and regulatory or other developments, have also been considered by the professional search firms and the Governance and Nominating Committee. In addition, the Board takes into account the Trustees' commitment and participation in Board and committee meetings, as well as their leadership of standing and ad hoc committees throughout their tenure.
In determining that a particular Trustee was and continues to be qualified to serve as a Trustee, the Board has considered a variety of criteria, none of which, in isolation, was controlling. The Board believes that, collectively, the Trustees have balanced and diverse experience, qualifications, attributes, and skills, which allow the Board to operate effectively in governing the fund and protecting the interests of shareholders. Information about the specific experience, skills, attributes, and qualifications of each Trustee, which in each case led to the Board's conclusion that the Trustee should serve (or continue to serve) as a trustee of the fund, is provided below.
Annual Report
Board Structure and Oversight Function. James C. Curvey is an interested person (as defined in the 1940 Act) and currently serves as Chairman. The Trustees have determined that an interested Chairman is appropriate and benefits shareholders because an interested Chairman has a personal and professional stake in the quality and continuity of services provided to the fund. Independent Trustees exercise their informed business judgment to appoint an individual of their choosing to serve as Chairman, regardless of whether the Trustee happens to be independent or a member of management. The Independent Trustees have determined that they can act independently and effectively without having an Independent Trustee serve as Chairman and that a key structural component for assuring that they are in a position to do so is for the Independent Trustees to constitute a substantial majority for the Board. The Independent Trustees also regularly meet in executive session. Ned C. Lautenbach serves as Chairman of the Independent Trustees and as such (i) acts as a liaison between the Independent Trustees and management with respect to matters important to the Independent Trustees and (ii) with management prepares agendas for Board meetings.
Fidelity funds are overseen by different Boards of Trustees. The fund's Board oversees Fidelity's high income and certain equity funds, and other Boards oversee Fidelity's investment-grade bond, money market, asset allocation, and sector funds. The asset allocation funds may invest in Fidelity funds overseen by the fund's Board. The use of separate Boards, each with its own committee structure, allows the Trustees of each group of Fidelity funds to focus on the unique issues of the funds they oversee, including common research, investment, and operational issues. On occasion, the separate Boards establish joint committees to address issues of overlapping consequences for the Fidelity funds overseen by each Board.
The Trustees operate using a system of committees to facilitate the timely and efficient consideration of all matters of importance to the Trustees, the fund, and fund shareholders and to facilitate compliance with legal and regulatory requirements and oversight of the fund's activities and associated risks. The Board, acting through its committees, has charged FMR and its affiliates with (i) identifying events or circumstances the occurrence of which could have demonstrably adverse effects on the fund's business and/or reputation; (ii) implementing processes and controls to lessen the possibility that such events or circumstances occur or to mitigate the effects of such events or circumstances if they do occur; and (iii) creating and maintaining a system designed to evaluate continuously business and market conditions in order to facilitate the identification and implementation processes described in (i) and (ii) above. Because the day-to-day operations and activities of the fund are carried out by or through FMR, its affiliates and other service providers, the fund's exposure to risks is mitigated but not eliminated by the processes overseen by the Trustees. While each of the Board's committees has responsibility for overseeing different aspects of the fund's activities, oversight is exercised primarily through the Operations, Audit, and Compliance Committees. In addition, the Independent Trustees have worked with FMR to enhance the Board's oversight of investment and financial risks, legal and regulatory risks, technology risks, and operational risks, including the development of additional risk reporting to the Board. For example, a working group comprised of Independent Trustees and FMR has worked and continues to work to review the Fidelity funds' valuation-related activities, reporting and risk management. Appropriate personnel, including but not limited to the fund's Chief Compliance Officer (CCO), FMR's internal auditor, the independent accountants, the fund's Treasurer and portfolio management personnel, make periodic reports to the Board's committees, as appropriate, including an annual review of Fidelity's risk management program for the Fidelity funds. The responsibilities of each standing committee, including their oversight responsibilities, are described further under "Standing Committees of the Fund's Trustees."
Annual Report
Trustees and Officers - continued
The fund's Statement of Additional Information (SAI) includes more information about the Trustees. To request a free copy, call Fidelity at 1-877-208-0098.
Interested Trustees*:
Correspondence intended for each Trustee who is an interested person may be sent to Fidelity Investments, 245 Summer Street, Boston, Massachusetts 02210.
Name, Year of Birth; Principal Occupations and Other Relevant Experience+ |
James C. Curvey (1935) |
Year of Election or Appointment: 2007 Trustee Chairman of the Board of Trustees |
| Mr. Curvey also serves as Trustee of other Fidelity funds. Mr. Curvey is a Director of Fidelity Research & Analysis Co. (investment adviser firm, 2009-present), and Vice Chairman (2007-present) and Director of FMR LLC (diversified financial services company). In addition, Mr. Curvey serves as an Overseer for the Boston Symphony Orchestra and a member of the board of Artis-Naples, Naples, Florida, and as a Trustee for Brewster Academy, Wolfeboro, New Hampshire. Previously, Mr. Curvey served as a Director of Fidelity Investments Money Management, Inc. (investment adviser firm, 2009-2014) and a Director of FMR and FMR Co., Inc. (investment adviser firms, 2007-2014). |
Charles S. Morrison (1960) |
Year of Election or Appointment: 2014 Trustee |
| Mr. Morrison also serves as Trustee of other funds. He serves as a Director of Fidelity Investments Money Management, Inc. (FIMM) (investment adviser firm, 2014-present), Director of Fidelity SelectCo, LLC (investment adviser firm, 2014-present), President, Asset Management (2014-present), and is an employee of Fidelity Investments. Previously, Mr. Morrison served as Vice President of Fidelity's Fixed Income and Asset Allocation Funds (2012-2014), President, Fixed Income (2011-2014), Vice President of Fidelity's Money Market Funds (2005-2009), President, Money Market Group Leader of FMR (investment adviser firm, 2009), and Senior Vice President, Money Market Group of FMR (2004-2009). Mr. Morrison also served as Vice President of Fidelity's Bond Funds (2002-2005), certain Balanced Funds (2002-2005), and certain Asset Allocation Funds (2002-2007), and as Senior Vice President (2002-2005) of Fidelity's Bond Division. |
* Trustees have been determined to be "Interested Trustees" by virtue of, among other things, their affiliation with the trust or various entities under common control with FMR.
+ The information above includes each Trustee's principal occupation during the last five years and other information relating to the experience, attributes, and skills relevant to each Trustee's qualifications to serve as a Trustee, which led to the conclusion that each Trustee should serve as a Trustee for the fund.
Annual Report
Trustees and Officers - continued
Independent Trustees:
Correspondence intended for each Independent Trustee (that is, the Trustees other than the Interested Trustees) may be sent to Fidelity Investments, P.O. Box 55235, Boston, Massachusetts 02205-5235.
Name, Year of Birth; Principal Occupations and Other Relevant Experience+ |
Dennis J. Dirks (1948) |
Year of Election or Appointment: 2005 Trustee |
| Mr. Dirks also serves as Trustee of other Fidelity funds. Prior to his retirement in May 2003, Mr. Dirks was Chief Operating Officer and a member of the Board of The Depository Trust & Clearing Corporation (DTCC). He also served as President, Chief Operating Officer, and Board member of The Depository Trust Company (DTC) and President and Board member of the National Securities Clearing Corporation (NSCC). In addition, Mr. Dirks served as Chief Executive Officer and Board member of the Government Securities Clearing Corporation, Chief Executive Officer and Board member of the Mortgage-Backed Securities Clearing Corporation, as a Trustee and a member of the Finance Committee of Manhattan College (2005-2008), as a Trustee and a member of the Finance Committee of AHRC of Nassau County (2006-2008), and as a member of the Independent Directors Council (IDC) Governing Council (2010-2015). Mr. Dirks is a member of the Board of Directors for The Brookville Center for Children's Services, Inc. (2009-present). |
Alan J. Lacy (1953) |
Year of Election or Appointment: 2008 Trustee |
| Mr. Lacy also serves as Trustee of other Fidelity funds. Mr. Lacy serves as a member of the Board of Directors of Dave & Buster's Entertainment, Inc. (restaurant and entertainment complexes, 2010-present) and Bristol-Myers Squibb Company (global pharmaceuticals, 2008-present). In addition, Mr. Lacy served as Senior Adviser (2007-2014) of Oak Hill Capital Partners, L.P. (private equity) and also served as Chief Executive Officer (2000-2005) and Vice Chairman (2005-2006) of Sears Holdings Corporation and Sears, Roebuck and Co. (retail). Mr. Lacy is a member of the Board of Trustees of The National Parks Conservation Association (2006-present). Previously, Mr. Lacy served as Chairman of the Board of Trustees of the National Parks Conservation Association (2008-2011) and as a member of the Board of Directors for The Western Union Company (global money transfer, 2006-2011), The Hillman Companies, Inc. (hardware wholesalers, 2010-2014), and Earth Fare, Inc. (retail grocery, 2010-2014). |
Ned C. Lautenbach (1944) |
Year of Election or Appointment: 2000 Trustee Chairman of the Independent Trustees |
| Mr. Lautenbach also serves as Trustee of other Fidelity funds. Mr. Lautenbach currently serves as the Lead Director of the Eaton Corporation Board of Directors (diversified industrial, 1997-present). Mr. Lautenbach is Chairman of the Board of Directors of Artis-Naples in Naples, Florida (2012-present), a member of the Council on Foreign Relations (1994-present), and a member of the Board of Governors, State University System of Florida (2013-present). Previously, Mr. Lautenbach was a Partner/Advisory Partner at Clayton, Dubilier & Rice, LLC (private equity investment, 1998-2010), as well as a Director of Sony Corporation (2006-2007). |
Joseph Mauriello (1944) |
Year of Election or Appointment: 2008 Trustee |
| Mr. Mauriello also serves as Trustee of other Fidelity funds. Prior to his retirement in January 2006, Mr. Mauriello served in numerous senior management positions including Deputy Chairman and Chief Operating Officer (2004-2005), and Vice Chairman of Financial Services (2002-2004) of KPMG LLP US (professional services, 1965-2005). Mr. Mauriello currently serves as a member of the Board of Directors of XL Group plc. (global insurance and re-insurance, 2006-present) and the Independent Directors Council (IDC) Governing Council (2015-present). Previously, Mr. Mauriello served as a Director of the Hamilton Funds of the Bank of New York (2006-2007) and of Arcadia Resources Inc. (health care services and products, 2007-2012). |
Robert W. Selander (1950) |
Year of Election or Appointment: 2011 Trustee |
| Mr. Selander also serves as Trustee of other Fidelity funds. Mr. Selander serves as a Director of The Western Union Company (global money transfer, 2014-present). Previously, Mr. Selander served as a Member of the Advisory Board of other Fidelity funds (2011), and Executive Vice Chairman (2010), Chief Executive Officer (2009-2010), and President and Chief Executive Officer (1997-2009) of Mastercard, Inc. |
Cornelia M. Small (1944) |
Year of Election or Appointment: 2005 Trustee |
| Ms. Small also serves as Trustee of other Fidelity funds. Ms. Small is a member of the Board of Directors (2009-present) and Chair of the Investment Committee (2010-present) of the Teagle Foundation. Ms. Small also serves on the Investment Committee of the Berkshire Taconic Community Foundation (2008-present). Previously, Ms. Small served as Chairperson (2002-2008) and a member of the Investment Committee and Chairperson (2008-2012) and a member of the Board of Trustees of Smith College. In addition, Ms. Small served as Chief Investment Officer, Director of Global Equity Investments, and a member of the Board of Directors of Scudder, Stevens & Clark and Scudder Kemper Investments. |
William S. Stavropoulos (1939) |
Year of Election or Appointment: 2001 Trustee Vice Chairman of the Independent Trustees |
| Mr. Stavropoulos also serves as Trustee of other Fidelity funds. Mr. Stavropoulos serves as President and Founder of the Michigan Baseball Foundation, the Great Lakes Loons (2007-present). Mr. Stavropoulos is Chairman Emeritus of the Board of Directors of The Dow Chemical Company, where he previously served in numerous senior management positions, including President, CEO (1995-2000; 2002-2004), Chairman of the Executive Committee (2000-2006), and as a member of the Board of Directors (1990-2006). Currently, Mr. Stavropoulos is Chairman of the Board of Directors of Univar Inc. (global distributor of commodity and specialty chemicals), a Director of Teradata Corporation (data warehousing and technology solutions), and Maersk Inc. (industrial conglomerate), and a member of the Advisory Board for Metalmark Capital LLC (private equity investment, 2005-present). Mr. Stavropoulos is an operating advisor to Clayton, Dubilier & Rice, LLC (private equity investment). In addition, Mr. Stavropoulos is a member of the University of Notre Dame Advisory Council for the College of Science, a Trustee of the Rollin L. Gerstacker Foundation, and a Director of the Naples Philharmonic Center for the Arts. Previously, Mr. Stavropoulos served as a Director of Chemical Financial Corporation (bank holding company, 1993-2012) and Tyco International, Ltd. (multinational manufacturing and services, 2007-2012). |
David M. Thomas (1949) |
Year of Election or Appointment: 2008 Trustee |
| Mr. Thomas also serves as Trustee of other Fidelity funds. Mr. Thomas serves as Non-Executive Chairman of the Board of Directors of Fortune Brands Home and Security (home and security products, 2011-present), as a member of the Board of Directors (2004-present) and Presiding Director (2013-present) of Interpublic Group of Companies, Inc. (marketing communication), and as a member of the Board of Trustees of the University of Florida (2013-present). Previously, Mr. Thomas served as Executive Chairman (2005-2006) and Chairman and Chief Executive Officer (2000-2005) of IMS Health, Inc. (pharmaceutical and healthcare information solutions), and a Director of Fortune Brands, Inc. (consumer products, 2000-2011). |
+ The information above includes each Trustee's principal occupation during the last five years and other information relating to the experience, attributes, and skills relevant to each Trustee's qualifications to serve as a Trustee, which led to the conclusion that each Trustee should serve as a Trustee for the fund.
Advisory Board Member and Officers:
Correspondence intended for each officer and Peter S. Lynch may be sent to Fidelity Investments, 245 Summer Street, Boston, Massachusetts 02210. Officers appear below in alphabetical order.
Name, Year of Birth; Principal Occupation |
Peter S. Lynch (1944) |
Year of Election or Appointment: 2003 Member of the Advisory Board |
| Mr. Lynch also serves as Member of the Advisory Board of other Fidelity funds. Mr. Lynch is Vice Chairman and a Director of FMR (investment adviser firm) and FMR Co., Inc. (investment adviser firm). In addition, Mr. Lynch serves as a Trustee of Boston College and as the Chairman of the Inner-City Scholarship Fund. Previously, Mr. Lynch served on the Special Olympics International Board of Directors (1997-2006). |
Elizabeth Paige Baumann (1968) |
Year of Election or Appointment: 2012 Anti-Money Laundering (AML) Officer |
| Ms. Baumann also serves as AML Officer of other funds. She is Chief AML Officer of FMR LLC (diversified financial services company, 2012-present) and is an employee of Fidelity Investments. Previously, Ms. Baumann served as Vice President and Deputy Anti-Money Laundering Officer (2007-2012). |
Marc R. Bryant (1966) |
Year of Election or Appointment: 2015 Secretary and Chief Legal Officer (CLO) |
| Mr. Bryant also serves as Secretary and CLO of other funds. Mr. Bryant serves as CLO, Secretary, and Senior Vice President of Fidelity Management & Research Company (investment adviser firm, 2015-present) and FMR Co., Inc. (investment adviser firm, 2015-present); Secretary of Fidelity SelectCo, LLC (investment adviser firm, 2015-present) and Fidelity Investments Money Management, Inc. (investment adviser firm, 2015-present); and CLO of Fidelity Management & Research (Hong Kong) Limited (investment adviser firm, 2015-present). He is Senior Vice President and Deputy General Counsel of FMR LLC (diversified financial services company). Previously, Mr. Bryant served as Secretary and Chief Legal Officer of Fidelity Rutland Square Trust II (2010-2014) and Assistant Secretary of Fidelity's Fixed Income and Asset Allocation Funds (2013-2015). Prior to joining Fidelity Investments, Mr. Bryant served as a Senior Vice President and the Head of Global Retail Legal for AllianceBernstein L.P. (2006-2010), and as the General Counsel for ProFund Advisors LLC (2001-2006). |
William C. Coffey (1969) |
Year of Election or Appointment: 2009 Assistant Secretary |
| Mr. Coffey also serves as Assistant Secretary of other funds. He is Senior Vice President and Deputy General Counsel of FMR LLC (diversified financial services company, 2010-present), and is an employee of Fidelity Investments. Previously, Mr. Coffey served as Vice President and Associate General Counsel of FMR LLC (2005-2009). |
Timothy M. Cohen (1969) |
Year of Election or Appointment: 2014 Vice President of certain Equity Funds |
| Mr. Cohen also serves as Vice President of other funds. Mr. Cohen serves as Chief Compliance Officer of FMR Investment Management (U.K.) Limited (investment adviser firm, 2013-present) and is an employee of Fidelity Investments. Previously, Mr. Cohen served as a Director of FMR Investment Management (U.K.) Limited (2013-2015). |
Jonathan Davis (1968) |
Year of Election or Appointment: 2010 Assistant Treasurer |
| Mr. Davis also serves as Assistant Treasurer of other funds, and is an employee of Fidelity Investments. Previously, Mr. Davis served as Vice President and Associate General Counsel of FMR LLC (diversified financial services company, 2003-2010). |
Adrien E. Deberghes (1967) |
Year of Election or Appointment: 2008 Deputy Treasurer |
| Mr. Deberghes also serves as an officer of other funds. He is an employee of Fidelity Investments (2008-present). Prior to joining Fidelity Investments, Mr. Deberghes was Senior Vice President of Mutual Fund Administration at State Street Corporation (2007-2008), Senior Director of Mutual Fund Administration at Investors Bank & Trust (2005-2007), and Director of Finance for Dunkin' Brands (2000-2005). |
Stephanie J. Dorsey (1969) |
Year of Election or Appointment: 2010 Assistant Treasurer |
| Ms. Dorsey also serves as an officer of other funds. She is an employee of Fidelity Investments (2008-present) and has served in other fund officer roles. Prior to joining Fidelity Investments, Ms. Dorsey served as Treasurer (2004-2008) of the JPMorgan Mutual Funds and Vice President (2004-2008) of JPMorgan Chase Bank. |
Howard J. Galligan III (1966) |
Year of Election or Appointment: 2014 Chief Financial Officer |
| Mr. Galligan also serves as Chief Financial Officer of other funds. Mr. Galligan serves as President of Fidelity Pricing and Cash Management Services (FPCMS) (2014-present) and as a Director of Strategic Advisers, Inc. (investment adviser firm, 2008-present). Previously, Mr. Galligan served as Chief Administrative Officer of Asset Management (2011-2014) and Chief Operating Officer and Senior Vice President of Investment Support for Strategic Advisers, Inc. (2003-2011). |
Scott C. Goebel (1968) |
Year of Election or Appointment: 2015 Vice President |
| Mr. Goebel serves as Vice President of other funds and is an employee of Fidelity Investments (2001-present). Previously, Mr. Goebel served as Secretary of Fidelity SelectCo, LLC (investment adviser firm, 2013-2015), Fidelity Investments Money Management, Inc. (FIMM) (investment adviser firm, 2010-2015), and Fidelity Research and Analysis Company (FRAC) (investment adviser firm, 2010-2015); General Counsel, Secretary, and Senior Vice President of Fidelity Management & Research Company (investment adviser firm, 2008-2015) and FMR Co., Inc. (investment adviser firm, 2008-2015); Assistant Secretary of Fidelity Management & Research (Japan) Limited (investment adviser firm, 2008-2015) and FMR Investment Management (U.K.) Limited (investment adviser firm, 2008-2015); Chief Legal Officer (CLO) of Fidelity Management & Research (Hong Kong) Limited (investment adviser firm, 2008-2015); Secretary and CLO of certain Fidelity funds (2008-2015); Assistant Secretary of FIMM (2008-2010), FRAC (2008-2010), and certain funds (2007-2008); and as Vice President and Secretary of Fidelity Distributors Corporation (FDC) (2005-2007). |
Brian B. Hogan (1964) |
Year of Election or Appointment: 2009 Vice President |
| Mr. Hogan also serves as Trustee or Vice President of other funds. Mr. Hogan serves as a Director of Fidelity SelectCo, LLC (investment adviser firm, 2014-present) and President of the Equity Division of FMR (investment adviser firm, 2009-present). Previously, Mr. Hogan served as Senior Vice President, Equity Research of FMR (2006-2009) and as a portfolio manager. |
Chris Maher (1972) |
Year of Election or Appointment: 2013 Assistant Treasurer |
| Mr. Maher serves as Assistant Treasurer of other funds. Mr. Maher is Vice President of Valuation Oversight and is an employee of Fidelity Investments. Previously, Mr. Maher served as Vice President of Asset Management Compliance (2013), Vice President of the Program Management Group of FMR (investment adviser firm, 2010-2013), and Vice President of Valuation Oversight (2008-2010). |
Kenneth B. Robins (1969) |
Year of Election or Appointment: 2008 President and Treasurer |
| Mr. Robins also serves as an officer of other funds. Mr. Robins serves as Executive Vice President of Fidelity Investments Money Management, Inc. (FIMM) (investment adviser firm, 2013-present) and is an employee of Fidelity Investments (2004-present). Previously, Mr. Robins served in other fund officer roles. |
Stacie M. Smith (1974) |
Year of Election or Appointment: 2013 Deputy Treasurer |
| Ms. Smith also serves as an officer of other funds. She is an employee of Fidelity Investments (2009-present) and has served in other fund officer roles. Prior to joining Fidelity Investments, Ms. Smith served as Senior Audit Manager of Ernst & Young LLP (1996-2009). |
Renee Stagnone (1975) |
Year of Election or Appointment: 2013 Deputy Treasurer |
| Ms. Stagnone also serves as Deputy Treasurer of other funds. Ms. Stagnone is an employee of Fidelity Investments (1997-present). |
Linda J. Wondrack (1964) |
Year of Election or Appointment: 2014 Chief Compliance Officer |
| Ms. Wondrack also serves as Chief Compliance Officer of other funds. Ms. Wondrack is Executive Vice President and head of the Ethics Office and Asset Management Compliance for Fidelity Investments (2012-present). Ms. Wondrack also serves as Chief Compliance Officer of Fidelity SelectCo, LLC (investment adviser firm, 2014-present); Chief Compliance Officer of Impresa Management LLC (2013-present); and Chief Compliance Officer of FMR Co., Inc. (investment adviser firm), Fidelity Investments Money Management, Inc. (investment adviser firm), Fidelity Management & Research (Japan) Limited (investment adviser firm), FMR Investment Management (U.K.) Limited (investment adviser firm), Fidelity Management & Research (Hong Kong) (investment adviser firm), Fidelity Management & Research Company (investment adviser firm), FIAM LLC (investment adviser firm), and Strategic Advisers, Inc. (investment adviser firm), Ballyrock Investment Advisors LLC, and Northern Neck Investors LLC (2012-present). Previously, Ms. Wondrack served as Senior Vice President and Chief Compliance Officer for Columbia Management Investment Advisers, LLC (2005-2012); Chief Compliance Officer for certain funds within the Columbia Family of Funds (2007-2012); and Senior Vice President of Compliance Risk Management at Bank of America (2005-2010). |
Joseph F. Zambello (1957) |
Year of Election or Appointment: 2011 Deputy Treasurer |
| Mr. Zambello also serves as Deputy Treasurer of other funds. Mr. Zambello is an employee of Fidelity Investments (1991-present). Previously, Mr. Zambello served as Vice President of the Program Management Group of FMR (investment adviser firm, 2009-2011) and Vice President of the Transfer Agent Oversight Group (2005-2009). |
Annual Report
Class I designates 61% of the dividends distributed during the fiscal year as amounts which may be taken into account as a dividend for the purposes of the maximum rate under section 1(h)(11) of the Internal Revenue Code.
The amounts per share which represent income derived from sources within, and taxes paid to, foreign countries or possessions of the United States are as follows:
| Pay Date | Income | Taxes |
Class I | 12/08/14 | $0.2241 | $0.0251 |
The fund will notify shareholders in January 2016 of amounts for use in preparing 2015 income tax returns.
Annual Report
Fidelity Total Emerging Markets Fund
Each year, the Board of Trustees, including the Independent Trustees (together, the Board), votes on the renewal of the management contract with Fidelity Management & Research Company (FMR) and the sub-advisory agreements (together, the Advisory Contracts) for the fund. The Board, assisted by the advice of fund counsel and Independent Trustees' counsel, requests and considers a broad range of information relevant to the renewal of the Advisory Contracts throughout the year.
The Board meets regularly and, at each of its meetings, covers an extensive agenda of topics and materials and considers factors that are relevant to its annual consideration of the renewal of the fund's Advisory Contracts, including the services and support provided to the fund and its shareholders. The Board has established various standing committees (Committees), each composed of and chaired by Independent Trustees with varying backgrounds, to which the Board has assigned specific subject matter responsibilities in order to enhance effective decision-making by the Board. The Board, acting directly and through its Committees, requests and receives information concerning the annual consideration of the renewal of the fund's Advisory Contracts. The Board also meets as needed to consider matters specifically related to the Board's annual consideration of the renewal of the Advisory Contracts. Members of the Board may also meet with trustees of other Fidelity funds through ad hoc joint committees to discuss certain matters relevant to all of the Fidelity funds.
At its July 2015 meeting, the Board unanimously determined to renew the fund's Advisory Contracts. In reaching its determination, the Board considered all factors it believed relevant, including (i) the nature, extent, and quality of the services to be provided to the fund and its shareholders (including the investment performance of the fund); (ii) the competitiveness of the fund's management fee and total expense ratio relative to peer funds; (iii) the total costs of the services to be provided by and the profits to be realized by Fidelity from its relationship with the fund; and (iv) the extent to which (if any) economies of scale exist and would be realized as each fund grows, and whether any economies of scale are appropriately shared with fund shareholders.
In considering whether to renew the Advisory Contracts for the fund, the Board reached a determination, with the assistance of fund counsel and Independent Trustees' counsel and through the exercise of its business judgment, that the renewal of the Advisory Contracts was in the best interests of the fund and its shareholders and that the compensation payable under the Advisory Contracts was fair and reasonable. The Board's decision to renew the Advisory Contracts was not based on any single factor, but rather was based on a comprehensive consideration of all the information provided to the Board at its meetings throughout the year. The Board, in reaching its determination to renew the Advisory Contracts, was aware that shareholders of the fund have a broad range of investment choices available to them, including a wide choice among funds offered by Fidelity's competitors, and that the fund's shareholders, who have the opportunity to review and weigh the disclosure provided by the fund in its prospectus and other public disclosures, have chosen to invest in this fund, which is part of the Fidelity family of funds.
Annual Report
Nature, Extent, and Quality of Services Provided. The Board considered Fidelity's staffing as it relates to the fund, including the backgrounds of investment personnel of Fidelity, and also considered the fund's investment objective, strategies, and related investment philosophy. The Independent Trustees also had discussions with senior management of Fidelity's investment operations and investment groups. The Board considered the structure of the portfolio manager compensation program and whether this structure provides appropriate incentives to act in the best interests of the fund. Additionally, the Board considered the portfolio managers' investments, if any, in the funds that they manage.
Resources Dedicated to Investment Management and Support Services. The Board and the Fund Oversight and Research Committees reviewed the general qualifications and capabilities of Fidelity's investment staff, including its size, education, experience, and resources, as well as Fidelity's approach to recruiting, training, managing, and compensating investment personnel. The Board noted that Fidelity has continued to increase the resources devoted to non-U.S. offices, including expansion of Fidelity's global investment organization. The Board also noted that Fidelity's analysts have extensive resources, tools and capabilities that allow them to conduct sophisticated quantitative and fundamental analysis, as well as credit analysis of issuers, counterparties and guarantors. Further, the Board considered that Fidelity's investment professionals have sufficient access to global information and data so as to provide competitive investment results over time, and that those professionals also have access to sophisticated tools that permit them to assess portfolio construction and risk and performance attribution characteristics continuously, as well as to transmit new information and research conclusions rapidly around the world. Additionally, in its deliberations, the Board considered Fidelity's trading, risk management, and compliance capabilities and resources, which are integral parts of the investment management process.
Shareholder and Administrative Services. The Board considered (i) the nature, extent, quality, and cost of advisory, administrative, and shareholder services performed by FMR, the sub-advisers (together with FMR, the Investment Advisers), and their affiliates under the Advisory Contracts and under separate agreements covering transfer agency, pricing and bookkeeping, and securities lending services for the fund; (ii) the nature and extent of the supervision of third party service providers, principally custodians and subcustodians; and (iii) the resources devoted to, and the record of compliance with, the fund's compliance policies and procedures. The Board also reviewed the allocation of fund brokerage, including allocations to brokers affiliated with the Investment Advisers, the use of brokerage commissions to pay fund expenses, and the use of "soft" commission dollars to pay for research services.
Annual Report
Board Approval of Investment Advisory Contracts and
Management Fees - continued
The Board noted that the growth of fund assets over time across the complex allows Fidelity to reinvest in the development of services designed to enhance the value or convenience of the Fidelity funds as investment vehicles. These services include 24-hour access to account information and market information through telephone representatives and over the Internet, investor education materials and asset allocation tools, and the expanded availability of Fidelity Investor Centers.
In 2014, the Board formed an ad hoc Committee on Transfer Agency Fees to review the variety of transfer agency fee structures throughout the industry and Fidelity's competitive positioning with respect to industry participants.
Investment in a Large Fund Family. The Board considered the benefits to shareholders of investing in a Fidelity fund, including the benefits of investing in a fund that is part of a large family of funds offering a variety of investment disciplines and providing a large variety of mutual fund investor services. The Board noted that Fidelity had taken, or had made recommendations that resulted in the Fidelity funds taking, a number of actions over the previous year that benefited particular funds, including (i) continuing to dedicate additional resources to investment research and to the support of the senior management team that oversees asset management; (ii) continuing efforts to enhance Fidelity's global research capabilities; (iii) launching new funds and making other enhancements to meet client needs; (iv) reducing management fees and total expenses for certain index funds and diversified international funds; (v) continuing to launch dedicated lower cost underlying funds to meet portfolio construction needs related to expanding underlying fund options for Fidelity funds of funds, specifically for the Freedom Fund product lines; (vi) rationalizing product lines and gaining increased efficiencies through fund mergers; (vii) launching active fixed-income exchange-traded funds; (viii) continuing to develop, acquire and implement systems and technology to improve services to the funds and information security and to increase efficiency; (ix) implementing investment enhancements to further strengthen Fidelity's target date product line to increase investors' probability of success in achieving their goals; (x) modifying the eligibility criteria for certain share classes to accommodate roll-over assets from employer-sponsored retirement plans; (xi) launching a new Class W of the Freedom Index Funds to attract and retain Fidelity record-kept retirement plan assets; and (xii) implementing changes to Fidelity's money market product line in response to recent money market regulatory reforms.
Investment Performance. The Board considered whether the fund has operated in accordance with its investment objective, as well as its record of compliance with its investment restrictions and its performance history. The Board noted that there was a portfolio management change for the fund in September 2014.
Annual Report
The Board took into account discussions with representatives of the Investment Advisers about fund investment performance that occur at Board meetings throughout the year. In this regard the Board noted that as part of regularly scheduled fund reviews and other reports to the Board on fund performance, the Board considers annualized return information for the fund, for different time periods, measured against a securities market index ("benchmark index") and a peer group of funds with similar objectives ("peer group"), if any. In its evaluation of fund investment performance, the Board gave particular attention to information indicating changes in performance of certain Fidelity funds for specific time periods and discussed with the Investment Advisers the reasons for any overperformance or underperformance.
In addition to reviewing absolute and relative fund performance, the Independent Trustees periodically consider the appropriateness of fund performance metrics in evaluating the results achieved. In general, the Independent Trustees believe that fund performance should be evaluated based on net performance (after fees and expenses) of both the highest performing and lowest performing fund share classes, where applicable, compared to appropriate benchmark indices, over appropriate time periods that may include full market cycles, and compared to peer groups, as applicable, over the same periods, taking into account relevant factors including the following: general market conditions; issuer-specific information; and fund cash flows and other factors.
The Independent Trustees recognize that shareholders evaluate performance on a net basis over their own holding periods, for which one-, three-, and five-year periods are often used as a proxy. For this reason, the performance information reviewed by the Board also included net cumulative calendar year total return information for the fund and an appropriate benchmark index for the most recent one- and three-year periods, as shown below. A peer group is not shown below because the fund does not generally utilize a peer group for performance comparison purposes.
Annual Report
Board Approval of Investment Advisory Contracts and
Management Fees - continued
Fidelity Total Emerging Markets Fund

Based on its review, the Board concluded that the nature, extent, and quality of services provided to the fund under the Advisory Contracts should benefit the shareholders of the fund.
Competitiveness of Management Fee and Total Expense Ratio. The Board considered the fund's management fee and total expense ratio compared to "mapped groups" of competitive funds and classes created for the purpose of facilitating the Trustees' competitive analysis of management fees and total expenses. Fidelity creates "mapped groups" by combining similar Lipper investment objective categories that have comparable investment mandates. Combining Lipper investment objective categories aids the Board's management fee and total expense ratio comparisons by broadening the competitive group used for comparison.
Management Fee. The Board considered two proprietary management fee comparisons for the 12-month (or shorter) periods shown in basis points (BP) in the chart below. The group of Lipper funds used by the Board for management fee comparisons is referred to below as the "Total Mapped Group." The Total Mapped Group comparison focuses on a fund's standing in terms of gross management fees before expense reimbursements or caps relative to the total universe of funds with comparable investment mandates, regardless of whether their management fee structures also are comparable. Funds with comparable investment mandates offer exposure to similar types of securities. Funds with comparable management fee structures have similar management fee contractual arrangements (e.g., flat rate charged for advisory services, all-inclusive fee rate, etc.). "TMG %" represents the percentage of funds in the Total Mapped Group that had management fees that were lower than the fund's. For example, a hypothetical TMG % of 20% would mean that 80% of the funds in the Total Mapped Group had higher, and 20% had lower, management fees than the fund. The fund's actual TMG %s and the number of funds in the Total Mapped Group are in the chart below. The "Asset-Size Peer Group" (ASPG) comparison focuses on a fund's standing relative to a subset of non-Fidelity funds within the Total Mapped Group that are similar in size and management fee structure without taking into account performance adjustments, if any. For example, if a fund is in the first quartile of the ASPG, the fund's management fee ranks in the least expensive or lowest 25% of funds in the ASPG. The ASPG represents at least 15% of the funds in the Total Mapped Group with comparable asset size and management fee structures, subject to a minimum of 50 funds (or all funds in the Total Mapped Group if fewer than 50). Additional information, such as the ASPG quartile in which the fund's management fee rate ranked, is also included in the chart and considered by the Board.
Annual Report
Fidelity Total Emerging Markets Fund
The Board noted that the fund's management fee rate ranked below the median of its Total Mapped Group and below the median of its ASPG for 2014.
The Board noted that, in 2014, the ad hoc Committee on Group Fee was formed by it and other Fidelity fund boards to conduct an in-depth review of the "group fee" component of the management fee of funds with such management fee structures. Committee focus included the mechanics of the group fee, the competitive landscape of group fee structures, Fidelity funds with no group fee component and investment products not included in group fee assets. The Board also considered that, for funds subject to the group fee,
Annual Report
Board Approval of Investment Advisory Contracts and
Management Fees - continued
FMR agreed to voluntarily waive fees over a specified period of time in amounts designed to account for assets converted from certain funds to certain collective investment trusts.
The Board also noted that, in 2013, the ad hoc Committee on Management Fees was formed to conduct an in-depth review of the management fee rates of Fidelity's active equity mutual funds. The Committee focused on the following areas: (i) standard fee structures; (ii) research consumption and trading evolution; (iii) management fee competitiveness/profitability by category; and (iv) factors that drive institutional pricing.
Based on its review, the Board concluded that the fund's management fee is fair and reasonable in light of the services that the fund receives and the other factors considered.
Total Expense Ratio. In its review of each class's total expense ratio the Board considered the fund's management fee as well as other fund or class expenses, as applicable, such as transfer agent fees, pricing and bookkeeping fees, fund-paid 12b-1 fees, and custodial, legal, and audit fees. The Board also noted that Fidelity may agree to waive fees and expenses from time to time, and the extent to which, if any, it has done so for the fund. As part of its review, the Board also considered the current and historical total expense ratios of each class of the fund compared to competitive fund median expenses. Each class of the fund is compared to those funds and classes in the Total Mapped Group (used by the Board for management fee comparisons) that have a similar sales load structure.
The Board noted that the total expense ratio of each of Class A and the retail class ranked below its competitive median for 2014 and the total expense ratio of each of Class T, Class C, and Class I ranked above its competitive median for 2014. The Board considered that, in general, various factors can affect total expense ratios. The Board noted that the total expense ratio of Class T was above the competitive median primarily because of higher 12b-1 fees on Class T as compared to most competitor funds. Class T has a higher 12b-1 fee, but a lower front-end sales charge, than traditionally priced front-end sales charge classes. The Board considered that Class T is primarily sold load-waived in the retirement plan market where its 0.50% 12b-1 fee is comparable to competing no-load, higher 12b-1 fee classes designed specifically for retirement plans. The Board noted that the fund offers multiple classes, each of which has a different sales load and 12b-1 fee structure, and that the multiple structures are intended to offer a range of pricing options for the intermediary market. The Board also noted that the total expense ratios of the classes vary primarily by the level of their 12b-1 fees, although differences in transfer agent fees may also cause expenses to vary from class to class.
The Board further considered that FMR contractually agreed to reimburse Class A, Class T, Class C, Class I, and the retail class of the fund to the extent that total operating expenses (excluding interest, certain taxes, certain securities lending costs, brokerage commissions, extraordinary expenses, and acquired fund fees and expenses, if any), as a percentage of their respective average net assets, exceed 1.65%, 1.90%, 2.40%, 1.40%, and 1.40% through December 31, 2015.
Annual Report
Fees Charged to Other Fidelity Clients. The Board also considered Fidelity fee structures and other information with respect to clients of Fidelity, such as other funds advised or subadvised by Fidelity, pension plan clients, and other institutional clients with similar mandates. The Board noted the findings of the 2013 ad hoc joint committee (created with the board of other Fidelity funds), which reviewed and compared Fidelity's institutional investment advisory business with its business of providing services to the Fidelity funds, including the differences in services provided, fees charged, and costs incurred, as well as competition in their respective marketplaces.
Based on its review of total expense ratios and fees charged to other Fidelity clients, the Board concluded that, although in some cases above the median of the universe presented for comparison, the total expense ratio of each class of the fund was reasonable in light of the services that the fund and its shareholders receive and the other factors considered.
Costs of the Services and Profitability. The Board considered the revenues earned and the expenses incurred by Fidelity in conducting the business of developing, marketing, distributing, managing, administering and servicing the fund and servicing the fund's shareholders. The Board also considered the level of Fidelity's profits in respect of all the Fidelity funds.
On an annual basis, Fidelity presents to the Board information about the profitability of its relationship with the fund. Fidelity calculates profitability information for each fund, as well as aggregate profitability information for groups of Fidelity funds and all Fidelity funds, using a series of detailed revenue and cost allocation methodologies which originate with the books and records of Fidelity on which Fidelity's audited financial statements are based. The Audit Committee of the Board reviews any significant changes from the prior year's methodologies.
PricewaterhouseCoopers LLP (PwC), independent registered public accounting firm and auditor to Fidelity and certain Fidelity funds, has been engaged annually by the Board as part of the Board's assessment of Fidelity's profitability analysis. PwC's engagement includes the review and assessment of the methodologies used by Fidelity in determining the revenues and expenses attributable to Fidelity's mutual fund business, and completion of agreed-upon procedures in respect of the mathematical accuracy of fund profitability and its conformity to established allocation methodologies. After considering PwC's reports issued under the engagement and information provided by Fidelity, the Board concluded that while other allocation methods may also be reasonable, Fidelity's profitability methodologies are reasonable in all material respects.
Annual Report
Board Approval of Investment Advisory Contracts and
Management Fees - continued
The Board also reviewed Fidelity's non-fund businesses and fall-out benefits related to the mutual fund business as well as cases where Fidelity's affiliates may benefit from or be related to the fund's business.
The Board considered the costs of the services provided by and the profits realized by Fidelity in connection with the operation of the fund and was satisfied that the profitability was not excessive.
Economies of Scale. The Board considered whether there have been economies of scale in respect of the management of the Fidelity funds, whether the Fidelity funds (including the fund) have appropriately benefited from any such economies of scale, and whether there is potential for realization of any further economies of scale. The Board considered the extent to which the fund will benefit from economies of scale as assets grow through increased services to the fund, through waivers or reimbursements, or through fee or expense ratio reductions. The Board also noted that in 2013, it and the boards of other Fidelity funds created an ad hoc committee (the Economies of Scale Committee) to analyze whether Fidelity attains economies of scale in respect of the management and servicing of the Fidelity funds, whether the Fidelity funds have appropriately benefited from such economies of scale, and whether there is potential for realization of any further economies of scale.
The Board recognized that the fund's management contract incorporates a "group fee" structure, which provides for lower group fee rates as total group assets increase, and for higher group fee rates as total group assets decrease (with "group assets" defined to include fund assets under FMR's management plus sector fund assets previously under FMR's management and currently managed by Fidelity SelectCo, LLC). FMR calculates the group fee rates based on a tiered asset "breakpoint" schedule that varies based on asset class. The Board considered that the group fee is designed to deliver the benefits of economies of scale to fund shareholders when total Fidelity fund assets increase, even if assets of any particular fund are unchanged or have declined, because some portion of Fidelity's costs are attributable to services provided to all Fidelity funds, and all funds benefit if those costs can be allocated among more assets. The Board concluded that, given the group fee structure, fund shareholders will benefit from lower management fees as group assets increase at the fund complex level, regardless of whether Fidelity achieves any such economies of scale.
The Board concluded, taking into account the analysis of the Economies of Scale Committee, that economies of scale, if any, are being appropriately shared between fund shareholders and Fidelity.
Additional Information Requested by the Board. In order to develop fully the factual basis for consideration of the Fidelity funds' Advisory Contracts, the Board requested and received additional information on certain topics, including: (i) fund performance trends and Fidelity's long-term strategies for certain funds; (ii) the various share classes employed by Fidelity and the attributes of each class, together with similar information on the distribution and servicing payments made by Fidelity or the funds to third-party participants in the distribution channels; (iii) fund profitability, and fund performance in relation to fund profitability; (iv) the methodology with respect to evaluating competitive fund data and peer group classifications and fee comparisons; (v) annual fund profitability margins, with particular focus on certain funds with negative margins; (vi) the realization of fall-out benefits in certain Fidelity business units; (vii) economies of scale and the way in which they are shared with fund shareholders; (viii) Fidelity's group fee structures, including the group fee schedule of breakpoints; (ix) the impact of cost containment measures on the funds; and (x) the transfer agent fee structure.
Annual Report
Based on its evaluation of all of the conclusions noted above, and after considering all factors it believed relevant, the Board concluded that the advisory fee structures are fair and reasonable, and that the fund's Advisory Contracts should be renewed.
Annual Report
Investment Adviser
Fidelity Management & Research Company
Boston, MA
Investment Sub-Advisers
FMR Co., Inc.
FMR Investment Management
(U.K.) Limited
Fidelity Management & Research
(Hong Kong) Limited
Fidelity Management & Research
(Japan) Limited
FIL Investment Advisors
FIL Investment Advisors (UK) Limited
FIL Investments (Japan) Limited
General Distributor
Fidelity Distributors Corporation
Smithfield, RI
Transfer and Service Agents
Fidelity Investments Institutional Operations Company, Inc.
Boston, MA
Fidelity Service Company, Inc.
Boston, MA
Custodian
The Northern Trust Company
Chicago, IL
(Fidelity Investment logo)(registered trademark)
ATEKI-UANN-1215
1.931260.103
ContentsPerformance: The Bottom LineManagement's Discussion of Fund PerformanceShareholder Expense ExampleInvestment Changes (Unaudited)Investments October 31, 2015Financial StatementsNotes to Financial StatementsReport of Independent Registered Public Accounting FirmTrustees and OfficersDistributions (Unaudited)Board Approval of Investment Advisory Contracts and Management Fees
(Fidelity Investment logo)(registered trademark)
Fidelity Advisor®
Total Emerging Markets
Fund - Class A, Class T,
and Class C
Annual Report
October 31, 2015
(Fidelity Cover Art)
Class A, Class T, and
Class C are classes of
Fidelity® Total Emerging
Markets Fund
Contents
Performance | (Click Here) | How the fund has done over time. |
Management's Discussion of Fund Performance | (Click Here) | The Portfolio Manager's review of fund performance and strategy. |
Shareholder Expense Example | (Click Here) | An example of shareholder expenses. |
Investment Changes | (Click Here) | A summary of major shifts in the fund's investments over the past six months. |
Investments | (Click Here) | A complete list of the fund's investments with their market values. |
Financial Statements | (Click Here) | Statements of assets and liabilities, operations, and changes in net assets, as well as financial highlights. |
Notes | (Click Here) | Notes to the financial statements. |
Report of Independent Registered Public Accounting Firm | (Click Here) | |
Trustees and Officers | (Click Here) | |
Distributions | (Click Here) | |
Board Approval of Investment Advisory Contracts and Management Fees | (Click Here) | |
To view a fund's proxy voting guidelines and proxy voting record for the 12-month period ended June 30, visit http://www.fidelity.com/proxyvotingresults or visit the Securities and Exchange Commission's (SEC) web site at http://www.sec.gov. You may also call 1-877-208-0098 to request a free copy of the proxy voting guidelines.
Standard & Poor's, S&P and S&P 500 are registered service marks of The McGraw-Hill Companies, Inc. and have been licensed for use by Fidelity Distributors Corporation.
Other third-party marks appearing herein are the property of their respective owners.
All other marks appearing herein are registered or unregistered trademarks or service marks of FMR LLC or an affiliated company. © 2015 FMR LLC. All rights reserved.
Annual Report
This report and the financial statements contained herein are submitted for the general information of the shareholders of the fund. This report is not authorized for distribution to prospective investors in the fund unless preceded or accompanied by an effective prospectus.
A fund files its complete schedule of portfolio holdings with the SEC for the first and third quarters of each fiscal year on Form N-Q. Forms N-Q are available on the SEC's web site at http://www.sec.gov. A fund's Forms N-Q may be reviewed and copied at the SEC's Public Reference Room in Washington, DC. Information regarding the operation of the SEC's Public Reference Room may be obtained by calling 1-800-SEC-0330. For a complete list of a fund's portfolio holdings, view the most recent holdings listing, semiannual report, or annual report on Fidelity's web site at http://www.fidelity.com, http://advisor.fidelity.com, or http://www.401k.com, as applicable.
NOT FDIC INSURED • MAY LOSE VALUE • NO BANK GUARANTEE
Neither the fund nor Fidelity Distributors Corporation is a bank.
Annual Report
Average annual total return reflects the change in the value of an investment, assuming reinvestment of the class' distributions from dividend income and capital gains (the profits earned upon the sale of securities that have grown in value, if any) and assuming a constant rate of performance each year. The $10,000 table and the fund's returns do not reflect the deduction of taxes that a shareholder would pay on fund distributions or the redemption of fund shares. During periods of reimbursement by Fidelity, a fund's total return will be greater than it would be had the reimbursement not occurred. How a fund did yesterday is no guarantee of how it will do tomorrow.
Average Annual Total Returns
Periods ended October 31, 2015 | Past 1
year | Life of fund A |
Class A (incl. 5.75% sales charge) | -14.16% | 0.62% |
Class T (incl. 3.50% sales charge) | -12.36% | 0.95% |
Class C (incl. contingent deferred sales charge) B | -10.57% | 1.33% |
A From November 1, 2011.
B Class C shares' contingent deferred sales charges included in the past one year and life of fund total return figures are 1% and 0%, respectively.
$10,000 Over Life of Fund
Let's say hypothetically that $10,000 was invested in Fidelity Advisor® Total Emerging Markets Fund - Class A on November 1, 2011, when the fund started, and the current 5.75% sales charge was paid. The chart shows how the value of your investment would have changed, and also shows how the MSCI Emerging Markets Index performed over the same period.
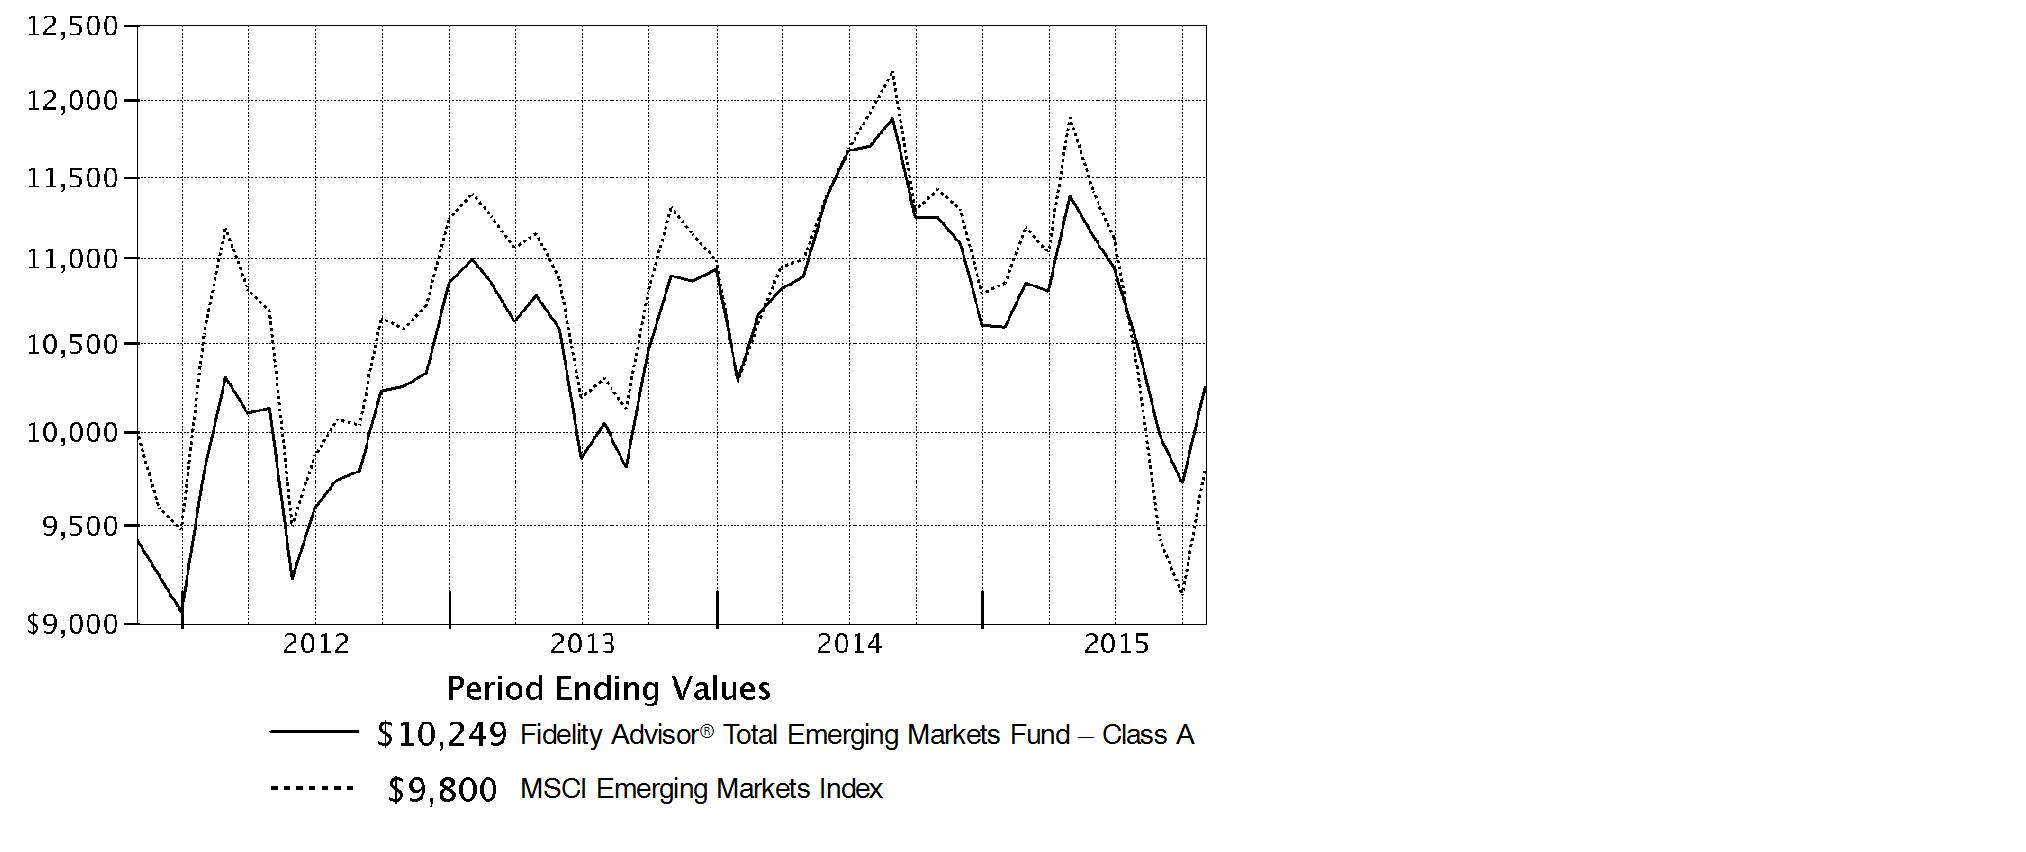
Annual Report
Fidelity Total Emerging Markets Fund
Market Recap: Following a tough time in August and September wherein a collapse in commodities prices hurt resources-related sectors and geographies, global equities rebounded in October to finish flat for the year ending October 31, 2015. The MSCI ACWI (All Country World Index) Index returned 0.35% for the period. Among market sectors, energy (-22%) and materials (-12%) declined sharply, whereas consumer discretionary (+13%) saw a gain driven largely by demand in the U.S. (+5%). Commodity prices and producers remained under pressure, largely from economic deceleration in China (-1%), a leading consumer of raw materials. This effect was exacerbated by U.S. dollar strength relative to global currencies, which weighed on commodities priced in dollars and acutely impacted equity returns within regions most exposed to resources prices. The emerging-markets (EM) group, for example, returned -15% this period. Canada, a significant energy producer, returned -17%. Net energy consumer Japan (+9%) proved the best-performing region by far. In fixed income, the Barclays Global Aggregate GDP Weighted Index returned -3.85% for the year, despite a modest gain from the U.S., the world's largest bond market. Investors continued to seek safe haven in U.S. bonds amid economic weakness throughout much of Europe and parts of Asia. EM and Canadian debt roughly paralleled equity underperformance.
Comments from Lead Portfolio Manager John Carlson: For the year, the fund's share classes (excluding sales charges, if applicable) turned in high-single-digit declines, straddling the -8.76% return of the Fidelity Total Emerging Markets Composite Index. For the full year, the fund held an overweighting, on average, in equity and a corresponding underweighting in debt versus the Composite index, which, in aggregate, had only a marginal positive influence on relative performance. Security selection within the fund's equity subportfolio was the biggest contributor. From a geographical perspective, equity investments in India, Malaysia and Mexico were helpful. Among sectors, picks in telecommunication services, consumer staples, information technology and materials lifted performance most, whereas choices in health care hurt. Looking at individual stocks, our substantial overweighting in China Life Insurance was the equity sleeve's top relative contributor this period. Conversely, an overweighting in underperforming Daewoo International, South Korea's largest trading company, was the fund's biggest individual detractor. The stock underperformed due to the businesses' link to global oil prices, which fell by nearly 50% during the period.
Note to shareholders: Xiatong Zhao was named Co-Manager of the fund, effective October 1, 2015.
The views expressed above reflect those of the portfolio manager(s) only through the end of the period as stated on the cover of this report and do not necessarily represent the views of Fidelity or any other person in the Fidelity organization. Any such views are subject to change at any time based upon market or other conditions and Fidelity disclaims any responsibility to update such views. These views may not be relied on as investment advice and, because investment decisions for a Fidelity fund are based on numerous factors, may not be relied on as an indication of trading intent on behalf of any Fidelity fund.
Annual Report
Fidelity Total Emerging Markets Fund
Shareholder Expense Example
As a shareholder of the Fund, you incur two types of costs: (1) transaction costs, including sales charges (loads) on purchase payments or redemption proceeds, redemption fees and (2) ongoing costs, including management fees, distribution and/or service (12b-1) fees and other Fund expenses. This Example is intended to help you understand your ongoing costs (in dollars) of investing in the Fund and to compare these costs with the ongoing costs of investing in other mutual funds.
The Example is based on an investment of $1,000 invested at the beginning of the period and held for the entire period (May 1, 2015 to October 31, 2015).
Actual Expenses
The first line of the accompanying table for each class of the Fund provides information about actual account values and actual expenses. You may use the information in this line, together with the amount you invested, to estimate the expenses that you paid over the period. Simply divide your account value by $1,000.00 (for example, an $8,600 account value divided by $1,000.00 = 8.6), then multiply the result by the number in the first line for a class of the Fund under the heading entitled "Expenses Paid During Period" to estimate the expenses you paid on your account during this period. A small balance maintenance fee of $12.00 that is charged once a year may apply for certain accounts with a value of less than $2,000. This fee is not included in the table below. If it was, the estimate of expenses you paid during the period would be higher, and your ending account value lower, by this amount. In addition, the Fund, as a shareholder in the underlying Fidelity Central Funds, will indirectly bear its pro-rata share of the fees and expenses incurred by the underlying Fidelity Central Funds. These fees and expenses are not included in the Fund's annualized expense ratio used to calculate the expense estimate in the table below.
Hypothetical Example for Comparison Purposes
The second line of the accompanying table for each class of the Fund provides information about hypothetical account values and hypothetical expenses based on a Class' actual expense ratio and an assumed rate of return of 5% per year before expenses, which is not the Class' actual return. The hypothetical account values and expenses may not be used to estimate the actual ending account balance or expenses you paid for the period. You may use this information to compare the ongoing costs of investing in the Fund and other funds. To do so, compare this 5% hypothetical example with the 5% hypothetical examples that appear in the shareholder reports of the other funds. A small balance maintenance fee of $12.00 that is charged once a year may apply for certain accounts with a value of less than $2,000. This fee is not included in the table below. If it was, the estimate of expenses you paid during the period would be higher, and your ending account value lower, by this amount. In addition, the Fund, as a shareholder in the underlying Fidelity Central Funds, will indirectly bear its pro-rata share of the fees and expenses incurred by the underlying Fidelity Central Funds. These fees and expenses are not included in the Fund's annualized expense ratio used to calculate the expense estimate in the table below.
Please note that the expenses shown in the table are meant to highlight your ongoing costs only and do not reflect any transaction costs. Therefore, the second line of the table is useful in comparing ongoing costs only, and will not help you determine the relative total costs of owning different funds. In addition, if these transactional costs were included, your costs would have been higher.
Annual Report
| Annualized
Expense RatioB | Beginning
Account Value
May 1, 2015 | Ending
Account Value
October 31, 2015 | Expenses Paid
During PeriodC
May 1, 2015 to
October 31, 2015 |
Class A | 1.65% | | | |
Actual | | $ 1,000.00 | $ 900.00 | $ 7.90 |
HypotheticalA | | $ 1,000.00 | $ 1,016.89 | $ 8.39 |
Class T | 1.90% | | | |
Actual | | $ 1,000.00 | $ 898.30 | $ 9.09 |
HypotheticalA | | $ 1,000.00 | $ 1,015.63 | $ 9.65 |
Class C | 2.40% | | | |
Actual | | $ 1,000.00 | $ 896.00 | $ 11.47 |
HypotheticalA | | $ 1,000.00 | $ 1,013.11 | $ 12.18 |
Total Emerging Markets | 1.40% | | | |
Actual | | $ 1,000.00 | $ 901.00 | $ 6.71 |
HypotheticalA | | $ 1,000.00 | $ 1,018.15 | $ 7.12 |
Class I | 1.40% | | | |
Actual | | $ 1,000.00 | $ 900.20 | $ 6.71 |
HypotheticalA | | $ 1,000.00 | $ 1,018.15 | $ 7.12 |
A 5% return per year before expenses
B Annualized expense ratio reflects expenses net of applicable fee waivers.
C Expenses are equal to each Class' annualized expense ratio, multiplied by the average account value over the period, multiplied by 184/365 (to reflect the one-half year period).
Annual Report
Fidelity Total Emerging Markets Fund
Investment Changes (Unaudited)
Top Five Stocks as of October 31, 2015 |
| % of fund's
net assets | % of fund's net assets
6 months ago |
Taiwan Semiconductor Manufacturing Co. Ltd. (Taiwan, Semiconductors & Semiconductor Equipment) | 2.0 | 2.2 |
Tencent Holdings Ltd. (Cayman Islands, Internet Software & Services) | 1.7 | 1.5 |
Samsung Electronics Co. Ltd. (Korea (South), Technology Hardware, Storage & Peripherals) | 1.4 | 2.4 |
Industrial & Commercial Bank of China Ltd. (H Shares) (China, Banks) | 1.2 | 1.3 |
Naspers Ltd. Class N (South Africa, Media) | 1.2 | 1.1 |
| 7.5 | |
Top Five Market Sectors as of October 31, 2015 |
| % of fund's
net assets | % of fund's net assets
6 months ago |
Financials | 17.5 | 19.0 |
Energy | 14.9 | 13.6 |
Information Technology | 10.9 | 12.5 |
Consumer Staples | 5.7 | 5.2 |
Consumer Discretionary | 5.7 | 5.5 |
Top Five Countries as of October 31, 2015 |
(excluding cash equivalents) | % of fund's
net assets | % of fund's net assets
6 months ago |
Korea (South) | 9.3 | 9.6 |
Cayman Islands | 7.0 | 6.0 |
China | 6.3 | 7.1 |
Mexico | 6.2 | 5.8 |
India | 5.3 | 6.3 |
Percentages are adjusted for the effect of open futures contracts, if applicable. |
Annual Report
Fidelity Total Emerging Markets Fund
Investments October 31, 2015
Showing Percentage of Net Assets
Common Stocks - 52.1% |
| Shares | | Value |
Argentina - 0.3% |
Telecom Argentina SA Class B sponsored ADR | 2,280 | | $ 44,483 |
YPF SA Class D sponsored ADR | 5,900 | | 126,024 |
TOTAL ARGENTINA | | 170,507 |
Austria - 0.1% |
Erste Group Bank AG (a) | 3,133 | | 91,884 |
Bermuda - 0.7% |
Aquarius Platinum Ltd. (Australia) (a) | 312,441 | | 54,187 |
China Resource Gas Group Ltd. | 24,000 | | 65,833 |
Credicorp Ltd. (United States) | 1,319 | | 149,284 |
GP Investments Ltd. Class A (depositary receipt) (a) | 30,222 | | 55,953 |
Shangri-La Asia Ltd. | 122,000 | | 111,650 |
TOTAL BERMUDA | | 436,907 |
Brazil - 1.6% |
B2W Companhia Global do Varejo (a) | 7,594 | | 28,710 |
BB Seguridade Participacoes SA | 15,070 | | 103,943 |
CCR SA | 33,000 | | 103,709 |
Cielo SA | 14,740 | | 139,926 |
Companhia de Saneamento de Minas Gerais | 13,546 | | 45,662 |
Cosan SA Industria e Comercio | 15,733 | | 100,806 |
Direcional Engenharia SA | 50,700 | | 46,538 |
Fibria Celulose SA | 15,200 | | 207,472 |
FPC Par Corretora de Seguros | 23,400 | | 65,469 |
Minerva SA (a) | 42,300 | | 139,956 |
Smiles SA | 8,400 | | 65,561 |
TOTAL BRAZIL | | 1,047,752 |
British Virgin Islands - 0.1% |
Mail.Ru Group Ltd. GDR (Reg. S) (a) | 2,586 | | 50,427 |
Canada - 0.3% |
Goldcorp, Inc. | 3,000 | | 38,383 |
Pan American Silver Corp. | 13,700 | | 103,709 |
Torex Gold Resources, Inc. (a) | 36,200 | | 34,329 |
TOTAL CANADA | | 176,421 |
Cayman Islands - 5.3% |
51job, Inc. sponsored ADR (a) | 2,500 | | 84,525 |
58.com, Inc. ADR (a) | 5,750 | | 301,818 |
AAC Technology Holdings, Inc. | 11,000 | | 69,760 |
Alibaba Group Holding Ltd. sponsored ADR (a) | 4,700 | | 394,001 |
Baidu.com, Inc. sponsored ADR (a) | 200 | | 37,494 |
Common Stocks - continued |
| Shares | | Value |
Cayman Islands - continued |
Bitauto Holdings Ltd. ADR (a) | 1,100 | | $ 35,090 |
China ZhengTong Auto Services Holdings Ltd. | 146,160 | | 65,410 |
Ctrip.com International Ltd. sponsored ADR (a) | 1,200 | | 111,564 |
ENN Energy Holdings Ltd. | 33,773 | | 193,473 |
Eurasia Drilling Co. Ltd. GDR (Reg. S) | 4,900 | | 55,615 |
Haitian International Holdings Ltd. | 28,000 | | 48,992 |
Hengan International Group Co. Ltd. | 16,500 | | 178,174 |
Leju Holdings Ltd. ADR | 6,448 | | 46,426 |
NetEase, Inc. sponsored ADR | 100 | | 14,453 |
Qunar Cayman Islands Ltd. sponsored ADR (a) | 4,500 | | 218,430 |
SINA Corp. (a) | 800 | | 38,112 |
Sino Biopharmaceutical Ltd. | 76,000 | | 94,445 |
SouFun Holdings Ltd. ADR | 4,500 | | 31,815 |
Sunny Optical Technology Group Co. Ltd. | 31,000 | | 72,079 |
Tencent Holdings Ltd. | 60,900 | | 1,147,927 |
Uni-President China Holdings Ltd. | 297,600 | | 243,742 |
TOTAL CAYMAN ISLANDS | | 3,483,345 |
Chile - 1.1% |
Compania Cervecerias Unidas SA sponsored ADR | 7,100 | | 170,187 |
Empresas CMPC SA | 50,670 | | 124,852 |
Enersis SA | 412,664 | | 109,200 |
Inversiones La Construccion SA | 8,038 | | 91,358 |
Vina Concha y Toro SA | 123,422 | | 210,239 |
TOTAL CHILE | | 705,836 |
China - 5.8% |
Anhui Conch Cement Co. Ltd. (H Shares) | 60,000 | | 183,078 |
BBMG Corp. (H Shares) | 267,500 | | 187,458 |
China Cinda Asset Management Co. Ltd. (H Shares) | 214,840 | | 83,529 |
China Life Insurance Co. Ltd. (H Shares) | 107,260 | | 386,789 |
China Longyuan Power Grid Corp. Ltd. (H Shares) | 69,970 | | 63,970 |
China Machinery Engineering Co. (H Shares) | 80,000 | | 69,432 |
China Pacific Insurance (Group) Co. Ltd. (H Shares) | 121,580 | | 484,301 |
China Petroleum & Chemical Corp. (H Shares) | 152,000 | | 109,568 |
China Suntien Green Energy Corp. Ltd. (H Shares) | 332,690 | | 59,316 |
China Telecom Corp. Ltd. (H Shares) | 433,059 | | 225,893 |
Daqin Railway Co. Ltd. (A Shares) | 60,300 | | 86,883 |
Industrial & Commercial Bank of China Ltd. (H Shares) | 1,271,260 | | 806,368 |
Inner Mongoli Yili Industries Co. Ltd. | 74,000 | | 186,138 |
Kweichow Moutai Co. Ltd. | 9,020 | | 304,549 |
Maanshan Iron & Steel Ltd. (H Shares) (a) | 244,000 | | 52,236 |
Common Stocks - continued |
| Shares | | Value |
China - continued |
PetroChina Co. Ltd. (H Shares) | 136,000 | | $ 106,475 |
Qingdao Haier Co. Ltd. | 143,700 | | 218,763 |
Zhengzhou Yutong Bus Co. Ltd. | 31,500 | | 108,495 |
Zhuzhou CSR Times Electric Co. Ltd. (H Shares) | 17,000 | | 110,049 |
TOTAL CHINA | | 3,833,290 |
Colombia - 0.2% |
Bancolombia SA sponsored ADR | 3,695 | | 127,921 |
Egypt - 0.1% |
Citadel Capital Corp. (a) | 170,400 | | 39,045 |
Greece - 0.3% |
Public Power Corp. of Greece | 2,506 | | 14,440 |
Titan Cement Co. SA (Reg.) | 7,400 | | 162,341 |
TOTAL GREECE | | 176,781 |
Hong Kong - 3.5% |
AIA Group Ltd. | 24,380 | | 142,948 |
China Mobile Ltd. | 15,110 | | 181,167 |
China Mobile Ltd. sponsored ADR | 9,480 | | 571,739 |
China Resources Beer Holdings Co. Ltd. | 74,000 | | 139,725 |
China Resources Power Holdings Co. Ltd. | 45,029 | | 101,863 |
China Unicom Ltd. | 10,990 | | 13,393 |
China Unicom Ltd. sponsored ADR | 5,406 | | 66,386 |
CNOOC Ltd. | 317,000 | | 358,055 |
CNOOC Ltd. sponsored ADR | 70 | | 7,958 |
Far East Horizon Ltd. | 392,564 | | 326,525 |
Lenovo Group Ltd. | 52,000 | | 48,315 |
Sinotruk Hong Kong Ltd. | 151,500 | | 63,060 |
Techtronic Industries Co. Ltd. | 66,000 | | 241,275 |
TOTAL HONG KONG | | 2,262,409 |
India - 5.3% |
Adani Ports & Special Economic Zone (a) | 26,087 | | 117,785 |
Axis Bank Ltd. (a) | 37,136 | | 268,957 |
Bharti Airtel Ltd. | 9,413 | | 50,142 |
Bharti Infratel Ltd. | 24,983 | | 148,382 |
Coal India Ltd. | 53,331 | | 260,304 |
Edelweiss Financial Services Ltd. | 62,457 | | 56,685 |
Eicher Motors Ltd. (a) | 450 | | 121,876 |
Grasim Industries Ltd. | 3,862 | | 219,209 |
ITC Ltd. | 69,734 | | 356,127 |
JK Cement Ltd. | 10,894 | | 113,885 |
Common Stocks - continued |
| Shares | | Value |
India - continued |
Larsen & Toubro Ltd. (a) | 5,849 | | $ 125,975 |
LIC Housing Finance Ltd. (a) | 14,923 | | 108,960 |
Lupin Ltd. | 9,017 | | 265,491 |
NTPC Ltd. | 13,829 | | 28,058 |
Oil & Natural Gas Corp. Ltd. | 31,237 | | 117,840 |
Petronet LNG Ltd. | 32,568 | | 96,522 |
Phoenix Mills Ltd. (a) | 21,082 | | 107,600 |
Power Grid Corp. of India Ltd. | 82,864 | | 162,892 |
SREI Infrastructure Finance Ltd. (a) | 136,028 | | 92,977 |
State Bank of India (a) | 66,221 | | 239,154 |
Tata Consultancy Services Ltd. | 8,565 | | 326,326 |
Yes Bank Ltd. (a) | 7,278 | | 84,114 |
TOTAL INDIA | | 3,469,261 |
Indonesia - 0.5% |
PT Bank Mandiri (Persero) Tbk | 196,000 | | 124,043 |
PT Bank Rakyat Indonesia Tbk | 174,900 | | 133,861 |
PT Kalbe Farma Tbk | 640,500 | | 66,705 |
PT Perusahaan Gas Negara Tbk Series B | 148,200 | | 32,370 |
TOTAL INDONESIA | | 356,979 |
Israel - 0.5% |
Bezeq The Israel Telecommunication Corp. Ltd. | 117,495 | | 252,624 |
Partner Communications Co. Ltd. (a) | 12,209 | | 55,410 |
TOTAL ISRAEL | | 308,034 |
Korea (South) - 8.3% |
AMOREPACIFIC Group, Inc. | 1,562 | | 220,256 |
BGFretail Co. Ltd. | 645 | | 96,035 |
Daewoo International Corp. | 3,552 | | 62,064 |
DOUBLEUGAMES Co. Ltd. | 472 | | 26,871 |
E-Mart Co. Ltd. | 1,406 | | 261,677 |
Fila Korea Ltd. | 2,319 | | 203,106 |
Hanon Systems | 1,976 | | 77,706 |
Hyundai Glovis Co. Ltd. | 1,418 | | 244,040 |
Hyundai Industrial Development & Construction Co. | 4,871 | | 196,458 |
Hyundai Mobis | 3,141 | | 660,238 |
KB Financial Group, Inc. | 5,866 | | 185,563 |
Korea Electric Power Corp. | 2,681 | | 120,529 |
Korea Zinc Co. Ltd. | 283 | | 117,486 |
Korean Reinsurance Co. | 19,619 | | 233,688 |
LG Chemical Ltd. | 1,413 | | 376,835 |
NAVER Corp. | 437 | | 229,643 |
Common Stocks - continued |
| Shares | | Value |
Korea (South) - continued |
NCSOFT Corp. | 317 | | $ 52,613 |
Samsung Electronics Co. Ltd. | 785 | | 943,290 |
Samsung Fire & Marine Insurance Co. Ltd. | 272 | | 76,113 |
Samsung Life Insurance Co. Ltd. | 1,434 | | 136,898 |
Samsung SDI Co. Ltd. | 360 | | 33,579 |
Shinhan Financial Group Co. Ltd. | 11,088 | | 422,539 |
SK Hynix, Inc. | 11,698 | | 314,537 |
SK Telecom Co. Ltd. | 80 | | 16,915 |
SK Telecom Co. Ltd. sponsored ADR | 4,960 | | 116,858 |
TOTAL KOREA (SOUTH) | | 5,425,537 |
Mauritius - 0.1% |
MakeMyTrip Ltd. (a) | 3,000 | | 47,880 |
Mexico - 3.5% |
America Movil S.A.B. de CV Series L sponsored ADR | 16,572 | | 295,147 |
Banregio Grupo Financiero S.A.B. de CV | 11,380 | | 61,393 |
El Puerto de Liverpool S.A.B. de CV Class C | 14,000 | | 194,424 |
Grupo Aeroportuario del Pacifico SA de CV Series B | 13,800 | | 124,292 |
Grupo Aeroportuario Norte S.A.B. de CV | 9,800 | | 50,407 |
Grupo Comercial Chedraui S.A.B. de CV | 34,576 | | 95,662 |
Grupo Financiero Banorte S.A.B. de CV Series O | 96,924 | | 521,945 |
Grupo Financiero Santander Mexico S.A.B. de CV | 44,200 | | 81,214 |
Infraestructura Energetica Nova S.A.B. de CV | 11,900 | | 57,383 |
Macquarie Mexican (REIT) | 227,130 | | 315,302 |
Promotora y Operadora de Infraestructura S.A.B. de CV (a) | 6,200 | | 77,739 |
Tenedora Nemak SA de CV (a) | 53,900 | | 77,957 |
Wal-Mart de Mexico SA de CV Series V | 137,800 | | 363,567 |
TOTAL MEXICO | | 2,316,432 |
Netherlands - 0.3% |
Cnova NV (a) | 6,600 | | 19,800 |
Hangzhou Hikvision Digital Technology Co. Ltd. ELS (BNP Paribas Arbitrage Warrant Program) warrants 10/21/16 (a) | 15,500 | | 84,430 |
Yandex NV (a) | 5,237 | | 84,316 |
TOTAL NETHERLANDS | | 188,546 |
Nigeria - 0.4% |
Guaranty Trust Bank PLC GDR (Reg. S) | 10,580 | | 60,835 |
Transnational Corp. of Nigeria PLC | 3,557,220 | | 32,346 |
Zenith Bank PLC | 1,780,503 | | 157,432 |
TOTAL NIGERIA | | 250,613 |
Common Stocks - continued |
| Shares | | Value |
Pakistan - 0.2% |
Habib Bank Ltd. | 66,300 | | $ 131,764 |
Panama - 0.1% |
Copa Holdings SA Class A | 2,000 | | 101,040 |
Philippines - 0.9% |
Alliance Global Group, Inc. | 321,850 | | 125,047 |
Metro Pacific Investments Corp. | 722,000 | | 80,328 |
Metropolitan Bank & Trust Co. | 80,721 | | 146,571 |
Robinsons Land Corp. | 410,280 | | 268,201 |
TOTAL PHILIPPINES | | 620,147 |
Russia - 1.6% |
E.ON Russia JSC (a) | 1,222,700 | | 58,169 |
Lukoil PJSC sponsored ADR | 9,600 | | 348,480 |
Mobile TeleSystems OJSC (a) | 24,172 | | 78,658 |
NOVATEK OAO GDR (Reg. S) | 2,600 | | 237,770 |
Sberbank of Russia (a) | 59,060 | | 83,738 |
Sberbank of Russia sponsored ADR | 32,984 | | 202,291 |
Sistema JSFC (a) | 169,200 | | 46,807 |
Sistema JSFC sponsored GDR | 3,860 | | 26,827 |
TOTAL RUSSIA | | 1,082,740 |
Singapore - 0.2% |
First Resources Ltd. | 90,100 | | 120,695 |
South Africa - 2.8% |
Aspen Pharmacare Holdings Ltd. | 8,021 | | 180,144 |
Barclays Africa Group Ltd. | 26,942 | | 345,755 |
Bidvest Group Ltd. | 6,756 | | 172,818 |
JSE Ltd. | 7,710 | | 74,376 |
Life Healthcare Group Holdings Ltd. | 46,600 | | 129,978 |
Naspers Ltd. Class N | 5,200 | | 761,645 |
Sasol Ltd. | 2,800 | | 89,717 |
Telkom SA Ltd. | 13,510 | | 70,972 |
TOTAL SOUTH AFRICA | | 1,825,405 |
Taiwan - 4.7% |
Advanced Semiconductor Engineering, Inc. | 44,000 | | 50,794 |
Advantech Co. Ltd. | 22,000 | | 158,232 |
ASUSTeK Computer, Inc. | 10,000 | | 89,635 |
Catcher Technology Co. Ltd. | 11,000 | | 108,424 |
E.SUN Financial Holdings Co. Ltd. | 368,946 | | 222,174 |
Hermes Microvision, Inc. | 1,000 | | 38,657 |
Hon Hai Precision Industry Co. Ltd. (Foxconn) | 39,555 | | 105,512 |
Common Stocks - continued |
| Shares | | Value |
Taiwan - continued |
Inotera Memories, Inc. (a) | 69,000 | | $ 53,347 |
King's Town Bank | 78,600 | | 62,706 |
Largan Precision Co. Ltd. | 2,000 | | 156,168 |
Taiwan Cement Corp. | 186,000 | | 207,399 |
Taiwan Fertilizer Co. Ltd. | 49,000 | | 62,712 |
Taiwan Semiconductor Manufacturing Co. Ltd. | 311,000 | | 1,310,382 |
Taiwan Semiconductor Manufacturing Co. Ltd. sponsored ADR | 1,542 | | 33,862 |
Unified-President Enterprises Corp. | 94,012 | | 159,269 |
Universal Cement Corp. | 97,654 | | 69,033 |
Vanguard International Semiconductor Corp. | 37,000 | | 47,810 |
Yuanta Financial Holding Co. Ltd. | 303,231 | | 119,555 |
TOTAL TAIWAN | | 3,055,671 |
Thailand - 1.5% |
Airports of Thailand PCL (For. Reg.) | 13,900 | | 116,191 |
Intouch Holdings PCL NVDR | 39,960 | | 84,214 |
Jasmine Broadband Internet Infrastructure Fund | 526,400 | | 153,998 |
Jasmine International Public Co. Ltd. | 84,500 | | 13,416 |
Kasikornbank PCL (For. Reg.) | 65,280 | | 315,778 |
PTT PCL (For. Reg.) | 22,900 | | 176,865 |
Thai Union Frozen Products PCL (For. Reg.) | 312,100 | | 155,058 |
TOTAL THAILAND | | 1,015,520 |
Turkey - 0.6% |
Aselsan A/S | 12,000 | | 57,419 |
Tupras Turkiye Petrol Rafinelleri A/S (a) | 7,000 | | 184,880 |
Turkiye Garanti Bankasi A/S | 47,864 | | 123,941 |
TOTAL TURKEY | | 366,240 |
United Arab Emirates - 0.6% |
DP World Ltd. | 4,418 | | 89,288 |
Emaar Properties PJSC | 53,120 | | 93,282 |
Emirates Telecommunications Corp. | 3,488 | | 14,529 |
First Gulf Bank PJSC | 63,878 | | 214,782 |
TOTAL UNITED ARAB EMIRATES | | 411,881 |
United Kingdom - 0.3% |
Fresnillo PLC | 8,200 | | 92,280 |
HSBC Holdings PLC (Hong Kong) | 16,000 | | 125,102 |
TOTAL UNITED KINGDOM | | 217,382 |
Common Stocks - continued |
| Shares | | Value |
United States of America - 0.3% |
Cognizant Technology Solutions Corp. Class A (a) | 2,620 | | $ 178,448 |
TOTAL COMMON STOCKS (Cost $31,801,701) |
34,092,740
|
Nonconvertible Preferred Stocks - 2.4% |
| | | |
Brazil - 1.2% |
Banco Bradesco SA (PN) sponsored ADR | 18,930 | | 102,979 |
Banco do Estado Rio Grande do Sul SA | 28,720 | | 44,608 |
Companhia Paranaense de Energia-Copel: | | | |
(PN-B) | 515 | | 4,340 |
(PN-B) sponsored | 8,502 | | 70,227 |
Itau Unibanco Holding SA sponsored ADR | 38,688 | | 265,013 |
Petroleo Brasileiro SA - Petrobras (PN) sponsored (non-vtg.) (a) | 37,506 | | 149,649 |
Telefonica Brasil SA | 4,890 | | 50,656 |
Vale SA (PN-A) sponsored ADR | 25,500 | | 91,800 |
TOTAL BRAZIL | | 779,272 |
Korea (South) - 1.0% |
Hyundai Motor Co. Series 2 | 2,535 | | 253,107 |
Samsung Electronics Co. Ltd. | 283 | | 296,194 |
Samsung Fire & Marine Insurance Co. Ltd. | 630 | | 110,631 |
TOTAL KOREA (SOUTH) | | 659,932 |
Russia - 0.2% |
Surgutneftegas OJSC (a) | 145,800 | | 99,386 |
TOTAL NONCONVERTIBLE PREFERRED STOCKS (Cost $2,121,719) |
1,538,590
|
Nonconvertible Bonds - 16.4% |
| Principal Amount | | |
Azerbaijan - 1.1% |
International Bank of Azerbaijan OJSC 5.625% 6/11/19 (Reg. S) | | $ 200,000 | | 184,016 |
State Oil Co. of Azerbaijan Republic: | | | | |
4.75% 3/13/23 (Reg. S) | | 325,000 | | 280,448 |
6.95% 3/18/30 (Reg. S) | | 275,000 | | 257,675 |
TOTAL AZERBAIJAN | | 722,139 |
Nonconvertible Bonds - continued |
| Principal Amount | | Value |
Brazil - 0.4% |
Caixa Economica Federal 3.5% 11/7/22 (d) | | $ 300,000 | | $ 241,500 |
Canada - 0.1% |
First Quantum Minerals Ltd. 7% 2/15/21 (d) | | 100,000 | | 74,000 |
Cayman Islands - 1.7% |
Lamar Funding Ltd. 3.958% 5/7/25 (d) | | 200,000 | | 187,340 |
Petrobras International Finance Co. Ltd.: | | | | |
3.5% 2/6/17 | | 200,000 | | 193,300 |
5.375% 1/27/21 | | 530,000 | | 431,288 |
8.375% 12/10/18 | | 300,000 | | 299,778 |
TOTAL CAYMAN ISLANDS | | 1,111,706 |
Chile - 0.3% |
Corporacion Nacional del Cobre de Chile (Codelco) 4.5% 9/16/25 (d) | | 200,000 | | 198,376 |
Indonesia - 1.9% |
PT Pertamina Persero: | | | | |
4.875% 5/3/22 (d) | | 275,000 | | 270,738 |
5.25% 5/23/21 (d) | | 200,000 | | 204,846 |
5.625% 5/20/43 (d) | | 200,000 | | 169,000 |
6% 5/3/42 (d) | | 400,000 | | 347,000 |
6.5% 5/27/41 (d) | | 275,000 | | 256,137 |
TOTAL INDONESIA | | 1,247,721 |
Ireland - 0.5% |
Vnesheconombank Via VEB Finance PLC: | | | | |
5.375% 2/13/17 (d) | | 250,000 | | 253,125 |
6.8% 11/22/25 (d) | | 100,000 | | 98,100 |
TOTAL IRELAND | | 351,225 |
Israel - 0.9% |
B Communications Ltd. 7.375% 2/15/21 (d) | | 300,000 | | 325,500 |
Israel Electric Corp. Ltd. 7.25% 1/15/19 (Reg. S) | | 250,000 | | 280,812 |
TOTAL ISRAEL | | 606,312 |
Kazakhstan - 1.9% |
Kazagro National Management Holding JSC 4.625% 5/24/23 (d) | | 400,000 | | 324,160 |
KazMunaiGaz Finance Sub BV: | | | | |
6% 11/7/44 (d) | | 200,000 | | 156,304 |
9.125% 7/2/18 (d) | | 200,000 | | 220,556 |
Nonconvertible Bonds - continued |
| Principal Amount | | Value |
Kazakhstan - continued |
KazMunaiGaz National Co. 5.75% 4/30/43 (d) | | $ 300,000 | | $ 230,926 |
Zhaikmunai International BV 7.125% 11/13/19 (d) | | 350,000 | | 285,250 |
TOTAL KAZAKHSTAN | | 1,217,196 |
Luxembourg - 0.9% |
RSHB Capital SA: | | | | |
5.1% 7/25/18 (d) | | 400,000 | | 398,500 |
6.299% 5/15/17 (Reg. S) | | 200,000 | | 204,152 |
TOTAL LUXEMBOURG | | 602,652 |
Mexico - 2.4% |
Pemex Project Funding Master Trust 6.625% 6/15/35 | | 350,000 | | 344,313 |
Petroleos Mexicanos: | | | | |
6.5% 6/2/41 | | 425,000 | | 407,915 |
6.625% (d)(e) | | 850,000 | | 838,525 |
TOTAL MEXICO | | 1,590,753 |
Netherlands - 0.6% |
Petrobras Global Finance BV: | | | | |
6.85% 6/5/2115 | | 215,000 | | 147,533 |
7.25% 3/17/44 | | 300,000 | | 223,200 |
TOTAL NETHERLANDS | | 370,733 |
South Africa - 0.4% |
Eskom Holdings SOC Ltd. 6.75% 8/6/23 (d) | | 300,000 | | 278,550 |
Trinidad & Tobago - 0.3% |
Petroleum Co. of Trinidad & Tobago Ltd. 9.75% 8/14/19 (d) | | 150,000 | | 160,500 |
Tunisia - 0.3% |
Banque Centrale de Tunisie 5.75% 1/30/25 (d) | | 200,000 | | 187,532 |
Turkey - 0.4% |
Arcelik A/S 5% 4/3/23 (d) | | 300,000 | | 280,860 |
United Kingdom - 0.2% |
Biz Finance PLC 9.625% 4/27/22 (d) | | 150,000 | | 136,088 |
Venezuela - 2.1% |
Petroleos de Venezuela SA: | | | | |
5.25% 4/12/17 | | 300,000 | | 168,750 |
5.5% 4/12/37 | | 500,000 | | 171,000 |
6% 11/15/26 (Reg. S) | | 700,000 | | 247,380 |
8.5% 11/2/17 (d) | | 250,000 | | 151,850 |
9% 11/17/21 (Reg. S) | | 550,000 | | 227,040 |
Nonconvertible Bonds - continued |
| Principal Amount | | Value |
Venezuela - continued |
Petroleos de Venezuela SA: - continued | | | | |
9.75% 5/17/35 (d) | | $ 300,000 | | $ 124,500 |
12.75% 2/17/22 (d) | | 600,000 | | 298,500 |
TOTAL VENEZUELA | | 1,389,020 |
TOTAL NONCONVERTIBLE BONDS (Cost $11,880,507) |
10,766,863
|
Government Obligations - 24.5% |
|
Armenia - 0.5% |
Republic of Armenia 6% 9/30/20 (d) | | 325,000 | | 321,250 |
Barbados - 0.5% |
Barbados Government 7% 8/4/22 (d) | | 350,000 | | 344,920 |
Belize - 0.4% |
Belize Government 5% 2/20/38 (c)(d) | | 332,500 | | 243,556 |
Bolivia - 0.3% |
Plurinational State of Bolivia 4.875% 10/29/22 (d) | | 200,000 | | 200,750 |
Brazil - 2.0% |
Brazilian Federative Republic: | | | | |
4.25% 1/7/25 | | 850,000 | | 753,313 |
7.125% 1/20/37 | | 100,000 | | 97,250 |
8.25% 1/20/34 | | 275,000 | | 293,563 |
12.25% 3/6/30 | | 100,000 | | 152,750 |
TOTAL BRAZIL | | 1,296,876 |
Colombia - 0.4% |
Colombian Republic 7.375% 9/18/37 | | 225,000 | | 261,000 |
Congo - 0.4% |
Congo Republic 4% 6/30/29 (c) | | 299,250 | | 245,385 |
Costa Rica - 0.8% |
Costa Rican Republic: | | | | |
4.375% 4/30/25 (d) | | 225,000 | | 194,625 |
7% 4/4/44 (d) | | 200,000 | | 180,000 |
7.158% 3/12/45 (d) | | 200,000 | | 180,500 |
TOTAL COSTA RICA | | 555,125 |
Government Obligations - continued |
| Principal Amount | | Value |
Dominican Republic - 0.5% |
Dominican Republic: | | | | |
6.6% 1/28/24 (d) | | $ 100,000 | | $ 106,250 |
7.45% 4/30/44 (d) | | 200,000 | | 211,000 |
TOTAL DOMINICAN REPUBLIC | | 317,250 |
Ecuador - 0.2% |
Ecuador Republic 7.95% 6/20/24 (d) | | 200,000 | | 152,000 |
Egypt - 0.2% |
Arab Republic of Egypt 6.875% 4/30/40 (d) | | 150,000 | | 134,400 |
El Salvador - 0.4% |
El Salvador Republic: | | | | |
7.375% 12/1/19 | | 100,000 | | 102,375 |
7.625% 2/1/41 (d) | | 150,000 | | 133,500 |
TOTAL EL SALVADOR | | 235,875 |
Ethiopia - 0.3% |
Federal Democratic Republic of Ethiopia 6.625% 12/11/24 (d) | | 200,000 | | 186,500 |
Gabon - 0.3% |
Gabonese Republic 6.375% 12/12/24 (d) | | 200,000 | | 172,000 |
Georgia - 0.3% |
Georgia Republic 6.875% 4/12/21 (d) | | 200,000 | | 213,350 |
Ghana - 0.8% |
Ghana Republic: | | | | |
7.875% 8/7/23 (Reg.S) | | 200,000 | | 171,564 |
8.125% 1/18/26 (d) | | 200,000 | | 169,850 |
10.75% 10/14/30 (d) | | 200,000 | | 211,800 |
TOTAL GHANA | | 553,214 |
Hungary - 0.3% |
Hungarian Republic 5.75% 11/22/23 | | 200,000 | | 225,250 |
Iraq - 0.3% |
Republic of Iraq 5.8% 1/15/28 (Reg. S) | | 250,000 | | 183,125 |
Ivory Coast - 0.6% |
Ivory Coast: | | | | |
5.375% 7/23/24 (d) | | 200,000 | | 178,000 |
5.75% 12/31/32 | | 275,000 | | 244,750 |
TOTAL IVORY COAST | | 422,750 |
Government Obligations - continued |
| Principal Amount | | Value |
Jamaica - 0.2% |
Jamaican Government 8% 6/24/19 | | $ 150,000 | | $ 163,500 |
Kenya - 0.3% |
Republic of Kenya 6.875% 6/24/24 (d) | | 200,000 | | 185,450 |
Lebanon - 1.0% |
Lebanese Republic: | | | | |
5% 10/12/17 | | 100,000 | | 99,864 |
6.1% 10/4/22 | | 150,000 | | 149,100 |
6.65% 2/26/30(Reg. S) | | 125,000 | | 123,750 |
11.625% 5/11/16 (Reg. S) | | 250,000 | | 259,008 |
TOTAL LEBANON | | 631,722 |
Mexico - 0.3% |
United Mexican States 5.75% 10/12/2110 | | 200,000 | | 195,500 |
Mongolia - 0.3% |
Mongolian People's Republic 5.125% 12/5/22 (Reg. S) | | 200,000 | | 166,737 |
Netherlands - 0.4% |
Republic of Angola 7% 8/16/19 (Issued by Northern Lights III BV for Republic of Angola) (Reg. S) | | 250,000 | | 243,125 |
Pakistan - 0.3% |
Islamic Republic of Pakistan 7.25% 4/15/19 (d) | | 200,000 | | 207,800 |
Panama - 0.4% |
Panamanian Republic 8.875% 9/30/27 | | 200,000 | | 282,500 |
Philippines - 0.9% |
Philippine Republic 9.5% 2/2/30 | | 350,000 | | 564,088 |
Qatar - 0.5% |
State of Qatar 5.75% 1/20/42 (d) | | 250,000 | | 310,625 |
Romania - 0.3% |
Romanian Republic 6.75% 2/7/22 (d) | | 170,000 | | 202,640 |
Russia - 2.9% |
Russian Federation: | | | | |
5% 4/29/20 (d) | | 225,000 | | 236,531 |
5.625% 4/4/42 (d) | | 200,000 | | 199,300 |
5.875% 9/16/43 (d) | | 200,000 | | 205,300 |
7.5% 3/31/30 (Reg. S) | | 490,875 | | 583,826 |
12.75% 6/24/28 (Reg. S) | | 425,000 | | 692,750 |
TOTAL RUSSIA | | 1,917,707 |
Senegal - 0.3% |
Republic of Senegal 8.75% 5/13/21 (d) | | 200,000 | | 214,800 |
Government Obligations - continued |
| Principal Amount | | Value |
Serbia - 0.5% |
Republic of Serbia 7.25% 9/28/21 (d) | | $ 260,000 | | $ 297,154 |
South Africa - 0.4% |
South African Republic 5.875% 9/16/25 | | 250,000 | | 271,688 |
Sri Lanka - 0.5% |
Democratic Socialist Republic of Sri Lanka 6.25% 10/4/20 (d) | | 300,000 | | 301,200 |
Tanzania - 0.3% |
United Republic of Tanzania 6.5375% 3/9/20 (g) | | 200,000 | | 193,750 |
Turkey - 1.7% |
Turkish Republic: | | | | |
6.25% 9/26/22 | | 200,000 | | 222,000 |
7% 6/5/20 | | 250,000 | | 283,238 |
7.375% 2/5/25 | | 300,000 | | 358,821 |
11.875% 1/15/30 | | 165,000 | | 275,550 |
TOTAL TURKEY | | 1,139,609 |
Ukraine - 1.1% |
Ukraine Government: | | | | |
6.58% 11/21/16 (d) | | 250,000 | | 190,052 |
6.75% 11/14/17 (d) | | 200,000 | | 151,413 |
7.5% 4/17/23 (Reg. S) | | 250,000 | | 197,292 |
9.25% 7/24/17 (d) | | 200,000 | | 151,413 |
TOTAL UKRAINE | | 690,170 |
United States of America - 0.1% |
U.S. Treasury Bills, yield at date of purchase 0.01% to 0.04% 12/3/15 (f) | | 60,000 | | 59,999 |
Venezuela - 1.5% |
Venezuelan Republic: | | | | |
7% 3/31/38 | | 650,000 | | 242,125 |
8.25% 10/13/24 | | 300,000 | | 114,000 |
9% 5/7/23 (Reg. S) | | 300,000 | | 117,750 |
9.25% 9/15/27 | | 650,000 | | 284,375 |
9.25% 5/7/28 (Reg. S) | | 250,000 | | 98,125 |
12.75% 8/23/22 | | 325,000 | | 154,375 |
TOTAL VENEZUELA | | 1,010,750 |
Vietnam - 0.3% |
Vietnamese Socialist Republic 6.75% 1/29/20 (d) | | 200,000 | | 221,557 |
Government Obligations - continued |
| Principal Amount | | Value |
Zambia - 0.5% |
Republic of Zambia: | | | | |
5.375% 9/20/22 (d) | | $ 200,000 | | $ 148,000 |
8.97% 7/30/27 (d) | | 200,000 | | 167,500 |
TOTAL ZAMBIA | | 315,500 |
TOTAL GOVERNMENT OBLIGATIONS (Cost $16,800,604) |
16,052,147
|
Preferred Securities - 0.6% |
|
China - 0.5% |
Sinochem Group 5% (d)(e)(f) | | 300,000 | | 312,349 |
Colombia - 0.1% |
Colombia Telecomunicacines SA 8.5% (d)(e)(f) | | 100,000 | | 90,122 |
TOTAL PREFERRED SECURITIES (Cost $403,473) |
402,471
|
Money Market Funds - 2.2% |
| Shares | | |
Fidelity Cash Central Fund, 0.18% (b)
(Cost $1,436,463) | 1,436,463 | |
1,436,463
|
TOTAL INVESTMENT PORTFOLIO - 98.2% (Cost $64,444,467) | | 64,289,274 |
NET OTHER ASSETS (LIABILITIES) - 1.8% | | 1,203,567 |
NET ASSETS - 100% | $ 65,492,841 |
Futures Contracts |
| Expiration Date | | Underlying Face Amount at Value | | Unrealized Appreciation/
(Depreciation) |
Purchased |
Equity Index Contracts |
12 ICE E-mini MSCI Emerging Markets Index Contracts (United States) | Dec. 2015 | | $ 506,220 | | $ 22,118 |
|
The face value of futures purchased as a percentage of net assets is 0.8% |
Security Type Abbreviations |
ELS | - | Equity-Linked Security |
Legend |
(a) Non-income producing |
(b) Affiliated fund that is generally available only to investment companies and other accounts managed by Fidelity Investments. The rate quoted is the annualized seven-day yield of the fund at period end. A complete unaudited listing of the fund's holdings as of its most recent quarter end is available upon request. In addition, each Fidelity Central Fund's financial statements, which are not covered by the Fund's Report of Independent Registered Public Accounting Firm, are available on the SEC's website or upon request. |
(c) Security initially issued at one coupon which converts to a higher coupon at a specified date. The rate shown is the rate at period end. |
(d) Security exempt from registration under Rule 144A of the Securities Act of 1933. These securities may be resold in transactions exempt from registration, normally to qualified institutional buyers. At the end of the period, the value of these securities amounted to $14,025,720 or 21.4% of net assets. |
(e) Security is perpetual in nature with no stated maturity date. |
(f) Security or a portion of the security was pledged to cover margin requirements for futures contracts. At period end, the value of securities pledged amounted to $59,999. |
(g) Coupon rates for floating and adjustable rate securities reflect the rates in effect at period end. |
Affiliated Central Funds |
Information regarding fiscal year to date income earned by the Fund from investments in Fidelity Central Funds is as follows: |
Fund | Income earned |
Fidelity Cash Central Fund | $ 2,500 |
Fidelity Securities Lending Cash Central Fund | 640 |
Total | $ 3,140 |
Other Information |
Categorizations in the Schedule of Investments are based on country or territory of incorporation. |
The following is a summary of the inputs used, as of October 31, 2015, involving the Fund's assets and liabilities carried at fair value. The inputs or methodology used for valuing securities may not be an indication of the risk associated with investing in those securities. For more information on valuation inputs, and their aggregation into the levels used in the tables below, please refer to the Investment Valuation section in the accompanying Notes to Financial Statements. |
Valuation Inputs at Reporting Date: |
Description | Total | Level 1 | Level 2 | Level 3 |
Investments in Securities: | | | | |
Equities: | | | | |
Consumer Discretionary | $ 3,430,635 | $ 2,766,666 | $ 445,206 | $ 218,763 |
Consumer Staples | 3,401,056 | 1,716,848 | 1,684,208 | - |
Energy | 2,685,230 | 1,211,182 | 1,474,048 | - |
Financials | 9,828,939 | 4,391,939 | 5,437,000 | - |
Health Care | 736,763 | 310,122 | 426,641 | - |
Industrials | 2,457,584 | 1,363,799 | 1,093,785 | - |
Information Technology | 7,039,412 | 4,013,829 | 3,025,583 | - |
Materials | 2,498,684 | 1,688,631 | 810,053 | - |
Telecommunication Services | 2,424,618 | 1,612,438 | 812,180 | - |
Utilities | 1,128,409 | 359,421 | 768,988 | - |
Corporate Bonds | 10,766,863 | - | 10,766,863 | - |
Government Obligations | 16,052,147 | - | 16,052,147 | - |
Preferred Securities | 402,471 | - | 402,471 | - |
Money Market Funds | 1,436,463 | 1,436,463 | - | - |
Total Investments in Securities: | $ 64,289,274 | $ 20,871,338 | $ 43,199,173 | $ 218,763 |
Derivative Instruments: | | | | |
Assets | | | | |
Futures Contracts | $ 22,118 | $ 22,118 | $ - | $ - |
The following is a summary of transfers between Level 1 and Level 2 for the period ended October 31, 2015. Transfers are assumed to have occurred at the beginning of the period, and are primarily attributable to the valuation techniques used for foreign equity securities, as discussed in the accompanying Notes to Financial Statements: |
Transfers | Total |
Level 1 to Level 2 | $ 695,622 |
Level 2 to Level 1 | $ 2,488,814 |
Value of Derivative Instruments |
The following table is a summary of the Fund's value of derivative instruments by primary risk exposure as of October 31, 2015. For additional information on derivative instruments, please refer to the Derivative Instruments section in the accompanying Notes to Financial Statements. |
Primary Risk Exposure /
Derivative Type | Value |
| Asset | Liability |
Equity Risk | | |
Futures Contracts (a) | $ 22,118 | $ - |
(a) Reflects gross cumulative appreciation (depreciation) on futures contracts as presented in the Schedule of Investments. Only the period end receivable or payable for daily variation margin and net unrealized appreciation (depreciation) are presented in the Statement of Assets and Liabilities. |
Other Information |
The composition of credit quality ratings as a percentage of net assets is as follows (Unaudited): |
AAA,AA,A | 3.8% |
BBB | 10.8% |
BB | 12.3% |
B | 7.4% |
CCC,CC,C | 5.1% |
Not Rated | 2.0% |
Equities | 54.5% |
Short-Term Investments and Net Other Assets | 4.1% |
| 100.0% |
We have used ratings from Moody's Investors Service, Inc. Where Moody's® ratings are not available, we have used S&P® ratings. All ratings are as of the date indicated and do not reflect subsequent changes. |
See accompanying notes which are an integral part of the financial statements.
Annual Report
Fidelity Total Emerging Markets Fund
Statement of Assets and Liabilities
| | October 31, 2015 |
| | |
Assets | | |
Investment in securities, at value - See accompanying schedule: Unaffiliated issuers (cost $63,008,004) | $ 62,852,811 | |
Fidelity Central Funds (cost $1,436,463) | 1,436,463 | |
Total Investments (cost $64,444,467) | | $ 64,289,274 |
Cash | | 362,836 |
Foreign currency held at value (cost $65,956) | | 65,977 |
Receivable for investments sold | | 555,312 |
Receivable for fund shares sold | | 101,694 |
Dividends receivable | | 12,507 |
Interest receivable | | 575,898 |
Distributions receivable from Fidelity Central Funds | | 286 |
Receivable for daily variation margin for derivative instruments | | 1,896 |
Prepaid expenses | | 183 |
Receivable from investment adviser for expense reductions | | 28,742 |
Other receivables | | 27,900 |
Total assets | | 66,022,505 |
| | |
Liabilities | | |
Payable for investments purchased | $ 313,888 | |
Payable for fund shares redeemed | 59,882 | |
Accrued management fee | 43,392 | |
Distribution and service plan fees payable | 10,104 | |
Other affiliated payables | 15,645 | |
Other payables and accrued expenses | 86,753 | |
Total liabilities | | 529,664 |
| | |
Net Assets | | $ 65,492,841 |
Net Assets consist of: | | |
Paid in capital | | $ 65,852,157 |
Undistributed net investment income | | 1,546,081 |
Accumulated undistributed net realized gain (loss) on investments and foreign currency transactions | | (1,767,162) |
Net unrealized appreciation (depreciation) on investments and assets and liabilities in foreign currencies | | (138,235) |
Net Assets | | $ 65,492,841 |
See accompanying notes which are an integral part of the financial statements.
Annual Report
Statement of Assets and Liabilities - continued
| | October 31, 2015 |
Calculation of Maximum Offering Price | | |
Class A: | | |
Net Asset Value and redemption price per share ($10,164,340 ÷ 982,497 shares) | | $ 10.35 |
| | |
Maximum offering price per share (100/94.25 of $10.35) | | $ 10.98 |
Class T: | | |
Net Asset Value and redemption price per share ($3,331,226 ÷ 322,484 shares) | | $ 10.33 |
| | |
Maximum offering price per share (100/96.50 of $10.33) | | $ 10.70 |
Class C: | | |
Net Asset Value and offering price per share ($7,735,733 ÷ 754,353 shares)A | | $ 10.25 |
| | |
Total Emerging Markets: | | |
Net Asset Value, offering price and redemption price per share ($37,918,319 ÷ 3,652,776 shares) | | $ 10.38 |
| | |
Class I: | | |
Net Asset Value, offering price and redemption price per share ($6,343,223 ÷ 611,457 shares) | | $ 10.37 |
A Redemption price per share is equal to net asset value less any applicable contingent deferred sales charge.
See accompanying notes which are an integral part of the financial statements.
Annual Report
Fidelity Total Emerging Markets Fund
Financial Statements - continued
Statement of Operations
| Year ended October 31, 2015 |
| | |
Investment Income | | |
Dividends | | $ 1,105,140 |
Interest | | 1,976,845 |
Income from Fidelity Central Funds | | 3,140 |
Income before foreign taxes withheld | | 3,085,125 |
Less foreign taxes withheld | | (111,245) |
Total income | | 2,973,880 |
| | |
Expenses | | |
Management fee | $ 564,291 | |
Transfer agent fees | 172,623 | |
Distribution and service plan fees | 148,766 | |
Accounting and security lending fees | 36,603 | |
Custodian fees and expenses | 262,557 | |
Independent trustees' compensation | 305 | |
Registration fees | 64,805 | |
Audit | 94,841 | |
Legal | 176 | |
Miscellaneous | 612 | |
Total expenses before reductions | 1,345,579 | |
Expense reductions | (217,505) | 1,128,074 |
Net investment income (loss) | | 1,845,806 |
Realized and Unrealized Gain (Loss) | | |
Net realized gain (loss) on: | | |
Investment securities: | | |
Unaffiliated issuers (net of foreign taxes of $51,537) | (1,335,001) | |
Foreign currency transactions | (33,466) | |
Futures contracts | 28,498 | |
Total net realized gain (loss) | | (1,339,969) |
Change in net unrealized appreciation (depreciation) on: Investment securities (net of decrease in deferred foreign taxes of $94,055) | (7,238,306) | |
Assets and liabilities in foreign currencies | 2,727 | |
Futures contracts | 21,984 | |
Total change in net unrealized appreciation (depreciation) | | (7,213,595) |
Net gain (loss) | | (8,553,564) |
Net increase (decrease) in net assets resulting from operations | | $ (6,707,758) |
See accompanying notes which are an integral part of the financial statements.
Annual Report
Statement of Changes in Net Assets
| Year ended
October 31,
2015 | Year ended
October 31,
2014 |
Increase (Decrease) in Net Assets | | |
Operations | | |
Net investment income (loss) | $ 1,845,806 | $ 1,316,375 |
Net realized gain (loss) | (1,339,969) | 3,140,986 |
Change in net unrealized appreciation (depreciation) | (7,213,595) | (2,656,389) |
Net increase (decrease) in net assets resulting from operations | (6,707,758) | 1,800,972 |
Distributions to shareholders from net investment income | (1,198,750) | (1,381,318) |
Distributions to shareholders from net realized gain | (136,019) | - |
Total distributions | (1,334,769) | (1,381,318) |
Share transactions - net increase (decrease) | (6,024,786) | (8,457,450) |
Redemption fees | 16,471 | 27,840 |
Total increase (decrease) in net assets | (14,050,842) | (8,009,956) |
| | |
Net Assets | | |
Beginning of period | 79,543,683 | 87,553,639 |
End of period (including undistributed net investment income of $1,546,081 and undistributed net investment income of $1,150,725, respectively) | $ 65,492,841 | $ 79,543,683 |
See accompanying notes which are an integral part of the financial statements.
Annual Report
Financial Highlights - Fidelity Total Emerging Markets Fund Class A
Years ended October 31, | 2015 | 2014 | 2013 | 2012 F |
Selected Per-Share Data | | | | |
Net asset value, beginning of period | $ 11.56 | $ 11.37 | $ 10.86 | $ 10.00 |
Income from Investment Operations | | | | |
Net investment income (loss) C | .28 | .18 | .18 | .20 |
Net realized and unrealized gain (loss) | (1.30) | .19 | .48 | .68 |
Total from investment operations | (1.02) | .37 | .66 | .88 |
Distributions from net investment income | (.17) | (.18) | (.15) | (.02) |
Distributions from net realized gain | (.02) | - | (.01) | - |
Total distributions | (.19) | (.18) | (.16) | (.02) |
Redemption fees added to paid in capitalC | - H | - H | .01 | -H |
Net asset value, end of period | $ 10.35 | $ 11.56 | $ 11.37 | $ 10.86 |
Total ReturnA, B | (8.92)% | 3.30% | 6.23% | 8.80% |
Ratios to Average Net AssetsD, G | | | | |
Expenses before reductions | 1.93% | 1.98% | 1.89% | 1.87% |
Expenses net of fee waivers, if any | 1.65% | 1.65% | 1.65% | 1.65% |
Expenses net of all reductions | 1.64% | 1.65% | 1.62% | 1.62% |
Net investment income (loss) | 2.58% | 1.61% | 1.61% | 1.92% |
Supplemental Data | | | | |
Net assets, end of period (000 omitted) | $ 10,164 | $ 13,627 | $ 18,837 | $ 7,675 |
Portfolio turnover rateE | 80% | 102% | 120% | 70% |
A Total returns would have been lower if certain expenses had not been reduced during the applicable periods shown.
B Total returns do not include the effect of the sales charges.
C Calculated based on average shares outstanding during the period.
D Fees and expenses of any underlying Fidelity Central Funds are not included in the Fund's expense ratio. The Fund indirectly bears its proportionate share of the expenses of any underlying Fidelity Central Funds.
E Amount does not include the portfolio activity of any underlying Fidelity Central Funds.
F For the period November 1, 2011 (commencement of operations) to October 31, 2012.
G Expense ratios reflect operating expenses of the class. Expenses before reductions do not reflect amounts reimbursed by the investment adviser or reductions from brokerage service arrangements or reductions from other expense offset arrangements and do not represent the amount paid by the class during periods when reimbursements or reductions occur. Expense ratios before reductions for start-up periods may not be representative of longer-term operating periods. Expenses net of fee waivers reflect expenses after reimbursement by the investment adviser but prior to reductions from brokerage service arrangements or other expense offset arrangements. Expenses net of all reductions represent the net expenses paid by the class.
H Amount represents less than $.005 per share.
See accompanying notes which are an integral part of the financial statements.
Annual Report
Financial Highlights - Fidelity Total Emerging Markets Fund Class T
Years ended October 31, | 2015 | 2014 | 2013 | 2012 G |
Selected Per-Share Data | | | | |
Net asset value, beginning of period | $ 11.54 | $ 11.34 | $ 10.84 | $ 10.00 |
Income from Investment Operations | | | | |
Net investment income (loss) C | .25 | .15 | .15 | .17 |
Net realized and unrealized gain (loss) | (1.30) | .19 | .48 | .68 |
Total from investment operations | (1.05) | .34 | .63 | .85 |
Distributions from net investment income | (.14) | (.14) | (.12) | (.01) |
Distributions from net realized gain | (.02) | - | (.01) | - |
Total distributions | (.16) | (.14) | (.14) F | (.01) |
Redemption fees added to paid in capitalC | -I | -I | .01 | -I |
Net asset value, end of period | $ 10.33 | $ 11.54 | $ 11.34 | $ 10.84 |
Total ReturnA, B | (9.18)% | 3.04% | 5.93% | 8.56% |
Ratios to Average Net AssetsD, H | | | | |
Expenses before reductions | 2.27% | 2.32% | 2.13% | 2.10% |
Expenses net of fee waivers, if any | 1.90% | 1.90% | 1.90% | 1.90% |
Expenses net of all reductions | 1.89% | 1.90% | 1.88% | 1.87% |
Net investment income (loss) | 2.33% | 1.36% | 1.36% | 1.67% |
Supplemental Data | | | | |
Net assets, end of period (000 omitted) | $ 3,331 | $ 5,277 | $ 5,967 | $ 5,823 |
Portfolio turnover rateE | 80% | 102% | 120% | 70% |
A Total returns would have been lower if certain expenses had not been reduced during the applicable periods shown.
B Total returns do not include the effect of the sales charges.
C Calculated based on average shares outstanding during the period.
D Fees and expenses of any underlying Fidelity Central Funds are not included in the Fund's expense ratio. The Fund indirectly bears its proportionate share of the expenses of any underlying Fidelity Central Funds.
E Amount does not include the portfolio activity of any underlying Fidelity Central Funds.
F Total distributions of $.14 per share is comprised of distributions from net investment income of $.124 and distributions from net realized gain of $.014 per share.
G For the period November 1, 2011 (commencement of operations) to October 31, 2012.
H Expense ratios reflect operating expenses of the class. Expenses before reductions do not reflect amounts reimbursed by the investment adviser or reductions from brokerage service arrangements or reductions from other expense offset arrangements and do not represent the amount paid by the class during periods when reimbursements or reductions occur. Expense ratios before reductions for start-up periods may not be representative of longer-term operating periods. Expenses net of fee waivers reflect expenses after reimbursement by the investment adviser but prior to reductions from brokerage service arrangements or other expense offset arrangements. Expenses net of all reductions represent the net expenses paid by the class.
I Amount represents less than $.005 per share.
See accompanying notes which are an integral part of the financial statements.
Annual Report
Financial Highlights - Fidelity Total Emerging Markets Fund Class C
Years ended October 31, | 2015 | 2014 | 2013 | 2012 F |
Selected Per-Share Data | | | | |
Net asset value, beginning of period | $ 11.47 | $ 11.29 | $ 10.80 | $ 10.00 |
Income from Investment Operations | | | | |
Net investment income (loss) C | .20 | .10 | .09 | .12 |
Net realized and unrealized gain (loss) | (1.30) | .19 | .47 | .69 |
Total from investment operations | (1.10) | .29 | .56 | .81 |
Distributions from net investment income | (.10) | (.11) | (.07) | (.01) |
Distributions from net realized gain | (.02) | - | (.01) | - |
Total distributions | (.12) | (.11) | (.08) | (.01) |
Redemption fees added to paid in capitalC | -H | -H | .01 | -H |
Net asset value, end of period | $ 10.25 | $ 11.47 | $ 11.29 | $ 10.80 |
Total ReturnA, B | (9.68)% | 2.56% | 5.31% | 8.07% |
Ratios to Average Net AssetsD, G | | | | |
Expenses before reductions | 2.68% | 2.72% | 2.65% | 2.63% |
Expenses net of fee waivers, if any | 2.40% | 2.40% | 2.40% | 2.40% |
Expenses net of all reductions | 2.39% | 2.40% | 2.37% | 2.37% |
Net investment income (loss) | 1.83% | .86% | .86% | 1.17% |
Supplemental Data | | | | |
Net assets, end of period (000 omitted) | $ 7,736 | $ 10,104 | $ 7,436 | $ 5,824 |
Portfolio turnover rateE | 80% | 102% | 120% | 70% |
A Total returns would have been lower if certain expenses had not been reduced during the applicable periods shown.
B Total returns do not include the effect of the contingent deferred sales charge.
C Calculated based on average shares outstanding during the period.
D Fees and expenses of any underlying Fidelity Central Funds are not included in the Fund's expense ratio. The Fund indirectly bears its proportionate share of the expenses of any underlying Fidelity Central Funds.
E Amount does not include the portfolio activity of any underlying Fidelity Central Funds.
F For the period November 1, 2011 (commencement of operations) to October 31, 2012.
G Expense ratios reflect operating expenses of the class. Expenses before reductions do not reflect amounts reimbursed by the investment adviser or reductions from brokerage service arrangements or reductions from other expense offset arrangements and do not represent the amount paid by the class during periods when reimbursements or reductions occur. Expense ratios before reductions for start-up periods may not be representative of longer-term operating periods. Expenses net of fee waivers reflect expenses after reimbursement by the investment adviser but prior to reductions from brokerage service arrangements or other expense offset arrangements. Expenses net of all reductions represent the net expenses paid by the class.
H Amount represents less than $.005 per share.
See accompanying notes which are an integral part of the financial statements.
Annual Report
Financial Highlights - Fidelity Total Emerging Markets Fund
Years ended October 31, | 2015 | 2014 | 2013 | 2012 E |
Selected Per-Share Data | | | | |
Net asset value, beginning of period | $ 11.60 | $ 11.40 | $ 10.89 | $ 10.00 |
Income from Investment Operations | | | | |
Net investment income (loss) B | .31 | .21 | .21 | .22 |
Net realized and unrealized gain (loss) | (1.31) | .19 | .47 | .69 |
Total from investment operations | (1.00) | .40 | .68 | .91 |
Distributions from net investment income | (.20) | (.20) | (.17) | (.02) |
Distributions from net realized gain | (.02) | - | (.01) | - |
Total distributions | (.22) | (.20) | (.18) | (.02) |
Redemption fees added to paid in capitalB | -G | -G | .01 | -G |
Net asset value, end of period | $ 10.38 | $ 11.60 | $ 11.40 | $ 10.89 |
Total ReturnA | (8.74)% | 3.56% | 6.44% | 9.15% |
Ratios to Average Net AssetsC, F | | | | |
Expenses before reductions | 1.72% | 1.73% | 1.56% | 1.60% |
Expenses net of fee waivers, if any | 1.40% | 1.40% | 1.40% | 1.40% |
Expenses net of all reductions | 1.39% | 1.40% | 1.38% | 1.38% |
Net investment income (loss) | 2.83% | 1.86% | 1.85% | 2.16% |
Supplemental Data | | | | |
Net assets, end of period (000 omitted) | $ 37,918 | $ 45,763 | $ 49,959 | $ 81,416 |
Portfolio turnover rateD | 80% | 102% | 120% | 70% |
A Total returns would have been lower if certain expenses had not been reduced during the applicable periods shown.
B Calculated based on average shares outstanding during the period.
C Fees and expenses of any underlying Fidelity Central Funds are not included in the Fund's expense ratio. The Fund indirectly bears its proportionate share of the expenses of any underlying Fidelity Central Funds.
D Amount does not include the portfolio activity of any underlying Fidelity Central Funds.
E For the period November 1, 2011 (commencement of operations) to October 31, 2012.
F Expense ratios reflect operating expenses of the class. Expenses before reductions do not reflect amounts reimbursed by the investment adviser or reductions from brokerage service arrangements or reductions from other expense offset arrangements and do not represent the amount paid by the class during periods when reimbursements or reductions occur. Expense ratios before reductions for start-up periods may not be representative of longer-term operating periods. Expenses net of fee waivers reflect expenses after reimbursement by the investment adviser but prior to reductions from brokerage service arrangements or other expense offset arrangements. Expenses net of all reductions represent the net expenses paid by the class.
G Amount represents less than $.005 per share.
See accompanying notes which are an integral part of the financial statements.
Annual Report
Financial Highlights - Fidelity Total Emerging Markets Fund Class I
Years ended October 31, | 2015 | 2014 | 2013 | 2012 E |
Selected Per-Share Data | | | | |
Net asset value, beginning of period | $ 11.59 | $ 11.40 | $ 10.89 | $ 10.00 |
Income from Investment Operations | | | | |
Net investment income (loss) B | .31 | .21 | .20 | .22 |
Net realized and unrealized gain (loss) | (1.31) | .18 | .48 | .69 |
Total from investment operations | (1.00) | .39 | .68 | .91 |
Distributions from net investment income | (.20) | (.20) | (.17) | (.02) |
Distributions from net realized gain | (.02) | - | (.01) | - |
Total distributions | (.22) | (.20) | (.18) | (.02) |
Redemption fees added to paid in capitalB | -G | -G | .01 | -G |
Net asset value, end of period | $ 10.37 | $ 11.59 | $ 11.40 | $ 10.89 |
Total ReturnA | (8.74)% | 3.51% | 6.44% | 9.15% |
Ratios to Average Net AssetsC, F | | | | |
Expenses before reductions | 1.58% | 1.71% | 1.63% | 1.62% |
Expenses net of fee waivers, if any | 1.40% | 1.40% | 1.40% | 1.40% |
Expenses net of all reductions | 1.39% | 1.40% | 1.37% | 1.37% |
Net investment income (loss) | 2.83% | 1.86% | 1.86% | 2.17% |
Supplemental Data | | | | |
Net assets, end of period (000 omitted) | $ 6,343 | $ 4,773 | $ 5,354 | $ 2,287 |
Portfolio turnover rateD | 80% | 102% | 120% | 70% |
A Total returns would have been lower if certain expenses had not been reduced during the applicable periods shown.
B Calculated based on average shares outstanding during the period.
C Fees and expenses of any underlying Fidelity Central Funds are not included in the Fund's expense ratio. The Fund indirectly bears its proportionate share of the expenses of any underlying Fidelity Central Funds.
D Amount does not include the portfolio activity of any underlying Fidelity Central Funds.
E For the period November 1, 2011 (commencement of operations) to October 31, 2012.
F Expense ratios reflect operating expenses of the class. Expenses before reductions do not reflect amounts reimbursed by the investment adviser or reductions from brokerage service arrangements or reductions from other expense offset arrangements and do not represent the amount paid by the class during periods when reimbursements or reductions occur. Expense ratios before reductions for start-up periods may not be representative of longer-term operating periods. Expenses net of fee waivers reflect expenses after reimbursement by the investment adviser but prior to reductions from brokerage service arrangements or other expense offset arrangements. Expenses net of all reductions represent the net expenses paid by the class.
G Amount represents less than $.005 per share.
See accompanying notes which are an integral part of the financial statements.
Annual Report
For the period ended October 31, 2015
1. Organization.
Fidelity Total Emerging Markets Fund (the Fund) is a fund of Fidelity Investment Trust (the Trust) and is authorized to issue an unlimited number of shares. The Trust is registered under the Investment Company Act of 1940, as amended (the 1940 Act), as an open-end management investment company organized as a Massachusetts business trust. The Fund offers Class A, Class T, Class C, Total Emerging Markets and Class I (formerly Institutional Class) shares, each of which has equal rights as to assets and voting privileges. Each class has exclusive voting rights with respect to matters that affect that class. The Fund's investments in emerging markets can be subject to social, economic, regulatory, and political uncertainties and can be extremely volatile.
2. Investments in Fidelity Central Funds.
The Fund invests in Fidelity Central Funds, which are open-end investment companies generally available only to other investment companies and accounts managed by the investment adviser and its affiliates. The Fund's Schedule of Investments lists each of the Fidelity Central Funds held as of period end, if any, as an investment of the Fund, but does not include the underlying holdings of each Fidelity Central Fund. As an Investing Fund, the Fund indirectly bears its proportionate share of the expenses of the underlying Fidelity Central Funds.
The Money Market Central Funds seek preservation of capital and current income and are managed by Fidelity Investments Money Management, Inc. (FIMM), an affiliate of the investment adviser. Annualized expenses of the Money Market Central Funds as of their most recent shareholder report date are less than .005%.
A complete unaudited list of holdings for each Fidelity Central Fund is available upon request or at the Securities and Exchange Commission (the SEC) website at www.sec.gov. In addition, the financial statements of the Fidelity Central Funds, which are not covered by the Fund's Report of Independent Registered Public Accounting Firm, are available on the SEC website or upon request.
3. Significant Accounting Policies.
The financial statements have been prepared in conformity with accounting principles generally accepted in the United States of America (GAAP), which require management to make certain estimates and assumptions at the date of the financial statements. Actual results could differ from those estimates. Subsequent events, if any, through the date that the financial statements were issued have been evaluated in the preparation of
Annual Report
3. Significant Accounting Policies - continued
the financial statements. The following summarizes the significant accounting policies of the Fund:
Investment Valuation. Investments are valued as of 4:00 p.m. Eastern time on the last calendar day of the period. The Board of Trustees (the Board) has delegated the day to day responsibility for the valuation of the Fund's investments to the Fidelity Management & Research Company (FMR) Fair Value Committee (the Committee). In accordance with valuation policies and procedures approved by the Board, the Fund attempts to obtain prices from one or more third party pricing vendors or brokers to value its investments. When current market prices, quotations or currency exchange rates are not readily available or reliable, investments will be fair valued in good faith by the Committee, in accordance with procedures adopted by the Board. Factors used in determining fair value vary by investment type and may include market or investment specific events, changes in interest rates and credit quality. The frequency with which these procedures are used cannot be predicted and they may be utilized to a significant extent. The Committee oversees the Fund's valuation policies and procedures and reports to the Board on the Committee's activities and fair value determinations. The Board monitors the appropriateness of the procedures used in valuing the Fund's investments and ratifies the fair value determinations of the Committee.
The Fund categorizes the inputs to valuation techniques used to value its investments into a disclosure hierarchy consisting of three levels as shown below:
Level 1 - quoted prices in active markets for identical investments
Level 2 - other significant observable inputs (including quoted prices for similar investments, interest rates, prepayment speeds, etc.)
Level 3 - unobservable inputs (including the Fund's own assumptions based on the best information available)
Valuation techniques used to value the Fund's investments by major category are as follows:
Equity securities, including restricted securities, for which market quotations are readily available, are valued at the last reported sale price or official closing price as reported by a third party pricing vendor on the primary market or exchange on which they are traded and are categorized as Level 1 in the hierarchy. In the event there were no sales during the day or closing prices are not available, securities are valued at the last quoted bid price or may be valued using the last available price and are generally categorized as Level 2 in the hierarchy. For foreign equity securities, when market or security specific events arise, comparisons to the valuation of American Depositary Receipts (ADRs), futures contracts, Exchange-Traded Funds (ETFs) and certain indexes as well as quoted prices for similar securities may be used and would be categorized as Level 2 in the hierarchy. Utilizing these techniques may result in transfers between Level 1 and Level 2.
Annual Report
Notes to Financial Statements - continued
3. Significant Accounting Policies - continued
Investment Valuation - continued
For equity securities, including restricted securities, where observable inputs are limited, assumptions about market activity and risk are used and these securities may be categorized as Level 3 in the hierarchy.
Debt securities, including restricted securities, are valued based on evaluated prices received from third party pricing vendors or from brokers who make markets in such securities. Corporate bonds, foreign government and government agency obligations, preferred securities and U.S. government and government agency obligations are valued by pricing vendors who utilize matrix pricing which considers yield or price of bonds of comparable quality, coupon, maturity and type or by broker-supplied prices. When independent prices are unavailable or unreliable, debt securities may be valued utilizing pricing methodologies which consider similar factors that would be used by third party pricing vendors. Debt securities are generally categorized as Level 2 in the hierarchy but may be Level 3 depending on the circumstances.
Futures contracts are valued at the settlement price established each day by the board of trade or exchange on which they are traded and are categorized as Level 1 in the hierarchy. Investments in open-end mutual funds, including the Fidelity Central Funds, are valued at their closing net asset value (NAV) each business day and are categorized as Level 1 in the hierarchy.
Changes in valuation techniques may result in transfers in or out of an assigned level within the disclosure hierarchy. The aggregate value of investments by input level as of October 31, 2015, including information on transfers between Levels 1 and 2, is included at the end of the Fund's Schedule of Investments.
Foreign Currency. The Fund may use foreign currency contracts to facilitate transactions in foreign-denominated securities. Gains and losses from these transactions may arise from changes in the value of the foreign currency or if the counterparties do not perform under the contracts' terms.
Foreign-denominated assets, including investment securities, and liabilities are translated into U.S. dollars at the exchange rates at period end. Purchases and sales of investment securities, income and dividends received and expenses denominated in foreign currencies are translated into U.S. dollars at the exchange rate in effect on the transaction date.
The effects of exchange rate fluctuations on investments are included with the net realized and unrealized gain (loss) on investment securities. Other foreign currency transactions resulting in realized and unrealized gain (loss) are disclosed separately.
Annual Report
3. Significant Accounting Policies - continued
Investment Transactions and Income. For financial reporting purposes, the Fund's investment holdings and NAV include trades executed through the end of the last business day of the period. The NAV per share for processing shareholder transactions is calculated as of the close of business of the New York Stock Exchange (NYSE), normally 4:00 p.m. Eastern time and includes trades executed through the end of the prior business day. Gains and losses on securities sold are determined on the basis of identified cost. Dividend income is recorded on the ex-dividend date, except for certain dividends from foreign securities where the ex-dividend date may have passed, which are recorded as soon as the Fund is informed of the ex-dividend date. Non-cash dividends included in dividend income, if any, are recorded at the fair market value of the securities received. Income and capital gain distributions from Fidelity Central Funds, if any, are recorded on the ex-dividend date. Distributions received on securities that represent a return of capital or capital gain are recorded as a reduction of cost of investments and/or as a realized gain. Subsequent to ex-dividend date the Fund determines the components of these distributions, based upon receipt of tax filings or other correspondence relating to the underlying investment. Interest income is accrued as earned and includes coupon interest and amortization of premium and accretion of discount on debt securities as applicable. Investment income is recorded net of foreign taxes withheld where recovery of such taxes is uncertain.
Class Allocations and Expenses. Investment income, realized and unrealized capital gains and losses, common expenses of the Fund, and certain fund-level expense reductions, if any, are allocated daily on a pro-rata basis to each class based on the relative net assets of each class to the total net assets of the Fund. Each class differs with respect to transfer agent and distribution and service plan fees incurred. Certain expense reductions may also differ by class. For the reporting period, the allocated portion of income and expenses to each class as a percent of its average net assets may vary due to the timing of recording these transactions in relation to fluctuating net assets of the classes. Expenses directly attributable to a fund are charged to that fund. Expenses attributable to more than one fund are allocated among the respective funds on the basis of relative net assets or other appropriate methods. Expense estimates are accrued in the period to which they relate and adjustments are made when actual amounts are known.
Income Tax Information and Distributions to Shareholders. Each year, the Fund intends to qualify as a regulated investment company under Subchapter M of the Internal Revenue Code, including distributing substantially all of its taxable income and realized gains. As a result, no provision for U.S. Federal income taxes is required. As of October 31, 2015, the Fund did not have any unrecognized tax benefits in the financial statements; nor is the Fund aware of any tax positions for which it is reasonably possible that the total amounts of unrecognized tax benefits will significantly change in the next twelve months. The Fund files a U.S. federal tax return, in addition to state and local tax
Annual Report
Notes to Financial Statements - continued
3. Significant Accounting Policies - continued
Income Tax Information and Distributions to Shareholders - continued
returns as required. The Fund's federal income tax returns are subject to examination by the Internal Revenue Service (IRS) for a period of three fiscal years after they are filed. State and local tax returns may be subject to examination for an additional fiscal year depending on the jurisdiction. Foreign taxes are provided for based on the Fund's understanding of the tax rules and rates that exist in the foreign markets in which it invests. The Fund is subject to a tax imposed on capital gains by certain countries in which it invests. An estimated deferred tax liability for net unrealized appreciation on the applicable securities is included in Other payables and accrued expenses on the Statement of Assets & Liabilities.
Distributions are declared and recorded on the ex-dividend date. Income dividends and capital gain distributions are declared separately for each class. Income and capital gain distributions are determined in accordance with income tax regulations, which may differ from GAAP. In addition, the Fund claimed a portion of the payment made to redeeming shareholders as a distribution for income tax purposes.
Capital accounts within the financial statements are adjusted for permanent book-tax differences. These adjustments have no impact on net assets or the results of operations. Capital accounts are not adjusted for temporary book-tax differences which will reverse in a subsequent period.
Book-tax differences are primarily due to foreign currency transactions, futures contracts, certain foreign taxes, market discount, passive foreign investment companies (PFIC), capital loss carryforward and losses deferred due to wash sales.
The federal tax cost of investment securities and unrealized appreciation (depreciation) as of period end were as follows:
Gross unrealized appreciation | $ 6,232,395 |
Gross unrealized depreciation | (6,504,580) |
Net unrealized appreciation (depreciation) on securities | $ (272,185) |
Tax Cost | $ 64,561,459 |
The tax-based components of distributable earnings as of period end were as follows:
Undistributed ordinary income | $ 1,285,899 |
Capital loss carryforward | $ (1,367,584) |
Net unrealized appreciation (depreciation) on securities and other investments | $ (274,699) |
Annual Report
3. Significant Accounting Policies - continued
Income Tax Information and Distributions to Shareholders - continued
Capital loss carryforwards are only available to offset future capital gains of the Fund to the extent provided by regulations and may be limited. Under the Regulated Investment Company Modernization Act of 2010 (the Act), the Fund is permitted to carry forward capital losses incurred in taxable years beginning after December 22, 2010 for an unlimited period and such capital losses are required to be used prior to any losses that expire. The capital loss carryforward information presented below, including any applicable limitation, is estimated as of fiscal period end and is subject to adjustment.
No expiration | |
Short-term | $ (1,367,584) |
The tax character of distributions paid was as follows:
| October 31, 2015 | October 31, 2014 |
Ordinary Income | $ 1,198,749 | $ 1,381,317 |
Long-term Capital Gain | 136,020 | - |
Total | $ 1,334,769 | $ 1,381,317 |
Short-Term Trading (Redemption) Fees. Shares held by investors in the Fund less than 90 days may have been subject to a redemption fee equal to 1.50% of the NAV of shares redeemed. All redemption fees, which reduce the proceeds of the shareholder redemption, are retained by the Fund and accounted for as an addition to paid in capital.
Restricted Securities. The Fund may invest in securities that are subject to legal or contractual restrictions on resale. These securities generally may be resold in transactions exempt from registration or to the public if the securities are registered. Disposal of these securities may involve time-consuming negotiations and expense, and prompt sale at an acceptable price may be difficult. Information regarding restricted securities is included at the end of the Fund's Schedule of Investments.
4. Derivative Instruments.
Risk Exposures and the Use of Derivative Instruments. The Fund's investment objective allows the Fund to enter into various types of derivative contracts, including futures contracts. Derivatives are investments whose value is primarily derived from underlying assets, indices or reference rates and may be transacted on an exchange or over-the-counter (OTC). Derivatives may involve a future commitment to buy or sell a specified asset based on specified terms, to exchange future cash flows at periodic intervals based on a notional principal amount, or for one party to make one or more payments upon the occurrence of specified events in exchange for periodic payments from the other party.
Annual Report
Notes to Financial Statements - continued
4. Derivative Instruments - continued
Risk Exposures and the Use of Derivative Instruments - continued
The Fund used derivatives to increase returns and to manage exposure to certain risks as defined below. The success of any strategy involving derivatives depends on analysis of numerous economic factors, and if the strategies for investment do not work as intended, the Fund may not achieve its objectives.
The Fund's use of derivatives increased or decreased its exposure to the following risks:
Equity Risk | Equity risk relates to the fluctuations in the value of financial instruments as a result of changes in market prices (other than those arising from interest rate risk or foreign exchange risk), whether caused by factors specific to an individual investment, its issuer, or all factors affecting all instruments traded in a market or market segment. |
The Fund is also exposed to additional risks from investing in derivatives, such as liquidity risk and counterparty credit risk. Liquidity risk is the risk that the Fund will be unable to close out the derivative in the open market in a timely manner. Counterparty credit risk is the risk that the counterparty will not be able to fulfill its obligation to the Fund. Counterparty credit risk related to exchange-traded futures contracts may be mitigated by the protection provided by the exchange on which they trade.
Investing in derivatives may involve greater risks than investing in the underlying assets directly and, to varying degrees, may involve risk of loss in excess of any initial investment and collateral received and amounts recognized in the Statement of Assets and Liabilities. In addition, there may be the risk that the change in value of the derivative contract does not correspond to the change in value of the underlying instrument.
Futures Contracts. A futures contract is an agreement between two parties to buy or sell a specified underlying instrument for a fixed price at a specified future date. The Fund used futures contracts to manage its exposure to the stock market.
Upon entering into a futures contract, a fund is required to deposit either cash or securities (initial margin) with a clearing broker in an amount equal to a certain percentage of the face value of the contract. Futures contracts are marked-to-market daily and subsequent daily payments (variation margin) are made or received by a fund depending on the daily fluctuations in the value of the futures contracts and are recorded as unrealized appreciation or (depreciation). This receivable and/or payable, if any, is included in daily variation margin for derivative instruments in the Statement of Assets and Liabilities. Realized gain or (loss) is recorded upon the expiration or closing of a futures contract.
Any open futures contracts at period end are presented in the Schedule of Investments under the caption "Futures Contracts." The underlying face amount at value reflects each contract's exposure to the underlying instrument or index at period end and is
Annual Report
4. Derivative Instruments - continued
Futures Contracts - continued
representative of volume of activity during the period. Securities deposited to meet initial margin requirements are identified in the Schedule of Investments.
During the period the Fund recognized net realized gain (loss) of $28,498 and a change in net unrealized appreciation (depreciation) of $21,984 related to its investment in futures contracts. These amounts are included in the Statement of Operations.
5. Purchases and Sales of Investments.
Purchases and sales of securities, other than short-term securities and U.S. government securities, aggregated $54,530,477 and $61,528,390, respectively.
6. Fees and Other Transactions with Affiliates.
Management Fee. Fidelity Management & Research Company (the investment adviser) and its affiliates provide the Fund with investment management related services for which the Fund pays a monthly management fee. The management fee is the sum of an individual fund fee rate that is based on an annual rate of .55% of the Fund's average net assets and an annualized group fee rate that averaged .25% during the period. The group fee rate is based upon the average net assets of all the mutual funds advised by the investment adviser, including any mutual funds previously advised by the investment adviser that are currently advised by Fidelity SelectCo, LLC, an affiliate of the investment adviser. The group fee rate decreases as assets under management increase and increases as assets under management decrease. For the reporting period, the total annual management fee rate was .80% of the Fund's average net assets.
Distribution and Service Plan Fees. In accordance with Rule 12b-1 of the 1940 Act, the Fund has adopted separate Distribution and Service Plans for each class of shares. Certain classes pay Fidelity Distributors Corporation (FDC), an affiliate of the investment adviser, separate Distribution and Service Fees, each of which is based on an annual percentage of each class' average net assets. In addition, FDC may pay financial intermediaries for selling shares of the Fund and providing shareholder support services. For the period, the Distribution and Service Fee rates, total fees and amounts retained by FDC were as follows:
| Distribution
Fee | Service
Fee | Total Fees | Retained
by FDC |
Class A | -% | .25% | $ 31,934 | $ 8,405 |
Class T | .25% | .25% | 22,488 | 8,147 |
Class C | .75% | .25% | 94,344 | 49,446 |
| | | $ 148,766 | $ 65,998 |
Annual Report
Notes to Financial Statements - continued
6. Fees and Other Transactions with Affiliates - continued
Sales Load. FDC may receive a front-end sales charge of up to 5.75% for selling Class A shares and 3.50% for selling Class T shares, some of which is paid to financial intermediaries for selling shares of the Fund. Depending on the holding period, FDC may receive contingent deferred sales charges levied on Class A, Class T, and Class C redemptions. The deferred sales charges are 1.00% for Class C shares, 1.00% for certain purchases of Class A shares and .25% for certain purchases of Class T shares.
For the period, sales charge amounts retained by FDC were as follows:
| Retained
by FDC |
Class A | $ 4,577 |
Class T | 1,143 |
Class CA | 5,625 |
| $ 11,345 |
A When Class C shares are initially sold, FDC pays commissions from its own resources to financial intermediaries through which the sales are made.
Transfer Agent Fees. Fidelity Investments Institutional Operations Company, Inc., (FIIOC), an affiliate of the investment adviser, is the transfer, dividend disbursing and shareholder servicing agent for each class of the Fund. FIIOC receives account fees and asset-based fees that vary according to the account size and type of account of the shareholders of the respective classes of the Fund. FIIOC pays for typesetting, printing and mailing of shareholder reports, except proxy statements.
For the period, transfer agent fees for each class were as follows:
| Amount | % of
Class-Level Average
Net Assets |
Class A | $ 29,046 | .23 |
Class T | 14,108 | .31 |
Class C | 21,328 | .23 |
Total Emerging Markets | 97,762 | .26 |
Class I | 10,379 | .16 |
| $ 172,623 | |
Accounting and Security Lending Fees. Fidelity Service Company, Inc. (FSC), an affiliate of the investment adviser, maintains the Fund's accounting records. The accounting fee is based on the level of average net assets for each month. Under a separate contract, FSC administers the security lending program. The security lending fee is based on the number and duration of lending transactions.
Annual Report
6. Fees and Other Transactions with Affiliates - continued
Brokerage Commissions. The Fund placed a portion of its portfolio transactions with brokerage firms which are affiliates of the investment adviser. Brokerage commissions are included in net realized gain (loss) and change in net unrealized appreciation (depreciation) in the Statement of Operations. The commissions paid to these affiliated firms were $434 for the period.
7. Committed Line of Credit.
The Fund participates with other funds managed by the investment adviser or an affiliate in a $4.25 billion credit facility (the "line of credit") to be utilized for temporary or emergency purposes to fund shareholder redemptions or for other short-term liquidity purposes. The Fund has agreed to pay commitment fees on its pro-rata portion of the line of credit, which amounted to $104 and is reflected in Miscellaneous expenses on the Statement of Operations. During the period, the Fund did not borrow on this line of credit.
8. Security Lending.
The Fund lends portfolio securities through a lending agent from time to time in order to earn additional income. For equity securities, a lending agent is used and may loan securities to certain qualified borrowers, including Fidelity Capital Markets (FCM), a broker-dealer affiliated with the Fund. On the settlement date of the loan, the Fund receives collateral (in the form of U.S. Treasury obligations, letters of credit and/or cash) against the loaned securities and maintains collateral in an amount not less than 100% of the market value of the loaned securities during the period of the loan. The market value of the loaned securities is determined at the close of business of the Fund and any additional required collateral is delivered to the Fund on the next business day. The Fund or borrower may terminate the loan at any time, and if the borrower defaults on its obligation to return the securities loaned because of insolvency or other reasons, the Fund may apply collateral received from the borrower against the obligation. The Fund may experience delays and costs in recovering the securities loaned. Any cash collateral received is invested in the Fidelity Securities Lending Cash Central Fund. At period end, there were no security loans outstanding. Security lending income represents the income earned on investing cash collateral, less rebates paid to borrowers and any lending agent fees associated with the loan, plus any premium payments received for lending certain types of securities. Security lending income is presented in the Statement of Operations as a component of income from Fidelity Central Funds. Total security lending income during the period amounted to $640. During the period, there were no securities loaned to FCM.
Annual Report
Notes to Financial Statements - continued
9. Expense Reductions.
The investment adviser contractually agreed to reimburse each class to the extent annual operating expenses exceeded certain levels of average net assets as noted in the table below. This reimbursement will remain in place through December 31, 2016. Some expenses, for example interest expense, including commitment fees, are excluded from this reimbursement.
The following classes were in reimbursement during the period:
| Expense
Limitations | Reimbursement |
Class A | 1.65% | $ 35,348 |
Class T | 1.90% | 16,501 |
Class C | 2.40% | 26,141 |
Total Emerging Markets | 1.40% | 119,637 |
Class I | 1.40% | 11,808 |
| | $ 209,435 |
Commissions paid to certain brokers with whom the investment adviser, or its affiliates, places trades on behalf of the Fund include an amount in addition to trade execution, which may be rebated back to the Fund to offset certain expenses. This amount totaled $5,745 for the period. In addition, through arrangements with the Fund's custodian, credits realized as a result of certain uninvested cash balances were used to reduce the Fund's expenses. During the period, these credits reduced the Fund's custody expenses by $199.
In addition, during the period the investment adviser reimbursed and/or waived a portion of fund-level operating expenses in the amount of $278 and a portion of class-level operating expenses as follows:
| Amount |
Class A | $ 359 |
Class T | 94 |
Class C | 192 |
Total Emerging Markets | 1,090 |
Class I | 113 |
| $ 1,848 |
Annual Report
10. Distributions to Shareholders.
Distributions to shareholders of each class were as follows:
Years ended October 31, | 2015 | 2014 |
From net investment income | | |
Class A | $ 211,944 | $ 298,475 |
Class T | 63,689 | 72,882 |
Class C | 88,937 | 71,691 |
Total Emerging Markets | 751,293 | 837,446 |
Class I | 82,887 | 100,824 |
Total | $ 1,198,750 | $ 1,381,318 |
From net realized gain | | |
Class A | $ 24,934 | $ - |
Class T | 9,098 | - |
Class C | 18,150 | - |
Total Emerging Markets | 75,507 | - |
Class I | 8,330 | - |
Total | $ 136,019 | $ - |
11. Share Transactions.
Share transactions for each class were as follows and may contain automatic conversions between classes or exchanges between funds:
| Shares | Dollars |
Years ended October 31, | 2015 | 2014 | 2015 | 2014 |
Class A | | | | |
Shares sold | 251,231 | 374,099 | $ 2,772,246 | $ 4,265,512 |
Reinvestment of distributions | 21,174 | 24,147 | 232,918 | 267,553 |
Shares redeemed | (469,131) | (876,261) | (4,963,727) | (9,758,391) |
Net increase (decrease) | (196,726) | (478,015) | $ (1,958,563) | $ (5,225,326) |
Class T | | | | |
Shares sold | 45,171 | 73,071 | $ 491,646 | $ 838,229 |
Reinvestment of distributions | 6,566 | 6,487 | 72,226 | 71,875 |
Shares redeemed | (186,633) | (148,531) | (1,964,687) | (1,659,489) |
Net increase (decrease) | (134,896) | (68,973) | $ (1,400,815) | $ (749,385) |
Class C | | | | |
Shares sold | 198,104 | 312,027 | $ 2,115,228 | $ 3,545,260 |
Reinvestment of distributions | 9,691 | 6,236 | 106,316 | 69,031 |
Shares redeemed | (334,580) | (95,617) | (3,520,139) | (1,079,948) |
Net increase (decrease) | (126,785) | 222,646 | $ (1,298,595) | $ 2,534,343 |
Annual Report
Notes to Financial Statements - continued
11. Share Transactions - continued
| Shares | Dollars |
Years ended October 31, | 2015 | 2014 | 2015 | 2014 |
Total Emerging Markets | | | | |
Shares sold | 1,772,167 | 1,227,986 | $ 18,534,579 | $ 14,240,572 |
Reinvestment of distributions | 70,595 | 69,851 | 777,256 | 774,644 |
Shares redeemed | (2,136,425) | (1,734,596) | (22,904,245) | (19,517,156) |
Net increase (decrease) | (293,663) | (436,759) | $ (3,592,410) | $ (4,501,940) |
Class I | | | | |
Shares sold | 421,240 | 216,506 | $ 4,563,340 | $ 2,508,322 |
Reinvestment of distributions | 8,237 | 8,910 | 90,609 | 98,814 |
Shares redeemed | (229,844) | (283,392) | (2,428,352) | (3,122,278) |
Net increase (decrease) | 199,633 | (57,976) | $ 2,225,597 | $ (515,142) |
12. Other.
The Fund's organizational documents provide former and current trustees and officers with a limited indemnification against liabilities arising in connection with the performance of their duties to the Fund. In the normal course of business, the Fund may also enter into contracts that provide general indemnifications. The Fund's maximum exposure under these arrangements is unknown as this would be dependent on future claims that may be made against the Fund. The risk of material loss from such claims is considered remote.
At the end of the period, the investment adviser or its affiliates were the owners of record of 13% of the total outstanding shares of the fund.
Annual Report
To the Trustees of Fidelity Investment Trust and the Shareholders of Fidelity Total Emerging Markets Fund:
In our opinion, the accompanying statement of assets and liabilities, including the schedule of investments, and the related statements of operations and of changes in net assets and the financial highlights present fairly, in all material respects, the financial position of Fidelity Total Emerging Markets Fund (a fund of Fidelity Investment Trust) at October 31, 2015, the results of its operations for the year then ended, the changes in its net assets for each of the two years in the period then ended and the financial highlights for each of the periods indicated, in conformity with accounting principles generally accepted in the United States of America. These financial statements and financial highlights (hereafter referred to as "financial statements") are the responsibility of the Fidelity Total Emerging Markets Fund's management. Our responsibility is to express an opinion on these financial statements based on our audits. We conducted our audits of these financial statements in accordance with the standards of the Public Company Accounting Oversight Board (United States). Those standards require that we plan and perform the audit to obtain reasonable assurance about whether the financial statements are free of material misstatement. An audit includes examining, on a test basis, evidence supporting the amounts and disclosures in the financial statements, assessing the accounting principles used and significant estimates made by management, and evaluating the overall financial statement presentation. We believe that our audits, which included confirmation of securities at October 31, 2015 by correspondence with the custodian and brokers, provide a reasonable basis for our opinion.
PricewaterhouseCoopers LLP
Boston, Massachusetts
December 18, 2015
Annual Report
The Trustees, Member of the Advisory Board, and officers of the trust and fund, as applicable, are listed below. The Board of Trustees governs the fund and is responsible for protecting the interests of shareholders. The Trustees are experienced executives who meet periodically throughout the year to oversee the fund's activities, review contractual arrangements with companies that provide services to the fund, oversee management of the risks associated with such activities and contractual arrangements, and review the fund's performance. Each of the Trustees oversees 170 funds.
The Trustees hold office without limit in time except that (a) any Trustee may resign; (b) any Trustee may be removed by written instrument, signed by at least two-thirds of the number of Trustees prior to such removal; (c) any Trustee who requests to be retired or who has become incapacitated by illness or injury may be retired by written instrument signed by a majority of the other Trustees; and (d) any Trustee may be removed at any special meeting of shareholders by a two-thirds vote of the outstanding voting securities of the trust. Each Trustee who is not an interested person (as defined in the 1940 Act) of the trust and the fund (Independent Trustee), shall retire not later than the last day of the calendar year in which his or her 75th birthday occurs. The Independent Trustees may waive this mandatory retirement age policy with respect to individual Trustees. The officers and Advisory Board Member hold office without limit in time, except that any officer and Advisory Board Member may resign or may be removed by a vote of a majority of the Trustees at any regular meeting or any special meeting of the Trustees. Except as indicated, each individual has held the office shown or other offices in the same company for the past five years.
Experience, Skills, Attributes, and Qualifications of the Fund's Trustees. The Governance and Nominating Committee has adopted a statement of policy that describes the experience, qualifications, attributes, and skills that are necessary and desirable for potential Independent Trustee candidates (Statement of Policy). The Board believes that each Trustee satisfied at the time he or she was initially elected or appointed a Trustee, and continues to satisfy, the standards contemplated by the Statement of Policy. The Governance and Nominating Committee also engages professional search firms to help identify potential Independent Trustee candidates who have the experience, qualifications, attributes, and skills consistent with the Statement of Policy. From time to time, additional criteria based on the composition and skills of the current Independent Trustees, as well as experience or skills that may be appropriate in light of future changes to board composition, business conditions, and regulatory or other developments, have also been considered by the professional search firms and the Governance and Nominating Committee. In addition, the Board takes into account the Trustees' commitment and participation in Board and committee meetings, as well as their leadership of standing and ad hoc committees throughout their tenure.
In determining that a particular Trustee was and continues to be qualified to serve as a Trustee, the Board has considered a variety of criteria, none of which, in isolation, was controlling. The Board believes that, collectively, the Trustees have balanced and diverse experience, qualifications, attributes, and skills, which allow the Board to operate effectively in governing the fund and protecting the interests of shareholders. Information about the specific experience, skills, attributes, and qualifications of each Trustee, which in each case led to the Board's conclusion that the Trustee should serve (or continue to serve) as a trustee of the fund, is provided below.
Annual Report
Trustees and Officers - continued
Board Structure and Oversight Function. James C. Curvey is an interested person (as defined in the 1940 Act) and currently serves as Chairman. The Trustees have determined that an interested Chairman is appropriate and benefits shareholders because an interested Chairman has a personal and professional stake in the quality and continuity of services provided to the fund. Independent Trustees exercise their informed business judgment to appoint an individual of their choosing to serve as Chairman, regardless of whether the Trustee happens to be independent or a member of management. The Independent Trustees have determined that they can act independently and effectively without having an Independent Trustee serve as Chairman and that a key structural component for assuring that they are in a position to do so is for the Independent Trustees to constitute a substantial majority for the Board. The Independent Trustees also regularly meet in executive session. Ned C. Lautenbach serves as Chairman of the Independent Trustees and as such (i) acts as a liaison between the Independent Trustees and management with respect to matters important to the Independent Trustees and (ii) with management prepares agendas for Board meetings.
Fidelity funds are overseen by different Boards of Trustees. The fund's Board oversees Fidelity's high income and certain equity funds, and other Boards oversee Fidelity's investment-grade bond, money market, asset allocation, and sector funds. The asset allocation funds may invest in Fidelity funds overseen by the fund's Board. The use of separate Boards, each with its own committee structure, allows the Trustees of each group of Fidelity funds to focus on the unique issues of the funds they oversee, including common research, investment, and operational issues. On occasion, the separate Boards establish joint committees to address issues of overlapping consequences for the Fidelity funds overseen by each Board.
The Trustees operate using a system of committees to facilitate the timely and efficient consideration of all matters of importance to the Trustees, the fund, and fund shareholders and to facilitate compliance with legal and regulatory requirements and oversight of the fund's activities and associated risks. The Board, acting through its committees, has charged FMR and its affiliates with (i) identifying events or circumstances the occurrence of which could have demonstrably adverse effects on the fund's business and/or reputation; (ii) implementing processes and controls to lessen the possibility that such events or circumstances occur or to mitigate the effects of such events or circumstances if they do occur; and (iii) creating and maintaining a system designed to evaluate continuously business and market conditions in order to facilitate the identification and implementation processes described in (i) and (ii) above. Because the day-to-day operations and activities of the fund are carried out by or through FMR, its affiliates and other service providers, the fund's exposure to risks is mitigated but not eliminated by the processes overseen by the Trustees. While each of the Board's committees has responsibility for overseeing different aspects of the fund's activities, oversight is exercised primarily through the Operations, Audit, and Compliance Committees. In addition, the Independent Trustees have worked with FMR to enhance the Board's oversight of investment and financial risks, legal and regulatory risks, technology risks, and operational risks, including the development of additional risk reporting to the Board. For example, a working group comprised of Independent Trustees and FMR has worked and continues to work to review the Fidelity funds' valuation-related activities, reporting and risk management. Appropriate personnel, including but not limited to the fund's Chief Compliance Officer (CCO), FMR's internal auditor, the independent accountants, the fund's Treasurer and portfolio management personnel, make periodic reports to the Board's committees, as appropriate, including an annual review of Fidelity's risk management program for the Fidelity funds. The responsibilities of each standing committee, including their oversight responsibilities, are described further under "Standing Committees of the Fund's Trustees."
Annual Report
The fund's Statement of Additional Information (SAI) includes more information about the Trustees. To request a free copy, call Fidelity at 1-877-208-0098.
Interested Trustees*:
Correspondence intended for each Trustee who is an interested person may be sent to Fidelity Investments, 245 Summer Street, Boston, Massachusetts 02210.
Name, Year of Birth; Principal Occupations and Other Relevant Experience+ |
James C. Curvey (1935) |
Year of Election or Appointment: 2007 Trustee Chairman of the Board of Trustees |
| Mr. Curvey also serves as Trustee of other Fidelity funds. Mr. Curvey is a Director of Fidelity Research & Analysis Co. (investment adviser firm, 2009-present), and Vice Chairman (2007-present) and Director of FMR LLC (diversified financial services company). In addition, Mr. Curvey serves as an Overseer for the Boston Symphony Orchestra and a member of the board of Artis-Naples, Naples, Florida, and as a Trustee for Brewster Academy, Wolfeboro, New Hampshire. Previously, Mr. Curvey served as a Director of Fidelity Investments Money Management, Inc. (investment adviser firm, 2009-2014) and a Director of FMR and FMR Co., Inc. (investment adviser firms, 2007-2014). |
Charles S. Morrison (1960) |
Year of Election or Appointment: 2014 Trustee |
| Mr. Morrison also serves as Trustee of other funds. He serves as a Director of Fidelity Investments Money Management, Inc. (FIMM) (investment adviser firm, 2014-present), Director of Fidelity SelectCo, LLC (investment adviser firm, 2014-present), President, Asset Management (2014-present), and is an employee of Fidelity Investments. Previously, Mr. Morrison served as Vice President of Fidelity's Fixed Income and Asset Allocation Funds (2012-2014), President, Fixed Income (2011-2014), Vice President of Fidelity's Money Market Funds (2005-2009), President, Money Market Group Leader of FMR (investment adviser firm, 2009), and Senior Vice President, Money Market Group of FMR (2004-2009). Mr. Morrison also served as Vice President of Fidelity's Bond Funds (2002-2005), certain Balanced Funds (2002-2005), and certain Asset Allocation Funds (2002-2007), and as Senior Vice President (2002-2005) of Fidelity's Bond Division. |
* Trustees have been determined to be "Interested Trustees" by virtue of, among other things, their affiliation with the trust or various entities under common control with FMR.
+ The information above includes each Trustee's principal occupation during the last five years and other information relating to the experience, attributes, and skills relevant to each Trustee's qualifications to serve as a Trustee, which led to the conclusion that each Trustee should serve as a Trustee for the fund.
Annual Report
Independent Trustees:
Correspondence intended for each Independent Trustee (that is, the Trustees other than the Interested Trustees) may be sent to Fidelity Investments, P.O. Box 55235, Boston, Massachusetts 02205-5235.
Name, Year of Birth; Principal Occupations and Other Relevant Experience+ |
Dennis J. Dirks (1948) |
Year of Election or Appointment: 2005 Trustee |
| Mr. Dirks also serves as Trustee of other Fidelity funds. Prior to his retirement in May 2003, Mr. Dirks was Chief Operating Officer and a member of the Board of The Depository Trust & Clearing Corporation (DTCC). He also served as President, Chief Operating Officer, and Board member of The Depository Trust Company (DTC) and President and Board member of the National Securities Clearing Corporation (NSCC). In addition, Mr. Dirks served as Chief Executive Officer and Board member of the Government Securities Clearing Corporation, Chief Executive Officer and Board member of the Mortgage-Backed Securities Clearing Corporation, as a Trustee and a member of the Finance Committee of Manhattan College (2005-2008), as a Trustee and a member of the Finance Committee of AHRC of Nassau County (2006-2008), and as a member of the Independent Directors Council (IDC) Governing Council (2010-2015). Mr. Dirks is a member of the Board of Directors for The Brookville Center for Children's Services, Inc. (2009-present). |
Alan J. Lacy (1953) |
Year of Election or Appointment: 2008 Trustee |
| Mr. Lacy also serves as Trustee of other Fidelity funds. Mr. Lacy serves as a member of the Board of Directors of Dave & Buster's Entertainment, Inc. (restaurant and entertainment complexes, 2010-present) and Bristol-Myers Squibb Company (global pharmaceuticals, 2008-present). In addition, Mr. Lacy served as Senior Adviser (2007-2014) of Oak Hill Capital Partners, L.P. (private equity) and also served as Chief Executive Officer (2000-2005) and Vice Chairman (2005-2006) of Sears Holdings Corporation and Sears, Roebuck and Co. (retail). Mr. Lacy is a member of the Board of Trustees of The National Parks Conservation Association (2006-present). Previously, Mr. Lacy served as Chairman of the Board of Trustees of the National Parks Conservation Association (2008-2011) and as a member of the Board of Directors for The Western Union Company (global money transfer, 2006-2011), The Hillman Companies, Inc. (hardware wholesalers, 2010-2014), and Earth Fare, Inc. (retail grocery, 2010-2014). |
Ned C. Lautenbach (1944) |
Year of Election or Appointment: 2000 Trustee Chairman of the Independent Trustees |
| Mr. Lautenbach also serves as Trustee of other Fidelity funds. Mr. Lautenbach currently serves as the Lead Director of the Eaton Corporation Board of Directors (diversified industrial, 1997-present). Mr. Lautenbach is Chairman of the Board of Directors of Artis-Naples in Naples, Florida (2012-present), a member of the Council on Foreign Relations (1994-present), and a member of the Board of Governors, State University System of Florida (2013-present). Previously, Mr. Lautenbach was a Partner/Advisory Partner at Clayton, Dubilier & Rice, LLC (private equity investment, 1998-2010), as well as a Director of Sony Corporation (2006-2007). |
Joseph Mauriello (1944) |
Year of Election or Appointment: 2008 Trustee |
| Mr. Mauriello also serves as Trustee of other Fidelity funds. Prior to his retirement in January 2006, Mr. Mauriello served in numerous senior management positions including Deputy Chairman and Chief Operating Officer (2004-2005), and Vice Chairman of Financial Services (2002-2004) of KPMG LLP US (professional services, 1965-2005). Mr. Mauriello currently serves as a member of the Board of Directors of XL Group plc. (global insurance and re-insurance, 2006-present) and the Independent Directors Council (IDC) Governing Council (2015-present). Previously, Mr. Mauriello served as a Director of the Hamilton Funds of the Bank of New York (2006-2007) and of Arcadia Resources Inc. (health care services and products, 2007-2012). |
Robert W. Selander (1950) |
Year of Election or Appointment: 2011 Trustee |
| Mr. Selander also serves as Trustee of other Fidelity funds. Mr. Selander serves as a Director of The Western Union Company (global money transfer, 2014-present). Previously, Mr. Selander served as a Member of the Advisory Board of other Fidelity funds (2011), and Executive Vice Chairman (2010), Chief Executive Officer (2009-2010), and President and Chief Executive Officer (1997-2009) of Mastercard, Inc. |
Cornelia M. Small (1944) |
Year of Election or Appointment: 2005 Trustee |
| Ms. Small also serves as Trustee of other Fidelity funds. Ms. Small is a member of the Board of Directors (2009-present) and Chair of the Investment Committee (2010-present) of the Teagle Foundation. Ms. Small also serves on the Investment Committee of the Berkshire Taconic Community Foundation (2008-present). Previously, Ms. Small served as Chairperson (2002-2008) and a member of the Investment Committee and Chairperson (2008-2012) and a member of the Board of Trustees of Smith College. In addition, Ms. Small served as Chief Investment Officer, Director of Global Equity Investments, and a member of the Board of Directors of Scudder, Stevens & Clark and Scudder Kemper Investments. |
William S. Stavropoulos (1939) |
Year of Election or Appointment: 2001 Trustee Vice Chairman of the Independent Trustees |
| Mr. Stavropoulos also serves as Trustee of other Fidelity funds. Mr. Stavropoulos serves as President and Founder of the Michigan Baseball Foundation, the Great Lakes Loons (2007-present). Mr. Stavropoulos is Chairman Emeritus of the Board of Directors of The Dow Chemical Company, where he previously served in numerous senior management positions, including President, CEO (1995-2000; 2002-2004), Chairman of the Executive Committee (2000-2006), and as a member of the Board of Directors (1990-2006). Currently, Mr. Stavropoulos is Chairman of the Board of Directors of Univar Inc. (global distributor of commodity and specialty chemicals), a Director of Teradata Corporation (data warehousing and technology solutions), and Maersk Inc. (industrial conglomerate), and a member of the Advisory Board for Metalmark Capital LLC (private equity investment, 2005-present). Mr. Stavropoulos is an operating advisor to Clayton, Dubilier & Rice, LLC (private equity investment). In addition, Mr. Stavropoulos is a member of the University of Notre Dame Advisory Council for the College of Science, a Trustee of the Rollin L. Gerstacker Foundation, and a Director of the Naples Philharmonic Center for the Arts. Previously, Mr. Stavropoulos served as a Director of Chemical Financial Corporation (bank holding company, 1993-2012) and Tyco International, Ltd. (multinational manufacturing and services, 2007-2012). |
David M. Thomas (1949) |
Year of Election or Appointment: 2008 Trustee |
| Mr. Thomas also serves as Trustee of other Fidelity funds. Mr. Thomas serves as Non-Executive Chairman of the Board of Directors of Fortune Brands Home and Security (home and security products, 2011-present), as a member of the Board of Directors (2004-present) and Presiding Director (2013-present) of Interpublic Group of Companies, Inc. (marketing communication), and as a member of the Board of Trustees of the University of Florida (2013-present). Previously, Mr. Thomas served as Executive Chairman (2005-2006) and Chairman and Chief Executive Officer (2000-2005) of IMS Health, Inc. (pharmaceutical and healthcare information solutions), and a Director of Fortune Brands, Inc. (consumer products, 2000-2011). |
+ The information above includes each Trustee's principal occupation during the last five years and other information relating to the experience, attributes, and skills relevant to each Trustee's qualifications to serve as a Trustee, which led to the conclusion that each Trustee should serve as a Trustee for the fund.
Advisory Board Member and Officers:
Correspondence intended for each officer and Peter S. Lynch may be sent to Fidelity Investments, 245 Summer Street, Boston, Massachusetts 02210. Officers appear below in alphabetical order.
Name, Year of Birth; Principal Occupation |
Peter S. Lynch (1944) |
Year of Election or Appointment: 2003 Member of the Advisory Board |
| Mr. Lynch also serves as Member of the Advisory Board of other Fidelity funds. Mr. Lynch is Vice Chairman and a Director of FMR (investment adviser firm) and FMR Co., Inc. (investment adviser firm). In addition, Mr. Lynch serves as a Trustee of Boston College and as the Chairman of the Inner-City Scholarship Fund. Previously, Mr. Lynch served on the Special Olympics International Board of Directors (1997-2006). |
Elizabeth Paige Baumann (1968) |
Year of Election or Appointment: 2012 Anti-Money Laundering (AML) Officer |
| Ms. Baumann also serves as AML Officer of other funds. She is Chief AML Officer of FMR LLC (diversified financial services company, 2012-present) and is an employee of Fidelity Investments. Previously, Ms. Baumann served as Vice President and Deputy Anti-Money Laundering Officer (2007-2012). |
Marc R. Bryant (1966) |
Year of Election or Appointment: 2015 Secretary and Chief Legal Officer (CLO) |
| Mr. Bryant also serves as Secretary and CLO of other funds. Mr. Bryant serves as CLO, Secretary, and Senior Vice President of Fidelity Management & Research Company (investment adviser firm, 2015-present) and FMR Co., Inc. (investment adviser firm, 2015-present); Secretary of Fidelity SelectCo, LLC (investment adviser firm, 2015-present) and Fidelity Investments Money Management, Inc. (investment adviser firm, 2015-present); and CLO of Fidelity Management & Research (Hong Kong) Limited (investment adviser firm, 2015-present). He is Senior Vice President and Deputy General Counsel of FMR LLC (diversified financial services company). Previously, Mr. Bryant served as Secretary and Chief Legal Officer of Fidelity Rutland Square Trust II (2010-2014) and Assistant Secretary of Fidelity's Fixed Income and Asset Allocation Funds (2013-2015). Prior to joining Fidelity Investments, Mr. Bryant served as a Senior Vice President and the Head of Global Retail Legal for AllianceBernstein L.P. (2006-2010), and as the General Counsel for ProFund Advisors LLC (2001-2006). |
William C. Coffey (1969) |
Year of Election or Appointment: 2009 Assistant Secretary |
| Mr. Coffey also serves as Assistant Secretary of other funds. He is Senior Vice President and Deputy General Counsel of FMR LLC (diversified financial services company, 2010-present), and is an employee of Fidelity Investments. Previously, Mr. Coffey served as Vice President and Associate General Counsel of FMR LLC (2005-2009). |
Timothy M. Cohen (1969) |
Year of Election or Appointment: 2014 Vice President of certain Equity Funds |
| Mr. Cohen also serves as Vice President of other funds. Mr. Cohen serves as Chief Compliance Officer of FMR Investment Management (U.K.) Limited (investment adviser firm, 2013-present) and is an employee of Fidelity Investments. Previously, Mr. Cohen served as a Director of FMR Investment Management (U.K.) Limited (2013-2015). |
Jonathan Davis (1968) |
Year of Election or Appointment: 2010 Assistant Treasurer |
| Mr. Davis also serves as Assistant Treasurer of other funds, and is an employee of Fidelity Investments. Previously, Mr. Davis served as Vice President and Associate General Counsel of FMR LLC (diversified financial services company, 2003-2010). |
Adrien E. Deberghes (1967) |
Year of Election or Appointment: 2008 Deputy Treasurer |
| Mr. Deberghes also serves as an officer of other funds. He is an employee of Fidelity Investments (2008-present). Prior to joining Fidelity Investments, Mr. Deberghes was Senior Vice President of Mutual Fund Administration at State Street Corporation (2007-2008), Senior Director of Mutual Fund Administration at Investors Bank & Trust (2005-2007), and Director of Finance for Dunkin' Brands (2000-2005). |
Stephanie J. Dorsey (1969) |
Year of Election or Appointment: 2010 Assistant Treasurer |
| Ms. Dorsey also serves as an officer of other funds. She is an employee of Fidelity Investments (2008-present) and has served in other fund officer roles. Prior to joining Fidelity Investments, Ms. Dorsey served as Treasurer (2004-2008) of the JPMorgan Mutual Funds and Vice President (2004-2008) of JPMorgan Chase Bank. |
Howard J. Galligan III (1966) |
Year of Election or Appointment: 2014 Chief Financial Officer |
| Mr. Galligan also serves as Chief Financial Officer of other funds. Mr. Galligan serves as President of Fidelity Pricing and Cash Management Services (FPCMS) (2014-present) and as a Director of Strategic Advisers, Inc. (investment adviser firm, 2008-present). Previously, Mr. Galligan served as Chief Administrative Officer of Asset Management (2011-2014) and Chief Operating Officer and Senior Vice President of Investment Support for Strategic Advisers, Inc. (2003-2011). |
Scott C. Goebel (1968) |
Year of Election or Appointment: 2015 Vice President |
| Mr. Goebel serves as Vice President of other funds and is an employee of Fidelity Investments (2001-present). Previously, Mr. Goebel served as Secretary of Fidelity SelectCo, LLC (investment adviser firm, 2013-2015), Fidelity Investments Money Management, Inc. (FIMM) (investment adviser firm, 2010-2015), and Fidelity Research and Analysis Company (FRAC) (investment adviser firm, 2010-2015); General Counsel, Secretary, and Senior Vice President of Fidelity Management & Research Company (investment adviser firm, 2008-2015) and FMR Co., Inc. (investment adviser firm, 2008-2015); Assistant Secretary of Fidelity Management & Research (Japan) Limited (investment adviser firm, 2008-2015) and FMR Investment Management (U.K.) Limited (investment adviser firm, 2008-2015); Chief Legal Officer (CLO) of Fidelity Management & Research (Hong Kong) Limited (investment adviser firm, 2008-2015); Secretary and CLO of certain Fidelity funds (2008-2015); Assistant Secretary of FIMM (2008-2010), FRAC (2008-2010), and certain funds (2007-2008); and as Vice President and Secretary of Fidelity Distributors Corporation (FDC) (2005-2007). |
Brian B. Hogan (1964) |
Year of Election or Appointment: 2009 Vice President |
| Mr. Hogan also serves as Trustee or Vice President of other funds. Mr. Hogan serves as a Director of Fidelity SelectCo, LLC (investment adviser firm, 2014-present) and President of the Equity Division of FMR (investment adviser firm, 2009-present). Previously, Mr. Hogan served as Senior Vice President, Equity Research of FMR (2006-2009) and as a portfolio manager. |
Chris Maher (1972) |
Year of Election or Appointment: 2013 Assistant Treasurer |
| Mr. Maher serves as Assistant Treasurer of other funds. Mr. Maher is Vice President of Valuation Oversight and is an employee of Fidelity Investments. Previously, Mr. Maher served as Vice President of Asset Management Compliance (2013), Vice President of the Program Management Group of FMR (investment adviser firm, 2010-2013), and Vice President of Valuation Oversight (2008-2010). |
Kenneth B. Robins (1969) |
Year of Election or Appointment: 2008 President and Treasurer |
| Mr. Robins also serves as an officer of other funds. Mr. Robins serves as Executive Vice President of Fidelity Investments Money Management, Inc. (FIMM) (investment adviser firm, 2013-present) and is an employee of Fidelity Investments (2004-present). Previously, Mr. Robins served in other fund officer roles. |
Stacie M. Smith (1974) |
Year of Election or Appointment: 2013 Deputy Treasurer |
| Ms. Smith also serves as an officer of other funds. She is an employee of Fidelity Investments (2009-present) and has served in other fund officer roles. Prior to joining Fidelity Investments, Ms. Smith served as Senior Audit Manager of Ernst & Young LLP (1996-2009). |
Renee Stagnone (1975) |
Year of Election or Appointment: 2013 Deputy Treasurer |
| Ms. Stagnone also serves as Deputy Treasurer of other funds. Ms. Stagnone is an employee of Fidelity Investments (1997-present). |
Linda J. Wondrack (1964) |
Year of Election or Appointment: 2014 Chief Compliance Officer |
| Ms. Wondrack also serves as Chief Compliance Officer of other funds. Ms. Wondrack is Executive Vice President and head of the Ethics Office and Asset Management Compliance for Fidelity Investments (2012-present). Ms. Wondrack also serves as Chief Compliance Officer of Fidelity SelectCo, LLC (investment adviser firm, 2014-present); Chief Compliance Officer of Impresa Management LLC (2013-present); and Chief Compliance Officer of FMR Co., Inc. (investment adviser firm), Fidelity Investments Money Management, Inc. (investment adviser firm), Fidelity Management & Research (Japan) Limited (investment adviser firm), FMR Investment Management (U.K.) Limited (investment adviser firm), Fidelity Management & Research (Hong Kong) (investment adviser firm), Fidelity Management & Research Company (investment adviser firm), FIAM LLC (investment adviser firm), and Strategic Advisers, Inc. (investment adviser firm), Ballyrock Investment Advisors LLC, and Northern Neck Investors LLC (2012-present). Previously, Ms. Wondrack served as Senior Vice President and Chief Compliance Officer for Columbia Management Investment Advisers, LLC (2005-2012); Chief Compliance Officer for certain funds within the Columbia Family of Funds (2007-2012); and Senior Vice President of Compliance Risk Management at Bank of America (2005-2010). |
Joseph F. Zambello (1957) |
Year of Election or Appointment: 2011 Deputy Treasurer |
| Mr. Zambello also serves as Deputy Treasurer of other funds. Mr. Zambello is an employee of Fidelity Investments (1991-present). Previously, Mr. Zambello served as Vice President of the Program Management Group of FMR (investment adviser firm, 2009-2011) and Vice President of the Transfer Agent Oversight Group (2005-2009). |
Annual Report
Class A designates 70%, Class T designates 83%, and Class C designate 100% of the dividends distributed during the fiscal year as amounts which may be taken into account as a dividend for purposes of the maximum rate under section 1(h)(11) of the Internal Revenue Code.
The amounts per share which represent income derived from sources within, and taxes paid to, foreign countries or possessions of the United States are as follows:
| Pay Date | Income | Taxes |
Class A | 12/08/14 | $0.1951 | $0.0251 |
Class T | 12/08/14 | $0.1651 | $0.0251 |
Class C | 12/08/14 | $0.1231 | $0.0251 |
The fund will notify shareholders in January 2016 of amounts for use in preparing 2015 income tax returns.
Annual Report
Fidelity Total Emerging Markets Fund
Each year, the Board of Trustees, including the Independent Trustees (together, the Board), votes on the renewal of the management contract with Fidelity Management & Research Company (FMR) and the sub-advisory agreements (together, the Advisory Contracts) for the fund. The Board, assisted by the advice of fund counsel and Independent Trustees' counsel, requests and considers a broad range of information relevant to the renewal of the Advisory Contracts throughout the year.
The Board meets regularly and, at each of its meetings, covers an extensive agenda of topics and materials and considers factors that are relevant to its annual consideration of the renewal of the fund's Advisory Contracts, including the services and support provided to the fund and its shareholders. The Board has established various standing committees (Committees), each composed of and chaired by Independent Trustees with varying backgrounds, to which the Board has assigned specific subject matter responsibilities in order to enhance effective decision-making by the Board. The Board, acting directly and through its Committees, requests and receives information concerning the annual consideration of the renewal of the fund's Advisory Contracts. The Board also meets as needed to consider matters specifically related to the Board's annual consideration of the renewal of the Advisory Contracts. Members of the Board may also meet with trustees of other Fidelity funds through ad hoc joint committees to discuss certain matters relevant to all of the Fidelity funds.
At its July 2015 meeting, the Board unanimously determined to renew the fund's Advisory Contracts. In reaching its determination, the Board considered all factors it believed relevant, including (i) the nature, extent, and quality of the services to be provided to the fund and its shareholders (including the investment performance of the fund); (ii) the competitiveness of the fund's management fee and total expense ratio relative to peer funds; (iii) the total costs of the services to be provided by and the profits to be realized by Fidelity from its relationship with the fund; and (iv) the extent to which (if any) economies of scale exist and would be realized as each fund grows, and whether any economies of scale are appropriately shared with fund shareholders.
In considering whether to renew the Advisory Contracts for the fund, the Board reached a determination, with the assistance of fund counsel and Independent Trustees' counsel and through the exercise of its business judgment, that the renewal of the Advisory Contracts was in the best interests of the fund and its shareholders and that the compensation payable under the Advisory Contracts was fair and reasonable. The Board's decision to renew the Advisory Contracts was not based on any single factor, but rather was based on a comprehensive consideration of all the information provided to the Board at its meetings throughout the year. The Board, in reaching its determination to renew the Advisory Contracts, was aware that shareholders of the fund have a broad range of investment choices available to them, including a wide choice among funds offered by Fidelity's competitors, and that the fund's shareholders, who have the opportunity to review and weigh the disclosure provided by the fund in its prospectus and other public disclosures, have chosen to invest in this fund, which is part of the Fidelity family of funds.
Annual Report
Board Approval of Investment Advisory Contracts and
Management Fees - continued
Nature, Extent, and Quality of Services Provided. The Board considered Fidelity's staffing as it relates to the fund, including the backgrounds of investment personnel of Fidelity, and also considered the fund's investment objective, strategies, and related investment philosophy. The Independent Trustees also had discussions with senior management of Fidelity's investment operations and investment groups. The Board considered the structure of the portfolio manager compensation program and whether this structure provides appropriate incentives to act in the best interests of the fund. Additionally, the Board considered the portfolio managers' investments, if any, in the funds that they manage.
Resources Dedicated to Investment Management and Support Services. The Board and the Fund Oversight and Research Committees reviewed the general qualifications and capabilities of Fidelity's investment staff, including its size, education, experience, and resources, as well as Fidelity's approach to recruiting, training, managing, and compensating investment personnel. The Board noted that Fidelity has continued to increase the resources devoted to non-U.S. offices, including expansion of Fidelity's global investment organization. The Board also noted that Fidelity's analysts have extensive resources, tools and capabilities that allow them to conduct sophisticated quantitative and fundamental analysis, as well as credit analysis of issuers, counterparties and guarantors. Further, the Board considered that Fidelity's investment professionals have sufficient access to global information and data so as to provide competitive investment results over time, and that those professionals also have access to sophisticated tools that permit them to assess portfolio construction and risk and performance attribution characteristics continuously, as well as to transmit new information and research conclusions rapidly around the world. Additionally, in its deliberations, the Board considered Fidelity's trading, risk management, and compliance capabilities and resources, which are integral parts of the investment management process.
Shareholder and Administrative Services. The Board considered (i) the nature, extent, quality, and cost of advisory, administrative, and shareholder services performed by FMR, the sub-advisers (together with FMR, the Investment Advisers), and their affiliates under the Advisory Contracts and under separate agreements covering transfer agency, pricing and bookkeeping, and securities lending services for the fund; (ii) the nature and extent of the supervision of third party service providers, principally custodians and subcustodians; and (iii) the resources devoted to, and the record of compliance with, the fund's compliance policies and procedures. The Board also reviewed the allocation of fund brokerage, including allocations to brokers affiliated with the Investment Advisers, the use of brokerage commissions to pay fund expenses, and the use of "soft" commission dollars to pay for research services.
Annual Report
The Board noted that the growth of fund assets over time across the complex allows Fidelity to reinvest in the development of services designed to enhance the value or convenience of the Fidelity funds as investment vehicles. These services include 24-hour access to account information and market information through telephone representatives and over the Internet, investor education materials and asset allocation tools, and the expanded availability of Fidelity Investor Centers.
In 2014, the Board formed an ad hoc Committee on Transfer Agency Fees to review the variety of transfer agency fee structures throughout the industry and Fidelity's competitive positioning with respect to industry participants.
Investment in a Large Fund Family. The Board considered the benefits to shareholders of investing in a Fidelity fund, including the benefits of investing in a fund that is part of a large family of funds offering a variety of investment disciplines and providing a large variety of mutual fund investor services. The Board noted that Fidelity had taken, or had made recommendations that resulted in the Fidelity funds taking, a number of actions over the previous year that benefited particular funds, including (i) continuing to dedicate additional resources to investment research and to the support of the senior management team that oversees asset management; (ii) continuing efforts to enhance Fidelity's global research capabilities; (iii) launching new funds and making other enhancements to meet client needs; (iv) reducing management fees and total expenses for certain index funds and diversified international funds; (v) continuing to launch dedicated lower cost underlying funds to meet portfolio construction needs related to expanding underlying fund options for Fidelity funds of funds, specifically for the Freedom Fund product lines; (vi) rationalizing product lines and gaining increased efficiencies through fund mergers; (vii) launching active fixed-income exchange-traded funds; (viii) continuing to develop, acquire and implement systems and technology to improve services to the funds and information security and to increase efficiency; (ix) implementing investment enhancements to further strengthen Fidelity's target date product line to increase investors' probability of success in achieving their goals; (x) modifying the eligibility criteria for certain share classes to accommodate roll-over assets from employer-sponsored retirement plans; (xi) launching a new Class W of the Freedom Index Funds to attract and retain Fidelity record-kept retirement plan assets; and (xii) implementing changes to Fidelity's money market product line in response to recent money market regulatory reforms.
Investment Performance. The Board considered whether the fund has operated in accordance with its investment objective, as well as its record of compliance with its investment restrictions and its performance history. The Board noted that there was a portfolio management change for the fund in September 2014.
Annual Report
Board Approval of Investment Advisory Contracts and
Management Fees - continued
The Board took into account discussions with representatives of the Investment Advisers about fund investment performance that occur at Board meetings throughout the year. In this regard the Board noted that as part of regularly scheduled fund reviews and other reports to the Board on fund performance, the Board considers annualized return information for the fund, for different time periods, measured against a securities market index ("benchmark index") and a peer group of funds with similar objectives ("peer group"), if any. In its evaluation of fund investment performance, the Board gave particular attention to information indicating changes in performance of certain Fidelity funds for specific time periods and discussed with the Investment Advisers the reasons for any overperformance or underperformance.
In addition to reviewing absolute and relative fund performance, the Independent Trustees periodically consider the appropriateness of fund performance metrics in evaluating the results achieved. In general, the Independent Trustees believe that fund performance should be evaluated based on net performance (after fees and expenses) of both the highest performing and lowest performing fund share classes, where applicable, compared to appropriate benchmark indices, over appropriate time periods that may include full market cycles, and compared to peer groups, as applicable, over the same periods, taking into account relevant factors including the following: general market conditions; issuer-specific information; and fund cash flows and other factors.
The Independent Trustees recognize that shareholders evaluate performance on a net basis over their own holding periods, for which one-, three-, and five-year periods are often used as a proxy. For this reason, the performance information reviewed by the Board also included net cumulative calendar year total return information for the fund and an appropriate benchmark index for the most recent one- and three-year periods, as shown below. A peer group is not shown below because the fund does not generally utilize a peer group for performance comparison purposes.
Annual Report
Fidelity Total Emerging Markets Fund

Based on its review, the Board concluded that the nature, extent, and quality of services provided to the fund under the Advisory Contracts should benefit the shareholders of the fund.
Competitiveness of Management Fee and Total Expense Ratio. The Board considered the fund's management fee and total expense ratio compared to "mapped groups" of competitive funds and classes created for the purpose of facilitating the Trustees' competitive analysis of management fees and total expenses. Fidelity creates "mapped groups" by combining similar Lipper investment objective categories that have comparable investment mandates. Combining Lipper investment objective categories aids the Board's management fee and total expense ratio comparisons by broadening the competitive group used for comparison.
Management Fee. The Board considered two proprietary management fee comparisons for the 12-month (or shorter) periods shown in basis points (BP) in the chart below. The group of Lipper funds used by the Board for management fee comparisons is referred to below as the "Total Mapped Group." The Total Mapped Group comparison focuses on a fund's standing in terms of gross management fees before expense reimbursements or caps relative to the total universe of funds with comparable investment mandates, regardless of whether their management fee structures also are comparable. Funds with comparable investment mandates offer exposure to similar types of securities. Funds with comparable management fee structures have similar management fee contractual arrangements (e.g., flat rate charged for advisory services, all-inclusive fee rate, etc.). "TMG %" represents the percentage of funds in the Total Mapped Group that had management fees that were lower than the fund's. For example, a hypothetical TMG % of 20% would mean that 80% of the funds in the Total Mapped Group had higher, and 20% had lower, management fees than the fund. The fund's actual TMG %s and the number of funds in the Total Mapped Group are in the chart below. The "Asset-Size Peer Group" (ASPG) comparison focuses on a fund's standing relative to a subset of non-Fidelity funds within the Total Mapped Group that are similar in size and management fee structure without taking into account performance adjustments, if any. For example, if a fund is in the first quartile of the ASPG, the fund's management fee ranks in the least expensive or lowest 25% of funds in the ASPG. The ASPG represents at least 15% of the funds in the Total Mapped Group with comparable asset size and management fee structures, subject to a minimum of 50 funds (or all funds in the Total Mapped Group if fewer than 50). Additional information, such as the ASPG quartile in which the fund's management fee rate ranked, is also included in the chart and considered by the Board.
Annual Report
Board Approval of Investment Advisory Contracts and
Management Fees - continued
Fidelity Total Emerging Markets Fund

The Board noted that the fund's management fee rate ranked below the median of its Total Mapped Group and below the median of its ASPG for 2014.
The Board noted that, in 2014, the ad hoc Committee on Group Fee was formed by it and other Fidelity fund boards to conduct an in-depth review of the "group fee" component of the management fee of funds with such management fee structures. Committee focus included the mechanics of the group fee, the competitive landscape of group fee structures, Fidelity funds with no group fee component and investment products not included in group fee assets. The Board also considered that, for funds subject to the group fee,
Annual Report
FMR agreed to voluntarily waive fees over a specified period of time in amounts designed to account for assets converted from certain funds to certain collective investment trusts.
The Board also noted that, in 2013, the ad hoc Committee on Management Fees was formed to conduct an in-depth review of the management fee rates of Fidelity's active equity mutual funds. The Committee focused on the following areas: (i) standard fee structures; (ii) research consumption and trading evolution; (iii) management fee competitiveness/profitability by category; and (iv) factors that drive institutional pricing.
Based on its review, the Board concluded that the fund's management fee is fair and reasonable in light of the services that the fund receives and the other factors considered.
Total Expense Ratio. In its review of each class's total expense ratio the Board considered the fund's management fee as well as other fund or class expenses, as applicable, such as transfer agent fees, pricing and bookkeeping fees, fund-paid 12b-1 fees, and custodial, legal, and audit fees. The Board also noted that Fidelity may agree to waive fees and expenses from time to time, and the extent to which, if any, it has done so for the fund. As part of its review, the Board also considered the current and historical total expense ratios of each class of the fund compared to competitive fund median expenses. Each class of the fund is compared to those funds and classes in the Total Mapped Group (used by the Board for management fee comparisons) that have a similar sales load structure.
The Board noted that the total expense ratio of each of Class A and the retail class ranked below its competitive median for 2014 and the total expense ratio of each of Class T, Class C, and Class I ranked above its competitive median for 2014. The Board considered that, in general, various factors can affect total expense ratios. The Board noted that the total expense ratio of Class T was above the competitive median primarily because of higher 12b-1 fees on Class T as compared to most competitor funds. Class T has a higher 12b-1 fee, but a lower front-end sales charge, than traditionally priced front-end sales charge classes. The Board considered that Class T is primarily sold load-waived in the retirement plan market where its 0.50% 12b-1 fee is comparable to competing no-load, higher 12b-1 fee classes designed specifically for retirement plans. The Board noted that the fund offers multiple classes, each of which has a different sales load and 12b-1 fee structure, and that the multiple structures are intended to offer a range of pricing options for the intermediary market. The Board also noted that the total expense ratios of the classes vary primarily by the level of their 12b-1 fees, although differences in transfer agent fees may also cause expenses to vary from class to class.
The Board further considered that FMR contractually agreed to reimburse Class A, Class T, Class C, Class I, and the retail class of the fund to the extent that total operating expenses (excluding interest, certain taxes, certain securities lending costs, brokerage commissions, extraordinary expenses, and acquired fund fees and expenses, if any), as a percentage of their respective average net assets, exceed 1.65%, 1.90%, 2.40%, 1.40%, and 1.40% through December 31, 2015.
Annual Report
Board Approval of Investment Advisory Contracts and
Management Fees - continued
Fees Charged to Other Fidelity Clients. The Board also considered Fidelity fee structures and other information with respect to clients of Fidelity, such as other funds advised or subadvised by Fidelity, pension plan clients, and other institutional clients with similar mandates. The Board noted the findings of the 2013 ad hoc joint committee (created with the board of other Fidelity funds), which reviewed and compared Fidelity's institutional investment advisory business with its business of providing services to the Fidelity funds, including the differences in services provided, fees charged, and costs incurred, as well as competition in their respective marketplaces.
Based on its review of total expense ratios and fees charged to other Fidelity clients, the Board concluded that, although in some cases above the median of the universe presented for comparison, the total expense ratio of each class of the fund was reasonable in light of the services that the fund and its shareholders receive and the other factors considered.
Costs of the Services and Profitability. The Board considered the revenues earned and the expenses incurred by Fidelity in conducting the business of developing, marketing, distributing, managing, administering and servicing the fund and servicing the fund's shareholders. The Board also considered the level of Fidelity's profits in respect of all the Fidelity funds.
On an annual basis, Fidelity presents to the Board information about the profitability of its relationship with the fund. Fidelity calculates profitability information for each fund, as well as aggregate profitability information for groups of Fidelity funds and all Fidelity funds, using a series of detailed revenue and cost allocation methodologies which originate with the books and records of Fidelity on which Fidelity's audited financial statements are based. The Audit Committee of the Board reviews any significant changes from the prior year's methodologies.
PricewaterhouseCoopers LLP (PwC), independent registered public accounting firm and auditor to Fidelity and certain Fidelity funds, has been engaged annually by the Board as part of the Board's assessment of Fidelity's profitability analysis. PwC's engagement includes the review and assessment of the methodologies used by Fidelity in determining the revenues and expenses attributable to Fidelity's mutual fund business, and completion of agreed-upon procedures in respect of the mathematical accuracy of fund profitability and its conformity to established allocation methodologies. After considering PwC's reports issued under the engagement and information provided by Fidelity, the Board concluded that while other allocation methods may also be reasonable, Fidelity's profitability methodologies are reasonable in all material respects.
Annual Report
The Board also reviewed Fidelity's non-fund businesses and fall-out benefits related to the mutual fund business as well as cases where Fidelity's affiliates may benefit from or be related to the fund's business.
The Board considered the costs of the services provided by and the profits realized by Fidelity in connection with the operation of the fund and was satisfied that the profitability was not excessive.
Economies of Scale. The Board considered whether there have been economies of scale in respect of the management of the Fidelity funds, whether the Fidelity funds (including the fund) have appropriately benefited from any such economies of scale, and whether there is potential for realization of any further economies of scale. The Board considered the extent to which the fund will benefit from economies of scale as assets grow through increased services to the fund, through waivers or reimbursements, or through fee or expense ratio reductions. The Board also noted that in 2013, it and the boards of other Fidelity funds created an ad hoc committee (the Economies of Scale Committee) to analyze whether Fidelity attains economies of scale in respect of the management and servicing of the Fidelity funds, whether the Fidelity funds have appropriately benefited from such economies of scale, and whether there is potential for realization of any further economies of scale.
The Board recognized that the fund's management contract incorporates a "group fee" structure, which provides for lower group fee rates as total group assets increase, and for higher group fee rates as total group assets decrease (with "group assets" defined to include fund assets under FMR's management plus sector fund assets previously under FMR's management and currently managed by Fidelity SelectCo, LLC). FMR calculates the group fee rates based on a tiered asset "breakpoint" schedule that varies based on asset class. The Board considered that the group fee is designed to deliver the benefits of economies of scale to fund shareholders when total Fidelity fund assets increase, even if assets of any particular fund are unchanged or have declined, because some portion of Fidelity's costs are attributable to services provided to all Fidelity funds, and all funds benefit if those costs can be allocated among more assets. The Board concluded that, given the group fee structure, fund shareholders will benefit from lower management fees as group assets increase at the fund complex level, regardless of whether Fidelity achieves any such economies of scale.
The Board concluded, taking into account the analysis of the Economies of Scale Committee, that economies of scale, if any, are being appropriately shared between fund shareholders and Fidelity.
Additional Information Requested by the Board. In order to develop fully the factual basis for consideration of the Fidelity funds' Advisory Contracts, the Board requested and received additional information on certain topics, including: (i) fund performance trends and Fidelity's long-term strategies for certain funds; (ii) the various share classes employed by Fidelity and the attributes of each class, together with similar information on the distribution and servicing payments made by Fidelity or the funds to third-party participants in the distribution channels; (iii) fund profitability, and fund performance in relation to fund profitability; (iv) the methodology with respect to evaluating competitive fund data and peer group classifications and fee comparisons; (v) annual fund profitability margins, with particular focus on certain funds with negative margins; (vi) the realization of fall-out benefits in certain Fidelity business units; (vii) economies of scale and the way in which they are shared with fund shareholders; (viii) Fidelity's group fee structures, including the group fee schedule of breakpoints; (ix) the impact of cost containment measures on the funds; and (x) the transfer agent fee structure.
Annual Report
Board Approval of Investment Advisory Contracts and
Management Fees - continued
Based on its evaluation of all of the conclusions noted above, and after considering all factors it believed relevant, the Board concluded that the advisory fee structures are fair and reasonable, and that the fund's Advisory Contracts should be renewed.
Annual Report
Investment Adviser
Fidelity Management & Research Company
Boston, MA
Investment Sub-Advisers
FMR Co., Inc.
FMR Investment Management
(U.K.) Limited
Fidelity Management & Research
(Hong Kong) Limited
Fidelity Management & Research
(Japan) Limited
FIL Investment Advisors
FIL Investment Advisors (UK) Limited
FIL Investments (Japan) Limited
General Distributor
Fidelity Distributors Corporation
Smithfield, RI
Transfer and Service Agents
Fidelity Investments Institutional Operations Company, Inc.
Boston, MA
Fidelity Service Company, Inc.
Boston, MA
Custodian
The Northern Trust Company
Chicago, IL
(Fidelity Investment logo)(registered trademark)
ATEK-UANN-1215
1.931267.103
ContentsPerformance: The Bottom LineManagement's Discussion of Fund PerformanceShareholder Expense ExampleInvestment Changes (Unaudited)Investments October 31, 2015Financial StatementsNotes to Financial StatementsReport of Independent Registered Public Accounting FirmTrustees and OfficersBoard Approval of Investment Advisory Contracts and Management Fees
(Fidelity Investment logo)(registered trademark)
Fidelity Advisor®
Emerging Markets Discovery
Fund - Class I
(formerly Institutional Class)
Annual Report
October 31, 2015
(Fidelity Cover Art)
Class I is
a class of Fidelity®
Emerging Markets
Discovery Fund
Contents
Performance | (Click Here) | How the fund has done over time. |
Management's Discussion of Fund Performance | (Click Here) | The Portfolio Manager's review of fund performance and strategy. |
Shareholder Expense Example | (Click Here) | An example of shareholder expenses. |
Investment Changes | (Click Here) | A summary of major shifts in the fund's investments over the past six months. |
Investments | (Click Here) | A complete list of the fund's investments with their market values. |
Financial Statements | (Click Here) | Statements of assets and liabilities, operations, and changes in net assets,
as well as financial highlights. |
Notes | (Click Here) | Notes to the financial statements. |
Report of Independent Registered Public Accounting Firm | (Click Here) | |
Trustees and Officers | (Click Here) | |
Board Approval of Investment Advisory Contracts and Management Fees | (Click Here) | |
To view a fund's proxy voting guidelines and proxy voting record for the 12-month period ended June 30, visit http://www.fidelity.com/proxyvotingresults or visit the Securities and Exchange Commission's (SEC) web site at http://www.sec.gov. You may also call 1-877-208-0098 to request a free copy of the proxy voting guidelines.
Standard & Poor's, S&P and S&P 500 are registered service marks of The McGraw-Hill Companies, Inc. and have been licensed for use by Fidelity Distributors Corporation.
Other third-party marks appearing herein are the property of their respective owners.
All other marks appearing herein are registered or unregistered trademarks or service marks of FMR LLC or an affiliated company. © 2015 FMR LLC. All rights reserved.
Annual Report
This report and the financial statements contained herein are submitted for the general information of the shareholders of the fund. This report is not authorized for distribution to prospective investors in the fund unless preceded or accompanied by an effective prospectus.
A fund files its complete schedule of portfolio holdings with the SEC for the first and third quarters of each fiscal year on Form N-Q. Forms N-Q are available on the SEC's web site at http://www.sec.gov. A fund's Forms N-Q may be reviewed and copied at the SEC's Public Reference Room in Washington, DC. Information regarding the operation of the SEC's Public Reference Room may be obtained by calling 1-800-SEC-0330. For a complete list of a fund's portfolio holdings, view the most recent holdings listing, semiannual report, or annual report on Fidelity's web site at http://www.fidelity.com, http://www.advisor.fidelity.com, or http://www.401k.com, as applicable.
NOT FDIC INSURED • MAY LOSE VALUE • NO BANK GUARANTEE
Neither the fund nor Fidelity Distributors Corporation is a bank.
Annual Report
Average annual total return reflects the change in the value of an investment, assuming reinvestment of the class' distributions from dividend income and capital gains (the profits earned upon the sale of securities that have grown in value, if any) and assuming a constant rate of performance each year. The $10,000 table and the fund's returns do not reflect the deduction of taxes that a shareholder would pay on fund distributions or the redemption of fund shares. During periods of reimbursement by Fidelity, a fund's total return will be greater than it would be had the reimbursement not occurred. How a fund did yesterday is no guarantee of how it will do tomorrow.
Average Annual Total Returns
Periods ended October 31, 2015 | Past 1
year | Life of
fund A |
Class I | -10.04% | 3.80% |
A From November 1, 2011.
$10,000 Over Life of Fund
Let's say hypothetically that $10,000 was invested in Fidelity Advisor® Emerging Markets Discovery Fund - Class I on November 1, 2011, when the fund started. The chart shows how the value of your investment would have changed, and also shows how the MSCI Emerging Markets SMID Cap Index performed over the same period.
Annual Report
Fidelity Emerging Markets Discovery Fund
Market Recap: International equities suffered a moderate setback for the 12 months ending October 31, 2015, held back by a collapse in commodities prices that hurt resources-related sectors and geographies. The MSCI ACWI (All Country World Index) ex USA Index returned -4.55% for the period, affected also by concerns about global economic growth. Commodity producers remained under pressure for much of the past year, largely related to economic deceleration in China (-1%), the world's second-largest economy and a leading consumer of raw materials. This effect was exacerbated by U.S. dollar strength relative to global currencies, which weighed on commodities priced in dollars and acutely impacted equity returns within regions most exposed to resources prices. The emerging-markets group, for example, returned about -15% this period. Canada, a significant energy producer, returned roughly -17%. Net energy consumer Japan (+9%) was the best-performing region by far. Only about a quarter of the nearly 50 index countries managed a gain this period: Ireland (+19%) - the EU's fastest-growing economy - and Israel (+17%) proved top performers; Greece (-56%) and Brazil (-46%), among the worst. As for sectors, energy (-25%) and materials (-16%) declined sharply, whereas the two consumer sectors each gained about 6%.
Comments from Co-Portfolio Managers Tim Gannon and Greg Lee: For the year, the fund's share classes (excluding sales charges, if applicable) turned in low double-digit declines but mostly outperformed the -10.55% return of the benchmark MSCI Emerging Markets SMID Cap Index. Security selection drove the funds performance versus the benchmark, as stock picking in a majority of the fund's 10 sector sleeves was positive. From a geographic perspective, investments in Malaysia, Indonesia and Turkey were helpful, but those in South Korea, Brazil and Nigeria hurt versus the benchmark. Among sectors, picks in consumer staples, materials, health care and telecommunication services lifted performance most. The fund's top relative contributor this period was its overweighting in Sansung Life & Science, a former cardboard manufacturer in South Korea that became an extremely successful cosmetics company. The stock re-rated upward, lifting the fund's relative results, as the company continued to take market share in its core face-mask category. We sold Sansung from the fund by period end. Picks in financials were most detrimental to relative performance this period, including stakes in Egypt-based diversified financials firm Citadel Capital and Banco Estado Rio Grande, from Brazil.
The views expressed above reflect those of the portfolio manager(s) only through the end of the period as stated on the cover of this report and do not necessarily represent the views of Fidelity or any other person in the Fidelity organization. Any such views are subject to change at any time based upon market or other conditions and Fidelity disclaims any responsibility to update such views. These views may not be relied on as investment advice and, because investment decisions for a Fidelity fund are based on numerous factors, may not be relied on as an indication of trading intent on behalf of any Fidelity fund.
Annual Report
Fidelity Emerging Markets Discovery Fund
Shareholder Expense Example
As a shareholder of the Fund, you incur two types of costs: (1) transaction costs, including sales charges (loads) on purchase payments or redemption proceeds, redemption fees and (2) ongoing costs, including management fees, distribution and/or service (12b-1) fees and other Fund expenses. This Example is intended to help you understand your ongoing costs (in dollars) of investing in the Fund and to compare these costs with the ongoing costs of investing in other mutual funds.
The Example is based on an investment of $1,000 invested at the beginning of the period and held for the entire period (May 1, 2015 to October 31, 2015).
Actual Expenses
The first line of the accompanying table for each class of the Fund provides information about actual account values and actual expenses. You may use the information in this line, together with the amount you invested, to estimate the expenses that you paid over the period. Simply divide your account value by $1,000.00 (for example, an $8,600 account value divided by $1,000.00 = 8.6), then multiply the result by the number in the first line for a class of the Fund under the heading entitled "Expenses Paid During Period" to estimate the expenses you paid on your account during this period. A small balance maintenance fee of $12.00 that is charged once a year may apply for certain accounts with a value of less than $2,000. This fee is not included in the table below. If it was, the estimate of expenses you paid during the period would be higher, and your ending account value lower, by this amount. In addition, the Fund, as a shareholder in the underlying Fidelity Central Funds, will indirectly bear its pro-rata share of the fees and expenses incurred by the underlying Fidelity Central Funds. These fees and expenses are not included in the Fund's annualized expense ratio used to calculate the expense estimate in the table below.
Hypothetical Example for Comparison Purposes
The second line of the accompanying table for each class of the Fund provides information about hypothetical account values and hypothetical expenses based on a Class' actual expense ratio and an assumed rate of return of 5% per year before expenses, which is not the Class' actual return. The hypothetical account values and expenses may not be used to estimate the actual ending account balance or expenses you paid for the period. You may use this information to compare the ongoing costs of investing in the Fund and other funds. To do so, compare this 5% hypothetical example with the 5% hypothetical examples that appear in the shareholder reports of the other funds. A small balance maintenance fee of $12.00 that is charged once a year may apply for certain accounts with a value of less than $2,000. This fee is not included in the table below. If it was, the estimate of expenses you paid during the period would be higher, and your ending account value lower, by this amount. In addition, the Fund, as a shareholder in the underlying Fidelity Central Funds, will indirectly bear its pro-rata share of the fees and expenses incurred by the underlying Fidelity Central Funds. These fees and expenses are not included in the Fund's annualized expense ratio used to calculate the expense estimate in the table below.
Please note that the expenses shown in the table are meant to highlight your ongoing costs only and do not reflect any transaction costs. Therefore, the second line of the table is useful in comparing ongoing costs only, and will not help you determine the relative total costs of owning different funds. In addition, if these transactional costs were included, your costs would have been higher.
Annual Report
Shareholder Expense Example - continued
| Annualized
Expense RatioB | Beginning
Account Value
May 1, 2015 | Ending
Account Value
October 31, 2015 | Expenses Paid
During PeriodC
May 1, 2015 to
October 31, 2015 |
Class A | 1.70% | | | |
Actual | | $ 1,000.00 | $ 865.30 | $ 7.99 |
HypotheticalA | | $ 1,000.00 | $ 1,016.64 | $ 8.64 |
Class T | 1.95% | | | |
Actual | | $ 1,000.00 | $ 864.00 | $ 9.16 |
HypotheticalA | | $ 1,000.00 | $ 1,015.38 | $ 9.91 |
Class C | 2.45% | | | |
Actual | | $ 1,000.00 | $ 862.10 | $ 11.50 |
HypotheticalA | | $ 1,000.00 | $ 1,012.85 | $ 12.43 |
Emerging Markets Discovery | 1.45% | | | |
Actual | | $ 1,000.00 | $ 865.90 | $ 6.82 |
HypotheticalA | | $ 1,000.00 | $ 1,017.90 | $ 7.38 |
Class I | 1.45% | | | |
Actual | | $ 1,000.00 | $ 866.40 | $ 6.82 |
HypotheticalA | | $ 1,000.00 | $ 1,017.90 | $ 7.38 |
A 5% return per year before expenses
B Annualized expense ratio reflects expenses net of applicable fee waivers.
C Expenses are equal to each Class' annualized expense ratio, multiplied by the average account value over the period, multiplied by 184/365 (to reflect the one-half year period).
Annual Report
Fidelity Emerging Markets Discovery Fund
Investment Changes (Unaudited)
Top Five Stocks as of October 31, 2015 |
| % of fund's
net assets | % of fund's net assets
6 months ago |
Techtronic Industries Co. Ltd. (Hong Kong, Household Durables) | 2.4 | 2.1 |
Quinenco SA (Chile, Industrial Conglomerates) | 1.9 | 1.7 |
Fila Korea Ltd. (Korea (South), Textiles, Apparel & Luxury Goods) | 1.6 | 1.5 |
Macquarie Mexican (REIT) (Mexico, Real Estate Investment Trusts) | 1.5 | 1.4 |
Advantech Co. Ltd. (Taiwan, Technology Hardware, Storage & Peripherals) | 1.4 | 0.7 |
| 8.8 | |
Top Five Market Sectors as of October 31, 2015 |
| % of fund's
net assets | % of fund's net assets
6 months ago |
Financials | 18.1 | 17.2 |
Industrials | 17.0 | 17.2 |
Information Technology | 15.4 | 15.9 |
Consumer Discretionary | 14.6 | 15.3 |
Materials | 10.2 | 10.1 |
Top Five Countries as of October 31, 2015 |
(excluding cash equivalents) | % of fund's
net assets | % of fund's net assets
6 months ago |
Korea (South) | 13.3 | 13.7 |
India | 13.0 | 12.7 |
Cayman Islands | 11.4 | 12.0 |
Taiwan | 9.6 | 8.2 |
China | 6.3 | 5.5 |
Percentages are adjusted for the effect of open futures contracts, if applicable. |
Annual Report
Fidelity Emerging Markets Discovery Fund
Investments October 31, 2015
Showing Percentage of Net Assets
Common Stocks - 96.3% |
| Shares | | Value |
Bangladesh - 0.4% |
BRAC Bank Ltd. | 449,466 | | $ 268,010 |
Bermuda - 2.5% |
Aquarius Platinum Ltd. (Australia) (a) | 2,009,820 | | 348,562 |
China Resource Gas Group Ltd. | 58,000 | | 159,097 |
Digital China Holdings Ltd. (H Shares) | 160,000 | | 163,238 |
PAX Global Technology Ltd. | 386,000 | | 504,757 |
Shangri-La Asia Ltd. | 660,000 | | 604,010 |
TOTAL BERMUDA | | 1,779,664 |
Brazil - 3.8% |
Companhia de Saneamento de Minas Gerais | 50,290 | | 169,522 |
Cosan SA Industria e Comercio | 64,720 | | 414,679 |
Direcional Engenharia SA | 219,000 | | 201,024 |
Fibria Celulose SA | 48,200 | | 657,906 |
FPC Par Corretora de Seguros | 96,200 | | 269,152 |
Minerva SA (a) | 129,800 | | 429,464 |
QGEP Participacoes SA (a) | 152,100 | | 235,059 |
Smiles SA | 44,100 | | 344,196 |
TOTAL BRAZIL | | 2,721,002 |
British Virgin Islands - 0.3% |
Dolphin Capital Investors Ltd. (a) | 918,400 | | 245,996 |
Canada - 1.4% |
Pan American Silver Corp. | 54,500 | | 412,565 |
Torex Gold Resources, Inc. (a) | 612,300 | | 580,645 |
TOTAL CANADA | | 993,210 |
Cayman Islands - 11.4% |
58.com, Inc. ADR (a)(d) | 15,100 | | 792,599 |
Casetek Holdings | 51,000 | | 224,642 |
China Cord Blood Corp. (a) | 97,900 | | 623,623 |
Cosmo Lady (China) Holdings Co. Ltd. | 755,000 | | 749,853 |
E-House China Holdings Ltd. ADR | 47,500 | | 294,500 |
ENN Energy Holdings Ltd. | 26,000 | | 148,945 |
Eurasia Drilling Co. Ltd. GDR (Reg. S) | 20,000 | | 227,000 |
GCL-Poly Energy Holdings Ltd. (a) | 1,093,000 | | 225,758 |
Haitian International Holdings Ltd. | 295,000 | | 516,161 |
Ju Teng International Holdings Ltd. | 436,000 | | 238,442 |
Kingboard Laminates Holdings Ltd. | 608,500 | | 253,439 |
Kingsoft Corp. Ltd. | 81,000 | | 183,293 |
Lee's Pharmaceutical Holdings Ltd. | 374,000 | | 482,885 |
Pico Far East Holdings Ltd. | 2,320,000 | | 615,850 |
Common Stocks - continued |
| Shares | | Value |
Cayman Islands - continued |
Semiconductor Manufacturing International Corp. (a) | 2,182,000 | | $ 202,140 |
Sino Biopharmaceutical Ltd. | 436,000 | | 541,817 |
SITC International Holdings Co. Ltd. | 1,224,000 | | 628,266 |
Sunny Optical Technology Group Co. Ltd. | 114,000 | | 265,064 |
TPK Holding Co. Ltd. | 32,000 | | 79,840 |
Uni-President China Holdings Ltd. (d) | 1,005,000 | | 823,121 |
TOTAL CAYMAN ISLANDS | | 8,117,238 |
Chile - 5.4% |
Compania Cervecerias Unidas SA sponsored ADR | 21,500 | | 515,355 |
CorpBanca SA | 33,441,053 | | 306,823 |
Empresas CMPC SA | 241,277 | | 594,514 |
Inversiones La Construccion SA | 41,103 | | 467,167 |
Quinenco SA | 673,804 | | 1,334,844 |
Vina Concha y Toro SA | 371,890 | | 633,485 |
TOTAL CHILE | | 3,852,188 |
China - 6.3% |
BBMG Corp. (H Shares) | 847,000 | | 593,558 |
China Longyuan Power Grid Corp. Ltd. (H Shares) | 149,000 | | 136,223 |
China Machinery Engineering Co. (H Shares) | 522,000 | | 453,046 |
China Suntien Green Energy Corp. Ltd. (H Shares) (d) | 1,262,200 | | 225,041 |
Huangshan Tourism Development Co. Ltd. | 346,700 | | 593,413 |
Qingdao Haier Co. Ltd. | 520,686 | | 792,670 |
Tong Ren Tang Technologies Co. Ltd. (H Shares) | 381,000 | | 595,104 |
Zhengzhou Yutong Bus Co. Ltd. | 149,219 | | 513,955 |
Zhuzhou CSR Times Electric Co. Ltd. (H Shares) | 96,500 | | 624,687 |
TOTAL CHINA | | 4,527,697 |
Colombia - 0.3% |
Organizacion Terpel SA | 48,928 | | 180,714 |
Cyprus - 1.0% |
Global Ports Investment PLC GDR (Reg. S) | 159,800 | | 703,120 |
Egypt - 0.3% |
Citadel Capital Corp. (a) | 1,084,800 | | 248,570 |
Greece - 1.1% |
Public Power Corp. of Greece | 43,080 | | 248,234 |
Titan Cement Co. SA (Reg.) | 23,400 | | 513,350 |
TOTAL GREECE | | 761,584 |
Hong Kong - 4.4% |
BYD Electronic International Co. Ltd. (a) | 146,000 | | 95,415 |
Common Stocks - continued |
| Shares | | Value |
Hong Kong - continued |
China Resources Beer Holdings Co. Ltd. | 288,000 | | $ 543,793 |
Far East Horizon Ltd. | 899,000 | | 747,766 |
Techtronic Industries Co. Ltd. | 471,500 | | 1,723,647 |
TOTAL HONG KONG | | 3,110,621 |
India - 13.0% |
Adani Ports & Special Economic Zone (a) | 114,759 | | 518,147 |
Arvind Mills Ltd. (a) | 117,146 | | 495,403 |
Bank of Baroda (a) | 84,785 | | 206,426 |
Cadila Healthcare Ltd. (a) | 83,485 | | 531,725 |
Edelweiss Financial Services Ltd. | 827,000 | | 750,570 |
Exide Industries Ltd. (a) | 318,791 | | 727,266 |
Grasim Industries Ltd. | 13,786 | | 782,499 |
Iifl Holdings Ltd. (a) | 227,222 | | 665,608 |
Indraprastha Gas Ltd. (a) | 52,765 | | 393,709 |
JK Cement Ltd. | 42,409 | | 443,340 |
LIC Housing Finance Ltd. (a) | 50,882 | | 371,515 |
Mahindra Lifespace Developers Ltd. (a) | 67,363 | | 512,341 |
Mphasis BFL Ltd. | 51,793 | | 375,539 |
Petronet LNG Ltd. | 113,023 | | 334,966 |
Power Grid Corp. of India Ltd. | 196,095 | | 385,479 |
Redington India Ltd. (a) | 102,277 | | 185,879 |
Solar Industries India Ltd. (a) | 6,809 | | 349,950 |
The Jammu & Kashmir Bank Ltd. | 237,424 | | 301,325 |
Torrent Pharmaceuticals Ltd. | 25,387 | | 596,652 |
VST Industries Ltd. (a) | 13,967 | | 341,812 |
TOTAL INDIA | | 9,270,151 |
Indonesia - 1.0% |
Link Net Tbk PT (a) | 770,900 | | 241,570 |
PT Panin Life Tbk (a) | 31,241,600 | | 498,676 |
TOTAL INDONESIA | | 740,246 |
Israel - 0.5% |
Bezeq The Israel Telecommunication Corp. Ltd. | 162,160 | | 348,658 |
Korea (South) - 12.2% |
AMOREPACIFIC Group, Inc. | 3,016 | | 425,284 |
BGFretail Co. Ltd. | 1,501 | | 223,486 |
Binggrea Co. Ltd. | 3,814 | | 228,151 |
Com2uS Corp. | 2,384 | | 240,118 |
Crown Confectionery Co., Ltd. | 506 | | 259,699 |
Daewoo International Corp. | 20,479 | | 357,827 |
Common Stocks - continued |
| Shares | | Value |
Korea (South) - continued |
Devsisters Co. Ltd. (a) | 7,152 | | $ 193,870 |
DGB Financial Group Co. Ltd. | 73,214 | | 679,706 |
E-Mart Co. Ltd. | 2,833 | | 527,263 |
Fila Korea Ltd. | 12,688 | | 1,111,257 |
Hyundai Glovis Co. Ltd. | 4,198 | | 722,481 |
Hyundai Industrial Development & Construction Co. | 20,928 | | 844,071 |
Hyundai Wia Corp. | 5,867 | | 685,991 |
Koh Young Technology, Inc. | 6,128 | | 178,456 |
Korean Reinsurance Co. | 32,080 | | 382,115 |
Medy-Tox, Inc. | 1,659 | | 707,469 |
NCSOFT Corp. | 2,058 | | 341,567 |
Silicon Works Co. Ltd. | 7,719 | | 229,859 |
Sungshin Cement Manufacturing Co. Ltd. (a) | 40,501 | | 404,382 |
TOTAL KOREA (SOUTH) | | 8,743,052 |
Luxembourg - 0.0% |
Atento SA (a) | 3,500 | | 36,050 |
Malaysia - 1.4% |
Inari Amertron Bhd | 223,600 | | 185,345 |
Top Glove Corp. Bhd | 354,600 | | 783,209 |
TOTAL MALAYSIA | | 968,554 |
Mexico - 6.3% |
Grupo Aeroportuario del Pacifico SA de CV Series B | 88,400 | | 796,188 |
Grupo Aeroportuario Norte S.A.B. de CV | 106,300 | | 546,759 |
Grupo Comercial Chedraui S.A.B. de CV | 175,300 | | 485,005 |
Grupo GICSA SA de CV (a) | 222,000 | | 216,385 |
Industrias Penoles SA de CV | 44,180 | | 587,362 |
Macquarie Mexican (REIT) (d) | 775,572 | | 1,076,649 |
Megacable Holdings S.A.B. de CV unit | 116,200 | | 442,843 |
Promotora y Operadora de Infraestructura S.A.B. de CV (a) | 7,718 | | 96,773 |
Qualitas Controladora S.A.B. de CV (a) | 210,300 | | 262,019 |
TOTAL MEXICO | | 4,509,983 |
Nigeria - 0.3% |
Transnational Corp. of Nigeria PLC | 23,459,127 | | 213,318 |
Pakistan - 0.4% |
Habib Bank Ltd. | 152,000 | | 302,084 |
Panama - 0.7% |
Copa Holdings SA Class A | 10,200 | | 515,304 |
Common Stocks - continued |
| Shares | | Value |
Philippines - 1.5% |
Alliance Global Group, Inc. | 1,515,900 | | $ 588,967 |
Metro Pacific Investments Corp. | 4,315,000 | | 480,076 |
TOTAL PHILIPPINES | | 1,069,043 |
Poland - 1.2% |
Asseco Poland SA | 21,300 | | 314,896 |
Prime Car Management SA | 48,600 | | 521,799 |
TOTAL POLAND | | 836,695 |
Romania - 1.0% |
Banca Transilvania SA (a) | 492,829 | | 309,840 |
BRD-Groupe Societe Generale (a) | 135,947 | | 394,474 |
TOTAL ROMANIA | | 704,314 |
Russia - 0.7% |
E.ON Russia JSC (a) | 5,471,000 | | 260,277 |
Sistema JSFC sponsored GDR | 31,660 | | 220,037 |
TOTAL RUSSIA | | 480,314 |
Singapore - 0.3% |
First Resources Ltd. | 168,700 | | 225,985 |
South Africa - 1.7% |
Alexander Forbes Group Holding | 861,282 | | 542,697 |
Reunert Ltd. | 137,600 | | 670,948 |
TOTAL SOUTH AFRICA | | 1,213,645 |
Sri Lanka - 0.6% |
Hatton National Bank PLC | 273,700 | | 422,852 |
Taiwan - 9.6% |
ADLINK Technology, Inc. | 95,749 | | 258,359 |
Advantech Co. Ltd. | 138,000 | | 992,546 |
Chipbond Technology Corp. | 124,000 | | 177,225 |
Cleanaway Co. Ltd. | 114,000 | | 561,836 |
Cub Elecparts, Inc. | 52,892 | | 666,343 |
Elite Semiconductor Memory Technology, Inc. | 143,000 | | 128,839 |
eMemory Technology, Inc. | 22,000 | | 227,014 |
Everlight Electronics Co. Ltd. | 160,000 | | 243,709 |
FLEXium Interconnect, Inc. | 84,442 | | 237,213 |
Forhouse Corp. | 485,000 | | 191,968 |
Hermes Microvision, Inc. | 4,000 | | 154,628 |
Inventec Corp. | 440,000 | | 253,442 |
Lite-On Technology Corp. | 333,640 | | 347,360 |
Common Stocks - continued |
| Shares | | Value |
Taiwan - continued |
Powertech Technology, Inc. | 184,000 | | $ 408,070 |
Radiant Opto-Electronics Corp. | 88,000 | | 273,772 |
Sirtec International Co. Ltd. | 176,000 | | 217,391 |
St.Shine Optical Co. Ltd. | 27,000 | | 409,179 |
Synnex Technology International Corp. | 277,000 | | 293,083 |
Tong Hsing Electronics Industries Ltd. | 108,000 | | 274,449 |
Universal Cement Corp. | 368,840 | | 260,739 |
Vanguard International Semiconductor Corp. | 200,000 | | 258,432 |
TOTAL TAIWAN | | 6,835,597 |
Thailand - 1.1% |
Delta Electronics PCL (For. Reg.) | 116,300 | | 276,351 |
Thai Union Frozen Products PCL (For. Reg.) | 963,800 | | 478,836 |
TOTAL THAILAND | | 755,187 |
Turkey - 2.0% |
Aksa Akrilik Kimya Sanayii | 118,000 | | 433,080 |
Aselsan A/S | 137,000 | | 655,536 |
Tupras Turkiye Petrol Rafinelleri A/S (a) | 12,576 | | 332,151 |
TOTAL TURKEY | | 1,420,767 |
United Arab Emirates - 0.5% |
National Bank of Ras Al-Khaimah PSC (a) | 178,179 | | 325,020 |
United Kingdom - 1.0% |
Bank of Georgia Holdings PLC | 23,100 | | 712,219 |
United States of America - 0.3% |
First Cash Financial Services, Inc. (a) | 6,000 | | 228,900 |
Vietnam - 0.4% |
FTP Corp. | 142,600 | | 314,754 |
TOTAL COMMON STOCKS (Cost $75,444,283) |
68,702,306
|
Nonconvertible Preferred Stocks - 1.4% |
| | | |
Brazil - 0.3% |
Banco do Estado Rio Grande do Sul SA | 142,200 | | 220,865 |
Korea (South) - 1.1% |
LG Chemical Ltd. | 4,102 | | 774,220 |
TOTAL NONCONVERTIBLE PREFERRED STOCKS (Cost $1,119,425) |
995,085
|
Government Obligations - 0.0% |
| Principal Amount | | Value |
United States of America - 0.0% |
U.S. Treasury Bills, yield at date of purchase 0.01% 12/3/15
(Cost $20,000) | | $ 20,000 | | $ 20,000 |
Money Market Funds - 5.7% |
| Shares | | |
Fidelity Cash Central Fund, 0.18% (b) | 1,625,275 | | 1,625,275 |
Fidelity Securities Lending Cash Central Fund, 0.19% (b)(c) | 2,456,800 | | 2,456,800 |
TOTAL MONEY MARKET FUNDS (Cost $4,082,075) |
4,082,075
|
TOTAL INVESTMENT PORTFOLIO - 103.4% (Cost $80,665,783) | 73,799,466 |
NET OTHER ASSETS (LIABILITIES) - (3.4)% | (2,439,342) |
NET ASSETS - 100% | $ 71,360,124 |
Legend |
(a) Non-income producing |
(b) Affiliated fund that is generally available only to investment companies and other accounts managed by Fidelity Investments. The rate quoted is the annualized seven-day yield of the fund at period end. A complete unaudited listing of the fund's holdings as of its most recent quarter end is available upon request. In addition, each Fidelity Central Fund's financial statements, which are not covered by the Fund's Report of Independent Registered Public Accounting Firm, are available on the SEC's website or upon request. |
(c) Investment made with cash collateral received from securities on loan. |
(d) Security or a portion of the security is on loan at period end. |
Affiliated Central Funds |
Information regarding fiscal year to date income earned by the Fund from investments in Fidelity Central Funds is as follows: |
Fund | Income earned |
Fidelity Cash Central Fund | $ 5,002 |
Fidelity Securities Lending Cash Central Fund | 7,859 |
Total | $ 12,861 |
Other Information |
Categorizations in the Schedule of Investments are based on country or territory of incorporation. |
The following is a summary of the inputs used, as of October 31, 2015, involving the Fund's assets and liabilities carried at fair value. The inputs or methodology used for valuing securities may not be an indication of the risk associated with investing in those securities. For more information on valuation inputs, and their aggregation into the levels used in the tables below, please refer to the Investment Valuation section in the accompanying Notes to Financial Statements. |
Valuation Inputs at Reporting Date: |
Description | Total | Level 1 | Level 2 | Level 3 |
Investments in Securities: | | | | |
Equities: | | | | |
Consumer Discretionary | $ 10,367,560 | $ 4,065,448 | $ 5,509,442 | $ 792,670 |
Consumer Staples | 6,140,739 | 3,727,192 | 2,413,547 | - |
Energy | 1,768,896 | 1,208,889 | 560,007 | - |
Financials | 12,923,664 | 8,389,361 | 4,534,303 | - |
Health Care | 5,271,663 | 1,740,271 | 3,531,392 | - |
Industrials | 12,206,765 | 8,363,536 | 3,843,229 | - |
Information Technology | 11,002,761 | 7,848,101 | 3,154,660 | - |
Materials | 7,303,592 | 4,785,683 | 2,517,909 | - |
Telecommunication Services | 810,265 | 568,695 | 241,570 | - |
Utilities | 1,901,486 | 678,033 | 1,223,453 | - |
Government Obligations | 20,000 | - | 20,000 | - |
Money Market Funds | 4,082,075 | 4,082,075 | - | - |
Total Investments in Securities: | $ 73,799,466 | $ 45,457,284 | $ 27,549,512 | $ 792,670 |
The following is a summary of transfers between Level 1 and Level 2 for the period ended October 31, 2015. Transfers are assumed to have occurred at the beginning of the period, and are primarily attributable to the valuation techniques used for foreign equity securities, as discussed in the accompanying Notes to Financial Statements: |
Transfers | Total |
Level 1 to Level 2 | $ 0 |
Level 2 to Level 1 | $ 2,193,999 |
Valuation Inputs at Reporting Date: |
The following is a reconciliation of Investments in Securities for which Level 3 inputs were used in determining value: |
Investments in Securities: | |
Equities - Consumer Discretionary | |
Beginning Balance | $ - |
Net Realized Gain (Loss) on Investment Securities | 123,445 |
Net Unrealized Gain (Loss) on Investment Securities | 1,856 |
Cost of Purchases | 977,596 |
Proceeds of Sales | (310,227) |
Amortization/Accretion | - |
Transfers into Level 3 | - |
Transfers out of Level 3 | - |
Ending Balance | $ 792,670 |
The change in unrealized gain (loss) for the period attributable to Level 3 securities held at October 31, 2015 | $ 1,856 |
The information used in the above reconciliation represents fiscal year to date activity for any Investments in Securities identified as using Level 3 inputs at either the beginning or the end of the current fiscal period. Transfers in or out of Level 3 represent the beginning value of any Security or Instrument where a change in the pricing level occurred from the beginning to the end of the period. The cost of purchases and the proceeds of sales may include securities received or delivered through corporate actions or exchanges. Realized and unrealized gains (losses) disclosed in the reconciliation are included in Net Gain (Loss) on the Fund's Statement of Operations. |
See accompanying notes which are an integral part of the financial statements.
Annual Report
Fidelity Emerging Markets Discovery Fund
Statement of Assets and Liabilities
| | October 31, 2015 |
| | |
Assets | | |
Investment in securities, at value (including securities loaned of $2,338,259) - See accompanying schedule: Unaffiliated issuers (cost $76,583,708) | $ 69,717,391 | |
Fidelity Central Funds (cost $4,082,075) | 4,082,075 | |
Total Investments (cost $80,665,783) | | $ 73,799,466 |
Cash | | 103,696 |
Foreign currency held at value (cost $7,645) | | 7,480 |
Receivable for investments sold | | 301,197 |
Receivable for fund shares sold | | 78,842 |
Dividends receivable | | 12,866 |
Distributions receivable from Fidelity Central Funds | | 868 |
Prepaid expenses | | 218 |
Receivable from investment adviser for expense reductions | | 33,319 |
Other receivables | | 9,766 |
Total assets | | 74,347,718 |
| | |
Liabilities | | |
Payable for investments purchased | $ 295,566 | |
Payable for fund shares redeemed | 73,113 | |
Accrued management fee | 50,866 | |
Distribution and service plan fees payable | 3,218 | |
Other affiliated payables | 16,907 | |
Other payables and accrued expenses | 91,124 | |
Collateral on securities loaned, at value | 2,456,800 | |
Total liabilities | | 2,987,594 |
| | |
Net Assets | | $ 71,360,124 |
Net Assets consist of: | | |
Paid in capital | | $ 80,045,129 |
Undistributed net investment income | | 413,597 |
Accumulated undistributed net realized gain (loss) on investments and foreign currency transactions | | (2,212,898) |
Net unrealized appreciation (depreciation) on investments and assets and liabilities in foreign currencies | | (6,885,704) |
Net Assets | | $ 71,360,124 |
See accompanying notes which are an integral part of the financial statements.
Annual Report
Statement of Assets and Liabilities - continued
| | October 31, 2015 |
Calculation of Maximum Offering Price | | |
Class A: | | |
Net Asset Value and redemption price per share ($4,660,013 ÷ 426,752 shares) | | $ 10.92 |
| | |
Maximum offering price per share (100/94.25 of $10.92) | | $ 11.59 |
Class T: | | |
Net Asset Value and redemption price per share ($2,015,001 ÷ 185,561 shares) | | $ 10.86 |
| | |
Maximum offering price per share (100/96.50 of $10.86) | | $ 11.25 |
Class C: | | |
Net Asset Value and offering price per share ($1,674,587 ÷ 156,693 shares)A | | $ 10.69 |
| | |
Emerging Markets Discovery: | | |
Net Asset Value, offering price and redemption price per share ($61,600,864 ÷ 5,608,316 shares) | | $ 10.98 |
| | |
Class I: | | |
Net Asset Value, offering price and redemption price per share ($1,409,659 ÷ 127,965 shares) | | $ 11.02 |
A Redemption price per share is equal to net asset value less any applicable contingent deferred sales charge.
See accompanying notes which are an integral part of the financial statements.
Annual Report
Fidelity Emerging Markets Discovery Fund
Financial Statements - continued
Statement of Operations
| Year ended October 31, 2015 |
| | |
Investment Income | | |
Dividends | | $ 1,741,878 |
Special dividends | | 415,817 |
Interest | | 4 |
Income from Fidelity Central Funds | | 12,861 |
Income before foreign taxes withheld | | 2,170,560 |
Less foreign taxes withheld | | (263,796) |
Total income | | 1,906,764 |
| | |
Expenses | | |
Management fee | $ 661,948 | |
Transfer agent fees | 178,413 | |
Distribution and service plan fees | 38,098 | |
Accounting and security lending fees | 40,604 | |
Custodian fees and expenses | 176,611 | |
Independent trustees' compensation | 337 | |
Registration fees | 70,131 | |
Audit | 90,650 | |
Legal | 210 | |
Miscellaneous | 897 | |
Total expenses before reductions | 1,257,899 | |
Expense reductions | (100,295) | 1,157,604 |
Net investment income (loss) | | 749,160 |
Realized and Unrealized Gain (Loss) | | |
Net realized gain (loss) on: | | |
Investment securities: | | |
Unaffiliated issuers (net of foreign taxes of $311,960) | (1,427,654) | |
Foreign currency transactions | (123,177) | |
Futures contracts | (381,269) | |
Total net realized gain (loss) | | (1,932,100) |
Change in net unrealized appreciation (depreciation) on: Investment securities (net of decrease in deferred foreign taxes of $258,529) | (8,018,876) | |
Assets and liabilities in foreign currencies | 16,343 | |
Total change in net unrealized appreciation (depreciation) | | (8,002,533) |
Net gain (loss) | | (9,934,633) |
Net increase (decrease) in net assets resulting from operations | | $ (9,185,473) |
See accompanying notes which are an integral part of the financial statements.
Annual Report
Statement of Changes in Net Assets
| Year ended
October 31,
2015 | Year ended
October 31,
2014 |
Increase (Decrease) in Net Assets | | |
Operations | | |
Net investment income (loss) | $ 749,160 | $ 451,642 |
Net realized gain (loss) | (1,932,100) | (250,198) |
Change in net unrealized appreciation (depreciation) | (8,002,533) | (701,823) |
Net increase (decrease) in net assets resulting from operations | (9,185,473) | (500,379) |
Distributions to shareholders from net investment income | - | (676,480) |
Distributions to shareholders from net realized gain | - | (2,520,609) |
Total distributions | - | (3,197,089) |
Share transactions - net increase (decrease) | (6,487,831) | (16,216,808) |
Redemption fees | 32,392 | 46,780 |
Total increase (decrease) in net assets | (15,640,912) | (19,867,496) |
| | |
Net Assets | | |
Beginning of period | 87,001,036 | 106,868,532 |
End of period (including undistributed net investment income of $413,597 and undistributed net investment income of $174, respectively) | $ 71,360,124 | $ 87,001,036 |
See accompanying notes which are an integral part of the financial statements.
Annual Report
Financial Highlights - Fidelity Emerging Markets Discovery Fund Class A
Years ended October 31, | 2015 | 2014 | 2013 | 2012 F |
Selected Per-Share Data | | | | |
Net asset value, beginning of period | $ 12.17 | $ 12.49 | $ 11.89 | $ 10.00 |
Income from Investment Operations | | | | |
Net investment income (loss) C | .09 J | .04 | .08 | .12 |
Net realized and unrealized gain (loss) | (1.34) | (.01) | .75 | 1.76 |
Total from investment operations | (1.25) | .03 | .83 | 1.88 |
Distributions from net investment income | - | (.06) | (.04) | (.01) |
Distributions from net realized gain | - | (.30) | (.20) | - |
Total distributions | - | (.36) | (.25)I | (.01) |
Redemption fees added to paid in capitalC | -H | .01 | .02 | .02 |
Net asset value, end of period | $ 10.92 | $ 12.17 | $ 12.49 | $ 11.89 |
Total ReturnA, B | (10.27)% | .31% | 7.20% | 19.00% |
Ratios to Average Net AssetsD, G | | | | |
Expenses before reductions | 1.88% | 1.82% | 1.87% | 3.49% |
Expenses net of fee waivers, if any | 1.70% | 1.70% | 1.70% | 1.70% |
Expenses net of all reductions | 1.69% | 1.70% | 1.64% | 1.64% |
Net investment income (loss) | .76% J | .29% | .62% | 1.16% |
Supplemental Data | | | | |
Net assets, end of period (000 omitted) | $ 4,660 | $ 4,362 | $ 5,065 | $ 1,671 |
Portfolio turnover rateE | 103% | 148% | 179% | 83% |
A Total returns would have been lower if certain expenses had not been reduced during the applicable periods shown.
B Total returns do not include the effect of the sales charges.
C Calculated based on average shares outstanding during the period.
D Fees and expenses of any underlying Fidelity Central Funds are not included in the Fund's expense ratio. The Fund indirectly bears its proportionate share of the expenses of any underlying Fidelity Central Funds.
E Amount does not include the portfolio activity of any underlying Fidelity Central Funds.
F For the period November 1, 2011 (commencement of operations) to October 31, 2012.
G Expense ratios reflect operating expenses of the class. Expenses before reductions do not reflect amounts reimbursed by the investment adviser or reductions from brokerage service arrangements or reductions from other expense offset arrangements and do not represent the amount paid by the class during periods when reimbursements or reductions occur. Expense ratios before reductions for start-up periods may not be representative of longer-term operating periods. Expenses net of fee waivers reflect expenses after reimbursement by the investment adviser but prior to reductions from brokerage service arrangements or other expense offset arrangements. Expenses net of all reductions represent the net expenses paid by the class.
H Amount represents less than $.005 per share.
I Total distributions of $.25 per share is comprised of distributions from net investment income of $.044 and distributions from net realized gain of $.203 per share.
J Investment income per share reflects a large, non-recurring dividend which amounted to $.06 per share. Excluding this non-recurring dividend, the ratio of net investment income (loss) to average net assets would have been .22%.
See accompanying notes which are an integral part of the financial statements.
Annual Report
Financial Highlights - Fidelity Emerging Markets Discovery Fund Class T
Years ended October 31, | 2015 | 2014 | 2013 | 2012 F |
Selected Per-Share Data | | | | |
Net asset value, beginning of period | $ 12.13 | $ 12.44 | $ 11.87 | $ 10.00 |
Income from Investment Operations | | | | |
Net investment income (loss) C | .06 J | -H | .05 | .10 |
Net realized and unrealized gain (loss) | (1.33) | -H | .74 | 1.75 |
Total from investment operations | (1.27) | -H | .79 | 1.85 |
Distributions from net investment income | - | (.02) | (.03) | -H |
Distributions from net realized gain | - | (.30) | (.20) | - |
Total distributions | - | (.32) | (.24)I | -H |
Redemption fees added to paid in capitalC | -H | .01 | .02 | .02 |
Net asset value, end of period | $ 10.86 | $ 12.13 | $ 12.44 | $ 11.87 |
Total ReturnA, B | (10.47)% | .05% | 6.87% | 18.75% |
Ratios to Average Net AssetsD, G | | | | |
Expenses before reductions | 2.16% | 2.10% | 2.19% | 3.77% |
Expenses net of fee waivers, if any | 1.95% | 1.95% | 1.95% | 1.95% |
Expenses net of all reductions | 1.94% | 1.95% | 1.89% | 1.89% |
Net investment income (loss) | .51% J | .04% | .37% | .91% |
Supplemental Data | | | | |
Net assets, end of period (000 omitted) | $ 2,015 | $ 2,031 | $ 1,914 | $ 1,700 |
Portfolio turnover rateE | 103% | 148% | 179% | 83% |
A Total returns would have been lower if certain expenses had not been reduced during the applicable periods shown.
B Total returns do not include the effect of the sales charges.
C Calculated based on average shares outstanding during the period.
D Fees and expenses of any underlying Fidelity Central Funds are not included in the Fund's expense ratio. The Fund indirectly bears its proportionate share of the expenses of any underlying Fidelity Central Funds.
E Amount does not include the portfolio activity of any underlying Fidelity Central Funds.
F For the period November 1, 2011 (commencement of operations) to October 31, 2012.
G Expense ratios reflect operating expenses of the class. Expenses before reductions do not reflect amounts reimbursed by the investment adviser or reductions from brokerage service arrangements or reductions from other expense offset arrangements and do not represent the amount paid by the class during periods when reimbursements or reductions occur. Expense ratios before reductions for start-up periods may not be representative of longer-term operating periods. Expenses net of fee waivers reflect expenses after reimbursement by the investment adviser but prior to reductions from brokerage service arrangements or other expense offset arrangements. Expenses net of all reductions represent the net expenses paid by the class.
H Amount represents less than $.005 per share.
I Total distributions of $.24 per share is comprised of distributions from net investment income of $.034 and distributions from net realized gain of $.203 per share.
J Investment income per share reflects a large, non-recurring dividend which amounted to $.06 per share. Excluding this non-recurring dividend, the ratio of net investment income (loss) to average net assets would have been (.03)%.
See accompanying notes which are an integral part of the financial statements.
Annual Report
Financial Highlights - Fidelity Emerging Markets Discovery Fund Class C
Years ended October 31, | 2015 | 2014 | 2013 | 2012 G |
Selected Per-Share Data | | | | |
Net asset value, beginning of period | $ 12.00 | $ 12.35 | $ 11.82 | $ 10.00 |
Income from Investment Operations | | | | |
Net investment income (loss) C | - F,I | (.06) | (.02) | .04 |
Net realized and unrealized gain (loss) | (1.31) | -I | .74 | 1.76 |
Total from investment operations | (1.31) | (.06) | .72 | 1.80 |
Distributions from net investment income | - | - | (.01) | - |
Distributions from net realized gain | - | (.30) | (.20) | - |
Total distributions | - | (.30) | (.21) | - |
Redemption fees added to paid in capitalC | - I | .01 | .02 | .02 |
Net asset value, end of period | $ 10.69 | $ 12.00 | $ 12.35 | $ 11.82 |
Total ReturnA, B | (10.92)% | (.42)% | 6.32% | 18.20% |
Ratios to Average Net AssetsD, H | | | | |
Expenses before reductions | 2.64% | 2.58% | 2.70% | 4.32% |
Expenses net of fee waivers, if any | 2.45% | 2.45% | 2.45% | 2.45% |
Expenses net of all reductions | 2.44% | 2.45% | 2.39% | 2.39% |
Net investment income (loss) | .01% F | (.46)% | (.13)% | .41% |
Supplemental Data | | | | |
Net assets, end of period (000 omitted) | $ 1,675 | $ 1,750 | $ 2,082 | $ 1,474 |
Portfolio turnover rateE | 103% | 148% | 179% | 83% |
A Total returns would have been lower if certain expenses had not been reduced during the applicable periods shown.
B Total returns do not include the effect of the contingent deferred sales charge.
C Calculated based on average shares outstanding during the period.
D Fees and expenses of any underlying Fidelity Central Funds are not included in the Fund's expense ratio. The Fund indirectly bears its proportionate share of the expenses of any underlying Fidelity Central Funds.
E Amount does not include the portfolio activity of any underlying Fidelity Central Funds.
F Investment income per share reflects a large, non-recurring dividend which amounted to $.06 per share. Excluding this non-recurring dividend, the ratio of net investment income (loss) to average net assets would have been (.52)%.
G For the period November 1, 2011 (commencement of operations) to October 31, 2012.
H Expense ratios reflect operating expenses of the class. Expenses before reductions do not reflect amounts reimbursed by the investment adviser or reductions from brokerage service arrangements or reductions from other expense offset arrangements and do not represent the amount paid by the class during periods when reimbursements or reductions occur. Expense ratios before reductions for start-up periods may not be representative of longer-term operating periods. Expenses net of fee waivers reflect expenses after reimbursement by the investment adviser but prior to reductions from brokerage service arrangements or other expense offset arrangements. Expenses net of all reductions represent the net expenses paid by the class.
I Amount represents less than $.005 per share.
See accompanying notes which are an integral part of the financial statements.
Annual Report
Financial Highlights - Fidelity Emerging Markets Discovery Fund
Years ended October 31, | 2015 | 2014 | 2013 | 2012 F |
Selected Per-Share Data | | | | |
Net asset value, beginning of period | $ 12.21 | $ 12.52 | $ 11.92 | $ 10.00 |
Income from Investment Operations | | | | |
Net investment income (loss)B | .12 E | .07 | .11 | .15 |
Net realized and unrealized gain (loss) | (1.35) | -H | .74 | 1.76 |
Total from investment operations | (1.23) | .07 | .85 | 1.91 |
Distributions from net investment income | - | (.09) | (.07) | (.01) |
Distributions from net realized gain | - | (.30) | (.20) | - |
Total distributions | - | (.39) | (.27) | (.01) |
Redemption fees added to paid in capitalB | -H | .01 | .02 | .02 |
Net asset value, end of period | $ 10.98 | $ 12.21 | $ 12.52 | $ 11.92 |
Total ReturnA | (10.07)% | .61% | 7.37% | 19.35% |
Ratios to Average Net AssetsC, G | | | | |
Expenses before reductions | 1.56% | 1.48% | 1.57% | 3.02% |
Expenses net of fee waivers, if any | 1.45% | 1.45% | 1.45% | 1.45% |
Expenses net of all reductions | 1.44% | 1.45% | 1.39% | 1.39% |
Net investment income (loss) | 1.01% E | .54% | .87% | 1.41% |
Supplemental Data | | | | |
Net assets, end of period (000 omitted) | $ 61,601 | $ 78,377 | $ 96,731 | $ 39,135 |
Portfolio turnover rateD | 103% | 148% | 179% | 83% |
A Total returns would have been lower if certain expenses had not been reduced during the applicable periods shown.
B Calculated based on average shares outstanding during the period.
C Fees and expenses of any underlying Fidelity Central Funds are not included in the Fund's expense ratio. The Fund indirectly bears its proportionate share of the expenses of any underlying Fidelity Central Funds.
D Amount does not include the portfolio activity of any underlying Fidelity Central Funds.
E Investment income per share reflects a large, non-recurring dividend which amounted to $.06 per share. Excluding this non-recurring dividend, the ratio of net investment income (loss) to average net assets would have been .48%.
F For the period November 1, 2011 (commencement of operations) to October 31, 2012.
G Expense ratios reflect operating expenses of the class. Expenses before reductions do not reflect amounts reimbursed by the investment adviser or reductions from brokerage service arrangements or reductions from other expense offset arrangements and do not represent the amount paid by the class during periods when reimbursements or reductions occur. Expense ratios before reductions for start-up periods may not be representative of longer-term operating periods. Expenses net of fee waivers reflect expenses after reimbursement by the investment adviser but prior to reductions from brokerage service arrangements or other expense offset arrangements. Expenses net of all reductions represent the net expenses paid by the class.
H Amount represents less than $.005 per share.
See accompanying notes which are an integral part of the financial statements.
Annual Report
Financial Highlights - Fidelity Emerging Markets Discovery Fund Class I
Years ended October 31, | 2015 | 2014 | 2013 | 2012 E |
Selected Per-Share Data | | | | |
Net asset value, beginning of period | $ 12.25 | $ 12.53 | $ 11.92 | $ 10.00 |
Income from Investment Operations | | | | |
Net investment income (loss) B | .12 H | .07 | .11 | .15 |
Net realized and unrealized gain (loss) | (1.35) | - G | .75 | 1.76 |
Total from investment operations | (1.23) | .07 | .86 | 1.91 |
Distributions from net investment income | - | (.06) | (.07) | (.01) |
Distributions from net realized gain | - | (.30) | (.20) | - |
Total distributions | - | (.36) | (.27) | (.01) |
Redemption fees added to paid in capitalB | - G | .01 | .02 | .02 |
Net asset value, end of period | $ 11.02 | $ 12.25 | $ 12.53 | $ 11.92 |
Total ReturnA | (10.04)% | .61% | 7.45% | 19.35% |
Ratios to Average Net AssetsC, F | | | | |
Expenses before reductions | 1.54% | 1.56% | 1.60% | 3.21% |
Expenses net of fee waivers, if any | 1.45% | 1.45% | 1.45% | 1.45% |
Expenses net of all reductions | 1.43% | 1.45% | 1.39% | 1.39% |
Net investment income (loss) | 1.01% H | .54% | .87% | 1.41% |
Supplemental Data | | | | |
Net assets, end of period (000 omitted) | $ 1,410 | $ 481 | $ 1,076 | $ 1,825 |
Portfolio turnover rateD | 103% | 148% | 179% | 83% |
A Total returns would have been lower if certain expenses had not been reduced during the applicable periods shown.
B Calculated based on average shares outstanding during the period.
C Fees and expenses of any underlying Fidelity Central Funds are not included in the Fund's expense ratio. The Fund indirectly bears its proportionate share of the expenses of any underlying Fidelity Central Funds.
D Amount does not include the portfolio activity of any underlying Fidelity Central Funds.
E For the period November 1, 2011 (commencement of operations) to October 31, 2012.
F Expense ratios reflect operating expenses of the class. Expenses before reductions do not reflect amounts reimbursed by the investment adviser or reductions from brokerage service arrangements or reductions from other expense offset arrangements and do not represent the amount paid by the class during periods when reimbursements or reductions occur. Expense ratios before reductions for start-up periods may not be representative of longer-term operating periods. Expenses net of fee waivers reflect expenses after reimbursement by the investment adviser but prior to reductions from brokerage service arrangements or other expense offset arrangements. Expenses net of all reductions represent the net expenses paid by the class.
G Amount represents less than $.005 per share.
H Investment income per share reflects a large, non-recurring dividend which amounted to $.06 per share. Excluding this non-recurring dividend, the ratio of net investment income (loss) to average net assets would have been .48%.
See accompanying notes which are an integral part of the financial statements.
Annual Report
For the period ended October 31, 2015
1. Organization.
Fidelity Emerging Markets Discovery Fund (the Fund) is a fund of Fidelity Investment Trust (the Trust) and is authorized to issue an unlimited number of shares. The Trust is registered under the Investment Company Act of 1940, as amended (the 1940 Act), as an open-end management investment company organized as a Massachusetts business trust. The Fund offers Class A, Class T, Class C, Emerging Markets Discovery and Class I (formerly Institutional Class) shares, each of which has equal rights as to assets and voting privileges. Each class has exclusive voting rights with respect to matters that affect that class. The Fund's investments in emerging markets can be subject to social, economic, regulatory, and political uncertainties and can be extremely volatile.
2. Investments in Fidelity Central Funds.
The Fund invests in Fidelity Central Funds, which are open-end investment companies generally available only to other investment companies and accounts managed by the investment adviser and its affiliates. The Fund's Schedule of Investments lists each of the Fidelity Central Funds held as of period end, if any, as an investment of the Fund, but does not include the underlying holdings of each Fidelity Central Fund. As an Investing Fund, the Fund indirectly bears its proportionate share of the expenses of the underlying Fidelity Central Funds.
The Money Market Central Funds seek preservation of capital and current income and are managed by Fidelity Investments Money Management, Inc. (FIMM), an affiliate of the investment adviser. Annualized expenses of the Money Market Central Funds as of their most recent shareholder report date are less than .005%.
A complete unaudited list of holdings for each Fidelity Central Fund is available upon request or at the Securities and Exchange Commission (the SEC) website at www.sec.gov. In addition, the financial statements of the Fidelity Central Funds, which are not covered by the Fund's Report of Independent Registered Public Accounting Firm, are available on the SEC website or upon request.
3. Significant Accounting Policies.
The financial statements have been prepared in conformity with accounting principles generally accepted in the United States of America (GAAP), which require management to make certain estimates and assumptions at the date of the financial statements. Actual results could differ from those estimates. Subsequent events, if any, through the date that the financial statements were issued have been evaluated in the preparation of
Annual Report
3. Significant Accounting Policies - continued
the financial statements. The following summarizes the significant accounting policies of the Fund:
Investment Valuation. Investments are valued as of 4:00 p.m. Eastern time on the last calendar day of the period. The Board of Trustees (the Board) has delegated the day to day responsibility for the valuation of the Fund's investments to the Fidelity Management & Research Company (FMR) Fair Value Committee (the Committee). In accordance with valuation policies and procedures approved by the Board, the Fund attempts to obtain prices from one or more third party pricing vendors or brokers to value its investments. When current market prices, quotations or currency exchange rates are not readily available or reliable, investments will be fair valued in good faith by the Committee, in accordance with procedures adopted by the Board. Factors used in determining fair value vary by investment type and may include market or investment specific events, changes in interest rates and credit quality. The frequency with which these procedures are used cannot be predicted and they may be utilized to a significant extent. The Committee oversees the Fund's valuation policies and procedures and reports to the Board on the Committee's activities and fair value determinations. The Board monitors the appropriateness of the procedures used in valuing the Fund's investments and ratifies the fair value determinations of the Committee.
The Fund categorizes the inputs to valuation techniques used to value its investments into a disclosure hierarchy consisting of three levels as shown below:
Level 1 - quoted prices in active markets for identical investments
Level 2 - other significant observable inputs (including quoted prices for similar investments, interest rates, prepayment speeds, etc.)
Level 3 - unobservable inputs (including the Fund's own assumptions based on the best information available)
Valuation techniques used to value the Fund's investments by major category are as follows:
Equity securities, including restricted securities, for which market quotations are readily available, are valued at the last reported sale price or official closing price as reported by a third party pricing vendor on the primary market or exchange on which they are traded and are categorized as Level 1 in the hierarchy. In the event there were no sales during the day or closing prices are not available, securities are valued at the last quoted bid price or may be valued using the last available price and are generally categorized as Level 2 in the hierarchy. For foreign equity securities, when market or security specific events arise, comparisons to the valuation of American Depositary Receipts (ADRs), futures contracts, Exchange-Traded Funds (ETFs) and certain indexes as well as quoted prices for similar securities may be used and would be categorized as Level 2 in the hierarchy. Utilizing these techniques may result in transfers between Level 1 and Level 2.
Annual Report
Notes to Financial Statements - continued
3. Significant Accounting Policies - continued
Investment Valuation - continued
For equity securities, including restricted securities, where observable inputs are limited, assumptions about market activity and risk are used and these securities may be categorized as Level 3 in the hierarchy.
Debt securities, including restricted securities, are valued based on evaluated prices received from third party pricing vendors or from brokers who make markets in such securities. U.S. government and government agency obligations are valued by pricing vendors who utilize matrix pricing which considers yield or price of bonds of comparable quality, coupon, maturity and type or by broker-supplied prices. When independent prices are unavailable or unreliable, debt securities may be valued utilizing pricing methodologies which consider similar factors that would be used by third party pricing vendors. Debt securities are generally categorized as Level 2 in the hierarchy but may be Level 3 depending on the circumstances.
Investments in open-end mutual funds, including the Fidelity Central Funds, are valued at their closing net asset value (NAV) each business day and are categorized as Level 1 in the hierarchy.
The following provides information on Level 3 securities held by the Fund that were valued at period end based on unobservable inputs. These amounts exclude valuations provided by a broker.
Asset Type | Fair Value at 10/31/15 | Valuation
Technique(s) | Unobservable
Input | Amount or Range/Weighted Average | Impact to
Valuation from an Increase
in InputA |
Equities | $ 792,670 | Adjusted transaction price | Proxy movement | 0.0% | Increase |
A Represents the expected directional change in the fair value of the Level 3 investments that would result from an increase in the corresponding input. A decrease to the unobservable input would have the opposite effect. Significant changes in these inputs could result in significantly higher or lower fair value measurements.
Changes in valuation techniques may result in transfers in or out of an assigned level within the disclosure hierarchy. The aggregate value of investments by input level as of October 31, 2015, including information on transfers between Levels 1 and 2, as well as a roll forward of Level 3 investments, is included at the end of the Fund's Schedule of Investments.
Annual Report
3. Significant Accounting Policies - continued
Foreign Currency. The Fund may use foreign currency contracts to facilitate transactions in foreign-denominated securities. Gains and losses from these transactions may arise from changes in the value of the foreign currency or if the counterparties do not perform under the contracts' terms.
Foreign-denominated assets, including investment securities, and liabilities are translated into U.S. dollars at the exchange rates at period end. Purchases and sales of investment securities, income and dividends received and expenses denominated in foreign currencies are translated into U.S. dollars at the exchange rate in effect on the transaction date.
The effects of exchange rate fluctuations on investments are included with the net realized and unrealized gain (loss) on investment securities. Other foreign currency transactions resulting in realized and unrealized gain (loss) are disclosed separately.
Investment Transactions and Income. For financial reporting purposes, the Fund's investment holdings and NAV include trades executed through the end of the last business day of the period. The NAV per share for processing shareholder transactions is calculated as of the close of business of the New York Stock Exchange (NYSE), normally 4:00 p.m. Eastern time and includes trades executed through the end of the prior business day. Gains and losses on securities sold are determined on the basis of identified cost. Dividend income is recorded on the ex-dividend date, except for certain dividends from foreign securities where the ex-dividend date may have passed, which are recorded as soon as the Fund is informed of the ex-dividend date. Non-cash dividends included in dividend income, if any, are recorded at the fair market value of the securities received. Income and capital gain distributions from Fidelity Central Funds, if any, are recorded on the ex-dividend date. Large, non-recurring dividends recognized by the Fund are presented separately on the Statement of Operations as "Special Dividends" and the impact of these dividends is presented in the Financial Highlights. Interest income is accrued as earned and includes coupon interest and amortization of premium and accretion of discount on debt securities as applicable. Investment income is recorded net of foreign taxes withheld where recovery of such taxes is uncertain.
Class Allocations and Expenses. Investment income, realized and unrealized capital gains and losses, common expenses of the Fund, and certain fund-level expense reductions, if any, are allocated daily on a pro-rata basis to each class based on the relative net assets of each class to the total net assets of the Fund. Each class differs with respect to transfer agent and distribution and service plan fees incurred. Certain expense reductions may also differ by class. For the reporting period, the allocated portion of income and expenses to each class as a percent of its average net assets may vary due to the timing of recording these transactions in relation to fluctuating net assets of the classes.
Annual Report
Notes to Financial Statements - continued
3. Significant Accounting Policies - continued
Class Allocations and Expenses - continued
Expenses directly attributable to a fund are charged to that fund. Expenses attributable to more than one fund are allocated among the respective funds on the basis of relative net assets or other appropriate methods. Expense estimates are accrued in the period to which they relate and adjustments are made when actual amounts are known.
Income Tax Information and Distributions to Shareholders. Each year, the Fund intends to qualify as a regulated investment company under Subchapter M of the Internal Revenue Code, including distributing substantially all of its taxable income and realized gains. As a result, no provision for U.S. Federal income taxes is required. As of October 31, 2015, the Fund did not have any unrecognized tax benefits in the financial statements; nor is the Fund aware of any tax positions for which it is reasonably possible that the total amounts of unrecognized tax benefits will significantly change in the next twelve months. The Fund files a U.S. federal tax return, in addition to state and local tax returns as required. The Fund's federal income tax returns are subject to examination by the Internal Revenue Service (IRS) for a period of three fiscal years after they are filed. State and local tax returns may be subject to examination for an additional fiscal year depending on the jurisdiction. Foreign taxes are provided for based on the Fund's understanding of the tax rules and rates that exist in the foreign markets in which it invests. The Fund is subject to a tax imposed on capital gains by certain countries in which it invests. An estimated deferred tax liability for net unrealized appreciation on the applicable securities is included in Other payables and accrued expenses on the Statement of Assets & Liabilities.
Distributions are declared and recorded on the ex-dividend date. Income dividends and capital gain distributions are declared separately for each class. Income and capital gain distributions are determined in accordance with income tax regulations, which may differ from GAAP.
Capital accounts within the financial statements are adjusted for permanent book-tax differences. These adjustments have no impact on net assets or the results of operations. Capital accounts are not adjusted for temporary book-tax differences which will reverse in a subsequent period.
Book-tax differences are primarily due to foreign currency transactions, futures transactions, certain foreign taxes, passive foreign investment companies (PFIC), capital loss carryforwards and losses deferred due to wash sales.
Annual Report
3. Significant Accounting Policies - continued
Income Tax Information and Distributions to Shareholders - continued
The federal tax cost of investment securities and unrealized appreciation (depreciation) as of period end were as follows:
Gross unrealized appreciation | $ 4,713,145 |
Gross unrealized depreciation | (12,060,381) |
Net unrealized appreciation (depreciation) on securities | $ (7,347,236) |
Tax Cost | $ 81,146,702 |
The tax-based components of distributable earnings as of period end were as follows:
Undistributed ordinary income | $ 413,626 |
Capital loss carryforward | $ (1,731,575) |
Net unrealized appreciation (depreciation) on securities and other investments | $ (7,349,233) |
Capital loss carryforwards are only available to offset future capital gains of the Fund to the extent provided by regulations and may be limited. Under the Regulated Investment Company Modernization Act of 2010 (the Act), the Fund is permitted to carry forward capital losses incurred in taxable years beginning after December 22, 2010 for an unlimited period and such capital losses are required to be used prior to any losses that expire. The capital loss carryforward information presented below, including any applicable limitation, is estimated as of fiscal period end and is subject to adjustment.
No expiration | |
Short-term | $ (1,731,575) |
The tax character of distributions paid was as follows:
| October 31, 2015 | October 31, 2014 |
Ordinary Income | $ - | $ 676,480 |
Long-term Capital Gains | - | 2,520,609 |
Total | $ - | $ 3,197,089 |
Short-Term Trading (Redemption) Fees. Shares held by investors in the Fund less than 90 days may have been subject to a redemption fee equal to 2.00% of the NAV of shares redeemed. All redemption fees, which reduce the proceeds of the shareholder redemption, are retained by the Fund and accounted for as an addition to paid in capital.
Annual Report
Notes to Financial Statements - continued
4. Derivative Instruments.
Risk Exposures and the Use of Derivative Instruments. The Fund's investment objective allows the Fund to enter into various types of derivative contracts, including futures contracts. Derivatives are investments whose value is primarily derived from underlying assets, indices or reference rates and may be transacted on an exchange or over-the-counter (OTC). Derivatives may involve a future commitment to buy or sell a specified asset based on specified terms, to exchange future cash flows at periodic intervals based on a notional principal amount, or for one party to make one or more payments upon the occurrence of specified events in exchange for periodic payments from the other party.
The Fund used derivatives to increase returns and to manage exposure to certain risks as defined below. The success of any strategy involving derivatives depends on analysis of numerous economic factors, and if the strategies for investment do not work as intended, the Fund may not achieve its objectives.
The Fund's use of derivatives increased or decreased its exposure to the following risk:
Equity Risk | Equity risk relates to the fluctuations in the value of financial instruments as a result of changes in market prices (other than those arising from interest rate risk or foreign exchange risk), whether caused by factors specific to an individual investment, its issuer, or all factors affecting all instruments traded in a market or market segment. |
The Fund is also exposed to additional risks from investing in derivatives, such as liquidity risk and counterparty credit risk. Liquidity risk is the risk that the Fund will be unable to close out the derivative in the open market in a timely manner. Counterparty credit risk is the risk that the counterparty will not be able to fulfill its obligation to the Fund. Counterparty credit risk related to exchange-traded futures contracts may be mitigated by the protection provided by the exchange on which they trade.
Investing in derivatives may involve greater risks than investing in the underlying assets directly and, to varying degrees, may involve risk of loss in excess of any initial investment and collateral received and amounts recognized in the Statement of Assets and Liabilities. In addition, there may be the risk that the change in value of the derivative contract does not correspond to the change in value of the underlying instrument.
Annual Report
4. Derivative Instruments - continued
Futures Contracts. A futures contract is an agreement between two parties to buy or sell a specified underlying instrument for a fixed price at a specified future date. The Fund used futures contracts to manage its exposure to the stock market.
Upon entering into a futures contract, a fund is required to deposit either cash or securities (initial margin) with a clearing broker in an amount equal to a certain percentage of the face value of the contract. Futures contracts are marked-to-market daily and subsequent daily payments (variation margin) are made or received by a fund depending on the daily fluctuations in the value of the futures contracts and are recorded as unrealized appreciation or (depreciation). This receivable and/or payable, if any, is included in daily variation margin for derivative instruments in the Statement of Assets and Liabilities. Realized gain or (loss) is recorded upon the expiration or closing of a futures contract.
Any open futures contracts at period end are presented in the Schedule of Investments under the caption "Futures Contracts." The underlying face amount at value reflects each contract's exposure to the underlying instrument or index at period end and is representative of volume of activity during the period. Securities deposited to meet initial margin requirements are identified in the Schedule of Investments.
During the period the Fund recognized net realized gain (loss) of $(381,269) related to its investment in futures contracts. This amount is included in the Statement of Operations.
5. Purchases and Sales of Investments.
Purchases and sales of securities, other than short-term securities, aggregated $77,304,743 and $80,761,199, respectively.
6. Fees and Other Transactions with Affiliates.
Management Fee. Fidelity Management & Research Company (the investment adviser) and its affiliates provide the Fund with investment management related services for which the Fund pays a monthly management fee. The management fee is the sum of an individual fund fee rate that is based on an annual rate of .60% of the Fund's average net assets and an annualized group fee rate that averaged .25% during the period. The group fee rate is based upon the average net assets of all the mutual funds advised by the investment adviser, including any mutual funds previously advised by the investment adviser that are currently advised by Fidelity SelectCo, LLC, an affiliate of the investment adviser. The group fee rate decreases as assets under management increase and increases as assets under management decrease. For the reporting period, the total annual management fee rate was .85% of the Fund's average net assets.
Annual Report
Notes to Financial Statements - continued
6. Fees and Other Transactions with Affiliates - continued
Distribution and Service Plan Fees. In accordance with Rule 12b-1 of the 1940 Act, the Fund has adopted separate Distribution and Service Plans for each class of shares. Certain classes pay Fidelity Distributors Corporation (FDC), an affiliate of the investment adviser, separate Distribution and Service Fees, each of which is based on an annual percentage of each class' average net assets. In addition, FDC may pay financial intermediaries for selling shares of the Fund and providing shareholder support services. For the period, the Distribution and Service Fee rates, total fees and amounts retained by FDC were as follows:
| Distribution
Fee | Service
Fee | Total Fees | Retained
by FDC |
Class A | -% | .25% | $ 11,767 | $ 550 |
Class T | .25% | .25% | 10,340 | 15 |
Class C | .75% | .25% | 15,991 | 5,122 |
| | | $ 38,098 | $ 5,687 |
Sales Load. FDC may receive a front-end sales charge of up to 5.75% for selling Class A shares and 3.50% for selling Class T shares, some of which is paid to financial intermediaries for selling shares of the Fund. Depending on the holding period, FDC may receive contingent deferred sales charges levied on Class A, Class T and Class C redemptions. The deferred sales charges are 1.00% for Class C shares, 1.00% for certain purchases of Class A shares and .25% for certain purchases of Class T shares.
For the period, sales charge amounts retained by FDC were as follows:
| Retained
by FDC |
Class A | $ 4,871 |
Class T | 2,151 |
Class CA | 233 |
| $ 7,255 |
A When Class C shares are initially sold, FDC pays commissions from its own resources to financial intermediaries through which the sales are made.
Transfer Agent Fees. Fidelity Investments Institutional Operations Company, Inc., (FIIOC), an affiliate of the investment adviser, is the transfer, dividend disbursing and shareholder servicing agent for each class of the Fund. FIIOC receives account fees and asset-based fees that vary according to the account size and type of account of the shareholders of the respective classes of the Fund. FIIOC pays for typesetting, printing and mailing of shareholder reports, except proxy statements.
Annual Report
6. Fees and Other Transactions with Affiliates - continued
Transfer Agent Fees - continued
For the period, transfer agent fees for each class were as follows:
| Amount | % of
Class-Level Average
Net Assets |
Class A | $ 14,269 | .30 |
Class T | 6,765 | .33 |
Class C | 4,800 | .30 |
Emerging Markets Discovery | 149,981 | .22 |
Class I | 2,598 | .25 |
| $ 178,413 | |
Accounting and Security Lending Fees. Fidelity Service Company, Inc. (FSC), an affiliate of the investment adviser, maintains the Fund's accounting records. The accounting fee is based on the level of average net assets for each month. Under a separate contract, FSC administers the security lending program. The security lending fee is based on the number and duration of lending transactions.
Brokerage Commissions. The Fund placed a portion of its portfolio transactions with brokerage firms which are affiliates of the investment adviser. Brokerage commissions are included in net realized gain (loss) and change in net unrealized appreciation (depreciation) in the Statement of Operations. The commissions paid to these affiliated firms were $608 for the period.
7. Committed Line of Credit.
The Fund participates with other funds managed by the investment adviser or an affiliate in a $4.25 billion credit facility (the "line of credit") to be utilized for temporary or emergency purposes to fund shareholder redemptions or for other short-term liquidity purposes. The Fund has agreed to pay commitment fees on its pro-rata portion of the line of credit, which amounted to $114 and is reflected in Miscellaneous expenses on the Statement of Operations. During the period, the Fund did not borrow on this line of credit.
Annual Report
Notes to Financial Statements - continued
8. Security Lending.
The Fund lends portfolio securities through a lending agent from time to time in order to earn additional income. For equity securities, a lending agent is used and may loan securities to certain qualified borrowers, including Fidelity Capital Markets (FCM), a broker-dealer affiliated with the Fund. On the settlement date of the loan, the Fund receives collateral (in the form of U.S. Treasury obligations, letters of credit and/or cash) against the loaned securities and maintains collateral in an amount not less than 100% of the market value of the loaned securities during the period of the loan. The market value of the loaned securities is determined at the close of business of the Fund and any additional required collateral is delivered to the Fund on the next business day. The Fund or borrower may terminate the loan at any time, and if the borrower defaults on its obligation to return the securities loaned because of insolvency or other reasons, the Fund may apply collateral received from the borrower against the obligation. The Fund may experience delays and costs in recovering the securities loaned. Any cash collateral received is invested in the Fidelity Securities Lending Cash Central Fund. The value of loaned securities and cash collateral at period end are disclosed on the Fund's Statement of Assets and Liabilities. Security lending income represents the income earned on investing cash collateral, less rebates paid to borrowers and any lending agent fees associated with the loan, plus any premium payments received for lending certain types of securities. Security lending income is presented in the Statement of Operations as a component of income from Fidelity Central Funds. Total security lending income during the period amounted to $7,859. During the period, there were no securities loaned to FCM.
9. Expense Reductions.
The investment adviser contractually agreed to reimburse each class to the extent annual operating expenses exceeded certain levels of average net assets as noted in the table below. This reimbursement will remain in place through December 31, 2016. Some expenses, for example interest expense, including commitment fees, are excluded from this reimbursement.
The following classes were in reimbursement during the period:
| Expense
Limitations | Reimbursement |
Class A | 1.70% | $ 8,649 |
Class T | 1.95% | 4,276 |
Class C | 2.45% | 2,999 |
Emerging Markets Discovery | 1.45% | 72,186 |
Class I | 1.45% | 950 |
| | $ 89,060 |
Annual Report
9. Expense Reductions - continued
Commissions paid to certain brokers with whom the investment adviser, or its affiliates, places trades on behalf of the Fund include an amount in addition to trade execution, which may be rebated back to the Fund to offset certain expenses. This amount totaled $8,674 for the period.
In addition, during the period the investment adviser reimbursed and/or waived a portion of fund-level operating expenses in the amount of $334 and a portion of class-level operating expenses as follows:
| Amount |
Class A | $ 36 |
Class T | 4 |
Class C | 16 |
Emerging Markets Discovery | 2,141 |
Class I | 30 |
| $ 2,227 |
10. Distributions to Shareholders.
Distributions to shareholders of each class were as follows:
Years ended October 31, | 2015 | 2014 |
From net investment income | | |
Class A | $ - | $ 23,688 |
Class T | - | 2,475 |
Emerging Markets Discovery | - | 646,254 |
Class I | - | 4,063 |
Total | $ - | $ 676,480 |
From net realized gain | | |
Class A | $ - | $ 122,525 |
Class T | - | 43,668 |
Class C | - | 51,356 |
Emerging Markets Discovery | - | 2,280,897 |
Class I | - | 22,163 |
Total | $ - | $ 2,520,609 |
Annual Report
Notes to Financial Statements - continued
11. Share Transactions.
Share transactions for each class were as follows and may contain automatic conversions between classes or exchanges between funds:
| Shares | Dollars |
Years ended October 31, | 2015 | 2014 | 2015 | 2014 |
Class A | | | | |
Shares sold | 161,641 | 147,354 | $ 1,908,467 | $ 1,789,001 |
Reinvestment of distributions | - | 10,958 | - | 133,251 |
Shares redeemed | (93,262) | (205,580) | (1,088,220) | (2,490,439) |
Net increase (decrease) | 68,379 | (47,268) | $ 820,247 | $ (568,187) |
Class T | | | | |
Shares sold | 59,344 | 52,146 | $ 694,558 | $ 631,489 |
Reinvestment of distributions | - | 3,566 | - | 43,325 |
Shares redeemed | (41,200) | (42,178) | (472,328) | (507,088) |
Net increase (decrease) | 18,144 | 13,534 | $ 222,230 | $ 167,726 |
Class C | | | | |
Shares sold | 68,780 | 92,257 | $ 796,943 | $ 1,143,008 |
Reinvestment of distributions | - | 4,241 | - | 51,185 |
Shares redeemed | (57,921) | (119,225) | (667,642) | (1,424,170) |
Net increase (decrease) | 10,859 | (22,727) | $ 129,301 | $ (229,977) |
Emerging Markets Discovery | | | | |
Shares sold | 2,311,392 | 2,185,123 | $ 27,313,497 | $ 26,469,903 |
Reinvestment of distributions | - | 205,996 | - | 2,506,974 |
Shares redeemed | (3,121,418) | (3,696,612) | (36,074,220) | (44,026,941) |
Net increase (decrease) | (810,026) | (1,305,493) | $ (8,760,723) | $ (15,050,064) |
Class I | | | | |
Shares sold | 209,924 | 25,831 | $ 2,474,235 | $ 324,477 |
Reinvestment of distributions | - | 824 | - | 10,052 |
Shares redeemed | (121,211) | (73,327) | (1,373,121) | (870,835) |
Net increase (decrease) | 88,713 | (46,672) | $ 1,101,114 | $ (536,306) |
12. Other.
The Fund's organizational documents provide former and current trustees and officers with a limited indemnification against liabilities arising in connection with the performance of their duties to the Fund. In the normal course of business, the Fund may also enter into contracts that provide general indemnifications. The Fund's maximum exposure under these arrangements is unknown as this would be dependent on future claims that may be made against the Fund. The risk of material loss from such claims is considered remote.
Annual Report
To the Trustees of Fidelity Investment Trust and the Shareholders of Fidelity Emerging Markets Discovery Fund:
In our opinion, the accompanying statement of assets and liabilities, including the schedule of investments, and the related statements of operations and of changes in net assets and the financial highlights present fairly, in all material respects, the financial position of Fidelity Emerging Markets Discovery Fund (a fund of Fidelity Investment Trust) at October 31, 2015, the results of its operations for the year then ended, the changes in its net assets for each of the two years in the period then ended and the financial highlights for each of the periods indicated, in conformity with accounting principles generally accepted in the United States of America. These financial statements and financial highlights (hereafter referred to as "financial statements") are the responsibility of the Fidelity Emerging Markets Discovery Fund's management. Our responsibility is to express an opinion on these financial statements based on our audits. We conducted our audits of these financial statements in accordance with the standards of the Public Company Accounting Oversight Board (United States). Those standards require that we plan and perform the audit to obtain reasonable assurance about whether the financial statements are free of material misstatement. An audit includes examining, on a test basis, evidence supporting the amounts and disclosures in the financial statements, assessing the accounting principles used and significant estimates made by management, and evaluating the overall financial statement presentation. We believe that our audits, which included confirmation of securities at October 31, 2015 by correspondence with the custodian and brokers, provide a reasonable basis for our opinion.
PricewaterhouseCoopers LLP
Boston, Massachusetts
December 18, 2015
Annual Report
The Trustees, Member of the Advisory Board, and officers of the trust and fund, as applicable, are listed below. The Board of Trustees governs the fund and is responsible for protecting the interests of shareholders. The Trustees are experienced executives who meet periodically throughout the year to oversee the fund's activities, review contractual arrangements with companies that provide services to the fund, oversee management of the risks associated with such activities and contractual arrangements, and review the fund's performance. Each of the Trustees oversees 170 funds.
The Trustees hold office without limit in time except that (a) any Trustee may resign; (b) any Trustee may be removed by written instrument, signed by at least two-thirds of the number of Trustees prior to such removal; (c) any Trustee who requests to be retired or who has become incapacitated by illness or injury may be retired by written instrument signed by a majority of the other Trustees; and (d) any Trustee may be removed at any special meeting of shareholders by a two-thirds vote of the outstanding voting securities of the trust. Each Trustee who is not an interested person (as defined in the 1940 Act) of the trust and the fund (Independent Trustee), shall retire not later than the last day of the calendar year in which his or her 75th birthday occurs. The Independent Trustees may waive this mandatory retirement age policy with respect to individual Trustees. The officers and Advisory Board Member hold office without limit in time, except that any officer and Advisory Board Member may resign or may be removed by a vote of a majority of the Trustees at any regular meeting or any special meeting of the Trustees. Except as indicated, each individual has held the office shown or other offices in the same company for the past five years.
Experience, Skills, Attributes, and Qualifications of the Fund's Trustees. The Governance and Nominating Committee has adopted a statement of policy that describes the experience, qualifications, attributes, and skills that are necessary and desirable for potential Independent Trustee candidates (Statement of Policy). The Board believes that each Trustee satisfied at the time he or she was initially elected or appointed a Trustee, and continues to satisfy, the standards contemplated by the Statement of Policy. The Governance and Nominating Committee also engages professional search firms to help identify potential Independent Trustee candidates who have the experience, qualifications, attributes, and skills consistent with the Statement of Policy. From time to time, additional criteria based on the composition and skills of the current Independent Trustees, as well as experience or skills that may be appropriate in light of future changes to board composition, business conditions, and regulatory or other developments, have also been considered by the professional search firms and the Governance and Nominating Committee. In addition, the Board takes into account the Trustees' commitment and participation in Board and committee meetings, as well as their leadership of standing and ad hoc committees throughout their tenure.
In determining that a particular Trustee was and continues to be qualified to serve as a Trustee, the Board has considered a variety of criteria, none of which, in isolation, was controlling. The Board believes that, collectively, the Trustees have balanced and diverse experience, qualifications, attributes, and skills, which allow the Board to operate effectively in governing the fund and protecting the interests of shareholders. Information about the specific experience, skills, attributes, and qualifications of each Trustee, which in each case led to the Board's conclusion that the Trustee should serve (or continue to serve) as a trustee of the fund, is provided below.
Annual Report
Trustees and Officers - continued
Board Structure and Oversight Function. James C. Curvey is an interested person (as defined in the 1940 Act) and currently serves as Chairman. The Trustees have determined that an interested Chairman is appropriate and benefits shareholders because an interested Chairman has a personal and professional stake in the quality and continuity of services provided to the fund. Independent Trustees exercise their informed business judgment to appoint an individual of their choosing to serve as Chairman, regardless of whether the Trustee happens to be independent or a member of management. The Independent Trustees have determined that they can act independently and effectively without having an Independent Trustee serve as Chairman and that a key structural component for assuring that they are in a position to do so is for the Independent Trustees to constitute a substantial majority for the Board. The Independent Trustees also regularly meet in executive session. Ned C. Lautenbach serves as Chairman of the Independent Trustees and as such (i) acts as a liaison between the Independent Trustees and management with respect to matters important to the Independent Trustees and (ii) with management prepares agendas for Board meetings.
Fidelity funds are overseen by different Boards of Trustees. The fund's Board oversees Fidelity's high income and certain equity funds, and other Boards oversee Fidelity's investment-grade bond, money market, asset allocation, and sector funds. The asset allocation funds may invest in Fidelity funds overseen by the fund's Board. The use of separate Boards, each with its own committee structure, allows the Trustees of each group of Fidelity funds to focus on the unique issues of the funds they oversee, including common research, investment, and operational issues. On occasion, the separate Boards establish joint committees to address issues of overlapping consequences for the Fidelity funds overseen by each Board.
The Trustees operate using a system of committees to facilitate the timely and efficient consideration of all matters of importance to the Trustees, the fund, and fund shareholders and to facilitate compliance with legal and regulatory requirements and oversight of the fund's activities and associated risks. The Board, acting through its committees, has charged FMR and its affiliates with (i) identifying events or circumstances the occurrence of which could have demonstrably adverse effects on the fund's business and/or reputation; (ii) implementing processes and controls to lessen the possibility that such events or circumstances occur or to mitigate the effects of such events or circumstances if they do occur; and (iii) creating and maintaining a system designed to evaluate continuously business and market conditions in order to facilitate the identification and implementation processes described in (i) and (ii) above. Because the day-to-day operations and activities of the fund are carried out by or through FMR, its affiliates and other service providers, the fund's exposure to risks is mitigated but not eliminated by the processes overseen by the Trustees. While each of the Board's committees has responsibility for overseeing different aspects of the fund's activities, oversight is exercised primarily through the Operations, Audit, and Compliance Committees. In addition, the Independent Trustees have worked with FMR to enhance the Board's oversight of investment and financial risks, legal and regulatory risks, technology risks, and operational risks, including the development of additional risk reporting to the Board. For example, a working group comprised of Independent Trustees and FMR has worked and continues to work to review the Fidelity funds' valuation-related activities, reporting and risk management. Appropriate personnel, including but not limited to the fund's Chief Compliance Officer (CCO), FMR's internal auditor, the independent accountants, the fund's Treasurer and portfolio management personnel, make periodic reports to the Board's committees, as appropriate, including an annual review of Fidelity's risk management program for the Fidelity funds. The responsibilities of each standing committee, including their oversight responsibilities, are described further under "Standing Committees of the Fund's Trustees."
Annual Report
The fund's Statement of Additional Information (SAI) includes more information about the Trustees. To request a free copy, call Fidelity at 1-877-208-0098.
Interested Trustees*:
Correspondence intended for each Trustee who is an interested person may be sent to Fidelity Investments, 245 Summer Street, Boston, Massachusetts 02210.
Name, Year of Birth; Principal Occupations and Other Relevant Experience+ |
James C. Curvey (1935) |
Year of Election or Appointment: 2007 Trustee Chairman of the Board of Trustees |
| Mr. Curvey also serves as Trustee of other Fidelity funds. Mr. Curvey is a Director of Fidelity Research & Analysis Co. (investment adviser firm, 2009-present), and Vice Chairman (2007-present) and Director of FMR LLC (diversified financial services company). In addition, Mr. Curvey serves as an Overseer for the Boston Symphony Orchestra and a member of the board of Artis-Naples, Naples, Florida, and as a Trustee for Brewster Academy, Wolfeboro, New Hampshire. Previously, Mr. Curvey served as a Director of Fidelity Investments Money Management, Inc. (investment adviser firm, 2009-2014) and a Director of FMR and FMR Co., Inc. (investment adviser firms, 2007-2014). |
Charles S. Morrison (1960) |
Year of Election or Appointment: 2014 Trustee |
| Mr. Morrison also serves as Trustee of other funds. He serves as a Director of Fidelity Investments Money Management, Inc. (FIMM) (investment adviser firm, 2014-present), Director of Fidelity SelectCo, LLC (investment adviser firm, 2014-present), President, Asset Management (2014-present), and is an employee of Fidelity Investments. Previously, Mr. Morrison served as Vice President of Fidelity's Fixed Income and Asset Allocation Funds (2012-2014), President, Fixed Income (2011-2014), Vice President of Fidelity's Money Market Funds (2005-2009), President, Money Market Group Leader of FMR (investment adviser firm, 2009), and Senior Vice President, Money Market Group of FMR (2004-2009). Mr. Morrison also served as Vice President of Fidelity's Bond Funds (2002-2005), certain Balanced Funds (2002-2005), and certain Asset Allocation Funds (2002-2007), and as Senior Vice President (2002-2005) of Fidelity's Bond Division. |
* Trustees have been determined to be "Interested Trustees" by virtue of, among other things, their affiliation with the trust or various entities under common control with FMR.
+ The information above includes each Trustee's principal occupation during the last five years and other information relating to the experience, attributes, and skills relevant to each Trustee's qualifications to serve as a Trustee, which led to the conclusion that each Trustee should serve as a Trustee for the fund.
Annual Report
Independent Trustees:
Correspondence intended for each Independent Trustee (that is, the Trustees other than the Interested Trustees) may be sent to Fidelity Investments, P.O. Box 55235, Boston, Massachusetts 02205-5235.
Name, Year of Birth; Principal Occupations and Other Relevant Experience+ |
Dennis J. Dirks (1948) |
Year of Election or Appointment: 2005 Trustee |
| Mr. Dirks also serves as Trustee of other Fidelity funds. Prior to his retirement in May 2003, Mr. Dirks was Chief Operating Officer and a member of the Board of The Depository Trust & Clearing Corporation (DTCC). He also served as President, Chief Operating Officer, and Board member of The Depository Trust Company (DTC) and President and Board member of the National Securities Clearing Corporation (NSCC). In addition, Mr. Dirks served as Chief Executive Officer and Board member of the Government Securities Clearing Corporation, Chief Executive Officer and Board member of the Mortgage-Backed Securities Clearing Corporation, as a Trustee and a member of the Finance Committee of Manhattan College (2005-2008), as a Trustee and a member of the Finance Committee of AHRC of Nassau County (2006-2008), and as a member of the Independent Directors Council (IDC) Governing Council (2010-2015). Mr. Dirks is a member of the Board of Directors for The Brookville Center for Children's Services, Inc. (2009-present). |
Alan J. Lacy (1953) |
Year of Election or Appointment: 2008 Trustee |
| Mr. Lacy also serves as Trustee of other Fidelity funds. Mr. Lacy serves as a member of the Board of Directors of Dave & Buster's Entertainment, Inc. (restaurant and entertainment complexes, 2010-present) and Bristol-Myers Squibb Company (global pharmaceuticals, 2008-present). In addition, Mr. Lacy served as Senior Adviser (2007-2014) of Oak Hill Capital Partners, L.P. (private equity) and also served as Chief Executive Officer (2000-2005) and Vice Chairman (2005-2006) of Sears Holdings Corporation and Sears, Roebuck and Co. (retail). Mr. Lacy is a member of the Board of Trustees of The National Parks Conservation Association (2006-present). Previously, Mr. Lacy served as Chairman of the Board of Trustees of the National Parks Conservation Association (2008-2011) and as a member of the Board of Directors for The Western Union Company (global money transfer, 2006-2011), The Hillman Companies, Inc. (hardware wholesalers, 2010-2014), and Earth Fare, Inc. (retail grocery, 2010-2014). |
Ned C. Lautenbach (1944) |
Year of Election or Appointment: 2000 Trustee Chairman of the Independent Trustees |
| Mr. Lautenbach also serves as Trustee of other Fidelity funds. Mr. Lautenbach currently serves as the Lead Director of the Eaton Corporation Board of Directors (diversified industrial, 1997-present). Mr. Lautenbach is Chairman of the Board of Directors of Artis-Naples in Naples, Florida (2012-present), a member of the Council on Foreign Relations (1994-present), and a member of the Board of Governors, State University System of Florida (2013-present). Previously, Mr. Lautenbach was a Partner/Advisory Partner at Clayton, Dubilier & Rice, LLC (private equity investment, 1998-2010), as well as a Director of Sony Corporation (2006-2007). |
Joseph Mauriello (1944) |
Year of Election or Appointment: 2008 Trustee |
| Mr. Mauriello also serves as Trustee of other Fidelity funds. Prior to his retirement in January 2006, Mr. Mauriello served in numerous senior management positions including Deputy Chairman and Chief Operating Officer (2004-2005), and Vice Chairman of Financial Services (2002-2004) of KPMG LLP US (professional services, 1965-2005). Mr. Mauriello currently serves as a member of the Board of Directors of XL Group plc. (global insurance and re-insurance, 2006-present) and the Independent Directors Council (IDC) Governing Council (2015-present). Previously, Mr. Mauriello served as a Director of the Hamilton Funds of the Bank of New York (2006-2007) and of Arcadia Resources Inc. (health care services and products, 2007-2012). |
Robert W. Selander (1950) |
Year of Election or Appointment: 2011 Trustee |
| Mr. Selander also serves as Trustee of other Fidelity funds. Mr. Selander serves as a Director of The Western Union Company (global money transfer, 2014-present). Previously, Mr. Selander served as a Member of the Advisory Board of other Fidelity funds (2011), and Executive Vice Chairman (2010), Chief Executive Officer (2009-2010), and President and Chief Executive Officer (1997-2009) of Mastercard, Inc. |
Cornelia M. Small (1944) |
Year of Election or Appointment: 2005 Trustee |
| Ms. Small also serves as Trustee of other Fidelity funds. Ms. Small is a member of the Board of Directors (2009-present) and Chair of the Investment Committee (2010-present) of the Teagle Foundation. Ms. Small also serves on the Investment Committee of the Berkshire Taconic Community Foundation (2008-present). Previously, Ms. Small served as Chairperson (2002-2008) and a member of the Investment Committee and Chairperson (2008-2012) and a member of the Board of Trustees of Smith College. In addition, Ms. Small served as Chief Investment Officer, Director of Global Equity Investments, and a member of the Board of Directors of Scudder, Stevens & Clark and Scudder Kemper Investments. |
William S. Stavropoulos (1939) |
Year of Election or Appointment: 2001 Trustee Vice Chairman of the Independent Trustees |
| Mr. Stavropoulos also serves as Trustee of other Fidelity funds. Mr. Stavropoulos serves as President and Founder of the Michigan Baseball Foundation, the Great Lakes Loons (2007-present). Mr. Stavropoulos is Chairman Emeritus of the Board of Directors of The Dow Chemical Company, where he previously served in numerous senior management positions, including President, CEO (1995-2000; 2002-2004), Chairman of the Executive Committee (2000-2006), and as a member of the Board of Directors (1990-2006). Currently, Mr. Stavropoulos is Chairman of the Board of Directors of Univar Inc. (global distributor of commodity and specialty chemicals), a Director of Teradata Corporation (data warehousing and technology solutions), and Maersk Inc. (industrial conglomerate), and a member of the Advisory Board for Metalmark Capital LLC (private equity investment, 2005-present). Mr. Stavropoulos is an operating advisor to Clayton, Dubilier & Rice, LLC (private equity investment). In addition, Mr. Stavropoulos is a member of the University of Notre Dame Advisory Council for the College of Science, a Trustee of the Rollin L. Gerstacker Foundation, and a Director of the Naples Philharmonic Center for the Arts. Previously, Mr. Stavropoulos served as a Director of Chemical Financial Corporation (bank holding company, 1993-2012) and Tyco International, Ltd. (multinational manufacturing and services, 2007-2012). |
David M. Thomas (1949) |
Year of Election or Appointment: 2008 Trustee |
| Mr. Thomas also serves as Trustee of other Fidelity funds. Mr. Thomas serves as Non-Executive Chairman of the Board of Directors of Fortune Brands Home and Security (home and security products, 2011-present), as a member of the Board of Directors (2004-present) and Presiding Director (2013-present) of Interpublic Group of Companies, Inc. (marketing communication), and as a member of the Board of Trustees of the University of Florida (2013-present). Previously, Mr. Thomas served as Executive Chairman (2005-2006) and Chairman and Chief Executive Officer (2000-2005) of IMS Health, Inc. (pharmaceutical and healthcare information solutions), and a Director of Fortune Brands, Inc. (consumer products, 2000-2011). |
+ The information above includes each Trustee's principal occupation during the last five years and other information relating to the experience, attributes, and skills relevant to each Trustee's qualifications to serve as a Trustee, which led to the conclusion that each Trustee should serve as a Trustee for the fund.
Advisory Board Member and Officers:
Correspondence intended for each officer and Peter S. Lynch may be sent to Fidelity Investments, 245 Summer Street, Boston, Massachusetts 02210. Officers appear below in alphabetical order.
Name, Year of Birth; Principal Occupation |
Peter S. Lynch (1944) |
Year of Election or Appointment: 2003 Member of the Advisory Board |
| Mr. Lynch also serves as Member of the Advisory Board of other Fidelity funds. Mr. Lynch is Vice Chairman and a Director of FMR (investment adviser firm) and FMR Co., Inc. (investment adviser firm). In addition, Mr. Lynch serves as a Trustee of Boston College and as the Chairman of the Inner-City Scholarship Fund. Previously, Mr. Lynch served on the Special Olympics International Board of Directors (1997-2006). |
Elizabeth Paige Baumann (1968) |
Year of Election or Appointment: 2012 Anti-Money Laundering (AML) Officer |
| Ms. Baumann also serves as AML Officer of other funds. She is Chief AML Officer of FMR LLC (diversified financial services company, 2012-present) and is an employee of Fidelity Investments. Previously, Ms. Baumann served as Vice President and Deputy Anti-Money Laundering Officer (2007-2012). |
Marc R. Bryant (1966) |
Year of Election or Appointment: 2015 Secretary and Chief Legal Officer (CLO) |
| Mr. Bryant also serves as Secretary and CLO of other funds. Mr. Bryant serves as CLO, Secretary, and Senior Vice President of Fidelity Management & Research Company (investment adviser firm, 2015-present) and FMR Co., Inc. (investment adviser firm, 2015-present); Secretary of Fidelity SelectCo, LLC (investment adviser firm, 2015-present) and Fidelity Investments Money Management, Inc. (investment adviser firm, 2015-present); and CLO of Fidelity Management & Research (Hong Kong) Limited (investment adviser firm, 2015-present). He is Senior Vice President and Deputy General Counsel of FMR LLC (diversified financial services company). Previously, Mr. Bryant served as Secretary and Chief Legal Officer of Fidelity Rutland Square Trust II (2010-2014) and Assistant Secretary of Fidelity's Fixed Income and Asset Allocation Funds (2013-2015). Prior to joining Fidelity Investments, Mr. Bryant served as a Senior Vice President and the Head of Global Retail Legal for AllianceBernstein L.P. (2006-2010), and as the General Counsel for ProFund Advisors LLC (2001-2006). |
William C. Coffey (1969) |
Year of Election or Appointment: 2009 Assistant Secretary |
| Mr. Coffey also serves as Assistant Secretary of other funds. He is Senior Vice President and Deputy General Counsel of FMR LLC (diversified financial services company, 2010-present), and is an employee of Fidelity Investments. Previously, Mr. Coffey served as Vice President and Associate General Counsel of FMR LLC (2005-2009). |
Timothy M. Cohen (1969) |
Year of Election or Appointment: 2014 Vice President of certain Equity Funds |
| Mr. Cohen also serves as Vice President of other funds. Mr. Cohen serves as Chief Compliance Officer of FMR Investment Management (U.K.) Limited (investment adviser firm, 2013-present) and is an employee of Fidelity Investments. Previously, Mr. Cohen served as a Director of FMR Investment Management (U.K.) Limited (2013-2015). |
Jonathan Davis (1968) |
Year of Election or Appointment: 2010 Assistant Treasurer |
| Mr. Davis also serves as Assistant Treasurer of other funds, and is an employee of Fidelity Investments. Previously, Mr. Davis served as Vice President and Associate General Counsel of FMR LLC (diversified financial services company, 2003-2010). |
Adrien E. Deberghes (1967) |
Year of Election or Appointment: 2008 Deputy Treasurer |
| Mr. Deberghes also serves as an officer of other funds. He is an employee of Fidelity Investments (2008-present). Prior to joining Fidelity Investments, Mr. Deberghes was Senior Vice President of Mutual Fund Administration at State Street Corporation (2007-2008), Senior Director of Mutual Fund Administration at Investors Bank & Trust (2005-2007), and Director of Finance for Dunkin' Brands (2000-2005). |
Stephanie J. Dorsey (1969) |
Year of Election or Appointment: 2010 Assistant Treasurer |
| Ms. Dorsey also serves as an officer of other funds. She is an employee of Fidelity Investments (2008-present) and has served in other fund officer roles. Prior to joining Fidelity Investments, Ms. Dorsey served as Treasurer (2004-2008) of the JPMorgan Mutual Funds and Vice President (2004-2008) of JPMorgan Chase Bank. |
Howard J. Galligan III (1966) |
Year of Election or Appointment: 2014 Chief Financial Officer |
| Mr. Galligan also serves as Chief Financial Officer of other funds. Mr. Galligan serves as President of Fidelity Pricing and Cash Management Services (FPCMS) (2014-present) and as a Director of Strategic Advisers, Inc. (investment adviser firm, 2008-present). Previously, Mr. Galligan served as Chief Administrative Officer of Asset Management (2011-2014) and Chief Operating Officer and Senior Vice President of Investment Support for Strategic Advisers, Inc. (2003-2011). |
Scott C. Goebel (1968) |
Year of Election or Appointment: 2015 Vice President |
| Mr. Goebel serves as Vice President of other funds and is an employee of Fidelity Investments (2001-present). Previously, Mr. Goebel served as Secretary of Fidelity SelectCo, LLC (investment adviser firm, 2013-2015), Fidelity Investments Money Management, Inc. (FIMM) (investment adviser firm, 2010-2015), and Fidelity Research and Analysis Company (FRAC) (investment adviser firm, 2010-2015); General Counsel, Secretary, and Senior Vice President of Fidelity Management & Research Company (investment adviser firm, 2008-2015) and FMR Co., Inc. (investment adviser firm, 2008-2015); Assistant Secretary of Fidelity Management & Research (Japan) Limited (investment adviser firm, 2008-2015) and FMR Investment Management (U.K.) Limited (investment adviser firm, 2008-2015); Chief Legal Officer (CLO) of Fidelity Management & Research (Hong Kong) Limited (investment adviser firm, 2008-2015); Secretary and CLO of certain Fidelity funds (2008-2015); Assistant Secretary of FIMM (2008-2010), FRAC (2008-2010), and certain funds (2007-2008); and as Vice President and Secretary of Fidelity Distributors Corporation (FDC) (2005-2007). |
Brian B. Hogan (1964) |
Year of Election or Appointment: 2009 Vice President |
| Mr. Hogan also serves as Trustee or Vice President of other funds. Mr. Hogan serves as a Director of Fidelity SelectCo, LLC (investment adviser firm, 2014-present) and President of the Equity Division of FMR (investment adviser firm, 2009-present). Previously, Mr. Hogan served as Senior Vice President, Equity Research of FMR (2006-2009) and as a portfolio manager. |
Chris Maher (1972) |
Year of Election or Appointment: 2013 Assistant Treasurer |
| Mr. Maher serves as Assistant Treasurer of other funds. Mr. Maher is Vice President of Valuation Oversight and is an employee of Fidelity Investments. Previously, Mr. Maher served as Vice President of Asset Management Compliance (2013), Vice President of the Program Management Group of FMR (investment adviser firm, 2010-2013), and Vice President of Valuation Oversight (2008-2010). |
Kenneth B. Robins (1969) |
Year of Election or Appointment: 2008 President and Treasurer |
| Mr. Robins also serves as an officer of other funds. Mr. Robins serves as Executive Vice President of Fidelity Investments Money Management, Inc. (FIMM) (investment adviser firm, 2013-present) and is an employee of Fidelity Investments (2004-present). Previously, Mr. Robins served in other fund officer roles. |
Stacie M. Smith (1974) |
Year of Election or Appointment: 2013 Deputy Treasurer |
| Ms. Smith also serves as an officer of other funds. She is an employee of Fidelity Investments (2009-present) and has served in other fund officer roles. Prior to joining Fidelity Investments, Ms. Smith served as Senior Audit Manager of Ernst & Young LLP (1996-2009). |
Renee Stagnone (1975) |
Year of Election or Appointment: 2013 Deputy Treasurer |
| Ms. Stagnone also serves as Deputy Treasurer of other funds. Ms. Stagnone is an employee of Fidelity Investments (1997-present). |
Linda J. Wondrack (1964) |
Year of Election or Appointment: 2014 Chief Compliance Officer |
| Ms. Wondrack also serves as Chief Compliance Officer of other funds. Ms. Wondrack is Executive Vice President and head of the Ethics Office and Asset Management Compliance for Fidelity Investments (2012-present). Ms. Wondrack also serves as Chief Compliance Officer of Fidelity SelectCo, LLC (investment adviser firm, 2014-present); Chief Compliance Officer of Impresa Management LLC (2013-present); and Chief Compliance Officer of FMR Co., Inc. (investment adviser firm), Fidelity Investments Money Management, Inc. (investment adviser firm), Fidelity Management & Research (Japan) Limited (investment adviser firm), FMR Investment Management (U.K.) Limited (investment adviser firm), Fidelity Management & Research (Hong Kong) (investment adviser firm), Fidelity Management & Research Company (investment adviser firm), FIAM LLC (investment adviser firm), and Strategic Advisers, Inc. (investment adviser firm), Ballyrock Investment Advisors LLC, and Northern Neck Investors LLC (2012-present). Previously, Ms. Wondrack served as Senior Vice President and Chief Compliance Officer for Columbia Management Investment Advisers, LLC (2005-2012); Chief Compliance Officer for certain funds within the Columbia Family of Funds (2007-2012); and Senior Vice President of Compliance Risk Management at Bank of America (2005-2010). |
Joseph F. Zambello (1957) |
Year of Election or Appointment: 2011 Deputy Treasurer |
| Mr. Zambello also serves as Deputy Treasurer of other funds. Mr. Zambello is an employee of Fidelity Investments (1991-present). Previously, Mr. Zambello served as Vice President of the Program Management Group of FMR (investment adviser firm, 2009-2011) and Vice President of the Transfer Agent Oversight Group (2005-2009). |
Annual Report
Fidelity Emerging Markets Discovery Fund
Each year, the Board of Trustees, including the Independent Trustees (together, the Board), votes on the renewal of the management contract with Fidelity Management & Research Company (FMR) and the sub-advisory agreements (together, the Advisory Contracts) for the fund. The Board, assisted by the advice of fund counsel and Independent Trustees' counsel, requests and considers a broad range of information relevant to the renewal of the Advisory Contracts throughout the year.
The Board meets regularly and, at each of its meetings, covers an extensive agenda of topics and materials and considers factors that are relevant to its annual consideration of the renewal of the fund's Advisory Contracts, including the services and support provided to the fund and its shareholders. The Board has established various standing committees (Committees), each composed of and chaired by Independent Trustees with varying backgrounds, to which the Board has assigned specific subject matter responsibilities in order to enhance effective decision-making by the Board. The Board, acting directly and through its Committees, requests and receives information concerning the annual consideration of the renewal of the fund's Advisory Contracts. The Board also meets as needed to consider matters specifically related to the Board's annual consideration of the renewal of the Advisory Contracts. Members of the Board may also meet with trustees of other Fidelity funds through ad hoc joint committees to discuss certain matters relevant to all of the Fidelity funds.
At its July 2015 meeting, the Board unanimously determined to renew the fund's Advisory Contracts. In reaching its determination, the Board considered all factors it believed relevant, including (i) the nature, extent, and quality of the services to be provided to the fund and its shareholders (including the investment performance of the fund); (ii) the competitiveness of the fund's management fee and total expense ratio relative to peer funds; (iii) the total costs of the services to be provided by and the profits to be realized by Fidelity from its relationship with the fund; and (iv) the extent to which (if any) economies of scale exist and would be realized as the fund grows, and whether any economies of scale are appropriately shared with fund shareholders.
In considering whether to renew the Advisory Contracts for the fund, the Board reached a determination, with the assistance of fund counsel and Independent Trustees' counsel and through the exercise of its business judgment, that the renewal of the Advisory Contracts was in the best interests of the fund and its shareholders and that the compensation payable under the Advisory Contracts was fair and reasonable. The Board's decision to renew the Advisory Contracts was not based on any single factor, but rather was based on a comprehensive consideration of all the information provided to the Board at its meetings throughout the year. The Board, in reaching its determination to renew the Advisory Contracts, was aware that shareholders of the fund have a broad range of investment choices available to them, including a wide choice among funds offered by Fidelity's competitors, and that the fund's shareholders, who have the opportunity to review and weigh the disclosure provided by the fund in its prospectus and other public disclosures, have chosen to invest in this fund, which is part of the Fidelity family of funds.
Annual Report
Nature, Extent, and Quality of Services Provided. The Board considered Fidelity's staffing as it relates to the fund, including the backgrounds of investment personnel of Fidelity, and also considered the fund's investment objective, strategies, and related investment philosophy. The Independent Trustees also had discussions with senior management of Fidelity's investment operations and investment groups. The Board considered the structure of the portfolio manager compensation program and whether this structure provides appropriate incentives to act in the best interests of the fund. Additionally, the Board considered the portfolio managers' investments, if any, in the funds that they manage.
Resources Dedicated to Investment Management and Support Services. The Board and the Fund Oversight and Research Committees reviewed the general qualifications and capabilities of Fidelity's investment staff, including its size, education, experience, and resources, as well as Fidelity's approach to recruiting, training, managing, and compensating investment personnel. The Board noted that Fidelity has continued to increase the resources devoted to non-U.S. offices, including expansion of Fidelity's global investment organization. The Board also noted that Fidelity's analysts have extensive resources, tools and capabilities that allow them to conduct sophisticated quantitative and fundamental analysis, as well as credit analysis of issuers, counterparties and guarantors. Further, the Board considered that Fidelity's investment professionals have sufficient access to global information and data so as to provide competitive investment results over time, and that those professionals also have access to sophisticated tools that permit them to assess portfolio construction and risk and performance attribution characteristics continuously, as well as to transmit new information and research conclusions rapidly around the world. Additionally, in its deliberations, the Board considered Fidelity's trading, risk management, and compliance capabilities and resources, which are integral parts of the investment management process.
Shareholder and Administrative Services. The Board considered (i) the nature, extent, quality, and cost of advisory, administrative, and shareholder services performed by FMR, the sub-advisers (together with FMR, the Investment Advisers), and their affiliates under the Advisory Contracts and under separate agreements covering transfer agency, pricing and bookkeeping, and securities lending services for the fund; (ii) the nature and extent of the supervision of third party service providers, principally custodians and subcustodians; and (iii) the resources devoted to, and the record of compliance with, the fund's compliance policies and procedures. The Board also reviewed the allocation of fund brokerage, including allocations to brokers affiliated with the Investment Advisers, the use of brokerage commissions to pay fund expenses, and the use of "soft" commission dollars to pay for research services.
Annual Report
Board Approval of Investment Advisory Contracts and
Management Fees - continued
The Board noted that the growth of fund assets over time across the complex allows Fidelity to reinvest in the development of services designed to enhance the value or convenience of the Fidelity funds as investment vehicles. These services include 24-hour access to account information and market information through telephone representatives and over the Internet, investor education materials and asset allocation tools, and the expanded availability of Fidelity Investor Centers.
In 2014, the Board formed an ad hoc Committee on Transfer Agency Fees to review the variety of transfer agency fee structures throughout the industry and Fidelity's competitive positioning with respect to industry participants.
Investment in a Large Fund Family. The Board considered the benefits to shareholders of investing in a Fidelity fund, including the benefits of investing in a fund that is part of a large family of funds offering a variety of investment disciplines and providing a large variety of mutual fund investor services. The Board noted that Fidelity had taken, or had made recommendations that resulted in the Fidelity funds taking, a number of actions over the previous year that benefited particular funds, including (i) continuing to dedicate additional resources to investment research and to the support of the senior management team that oversees asset management; (ii) continuing efforts to enhance Fidelity's global research capabilities; (iii) launching new funds and making other enhancements to meet client needs; (iv) reducing management fees and total expenses for certain index funds and diversified international funds; (v) continuing to launch dedicated lower cost underlying funds to meet portfolio construction needs related to expanding underlying fund options for Fidelity funds of funds, specifically for the Freedom Fund product lines; (vi) rationalizing product lines and gaining increased efficiencies through fund mergers; (vii) launching active fixed-income exchange-traded funds; (viii) continuing to develop, acquire and implement systems and technology to improve services to the funds and information security and to increase efficiency; (ix) implementing investment enhancements to further strengthen Fidelity's target date product line to increase investors' probability of success in achieving their goals; (x) modifying the eligibility criteria for certain share classes to accommodate roll-over assets from employer-sponsored retirement plans; (xi) launching a new Class W of the Freedom Index Funds to attract and retain Fidelity record-kept retirement plan assets; and (xii) implementing changes to Fidelity's money market product line in response to recent money market regulatory reforms.
Investment Performance. The Board considered whether the fund has operated in accordance with its investment objective, as well as its record of compliance with its investment restrictions and its performance history.
Annual Report
The Board took into account discussions with representatives of the Investment Advisers about fund investment performance that occur at Board meetings throughout the year. In this regard the Board noted that as part of regularly scheduled fund reviews and other reports to the Board on fund performance, the Board considers annualized return information for the fund, for different time periods, measured against a securities market index ("benchmark index") and a peer group of funds with similar objectives ("peer group"), if any. In its evaluation of fund investment performance, the Board gave particular attention to information indicating changes in performance of certain Fidelity funds for specific time periods and discussed with the Investment Advisers the reasons for any overperformance or underperformance.
In addition to reviewing absolute and relative fund performance, the Independent Trustees periodically consider the appropriateness of fund performance metrics in evaluating the results achieved. In general, the Independent Trustees believe that fund performance should be evaluated based on net performance (after fees and expenses) of both the highest performing and lowest performing fund share classes, where applicable, compared to appropriate benchmark indices, over appropriate time periods that may include full market cycles, and compared to peer groups, as applicable, over the same periods, taking into account relevant factors including the following: general market conditions; issuer-specific information; and fund cash flows and other factors.
The Independent Trustees recognize that shareholders evaluate performance on a net basis over their own holding periods, for which one-, three-, and five-year periods are often used as a proxy. For this reason, the performance information reviewed by the Board also included net cumulative calendar year total return information for the fund and an appropriate benchmark index and peer group for the most recent one- and three-year periods, as shown below. Returns are shown compared to the 25th percentile (top of box, 75% beaten) and 75th percentile (bottom of box, 25% beaten) of the peer universe.
Annual Report
Board Approval of Investment Advisory Contracts and
Management Fees - continued
Fidelity Emerging Markets Discovery Fund

Based on its review, the Board concluded that the nature, extent, and quality of services provided to the fund under the Advisory Contracts should benefit the shareholders of the fund.
Competitiveness of Management Fee and Total Expense Ratio. The Board considered the fund's management fee and total expense ratio compared to "mapped groups" of competitive funds and classes created for the purpose of facilitating the Trustees' competitive analysis of management fees and total expenses. Fidelity creates "mapped groups" by combining similar Lipper investment objective categories that have comparable investment mandates. Combining Lipper investment objective categories aids the Board's management fee and total expense ratio comparisons by broadening the competitive group used for comparison.
Management Fee. The Board considered two proprietary management fee comparisons for the 12-month (or shorter) periods shown in basis points (BP) in the chart below. The group of Lipper funds used by the Board for management fee comparisons is referred to below as the "Total Mapped Group." The Total Mapped Group comparison focuses on a fund's standing in terms of gross management fees before expense reimbursements or caps relative to the total universe of funds with comparable investment mandates, regardless of whether their management fee structures also are comparable. Funds with comparable investment mandates offer exposure to similar types of securities. Funds with comparable management fee structures have similar management fee contractual arrangements (e.g., flat rate charged for advisory services, all-inclusive fee rate, etc.). "TMG %" represents the percentage of funds in the Total Mapped Group that had management fees that were lower than the fund's. For example, a hypothetical TMG % of 20% would mean that 80% of the funds in the Total Mapped Group had higher, and 20% had lower, management fees than the fund. The fund's actual TMG %s and the number of funds in the Total Mapped Group are in the chart below. The "Asset-Size Peer Group" (ASPG) comparison focuses on a fund's standing relative to a subset of non-Fidelity funds within the Total Mapped Group that are similar in size and management fee structure without taking into account performance adjustments, if any. For example, if a fund is in the first quartile of the ASPG, the fund's management fee ranks in the least expensive or lowest 25% of funds in the ASPG. The ASPG represents at least 15% of the funds in the Total Mapped Group with comparable asset size and management fee structures, subject to a minimum of 50 funds (or all funds in the Total Mapped Group if fewer than 50). Additional information, such as the ASPG quartile in which the fund's management fee rate ranked, is also included in the chart and considered by the Board.
Annual Report
Fidelity Emerging Markets Discovery Fund
The Board noted that the fund's management fee rate ranked below the median of its Total Mapped Group and below the median of its ASPG for 2014.
The Board noted that, in 2014, the ad hoc Committee on Group Fee was formed by it and other Fidelity fund boards to conduct an in-depth review of the "group fee" component of the management fee of funds with such management fee structures. Committee focus included the mechanics of the group fee, the competitive landscape of group fee structures, Fidelity funds with no group fee component and investment products not included in group fee assets. The Board also considered that, for funds subject to the group fee,
Annual Report
Board Approval of Investment Advisory Contracts and
Management Fees - continued
FMR agreed to voluntarily waive fees over a specified period of time in amounts designed to account for assets converted from certain funds to certain collective investment trusts.
The Board also noted that, in 2013, the ad hoc Committee on Management Fees was formed to conduct an in-depth review of the management fee rates of Fidelity's active equity mutual funds. The Committee focused on the following areas: (i) standard fee structures; (ii) research consumption and trading evolution; (iii) management fee competitiveness/profitability by category; and (iv) factors that drive institutional pricing.
Based on its review, the Board concluded that the fund's management fee is fair and reasonable in light of the services that the fund receives and the other factors considered.
Total Expense Ratio. In its review of each class's total expense ratio, the Board considered the fund's management fee as well as other fund or class expenses, as applicable, such as transfer agent fees, pricing and bookkeeping fees, fund-paid 12b-1 fees, and custodial, legal, and audit fees. The Board also noted that Fidelity may agree to waive fees and expenses from time to time, and the extent to which, if any, it has done so for the fund. As part of its review, the Board also considered the current and historical total expense ratios of each class of the fund compared to competitive fund median expenses. Each class of the fund is compared to those funds and classes in the Total Mapped Group (used by the Board for management fee comparisons) that have a similar sales load structure.
The Board noted that the total expense ratio of the retail class ranked equal to its competitive median for 2014 and the total expense ratio of each of Class A, Class T, Class C, and Class I ranked above its competitive median for 2014. The Board considered that, in general, various factors can affect total expense ratios. The Board noted that the total expense ratio of Class T was above the competitive median primarily because of higher 12b-1 fees on Class T as compared to most competitor funds. Class T has a higher 12b-1 fee, but a lower front-end sales charge, than traditionally priced front-end sales charge classes. The Board considered that Class T is primarily sold load-waived in the retirement plan market where its 0.50% 12b-1 fee is comparable to competing no-load, higher 12b-1 fee classes designed specifically for retirement plans. The Board noted that the fund offers multiple classes, each of which has a different sales load and 12b-1 fee structure, and that the multiple structures are intended to offer a range of pricing options for the intermediary market. The Board also noted that the total expense ratios of the classes vary primarily by the level of their 12b-1 fees, although differences in transfer agent fees may also cause expenses to vary from class to class.
The Board further considered that FMR contractually agreed to reimburse Class A, Class T, Class C, Class I and the retail class of the fund to the extent that total operating expenses (excluding interest, certain taxes, certain securities lending costs, brokerage commissions, extraordinary expenses, and acquired fund fees and expenses, if any), as a percentage of their respective average net assets, exceed 1.70%, 1.95%, 2.45%, 1.45%, and 1.45% through December 31, 2015.
Annual Report
Fees Charged to Other Fidelity Clients. The Board also considered Fidelity fee structures and other information with respect to clients of Fidelity, such as other funds advised or subadvised by Fidelity, pension plan clients, and other institutional clients with similar mandates. The Board noted the findings of the 2013 ad hoc joint committee (created with the board of other Fidelity funds), which reviewed and compared Fidelity's institutional investment advisory business with its business of providing services to the Fidelity funds, including the differences in services provided, fees charged, and costs incurred, as well as competition in their respective marketplaces.
Based on its review of total expense ratios and fees charged to other Fidelity clients, the Board concluded that, although in some cases above the median of the universe presented for comparison, the total expense ratio of each class of the fund was reasonable in light of the services that the fund and its shareholders receive and the other factors considered.
Costs of the Services and Profitability. The Board considered the revenues earned and the expenses incurred by Fidelity in conducting the business of developing, marketing, distributing, managing, administering and servicing the fund and servicing the fund's shareholders. The Board also considered the level of Fidelity's profits in respect of all the Fidelity funds.
On an annual basis, Fidelity presents to the Board information about the profitability of its relationship with the fund. Fidelity calculates profitability information for each fund, as well as aggregate profitability information for groups of Fidelity funds and all Fidelity funds, using a series of detailed revenue and cost allocation methodologies which originate with the books and records of Fidelity on which Fidelity's audited financial statements are based. The Audit Committee of the Board reviews any significant changes from the prior year's methodologies.
PricewaterhouseCoopers LLP (PwC), independent registered public accounting firm and auditor to Fidelity and certain Fidelity funds, has been engaged annually by the Board as part of the Board's assessment of Fidelity's profitability analysis. PwC's engagement includes the review and assessment of the methodologies used by Fidelity in determining the revenues and expenses attributable to Fidelity's mutual fund business, and completion of agreed-upon procedures in respect of the mathematical accuracy of fund profitability and its conformity to established allocation methodologies. After considering PwC's reports issued under the engagement and information provided by Fidelity, the Board concluded that while other allocation methods may also be reasonable, Fidelity's profitability methodologies are reasonable in all material respects.
Annual Report
Board Approval of Investment Advisory Contracts and
Management Fees - continued
The Board also reviewed Fidelity's non-fund businesses and fall-out benefits related to the mutual fund business as well as cases where Fidelity's affiliates may benefit from or be related to the fund's business.
The Board considered the costs of the services provided by and the profits realized by Fidelity in connection with the operation of the fund and was satisfied that the profitability was not excessive.
Economies of Scale. The Board considered whether there have been economies of scale in respect of the management of the Fidelity funds, whether the Fidelity funds (including the fund) have appropriately benefited from any such economies of scale, and whether there is potential for realization of any further economies of scale. The Board considered the extent to which the fund will benefit from economies of scale as assets grow through increased services to the fund, through waivers or reimbursements, or through fee or expense ratio reductions. The Board also noted that in 2013, it and the boards of other Fidelity funds created an ad hoc committee (the Economies of Scale Committee) to analyze whether Fidelity attains economies of scale in respect of the management and servicing of the Fidelity funds, whether the Fidelity funds have appropriately benefited from such economies of scale, and whether there is potential for realization of any further economies of scale.
The Board recognized that the fund's management contract incorporates a "group fee" structure, which provides for lower group fee rates as total group assets increase, and for higher group fee rates as total group assets decrease (with "group assets" defined to include fund assets under FMR's management plus sector fund assets previously under FMR's management and currently managed by Fidelity SelectCo, LLC). FMR calculates the group fee rates based on a tiered asset "breakpoint" schedule that varies based on asset class. The Board considered that the group fee is designed to deliver the benefits of economies of scale to fund shareholders when total Fidelity fund assets increase, even if assets of any particular fund are unchanged or have declined, because some portion of Fidelity's costs are attributable to services provided to all Fidelity funds, and all funds benefit if those costs can be allocated among more assets. The Board concluded that, given the group fee structure, fund shareholders will benefit from lower management fees as group assets increase at the fund complex level, regardless of whether Fidelity achieves any such economies of scale.
The Board concluded, taking into account the analysis of the Economies of Scale Committee, that economies of scale, if any, are being appropriately shared between fund shareholders and Fidelity.
Additional Information Requested by the Board. In order to develop fully the factual basis for consideration of the Fidelity funds' Advisory Contracts, the Board requested and received additional information on certain topics, including: (i) fund performance trends and Fidelity's long-term strategies for certain funds; (ii) the various share classes employed by Fidelity and the attributes of each class, together with similar information on the distribution and servicing payments made by Fidelity or the funds to third-party participants in the distribution channels; (iii) fund profitability, and fund performance in relation to fund profitability; (iv) the methodology with respect to evaluating competitive fund data and peer group classifications and fee comparisons; (v) annual fund profitability margins, with particular focus on certain funds with negative margins; (vi) the realization of fall-out benefits in certain Fidelity business units; (vii) economies of scale and the way in which they are shared with fund shareholders; (viii) Fidelity's group fee structures, including the group fee schedule of breakpoints; (ix) the impact of cost containment measures on the funds; and (x) the transfer agent fee structure.
Annual Report
Based on its evaluation of all of the conclusions noted above, and after considering all factors it believed relevant, the Board concluded that the advisory fee structures are fair and reasonable, and that the fund's Advisory Contracts should be renewed.
Annual Report
Investment Adviser
Fidelity Management & Research Company
Boston, MA
Investment Sub-Advisers
FMR Co., Inc.
FMR Investment Management
(U.K.) Limited
Fidelity Management & Research
(Hong Kong) Limited
Fidelity Management & Research
(Japan) Limited
FIL Investments (Japan) Limited
FIL Investment Advisors (UK) Limited
FIL Investment Advisors
General Distributor
Fidelity Distributors Corporation
Smithfield, RI
Transfer and Service Agents
Fidelity Investments Institutional Operations Company, Inc.
Boston, MA
Fidelity Service Company, Inc.
Boston, MA
Custodian
The Northern Trust Company
Chicago, IL
(Fidelity Investment logo)(registered trademark)
AEMDI-UANN-1215
1.931242.103
ContentsPerformance: The Bottom LineManagement's Discussion of Fund PerformanceShareholder Expense ExampleInvestment Changes (Unaudited)Investments October 31, 2015Financial StatementsNotes to Financial StatementsReport of Independent Registered Public Accounting FirmTrustees and OfficersBoard Approval of Investment Advisory Contracts and Management Fees
(Fidelity Investment logo)(registered trademark)
Fidelity Advisor®
Emerging Markets Discovery
Fund - Class A, Class T,
and Class C
Annual Report
October 31, 2015
(Fidelity Cover Art)
Class A, Class T, and
Class C are classes of
Fidelity® Emerging
Markets Discovery Fund
Contents
Performance | (Click Here) | How the fund has done over time. |
Management's Discussion of Fund Performance | (Click Here) | The Portfolio Manager's review of fund performance and strategy. |
Shareholder Expense Example | (Click Here) | An example of shareholder expenses. |
Investment Changes | (Click Here) | A summary of major shifts in the fund's investments over the past six months. |
Investments | (Click Here) | A complete list of the fund's investments with their market values. |
Financial Statements | (Click Here) | Statements of assets and liabilities, operations, and changes in net assets, as well as financial highlights. |
Notes | (Click Here) | Notes to the financial statements. |
Report of Independent Registered Public Accounting Firm | (Click Here) | |
Trustees and Officers | (Click Here) | |
Board Approval of Investment Advisory Contracts and Management Fees | (Click Here) | |
To view a fund's proxy voting guidelines and proxy voting record for the 12-month period ended June 30, visit http://www.fidelity.com/proxyvotingresults or visit the Securities and Exchange Commission's (SEC) web site at http://www.sec.gov. You may also call 1-877-208-0098 to request a free copy of the proxy voting guidelines.
Standard & Poor's, S&P and S&P 500 are registered service marks of The McGraw-Hill Companies, Inc. and have been licensed for use by Fidelity Distributors Corporation.
Other third-party marks appearing herein are the property of their respective owners.
All other marks appearing herein are registered or unregistered trademarks or service marks of FMR LLC or an affiliated company. © 2015 FMR LLC. All rights reserved.
Annual Report
This report and the financial statements contained herein are submitted for the general information of the shareholders of the fund. This report is not authorized for distribution to prospective investors in the fund unless preceded or accompanied by an effective prospectus.
A fund files its complete schedule of portfolio holdings with the SEC for the first and third quarters of each fiscal year on Form N-Q. Forms N-Q are available on the SEC's web site at http://www.sec.gov. A fund's Forms N-Q may be reviewed and copied at the SEC's Public Reference Room in Washington, DC. Information regarding the operation of the SEC's Public Reference Room may be obtained by calling 1-800-SEC-0330. For a complete list of a fund's portfolio holdings, view the most recent holdings listing, semiannual report, or annual report on Fidelity's web site at http://www.fidelity.com, http://www.advisor.fidelity.com, or http://www.401k.com, as applicable.
NOT FDIC INSURED • MAY LOSE VALUE • NO BANK GUARANTEE
Neither the fund nor Fidelity Distributors Corporation is a bank.
Annual Report
Average annual total return reflects the change in the value of an investment, assuming reinvestment of the class' distributions from dividend income and capital gains (the profits earned upon the sale of securities that have grown in value, if any) and assuming a constant rate of performance each year. The $10,000 table and the fund's returns do not reflect the deduction of taxes that a shareholder would pay on fund distributions or the redemption of fund shares. During periods of reimbursement by Fidelity, a fund's total return will be greater than it would be had the reimbursement not occurred. How a fund did yesterday is no guarantee of how it will do tomorrow.
Average Annual Total Returns
Periods ended October 31, 2015 | Past 1
year | Life of
fund A |
Class A (incl. 5.75% sales charge) | -15.43% | 1.99% |
Class T (incl. 3.50% sales charge) | -13.60% | 2.34% |
Class C (incl. contingent deferred sales charge) B | -11.81% | 2.76% |
A From November 1, 2011.
B Class C shares' contingent deferred sales charges included in the past one year and life of fund total return figures are 1% and 0%, respectively.
$10,000 Over Life of Fund
Let's say hypothetically that $10,000 was invested in Fidelity Advisor® Emerging Markets Discovery Fund - Class A on November 1, 2011, when the fund started, and the current 5.75% sales charge was paid. The chart shows how the value of your investment would have changed, and also shows how the MSCI Emerging Markets SMID Cap Index performed over the same period.
Annual Report
Fidelity Emerging Markets Discovery Fund
Market Recap: International equities suffered a moderate setback for the 12 months ending October 31, 2015, held back by a collapse in commodities prices that hurt resources-related sectors and geographies. The MSCI ACWI (All Country World Index) ex USA Index returned -4.55% for the period, affected also by concerns about global economic growth. Commodity producers remained under pressure for much of the past year, largely related to economic deceleration in China (-1%), the world's second-largest economy and a leading consumer of raw materials. This effect was exacerbated by U.S. dollar strength relative to global currencies, which weighed on commodities priced in dollars and acutely impacted equity returns within regions most exposed to resources prices. The emerging-markets group, for example, returned about -15% this period. Canada, a significant energy producer, returned roughly -17%. Net energy consumer Japan (+9%) was the best-performing region by far. Only about a quarter of the nearly 50 index countries managed a gain this period: Ireland (+19%) - the EU's fastest-growing economy - and Israel (+17%) proved top performers; Greece (-56%) and Brazil (-46%), among the worst. As for sectors, energy (-25%) and materials (-16%) declined sharply, whereas the two consumer sectors each gained about 6%.
Comments from Co-Portfolio Managers Tim Gannon and Greg Lee: For the year, the fund's share classes (excluding sales charges, if applicable) turned in low double-digit declines but mostly outperformed the -10.55% return of the benchmark MSCI Emerging Markets SMID Cap Index. Security selection drove the funds performance versus the benchmark, as stock picking in a majority of the fund's 10 sector sleeves was positive. From a geographic perspective, investments in Malaysia, Indonesia and Turkey were helpful, but those in South Korea, Brazil and Nigeria hurt versus the benchmark. Among sectors, picks in consumer staples, materials, health care and telecommunication services lifted performance most. The fund's top relative contributor this period was its overweighting in Sansung Life & Science, a former cardboard manufacturer in South Korea that became an extremely successful cosmetics company. The stock re-rated upward, lifting the fund's relative results, as the company continued to take market share in its core face-mask category. We sold Sansung from the fund by period end. Picks in financials were most detrimental to relative performance this period, including stakes in Egypt-based diversified financials firm Citadel Capital and Banco Estado Rio Grande, from Brazil.
The views expressed above reflect those of the portfolio manager(s) only through the end of the period as stated on the cover of this report and do not necessarily represent the views of Fidelity or any other person in the Fidelity organization. Any such views are subject to change at any time based upon market or other conditions and Fidelity disclaims any responsibility to update such views. These views may not be relied on as investment advice and, because investment decisions for a Fidelity fund are based on numerous factors, may not be relied on as an indication of trading intent on behalf of any Fidelity fund.
Annual Report
Fidelity Emerging Markets Discovery Fund
Shareholder Expense Example
As a shareholder of the Fund, you incur two types of costs: (1) transaction costs, including sales charges (loads) on purchase payments or redemption proceeds, redemption fees and (2) ongoing costs, including management fees, distribution and/or service (12b-1) fees and other Fund expenses. This Example is intended to help you understand your ongoing costs (in dollars) of investing in the Fund and to compare these costs with the ongoing costs of investing in other mutual funds.
The Example is based on an investment of $1,000 invested at the beginning of the period and held for the entire period (May 1, 2015 to October 31, 2015).
Actual Expenses
The first line of the accompanying table for each class of the Fund provides information about actual account values and actual expenses. You may use the information in this line, together with the amount you invested, to estimate the expenses that you paid over the period. Simply divide your account value by $1,000.00 (for example, an $8,600 account value divided by $1,000.00 = 8.6), then multiply the result by the number in the first line for a class of the Fund under the heading entitled "Expenses Paid During Period" to estimate the expenses you paid on your account during this period. A small balance maintenance fee of $12.00 that is charged once a year may apply for certain accounts with a value of less than $2,000. This fee is not included in the table below. If it was, the estimate of expenses you paid during the period would be higher, and your ending account value lower, by this amount. In addition, the Fund, as a shareholder in the underlying Fidelity Central Funds, will indirectly bear its pro-rata share of the fees and expenses incurred by the underlying Fidelity Central Funds. These fees and expenses are not included in the Fund's annualized expense ratio used to calculate the expense estimate in the table below.
Hypothetical Example for Comparison Purposes
The second line of the accompanying table for each class of the Fund provides information about hypothetical account values and hypothetical expenses based on a Class' actual expense ratio and an assumed rate of return of 5% per year before expenses, which is not the Class' actual return. The hypothetical account values and expenses may not be used to estimate the actual ending account balance or expenses you paid for the period. You may use this information to compare the ongoing costs of investing in the Fund and other funds. To do so, compare this 5% hypothetical example with the 5% hypothetical examples that appear in the shareholder reports of the other funds. A small balance maintenance fee of $12.00 that is charged once a year may apply for certain accounts with a value of less than $2,000. This fee is not included in the table below. If it was, the estimate of expenses you paid during the period would be higher, and your ending account value lower, by this amount. In addition, the Fund, as a shareholder in the underlying Fidelity Central Funds, will indirectly bear its pro-rata share of the fees and expenses incurred by the underlying Fidelity Central Funds. These fees and expenses are not included in the Fund's annualized expense ratio used to calculate the expense estimate in the table below.
Please note that the expenses shown in the table are meant to highlight your ongoing costs only and do not reflect any transaction costs. Therefore, the second line of the table is useful in comparing ongoing costs only, and will not help you determine the relative total costs of owning different funds. In addition, if these transactional costs were included, your costs would have been higher.
Annual Report
| Annualized
Expense RatioB | Beginning
Account Value
May 1, 2015 | Ending
Account Value
October 31, 2015 | Expenses Paid
During PeriodC
May 1, 2015 to
October 31, 2015 |
Class A | 1.70% | | | |
Actual | | $ 1,000.00 | $ 865.30 | $ 7.99 |
HypotheticalA | | $ 1,000.00 | $ 1,016.64 | $ 8.64 |
Class T | 1.95% | | | |
Actual | | $ 1,000.00 | $ 864.00 | $ 9.16 |
HypotheticalA | | $ 1,000.00 | $ 1,015.38 | $ 9.91 |
Class C | 2.45% | | | |
Actual | | $ 1,000.00 | $ 862.10 | $ 11.50 |
HypotheticalA | | $ 1,000.00 | $ 1,012.85 | $ 12.43 |
Emerging Markets Discovery | 1.45% | | | |
Actual | | $ 1,000.00 | $ 865.90 | $ 6.82 |
HypotheticalA | | $ 1,000.00 | $ 1,017.90 | $ 7.38 |
Class I | 1.45% | | | |
Actual | | $ 1,000.00 | $ 866.40 | $ 6.82 |
HypotheticalA | | $ 1,000.00 | $ 1,017.90 | $ 7.38 |
A 5% return per year before expenses
B Annualized expense ratio reflects expenses net of applicable fee waivers.
C Expenses are equal to each Class' annualized expense ratio, multiplied by the average account value over the period, multiplied by 184/365 (to reflect the one-half year period).
Annual Report
Fidelity Emerging Markets Discovery Fund
Investment Changes (Unaudited)
Top Five Stocks as of October 31, 2015 |
| % of fund's
net assets | % of fund's net assets
6 months ago |
Techtronic Industries Co. Ltd. (Hong Kong, Household Durables) | 2.4 | 2.1 |
Quinenco SA (Chile, Industrial Conglomerates) | 1.9 | 1.7 |
Fila Korea Ltd. (Korea (South), Textiles, Apparel & Luxury Goods) | 1.6 | 1.5 |
Macquarie Mexican (REIT) (Mexico, Real Estate Investment Trusts) | 1.5 | 1.4 |
Advantech Co. Ltd. (Taiwan, Technology Hardware, Storage & Peripherals) | 1.4 | 0.7 |
| 8.8 | |
Top Five Market Sectors as of October 31, 2015 |
| % of fund's
net assets | % of fund's net assets
6 months ago |
Financials | 18.1 | 17.2 |
Industrials | 17.0 | 17.2 |
Information Technology | 15.4 | 15.9 |
Consumer Discretionary | 14.6 | 15.3 |
Materials | 10.2 | 10.1 |
Top Five Countries as of October 31, 2015 |
(excluding cash equivalents) | % of fund's
net assets | % of fund's net assets
6 months ago |
Korea (South) | 13.3 | 13.7 |
India | 13.0 | 12.7 |
Cayman Islands | 11.4 | 12.0 |
Taiwan | 9.6 | 8.2 |
China | 6.3 | 5.5 |
Percentages are adjusted for the effect of open futures contracts, if applicable. |
Annual Report
Fidelity Emerging Markets Discovery Fund
Investments October 31, 2015
Showing Percentage of Net Assets
Common Stocks - 96.3% |
| Shares | | Value |
Bangladesh - 0.4% |
BRAC Bank Ltd. | 449,466 | | $ 268,010 |
Bermuda - 2.5% |
Aquarius Platinum Ltd. (Australia) (a) | 2,009,820 | | 348,562 |
China Resource Gas Group Ltd. | 58,000 | | 159,097 |
Digital China Holdings Ltd. (H Shares) | 160,000 | | 163,238 |
PAX Global Technology Ltd. | 386,000 | | 504,757 |
Shangri-La Asia Ltd. | 660,000 | | 604,010 |
TOTAL BERMUDA | | 1,779,664 |
Brazil - 3.8% |
Companhia de Saneamento de Minas Gerais | 50,290 | | 169,522 |
Cosan SA Industria e Comercio | 64,720 | | 414,679 |
Direcional Engenharia SA | 219,000 | | 201,024 |
Fibria Celulose SA | 48,200 | | 657,906 |
FPC Par Corretora de Seguros | 96,200 | | 269,152 |
Minerva SA (a) | 129,800 | | 429,464 |
QGEP Participacoes SA (a) | 152,100 | | 235,059 |
Smiles SA | 44,100 | | 344,196 |
TOTAL BRAZIL | | 2,721,002 |
British Virgin Islands - 0.3% |
Dolphin Capital Investors Ltd. (a) | 918,400 | | 245,996 |
Canada - 1.4% |
Pan American Silver Corp. | 54,500 | | 412,565 |
Torex Gold Resources, Inc. (a) | 612,300 | | 580,645 |
TOTAL CANADA | | 993,210 |
Cayman Islands - 11.4% |
58.com, Inc. ADR (a)(d) | 15,100 | | 792,599 |
Casetek Holdings | 51,000 | | 224,642 |
China Cord Blood Corp. (a) | 97,900 | | 623,623 |
Cosmo Lady (China) Holdings Co. Ltd. | 755,000 | | 749,853 |
E-House China Holdings Ltd. ADR | 47,500 | | 294,500 |
ENN Energy Holdings Ltd. | 26,000 | | 148,945 |
Eurasia Drilling Co. Ltd. GDR (Reg. S) | 20,000 | | 227,000 |
GCL-Poly Energy Holdings Ltd. (a) | 1,093,000 | | 225,758 |
Haitian International Holdings Ltd. | 295,000 | | 516,161 |
Ju Teng International Holdings Ltd. | 436,000 | | 238,442 |
Kingboard Laminates Holdings Ltd. | 608,500 | | 253,439 |
Kingsoft Corp. Ltd. | 81,000 | | 183,293 |
Lee's Pharmaceutical Holdings Ltd. | 374,000 | | 482,885 |
Pico Far East Holdings Ltd. | 2,320,000 | | 615,850 |
Common Stocks - continued |
| Shares | | Value |
Cayman Islands - continued |
Semiconductor Manufacturing International Corp. (a) | 2,182,000 | | $ 202,140 |
Sino Biopharmaceutical Ltd. | 436,000 | | 541,817 |
SITC International Holdings Co. Ltd. | 1,224,000 | | 628,266 |
Sunny Optical Technology Group Co. Ltd. | 114,000 | | 265,064 |
TPK Holding Co. Ltd. | 32,000 | | 79,840 |
Uni-President China Holdings Ltd. (d) | 1,005,000 | | 823,121 |
TOTAL CAYMAN ISLANDS | | 8,117,238 |
Chile - 5.4% |
Compania Cervecerias Unidas SA sponsored ADR | 21,500 | | 515,355 |
CorpBanca SA | 33,441,053 | | 306,823 |
Empresas CMPC SA | 241,277 | | 594,514 |
Inversiones La Construccion SA | 41,103 | | 467,167 |
Quinenco SA | 673,804 | | 1,334,844 |
Vina Concha y Toro SA | 371,890 | | 633,485 |
TOTAL CHILE | | 3,852,188 |
China - 6.3% |
BBMG Corp. (H Shares) | 847,000 | | 593,558 |
China Longyuan Power Grid Corp. Ltd. (H Shares) | 149,000 | | 136,223 |
China Machinery Engineering Co. (H Shares) | 522,000 | | 453,046 |
China Suntien Green Energy Corp. Ltd. (H Shares) (d) | 1,262,200 | | 225,041 |
Huangshan Tourism Development Co. Ltd. | 346,700 | | 593,413 |
Qingdao Haier Co. Ltd. | 520,686 | | 792,670 |
Tong Ren Tang Technologies Co. Ltd. (H Shares) | 381,000 | | 595,104 |
Zhengzhou Yutong Bus Co. Ltd. | 149,219 | | 513,955 |
Zhuzhou CSR Times Electric Co. Ltd. (H Shares) | 96,500 | | 624,687 |
TOTAL CHINA | | 4,527,697 |
Colombia - 0.3% |
Organizacion Terpel SA | 48,928 | | 180,714 |
Cyprus - 1.0% |
Global Ports Investment PLC GDR (Reg. S) | 159,800 | | 703,120 |
Egypt - 0.3% |
Citadel Capital Corp. (a) | 1,084,800 | | 248,570 |
Greece - 1.1% |
Public Power Corp. of Greece | 43,080 | | 248,234 |
Titan Cement Co. SA (Reg.) | 23,400 | | 513,350 |
TOTAL GREECE | | 761,584 |
Hong Kong - 4.4% |
BYD Electronic International Co. Ltd. (a) | 146,000 | | 95,415 |
Common Stocks - continued |
| Shares | | Value |
Hong Kong - continued |
China Resources Beer Holdings Co. Ltd. | 288,000 | | $ 543,793 |
Far East Horizon Ltd. | 899,000 | | 747,766 |
Techtronic Industries Co. Ltd. | 471,500 | | 1,723,647 |
TOTAL HONG KONG | | 3,110,621 |
India - 13.0% |
Adani Ports & Special Economic Zone (a) | 114,759 | | 518,147 |
Arvind Mills Ltd. (a) | 117,146 | | 495,403 |
Bank of Baroda (a) | 84,785 | | 206,426 |
Cadila Healthcare Ltd. (a) | 83,485 | | 531,725 |
Edelweiss Financial Services Ltd. | 827,000 | | 750,570 |
Exide Industries Ltd. (a) | 318,791 | | 727,266 |
Grasim Industries Ltd. | 13,786 | | 782,499 |
Iifl Holdings Ltd. (a) | 227,222 | | 665,608 |
Indraprastha Gas Ltd. (a) | 52,765 | | 393,709 |
JK Cement Ltd. | 42,409 | | 443,340 |
LIC Housing Finance Ltd. (a) | 50,882 | | 371,515 |
Mahindra Lifespace Developers Ltd. (a) | 67,363 | | 512,341 |
Mphasis BFL Ltd. | 51,793 | | 375,539 |
Petronet LNG Ltd. | 113,023 | | 334,966 |
Power Grid Corp. of India Ltd. | 196,095 | | 385,479 |
Redington India Ltd. (a) | 102,277 | | 185,879 |
Solar Industries India Ltd. (a) | 6,809 | | 349,950 |
The Jammu & Kashmir Bank Ltd. | 237,424 | | 301,325 |
Torrent Pharmaceuticals Ltd. | 25,387 | | 596,652 |
VST Industries Ltd. (a) | 13,967 | | 341,812 |
TOTAL INDIA | | 9,270,151 |
Indonesia - 1.0% |
Link Net Tbk PT (a) | 770,900 | | 241,570 |
PT Panin Life Tbk (a) | 31,241,600 | | 498,676 |
TOTAL INDONESIA | | 740,246 |
Israel - 0.5% |
Bezeq The Israel Telecommunication Corp. Ltd. | 162,160 | | 348,658 |
Korea (South) - 12.2% |
AMOREPACIFIC Group, Inc. | 3,016 | | 425,284 |
BGFretail Co. Ltd. | 1,501 | | 223,486 |
Binggrea Co. Ltd. | 3,814 | | 228,151 |
Com2uS Corp. | 2,384 | | 240,118 |
Crown Confectionery Co., Ltd. | 506 | | 259,699 |
Daewoo International Corp. | 20,479 | | 357,827 |
Common Stocks - continued |
| Shares | | Value |
Korea (South) - continued |
Devsisters Co. Ltd. (a) | 7,152 | | $ 193,870 |
DGB Financial Group Co. Ltd. | 73,214 | | 679,706 |
E-Mart Co. Ltd. | 2,833 | | 527,263 |
Fila Korea Ltd. | 12,688 | | 1,111,257 |
Hyundai Glovis Co. Ltd. | 4,198 | | 722,481 |
Hyundai Industrial Development & Construction Co. | 20,928 | | 844,071 |
Hyundai Wia Corp. | 5,867 | | 685,991 |
Koh Young Technology, Inc. | 6,128 | | 178,456 |
Korean Reinsurance Co. | 32,080 | | 382,115 |
Medy-Tox, Inc. | 1,659 | | 707,469 |
NCSOFT Corp. | 2,058 | | 341,567 |
Silicon Works Co. Ltd. | 7,719 | | 229,859 |
Sungshin Cement Manufacturing Co. Ltd. (a) | 40,501 | | 404,382 |
TOTAL KOREA (SOUTH) | | 8,743,052 |
Luxembourg - 0.0% |
Atento SA (a) | 3,500 | | 36,050 |
Malaysia - 1.4% |
Inari Amertron Bhd | 223,600 | | 185,345 |
Top Glove Corp. Bhd | 354,600 | | 783,209 |
TOTAL MALAYSIA | | 968,554 |
Mexico - 6.3% |
Grupo Aeroportuario del Pacifico SA de CV Series B | 88,400 | | 796,188 |
Grupo Aeroportuario Norte S.A.B. de CV | 106,300 | | 546,759 |
Grupo Comercial Chedraui S.A.B. de CV | 175,300 | | 485,005 |
Grupo GICSA SA de CV (a) | 222,000 | | 216,385 |
Industrias Penoles SA de CV | 44,180 | | 587,362 |
Macquarie Mexican (REIT) (d) | 775,572 | | 1,076,649 |
Megacable Holdings S.A.B. de CV unit | 116,200 | | 442,843 |
Promotora y Operadora de Infraestructura S.A.B. de CV (a) | 7,718 | | 96,773 |
Qualitas Controladora S.A.B. de CV (a) | 210,300 | | 262,019 |
TOTAL MEXICO | | 4,509,983 |
Nigeria - 0.3% |
Transnational Corp. of Nigeria PLC | 23,459,127 | | 213,318 |
Pakistan - 0.4% |
Habib Bank Ltd. | 152,000 | | 302,084 |
Panama - 0.7% |
Copa Holdings SA Class A | 10,200 | | 515,304 |
Common Stocks - continued |
| Shares | | Value |
Philippines - 1.5% |
Alliance Global Group, Inc. | 1,515,900 | | $ 588,967 |
Metro Pacific Investments Corp. | 4,315,000 | | 480,076 |
TOTAL PHILIPPINES | | 1,069,043 |
Poland - 1.2% |
Asseco Poland SA | 21,300 | | 314,896 |
Prime Car Management SA | 48,600 | | 521,799 |
TOTAL POLAND | | 836,695 |
Romania - 1.0% |
Banca Transilvania SA (a) | 492,829 | | 309,840 |
BRD-Groupe Societe Generale (a) | 135,947 | | 394,474 |
TOTAL ROMANIA | | 704,314 |
Russia - 0.7% |
E.ON Russia JSC (a) | 5,471,000 | | 260,277 |
Sistema JSFC sponsored GDR | 31,660 | | 220,037 |
TOTAL RUSSIA | | 480,314 |
Singapore - 0.3% |
First Resources Ltd. | 168,700 | | 225,985 |
South Africa - 1.7% |
Alexander Forbes Group Holding | 861,282 | | 542,697 |
Reunert Ltd. | 137,600 | | 670,948 |
TOTAL SOUTH AFRICA | | 1,213,645 |
Sri Lanka - 0.6% |
Hatton National Bank PLC | 273,700 | | 422,852 |
Taiwan - 9.6% |
ADLINK Technology, Inc. | 95,749 | | 258,359 |
Advantech Co. Ltd. | 138,000 | | 992,546 |
Chipbond Technology Corp. | 124,000 | | 177,225 |
Cleanaway Co. Ltd. | 114,000 | | 561,836 |
Cub Elecparts, Inc. | 52,892 | | 666,343 |
Elite Semiconductor Memory Technology, Inc. | 143,000 | | 128,839 |
eMemory Technology, Inc. | 22,000 | | 227,014 |
Everlight Electronics Co. Ltd. | 160,000 | | 243,709 |
FLEXium Interconnect, Inc. | 84,442 | | 237,213 |
Forhouse Corp. | 485,000 | | 191,968 |
Hermes Microvision, Inc. | 4,000 | | 154,628 |
Inventec Corp. | 440,000 | | 253,442 |
Lite-On Technology Corp. | 333,640 | | 347,360 |
Common Stocks - continued |
| Shares | | Value |
Taiwan - continued |
Powertech Technology, Inc. | 184,000 | | $ 408,070 |
Radiant Opto-Electronics Corp. | 88,000 | | 273,772 |
Sirtec International Co. Ltd. | 176,000 | | 217,391 |
St.Shine Optical Co. Ltd. | 27,000 | | 409,179 |
Synnex Technology International Corp. | 277,000 | | 293,083 |
Tong Hsing Electronics Industries Ltd. | 108,000 | | 274,449 |
Universal Cement Corp. | 368,840 | | 260,739 |
Vanguard International Semiconductor Corp. | 200,000 | | 258,432 |
TOTAL TAIWAN | | 6,835,597 |
Thailand - 1.1% |
Delta Electronics PCL (For. Reg.) | 116,300 | | 276,351 |
Thai Union Frozen Products PCL (For. Reg.) | 963,800 | | 478,836 |
TOTAL THAILAND | | 755,187 |
Turkey - 2.0% |
Aksa Akrilik Kimya Sanayii | 118,000 | | 433,080 |
Aselsan A/S | 137,000 | | 655,536 |
Tupras Turkiye Petrol Rafinelleri A/S (a) | 12,576 | | 332,151 |
TOTAL TURKEY | | 1,420,767 |
United Arab Emirates - 0.5% |
National Bank of Ras Al-Khaimah PSC (a) | 178,179 | | 325,020 |
United Kingdom - 1.0% |
Bank of Georgia Holdings PLC | 23,100 | | 712,219 |
United States of America - 0.3% |
First Cash Financial Services, Inc. (a) | 6,000 | | 228,900 |
Vietnam - 0.4% |
FTP Corp. | 142,600 | | 314,754 |
TOTAL COMMON STOCKS (Cost $75,444,283) |
68,702,306
|
Nonconvertible Preferred Stocks - 1.4% |
| | | |
Brazil - 0.3% |
Banco do Estado Rio Grande do Sul SA | 142,200 | | 220,865 |
Korea (South) - 1.1% |
LG Chemical Ltd. | 4,102 | | 774,220 |
TOTAL NONCONVERTIBLE PREFERRED STOCKS (Cost $1,119,425) |
995,085
|
Government Obligations - 0.0% |
| Principal Amount | | Value |
United States of America - 0.0% |
U.S. Treasury Bills, yield at date of purchase 0.01% 12/3/15
(Cost $20,000) | | $ 20,000 | | $ 20,000 |
Money Market Funds - 5.7% |
| Shares | | |
Fidelity Cash Central Fund, 0.18% (b) | 1,625,275 | | 1,625,275 |
Fidelity Securities Lending Cash Central Fund, 0.19% (b)(c) | 2,456,800 | | 2,456,800 |
TOTAL MONEY MARKET FUNDS (Cost $4,082,075) |
4,082,075
|
TOTAL INVESTMENT PORTFOLIO - 103.4% (Cost $80,665,783) | 73,799,466 |
NET OTHER ASSETS (LIABILITIES) - (3.4)% | (2,439,342) |
NET ASSETS - 100% | $ 71,360,124 |
Legend |
(a) Non-income producing |
(b) Affiliated fund that is generally available only to investment companies and other accounts managed by Fidelity Investments. The rate quoted is the annualized seven-day yield of the fund at period end. A complete unaudited listing of the fund's holdings as of its most recent quarter end is available upon request. In addition, each Fidelity Central Fund's financial statements, which are not covered by the Fund's Report of Independent Registered Public Accounting Firm, are available on the SEC's website or upon request. |
(c) Investment made with cash collateral received from securities on loan. |
(d) Security or a portion of the security is on loan at period end. |
Affiliated Central Funds |
Information regarding fiscal year to date income earned by the Fund from investments in Fidelity Central Funds is as follows: |
Fund | Income earned |
Fidelity Cash Central Fund | $ 5,002 |
Fidelity Securities Lending Cash Central Fund | 7,859 |
Total | $ 12,861 |
Other Information |
Categorizations in the Schedule of Investments are based on country or territory of incorporation. |
The following is a summary of the inputs used, as of October 31, 2015, involving the Fund's assets and liabilities carried at fair value. The inputs or methodology used for valuing securities may not be an indication of the risk associated with investing in those securities. For more information on valuation inputs, and their aggregation into the levels used in the tables below, please refer to the Investment Valuation section in the accompanying Notes to Financial Statements. |
Valuation Inputs at Reporting Date: |
Description | Total | Level 1 | Level 2 | Level 3 |
Investments in Securities: | | | | |
Equities: | | | | |
Consumer Discretionary | $ 10,367,560 | $ 4,065,448 | $ 5,509,442 | $ 792,670 |
Consumer Staples | 6,140,739 | 3,727,192 | 2,413,547 | - |
Energy | 1,768,896 | 1,208,889 | 560,007 | - |
Financials | 12,923,664 | 8,389,361 | 4,534,303 | - |
Health Care | 5,271,663 | 1,740,271 | 3,531,392 | - |
Industrials | 12,206,765 | 8,363,536 | 3,843,229 | - |
Information Technology | 11,002,761 | 7,848,101 | 3,154,660 | - |
Materials | 7,303,592 | 4,785,683 | 2,517,909 | - |
Telecommunication Services | 810,265 | 568,695 | 241,570 | - |
Utilities | 1,901,486 | 678,033 | 1,223,453 | - |
Government Obligations | 20,000 | - | 20,000 | - |
Money Market Funds | 4,082,075 | 4,082,075 | - | - |
Total Investments in Securities: | $ 73,799,466 | $ 45,457,284 | $ 27,549,512 | $ 792,670 |
The following is a summary of transfers between Level 1 and Level 2 for the period ended October 31, 2015. Transfers are assumed to have occurred at the beginning of the period, and are primarily attributable to the valuation techniques used for foreign equity securities, as discussed in the accompanying Notes to Financial Statements: |
Transfers | Total |
Level 1 to Level 2 | $ 0 |
Level 2 to Level 1 | $ 2,193,999 |
Valuation Inputs at Reporting Date: |
The following is a reconciliation of Investments in Securities for which Level 3 inputs were used in determining value: |
Investments in Securities: | |
Equities - Consumer Discretionary | |
Beginning Balance | $ - |
Net Realized Gain (Loss) on Investment Securities | 123,445 |
Net Unrealized Gain (Loss) on Investment Securities | 1,856 |
Cost of Purchases | 977,596 |
Proceeds of Sales | (310,227) |
Amortization/Accretion | - |
Transfers into Level 3 | - |
Transfers out of Level 3 | - |
Ending Balance | $ 792,670 |
The change in unrealized gain (loss) for the period attributable to Level 3 securities held at October 31, 2015 | $ 1,856 |
The information used in the above reconciliation represents fiscal year to date activity for any Investments in Securities identified as using Level 3 inputs at either the beginning or the end of the current fiscal period. Transfers in or out of Level 3 represent the beginning value of any Security or Instrument where a change in the pricing level occurred from the beginning to the end of the period. The cost of purchases and the proceeds of sales may include securities received or delivered through corporate actions or exchanges. Realized and unrealized gains (losses) disclosed in the reconciliation are included in Net Gain (Loss) on the Fund's Statement of Operations. |
See accompanying notes which are an integral part of the financial statements.
Annual Report
Fidelity Emerging Markets Discovery Fund
Statement of Assets and Liabilities
| | October 31, 2015 |
| | |
Assets | | |
Investment in securities, at value (including securities loaned of $2,338,259) - See accompanying schedule: Unaffiliated issuers (cost $76,583,708) | $ 69,717,391 | |
Fidelity Central Funds (cost $4,082,075) | 4,082,075 | |
Total Investments (cost $80,665,783) | | $ 73,799,466 |
Cash | | 103,696 |
Foreign currency held at value (cost $7,645) | | 7,480 |
Receivable for investments sold | | 301,197 |
Receivable for fund shares sold | | 78,842 |
Dividends receivable | | 12,866 |
Distributions receivable from Fidelity Central Funds | | 868 |
Prepaid expenses | | 218 |
Receivable from investment adviser for expense reductions | | 33,319 |
Other receivables | | 9,766 |
Total assets | | 74,347,718 |
| | |
Liabilities | | |
Payable for investments purchased | $ 295,566 | |
Payable for fund shares redeemed | 73,113 | |
Accrued management fee | 50,866 | |
Distribution and service plan fees payable | 3,218 | |
Other affiliated payables | 16,907 | |
Other payables and accrued expenses | 91,124 | |
Collateral on securities loaned, at value | 2,456,800 | |
Total liabilities | | 2,987,594 |
| | |
Net Assets | | $ 71,360,124 |
Net Assets consist of: | | |
Paid in capital | | $ 80,045,129 |
Undistributed net investment income | | 413,597 |
Accumulated undistributed net realized gain (loss) on investments and foreign currency transactions | | (2,212,898) |
Net unrealized appreciation (depreciation) on investments and assets and liabilities in foreign currencies | | (6,885,704) |
Net Assets | | $ 71,360,124 |
See accompanying notes which are an integral part of the financial statements.
Annual Report
Fidelity Emerging Markets Discovery Fund
Financial Statements - continued
Statement of Assets and Liabilities - continued
| | October 31, 2015 |
Calculation of Maximum Offering Price | | |
Class A: | | |
Net Asset Value and redemption price per share ($4,660,013 ÷ 426,752 shares) | | $ 10.92 |
| | |
Maximum offering price per share (100/94.25 of $10.92) | | $ 11.59 |
Class T: | | |
Net Asset Value and redemption price per share ($2,015,001 ÷ 185,561 shares) | | $ 10.86 |
| | |
Maximum offering price per share (100/96.50 of $10.86) | | $ 11.25 |
Class C: | | |
Net Asset Value and offering price per share ($1,674,587 ÷ 156,693 shares)A | | $ 10.69 |
| | |
Emerging Markets Discovery: | | |
Net Asset Value, offering price and redemption price per share ($61,600,864 ÷ 5,608,316 shares) | | $ 10.98 |
| | |
Class I: | | |
Net Asset Value, offering price and redemption price per share ($1,409,659 ÷ 127,965 shares) | | $ 11.02 |
A Redemption price per share is equal to net asset value less any applicable contingent deferred sales charge.
See accompanying notes which are an integral part of the financial statements.
Annual Report
Statement of Operations
| Year ended October 31, 2015 |
| | |
Investment Income | | |
Dividends | | $ 1,741,878 |
Special dividends | | 415,817 |
Interest | | 4 |
Income from Fidelity Central Funds | | 12,861 |
Income before foreign taxes withheld | | 2,170,560 |
Less foreign taxes withheld | | (263,796) |
Total income | | 1,906,764 |
| | |
Expenses | | |
Management fee | $ 661,948 | |
Transfer agent fees | 178,413 | |
Distribution and service plan fees | 38,098 | |
Accounting and security lending fees | 40,604 | |
Custodian fees and expenses | 176,611 | |
Independent trustees' compensation | 337 | |
Registration fees | 70,131 | |
Audit | 90,650 | |
Legal | 210 | |
Miscellaneous | 897 | |
Total expenses before reductions | 1,257,899 | |
Expense reductions | (100,295) | 1,157,604 |
Net investment income (loss) | | 749,160 |
Realized and Unrealized Gain (Loss) | | |
Net realized gain (loss) on: | | |
Investment securities: | | |
Unaffiliated issuers (net of foreign taxes of $311,960) | (1,427,654) | |
Foreign currency transactions | (123,177) | |
Futures contracts | (381,269) | |
Total net realized gain (loss) | | (1,932,100) |
Change in net unrealized appreciation (depreciation) on: Investment securities (net of decrease in deferred foreign taxes of $258,529) | (8,018,876) | |
Assets and liabilities in foreign currencies | 16,343 | |
Total change in net unrealized appreciation (depreciation) | | (8,002,533) |
Net gain (loss) | | (9,934,633) |
Net increase (decrease) in net assets resulting from operations | | $ (9,185,473) |
See accompanying notes which are an integral part of the financial statements.
Annual Report
Fidelity Emerging Markets Discovery Fund
Financial Statements - continued
Statement of Changes in Net Assets
| Year ended
October 31,
2015 | Year ended
October 31,
2014 |
Increase (Decrease) in Net Assets | | |
Operations | | |
Net investment income (loss) | $ 749,160 | $ 451,642 |
Net realized gain (loss) | (1,932,100) | (250,198) |
Change in net unrealized appreciation (depreciation) | (8,002,533) | (701,823) |
Net increase (decrease) in net assets resulting from operations | (9,185,473) | (500,379) |
Distributions to shareholders from net investment income | - | (676,480) |
Distributions to shareholders from net realized gain | - | (2,520,609) |
Total distributions | - | (3,197,089) |
Share transactions - net increase (decrease) | (6,487,831) | (16,216,808) |
Redemption fees | 32,392 | 46,780 |
Total increase (decrease) in net assets | (15,640,912) | (19,867,496) |
| | |
Net Assets | | |
Beginning of period | 87,001,036 | 106,868,532 |
End of period (including undistributed net investment income of $413,597 and undistributed net investment income of $174, respectively) | $ 71,360,124 | $ 87,001,036 |
See accompanying notes which are an integral part of the financial statements.
Annual Report
Financial Highlights - Fidelity Emerging Markets Discovery Fund Class A
Years ended October 31, | 2015 | 2014 | 2013 | 2012 F |
Selected Per-Share Data | | | | |
Net asset value, beginning of period | $ 12.17 | $ 12.49 | $ 11.89 | $ 10.00 |
Income from Investment Operations | | | | |
Net investment income (loss) C | .09 J | .04 | .08 | .12 |
Net realized and unrealized gain (loss) | (1.34) | (.01) | .75 | 1.76 |
Total from investment operations | (1.25) | .03 | .83 | 1.88 |
Distributions from net investment income | - | (.06) | (.04) | (.01) |
Distributions from net realized gain | - | (.30) | (.20) | - |
Total distributions | - | (.36) | (.25)I | (.01) |
Redemption fees added to paid in capitalC | -H | .01 | .02 | .02 |
Net asset value, end of period | $ 10.92 | $ 12.17 | $ 12.49 | $ 11.89 |
Total ReturnA, B | (10.27)% | .31% | 7.20% | 19.00% |
Ratios to Average Net AssetsD, G | | | | |
Expenses before reductions | 1.88% | 1.82% | 1.87% | 3.49% |
Expenses net of fee waivers, if any | 1.70% | 1.70% | 1.70% | 1.70% |
Expenses net of all reductions | 1.69% | 1.70% | 1.64% | 1.64% |
Net investment income (loss) | .76% J | .29% | .62% | 1.16% |
Supplemental Data | | | | |
Net assets, end of period (000 omitted) | $ 4,660 | $ 4,362 | $ 5,065 | $ 1,671 |
Portfolio turnover rateE | 103% | 148% | 179% | 83% |
A Total returns would have been lower if certain expenses had not been reduced during the applicable periods shown.
B Total returns do not include the effect of the sales charges.
C Calculated based on average shares outstanding during the period.
D Fees and expenses of any underlying Fidelity Central Funds are not included in the Fund's expense ratio. The Fund indirectly bears its proportionate share of the expenses of any underlying Fidelity Central Funds.
E Amount does not include the portfolio activity of any underlying Fidelity Central Funds.
F For the period November 1, 2011 (commencement of operations) to October 31, 2012.
G Expense ratios reflect operating expenses of the class. Expenses before reductions do not reflect amounts reimbursed by the investment adviser or reductions from brokerage service arrangements or reductions from other expense offset arrangements and do not represent the amount paid by the class during periods when reimbursements or reductions occur. Expense ratios before reductions for start-up periods may not be representative of longer-term operating periods. Expenses net of fee waivers reflect expenses after reimbursement by the investment adviser but prior to reductions from brokerage service arrangements or other expense offset arrangements. Expenses net of all reductions represent the net expenses paid by the class.
H Amount represents less than $.005 per share.
I Total distributions of $.25 per share is comprised of distributions from net investment income of $.044 and distributions from net realized gain of $.203 per share.
J Investment income per share reflects a large, non-recurring dividend which amounted to $.06 per share. Excluding this non-recurring dividend, the ratio of net investment income (loss) to average net assets would have been .22%.
See accompanying notes which are an integral part of the financial statements.
Annual Report
Financial Highlights - Fidelity Emerging Markets Discovery Fund Class T
Years ended October 31, | 2015 | 2014 | 2013 | 2012 F |
Selected Per-Share Data | | | | |
Net asset value, beginning of period | $ 12.13 | $ 12.44 | $ 11.87 | $ 10.00 |
Income from Investment Operations | | | | |
Net investment income (loss) C | .06 J | -H | .05 | .10 |
Net realized and unrealized gain (loss) | (1.33) | -H | .74 | 1.75 |
Total from investment operations | (1.27) | -H | .79 | 1.85 |
Distributions from net investment income | �� - | (.02) | (.03) | -H |
Distributions from net realized gain | - | (.30) | (.20) | - |
Total distributions | - | (.32) | (.24)I | -H |
Redemption fees added to paid in capitalC | -H | .01 | .02 | .02 |
Net asset value, end of period | $ 10.86 | $ 12.13 | $ 12.44 | $ 11.87 |
Total ReturnA, B | (10.47)% | .05% | 6.87% | 18.75% |
Ratios to Average Net AssetsD, G | | | | |
Expenses before reductions | 2.16% | 2.10% | 2.19% | 3.77% |
Expenses net of fee waivers, if any | 1.95% | 1.95% | 1.95% | 1.95% |
Expenses net of all reductions | 1.94% | 1.95% | 1.89% | 1.89% |
Net investment income (loss) | .51% J | .04% | .37% | .91% |
Supplemental Data | | | | |
Net assets, end of period (000 omitted) | $ 2,015 | $ 2,031 | $ 1,914 | $ 1,700 |
Portfolio turnover rateE | 103% | 148% | 179% | 83% |
A Total returns would have been lower if certain expenses had not been reduced during the applicable periods shown.
B Total returns do not include the effect of the sales charges.
C Calculated based on average shares outstanding during the period.
D Fees and expenses of any underlying Fidelity Central Funds are not included in the Fund's expense ratio. The Fund indirectly bears its proportionate share of the expenses of any underlying Fidelity Central Funds.
E Amount does not include the portfolio activity of any underlying Fidelity Central Funds.
F For the period November 1, 2011 (commencement of operations) to October 31, 2012.
G Expense ratios reflect operating expenses of the class. Expenses before reductions do not reflect amounts reimbursed by the investment adviser or reductions from brokerage service arrangements or reductions from other expense offset arrangements and do not represent the amount paid by the class during periods when reimbursements or reductions occur. Expense ratios before reductions for start-up periods may not be representative of longer-term operating periods. Expenses net of fee waivers reflect expenses after reimbursement by the investment adviser but prior to reductions from brokerage service arrangements or other expense offset arrangements. Expenses net of all reductions represent the net expenses paid by the class.
H Amount represents less than $.005 per share.
I Total distributions of $.24 per share is comprised of distributions from net investment income of $.034 and distributions from net realized gain of $.203 per share.
J Investment income per share reflects a large, non-recurring dividend which amounted to $.06 per share. Excluding this non-recurring dividend, the ratio of net investment income (loss) to average net assets would have been (.03)%.
See accompanying notes which are an integral part of the financial statements.
Annual Report
Financial Highlights - Fidelity Emerging Markets Discovery Fund Class C
Years ended October 31, | 2015 | 2014 | 2013 | 2012 G |
Selected Per-Share Data | | | | |
Net asset value, beginning of period | $ 12.00 | $ 12.35 | $ 11.82 | $ 10.00 |
Income from Investment Operations | | | | |
Net investment income (loss) C | - F,I | (.06) | (.02) | .04 |
Net realized and unrealized gain (loss) | (1.31) | -I | .74 | 1.76 |
Total from investment operations | (1.31) | (.06) | .72 | 1.80 |
Distributions from net investment income | - | - | (.01) | - |
Distributions from net realized gain | - | (.30) | (.20) | - |
Total distributions | - | (.30) | (.21) | - |
Redemption fees added to paid in capitalC | - I | .01 | .02 | .02 |
Net asset value, end of period | $ 10.69 | $ 12.00 | $ 12.35 | $ 11.82 |
Total ReturnA, B | (10.92)% | (.42)% | 6.32% | 18.20% |
Ratios to Average Net AssetsD, H | | | | |
Expenses before reductions | 2.64% | 2.58% | 2.70% | 4.32% |
Expenses net of fee waivers, if any | 2.45% | 2.45% | 2.45% | 2.45% |
Expenses net of all reductions | 2.44% | 2.45% | 2.39% | 2.39% |
Net investment income (loss) | .01% F | (.46)% | (.13)% | .41% |
Supplemental Data | | | | |
Net assets, end of period (000 omitted) | $ 1,675 | $ 1,750 | $ 2,082 | $ 1,474 |
Portfolio turnover rateE | 103% | 148% | 179% | 83% |
A Total returns would have been lower if certain expenses had not been reduced during the applicable periods shown.
B Total returns do not include the effect of the contingent deferred sales charge.
C Calculated based on average shares outstanding during the period.
D Fees and expenses of any underlying Fidelity Central Funds are not included in the Fund's expense ratio. The Fund indirectly bears its proportionate share of the expenses of any underlying Fidelity Central Funds.
E Amount does not include the portfolio activity of any underlying Fidelity Central Funds.
F Investment income per share reflects a large, non-recurring dividend which amounted to $.06 per share. Excluding this non-recurring dividend, the ratio of net investment income (loss) to average net assets would have been (.52)%.
G For the period November 1, 2011 (commencement of operations) to October 31, 2012.
H Expense ratios reflect operating expenses of the class. Expenses before reductions do not reflect amounts reimbursed by the investment adviser or reductions from brokerage service arrangements or reductions from other expense offset arrangements and do not represent the amount paid by the class during periods when reimbursements or reductions occur. Expense ratios before reductions for start-up periods may not be representative of longer-term operating periods. Expenses net of fee waivers reflect expenses after reimbursement by the investment adviser but prior to reductions from brokerage service arrangements or other expense offset arrangements. Expenses net of all reductions represent the net expenses paid by the class.
I Amount represents less than $.005 per share.
See accompanying notes which are an integral part of the financial statements.
Annual Report
Financial Highlights - Fidelity Emerging Markets Discovery Fund
Years ended October 31, | 2015 | 2014 | 2013 | 2012 F |
Selected Per-Share Data | | | | |
Net asset value, beginning of period | $ 12.21 | $ 12.52 | $ 11.92 | $ 10.00 |
Income from Investment Operations | | | | |
Net investment income (loss)B | .12 E | .07 | .11 | .15 |
Net realized and unrealized gain (loss) | (1.35) | -H | .74 | 1.76 |
Total from investment operations | (1.23) | .07 | .85 | 1.91 |
Distributions from net investment income | - | (.09) | (.07) | (.01) |
Distributions from net realized gain | - | (.30) | (.20) | - |
Total distributions | - | (.39) | (.27) | (.01) |
Redemption fees added to paid in capitalB | -H | .01 | .02 | .02 |
Net asset value, end of period | $ 10.98 | $ 12.21 | $ 12.52 | $ 11.92 |
Total ReturnA | (10.07)% | .61% | 7.37% | 19.35% |
Ratios to Average Net AssetsC, G | | | | |
Expenses before reductions | 1.56% | 1.48% | 1.57% | 3.02% |
Expenses net of fee waivers, if any | 1.45% | 1.45% | 1.45% | 1.45% |
Expenses net of all reductions | 1.44% | 1.45% | 1.39% | 1.39% |
Net investment income (loss) | 1.01% E | .54% | .87% | 1.41% |
Supplemental Data | | | | |
Net assets, end of period (000 omitted) | $ 61,601 | $ 78,377 | $ 96,731 | $ 39,135 |
Portfolio turnover rateD | 103% | 148% | 179% | 83% |
A Total returns would have been lower if certain expenses had not been reduced during the applicable periods shown.
B Calculated based on average shares outstanding during the period.
C Fees and expenses of any underlying Fidelity Central Funds are not included in the Fund's expense ratio. The Fund indirectly bears its proportionate share of the expenses of any underlying Fidelity Central Funds.
D Amount does not include the portfolio activity of any underlying Fidelity Central Funds.
E Investment income per share reflects a large, non-recurring dividend which amounted to $.06 per share. Excluding this non-recurring dividend, the ratio of net investment income (loss) to average net assets would have been .48%.
F For the period November 1, 2011 (commencement of operations) to October 31, 2012.
G Expense ratios reflect operating expenses of the class. Expenses before reductions do not reflect amounts reimbursed by the investment adviser or reductions from brokerage service arrangements or reductions from other expense offset arrangements and do not represent the amount paid by the class during periods when reimbursements or reductions occur. Expense ratios before reductions for start-up periods may not be representative of longer-term operating periods. Expenses net of fee waivers reflect expenses after reimbursement by the investment adviser but prior to reductions from brokerage service arrangements or other expense offset arrangements. Expenses net of all reductions represent the net expenses paid by the class.
H Amount represents less than $.005 per share.
See accompanying notes which are an integral part of the financial statements.
Annual Report
Financial Highlights - Fidelity Emerging Markets Discovery Fund Class I
Years ended October 31, | 2015 | 2014 | 2013 | 2012 E |
Selected Per-Share Data | | | | |
Net asset value, beginning of period | $ 12.25 | $ 12.53 | $ 11.92 | $ 10.00 |
Income from Investment Operations | | | | |
Net investment income (loss) B | .12 H | .07 | .11 | .15 |
Net realized and unrealized gain (loss) | (1.35) | - G | .75 | 1.76 |
Total from investment operations | (1.23) | .07 | .86 | 1.91 |
Distributions from net investment income | - | (.06) | (.07) | (.01) |
Distributions from net realized gain | - | (.30) | (.20) | - |
Total distributions | - | (.36) | (.27) | (.01) |
Redemption fees added to paid in capitalB | - G | .01 | .02 | .02 |
Net asset value, end of period | $ 11.02 | $ 12.25 | $ 12.53 | $ 11.92 |
Total ReturnA | (10.04)% | .61% | 7.45% | 19.35% |
Ratios to Average Net AssetsC, F | | | | |
Expenses before reductions | 1.54% | 1.56% | 1.60% | 3.21% |
Expenses net of fee waivers, if any | 1.45% | 1.45% | 1.45% | 1.45% |
Expenses net of all reductions | 1.43% | 1.45% | 1.39% | 1.39% |
Net investment income (loss) | 1.01% H | .54% | .87% | 1.41% |
Supplemental Data | | | | |
Net assets, end of period (000 omitted) | $ 1,410 | $ 481 | $ 1,076 | $ 1,825 |
Portfolio turnover rateD | 103% | 148% | 179% | 83% |
A Total returns would have been lower if certain expenses had not been reduced during the applicable periods shown.
B Calculated based on average shares outstanding during the period.
C Fees and expenses of any underlying Fidelity Central Funds are not included in the Fund's expense ratio. The Fund indirectly bears its proportionate share of the expenses of any underlying Fidelity Central Funds.
D Amount does not include the portfolio activity of any underlying Fidelity Central Funds.
E For the period November 1, 2011 (commencement of operations) to October 31, 2012.
F Expense ratios reflect operating expenses of the class. Expenses before reductions do not reflect amounts reimbursed by the investment adviser or reductions from brokerage service arrangements or reductions from other expense offset arrangements and do not represent the amount paid by the class during periods when reimbursements or reductions occur. Expense ratios before reductions for start-up periods may not be representative of longer-term operating periods. Expenses net of fee waivers reflect expenses after reimbursement by the investment adviser but prior to reductions from brokerage service arrangements or other expense offset arrangements. Expenses net of all reductions represent the net expenses paid by the class.
G Amount represents less than $.005 per share.
H Investment income per share reflects a large, non-recurring dividend which amounted to $.06 per share. Excluding this non-recurring dividend, the ratio of net investment income (loss) to average net assets would have been .48%.
See accompanying notes which are an integral part of the financial statements.
Annual Report
For the period ended October 31, 2015
1. Organization.
Fidelity Emerging Markets Discovery Fund (the Fund) is a fund of Fidelity Investment Trust (the Trust) and is authorized to issue an unlimited number of shares. The Trust is registered under the Investment Company Act of 1940, as amended (the 1940 Act), as an open-end management investment company organized as a Massachusetts business trust. The Fund offers Class A, Class T, Class C, Emerging Markets Discovery and Class I (formerly Institutional Class) shares, each of which has equal rights as to assets and voting privileges. Each class has exclusive voting rights with respect to matters that affect that class. The Fund's investments in emerging markets can be subject to social, economic, regulatory, and political uncertainties and can be extremely volatile.
2. Investments in Fidelity Central Funds.
The Fund invests in Fidelity Central Funds, which are open-end investment companies generally available only to other investment companies and accounts managed by the investment adviser and its affiliates. The Fund's Schedule of Investments lists each of the Fidelity Central Funds held as of period end, if any, as an investment of the Fund, but does not include the underlying holdings of each Fidelity Central Fund. As an Investing Fund, the Fund indirectly bears its proportionate share of the expenses of the underlying Fidelity Central Funds.
The Money Market Central Funds seek preservation of capital and current income and are managed by Fidelity Investments Money Management, Inc. (FIMM), an affiliate of the investment adviser. Annualized expenses of the Money Market Central Funds as of their most recent shareholder report date are less than .005%.
A complete unaudited list of holdings for each Fidelity Central Fund is available upon request or at the Securities and Exchange Commission (the SEC) website at www.sec.gov. In addition, the financial statements of the Fidelity Central Funds, which are not covered by the Fund's Report of Independent Registered Public Accounting Firm, are available on the SEC website or upon request.
3. Significant Accounting Policies.
The financial statements have been prepared in conformity with accounting principles generally accepted in the United States of America (GAAP), which require management to make certain estimates and assumptions at the date of the financial statements. Actual results could differ from those estimates. Subsequent events, if any, through the date that the financial statements were issued have been evaluated in the preparation of
Annual Report
Notes to Financial Statements - continued
3. Significant Accounting Policies - continued
the financial statements. The following summarizes the significant accounting policies of the Fund:
Investment Valuation. Investments are valued as of 4:00 p.m. Eastern time on the last calendar day of the period. The Board of Trustees (the Board) has delegated the day to day responsibility for the valuation of the Fund's investments to the Fidelity Management & Research Company (FMR) Fair Value Committee (the Committee). In accordance with valuation policies and procedures approved by the Board, the Fund attempts to obtain prices from one or more third party pricing vendors or brokers to value its investments. When current market prices, quotations or currency exchange rates are not readily available or reliable, investments will be fair valued in good faith by the Committee, in accordance with procedures adopted by the Board. Factors used in determining fair value vary by investment type and may include market or investment specific events, changes in interest rates and credit quality. The frequency with which these procedures are used cannot be predicted and they may be utilized to a significant extent. The Committee oversees the Fund's valuation policies and procedures and reports to the Board on the Committee's activities and fair value determinations. The Board monitors the appropriateness of the procedures used in valuing the Fund's investments and ratifies the fair value determinations of the Committee.
The Fund categorizes the inputs to valuation techniques used to value its investments into a disclosure hierarchy consisting of three levels as shown below:
Level 1 - quoted prices in active markets for identical investments
Level 2 - other significant observable inputs (including quoted prices for similar investments, interest rates, prepayment speeds, etc.)
Level 3 - unobservable inputs (including the Fund's own assumptions based on the best information available)
Valuation techniques used to value the Fund's investments by major category are as follows:
Equity securities, including restricted securities, for which market quotations are readily available, are valued at the last reported sale price or official closing price as reported by a third party pricing vendor on the primary market or exchange on which they are traded and are categorized as Level 1 in the hierarchy. In the event there were no sales during the day or closing prices are not available, securities are valued at the last quoted bid price or may be valued using the last available price and are generally categorized as Level 2 in the hierarchy. For foreign equity securities, when market or security specific events arise, comparisons to the valuation of American Depositary Receipts (ADRs), futures contracts, Exchange-Traded Funds (ETFs) and certain indexes as well as quoted prices for similar securities may be used and would be categorized as Level 2 in the hierarchy. Utilizing these techniques may result in transfers between Level 1 and Level 2.
Annual Report
3. Significant Accounting Policies - continued
Investment Valuation - continued
For equity securities, including restricted securities, where observable inputs are limited, assumptions about market activity and risk are used and these securities may be categorized as Level 3 in the hierarchy.
Debt securities, including restricted securities, are valued based on evaluated prices received from third party pricing vendors or from brokers who make markets in such securities. U.S. government and government agency obligations are valued by pricing vendors who utilize matrix pricing which considers yield or price of bonds of comparable quality, coupon, maturity and type or by broker-supplied prices. When independent prices are unavailable or unreliable, debt securities may be valued utilizing pricing methodologies which consider similar factors that would be used by third party pricing vendors. Debt securities are generally categorized as Level 2 in the hierarchy but may be Level 3 depending on the circumstances.
Investments in open-end mutual funds, including the Fidelity Central Funds, are valued at their closing net asset value (NAV) each business day and are categorized as Level 1 in the hierarchy.
The following provides information on Level 3 securities held by the Fund that were valued at period end based on unobservable inputs. These amounts exclude valuations provided by a broker.
Asset Type | Fair Value at 10/31/15 | Valuation
Technique(s) | Unobservable
Input | Amount or Range/Weighted Average | Impact to
Valuation from an Increase
in InputA |
Equities | $ 792,670 | Adjusted transaction price | Proxy movement | 0.0% | Increase |
A Represents the expected directional change in the fair value of the Level 3 investments that would result from an increase in the corresponding input. A decrease to the unobservable input would have the opposite effect. Significant changes in these inputs could result in significantly higher or lower fair value measurements.
Changes in valuation techniques may result in transfers in or out of an assigned level within the disclosure hierarchy. The aggregate value of investments by input level as of October 31, 2015, including information on transfers between Levels 1 and 2, as well as a roll forward of Level 3 investments, is included at the end of the Fund's Schedule of Investments.
Annual Report
Notes to Financial Statements - continued
3. Significant Accounting Policies - continued
Foreign Currency. The Fund may use foreign currency contracts to facilitate transactions in foreign-denominated securities. Gains and losses from these transactions may arise from changes in the value of the foreign currency or if the counterparties do not perform under the contracts' terms.
Foreign-denominated assets, including investment securities, and liabilities are translated into U.S. dollars at the exchange rates at period end. Purchases and sales of investment securities, income and dividends received and expenses denominated in foreign currencies are translated into U.S. dollars at the exchange rate in effect on the transaction date.
The effects of exchange rate fluctuations on investments are included with the net realized and unrealized gain (loss) on investment securities. Other foreign currency transactions resulting in realized and unrealized gain (loss) are disclosed separately.
Investment Transactions and Income. For financial reporting purposes, the Fund's investment holdings and NAV include trades executed through the end of the last business day of the period. The NAV per share for processing shareholder transactions is calculated as of the close of business of the New York Stock Exchange (NYSE), normally 4:00 p.m. Eastern time and includes trades executed through the end of the prior business day. Gains and losses on securities sold are determined on the basis of identified cost. Dividend income is recorded on the ex-dividend date, except for certain dividends from foreign securities where the ex-dividend date may have passed, which are recorded as soon as the Fund is informed of the ex-dividend date. Non-cash dividends included in dividend income, if any, are recorded at the fair market value of the securities received. Income and capital gain distributions from Fidelity Central Funds, if any, are recorded on the ex-dividend date. Large, non-recurring dividends recognized by the Fund are presented separately on the Statement of Operations as "Special Dividends" and the impact of these dividends is presented in the Financial Highlights. Interest income is accrued as earned and includes coupon interest and amortization of premium and accretion of discount on debt securities as applicable. Investment income is recorded net of foreign taxes withheld where recovery of such taxes is uncertain.
Class Allocations and Expenses. Investment income, realized and unrealized capital gains and losses, common expenses of the Fund, and certain fund-level expense reductions, if any, are allocated daily on a pro-rata basis to each class based on the relative net assets of each class to the total net assets of the Fund. Each class differs with respect to transfer agent and distribution and service plan fees incurred. Certain expense reductions may also differ by class. For the reporting period, the allocated portion of income and expenses to each class as a percent of its average net assets may vary due to the timing of recording these transactions in relation to fluctuating net assets of the classes.
Annual Report
3. Significant Accounting Policies - continued
Class Allocations and Expenses - continued
Expenses directly attributable to a fund are charged to that fund. Expenses attributable to more than one fund are allocated among the respective funds on the basis of relative net assets or other appropriate methods. Expense estimates are accrued in the period to which they relate and adjustments are made when actual amounts are known.
Income Tax Information and Distributions to Shareholders. Each year, the Fund intends to qualify as a regulated investment company under Subchapter M of the Internal Revenue Code, including distributing substantially all of its taxable income and realized gains. As a result, no provision for U.S. Federal income taxes is required. As of October 31, 2015, the Fund did not have any unrecognized tax benefits in the financial statements; nor is the Fund aware of any tax positions for which it is reasonably possible that the total amounts of unrecognized tax benefits will significantly change in the next twelve months. The Fund files a U.S. federal tax return, in addition to state and local tax returns as required. The Fund's federal income tax returns are subject to examination by the Internal Revenue Service (IRS) for a period of three fiscal years after they are filed. State and local tax returns may be subject to examination for an additional fiscal year depending on the jurisdiction. Foreign taxes are provided for based on the Fund's understanding of the tax rules and rates that exist in the foreign markets in which it invests. The Fund is subject to a tax imposed on capital gains by certain countries in which it invests. An estimated deferred tax liability for net unrealized appreciation on the applicable securities is included in Other payables and accrued expenses on the Statement of Assets & Liabilities.
Distributions are declared and recorded on the ex-dividend date. Income dividends and capital gain distributions are declared separately for each class. Income and capital gain distributions are determined in accordance with income tax regulations, which may differ from GAAP.
Capital accounts within the financial statements are adjusted for permanent book-tax differences. These adjustments have no impact on net assets or the results of operations. Capital accounts are not adjusted for temporary book-tax differences which will reverse in a subsequent period.
Book-tax differences are primarily due to foreign currency transactions, futures transactions, certain foreign taxes, passive foreign investment companies (PFIC), capital loss carryforwards and losses deferred due to wash sales.
Annual Report
Notes to Financial Statements - continued
3. Significant Accounting Policies - continued
Income Tax Information and Distributions to Shareholders - continued
The federal tax cost of investment securities and unrealized appreciation (depreciation) as of period end were as follows:
Gross unrealized appreciation | $ 4,713,145 |
Gross unrealized depreciation | (12,060,381) |
Net unrealized appreciation (depreciation) on securities | $ (7,347,236) |
Tax Cost | $ 81,146,702 |
The tax-based components of distributable earnings as of period end were as follows:
Undistributed ordinary income | $ 413,626 |
Capital loss carryforward | $ (1,731,575) |
Net unrealized appreciation (depreciation) on securities and other investments | $ (7,349,233) |
Capital loss carryforwards are only available to offset future capital gains of the Fund to the extent provided by regulations and may be limited. Under the Regulated Investment Company Modernization Act of 2010 (the Act), the Fund is permitted to carry forward capital losses incurred in taxable years beginning after December 22, 2010 for an unlimited period and such capital losses are required to be used prior to any losses that expire. The capital loss carryforward information presented below, including any applicable limitation, is estimated as of fiscal period end and is subject to adjustment.
No expiration | |
Short-term | $ (1,731,575) |
The tax character of distributions paid was as follows:
| October 31, 2015 | October 31, 2014 |
Ordinary Income | $ - | $ 676,480 |
Long-term Capital Gains | - | 2,520,609 |
Total | $ - | $ 3,197,089 |
Short-Term Trading (Redemption) Fees. Shares held by investors in the Fund less than 90 days may have been subject to a redemption fee equal to 2.00% of the NAV of shares redeemed. All redemption fees, which reduce the proceeds of the shareholder redemption, are retained by the Fund and accounted for as an addition to paid in capital.
Annual Report
4. Derivative Instruments.
Risk Exposures and the Use of Derivative Instruments. The Fund's investment objective allows the Fund to enter into various types of derivative contracts, including futures contracts. Derivatives are investments whose value is primarily derived from underlying assets, indices or reference rates and may be transacted on an exchange or over-the-counter (OTC). Derivatives may involve a future commitment to buy or sell a specified asset based on specified terms, to exchange future cash flows at periodic intervals based on a notional principal amount, or for one party to make one or more payments upon the occurrence of specified events in exchange for periodic payments from the other party.
The Fund used derivatives to increase returns and to manage exposure to certain risks as defined below. The success of any strategy involving derivatives depends on analysis of numerous economic factors, and if the strategies for investment do not work as intended, the Fund may not achieve its objectives.
The Fund's use of derivatives increased or decreased its exposure to the following risk:
Equity Risk | Equity risk relates to the fluctuations in the value of financial instruments as a result of changes in market prices (other than those arising from interest rate risk or foreign exchange risk), whether caused by factors specific to an individual investment, its issuer, or all factors affecting all instruments traded in a market or market segment. |
The Fund is also exposed to additional risks from investing in derivatives, such as liquidity risk and counterparty credit risk. Liquidity risk is the risk that the Fund will be unable to close out the derivative in the open market in a timely manner. Counterparty credit risk is the risk that the counterparty will not be able to fulfill its obligation to the Fund. Counterparty credit risk related to exchange-traded futures contracts may be mitigated by the protection provided by the exchange on which they trade.
Investing in derivatives may involve greater risks than investing in the underlying assets directly and, to varying degrees, may involve risk of loss in excess of any initial investment and collateral received and amounts recognized in the Statement of Assets and Liabilities. In addition, there may be the risk that the change in value of the derivative contract does not correspond to the change in value of the underlying instrument.
Annual Report
Notes to Financial Statements - continued
4. Derivative Instruments - continued
Futures Contracts. A futures contract is an agreement between two parties to buy or sell a specified underlying instrument for a fixed price at a specified future date. The Fund used futures contracts to manage its exposure to the stock market.
Upon entering into a futures contract, a fund is required to deposit either cash or securities (initial margin) with a clearing broker in an amount equal to a certain percentage of the face value of the contract. Futures contracts are marked-to-market daily and subsequent daily payments (variation margin) are made or received by a fund depending on the daily fluctuations in the value of the futures contracts and are recorded as unrealized appreciation or (depreciation). This receivable and/or payable, if any, is included in daily variation margin for derivative instruments in the Statement of Assets and Liabilities. Realized gain or (loss) is recorded upon the expiration or closing of a futures contract.
Any open futures contracts at period end are presented in the Schedule of Investments under the caption "Futures Contracts." The underlying face amount at value reflects each contract's exposure to the underlying instrument or index at period end and is representative of volume of activity during the period. Securities deposited to meet initial margin requirements are identified in the Schedule of Investments.
During the period the Fund recognized net realized gain (loss) of $(381,269) related to its investment in futures contracts. This amount is included in the Statement of Operations.
5. Purchases and Sales of Investments.
Purchases and sales of securities, other than short-term securities, aggregated $77,304,743 and $80,761,199, respectively.
6. Fees and Other Transactions with Affiliates.
Management Fee. Fidelity Management & Research Company (the investment adviser) and its affiliates provide the Fund with investment management related services for which the Fund pays a monthly management fee. The management fee is the sum of an individual fund fee rate that is based on an annual rate of .60% of the Fund's average net assets and an annualized group fee rate that averaged .25% during the period. The group fee rate is based upon the average net assets of all the mutual funds advised by the investment adviser, including any mutual funds previously advised by the investment adviser that are currently advised by Fidelity SelectCo, LLC, an affiliate of the investment adviser. The group fee rate decreases as assets under management increase and increases as assets under management decrease. For the reporting period, the total annual management fee rate was .85% of the Fund's average net assets.
Annual Report
6. Fees and Other Transactions with Affiliates - continued
Distribution and Service Plan Fees. In accordance with Rule 12b-1 of the 1940 Act, the Fund has adopted separate Distribution and Service Plans for each class of shares. Certain classes pay Fidelity Distributors Corporation (FDC), an affiliate of the investment adviser, separate Distribution and Service Fees, each of which is based on an annual percentage of each class' average net assets. In addition, FDC may pay financial intermediaries for selling shares of the Fund and providing shareholder support services. For the period, the Distribution and Service Fee rates, total fees and amounts retained by FDC were as follows:
| Distribution
Fee | Service
Fee | Total Fees | Retained
by FDC |
Class A | -% | .25% | $ 11,767 | $ 550 |
Class T | .25% | .25% | 10,340 | 15 |
Class C | .75% | .25% | 15,991 | 5,122 |
| | | $ 38,098 | $ 5,687 |
Sales Load. FDC may receive a front-end sales charge of up to 5.75% for selling Class A shares and 3.50% for selling Class T shares, some of which is paid to financial intermediaries for selling shares of the Fund. Depending on the holding period, FDC may receive contingent deferred sales charges levied on Class A, Class T and Class C redemptions. The deferred sales charges are 1.00% for Class C shares, 1.00% for certain purchases of Class A shares and .25% for certain purchases of Class T shares.
For the period, sales charge amounts retained by FDC were as follows:
| Retained
by FDC |
Class A | $ 4,871 |
Class T | 2,151 |
Class CA | 233 |
| $ 7,255 |
A When Class C shares are initially sold, FDC pays commissions from its own resources to financial intermediaries through which the sales are made.
Transfer Agent Fees. Fidelity Investments Institutional Operations Company, Inc., (FIIOC), an affiliate of the investment adviser, is the transfer, dividend disbursing and shareholder servicing agent for each class of the Fund. FIIOC receives account fees and asset-based fees that vary according to the account size and type of account of the shareholders of the respective classes of the Fund. FIIOC pays for typesetting, printing and mailing of shareholder reports, except proxy statements.
Annual Report
Notes to Financial Statements - continued
6. Fees and Other Transactions with Affiliates - continued
Transfer Agent Fees - continued
For the period, transfer agent fees for each class were as follows:
| Amount | % of
Class-Level Average
Net Assets |
Class A | $ 14,269 | .30 |
Class T | 6,765 | .33 |
Class C | 4,800 | .30 |
Emerging Markets Discovery | 149,981 | .22 |
Class I | 2,598 | .25 |
| $ 178,413 | |
Accounting and Security Lending Fees. Fidelity Service Company, Inc. (FSC), an affiliate of the investment adviser, maintains the Fund's accounting records. The accounting fee is based on the level of average net assets for each month. Under a separate contract, FSC administers the security lending program. The security lending fee is based on the number and duration of lending transactions.
Brokerage Commissions. The Fund placed a portion of its portfolio transactions with brokerage firms which are affiliates of the investment adviser. Brokerage commissions are included in net realized gain (loss) and change in net unrealized appreciation (depreciation) in the Statement of Operations. The commissions paid to these affiliated firms were $608 for the period.
7. Committed Line of Credit.
The Fund participates with other funds managed by the investment adviser or an affiliate in a $4.25 billion credit facility (the "line of credit") to be utilized for temporary or emergency purposes to fund shareholder redemptions or for other short-term liquidity purposes. The Fund has agreed to pay commitment fees on its pro-rata portion of the line of credit, which amounted to $114 and is reflected in Miscellaneous expenses on the Statement of Operations. During the period, the Fund did not borrow on this line of credit.
Annual Report
8. Security Lending.
The Fund lends portfolio securities through a lending agent from time to time in order to earn additional income. For equity securities, a lending agent is used and may loan securities to certain qualified borrowers, including Fidelity Capital Markets (FCM), a broker-dealer affiliated with the Fund. On the settlement date of the loan, the Fund receives collateral (in the form of U.S. Treasury obligations, letters of credit and/or cash) against the loaned securities and maintains collateral in an amount not less than 100% of the market value of the loaned securities during the period of the loan. The market value of the loaned securities is determined at the close of business of the Fund and any additional required collateral is delivered to the Fund on the next business day. The Fund or borrower may terminate the loan at any time, and if the borrower defaults on its obligation to return the securities loaned because of insolvency or other reasons, the Fund may apply collateral received from the borrower against the obligation. The Fund may experience delays and costs in recovering the securities loaned. Any cash collateral received is invested in the Fidelity Securities Lending Cash Central Fund. The value of loaned securities and cash collateral at period end are disclosed on the Fund's Statement of Assets and Liabilities. Security lending income represents the income earned on investing cash collateral, less rebates paid to borrowers and any lending agent fees associated with the loan, plus any premium payments received for lending certain types of securities. Security lending income is presented in the Statement of Operations as a component of income from Fidelity Central Funds. Total security lending income during the period amounted to $7,859. During the period, there were no securities loaned to FCM.
9. Expense Reductions.
The investment adviser contractually agreed to reimburse each class to the extent annual operating expenses exceeded certain levels of average net assets as noted in the table below. This reimbursement will remain in place through December 31, 2016. Some expenses, for example interest expense, including commitment fees, are excluded from this reimbursement.
The following classes were in reimbursement during the period:
| Expense
Limitations | Reimbursement |
Class A | 1.70% | $ 8,649 |
Class T | 1.95% | 4,276 |
Class C | 2.45% | 2,999 |
Emerging Markets Discovery | 1.45% | 72,186 |
Class I | 1.45% | 950 |
| | $ 89,060 |
Annual Report
Notes to Financial Statements - continued
9. Expense Reductions - continued
Commissions paid to certain brokers with whom the investment adviser, or its affiliates, places trades on behalf of the Fund include an amount in addition to trade execution, which may be rebated back to the Fund to offset certain expenses. This amount totaled $8,674 for the period.
In addition, during the period the investment adviser reimbursed and/or waived a portion of fund-level operating expenses in the amount of $334 and a portion of class-level operating expenses as follows:
| Amount |
Class A | $ 36 |
Class T | 4 |
Class C | 16 |
Emerging Markets Discovery | 2,141 |
Class I | 30 |
| $ 2,227 |
10. Distributions to Shareholders.
Distributions to shareholders of each class were as follows:
Years ended October 31, | 2015 | 2014 |
From net investment income | | |
Class A | $ - | $ 23,688 |
Class T | - | 2,475 |
Emerging Markets Discovery | - | 646,254 |
Class I | - | 4,063 |
Total | $ - | $ 676,480 |
From net realized gain | | |
Class A | $ - | $ 122,525 |
Class T | - | 43,668 |
Class C | - | 51,356 |
Emerging Markets Discovery | - | 2,280,897 |
Class I | - | 22,163 |
Total | $ - | $ 2,520,609 |
Annual Report
11. Share Transactions.
Share transactions for each class were as follows and may contain automatic conversions between classes or exchanges between funds:
| Shares | Dollars |
Years ended October 31, | 2015 | 2014 | 2015 | 2014 |
Class A | | | | |
Shares sold | 161,641 | 147,354 | $ 1,908,467 | $ 1,789,001 |
Reinvestment of distributions | - | 10,958 | - | 133,251 |
Shares redeemed | (93,262) | (205,580) | (1,088,220) | (2,490,439) |
Net increase (decrease) | 68,379 | (47,268) | $ 820,247 | $ (568,187) |
Class T | | | | |
Shares sold | 59,344 | 52,146 | $ 694,558 | $ 631,489 |
Reinvestment of distributions | - | 3,566 | - | 43,325 |
Shares redeemed | (41,200) | (42,178) | (472,328) | (507,088) |
Net increase (decrease) | 18,144 | 13,534 | $ 222,230 | $ 167,726 |
Class C | | | | |
Shares sold | 68,780 | 92,257 | $ 796,943 | $ 1,143,008 |
Reinvestment of distributions | - | 4,241 | - | 51,185 |
Shares redeemed | (57,921) | (119,225) | (667,642) | (1,424,170) |
Net increase (decrease) | 10,859 | (22,727) | $ 129,301 | $ (229,977) |
Emerging Markets Discovery | | | | |
Shares sold | 2,311,392 | 2,185,123 | $ 27,313,497 | $ 26,469,903 |
Reinvestment of distributions | - | 205,996 | - | 2,506,974 |
Shares redeemed | (3,121,418) | (3,696,612) | (36,074,220) | (44,026,941) |
Net increase (decrease) | (810,026) | (1,305,493) | $ (8,760,723) | $ (15,050,064) |
Class I | | | | |
Shares sold | 209,924 | 25,831 | $ 2,474,235 | $ 324,477 |
Reinvestment of distributions | - | 824 | - | 10,052 |
Shares redeemed | (121,211) | (73,327) | (1,373,121) | (870,835) |
Net increase (decrease) | 88,713 | (46,672) | $ 1,101,114 | $ (536,306) |
12. Other.
The Fund's organizational documents provide former and current trustees and officers with a limited indemnification against liabilities arising in connection with the performance of their duties to the Fund. In the normal course of business, the Fund may also enter into contracts that provide general indemnifications. The Fund's maximum exposure under these arrangements is unknown as this would be dependent on future claims that may be made against the Fund. The risk of material loss from such claims is considered remote.
Annual Report
To the Trustees of Fidelity Investment Trust and the Shareholders of Fidelity Emerging Markets Discovery Fund:
In our opinion, the accompanying statement of assets and liabilities, including the schedule of investments, and the related statements of operations and of changes in net assets and the financial highlights present fairly, in all material respects, the financial position of Fidelity Emerging Markets Discovery Fund (a fund of Fidelity Investment Trust) at October 31, 2015, the results of its operations for the year then ended, the changes in its net assets for each of the two years in the period then ended and the financial highlights for each of the periods indicated, in conformity with accounting principles generally accepted in the United States of America. These financial statements and financial highlights (hereafter referred to as "financial statements") are the responsibility of the Fidelity Emerging Markets Discovery Fund's management. Our responsibility is to express an opinion on these financial statements based on our audits. We conducted our audits of these financial statements in accordance with the standards of the Public Company Accounting Oversight Board (United States). Those standards require that we plan and perform the audit to obtain reasonable assurance about whether the financial statements are free of material misstatement. An audit includes examining, on a test basis, evidence supporting the amounts and disclosures in the financial statements, assessing the accounting principles used and significant estimates made by management, and evaluating the overall financial statement presentation. We believe that our audits, which included confirmation of securities at October 31, 2015 by correspondence with the custodian and brokers, provide a reasonable basis for our opinion.
PricewaterhouseCoopers LLP
Boston, Massachusetts
December 18, 2015
Annual Report
The Trustees, Member of the Advisory Board, and officers of the trust and fund, as applicable, are listed below. The Board of Trustees governs the fund and is responsible for protecting the interests of shareholders. The Trustees are experienced executives who meet periodically throughout the year to oversee the fund's activities, review contractual arrangements with companies that provide services to the fund, oversee management of the risks associated with such activities and contractual arrangements, and review the fund's performance. Each of the Trustees oversees 170 funds.
The Trustees hold office without limit in time except that (a) any Trustee may resign; (b) any Trustee may be removed by written instrument, signed by at least two-thirds of the number of Trustees prior to such removal; (c) any Trustee who requests to be retired or who has become incapacitated by illness or injury may be retired by written instrument signed by a majority of the other Trustees; and (d) any Trustee may be removed at any special meeting of shareholders by a two-thirds vote of the outstanding voting securities of the trust. Each Trustee who is not an interested person (as defined in the 1940 Act) of the trust and the fund (Independent Trustee), shall retire not later than the last day of the calendar year in which his or her 75th birthday occurs. The Independent Trustees may waive this mandatory retirement age policy with respect to individual Trustees. The officers and Advisory Board Member hold office without limit in time, except that any officer and Advisory Board Member may resign or may be removed by a vote of a majority of the Trustees at any regular meeting or any special meeting of the Trustees. Except as indicated, each individual has held the office shown or other offices in the same company for the past five years.
Experience, Skills, Attributes, and Qualifications of the Fund's Trustees. The Governance and Nominating Committee has adopted a statement of policy that describes the experience, qualifications, attributes, and skills that are necessary and desirable for potential Independent Trustee candidates (Statement of Policy). The Board believes that each Trustee satisfied at the time he or she was initially elected or appointed a Trustee, and continues to satisfy, the standards contemplated by the Statement of Policy. The Governance and Nominating Committee also engages professional search firms to help identify potential Independent Trustee candidates who have the experience, qualifications, attributes, and skills consistent with the Statement of Policy. From time to time, additional criteria based on the composition and skills of the current Independent Trustees, as well as experience or skills that may be appropriate in light of future changes to board composition, business conditions, and regulatory or other developments, have also been considered by the professional search firms and the Governance and Nominating Committee. In addition, the Board takes into account the Trustees' commitment and participation in Board and committee meetings, as well as their leadership of standing and ad hoc committees throughout their tenure.
In determining that a particular Trustee was and continues to be qualified to serve as a Trustee, the Board has considered a variety of criteria, none of which, in isolation, was controlling. The Board believes that, collectively, the Trustees have balanced and diverse experience, qualifications, attributes, and skills, which allow the Board to operate effectively in governing the fund and protecting the interests of shareholders. Information about the specific experience, skills, attributes, and qualifications of each Trustee, which in each case led to the Board's conclusion that the Trustee should serve (or continue to serve) as a trustee of the fund, is provided below.
Annual Report
Trustees and Officers - continued
Board Structure and Oversight Function. James C. Curvey is an interested person (as defined in the 1940 Act) and currently serves as Chairman. The Trustees have determined that an interested Chairman is appropriate and benefits shareholders because an interested Chairman has a personal and professional stake in the quality and continuity of services provided to the fund. Independent Trustees exercise their informed business judgment to appoint an individual of their choosing to serve as Chairman, regardless of whether the Trustee happens to be independent or a member of management. The Independent Trustees have determined that they can act independently and effectively without having an Independent Trustee serve as Chairman and that a key structural component for assuring that they are in a position to do so is for the Independent Trustees to constitute a substantial majority for the Board. The Independent Trustees also regularly meet in executive session. Ned C. Lautenbach serves as Chairman of the Independent Trustees and as such (i) acts as a liaison between the Independent Trustees and management with respect to matters important to the Independent Trustees and (ii) with management prepares agendas for Board meetings.
Fidelity funds are overseen by different Boards of Trustees. The fund's Board oversees Fidelity's high income and certain equity funds, and other Boards oversee Fidelity's investment-grade bond, money market, asset allocation, and sector funds. The asset allocation funds may invest in Fidelity funds overseen by the fund's Board. The use of separate Boards, each with its own committee structure, allows the Trustees of each group of Fidelity funds to focus on the unique issues of the funds they oversee, including common research, investment, and operational issues. On occasion, the separate Boards establish joint committees to address issues of overlapping consequences for the Fidelity funds overseen by each Board.
The Trustees operate using a system of committees to facilitate the timely and efficient consideration of all matters of importance to the Trustees, the fund, and fund shareholders and to facilitate compliance with legal and regulatory requirements and oversight of the fund's activities and associated risks. The Board, acting through its committees, has charged FMR and its affiliates with (i) identifying events or circumstances the occurrence of which could have demonstrably adverse effects on the fund's business and/or reputation; (ii) implementing processes and controls to lessen the possibility that such events or circumstances occur or to mitigate the effects of such events or circumstances if they do occur; and (iii) creating and maintaining a system designed to evaluate continuously business and market conditions in order to facilitate the identification and implementation processes described in (i) and (ii) above. Because the day-to-day operations and activities of the fund are carried out by or through FMR, its affiliates and other service providers, the fund's exposure to risks is mitigated but not eliminated by the processes overseen by the Trustees. While each of the Board's committees has responsibility for overseeing different aspects of the fund's activities, oversight is exercised primarily through the Operations, Audit, and Compliance Committees. In addition, the Independent Trustees have worked with FMR to enhance the Board's oversight of investment and financial risks, legal and regulatory risks, technology risks, and operational risks, including the development of additional risk reporting to the Board. For example, a working group comprised of Independent Trustees and FMR has worked and continues to work to review the Fidelity funds' valuation-related activities, reporting and risk management. Appropriate personnel, including but not limited to the fund's Chief Compliance Officer (CCO), FMR's internal auditor, the independent accountants, the fund's Treasurer and portfolio management personnel, make periodic reports to the Board's committees, as appropriate, including an annual review of Fidelity's risk management program for the Fidelity funds. The responsibilities of each standing committee, including their oversight responsibilities, are described further under "Standing Committees of the Fund's Trustees."
Annual Report
The fund's Statement of Additional Information (SAI) includes more information about the Trustees. To request a free copy, call Fidelity at 1-877-208-0098.
Interested Trustees*:
Correspondence intended for each Trustee who is an interested person may be sent to Fidelity Investments, 245 Summer Street, Boston, Massachusetts 02210.
Name, Year of Birth; Principal Occupations and Other Relevant Experience+ |
James C. Curvey (1935) |
Year of Election or Appointment: 2007 Trustee Chairman of the Board of Trustees |
| Mr. Curvey also serves as Trustee of other Fidelity funds. Mr. Curvey is a Director of Fidelity Research & Analysis Co. (investment adviser firm, 2009-present), and Vice Chairman (2007-present) and Director of FMR LLC (diversified financial services company). In addition, Mr. Curvey serves as an Overseer for the Boston Symphony Orchestra and a member of the board of Artis-Naples, Naples, Florida, and as a Trustee for Brewster Academy, Wolfeboro, New Hampshire. Previously, Mr. Curvey served as a Director of Fidelity Investments Money Management, Inc. (investment adviser firm, 2009-2014) and a Director of FMR and FMR Co., Inc. (investment adviser firms, 2007-2014). |
Charles S. Morrison (1960) |
Year of Election or Appointment: 2014 Trustee |
| Mr. Morrison also serves as Trustee of other funds. He serves as a Director of Fidelity Investments Money Management, Inc. (FIMM) (investment adviser firm, 2014-present), Director of Fidelity SelectCo, LLC (investment adviser firm, 2014-present), President, Asset Management (2014-present), and is an employee of Fidelity Investments. Previously, Mr. Morrison served as Vice President of Fidelity's Fixed Income and Asset Allocation Funds (2012-2014), President, Fixed Income (2011-2014), Vice President of Fidelity's Money Market Funds (2005-2009), President, Money Market Group Leader of FMR (investment adviser firm, 2009), and Senior Vice President, Money Market Group of FMR (2004-2009). Mr. Morrison also served as Vice President of Fidelity's Bond Funds (2002-2005), certain Balanced Funds (2002-2005), and certain Asset Allocation Funds (2002-2007), and as Senior Vice President (2002-2005) of Fidelity's Bond Division. |
* Trustees have been determined to be "Interested Trustees" by virtue of, among other things, their affiliation with the trust or various entities under common control with FMR.
+ The information above includes each Trustee's principal occupation during the last five years and other information relating to the experience, attributes, and skills relevant to each Trustee's qualifications to serve as a Trustee, which led to the conclusion that each Trustee should serve as a Trustee for the fund.
Annual Report
Independent Trustees:
Correspondence intended for each Independent Trustee (that is, the Trustees other than the Interested Trustees) may be sent to Fidelity Investments, P.O. Box 55235, Boston, Massachusetts 02205-5235.
Name, Year of Birth; Principal Occupations and Other Relevant Experience+ |
Dennis J. Dirks (1948) |
Year of Election or Appointment: 2005 Trustee |
| Mr. Dirks also serves as Trustee of other Fidelity funds. Prior to his retirement in May 2003, Mr. Dirks was Chief Operating Officer and a member of the Board of The Depository Trust & Clearing Corporation (DTCC). He also served as President, Chief Operating Officer, and Board member of The Depository Trust Company (DTC) and President and Board member of the National Securities Clearing Corporation (NSCC). In addition, Mr. Dirks served as Chief Executive Officer and Board member of the Government Securities Clearing Corporation, Chief Executive Officer and Board member of the Mortgage-Backed Securities Clearing Corporation, as a Trustee and a member of the Finance Committee of Manhattan College (2005-2008), as a Trustee and a member of the Finance Committee of AHRC of Nassau County (2006-2008), and as a member of the Independent Directors Council (IDC) Governing Council (2010-2015). Mr. Dirks is a member of the Board of Directors for The Brookville Center for Children's Services, Inc. (2009-present). |
Alan J. Lacy (1953) |
Year of Election or Appointment: 2008 Trustee |
| Mr. Lacy also serves as Trustee of other Fidelity funds. Mr. Lacy serves as a member of the Board of Directors of Dave & Buster's Entertainment, Inc. (restaurant and entertainment complexes, 2010-present) and Bristol-Myers Squibb Company (global pharmaceuticals, 2008-present). In addition, Mr. Lacy served as Senior Adviser (2007-2014) of Oak Hill Capital Partners, L.P. (private equity) and also served as Chief Executive Officer (2000-2005) and Vice Chairman (2005-2006) of Sears Holdings Corporation and Sears, Roebuck and Co. (retail). Mr. Lacy is a member of the Board of Trustees of The National Parks Conservation Association (2006-present). Previously, Mr. Lacy served as Chairman of the Board of Trustees of the National Parks Conservation Association (2008-2011) and as a member of the Board of Directors for The Western Union Company (global money transfer, 2006-2011), The Hillman Companies, Inc. (hardware wholesalers, 2010-2014), and Earth Fare, Inc. (retail grocery, 2010-2014). |
Ned C. Lautenbach (1944) |
Year of Election or Appointment: 2000 Trustee Chairman of the Independent Trustees |
| Mr. Lautenbach also serves as Trustee of other Fidelity funds. Mr. Lautenbach currently serves as the Lead Director of the Eaton Corporation Board of Directors (diversified industrial, 1997-present). Mr. Lautenbach is Chairman of the Board of Directors of Artis-Naples in Naples, Florida (2012-present), a member of the Council on Foreign Relations (1994-present), and a member of the Board of Governors, State University System of Florida (2013-present). Previously, Mr. Lautenbach was a Partner/Advisory Partner at Clayton, Dubilier & Rice, LLC (private equity investment, 1998-2010), as well as a Director of Sony Corporation (2006-2007). |
Joseph Mauriello (1944) |
Year of Election or Appointment: 2008 Trustee |
| Mr. Mauriello also serves as Trustee of other Fidelity funds. Prior to his retirement in January 2006, Mr. Mauriello served in numerous senior management positions including Deputy Chairman and Chief Operating Officer (2004-2005), and Vice Chairman of Financial Services (2002-2004) of KPMG LLP US (professional services, 1965-2005). Mr. Mauriello currently serves as a member of the Board of Directors of XL Group plc. (global insurance and re-insurance, 2006-present) and the Independent Directors Council (IDC) Governing Council (2015-present). Previously, Mr. Mauriello served as a Director of the Hamilton Funds of the Bank of New York (2006-2007) and of Arcadia Resources Inc. (health care services and products, 2007-2012). |
Robert W. Selander (1950) |
Year of Election or Appointment: 2011 Trustee |
| Mr. Selander also serves as Trustee of other Fidelity funds. Mr. Selander serves as a Director of The Western Union Company (global money transfer, 2014-present). Previously, Mr. Selander served as a Member of the Advisory Board of other Fidelity funds (2011), and Executive Vice Chairman (2010), Chief Executive Officer (2009-2010), and President and Chief Executive Officer (1997-2009) of Mastercard, Inc. |
Cornelia M. Small (1944) |
Year of Election or Appointment: 2005 Trustee |
| Ms. Small also serves as Trustee of other Fidelity funds. Ms. Small is a member of the Board of Directors (2009-present) and Chair of the Investment Committee (2010-present) of the Teagle Foundation. Ms. Small also serves on the Investment Committee of the Berkshire Taconic Community Foundation (2008-present). Previously, Ms. Small served as Chairperson (2002-2008) and a member of the Investment Committee and Chairperson (2008-2012) and a member of the Board of Trustees of Smith College. In addition, Ms. Small served as Chief Investment Officer, Director of Global Equity Investments, and a member of the Board of Directors of Scudder, Stevens & Clark and Scudder Kemper Investments. |
William S. Stavropoulos (1939) |
Year of Election or Appointment: 2001 Trustee Vice Chairman of the Independent Trustees |
| Mr. Stavropoulos also serves as Trustee of other Fidelity funds. Mr. Stavropoulos serves as President and Founder of the Michigan Baseball Foundation, the Great Lakes Loons (2007-present). Mr. Stavropoulos is Chairman Emeritus of the Board of Directors of The Dow Chemical Company, where he previously served in numerous senior management positions, including President, CEO (1995-2000; 2002-2004), Chairman of the Executive Committee (2000-2006), and as a member of the Board of Directors (1990-2006). Currently, Mr. Stavropoulos is Chairman of the Board of Directors of Univar Inc. (global distributor of commodity and specialty chemicals), a Director of Teradata Corporation (data warehousing and technology solutions), and Maersk Inc. (industrial conglomerate), and a member of the Advisory Board for Metalmark Capital LLC (private equity investment, 2005-present). Mr. Stavropoulos is an operating advisor to Clayton, Dubilier & Rice, LLC (private equity investment). In addition, Mr. Stavropoulos is a member of the University of Notre Dame Advisory Council for the College of Science, a Trustee of the Rollin L. Gerstacker Foundation, and a Director of the Naples Philharmonic Center for the Arts. Previously, Mr. Stavropoulos served as a Director of Chemical Financial Corporation (bank holding company, 1993-2012) and Tyco International, Ltd. (multinational manufacturing and services, 2007-2012). |
David M. Thomas (1949) |
Year of Election or Appointment: 2008 Trustee |
| Mr. Thomas also serves as Trustee of other Fidelity funds. Mr. Thomas serves as Non-Executive Chairman of the Board of Directors of Fortune Brands Home and Security (home and security products, 2011-present), as a member of the Board of Directors (2004-present) and Presiding Director (2013-present) of Interpublic Group of Companies, Inc. (marketing communication), and as a member of the Board of Trustees of the University of Florida (2013-present). Previously, Mr. Thomas served as Executive Chairman (2005-2006) and Chairman and Chief Executive Officer (2000-2005) of IMS Health, Inc. (pharmaceutical and healthcare information solutions), and a Director of Fortune Brands, Inc. (consumer products, 2000-2011). |
+ The information above includes each Trustee's principal occupation during the last five years and other information relating to the experience, attributes, and skills relevant to each Trustee's qualifications to serve as a Trustee, which led to the conclusion that each Trustee should serve as a Trustee for the fund.
Advisory Board Member and Officers:
Correspondence intended for each officer and Peter S. Lynch may be sent to Fidelity Investments, 245 Summer Street, Boston, Massachusetts 02210. Officers appear below in alphabetical order.
Name, Year of Birth; Principal Occupation |
Peter S. Lynch (1944) |
Year of Election or Appointment: 2003 Member of the Advisory Board |
| Mr. Lynch also serves as Member of the Advisory Board of other Fidelity funds. Mr. Lynch is Vice Chairman and a Director of FMR (investment adviser firm) and FMR Co., Inc. (investment adviser firm). In addition, Mr. Lynch serves as a Trustee of Boston College and as the Chairman of the Inner-City Scholarship Fund. Previously, Mr. Lynch served on the Special Olympics International Board of Directors (1997-2006). |
Elizabeth Paige Baumann (1968) |
Year of Election or Appointment: 2012 Anti-Money Laundering (AML) Officer |
| Ms. Baumann also serves as AML Officer of other funds. She is Chief AML Officer of FMR LLC (diversified financial services company, 2012-present) and is an employee of Fidelity Investments. Previously, Ms. Baumann served as Vice President and Deputy Anti-Money Laundering Officer (2007-2012). |
Marc R. Bryant (1966) |
Year of Election or Appointment: 2015 Secretary and Chief Legal Officer (CLO) |
| Mr. Bryant also serves as Secretary and CLO of other funds. Mr. Bryant serves as CLO, Secretary, and Senior Vice President of Fidelity Management & Research Company (investment adviser firm, 2015-present) and FMR Co., Inc. (investment adviser firm, 2015-present); Secretary of Fidelity SelectCo, LLC (investment adviser firm, 2015-present) and Fidelity Investments Money Management, Inc. (investment adviser firm, 2015-present); and CLO of Fidelity Management & Research (Hong Kong) Limited (investment adviser firm, 2015-present). He is Senior Vice President and Deputy General Counsel of FMR LLC (diversified financial services company). Previously, Mr. Bryant served as Secretary and Chief Legal Officer of Fidelity Rutland Square Trust II (2010-2014) and Assistant Secretary of Fidelity's Fixed Income and Asset Allocation Funds (2013-2015). Prior to joining Fidelity Investments, Mr. Bryant served as a Senior Vice President and the Head of Global Retail Legal for AllianceBernstein L.P. (2006-2010), and as the General Counsel for ProFund Advisors LLC (2001-2006). |
William C. Coffey (1969) |
Year of Election or Appointment: 2009 Assistant Secretary |
| Mr. Coffey also serves as Assistant Secretary of other funds. He is Senior Vice President and Deputy General Counsel of FMR LLC (diversified financial services company, 2010-present), and is an employee of Fidelity Investments. Previously, Mr. Coffey served as Vice President and Associate General Counsel of FMR LLC (2005-2009). |
Timothy M. Cohen (1969) |
Year of Election or Appointment: 2014 Vice President of certain Equity Funds |
| Mr. Cohen also serves as Vice President of other funds. Mr. Cohen serves as Chief Compliance Officer of FMR Investment Management (U.K.) Limited (investment adviser firm, 2013-present) and is an employee of Fidelity Investments. Previously, Mr. Cohen served as a Director of FMR Investment Management (U.K.) Limited (2013-2015). |
Jonathan Davis (1968) |
Year of Election or Appointment: 2010 Assistant Treasurer |
| Mr. Davis also serves as Assistant Treasurer of other funds, and is an employee of Fidelity Investments. Previously, Mr. Davis served as Vice President and Associate General Counsel of FMR LLC (diversified financial services company, 2003-2010). |
Adrien E. Deberghes (1967) |
Year of Election or Appointment: 2008 Deputy Treasurer |
| Mr. Deberghes also serves as an officer of other funds. He is an employee of Fidelity Investments (2008-present). Prior to joining Fidelity Investments, Mr. Deberghes was Senior Vice President of Mutual Fund Administration at State Street Corporation (2007-2008), Senior Director of Mutual Fund Administration at Investors Bank & Trust (2005-2007), and Director of Finance for Dunkin' Brands (2000-2005). |
Stephanie J. Dorsey (1969) |
Year of Election or Appointment: 2010 Assistant Treasurer |
| Ms. Dorsey also serves as an officer of other funds. She is an employee of Fidelity Investments (2008-present) and has served in other fund officer roles. Prior to joining Fidelity Investments, Ms. Dorsey served as Treasurer (2004-2008) of the JPMorgan Mutual Funds and Vice President (2004-2008) of JPMorgan Chase Bank. |
Howard J. Galligan III (1966) |
Year of Election or Appointment: 2014 Chief Financial Officer |
| Mr. Galligan also serves as Chief Financial Officer of other funds. Mr. Galligan serves as President of Fidelity Pricing and Cash Management Services (FPCMS) (2014-present) and as a Director of Strategic Advisers, Inc. (investment adviser firm, 2008-present). Previously, Mr. Galligan served as Chief Administrative Officer of Asset Management (2011-2014) and Chief Operating Officer and Senior Vice President of Investment Support for Strategic Advisers, Inc. (2003-2011). |
Scott C. Goebel (1968) |
Year of Election or Appointment: 2015 Vice President |
| Mr. Goebel serves as Vice President of other funds and is an employee of Fidelity Investments (2001-present). Previously, Mr. Goebel served as Secretary of Fidelity SelectCo, LLC (investment adviser firm, 2013-2015), Fidelity Investments Money Management, Inc. (FIMM) (investment adviser firm, 2010-2015), and Fidelity Research and Analysis Company (FRAC) (investment adviser firm, 2010-2015); General Counsel, Secretary, and Senior Vice President of Fidelity Management & Research Company (investment adviser firm, 2008-2015) and FMR Co., Inc. (investment adviser firm, 2008-2015); Assistant Secretary of Fidelity Management & Research (Japan) Limited (investment adviser firm, 2008-2015) and FMR Investment Management (U.K.) Limited (investment adviser firm, 2008-2015); Chief Legal Officer (CLO) of Fidelity Management & Research (Hong Kong) Limited (investment adviser firm, 2008-2015); Secretary and CLO of certain Fidelity funds (2008-2015); Assistant Secretary of FIMM (2008-2010), FRAC (2008-2010), and certain funds (2007-2008); and as Vice President and Secretary of Fidelity Distributors Corporation (FDC) (2005-2007). |
Brian B. Hogan (1964) |
Year of Election or Appointment: 2009 Vice President |
| Mr. Hogan also serves as Trustee or Vice President of other funds. Mr. Hogan serves as a Director of Fidelity SelectCo, LLC (investment adviser firm, 2014-present) and President of the Equity Division of FMR (investment adviser firm, 2009-present). Previously, Mr. Hogan served as Senior Vice President, Equity Research of FMR (2006-2009) and as a portfolio manager. |
Chris Maher (1972) |
Year of Election or Appointment: 2013 Assistant Treasurer |
| Mr. Maher serves as Assistant Treasurer of other funds. Mr. Maher is Vice President of Valuation Oversight and is an employee of Fidelity Investments. Previously, Mr. Maher served as Vice President of Asset Management Compliance (2013), Vice President of the Program Management Group of FMR (investment adviser firm, 2010-2013), and Vice President of Valuation Oversight (2008-2010). |
Kenneth B. Robins (1969) |
Year of Election or Appointment: 2008 President and Treasurer |
| Mr. Robins also serves as an officer of other funds. Mr. Robins serves as Executive Vice President of Fidelity Investments Money Management, Inc. (FIMM) (investment adviser firm, 2013-present) and is an employee of Fidelity Investments (2004-present). Previously, Mr. Robins served in other fund officer roles. |
Stacie M. Smith (1974) |
Year of Election or Appointment: 2013 Deputy Treasurer |
| Ms. Smith also serves as an officer of other funds. She is an employee of Fidelity Investments (2009-present) and has served in other fund officer roles. Prior to joining Fidelity Investments, Ms. Smith served as Senior Audit Manager of Ernst & Young LLP (1996-2009). |
Renee Stagnone (1975) |
Year of Election or Appointment: 2013 Deputy Treasurer |
| Ms. Stagnone also serves as Deputy Treasurer of other funds. Ms. Stagnone is an employee of Fidelity Investments (1997-present). |
Linda J. Wondrack (1964) |
Year of Election or Appointment: 2014 Chief Compliance Officer |
| Ms. Wondrack also serves as Chief Compliance Officer of other funds. Ms. Wondrack is Executive Vice President and head of the Ethics Office and Asset Management Compliance for Fidelity Investments (2012-present). Ms. Wondrack also serves as Chief Compliance Officer of Fidelity SelectCo, LLC (investment adviser firm, 2014-present); Chief Compliance Officer of Impresa Management LLC (2013-present); and Chief Compliance Officer of FMR Co., Inc. (investment adviser firm), Fidelity Investments Money Management, Inc. (investment adviser firm), Fidelity Management & Research (Japan) Limited (investment adviser firm), FMR Investment Management (U.K.) Limited (investment adviser firm), Fidelity Management & Research (Hong Kong) (investment adviser firm), Fidelity Management & Research Company (investment adviser firm), FIAM LLC (investment adviser firm), and Strategic Advisers, Inc. (investment adviser firm), Ballyrock Investment Advisors LLC, and Northern Neck Investors LLC (2012-present). Previously, Ms. Wondrack served as Senior Vice President and Chief Compliance Officer for Columbia Management Investment Advisers, LLC (2005-2012); Chief Compliance Officer for certain funds within the Columbia Family of Funds (2007-2012); and Senior Vice President of Compliance Risk Management at Bank of America (2005-2010). |
Joseph F. Zambello (1957) |
Year of Election or Appointment: 2011 Deputy Treasurer |
| Mr. Zambello also serves as Deputy Treasurer of other funds. Mr. Zambello is an employee of Fidelity Investments (1991-present). Previously, Mr. Zambello served as Vice President of the Program Management Group of FMR (investment adviser firm, 2009-2011) and Vice President of the Transfer Agent Oversight Group (2005-2009). |
Annual Report
Fidelity Emerging Markets Discovery Fund
Each year, the Board of Trustees, including the Independent Trustees (together, the Board), votes on the renewal of the management contract with Fidelity Management & Research Company (FMR) and the sub-advisory agreements (together, the Advisory Contracts) for the fund. The Board, assisted by the advice of fund counsel and Independent Trustees' counsel, requests and considers a broad range of information relevant to the renewal of the Advisory Contracts throughout the year.
The Board meets regularly and, at each of its meetings, covers an extensive agenda of topics and materials and considers factors that are relevant to its annual consideration of the renewal of the fund's Advisory Contracts, including the services and support provided to the fund and its shareholders. The Board has established various standing committees (Committees), each composed of and chaired by Independent Trustees with varying backgrounds, to which the Board has assigned specific subject matter responsibilities in order to enhance effective decision-making by the Board. The Board, acting directly and through its Committees, requests and receives information concerning the annual consideration of the renewal of the fund's Advisory Contracts. The Board also meets as needed to consider matters specifically related to the Board's annual consideration of the renewal of the Advisory Contracts. Members of the Board may also meet with trustees of other Fidelity funds through ad hoc joint committees to discuss certain matters relevant to all of the Fidelity funds.
At its July 2015 meeting, the Board unanimously determined to renew the fund's Advisory Contracts. In reaching its determination, the Board considered all factors it believed relevant, including (i) the nature, extent, and quality of the services to be provided to the fund and its shareholders (including the investment performance of the fund); (ii) the competitiveness of the fund's management fee and total expense ratio relative to peer funds; (iii) the total costs of the services to be provided by and the profits to be realized by Fidelity from its relationship with the fund; and (iv) the extent to which (if any) economies of scale exist and would be realized as the fund grows, and whether any economies of scale are appropriately shared with fund shareholders.
In considering whether to renew the Advisory Contracts for the fund, the Board reached a determination, with the assistance of fund counsel and Independent Trustees' counsel and through the exercise of its business judgment, that the renewal of the Advisory Contracts was in the best interests of the fund and its shareholders and that the compensation payable under the Advisory Contracts was fair and reasonable. The Board's decision to renew the Advisory Contracts was not based on any single factor, but rather was based on a comprehensive consideration of all the information provided to the Board at its meetings throughout the year. The Board, in reaching its determination to renew the Advisory Contracts, was aware that shareholders of the fund have a broad range of investment choices available to them, including a wide choice among funds offered by Fidelity's competitors, and that the fund's shareholders, who have the opportunity to review and weigh the disclosure provided by the fund in its prospectus and other public disclosures, have chosen to invest in this fund, which is part of the Fidelity family of funds.
Annual Report
Nature, Extent, and Quality of Services Provided. The Board considered Fidelity's staffing as it relates to the fund, including the backgrounds of investment personnel of Fidelity, and also considered the fund's investment objective, strategies, and related investment philosophy. The Independent Trustees also had discussions with senior management of Fidelity's investment operations and investment groups. The Board considered the structure of the portfolio manager compensation program and whether this structure provides appropriate incentives to act in the best interests of the fund. Additionally, the Board considered the portfolio managers' investments, if any, in the funds that they manage.
Resources Dedicated to Investment Management and Support Services. The Board and the Fund Oversight and Research Committees reviewed the general qualifications and capabilities of Fidelity's investment staff, including its size, education, experience, and resources, as well as Fidelity's approach to recruiting, training, managing, and compensating investment personnel. The Board noted that Fidelity has continued to increase the resources devoted to non-U.S. offices, including expansion of Fidelity's global investment organization. The Board also noted that Fidelity's analysts have extensive resources, tools and capabilities that allow them to conduct sophisticated quantitative and fundamental analysis, as well as credit analysis of issuers, counterparties and guarantors. Further, the Board considered that Fidelity's investment professionals have sufficient access to global information and data so as to provide competitive investment results over time, and that those professionals also have access to sophisticated tools that permit them to assess portfolio construction and risk and performance attribution characteristics continuously, as well as to transmit new information and research conclusions rapidly around the world. Additionally, in its deliberations, the Board considered Fidelity's trading, risk management, and compliance capabilities and resources, which are integral parts of the investment management process.
Shareholder and Administrative Services. The Board considered (i) the nature, extent, quality, and cost of advisory, administrative, and shareholder services performed by FMR, the sub-advisers (together with FMR, the Investment Advisers), and their affiliates under the Advisory Contracts and under separate agreements covering transfer agency, pricing and bookkeeping, and securities lending services for the fund; (ii) the nature and extent of the supervision of third party service providers, principally custodians and subcustodians; and (iii) the resources devoted to, and the record of compliance with, the fund's compliance policies and procedures. The Board also reviewed the allocation of fund brokerage, including allocations to brokers affiliated with the Investment Advisers, the use of brokerage commissions to pay fund expenses, and the use of "soft" commission dollars to pay for research services.
Annual Report
Board Approval of Investment Advisory Contracts and
Management Fees - continued
The Board noted that the growth of fund assets over time across the complex allows Fidelity to reinvest in the development of services designed to enhance the value or convenience of the Fidelity funds as investment vehicles. These services include 24-hour access to account information and market information through telephone representatives and over the Internet, investor education materials and asset allocation tools, and the expanded availability of Fidelity Investor Centers.
In 2014, the Board formed an ad hoc Committee on Transfer Agency Fees to review the variety of transfer agency fee structures throughout the industry and Fidelity's competitive positioning with respect to industry participants.
Investment in a Large Fund Family. The Board considered the benefits to shareholders of investing in a Fidelity fund, including the benefits of investing in a fund that is part of a large family of funds offering a variety of investment disciplines and providing a large variety of mutual fund investor services. The Board noted that Fidelity had taken, or had made recommendations that resulted in the Fidelity funds taking, a number of actions over the previous year that benefited particular funds, including (i) continuing to dedicate additional resources to investment research and to the support of the senior management team that oversees asset management; (ii) continuing efforts to enhance Fidelity's global research capabilities; (iii) launching new funds and making other enhancements to meet client needs; (iv) reducing management fees and total expenses for certain index funds and diversified international funds; (v) continuing to launch dedicated lower cost underlying funds to meet portfolio construction needs related to expanding underlying fund options for Fidelity funds of funds, specifically for the Freedom Fund product lines; (vi) rationalizing product lines and gaining increased efficiencies through fund mergers; (vii) launching active fixed-income exchange-traded funds; (viii) continuing to develop, acquire and implement systems and technology to improve services to the funds and information security and to increase efficiency; (ix) implementing investment enhancements to further strengthen Fidelity's target date product line to increase investors' probability of success in achieving their goals; (x) modifying the eligibility criteria for certain share classes to accommodate roll-over assets from employer-sponsored retirement plans; (xi) launching a new Class W of the Freedom Index Funds to attract and retain Fidelity record-kept retirement plan assets; and (xii) implementing changes to Fidelity's money market product line in response to recent money market regulatory reforms.
Investment Performance. The Board considered whether the fund has operated in accordance with its investment objective, as well as its record of compliance with its investment restrictions and its performance history.
Annual Report
The Board took into account discussions with representatives of the Investment Advisers about fund investment performance that occur at Board meetings throughout the year. In this regard the Board noted that as part of regularly scheduled fund reviews and other reports to the Board on fund performance, the Board considers annualized return information for the fund, for different time periods, measured against a securities market index ("benchmark index") and a peer group of funds with similar objectives ("peer group"), if any. In its evaluation of fund investment performance, the Board gave particular attention to information indicating changes in performance of certain Fidelity funds for specific time periods and discussed with the Investment Advisers the reasons for any overperformance or underperformance.
In addition to reviewing absolute and relative fund performance, the Independent Trustees periodically consider the appropriateness of fund performance metrics in evaluating the results achieved. In general, the Independent Trustees believe that fund performance should be evaluated based on net performance (after fees and expenses) of both the highest performing and lowest performing fund share classes, where applicable, compared to appropriate benchmark indices, over appropriate time periods that may include full market cycles, and compared to peer groups, as applicable, over the same periods, taking into account relevant factors including the following: general market conditions; issuer-specific information; and fund cash flows and other factors.
The Independent Trustees recognize that shareholders evaluate performance on a net basis over their own holding periods, for which one-, three-, and five-year periods are often used as a proxy. For this reason, the performance information reviewed by the Board also included net cumulative calendar year total return information for the fund and an appropriate benchmark index and peer group for the most recent one- and three-year periods, as shown below. Returns are shown compared to the 25th percentile (top of box, 75% beaten) and 75th percentile (bottom of box, 25% beaten) of the peer universe.
Annual Report
Board Approval of Investment Advisory Contracts and
Management Fees - continued
Fidelity Emerging Markets Discovery Fund
Based on its review, the Board concluded that the nature, extent, and quality of services provided to the fund under the Advisory Contracts should benefit the shareholders of the fund.
Competitiveness of Management Fee and Total Expense Ratio. The Board considered the fund's management fee and total expense ratio compared to "mapped groups" of competitive funds and classes created for the purpose of facilitating the Trustees' competitive analysis of management fees and total expenses. Fidelity creates "mapped groups" by combining similar Lipper investment objective categories that have comparable investment mandates. Combining Lipper investment objective categories aids the Board's management fee and total expense ratio comparisons by broadening the competitive group used for comparison.
Management Fee. The Board considered two proprietary management fee comparisons for the 12-month (or shorter) periods shown in basis points (BP) in the chart below. The group of Lipper funds used by the Board for management fee comparisons is referred to below as the "Total Mapped Group." The Total Mapped Group comparison focuses on a fund's standing in terms of gross management fees before expense reimbursements or caps relative to the total universe of funds with comparable investment mandates, regardless of whether their management fee structures also are comparable. Funds with comparable investment mandates offer exposure to similar types of securities. Funds with comparable management fee structures have similar management fee contractual arrangements (e.g., flat rate charged for advisory services, all-inclusive fee rate, etc.). "TMG %" represents the percentage of funds in the Total Mapped Group that had management fees that were lower than the fund's. For example, a hypothetical TMG % of 20% would mean that 80% of the funds in the Total Mapped Group had higher, and 20% had lower, management fees than the fund. The fund's actual TMG %s and the number of funds in the Total Mapped Group are in the chart below. The "Asset-Size Peer Group" (ASPG) comparison focuses on a fund's standing relative to a subset of non-Fidelity funds within the Total Mapped Group that are similar in size and management fee structure without taking into account performance adjustments, if any. For example, if a fund is in the first quartile of the ASPG, the fund's management fee ranks in the least expensive or lowest 25% of funds in the ASPG. The ASPG represents at least 15% of the funds in the Total Mapped Group with comparable asset size and management fee structures, subject to a minimum of 50 funds (or all funds in the Total Mapped Group if fewer than 50). Additional information, such as the ASPG quartile in which the fund's management fee rate ranked, is also included in the chart and considered by the Board.
Annual Report
Fidelity Emerging Markets Discovery Fund

The Board noted that the fund's management fee rate ranked below the median of its Total Mapped Group and below the median of its ASPG for 2014.
The Board noted that, in 2014, the ad hoc Committee on Group Fee was formed by it and other Fidelity fund boards to conduct an in-depth review of the "group fee" component of the management fee of funds with such management fee structures. Committee focus included the mechanics of the group fee, the competitive landscape of group fee structures, Fidelity funds with no group fee component and investment products not included in group fee assets. The Board also considered that, for funds subject to the group fee,
Annual Report
Board Approval of Investment Advisory Contracts and
Management Fees - continued
FMR agreed to voluntarily waive fees over a specified period of time in amounts designed to account for assets converted from certain funds to certain collective investment trusts.
The Board also noted that, in 2013, the ad hoc Committee on Management Fees was formed to conduct an in-depth review of the management fee rates of Fidelity's active equity mutual funds. The Committee focused on the following areas: (i) standard fee structures; (ii) research consumption and trading evolution; (iii) management fee competitiveness/profitability by category; and (iv) factors that drive institutional pricing.
Based on its review, the Board concluded that the fund's management fee is fair and reasonable in light of the services that the fund receives and the other factors considered.
Total Expense Ratio. In its review of each class's total expense ratio, the Board considered the fund's management fee as well as other fund or class expenses, as applicable, such as transfer agent fees, pricing and bookkeeping fees, fund-paid 12b-1 fees, and custodial, legal, and audit fees. The Board also noted that Fidelity may agree to waive fees and expenses from time to time, and the extent to which, if any, it has done so for the fund. As part of its review, the Board also considered the current and historical total expense ratios of each class of the fund compared to competitive fund median expenses. Each class of the fund is compared to those funds and classes in the Total Mapped Group (used by the Board for management fee comparisons) that have a similar sales load structure.
The Board noted that the total expense ratio of the retail class ranked equal to its competitive median for 2014 and the total expense ratio of each of Class A, Class T, Class C, and Class I ranked above its competitive median for 2014. The Board considered that, in general, various factors can affect total expense ratios. The Board noted that the total expense ratio of Class T was above the competitive median primarily because of higher 12b-1 fees on Class T as compared to most competitor funds. Class T has a higher 12b-1 fee, but a lower front-end sales charge, than traditionally priced front-end sales charge classes. The Board considered that Class T is primarily sold load-waived in the retirement plan market where its 0.50% 12b-1 fee is comparable to competing no-load, higher 12b-1 fee classes designed specifically for retirement plans. The Board noted that the fund offers multiple classes, each of which has a different sales load and 12b-1 fee structure, and that the multiple structures are intended to offer a range of pricing options for the intermediary market. The Board also noted that the total expense ratios of the classes vary primarily by the level of their 12b-1 fees, although differences in transfer agent fees may also cause expenses to vary from class to class.
The Board further considered that FMR contractually agreed to reimburse Class A, Class T, Class C, Class I and the retail class of the fund to the extent that total operating expenses (excluding interest, certain taxes, certain securities lending costs, brokerage commissions, extraordinary expenses, and acquired fund fees and expenses, if any), as a percentage of their respective average net assets, exceed 1.70%, 1.95%, 2.45%, 1.45%, and 1.45% through December 31, 2015.
Annual Report
Fees Charged to Other Fidelity Clients. The Board also considered Fidelity fee structures and other information with respect to clients of Fidelity, such as other funds advised or subadvised by Fidelity, pension plan clients, and other institutional clients with similar mandates. The Board noted the findings of the 2013 ad hoc joint committee (created with the board of other Fidelity funds), which reviewed and compared Fidelity's institutional investment advisory business with its business of providing services to the Fidelity funds, including the differences in services provided, fees charged, and costs incurred, as well as competition in their respective marketplaces.
Based on its review of total expense ratios and fees charged to other Fidelity clients, the Board concluded that, although in some cases above the median of the universe presented for comparison, the total expense ratio of each class of the fund was reasonable in light of the services that the fund and its shareholders receive and the other factors considered.
Costs of the Services and Profitability. The Board considered the revenues earned and the expenses incurred by Fidelity in conducting the business of developing, marketing, distributing, managing, administering and servicing the fund and servicing the fund's shareholders. The Board also considered the level of Fidelity's profits in respect of all the Fidelity funds.
On an annual basis, Fidelity presents to the Board information about the profitability of its relationship with the fund. Fidelity calculates profitability information for each fund, as well as aggregate profitability information for groups of Fidelity funds and all Fidelity funds, using a series of detailed revenue and cost allocation methodologies which originate with the books and records of Fidelity on which Fidelity's audited financial statements are based. The Audit Committee of the Board reviews any significant changes from the prior year's methodologies.
PricewaterhouseCoopers LLP (PwC), independent registered public accounting firm and auditor to Fidelity and certain Fidelity funds, has been engaged annually by the Board as part of the Board's assessment of Fidelity's profitability analysis. PwC's engagement includes the review and assessment of the methodologies used by Fidelity in determining the revenues and expenses attributable to Fidelity's mutual fund business, and completion of agreed-upon procedures in respect of the mathematical accuracy of fund profitability and its conformity to established allocation methodologies. After considering PwC's reports issued under the engagement and information provided by Fidelity, the Board concluded that while other allocation methods may also be reasonable, Fidelity's profitability methodologies are reasonable in all material respects.
Annual Report
Board Approval of Investment Advisory Contracts and
Management Fees - continued
The Board also reviewed Fidelity's non-fund businesses and fall-out benefits related to the mutual fund business as well as cases where Fidelity's affiliates may benefit from or be related to the fund's business.
The Board considered the costs of the services provided by and the profits realized by Fidelity in connection with the operation of the fund and was satisfied that the profitability was not excessive.
Economies of Scale. The Board considered whether there have been economies of scale in respect of the management of the Fidelity funds, whether the Fidelity funds (including the fund) have appropriately benefited from any such economies of scale, and whether there is potential for realization of any further economies of scale. The Board considered the extent to which the fund will benefit from economies of scale as assets grow through increased services to the fund, through waivers or reimbursements, or through fee or expense ratio reductions. The Board also noted that in 2013, it and the boards of other Fidelity funds created an ad hoc committee (the Economies of Scale Committee) to analyze whether Fidelity attains economies of scale in respect of the management and servicing of the Fidelity funds, whether the Fidelity funds have appropriately benefited from such economies of scale, and whether there is potential for realization of any further economies of scale.
The Board recognized that the fund's management contract incorporates a "group fee" structure, which provides for lower group fee rates as total group assets increase, and for higher group fee rates as total group assets decrease (with "group assets" defined to include fund assets under FMR's management plus sector fund assets previously under FMR's management and currently managed by Fidelity SelectCo, LLC). FMR calculates the group fee rates based on a tiered asset "breakpoint" schedule that varies based on asset class. The Board considered that the group fee is designed to deliver the benefits of economies of scale to fund shareholders when total Fidelity fund assets increase, even if assets of any particular fund are unchanged or have declined, because some portion of Fidelity's costs are attributable to services provided to all Fidelity funds, and all funds benefit if those costs can be allocated among more assets. The Board concluded that, given the group fee structure, fund shareholders will benefit from lower management fees as group assets increase at the fund complex level, regardless of whether Fidelity achieves any such economies of scale.
The Board concluded, taking into account the analysis of the Economies of Scale Committee, that economies of scale, if any, are being appropriately shared between fund shareholders and Fidelity.
Additional Information Requested by the Board. In order to develop fully the factual basis for consideration of the Fidelity funds' Advisory Contracts, the Board requested and received additional information on certain topics, including: (i) fund performance trends and Fidelity's long-term strategies for certain funds; (ii) the various share classes employed by Fidelity and the attributes of each class, together with similar information on the distribution and servicing payments made by Fidelity or the funds to third-party participants in the distribution channels; (iii) fund profitability, and fund performance in relation to fund profitability; (iv) the methodology with respect to evaluating competitive fund data and peer group classifications and fee comparisons; (v) annual fund profitability margins, with particular focus on certain funds with negative margins; (vi) the realization of fall-out benefits in certain Fidelity business units; (vii) economies of scale and the way in which they are shared with fund shareholders; (viii) Fidelity's group fee structures, including the group fee schedule of breakpoints; (ix) the impact of cost containment measures on the funds; and (x) the transfer agent fee structure.
Annual Report
Based on its evaluation of all of the conclusions noted above, and after considering all factors it believed relevant, the Board concluded that the advisory fee structures are fair and reasonable, and that the fund's Advisory Contracts should be renewed.
Annual Report
Investment Adviser
Fidelity Management & Research Company
Boston, MA
Investment Sub-Advisers
FMR Co., Inc.
FMR Investment Management
(U.K.) Limited
Fidelity Management & Research
(Hong Kong) Limited
Fidelity Management & Research
(Japan) Limited
FIL Investments (Japan) Limited
FIL Investment Advisors (UK) Limited
FIL Investment Advisors
General Distributor
Fidelity Distributors Corporation
Smithfield, RI
Transfer and Service Agents
Fidelity Investments Institutional Operations Company, Inc.
Boston, MA
Fidelity Service Company, Inc.
Boston, MA
Custodian
The Northern Trust Company
Chicago, IL
(Fidelity Investment logo)(registered trademark)
AEMD-UANN-1215
1.931249.103
ContentsPerformance: The Bottom LineManagement's Discussion of Fund PerformanceShareholder Expense ExampleInvestment Changes (Unaudited)Investments October 31, 2015Financial StatementsNotes to Financial StatementsPerformance: The Bottom LineManagement's Discussion of Fund PerformanceShareholder Expense ExampleInvestment Changes (Unaudited)Investments October 31, 2015Financial StatementsNotes to Financial StatementsReport of Independent Registered Public Accounting FirmReport of Independent Registered Public Accounting FirmTrustees and OfficersDistributions (Unaudited)Board Approval of Investment Advisory Contracts and Management Fees
Fidelity®
Emerging Markets Discovery
Fund
and Fidelity®
Total Emerging Markets
Fund
Annual Report
October 31, 2015
(Fidelity Cover Art)
Contents
Fidelity® Emerging Markets Discovery Fund |
Performance | (Click Here) | How the fund has done over time. |
Management's Discussion of Fund Performance | (Click Here) | The Portfolio Managers' review of fund performance and strategy. |
Shareholder Expense Example | (Click Here) | An example of shareholder expenses. |
Investment Changes | (Click Here) | A summary of major shifts in the fund's investments over the past six months. |
Investments | (Click Here) | A complete list of the fund's investments with their market values. |
Financial Statements | (Click Here) | Statements of assets and liabilities, operations, and changes in net assets, as well as financial highlights. |
Notes | (Click Here) | Notes to the Financial Statements. |
Fidelity Total Emerging Markets Fund |
Performance | (Click Here) | How the fund has done over time. |
Management's Discussion of Fund Performance | (Click Here) | The Portfolio Managers' review of fund performance and strategy. |
Shareholder Expense Example | (Click Here) | An example of shareholder expenses. |
Investment Changes | (Click Here) | A summary of major shifts in the fund's investments over the past six months. |
Investments | (Click Here) | A complete list of the fund's investments with their market values. |
Financial Statements | (Click Here) | Statements of assets and liabilities, operations, and changes in net assets, as well as financial highlights. |
Notes | (Click Here) | Notes to the Financial Statements. |
Reports of Independent Registered Public Accounting Firm | (Click Here) | |
Trustees and Officers | (Click Here) | |
Distributions | (Click Here) | |
Board Approval of Investment Advisory Contracts and Management Fees | (Click Here) | |
Annual Report
To view a fund's proxy voting guidelines and proxy voting record for the 12-month period ended June 30, visit http://www.fidelity.com/proxyvotingresults or visit the Securities and Exchange Commission's (SEC) web site at http://www.sec.gov. You may also call 1-800-544-8544 to request a free copy of the proxy voting guidelines.
Standard & Poor's, S&P and S&P 500 are registered service marks of The McGraw-Hill Companies, Inc. and have been licensed for use by Fidelity Distributors Corporation.
Other third-party marks appearing herein are the property of their respective owners.
All other marks appearing herein are registered or unregistered trademarks or service marks of FMR LLC or an affiliated company. © 2015 FMR LLC. All rights reserved.
This report and the financial statements contained herein are submitted for the general information of the shareholders of the funds. This report is not authorized for distribution to prospective investors in the funds unless preceded or accompanied by an effective prospectus.
A fund files its complete schedule of portfolio holdings with the SEC for the first and third quarters of each fiscal year on Form N-Q. Forms N-Q are available on the SEC's web site at http://www.sec.gov. A fund's Forms N-Q may be reviewed and copied at the SEC's Public Reference Room in Washington, DC. Information regarding the operation of the SEC's Public Reference Room may be obtained by calling 1-800-SEC-0330. For a complete list of a fund's portfolio holdings, view the most recent holdings listing, semiannual report, or annual report on Fidelity's web site at http://www.fidelity.com, http://www.advisor.fidelity.com, or http://www.401k.com, as applicable.
NOT FDIC INSURED • MAY LOSE VALUE • NO BANK GUARANTEE
Neither the funds nor Fidelity Distributors Corporation is a bank.
Annual Report
Fidelity Emerging Markets Discovery Fund
Average annual total return reflects the change in the value of an investment, assuming reinvestment of the class' distributions from dividend income and capital gains (the profits earned upon the sale of securities that have grown in value, if any) and assuming a constant rate of performance each year. The $10,000 table and the fund's returns do not reflect the deduction of taxes that a shareholder would pay on fund distributions or the redemption of fund shares. During periods of reimbursement by Fidelity, a fund's total return will be greater than it would be had the reimbursement not occurred. How a fund did yesterday is no guarantee of how it will do tomorrow.
Average Annual Total Returns
Periods ended October 31, 2015 | Past 1
year | Life of
fund A |
Fidelity® Emerging Markets Discovery Fund | -10.07% | 3.77% |
A From November 1, 2011.
$10,000 Over Life of Fund
Let's say hypothetically that $10,000 was invested in Fidelity® Emerging Markets Discovery Fund, a class of the fund, on November 1, 2011, when the fund started. The chart shows how the value of your investment would have changed, and also shows how the MSCI Emerging Markets SMID Cap Index performed over the same period.
Annual Report
Fidelity Emerging Markets Discovery Fund
Market Recap: International equities suffered a moderate setback for the 12 months ending October 31, 2015, held back by a collapse in commodities prices that hurt resources-related sectors and geographies. The MSCI ACWI (All Country World Index) ex USA Index returned -4.55% for the period, affected also by concerns about global economic growth. Commodity producers remained under pressure for much of the past year, largely related to economic deceleration in China (-1%), the world's second-largest economy and a leading consumer of raw materials. This effect was exacerbated by U.S. dollar strength relative to global currencies, which weighed on commodities priced in dollars and acutely impacted equity returns within regions most exposed to resources prices. The emerging-markets group, for example, returned about -15% this period. Canada, a significant energy producer, returned roughly -17%. Net energy consumer Japan (+9%) was the best-performing region by far. Only about a quarter of the nearly 50 index countries managed a gain this period: Ireland (+19%) - the EU's fastest-growing economy - and Israel (+17%) proved top performers; Greece (-56%) and Brazil (-46%), among the worst. As for sectors, energy (-25%) and materials (-16%) declined sharply, whereas the two consumer sectors each gained about 6%.
Comments from Co-Portfolio Managers Tim Gannon and Greg Lee: For the year, the fund's share classes (excluding sales charges, if applicable) turned in low double-digit declines but mostly outperformed the -10.55% return of the benchmark MSCI Emerging Markets SMID Cap Index. Security selection drove the funds performance versus the benchmark, as stock picking in a majority of the fund's 10 sector sleeves was positive. From a geographic perspective, investments in Malaysia, Indonesia and Turkey were helpful, but those in South Korea, Brazil and Nigeria hurt versus the benchmark. Among sectors, picks in consumer staples, materials, health care and telecommunication services lifted performance most. The fund's top relative contributor this period was its overweighting in Sansung Life & Science, a former cardboard manufacturer in South Korea that became an extremely successful cosmetics company. The stock re-rated upward, lifting the fund's relative results, as the company continued to take market share in its core face-mask category. We sold Sansung from the fund by period end. Picks in financials were most detrimental to relative performance this period, including stakes in Egypt-based diversified financials firm Citadel Capital and Banco Estado Rio Grande, from Brazil.
The views expressed above reflect those of the portfolio manager(s) only through the end of the period as stated on the cover of this report and do not necessarily represent the views of Fidelity or any other person in the Fidelity organization. Any such views are subject to change at any time based upon market or other conditions and Fidelity disclaims any responsibility to update such views. These views may not be relied on as investment advice and, because investment decisions for a Fidelity fund are based on numerous factors, may not be relied on as an indication of trading intent on behalf of any Fidelity fund.
Annual Report
Fidelity Emerging Markets Discovery Fund
Shareholder Expense Example
As a shareholder of the Fund, you incur two types of costs: (1) transaction costs, including sales charges (loads) on purchase payments or redemption proceeds, redemption fees and (2) ongoing costs, including management fees, distribution and/or service (12b-1) fees and other Fund expenses. This Example is intended to help you understand your ongoing costs (in dollars) of investing in the Fund and to compare these costs with the ongoing costs of investing in other mutual funds.
The Example is based on an investment of $1,000 invested at the beginning of the period and held for the entire period (May 1, 2015 to October 31, 2015).
Actual Expenses
The first line of the accompanying table for each class of the Fund provides information about actual account values and actual expenses. You may use the information in this line, together with the amount you invested, to estimate the expenses that you paid over the period. Simply divide your account value by $1,000.00 (for example, an $8,600 account value divided by $1,000.00 = 8.6), then multiply the result by the number in the first line for a class of the Fund under the heading entitled "Expenses Paid During Period" to estimate the expenses you paid on your account during this period. A small balance maintenance fee of $12.00 that is charged once a year may apply for certain accounts with a value of less than $2,000. This fee is not included in the table below. If it was, the estimate of expenses you paid during the period would be higher, and your ending account value lower, by this amount. In addition, the Fund, as a shareholder in the underlying Fidelity Central Funds, will indirectly bear its pro-rata share of the fees and expenses incurred by the underlying Fidelity Central Funds. These fees and expenses are not included in the Fund's annualized expense ratio used to calculate the expense estimate in the table below.
Hypothetical Example for Comparison Purposes
The second line of the accompanying table for each class of the Fund provides information about hypothetical account values and hypothetical expenses based on a Class' actual expense ratio and an assumed rate of return of 5% per year before expenses, which is not the Class' actual return. The hypothetical account values and expenses may not be used to estimate the actual ending account balance or expenses you paid for the period. You may use this information to compare the ongoing costs of investing in the Fund and other funds. To do so, compare this 5% hypothetical example with the 5% hypothetical examples that appear in the shareholder reports of the other funds. A small balance maintenance fee of $12.00 that is charged once a year may apply for certain accounts with a value of less than $2,000. This fee is not included in the table below. If it was, the estimate of expenses you paid during the period would be higher, and your ending account value lower, by this amount. In addition, the Fund, as a shareholder in the underlying Fidelity Central Funds, will indirectly bear its pro-rata share of the fees and expenses incurred by the underlying Fidelity Central Funds. These fees and expenses are not included in the Fund's annualized expense ratio used to calculate the expense estimate in the table below.
Please note that the expenses shown in the table are meant to highlight your ongoing costs only and do not reflect any transaction costs. Therefore, the second line of the table is useful in comparing ongoing costs only, and will not help you determine the relative total costs of owning different funds. In addition, if these transactional costs were included, your costs would have been higher.
Annual Report
Shareholder Expense Example - continued
| Annualized
Expense RatioB | Beginning
Account Value
May 1, 2015 | Ending
Account Value
October 31, 2015 | Expenses Paid
During PeriodC
May 1, 2015 to
October 31, 2015 |
Class A | 1.70% | | | |
Actual | | $ 1,000.00 | $ 865.30 | $ 7.99 |
HypotheticalA | | $ 1,000.00 | $ 1,016.64 | $ 8.64 |
Class T | 1.95% | | | |
Actual | | $ 1,000.00 | $ 864.00 | $ 9.16 |
HypotheticalA | | $ 1,000.00 | $ 1,015.38 | $ 9.91 |
Class C | 2.45% | | | |
Actual | | $ 1,000.00 | $ 862.10 | $ 11.50 |
HypotheticalA | | $ 1,000.00 | $ 1,012.85 | $ 12.43 |
Emerging Markets Discovery | 1.45% | | | |
Actual | | $ 1,000.00 | $ 865.90 | $ 6.82 |
HypotheticalA | | $ 1,000.00 | $ 1,017.90 | $ 7.38 |
Class I | 1.45% | | | |
Actual | | $ 1,000.00 | $ 866.40 | $ 6.82 |
HypotheticalA | | $ 1,000.00 | $ 1,017.90 | $ 7.38 |
A 5% return per year before expenses
B Annualized expense ratio reflects expenses net of applicable fee waivers.
C Expenses are equal to each Class' annualized expense ratio, multiplied by the average account value over the period, multiplied by 184/365 (to reflect the one-half year period).
Annual Report
Fidelity Emerging Markets Discovery Fund
Investment Changes (Unaudited)
Top Five Stocks as of October 31, 2015 |
| % of fund's
net assets | % of fund's net assets
6 months ago |
Techtronic Industries Co. Ltd. (Hong Kong, Household Durables) | 2.4 | 2.1 |
Quinenco SA (Chile, Industrial Conglomerates) | 1.9 | 1.7 |
Fila Korea Ltd. (Korea (South), Textiles, Apparel & Luxury Goods) | 1.6 | 1.5 |
Macquarie Mexican (REIT) (Mexico, Real Estate Investment Trusts) | 1.5 | 1.4 |
Advantech Co. Ltd. (Taiwan, Technology Hardware, Storage & Peripherals) | 1.4 | 0.7 |
| 8.8 | |
Top Five Market Sectors as of October 31, 2015 |
| % of fund's
net assets | % of fund's net assets
6 months ago |
Financials | 18.1 | 17.2 |
Industrials | 17.0 | 17.2 |
Information Technology | 15.4 | 15.9 |
Consumer Discretionary | 14.6 | 15.3 |
Materials | 10.2 | 10.1 |
Top Five Countries as of October 31, 2015 |
(excluding cash equivalents) | % of fund's
net assets | % of fund's net assets
6 months ago |
Korea (South) | 13.3 | 13.7 |
India | 13.0 | 12.7 |
Cayman Islands | 11.4 | 12.0 |
Taiwan | 9.6 | 8.2 |
China | 6.3 | 5.5 |
Percentages are adjusted for the effect of open futures contracts, if applicable. |
Annual Report
Fidelity Emerging Markets Discovery Fund
Investments October 31, 2015
Showing Percentage of Net Assets
Common Stocks - 96.3% |
| Shares | | Value |
Bangladesh - 0.4% |
BRAC Bank Ltd. | 449,466 | | $ 268,010 |
Bermuda - 2.5% |
Aquarius Platinum Ltd. (Australia) (a) | 2,009,820 | | 348,562 |
China Resource Gas Group Ltd. | 58,000 | | 159,097 |
Digital China Holdings Ltd. (H Shares) | 160,000 | | 163,238 |
PAX Global Technology Ltd. | 386,000 | | 504,757 |
Shangri-La Asia Ltd. | 660,000 | | 604,010 |
TOTAL BERMUDA | | 1,779,664 |
Brazil - 3.8% |
Companhia de Saneamento de Minas Gerais | 50,290 | | 169,522 |
Cosan SA Industria e Comercio | 64,720 | | 414,679 |
Direcional Engenharia SA | 219,000 | | 201,024 |
Fibria Celulose SA | 48,200 | | 657,906 |
FPC Par Corretora de Seguros | 96,200 | | 269,152 |
Minerva SA (a) | 129,800 | | 429,464 |
QGEP Participacoes SA (a) | 152,100 | | 235,059 |
Smiles SA | 44,100 | | 344,196 |
TOTAL BRAZIL | | 2,721,002 |
British Virgin Islands - 0.3% |
Dolphin Capital Investors Ltd. (a) | 918,400 | | 245,996 |
Canada - 1.4% |
Pan American Silver Corp. | 54,500 | | 412,565 |
Torex Gold Resources, Inc. (a) | 612,300 | | 580,645 |
TOTAL CANADA | | 993,210 |
Cayman Islands - 11.4% |
58.com, Inc. ADR (a)(d) | 15,100 | | 792,599 |
Casetek Holdings | 51,000 | | 224,642 |
China Cord Blood Corp. (a) | 97,900 | | 623,623 |
Cosmo Lady (China) Holdings Co. Ltd. | 755,000 | | 749,853 |
E-House China Holdings Ltd. ADR | 47,500 | | 294,500 |
ENN Energy Holdings Ltd. | 26,000 | | 148,945 |
Eurasia Drilling Co. Ltd. GDR (Reg. S) | 20,000 | | 227,000 |
GCL-Poly Energy Holdings Ltd. (a) | 1,093,000 | | 225,758 |
Haitian International Holdings Ltd. | 295,000 | | 516,161 |
Ju Teng International Holdings Ltd. | 436,000 | | 238,442 |
Kingboard Laminates Holdings Ltd. | 608,500 | | 253,439 |
Kingsoft Corp. Ltd. | 81,000 | | 183,293 |
Lee's Pharmaceutical Holdings Ltd. | 374,000 | | 482,885 |
Pico Far East Holdings Ltd. | 2,320,000 | | 615,850 |
Common Stocks - continued |
| Shares | | Value |
Cayman Islands - continued |
Semiconductor Manufacturing International Corp. (a) | 2,182,000 | | $ 202,140 |
Sino Biopharmaceutical Ltd. | 436,000 | | 541,817 |
SITC International Holdings Co. Ltd. | 1,224,000 | | 628,266 |
Sunny Optical Technology Group Co. Ltd. | 114,000 | | 265,064 |
TPK Holding Co. Ltd. | 32,000 | | 79,840 |
Uni-President China Holdings Ltd. (d) | 1,005,000 | | 823,121 |
TOTAL CAYMAN ISLANDS | | 8,117,238 |
Chile - 5.4% |
Compania Cervecerias Unidas SA sponsored ADR | 21,500 | | 515,355 |
CorpBanca SA | 33,441,053 | | 306,823 |
Empresas CMPC SA | 241,277 | | 594,514 |
Inversiones La Construccion SA | 41,103 | | 467,167 |
Quinenco SA | 673,804 | | 1,334,844 |
Vina Concha y Toro SA | 371,890 | | 633,485 |
TOTAL CHILE | | 3,852,188 |
China - 6.3% |
BBMG Corp. (H Shares) | 847,000 | | 593,558 |
China Longyuan Power Grid Corp. Ltd. (H Shares) | 149,000 | | 136,223 |
China Machinery Engineering Co. (H Shares) | 522,000 | | 453,046 |
China Suntien Green Energy Corp. Ltd. (H Shares) (d) | 1,262,200 | | 225,041 |
Huangshan Tourism Development Co. Ltd. | 346,700 | | 593,413 |
Qingdao Haier Co. Ltd. | 520,686 | | 792,670 |
Tong Ren Tang Technologies Co. Ltd. (H Shares) | 381,000 | | 595,104 |
Zhengzhou Yutong Bus Co. Ltd. | 149,219 | | 513,955 |
Zhuzhou CSR Times Electric Co. Ltd. (H Shares) | 96,500 | | 624,687 |
TOTAL CHINA | | 4,527,697 |
Colombia - 0.3% |
Organizacion Terpel SA | 48,928 | | 180,714 |
Cyprus - 1.0% |
Global Ports Investment PLC GDR (Reg. S) | 159,800 | | 703,120 |
Egypt - 0.3% |
Citadel Capital Corp. (a) | 1,084,800 | | 248,570 |
Greece - 1.1% |
Public Power Corp. of Greece | 43,080 | | 248,234 |
Titan Cement Co. SA (Reg.) | 23,400 | | 513,350 |
TOTAL GREECE | | 761,584 |
Hong Kong - 4.4% |
BYD Electronic International Co. Ltd. (a) | 146,000 | | 95,415 |
Common Stocks - continued |
| Shares | | Value |
Hong Kong - continued |
China Resources Beer Holdings Co. Ltd. | 288,000 | | $ 543,793 |
Far East Horizon Ltd. | 899,000 | | 747,766 |
Techtronic Industries Co. Ltd. | 471,500 | | 1,723,647 |
TOTAL HONG KONG | | 3,110,621 |
India - 13.0% |
Adani Ports & Special Economic Zone (a) | 114,759 | | 518,147 |
Arvind Mills Ltd. (a) | 117,146 | | 495,403 |
Bank of Baroda (a) | 84,785 | | 206,426 |
Cadila Healthcare Ltd. (a) | 83,485 | | 531,725 |
Edelweiss Financial Services Ltd. | 827,000 | | 750,570 |
Exide Industries Ltd. (a) | 318,791 | | 727,266 |
Grasim Industries Ltd. | 13,786 | | 782,499 |
Iifl Holdings Ltd. (a) | 227,222 | | 665,608 |
Indraprastha Gas Ltd. (a) | 52,765 | | 393,709 |
JK Cement Ltd. | 42,409 | | 443,340 |
LIC Housing Finance Ltd. (a) | 50,882 | | 371,515 |
Mahindra Lifespace Developers Ltd. (a) | 67,363 | | 512,341 |
Mphasis BFL Ltd. | 51,793 | | 375,539 |
Petronet LNG Ltd. | 113,023 | | 334,966 |
Power Grid Corp. of India Ltd. | 196,095 | | 385,479 |
Redington India Ltd. (a) | 102,277 | | 185,879 |
Solar Industries India Ltd. (a) | 6,809 | | 349,950 |
The Jammu & Kashmir Bank Ltd. | 237,424 | | 301,325 |
Torrent Pharmaceuticals Ltd. | 25,387 | | 596,652 |
VST Industries Ltd. (a) | 13,967 | | 341,812 |
TOTAL INDIA | | 9,270,151 |
Indonesia - 1.0% |
Link Net Tbk PT (a) | 770,900 | | 241,570 |
PT Panin Life Tbk (a) | 31,241,600 | | 498,676 |
TOTAL INDONESIA | | 740,246 |
Israel - 0.5% |
Bezeq The Israel Telecommunication Corp. Ltd. | 162,160 | | 348,658 |
Korea (South) - 12.2% |
AMOREPACIFIC Group, Inc. | 3,016 | | 425,284 |
BGFretail Co. Ltd. | 1,501 | | 223,486 |
Binggrea Co. Ltd. | 3,814 | | 228,151 |
Com2uS Corp. | 2,384 | | 240,118 |
Crown Confectionery Co., Ltd. | 506 | | 259,699 |
Daewoo International Corp. | 20,479 | | 357,827 |
Common Stocks - continued |
| Shares | | Value |
Korea (South) - continued |
Devsisters Co. Ltd. (a) | 7,152 | | $ 193,870 |
DGB Financial Group Co. Ltd. | 73,214 | | 679,706 |
E-Mart Co. Ltd. | 2,833 | | 527,263 |
Fila Korea Ltd. | 12,688 | | 1,111,257 |
Hyundai Glovis Co. Ltd. | 4,198 | | 722,481 |
Hyundai Industrial Development & Construction Co. | 20,928 | | 844,071 |
Hyundai Wia Corp. | 5,867 | | 685,991 |
Koh Young Technology, Inc. | 6,128 | | 178,456 |
Korean Reinsurance Co. | 32,080 | | 382,115 |
Medy-Tox, Inc. | 1,659 | | 707,469 |
NCSOFT Corp. | 2,058 | | 341,567 |
Silicon Works Co. Ltd. | 7,719 | | 229,859 |
Sungshin Cement Manufacturing Co. Ltd. (a) | 40,501 | | 404,382 |
TOTAL KOREA (SOUTH) | | 8,743,052 |
Luxembourg - 0.0% |
Atento SA (a) | 3,500 | | 36,050 |
Malaysia - 1.4% |
Inari Amertron Bhd | 223,600 | | 185,345 |
Top Glove Corp. Bhd | 354,600 | | 783,209 |
TOTAL MALAYSIA | | 968,554 |
Mexico - 6.3% |
Grupo Aeroportuario del Pacifico SA de CV Series B | 88,400 | | 796,188 |
Grupo Aeroportuario Norte S.A.B. de CV | 106,300 | | 546,759 |
Grupo Comercial Chedraui S.A.B. de CV | 175,300 | | 485,005 |
Grupo GICSA SA de CV (a) | 222,000 | | 216,385 |
Industrias Penoles SA de CV | 44,180 | | 587,362 |
Macquarie Mexican (REIT) (d) | 775,572 | | 1,076,649 |
Megacable Holdings S.A.B. de CV unit | 116,200 | | 442,843 |
Promotora y Operadora de Infraestructura S.A.B. de CV (a) | 7,718 | | 96,773 |
Qualitas Controladora S.A.B. de CV (a) | 210,300 | | 262,019 |
TOTAL MEXICO | | 4,509,983 |
Nigeria - 0.3% |
Transnational Corp. of Nigeria PLC | 23,459,127 | | 213,318 |
Pakistan - 0.4% |
Habib Bank Ltd. | 152,000 | | 302,084 |
Panama - 0.7% |
Copa Holdings SA Class A | 10,200 | | 515,304 |
Common Stocks - continued |
| Shares | | Value |
Philippines - 1.5% |
Alliance Global Group, Inc. | 1,515,900 | | $ 588,967 |
Metro Pacific Investments Corp. | 4,315,000 | | 480,076 |
TOTAL PHILIPPINES | | 1,069,043 |
Poland - 1.2% |
Asseco Poland SA | 21,300 | | 314,896 |
Prime Car Management SA | 48,600 | | 521,799 |
TOTAL POLAND | | 836,695 |
Romania - 1.0% |
Banca Transilvania SA (a) | 492,829 | | 309,840 |
BRD-Groupe Societe Generale (a) | 135,947 | | 394,474 |
TOTAL ROMANIA | | 704,314 |
Russia - 0.7% |
E.ON Russia JSC (a) | 5,471,000 | | 260,277 |
Sistema JSFC sponsored GDR | 31,660 | | 220,037 |
TOTAL RUSSIA | | 480,314 |
Singapore - 0.3% |
First Resources Ltd. | 168,700 | | 225,985 |
South Africa - 1.7% |
Alexander Forbes Group Holding | 861,282 | | 542,697 |
Reunert Ltd. | 137,600 | | 670,948 |
TOTAL SOUTH AFRICA | | 1,213,645 |
Sri Lanka - 0.6% |
Hatton National Bank PLC | 273,700 | | 422,852 |
Taiwan - 9.6% |
ADLINK Technology, Inc. | 95,749 | | 258,359 |
Advantech Co. Ltd. | 138,000 | | 992,546 |
Chipbond Technology Corp. | 124,000 | | 177,225 |
Cleanaway Co. Ltd. | 114,000 | | 561,836 |
Cub Elecparts, Inc. | 52,892 | | 666,343 |
Elite Semiconductor Memory Technology, Inc. | 143,000 | | 128,839 |
eMemory Technology, Inc. | 22,000 | | 227,014 |
Everlight Electronics Co. Ltd. | 160,000 | | 243,709 |
FLEXium Interconnect, Inc. | 84,442 | | 237,213 |
Forhouse Corp. | 485,000 | | 191,968 |
Hermes Microvision, Inc. | 4,000 | | 154,628 |
Inventec Corp. | 440,000 | | 253,442 |
Lite-On Technology Corp. | 333,640 | | 347,360 |
Common Stocks - continued |
| Shares | | Value |
Taiwan - continued |
Powertech Technology, Inc. | 184,000 | | $ 408,070 |
Radiant Opto-Electronics Corp. | 88,000 | | 273,772 |
Sirtec International Co. Ltd. | 176,000 | | 217,391 |
St.Shine Optical Co. Ltd. | 27,000 | | 409,179 |
Synnex Technology International Corp. | 277,000 | | 293,083 |
Tong Hsing Electronics Industries Ltd. | 108,000 | | 274,449 |
Universal Cement Corp. | 368,840 | | 260,739 |
Vanguard International Semiconductor Corp. | 200,000 | | 258,432 |
TOTAL TAIWAN | | 6,835,597 |
Thailand - 1.1% |
Delta Electronics PCL (For. Reg.) | 116,300 | | 276,351 |
Thai Union Frozen Products PCL (For. Reg.) | 963,800 | | 478,836 |
TOTAL THAILAND | | 755,187 |
Turkey - 2.0% |
Aksa Akrilik Kimya Sanayii | 118,000 | | 433,080 |
Aselsan A/S | 137,000 | | 655,536 |
Tupras Turkiye Petrol Rafinelleri A/S (a) | 12,576 | | 332,151 |
TOTAL TURKEY | | 1,420,767 |
United Arab Emirates - 0.5% |
National Bank of Ras Al-Khaimah PSC (a) | 178,179 | | 325,020 |
United Kingdom - 1.0% |
Bank of Georgia Holdings PLC | 23,100 | | 712,219 |
United States of America - 0.3% |
First Cash Financial Services, Inc. (a) | 6,000 | | 228,900 |
Vietnam - 0.4% |
FTP Corp. | 142,600 | | 314,754 |
TOTAL COMMON STOCKS (Cost $75,444,283) |
68,702,306
|
Nonconvertible Preferred Stocks - 1.4% |
| | | |
Brazil - 0.3% |
Banco do Estado Rio Grande do Sul SA | 142,200 | | 220,865 |
Korea (South) - 1.1% |
LG Chemical Ltd. | 4,102 | | 774,220 |
TOTAL NONCONVERTIBLE PREFERRED STOCKS (Cost $1,119,425) |
995,085
|
Government Obligations - 0.0% |
| Principal Amount | | Value |
United States of America - 0.0% |
U.S. Treasury Bills, yield at date of purchase 0.01% 12/3/15
(Cost $20,000) | | $ 20,000 | | $ 20,000 |
Money Market Funds - 5.7% |
| Shares | | |
Fidelity Cash Central Fund, 0.18% (b) | 1,625,275 | | 1,625,275 |
Fidelity Securities Lending Cash Central Fund, 0.19% (b)(c) | 2,456,800 | | 2,456,800 |
TOTAL MONEY MARKET FUNDS (Cost $4,082,075) |
4,082,075
|
TOTAL INVESTMENT PORTFOLIO - 103.4% (Cost $80,665,783) | 73,799,466 |
NET OTHER ASSETS (LIABILITIES) - (3.4)% | (2,439,342) |
NET ASSETS - 100% | $ 71,360,124 |
Legend |
(a) Non-income producing |
(b) Affiliated fund that is generally available only to investment companies and other accounts managed by Fidelity Investments. The rate quoted is the annualized seven-day yield of the fund at period end. A complete unaudited listing of the fund's holdings as of its most recent quarter end is available upon request. In addition, each Fidelity Central Fund's financial statements, which are not covered by the Fund's Report of Independent Registered Public Accounting Firm, are available on the SEC's website or upon request. |
(c) Investment made with cash collateral received from securities on loan. |
(d) Security or a portion of the security is on loan at period end. |
Affiliated Central Funds |
Information regarding fiscal year to date income earned by the Fund from investments in Fidelity Central Funds is as follows: |
Fund | Income earned |
Fidelity Cash Central Fund | $ 5,002 |
Fidelity Securities Lending Cash Central Fund | 7,859 |
Total | $ 12,861 |
Other Information |
Categorizations in the Schedule of Investments are based on country or territory of incorporation. |
The following is a summary of the inputs used, as of October 31, 2015, involving the Fund's assets and liabilities carried at fair value. The inputs or methodology used for valuing securities may not be an indication of the risk associated with investing in those securities. For more information on valuation inputs, and their aggregation into the levels used in the tables below, please refer to the Investment Valuation section in the accompanying Notes to Financial Statements. |
Valuation Inputs at Reporting Date: |
Description | Total | Level 1 | Level 2 | Level 3 |
Investments in Securities: | | | | |
Equities: | | | | |
Consumer Discretionary | $ 10,367,560 | $ 4,065,448 | $ 5,509,442 | $ 792,670 |
Consumer Staples | 6,140,739 | 3,727,192 | 2,413,547 | - |
Energy | 1,768,896 | 1,208,889 | 560,007 | - |
Financials | 12,923,664 | 8,389,361 | 4,534,303 | - |
Health Care | 5,271,663 | 1,740,271 | 3,531,392 | - |
Industrials | 12,206,765 | 8,363,536 | 3,843,229 | - |
Information Technology | 11,002,761 | 7,848,101 | 3,154,660 | - |
Materials | 7,303,592 | 4,785,683 | 2,517,909 | - |
Telecommunication Services | 810,265 | 568,695 | 241,570 | - |
Utilities | 1,901,486 | 678,033 | 1,223,453 | - |
Government Obligations | 20,000 | - | 20,000 | - |
Money Market Funds | 4,082,075 | 4,082,075 | - | - |
Total Investments in Securities: | $ 73,799,466 | $ 45,457,284 | $ 27,549,512 | $ 792,670 |
The following is a summary of transfers between Level 1 and Level 2 for the period ended October 31, 2015. Transfers are assumed to have occurred at the beginning of the period, and are primarily attributable to the valuation techniques used for foreign equity securities, as discussed in the accompanying Notes to Financial Statements: |
Transfers | Total |
Level 1 to Level 2 | $ 0 |
Level 2 to Level 1 | $ 2,193,999 |
Valuation Inputs at Reporting Date: |
The following is a reconciliation of Investments in Securities for which Level 3 inputs were used in determining value: |
Investments in Securities: | |
Equities - Consumer Discretionary | |
Beginning Balance | $ - |
Net Realized Gain (Loss) on Investment Securities | 123,445 |
Net Unrealized Gain (Loss) on Investment Securities | 1,856 |
Cost of Purchases | 977,596 |
Proceeds of Sales | (310,227) |
Amortization/Accretion | - |
Transfers into Level 3 | - |
Transfers out of Level 3 | - |
Ending Balance | $ 792,670 |
The change in unrealized gain (loss) for the period attributable to Level 3 securities held at October 31, 2015 | $ 1,856 |
The information used in the above reconciliation represents fiscal year to date activity for any Investments in Securities identified as using Level 3 inputs at either the beginning or the end of the current fiscal period. Transfers in or out of Level 3 represent the beginning value of any Security or Instrument where a change in the pricing level occurred from the beginning to the end of the period. The cost of purchases and the proceeds of sales may include securities received or delivered through corporate actions or exchanges. Realized and unrealized gains (losses) disclosed in the reconciliation are included in Net Gain (Loss) on the Fund's Statement of Operations. |
See accompanying notes which are an integral part of the financial statements.
Annual Report
Fidelity Emerging Markets Discovery Fund
Statement of Assets and Liabilities
| | October 31, 2015 |
| | |
Assets | | |
Investment in securities, at value (including securities loaned of $2,338,259) - See accompanying schedule: Unaffiliated issuers (cost $76,583,708) | $ 69,717,391 | |
Fidelity Central Funds (cost $4,082,075) | 4,082,075 | |
Total Investments (cost $80,665,783) | | $ 73,799,466 |
Cash | | 103,696 |
Foreign currency held at value (cost $7,645) | | 7,480 |
Receivable for investments sold | | 301,197 |
Receivable for fund shares sold | | 78,842 |
Dividends receivable | | 12,866 |
Distributions receivable from Fidelity Central Funds | | 868 |
Prepaid expenses | | 218 |
Receivable from investment adviser for expense reductions | | 33,319 |
Other receivables | | 9,766 |
Total assets | | 74,347,718 |
| | |
Liabilities | | |
Payable for investments purchased | $ 295,566 | |
Payable for fund shares redeemed | 73,113 | |
Accrued management fee | 50,866 | |
Distribution and service plan fees payable | 3,218 | |
Other affiliated payables | 16,907 | |
Other payables and accrued expenses | 91,124 | |
Collateral on securities loaned, at value | 2,456,800 | |
Total liabilities | | 2,987,594 |
| | |
Net Assets | | $ 71,360,124 |
Net Assets consist of: | | |
Paid in capital | | $ 80,045,129 |
Undistributed net investment income | | 413,597 |
Accumulated undistributed net realized gain (loss) on investments and foreign currency transactions | | (2,212,898) |
Net unrealized appreciation (depreciation) on investments and assets and liabilities in foreign currencies | | (6,885,704) |
Net Assets | | $ 71,360,124 |
See accompanying notes which are an integral part of the financial statements.
Annual Report
Statement of Assets and Liabilities - continued
| | October 31, 2015 |
Calculation of Maximum Offering Price | | |
Class A: | | |
Net Asset Value and redemption price per share ($4,660,013 ÷ 426,752 shares) | | $ 10.92 |
| | |
Maximum offering price per share (100/94.25 of $10.92) | | $ 11.59 |
Class T: | | |
Net Asset Value and redemption price per share ($2,015,001 ÷ 185,561 shares) | | $ 10.86 |
| | |
Maximum offering price per share (100/96.50 of $10.86) | | $ 11.25 |
Class C: | | |
Net Asset Value and offering price per share ($1,674,587 ÷ 156,693 shares)A | | $ 10.69 |
| | |
Emerging Markets Discovery: | | |
Net Asset Value, offering price and redemption price per share ($61,600,864 ÷ 5,608,316 shares) | | $ 10.98 |
| | |
Class I: | | |
Net Asset Value, offering price and redemption price per share ($1,409,659 ÷ 127,965 shares) | | $ 11.02 |
A Redemption price per share is equal to net asset value less any applicable contingent deferred sales charge.
See accompanying notes which are an integral part of the financial statements.
Annual Report
Fidelity Emerging Markets Discovery Fund
Financial Statements - continued
Statement of Operations
| Year ended October 31, 2015 |
| | |
Investment Income | | |
Dividends | | $ 1,741,878 |
Special dividends | | 415,817 |
Interest | | 4 |
Income from Fidelity Central Funds | | 12,861 |
Income before foreign taxes withheld | | 2,170,560 |
Less foreign taxes withheld | | (263,796) |
Total income | | 1,906,764 |
| | |
Expenses | | |
Management fee | $ 661,948 | |
Transfer agent fees | 178,413 | |
Distribution and service plan fees | 38,098 | |
Accounting and security lending fees | 40,604 | |
Custodian fees and expenses | 176,611 | |
Independent trustees' compensation | 337 | |
Registration fees | 70,131 | |
Audit | 90,650 | |
Legal | 210 | |
Miscellaneous | 897 | |
Total expenses before reductions | 1,257,899 | |
Expense reductions | (100,295) | 1,157,604 |
Net investment income (loss) | | 749,160 |
Realized and Unrealized Gain (Loss) | | |
Net realized gain (loss) on: | | |
Investment securities: | | |
Unaffiliated issuers (net of foreign taxes of $311,960) | (1,427,654) | |
Foreign currency transactions | (123,177) | |
Futures contracts | (381,269) | |
Total net realized gain (loss) | | (1,932,100) |
Change in net unrealized appreciation (depreciation) on: Investment securities (net of decrease in deferred foreign taxes of $258,529) | (8,018,876) | |
Assets and liabilities in foreign currencies | 16,343 | |
Total change in net unrealized appreciation (depreciation) | | (8,002,533) |
Net gain (loss) | | (9,934,633) |
Net increase (decrease) in net assets resulting from operations | | $ (9,185,473) |
See accompanying notes which are an integral part of the financial statements.
Annual Report
Statement of Changes in Net Assets
| Year ended
October 31,
2015 | Year ended
October 31,
2014 |
Increase (Decrease) in Net Assets | | |
Operations | | |
Net investment income (loss) | $ 749,160 | $ 451,642 |
Net realized gain (loss) | (1,932,100) | (250,198) |
Change in net unrealized appreciation (depreciation) | (8,002,533) | (701,823) |
Net increase (decrease) in net assets resulting from operations | (9,185,473) | (500,379) |
Distributions to shareholders from net investment income | - | (676,480) |
Distributions to shareholders from net realized gain | - | (2,520,609) |
Total distributions | - | (3,197,089) |
Share transactions - net increase (decrease) | (6,487,831) | (16,216,808) |
Redemption fees | 32,392 | 46,780 |
Total increase (decrease) in net assets | (15,640,912) | (19,867,496) |
| | |
Net Assets | | |
Beginning of period | 87,001,036 | 106,868,532 |
End of period (including undistributed net investment income of $413,597 and undistributed net investment income of $174, respectively) | $ 71,360,124 | $ 87,001,036 |
See accompanying notes which are an integral part of the financial statements.
Annual Report
Financial Highlights - Fidelity Emerging Markets Discovery Fund Class A
Years ended October 31, | 2015 | 2014 | 2013 | 2012 F |
Selected Per-Share Data | | | | |
Net asset value, beginning of period | $ 12.17 | $ 12.49 | $ 11.89 | $ 10.00 |
Income from Investment Operations | | | | |
Net investment income (loss) C | .09 J | .04 | .08 | .12 |
Net realized and unrealized gain (loss) | (1.34) | (.01) | .75 | 1.76 |
Total from investment operations | (1.25) | .03 | .83 | 1.88 |
Distributions from net investment income | - | (.06) | (.04) | (.01) |
Distributions from net realized gain | - | (.30) | (.20) | - |
Total distributions | - | (.36) | (.25)I | (.01) |
Redemption fees added to paid in capitalC | -H | .01 | .02 | .02 |
Net asset value, end of period | $ 10.92 | $ 12.17 | $ 12.49 | $ 11.89 |
Total ReturnA, B | (10.27)% | .31% | 7.20% | 19.00% |
Ratios to Average Net AssetsD, G | | | | |
Expenses before reductions | 1.88% | 1.82% | 1.87% | 3.49% |
Expenses net of fee waivers, if any | 1.70% | 1.70% | 1.70% | 1.70% |
Expenses net of all reductions | 1.69% | 1.70% | 1.64% | 1.64% |
Net investment income (loss) | .76% J | .29% | .62% | 1.16% |
Supplemental Data | | | | |
Net assets, end of period (000 omitted) | $ 4,660 | $ 4,362 | $ 5,065 | $ 1,671 |
Portfolio turnover rateE | 103% | 148% | 179% | 83% |
A Total returns would have been lower if certain expenses had not been reduced during the applicable periods shown.
B Total returns do not include the effect of the sales charges.
C Calculated based on average shares outstanding during the period.
D Fees and expenses of any underlying Fidelity Central Funds are not included in the Fund's expense ratio. The Fund indirectly bears its proportionate share of the expenses of any underlying Fidelity Central Funds.
E Amount does not include the portfolio activity of any underlying Fidelity Central Funds.
F For the period November 1, 2011 (commencement of operations) to October 31, 2012.
G Expense ratios reflect operating expenses of the class. Expenses before reductions do not reflect amounts reimbursed by the investment adviser or reductions from brokerage service arrangements or reductions from other expense offset arrangements and do not represent the amount paid by the class during periods when reimbursements or reductions occur. Expense ratios before reductions for start-up periods may not be representative of longer-term operating periods. Expenses net of fee waivers reflect expenses after reimbursement by the investment adviser but prior to reductions from brokerage service arrangements or other expense offset arrangements. Expenses net of all reductions represent the net expenses paid by the class.
H Amount represents less than $.005 per share.
I Total distributions of $.25 per share is comprised of distributions from net investment income of $.044 and distributions from net realized gain of $.203 per share.
J Investment income per share reflects a large, non-recurring dividend which amounted to $.06 per share. Excluding this non-recurring dividend, the ratio of net investment income (loss) to average net assets would have been .22%.
See accompanying notes which are an integral part of the financial statements.
Annual Report
Financial Highlights - Fidelity Emerging Markets Discovery Fund Class T
Years ended October 31, | 2015 | 2014 | 2013 | 2012 F |
Selected Per-Share Data | | | | |
Net asset value, beginning of period | $ 12.13 | $ 12.44 | $ 11.87 | $ 10.00 |
Income from Investment Operations | | | | |
Net investment income (loss) C | .06 J | -H | .05 | .10 |
Net realized and unrealized gain (loss) | (1.33) | -H | .74 | 1.75 |
Total from investment operations | (1.27) | -H | .79 | 1.85 |
Distributions from net investment income | - | (.02) | (.03) | -H |
Distributions from net realized gain | - | (.30) | (.20) | - |
Total distributions | - | (.32) | (.24)I | -H |
Redemption fees added to paid in capitalC | -H | .01 | .02 | .02 |
Net asset value, end of period | $ 10.86 | $ 12.13 | $ 12.44 | $ 11.87 |
Total ReturnA, B | (10.47)% | .05% | 6.87% | 18.75% |
Ratios to Average Net AssetsD, G | | | | |
Expenses before reductions | 2.16% | 2.10% | 2.19% | 3.77% |
Expenses net of fee waivers, if any | 1.95% | 1.95% | 1.95% | 1.95% |
Expenses net of all reductions | 1.94% | 1.95% | 1.89% | 1.89% |
Net investment income (loss) | .51% J | .04% | .37% | .91% |
Supplemental Data | | | | |
Net assets, end of period (000 omitted) | $ 2,015 | $ 2,031 | $ 1,914 | $ 1,700 |
Portfolio turnover rateE | 103% | 148% | 179% | 83% |
A Total returns would have been lower if certain expenses had not been reduced during the applicable periods shown.
B Total returns do not include the effect of the sales charges.
C Calculated based on average shares outstanding during the period.
D Fees and expenses of any underlying Fidelity Central Funds are not included in the Fund's expense ratio. The Fund indirectly bears its proportionate share of the expenses of any underlying Fidelity Central Funds.
E Amount does not include the portfolio activity of any underlying Fidelity Central Funds.
F For the period November 1, 2011 (commencement of operations) to October 31, 2012.
G Expense ratios reflect operating expenses of the class. Expenses before reductions do not reflect amounts reimbursed by the investment adviser or reductions from brokerage service arrangements or reductions from other expense offset arrangements and do not represent the amount paid by the class during periods when reimbursements or reductions occur. Expense ratios before reductions for start-up periods may not be representative of longer-term operating periods. Expenses net of fee waivers reflect expenses after reimbursement by the investment adviser but prior to reductions from brokerage service arrangements or other expense offset arrangements. Expenses net of all reductions represent the net expenses paid by the class.
H Amount represents less than $.005 per share.
I Total distributions of $.24 per share is comprised of distributions from net investment income of $.034 and distributions from net realized gain of $.203 per share.
J Investment income per share reflects a large, non-recurring dividend which amounted to $.06 per share. Excluding this non-recurring dividend, the ratio of net investment income (loss) to average net assets would have been (.03)%.
See accompanying notes which are an integral part of the financial statements.
Annual Report
Financial Highlights - Fidelity Emerging Markets Discovery Fund Class C
Years ended October 31, | 2015 | 2014 | 2013 | 2012 G |
Selected Per-Share Data | | | | |
Net asset value, beginning of period | $ 12.00 | $ 12.35 | $ 11.82 | $ 10.00 |
Income from Investment Operations | | | | |
Net investment income (loss) C | - F,I | (.06) | (.02) | .04 |
Net realized and unrealized gain (loss) | (1.31) | -I | .74 | 1.76 |
Total from investment operations | (1.31) | (.06) | .72 | 1.80 |
Distributions from net investment income | - | - | (.01) | - |
Distributions from net realized gain | - | (.30) | (.20) | - |
Total distributions | - | (.30) | (.21) | - |
Redemption fees added to paid in capitalC | - I | .01 | .02 | .02 |
Net asset value, end of period | $ 10.69 | $ 12.00 | $ 12.35 | $ 11.82 |
Total ReturnA, B | (10.92)% | (.42)% | 6.32% | 18.20% |
Ratios to Average Net AssetsD, H | | | | |
Expenses before reductions | 2.64% | 2.58% | 2.70% | 4.32% |
Expenses net of fee waivers, if any | 2.45% | 2.45% | 2.45% | 2.45% |
Expenses net of all reductions | 2.44% | 2.45% | 2.39% | 2.39% |
Net investment income (loss) | .01% F | (.46)% | (.13)% | .41% |
Supplemental Data | | | | |
Net assets, end of period (000 omitted) | $ 1,675 | $ 1,750 | $ 2,082 | $ 1,474 |
Portfolio turnover rateE | 103% | 148% | 179% | 83% |
A Total returns would have been lower if certain expenses had not been reduced during the applicable periods shown.
B Total returns do not include the effect of the contingent deferred sales charge.
C Calculated based on average shares outstanding during the period.
D Fees and expenses of any underlying Fidelity Central Funds are not included in the Fund's expense ratio. The Fund indirectly bears its proportionate share of the expenses of any underlying Fidelity Central Funds.
E Amount does not include the portfolio activity of any underlying Fidelity Central Funds.
F Investment income per share reflects a large, non-recurring dividend which amounted to $.06 per share. Excluding this non-recurring dividend, the ratio of net investment income (loss) to average net assets would have been (.52)%.
G For the period November 1, 2011 (commencement of operations) to October 31, 2012.
H Expense ratios reflect operating expenses of the class. Expenses before reductions do not reflect amounts reimbursed by the investment adviser or reductions from brokerage service arrangements or reductions from other expense offset arrangements and do not represent the amount paid by the class during periods when reimbursements or reductions occur. Expense ratios before reductions for start-up periods may not be representative of longer-term operating periods. Expenses net of fee waivers reflect expenses after reimbursement by the investment adviser but prior to reductions from brokerage service arrangements or other expense offset arrangements. Expenses net of all reductions represent the net expenses paid by the class.
I Amount represents less than $.005 per share.
See accompanying notes which are an integral part of the financial statements.
Annual Report
Financial Highlights - Fidelity Emerging Markets Discovery Fund
Years ended October 31, | 2015 | 2014 | 2013 | 2012 F |
Selected Per-Share Data | | | | |
Net asset value, beginning of period | $ 12.21 | $ 12.52 | $ 11.92 | $ 10.00 |
Income from Investment Operations | | | | |
Net investment income (loss)B | .12 E | .07 | .11 | .15 |
Net realized and unrealized gain (loss) | (1.35) | -H | .74 | 1.76 |
Total from investment operations | (1.23) | .07 | .85 | 1.91 |
Distributions from net investment income | - | (.09) | (.07) | (.01) |
Distributions from net realized gain | - | (.30) | (.20) | - |
Total distributions | - | (.39) | (.27) | (.01) |
Redemption fees added to paid in capitalB | -H | .01 | .02 | .02 |
Net asset value, end of period | $ 10.98 | $ 12.21 | $ 12.52 | $ 11.92 |
Total ReturnA | (10.07)% | .61% | 7.37% | 19.35% |
Ratios to Average Net AssetsC, G | | | | |
Expenses before reductions | 1.56% | 1.48% | 1.57% | 3.02% |
Expenses net of fee waivers, if any | 1.45% | 1.45% | 1.45% | 1.45% |
Expenses net of all reductions | 1.44% | 1.45% | 1.39% | 1.39% |
Net investment income (loss) | 1.01% E | .54% | .87% | 1.41% |
Supplemental Data | | | | |
Net assets, end of period (000 omitted) | $ 61,601 | $ 78,377 | $ 96,731 | $ 39,135 |
Portfolio turnover rateD | 103% | 148% | 179% | 83% |
A Total returns would have been lower if certain expenses had not been reduced during the applicable periods shown.
B Calculated based on average shares outstanding during the period.
C Fees and expenses of any underlying Fidelity Central Funds are not included in the Fund's expense ratio. The Fund indirectly bears its proportionate share of the expenses of any underlying Fidelity Central Funds.
D Amount does not include the portfolio activity of any underlying Fidelity Central Funds.
E Investment income per share reflects a large, non-recurring dividend which amounted to $.06 per share. Excluding this non-recurring dividend, the ratio of net investment income (loss) to average net assets would have been .48%.
F For the period November 1, 2011 (commencement of operations) to October 31, 2012.
G Expense ratios reflect operating expenses of the class. Expenses before reductions do not reflect amounts reimbursed by the investment adviser or reductions from brokerage service arrangements or reductions from other expense offset arrangements and do not represent the amount paid by the class during periods when reimbursements or reductions occur. Expense ratios before reductions for start-up periods may not be representative of longer-term operating periods. Expenses net of fee waivers reflect expenses after reimbursement by the investment adviser but prior to reductions from brokerage service arrangements or other expense offset arrangements. Expenses net of all reductions represent the net expenses paid by the class.
H Amount represents less than $.005 per share.
See accompanying notes which are an integral part of the financial statements.
Annual Report
Financial Highlights - Fidelity Emerging Markets Discovery Fund Class I
Years ended October 31, | 2015 | 2014 | 2013 | 2012 E |
Selected Per-Share Data | | | | |
Net asset value, beginning of period | $ 12.25 | $ 12.53 | $ 11.92 | $ 10.00 |
Income from Investment Operations | | | | |
Net investment income (loss) B | .12 H | .07 | .11 | .15 |
Net realized and unrealized gain (loss) | (1.35) | - G | .75 | 1.76 |
Total from investment operations | (1.23) | .07 | .86 | 1.91 |
Distributions from net investment income | - | (.06) | (.07) | (.01) |
Distributions from net realized gain | - | (.30) | (.20) | - |
Total distributions | - | (.36) | (.27) | (.01) |
Redemption fees added to paid in capitalB | - G | .01 | .02 | .02 |
Net asset value, end of period | $ 11.02 | $ 12.25 | $ 12.53 | $ 11.92 |
Total ReturnA | (10.04)% | .61% | 7.45% | 19.35% |
Ratios to Average Net AssetsC, F | | | | |
Expenses before reductions | 1.54% | 1.56% | 1.60% | 3.21% |
Expenses net of fee waivers, if any | 1.45% | 1.45% | 1.45% | 1.45% |
Expenses net of all reductions | 1.43% | 1.45% | 1.39% | 1.39% |
Net investment income (loss) | 1.01% H | .54% | .87% | 1.41% |
Supplemental Data | | | | |
Net assets, end of period (000 omitted) | $ 1,410 | $ 481 | $ 1,076 | $ 1,825 |
Portfolio turnover rateD | 103% | 148% | 179% | 83% |
A Total returns would have been lower if certain expenses had not been reduced during the applicable periods shown.
B Calculated based on average shares outstanding during the period.
C Fees and expenses of any underlying Fidelity Central Funds are not included in the Fund's expense ratio. The Fund indirectly bears its proportionate share of the expenses of any underlying Fidelity Central Funds.
D Amount does not include the portfolio activity of any underlying Fidelity Central Funds.
E For the period November 1, 2011 (commencement of operations) to October 31, 2012.
F Expense ratios reflect operating expenses of the class. Expenses before reductions do not reflect amounts reimbursed by the investment adviser or reductions from brokerage service arrangements or reductions from other expense offset arrangements and do not represent the amount paid by the class during periods when reimbursements or reductions occur. Expense ratios before reductions for start-up periods may not be representative of longer-term operating periods. Expenses net of fee waivers reflect expenses after reimbursement by the investment adviser but prior to reductions from brokerage service arrangements or other expense offset arrangements. Expenses net of all reductions represent the net expenses paid by the class.
G Amount represents less than $.005 per share.
H Investment income per share reflects a large, non-recurring dividend which amounted to $.06 per share. Excluding this non-recurring dividend, the ratio of net investment income (loss) to average net assets would have been .48%.
See accompanying notes which are an integral part of the financial statements.
Annual Report
For the period ended October 31, 2015
1. Organization.
Fidelity Emerging Markets Discovery Fund (the Fund) is a fund of Fidelity Investment Trust (the Trust) and is authorized to issue an unlimited number of shares. The Trust is registered under the Investment Company Act of 1940, as amended (the 1940 Act), as an open-end management investment company organized as a Massachusetts business trust. The Fund offers Class A, Class T, Class C, Emerging Markets Discovery and Class I (formerly Institutional Class) shares, each of which has equal rights as to assets and voting privileges. Each class has exclusive voting rights with respect to matters that affect that class. The Fund's investments in emerging markets can be subject to social, economic, regulatory, and political uncertainties and can be extremely volatile.
2. Investments in Fidelity Central Funds.
The Fund invests in Fidelity Central Funds, which are open-end investment companies generally available only to other investment companies and accounts managed by the investment adviser and its affiliates. The Fund's Schedule of Investments lists each of the Fidelity Central Funds held as of period end, if any, as an investment of the Fund, but does not include the underlying holdings of each Fidelity Central Fund. As an Investing Fund, the Fund indirectly bears its proportionate share of the expenses of the underlying Fidelity Central Funds.
The Money Market Central Funds seek preservation of capital and current income and are managed by Fidelity Investments Money Management, Inc. (FIMM), an affiliate of the investment adviser. Annualized expenses of the Money Market Central Funds as of their most recent shareholder report date are less than .005%.
A complete unaudited list of holdings for each Fidelity Central Fund is available upon request or at the Securities and Exchange Commission (the SEC) website at www.sec.gov. In addition, the financial statements of the Fidelity Central Funds, which are not covered by the Fund's Report of Independent Registered Public Accounting Firm, are available on the SEC website or upon request.
3. Significant Accounting Policies.
The financial statements have been prepared in conformity with accounting principles generally accepted in the United States of America (GAAP), which require management to make certain estimates and assumptions at the date of the financial statements. Actual results could differ from those estimates. Subsequent events, if any, through the date that the financial statements were issued have been evaluated in the preparation of
Annual Report
3. Significant Accounting Policies - continued
the financial statements. The following summarizes the significant accounting policies of the Fund:
Investment Valuation. Investments are valued as of 4:00 p.m. Eastern time on the last calendar day of the period. The Board of Trustees (the Board) has delegated the day to day responsibility for the valuation of the Fund's investments to the Fidelity Management & Research Company (FMR) Fair Value Committee (the Committee). In accordance with valuation policies and procedures approved by the Board, the Fund attempts to obtain prices from one or more third party pricing vendors or brokers to value its investments. When current market prices, quotations or currency exchange rates are not readily available or reliable, investments will be fair valued in good faith by the Committee, in accordance with procedures adopted by the Board. Factors used in determining fair value vary by investment type and may include market or investment specific events, changes in interest rates and credit quality. The frequency with which these procedures are used cannot be predicted and they may be utilized to a significant extent. The Committee oversees the Fund's valuation policies and procedures and reports to the Board on the Committee's activities and fair value determinations. The Board monitors the appropriateness of the procedures used in valuing the Fund's investments and ratifies the fair value determinations of the Committee.
The Fund categorizes the inputs to valuation techniques used to value its investments into a disclosure hierarchy consisting of three levels as shown below:
Level 1 - quoted prices in active markets for identical investments
Level 2 - other significant observable inputs (including quoted prices for similar investments, interest rates, prepayment speeds, etc.)
Level 3 - unobservable inputs (including the Fund's own assumptions based on the best information available)
Valuation techniques used to value the Fund's investments by major category are as follows:
Equity securities, including restricted securities, for which market quotations are readily available, are valued at the last reported sale price or official closing price as reported by a third party pricing vendor on the primary market or exchange on which they are traded and are categorized as Level 1 in the hierarchy. In the event there were no sales during the day or closing prices are not available, securities are valued at the last quoted bid price or may be valued using the last available price and are generally categorized as Level 2 in the hierarchy. For foreign equity securities, when market or security specific events arise, comparisons to the valuation of American Depositary Receipts (ADRs), futures contracts, Exchange-Traded Funds (ETFs) and certain indexes as well as quoted prices for similar securities may be used and would be categorized as Level 2 in the hierarchy. Utilizing these techniques may result in transfers between Level 1 and Level 2.
Annual Report
Notes to Financial Statements - continued
3. Significant Accounting Policies - continued
Investment Valuation - continued
For equity securities, including restricted securities, where observable inputs are limited, assumptions about market activity and risk are used and these securities may be categorized as Level 3 in the hierarchy.
Debt securities, including restricted securities, are valued based on evaluated prices received from third party pricing vendors or from brokers who make markets in such securities. U.S. government and government agency obligations are valued by pricing vendors who utilize matrix pricing which considers yield or price of bonds of comparable quality, coupon, maturity and type or by broker-supplied prices. When independent prices are unavailable or unreliable, debt securities may be valued utilizing pricing methodologies which consider similar factors that would be used by third party pricing vendors. Debt securities are generally categorized as Level 2 in the hierarchy but may be Level 3 depending on the circumstances.
Investments in open-end mutual funds, including the Fidelity Central Funds, are valued at their closing net asset value (NAV) each business day and are categorized as Level 1 in the hierarchy.
The following provides information on Level 3 securities held by the Fund that were valued at period end based on unobservable inputs. These amounts exclude valuations provided by a broker.
Asset Type | Fair Value at 10/31/15 | Valuation
Technique(s) | Unobservable
Input | Amount or Range/Weighted Average | Impact to
Valuation from an Increase
in InputA |
Equities | $ 792,670 | Adjusted transaction price | Proxy movement | 0.0% | Increase |
A Represents the expected directional change in the fair value of the Level 3 investments that would result from an increase in the corresponding input. A decrease to the unobservable input would have the opposite effect. Significant changes in these inputs could result in significantly higher or lower fair value measurements.
Changes in valuation techniques may result in transfers in or out of an assigned level within the disclosure hierarchy. The aggregate value of investments by input level as of October 31, 2015, including information on transfers between Levels 1 and 2, as well as a roll forward of Level 3 investments, is included at the end of the Fund's Schedule of Investments.
Annual Report
3. Significant Accounting Policies - continued
Foreign Currency. The Fund may use foreign currency contracts to facilitate transactions in foreign-denominated securities. Gains and losses from these transactions may arise from changes in the value of the foreign currency or if the counterparties do not perform under the contracts' terms.
Foreign-denominated assets, including investment securities, and liabilities are translated into U.S. dollars at the exchange rates at period end. Purchases and sales of investment securities, income and dividends received and expenses denominated in foreign currencies are translated into U.S. dollars at the exchange rate in effect on the transaction date.
The effects of exchange rate fluctuations on investments are included with the net realized and unrealized gain (loss) on investment securities. Other foreign currency transactions resulting in realized and unrealized gain (loss) are disclosed separately.
Investment Transactions and Income. For financial reporting purposes, the Fund's investment holdings and NAV include trades executed through the end of the last business day of the period. The NAV per share for processing shareholder transactions is calculated as of the close of business of the New York Stock Exchange (NYSE), normally 4:00 p.m. Eastern time and includes trades executed through the end of the prior business day. Gains and losses on securities sold are determined on the basis of identified cost. Dividend income is recorded on the ex-dividend date, except for certain dividends from foreign securities where the ex-dividend date may have passed, which are recorded as soon as the Fund is informed of the ex-dividend date. Non-cash dividends included in dividend income, if any, are recorded at the fair market value of the securities received. Income and capital gain distributions from Fidelity Central Funds, if any, are recorded on the ex-dividend date. Large, non-recurring dividends recognized by the Fund are presented separately on the Statement of Operations as "Special Dividends" and the impact of these dividends is presented in the Financial Highlights. Interest income is accrued as earned and includes coupon interest and amortization of premium and accretion of discount on debt securities as applicable. Investment income is recorded net of foreign taxes withheld where recovery of such taxes is uncertain.
Class Allocations and Expenses. Investment income, realized and unrealized capital gains and losses, common expenses of the Fund, and certain fund-level expense reductions, if any, are allocated daily on a pro-rata basis to each class based on the relative net assets of each class to the total net assets of the Fund. Each class differs with respect to transfer agent and distribution and service plan fees incurred. Certain expense reductions may also differ by class. For the reporting period, the allocated portion of income and expenses to each class as a percent of its average net assets may vary due to the timing of recording these transactions in relation to fluctuating net assets of the classes.
Annual Report
Notes to Financial Statements - continued
3. Significant Accounting Policies - continued
Class Allocations and Expenses - continued
Expenses directly attributable to a fund are charged to that fund. Expenses attributable to more than one fund are allocated among the respective funds on the basis of relative net assets or other appropriate methods. Expense estimates are accrued in the period to which they relate and adjustments are made when actual amounts are known.
Income Tax Information and Distributions to Shareholders. Each year, the Fund intends to qualify as a regulated investment company under Subchapter M of the Internal Revenue Code, including distributing substantially all of its taxable income and realized gains. As a result, no provision for U.S. Federal income taxes is required. As of October 31, 2015, the Fund did not have any unrecognized tax benefits in the financial statements; nor is the Fund aware of any tax positions for which it is reasonably possible that the total amounts of unrecognized tax benefits will significantly change in the next twelve months. The Fund files a U.S. federal tax return, in addition to state and local tax returns as required. The Fund's federal income tax returns are subject to examination by the Internal Revenue Service (IRS) for a period of three fiscal years after they are filed. State and local tax returns may be subject to examination for an additional fiscal year depending on the jurisdiction. Foreign taxes are provided for based on the Fund's understanding of the tax rules and rates that exist in the foreign markets in which it invests. The Fund is subject to a tax imposed on capital gains by certain countries in which it invests. An estimated deferred tax liability for net unrealized appreciation on the applicable securities is included in Other payables and accrued expenses on the Statement of Assets & Liabilities.
Distributions are declared and recorded on the ex-dividend date. Income dividends and capital gain distributions are declared separately for each class. Income and capital gain distributions are determined in accordance with income tax regulations, which may differ from GAAP.
Capital accounts within the financial statements are adjusted for permanent book-tax differences. These adjustments have no impact on net assets or the results of operations. Capital accounts are not adjusted for temporary book-tax differences which will reverse in a subsequent period.
Book-tax differences are primarily due to foreign currency transactions, futures transactions, certain foreign taxes, passive foreign investment companies (PFIC), capital loss carryforwards and losses deferred due to wash sales.
Annual Report
3. Significant Accounting Policies - continued
Income Tax Information and Distributions to Shareholders - continued
The federal tax cost of investment securities and unrealized appreciation (depreciation) as of period end were as follows:
Gross unrealized appreciation | $ 4,713,145 |
Gross unrealized depreciation | (12,060,381) |
Net unrealized appreciation (depreciation) on securities | $ (7,347,236) |
Tax Cost | $ 81,146,702 |
The tax-based components of distributable earnings as of period end were as follows:
Undistributed ordinary income | $ 413,626 |
Capital loss carryforward | $ (1,731,575) |
Net unrealized appreciation (depreciation) on securities and other investments | $ (7,349,233) |
Capital loss carryforwards are only available to offset future capital gains of the Fund to the extent provided by regulations and may be limited. Under the Regulated Investment Company Modernization Act of 2010 (the Act), the Fund is permitted to carry forward capital losses incurred in taxable years beginning after December 22, 2010 for an unlimited period and such capital losses are required to be used prior to any losses that expire. The capital loss carryforward information presented below, including any applicable limitation, is estimated as of fiscal period end and is subject to adjustment.
No expiration | |
Short-term | $ (1,731,575) |
The tax character of distributions paid was as follows:
| October 31, 2015 | October 31, 2014 |
Ordinary Income | $ - | $ 676,480 |
Long-term Capital Gains | - | 2,520,609 |
Total | $ - | $ 3,197,089 |
Short-Term Trading (Redemption) Fees. Shares held by investors in the Fund less than 90 days may have been subject to a redemption fee equal to 2.00% of the NAV of shares redeemed. All redemption fees, which reduce the proceeds of the shareholder redemption, are retained by the Fund and accounted for as an addition to paid in capital.
Annual Report
Notes to Financial Statements - continued
4. Derivative Instruments.
Risk Exposures and the Use of Derivative Instruments. The Fund's investment objective allows the Fund to enter into various types of derivative contracts, including futures contracts. Derivatives are investments whose value is primarily derived from underlying assets, indices or reference rates and may be transacted on an exchange or over-the-counter (OTC). Derivatives may involve a future commitment to buy or sell a specified asset based on specified terms, to exchange future cash flows at periodic intervals based on a notional principal amount, or for one party to make one or more payments upon the occurrence of specified events in exchange for periodic payments from the other party.
The Fund used derivatives to increase returns and to manage exposure to certain risks as defined below. The success of any strategy involving derivatives depends on analysis of numerous economic factors, and if the strategies for investment do not work as intended, the Fund may not achieve its objectives.
The Fund's use of derivatives increased or decreased its exposure to the following risk:
Equity Risk | Equity risk relates to the fluctuations in the value of financial instruments as a result of changes in market prices (other than those arising from interest rate risk or foreign exchange risk), whether caused by factors specific to an individual investment, its issuer, or all factors affecting all instruments traded in a market or market segment. |
The Fund is also exposed to additional risks from investing in derivatives, such as liquidity risk and counterparty credit risk. Liquidity risk is the risk that the Fund will be unable to close out the derivative in the open market in a timely manner. Counterparty credit risk is the risk that the counterparty will not be able to fulfill its obligation to the Fund. Counterparty credit risk related to exchange-traded futures contracts may be mitigated by the protection provided by the exchange on which they trade.
Investing in derivatives may involve greater risks than investing in the underlying assets directly and, to varying degrees, may involve risk of loss in excess of any initial investment and collateral received and amounts recognized in the Statement of Assets and Liabilities. In addition, there may be the risk that the change in value of the derivative contract does not correspond to the change in value of the underlying instrument.
Annual Report
4. Derivative Instruments - continued
Futures Contracts. A futures contract is an agreement between two parties to buy or sell a specified underlying instrument for a fixed price at a specified future date. The Fund used futures contracts to manage its exposure to the stock market.
Upon entering into a futures contract, a fund is required to deposit either cash or securities (initial margin) with a clearing broker in an amount equal to a certain percentage of the face value of the contract. Futures contracts are marked-to-market daily and subsequent daily payments (variation margin) are made or received by a fund depending on the daily fluctuations in the value of the futures contracts and are recorded as unrealized appreciation or (depreciation). This receivable and/or payable, if any, is included in daily variation margin for derivative instruments in the Statement of Assets and Liabilities. Realized gain or (loss) is recorded upon the expiration or closing of a futures contract.
Any open futures contracts at period end are presented in the Schedule of Investments under the caption "Futures Contracts." The underlying face amount at value reflects each contract's exposure to the underlying instrument or index at period end and is representative of volume of activity during the period. Securities deposited to meet initial margin requirements are identified in the Schedule of Investments.
During the period the Fund recognized net realized gain (loss) of $(381,269) related to its investment in futures contracts. This amount is included in the Statement of Operations.
5. Purchases and Sales of Investments.
Purchases and sales of securities, other than short-term securities, aggregated $77,304,743 and $80,761,199, respectively.
6. Fees and Other Transactions with Affiliates.
Management Fee. Fidelity Management & Research Company (the investment adviser) and its affiliates provide the Fund with investment management related services for which the Fund pays a monthly management fee. The management fee is the sum of an individual fund fee rate that is based on an annual rate of .60% of the Fund's average net assets and an annualized group fee rate that averaged .25% during the period. The group fee rate is based upon the average net assets of all the mutual funds advised by the investment adviser, including any mutual funds previously advised by the investment adviser that are currently advised by Fidelity SelectCo, LLC, an affiliate of the investment adviser. The group fee rate decreases as assets under management increase and increases as assets under management decrease. For the reporting period, the total annual management fee rate was .85% of the Fund's average net assets.
Annual Report
Notes to Financial Statements - continued
6. Fees and Other Transactions with Affiliates - continued
Distribution and Service Plan Fees. In accordance with Rule 12b-1 of the 1940 Act, the Fund has adopted separate Distribution and Service Plans for each class of shares. Certain classes pay Fidelity Distributors Corporation (FDC), an affiliate of the investment adviser, separate Distribution and Service Fees, each of which is based on an annual percentage of each class' average net assets. In addition, FDC may pay financial intermediaries for selling shares of the Fund and providing shareholder support services. For the period, the Distribution and Service Fee rates, total fees and amounts retained by FDC were as follows:
| Distribution
Fee | Service
Fee | Total Fees | Retained
by FDC |
Class A | -% | .25% | $ 11,767 | $ 550 |
Class T | .25% | .25% | 10,340 | 15 |
Class C | .75% | .25% | 15,991 | 5,122 |
| | | $ 38,098 | $ 5,687 |
Sales Load. FDC may receive a front-end sales charge of up to 5.75% for selling Class A shares and 3.50% for selling Class T shares, some of which is paid to financial intermediaries for selling shares of the Fund. Depending on the holding period, FDC may receive contingent deferred sales charges levied on Class A, Class T and Class C redemptions. The deferred sales charges are 1.00% for Class C shares, 1.00% for certain purchases of Class A shares and .25% for certain purchases of Class T shares.
For the period, sales charge amounts retained by FDC were as follows:
| Retained
by FDC |
Class A | $ 4,871 |
Class T | 2,151 |
Class CA | 233 |
| $ 7,255 |
A When Class C shares are initially sold, FDC pays commissions from its own resources to financial intermediaries through which the sales are made.
Transfer Agent Fees. Fidelity Investments Institutional Operations Company, Inc., (FIIOC), an affiliate of the investment adviser, is the transfer, dividend disbursing and shareholder servicing agent for each class of the Fund. FIIOC receives account fees and asset-based fees that vary according to the account size and type of account of the shareholders of the respective classes of the Fund. FIIOC pays for typesetting, printing and mailing of shareholder reports, except proxy statements.
Annual Report
6. Fees and Other Transactions with Affiliates - continued
Transfer Agent Fees - continued
For the period, transfer agent fees for each class were as follows:
| Amount | % of
Class-Level Average
Net Assets |
Class A | $ 14,269 | .30 |
Class T | 6,765 | .33 |
Class C | 4,800 | .30 |
Emerging Markets Discovery | 149,981 | .22 |
Class I | 2,598 | .25 |
| $ 178,413 | |
Accounting and Security Lending Fees. Fidelity Service Company, Inc. (FSC), an affiliate of the investment adviser, maintains the Fund's accounting records. The accounting fee is based on the level of average net assets for each month. Under a separate contract, FSC administers the security lending program. The security lending fee is based on the number and duration of lending transactions.
Brokerage Commissions. The Fund placed a portion of its portfolio transactions with brokerage firms which are affiliates of the investment adviser. Brokerage commissions are included in net realized gain (loss) and change in net unrealized appreciation (depreciation) in the Statement of Operations. The commissions paid to these affiliated firms were $608 for the period.
7. Committed Line of Credit.
The Fund participates with other funds managed by the investment adviser or an affiliate in a $4.25 billion credit facility (the "line of credit") to be utilized for temporary or emergency purposes to fund shareholder redemptions or for other short-term liquidity purposes. The Fund has agreed to pay commitment fees on its pro-rata portion of the line of credit, which amounted to $114 and is reflected in Miscellaneous expenses on the Statement of Operations. During the period, the Fund did not borrow on this line of credit.
Annual Report
Notes to Financial Statements - continued
8. Security Lending.
The Fund lends portfolio securities through a lending agent from time to time in order to earn additional income. For equity securities, a lending agent is used and may loan securities to certain qualified borrowers, including Fidelity Capital Markets (FCM), a broker-dealer affiliated with the Fund. On the settlement date of the loan, the Fund receives collateral (in the form of U.S. Treasury obligations, letters of credit and/or cash) against the loaned securities and maintains collateral in an amount not less than 100% of the market value of the loaned securities during the period of the loan. The market value of the loaned securities is determined at the close of business of the Fund and any additional required collateral is delivered to the Fund on the next business day. The Fund or borrower may terminate the loan at any time, and if the borrower defaults on its obligation to return the securities loaned because of insolvency or other reasons, the Fund may apply collateral received from the borrower against the obligation. The Fund may experience delays and costs in recovering the securities loaned. Any cash collateral received is invested in the Fidelity Securities Lending Cash Central Fund. The value of loaned securities and cash collateral at period end are disclosed on the Fund's Statement of Assets and Liabilities. Security lending income represents the income earned on investing cash collateral, less rebates paid to borrowers and any lending agent fees associated with the loan, plus any premium payments received for lending certain types of securities. Security lending income is presented in the Statement of Operations as a component of income from Fidelity Central Funds. Total security lending income during the period amounted to $7,859. During the period, there were no securities loaned to FCM.
9. Expense Reductions.
The investment adviser contractually agreed to reimburse each class to the extent annual operating expenses exceeded certain levels of average net assets as noted in the table below. This reimbursement will remain in place through December 31, 2016. Some expenses, for example interest expense, including commitment fees, are excluded from this reimbursement.
The following classes were in reimbursement during the period:
| Expense
Limitations | Reimbursement |
Class A | 1.70% | $ 8,649 |
Class T | 1.95% | 4,276 |
Class C | 2.45% | 2,999 |
Emerging Markets Discovery | 1.45% | 72,186 |
Class I | 1.45% | 950 |
| | $ 89,060 |
Annual Report
9. Expense Reductions - continued
Commissions paid to certain brokers with whom the investment adviser, or its affiliates, places trades on behalf of the Fund include an amount in addition to trade execution, which may be rebated back to the Fund to offset certain expenses. This amount totaled $8,674 for the period.
In addition, during the period the investment adviser reimbursed and/or waived a portion of fund-level operating expenses in the amount of $334 and a portion of class-level operating expenses as follows:
| Amount |
Class A | $ 36 |
Class T | 4 |
Class C | 16 |
Emerging Markets Discovery | 2,141 |
Class I | 30 |
| $ 2,227 |
10. Distributions to Shareholders.
Distributions to shareholders of each class were as follows:
Years ended October 31, | 2015 | 2014 |
From net investment income | | |
Class A | $ - | $ 23,688 |
Class T | - | 2,475 |
Emerging Markets Discovery | - | 646,254 |
Class I | - | 4,063 |
Total | $ - | $ 676,480 |
From net realized gain | | |
Class A | $ - | $ 122,525 |
Class T | - | 43,668 |
Class C | - | 51,356 |
Emerging Markets Discovery | - | 2,280,897 |
Class I | - | 22,163 |
Total | $ - | $ 2,520,609 |
Annual Report
Notes to Financial Statements - continued
11. Share Transactions.
Share transactions for each class were as follows and may contain automatic conversions between classes or exchanges between funds:
| Shares | Dollars |
Years ended October 31, | 2015 | 2014 | 2015 | 2014 |
Class A | | | | |
Shares sold | 161,641 | 147,354 | $ 1,908,467 | $ 1,789,001 |
Reinvestment of distributions | - | 10,958 | - | 133,251 |
Shares redeemed | (93,262) | (205,580) | (1,088,220) | (2,490,439) |
Net increase (decrease) | 68,379 | (47,268) | $ 820,247 | $ (568,187) |
Class T | | | | |
Shares sold | 59,344 | 52,146 | $ 694,558 | $ 631,489 |
Reinvestment of distributions | - | 3,566 | - | 43,325 |
Shares redeemed | (41,200) | (42,178) | (472,328) | (507,088) |
Net increase (decrease) | 18,144 | 13,534 | $ 222,230 | $ 167,726 |
Class C | | | | |
Shares sold | 68,780 | 92,257 | $ 796,943 | $ 1,143,008 |
Reinvestment of distributions | - | 4,241 | - | 51,185 |
Shares redeemed | (57,921) | (119,225) | (667,642) | (1,424,170) |
Net increase (decrease) | 10,859 | (22,727) | $ 129,301 | $ (229,977) |
Emerging Markets Discovery | | | | |
Shares sold | 2,311,392 | 2,185,123 | $ 27,313,497 | $ 26,469,903 |
Reinvestment of distributions | - | 205,996 | - | 2,506,974 |
Shares redeemed | (3,121,418) | (3,696,612) | (36,074,220) | (44,026,941) |
Net increase (decrease) | (810,026) | (1,305,493) | $ (8,760,723) | $ (15,050,064) |
Class I | | | | |
Shares sold | 209,924 | 25,831 | $ 2,474,235 | $ 324,477 |
Reinvestment of distributions | - | 824 | - | 10,052 |
Shares redeemed | (121,211) | (73,327) | (1,373,121) | (870,835) |
Net increase (decrease) | 88,713 | (46,672) | $ 1,101,114 | $ (536,306) |
12. Other.
The Fund's organizational documents provide former and current trustees and officers with a limited indemnification against liabilities arising in connection with the performance of their duties to the Fund. In the normal course of business, the Fund may also enter into contracts that provide general indemnifications. The Fund's maximum exposure under these arrangements is unknown as this would be dependent on future claims that may be made against the Fund. The risk of material loss from such claims is considered remote.
Annual Report
Fidelity Total Emerging Markets Fund
Average annual total return reflects the change in the value of an investment, assuming reinvestment of the class' distributions from dividend income and capital gains (the profits earned upon the sale of securities that have grown in value, if any) and assuming a constant rate of performance each year. The $10,000 table and the fund's returns do not reflect the deduction of taxes that a shareholder would pay on fund distributions or the redemption of fund shares. During periods of reimbursement by Fidelity, a fund's total return will be greater than it would be had the reimbursement not occurred. How a fund did yesterday is no guarantee of how it will do tomorrow.
Average Annual Total Returns
Periods ended October 31, 2015 | Past 1
year | Life of
fund A |
Fidelity Total Emerging Markets Fund | -8.74% | 2.36% |
A From November 1, 2011.
$10,000 Over Life of Fund
Let's say hypothetically that $10,000 was invested in Fidelity Total Emerging Markets Fund, a class of the fund, on November 1, 2011, when the fund started. The chart shows how the value of your investment would have changed, and also shows how the MSCI Emerging Markets Index performed over the same period.
Annual Report
Fidelity Total Emerging Markets Fund
Market Recap: Following a tough time in August and September wherein a collapse in commodities prices hurt resources-related sectors and geographies, global equities rebounded in October to finish flat for the year ending October 31, 2015. The MSCI ACWI (All Country World Index) Index returned 0.35% for the period. Among market sectors, energy (-22%) and materials (-12%) declined sharply, whereas consumer discretionary (+13%) saw a gain driven largely by demand in the U.S. (+5%). Commodity prices and producers remained under pressure, largely from economic deceleration in China (-1%), a leading consumer of raw materials. This effect was exacerbated by U.S. dollar strength relative to global currencies, which weighed on commodities priced in dollars and acutely impacted equity returns within regions most exposed to resources prices. The emerging-markets (EM) group, for example, returned -15% this period. Canada, a significant energy producer, returned -17%. Net energy consumer Japan (+9%) proved the best-performing region by far. In fixed income, the Barclays Global Aggregate GDP Weighted Index returned -3.85% for the year, despite a modest gain from the U.S., the world's largest bond market. Investors continued to seek safe haven in U.S. bonds amid economic weakness throughout much of Europe and parts of Asia. EM and Canadian debt roughly paralleled equity underperformance.
Comments from Lead Portfolio Manager John Carlson: For the year, the fund's share classes (excluding sales charges, if applicable) turned in high-single-digit declines, straddling the -8.76% return of the Fidelity Total Emerging Markets Composite Index. For the full year, the fund held an overweighting, on average, in equity and a corresponding underweighting in debt versus the Composite index, which, in aggregate, had only a marginal positive influence on relative performance. Security selection within the fund's equity subportfolio was the biggest contributor. From a geographical perspective, equity investments in India, Malaysia and Mexico were helpful. Among sectors, picks in telecommunication services, consumer staples, information technology and materials lifted performance most, whereas choices in health care hurt. Looking at individual stocks, our substantial overweighting in China Life Insurance was the equity sleeve's top relative contributor this period. Conversely, an overweighting in underperforming Daewoo International, South Korea's largest trading company, was the fund's biggest individual detractor. The stock underperformed due to the businesses' link to global oil prices, which fell by nearly 50% during the period.
Note to shareholders: Xiatong Zhao was named Co-Manager of the fund, effective October 1, 2015.
The views expressed above reflect those of the portfolio manager(s) only through the end of the period as stated on the cover of this report and do not necessarily represent the views of Fidelity or any other person in the Fidelity organization. Any such views are subject to change at any time based upon market or other conditions and Fidelity disclaims any responsibility to update such views. These views may not be relied on as investment advice and, because investment decisions for a Fidelity fund are based on numerous factors, may not be relied on as an indication of trading intent on behalf of any Fidelity fund.
Annual Report
Fidelity Total Emerging Markets Fund
Shareholder Expense Example
As a shareholder of the Fund, you incur two types of costs: (1) transaction costs, including sales charges (loads) on purchase payments or redemption proceeds, redemption fees and (2) ongoing costs, including management fees, distribution and/or service (12b-1) fees and other Fund expenses. This Example is intended to help you understand your ongoing costs (in dollars) of investing in the Fund and to compare these costs with the ongoing costs of investing in other mutual funds.
The Example is based on an investment of $1,000 invested at the beginning of the period and held for the entire period (May 1, 2015 to October 31, 2015).
Actual Expenses
The first line of the accompanying table for each class of the Fund provides information about actual account values and actual expenses. You may use the information in this line, together with the amount you invested, to estimate the expenses that you paid over the period. Simply divide your account value by $1,000.00 (for example, an $8,600 account value divided by $1,000.00 = 8.6), then multiply the result by the number in the first line for a class of the Fund under the heading entitled "Expenses Paid During Period" to estimate the expenses you paid on your account during this period. A small balance maintenance fee of $12.00 that is charged once a year may apply for certain accounts with a value of less than $2,000. This fee is not included in the table below. If it was, the estimate of expenses you paid during the period would be higher, and your ending account value lower, by this amount. In addition, the Fund, as a shareholder in the underlying Fidelity Central Funds, will indirectly bear its pro-rata share of the fees and expenses incurred by the underlying Fidelity Central Funds. These fees and expenses are not included in the Fund's annualized expense ratio used to calculate the expense estimate in the table below.
Hypothetical Example for Comparison Purposes
The second line of the accompanying table for each class of the Fund provides information about hypothetical account values and hypothetical expenses based on a Class' actual expense ratio and an assumed rate of return of 5% per year before expenses, which is not the Class' actual return. The hypothetical account values and expenses may not be used to estimate the actual ending account balance or expenses you paid for the period. You may use this information to compare the ongoing costs of investing in the Fund and other funds. To do so, compare this 5% hypothetical example with the 5% hypothetical examples that appear in the shareholder reports of the other funds. A small balance maintenance fee of $12.00 that is charged once a year may apply for certain accounts with a value of less than $2,000. This fee is not included in the table below. If it was, the estimate of expenses you paid during the period would be higher, and your ending account value lower, by this amount. In addition, the Fund, as a shareholder in the underlying Fidelity Central Funds, will indirectly bear its pro-rata share of the fees and expenses incurred by the underlying Fidelity Central Funds. These fees and expenses are not included in the Fund's annualized expense ratio used to calculate the expense estimate in the table below.
Please note that the expenses shown in the table are meant to highlight your ongoing costs only and do not reflect any transaction costs. Therefore, the second line of the table is useful in comparing ongoing costs only, and will not help you determine the relative total costs of owning different funds. In addition, if these transactional costs were included, your costs would have been higher.
Annual Report
| Annualized
Expense RatioB | Beginning
Account Value
May 1, 2015 | Ending
Account Value
October 31, 2015 | Expenses Paid
During PeriodC
May 1, 2015 to
October 31, 2015 |
Class A | 1.65% | | | |
Actual | | $ 1,000.00 | $ 900.00 | $ 7.90 |
HypotheticalA | | $ 1,000.00 | $ 1,016.89 | $ 8.39 |
Class T | 1.90% | | | |
Actual | | $ 1,000.00 | $ 898.30 | $ 9.09 |
HypotheticalA | | $ 1,000.00 | $ 1,015.63 | $ 9.65 |
Class C | 2.40% | | | |
Actual | | $ 1,000.00 | $ 896.00 | $ 11.47 |
HypotheticalA | | $ 1,000.00 | $ 1,013.11 | $ 12.18 |
Total Emerging Markets | 1.40% | | | |
Actual | | $ 1,000.00 | $ 901.00 | $ 6.71 |
HypotheticalA | | $ 1,000.00 | $ 1,018.15 | $ 7.12 |
Class I | 1.40% | | | |
Actual | | $ 1,000.00 | $ 900.20 | $ 6.71 |
HypotheticalA | | $ 1,000.00 | $ 1,018.15 | $ 7.12 |
A 5% return per year before expenses
B Annualized expense ratio reflects expenses net of applicable fee waivers.
C Expenses are equal to each Class' annualized expense ratio, multiplied by the average account value over the period, multiplied by 184/365 (to reflect the one-half year period).
Annual Report
Fidelity Total Emerging Markets Fund
Investment Changes (Unaudited)
Top Five Stocks as of October 31, 2015 |
| % of fund's
net assets | % of fund's net assets
6 months ago |
Taiwan Semiconductor Manufacturing Co. Ltd. (Taiwan, Semiconductors & Semiconductor Equipment) | 2.0 | 2.2 |
Tencent Holdings Ltd. (Cayman Islands, Internet Software & Services) | 1.7 | 1.5 |
Samsung Electronics Co. Ltd. (Korea (South), Technology Hardware, Storage & Peripherals) | 1.4 | 2.4 |
Industrial & Commercial Bank of China Ltd. (H Shares) (China, Banks) | 1.2 | 1.3 |
Naspers Ltd. Class N (South Africa, Media) | 1.2 | 1.1 |
| 7.5 | |
Top Five Market Sectors as of October 31, 2015 |
| % of fund's
net assets | % of fund's net assets
6 months ago |
Financials | 17.5 | 19.0 |
Energy | 14.9 | 13.6 |
Information Technology | 10.9 | 12.5 |
Consumer Staples | 5.7 | 5.2 |
Consumer Discretionary | 5.7 | 5.5 |
Top Five Countries as of October 31, 2015 |
(excluding cash equivalents) | % of fund's
net assets | % of fund's net assets
6 months ago |
Korea (South) | 9.3 | 9.6 |
Cayman Islands | 7.0 | 6.0 |
China | 6.3 | 7.1 |
Mexico | 6.2 | 5.8 |
India | 5.3 | 6.3 |
Percentages are adjusted for the effect of open futures contracts, if applicable. |
Annual Report
Fidelity Total Emerging Markets Fund
Investments October 31, 2015
Showing Percentage of Net Assets
Common Stocks - 52.1% |
| Shares | | Value |
Argentina - 0.3% |
Telecom Argentina SA Class B sponsored ADR | 2,280 | | $ 44,483 |
YPF SA Class D sponsored ADR | 5,900 | | 126,024 |
TOTAL ARGENTINA | | 170,507 |
Austria - 0.1% |
Erste Group Bank AG (a) | 3,133 | | 91,884 |
Bermuda - 0.7% |
Aquarius Platinum Ltd. (Australia) (a) | 312,441 | | 54,187 |
China Resource Gas Group Ltd. | 24,000 | | 65,833 |
Credicorp Ltd. (United States) | 1,319 | | 149,284 |
GP Investments Ltd. Class A (depositary receipt) (a) | 30,222 | | 55,953 |
Shangri-La Asia Ltd. | 122,000 | | 111,650 |
TOTAL BERMUDA | | 436,907 |
Brazil - 1.6% |
B2W Companhia Global do Varejo (a) | 7,594 | | 28,710 |
BB Seguridade Participacoes SA | 15,070 | | 103,943 |
CCR SA | 33,000 | | 103,709 |
Cielo SA | 14,740 | | 139,926 |
Companhia de Saneamento de Minas Gerais | 13,546 | | 45,662 |
Cosan SA Industria e Comercio | 15,733 | | 100,806 |
Direcional Engenharia SA | 50,700 | | 46,538 |
Fibria Celulose SA | 15,200 | | 207,472 |
FPC Par Corretora de Seguros | 23,400 | | 65,469 |
Minerva SA (a) | 42,300 | | 139,956 |
Smiles SA | 8,400 | | 65,561 |
TOTAL BRAZIL | | 1,047,752 |
British Virgin Islands - 0.1% |
Mail.Ru Group Ltd. GDR (Reg. S) (a) | 2,586 | | 50,427 |
Canada - 0.3% |
Goldcorp, Inc. | 3,000 | | 38,383 |
Pan American Silver Corp. | 13,700 | | 103,709 |
Torex Gold Resources, Inc. (a) | 36,200 | | 34,329 |
TOTAL CANADA | | 176,421 |
Cayman Islands - 5.3% |
51job, Inc. sponsored ADR (a) | 2,500 | | 84,525 |
58.com, Inc. ADR (a) | 5,750 | | 301,818 |
AAC Technology Holdings, Inc. | 11,000 | | 69,760 |
Alibaba Group Holding Ltd. sponsored ADR (a) | 4,700 | | 394,001 |
Baidu.com, Inc. sponsored ADR (a) | 200 | | 37,494 |
Common Stocks - continued |
| Shares | | Value |
Cayman Islands - continued |
Bitauto Holdings Ltd. ADR (a) | 1,100 | | $ 35,090 |
China ZhengTong Auto Services Holdings Ltd. | 146,160 | | 65,410 |
Ctrip.com International Ltd. sponsored ADR (a) | 1,200 | | 111,564 |
ENN Energy Holdings Ltd. | 33,773 | | 193,473 |
Eurasia Drilling Co. Ltd. GDR (Reg. S) | 4,900 | | 55,615 |
Haitian International Holdings Ltd. | 28,000 | | 48,992 |
Hengan International Group Co. Ltd. | 16,500 | | 178,174 |
Leju Holdings Ltd. ADR | 6,448 | | 46,426 |
NetEase, Inc. sponsored ADR | 100 | | 14,453 |
Qunar Cayman Islands Ltd. sponsored ADR (a) | 4,500 | | 218,430 |
SINA Corp. (a) | 800 | | 38,112 |
Sino Biopharmaceutical Ltd. | 76,000 | | 94,445 |
SouFun Holdings Ltd. ADR | 4,500 | | 31,815 |
Sunny Optical Technology Group Co. Ltd. | 31,000 | | 72,079 |
Tencent Holdings Ltd. | 60,900 | | 1,147,927 |
Uni-President China Holdings Ltd. | 297,600 | | 243,742 |
TOTAL CAYMAN ISLANDS | | 3,483,345 |
Chile - 1.1% |
Compania Cervecerias Unidas SA sponsored ADR | 7,100 | | 170,187 |
Empresas CMPC SA | 50,670 | | 124,852 |
Enersis SA | 412,664 | | 109,200 |
Inversiones La Construccion SA | 8,038 | | 91,358 |
Vina Concha y Toro SA | 123,422 | | 210,239 |
TOTAL CHILE | | 705,836 |
China - 5.8% |
Anhui Conch Cement Co. Ltd. (H Shares) | 60,000 | | 183,078 |
BBMG Corp. (H Shares) | 267,500 | | 187,458 |
China Cinda Asset Management Co. Ltd. (H Shares) | 214,840 | | 83,529 |
China Life Insurance Co. Ltd. (H Shares) | 107,260 | | 386,789 |
China Longyuan Power Grid Corp. Ltd. (H Shares) | 69,970 | | 63,970 |
China Machinery Engineering Co. (H Shares) | 80,000 | | 69,432 |
China Pacific Insurance (Group) Co. Ltd. (H Shares) | 121,580 | | 484,301 |
China Petroleum & Chemical Corp. (H Shares) | 152,000 | | 109,568 |
China Suntien Green Energy Corp. Ltd. (H Shares) | 332,690 | | 59,316 |
China Telecom Corp. Ltd. (H Shares) | 433,059 | | 225,893 |
Daqin Railway Co. Ltd. (A Shares) | 60,300 | | 86,883 |
Industrial & Commercial Bank of China Ltd. (H Shares) | 1,271,260 | | 806,368 |
Inner Mongoli Yili Industries Co. Ltd. | 74,000 | | 186,138 |
Kweichow Moutai Co. Ltd. | 9,020 | | 304,549 |
Maanshan Iron & Steel Ltd. (H Shares) (a) | 244,000 | | 52,236 |
Common Stocks - continued |
| Shares | | Value |
China - continued |
PetroChina Co. Ltd. (H Shares) | 136,000 | | $ 106,475 |
Qingdao Haier Co. Ltd. | 143,700 | | 218,763 |
Zhengzhou Yutong Bus Co. Ltd. | 31,500 | | 108,495 |
Zhuzhou CSR Times Electric Co. Ltd. (H Shares) | 17,000 | | 110,049 |
TOTAL CHINA | | 3,833,290 |
Colombia - 0.2% |
Bancolombia SA sponsored ADR | 3,695 | | 127,921 |
Egypt - 0.1% |
Citadel Capital Corp. (a) | 170,400 | | 39,045 |
Greece - 0.3% |
Public Power Corp. of Greece | 2,506 | | 14,440 |
Titan Cement Co. SA (Reg.) | 7,400 | | 162,341 |
TOTAL GREECE | | 176,781 |
Hong Kong - 3.5% |
AIA Group Ltd. | 24,380 | | 142,948 |
China Mobile Ltd. | 15,110 | | 181,167 |
China Mobile Ltd. sponsored ADR | 9,480 | | 571,739 |
China Resources Beer Holdings Co. Ltd. | 74,000 | | 139,725 |
China Resources Power Holdings Co. Ltd. | 45,029 | | 101,863 |
China Unicom Ltd. | 10,990 | | 13,393 |
China Unicom Ltd. sponsored ADR | 5,406 | | 66,386 |
CNOOC Ltd. | 317,000 | | 358,055 |
CNOOC Ltd. sponsored ADR | 70 | | 7,958 |
Far East Horizon Ltd. | 392,564 | | 326,525 |
Lenovo Group Ltd. | 52,000 | | 48,315 |
Sinotruk Hong Kong Ltd. | 151,500 | | 63,060 |
Techtronic Industries Co. Ltd. | 66,000 | | 241,275 |
TOTAL HONG KONG | | 2,262,409 |
India - 5.3% |
Adani Ports & Special Economic Zone (a) | 26,087 | | 117,785 |
Axis Bank Ltd. (a) | 37,136 | | 268,957 |
Bharti Airtel Ltd. | 9,413 | | 50,142 |
Bharti Infratel Ltd. | 24,983 | | 148,382 |
Coal India Ltd. | 53,331 | | 260,304 |
Edelweiss Financial Services Ltd. | 62,457 | | 56,685 |
Eicher Motors Ltd. (a) | 450 | | 121,876 |
Grasim Industries Ltd. | 3,862 | | 219,209 |
ITC Ltd. | 69,734 | | 356,127 |
JK Cement Ltd. | 10,894 | | 113,885 |
Common Stocks - continued |
| Shares | | Value |
India - continued |
Larsen & Toubro Ltd. (a) | 5,849 | | $ 125,975 |
LIC Housing Finance Ltd. (a) | 14,923 | | 108,960 |
Lupin Ltd. | 9,017 | | 265,491 |
NTPC Ltd. | 13,829 | | 28,058 |
Oil & Natural Gas Corp. Ltd. | 31,237 | | 117,840 |
Petronet LNG Ltd. | 32,568 | | 96,522 |
Phoenix Mills Ltd. (a) | 21,082 | | 107,600 |
Power Grid Corp. of India Ltd. | 82,864 | | 162,892 |
SREI Infrastructure Finance Ltd. (a) | 136,028 | | 92,977 |
State Bank of India (a) | 66,221 | | 239,154 |
Tata Consultancy Services Ltd. | 8,565 | | 326,326 |
Yes Bank Ltd. (a) | 7,278 | | 84,114 |
TOTAL INDIA | | 3,469,261 |
Indonesia - 0.5% |
PT Bank Mandiri (Persero) Tbk | 196,000 | | 124,043 |
PT Bank Rakyat Indonesia Tbk | 174,900 | | 133,861 |
PT Kalbe Farma Tbk | 640,500 | | 66,705 |
PT Perusahaan Gas Negara Tbk Series B | 148,200 | | 32,370 |
TOTAL INDONESIA | | 356,979 |
Israel - 0.5% |
Bezeq The Israel Telecommunication Corp. Ltd. | 117,495 | | 252,624 |
Partner Communications Co. Ltd. (a) | 12,209 | | 55,410 |
TOTAL ISRAEL | | 308,034 |
Korea (South) - 8.3% |
AMOREPACIFIC Group, Inc. | 1,562 | | 220,256 |
BGFretail Co. Ltd. | 645 | | 96,035 |
Daewoo International Corp. | 3,552 | | 62,064 |
DOUBLEUGAMES Co. Ltd. | 472 | | 26,871 |
E-Mart Co. Ltd. | 1,406 | | 261,677 |
Fila Korea Ltd. | 2,319 | | 203,106 |
Hanon Systems | 1,976 | | 77,706 |
Hyundai Glovis Co. Ltd. | 1,418 | | 244,040 |
Hyundai Industrial Development & Construction Co. | 4,871 | | 196,458 |
Hyundai Mobis | 3,141 | | 660,238 |
KB Financial Group, Inc. | 5,866 | | 185,563 |
Korea Electric Power Corp. | 2,681 | | 120,529 |
Korea Zinc Co. Ltd. | 283 | | 117,486 |
Korean Reinsurance Co. | 19,619 | | 233,688 |
LG Chemical Ltd. | 1,413 | | 376,835 |
NAVER Corp. | 437 | | 229,643 |
Common Stocks - continued |
| Shares | | Value |
Korea (South) - continued |
NCSOFT Corp. | 317 | | $ 52,613 |
Samsung Electronics Co. Ltd. | 785 | | 943,290 |
Samsung Fire & Marine Insurance Co. Ltd. | 272 | | 76,113 |
Samsung Life Insurance Co. Ltd. | 1,434 | | 136,898 |
Samsung SDI Co. Ltd. | 360 | | 33,579 |
Shinhan Financial Group Co. Ltd. | 11,088 | | 422,539 |
SK Hynix, Inc. | 11,698 | | 314,537 |
SK Telecom Co. Ltd. | 80 | | 16,915 |
SK Telecom Co. Ltd. sponsored ADR | 4,960 | | 116,858 |
TOTAL KOREA (SOUTH) | | 5,425,537 |
Mauritius - 0.1% |
MakeMyTrip Ltd. (a) | 3,000 | | 47,880 |
Mexico - 3.5% |
America Movil S.A.B. de CV Series L sponsored ADR | 16,572 | | 295,147 |
Banregio Grupo Financiero S.A.B. de CV | 11,380 | | 61,393 |
El Puerto de Liverpool S.A.B. de CV Class C | 14,000 | | 194,424 |
Grupo Aeroportuario del Pacifico SA de CV Series B | 13,800 | | 124,292 |
Grupo Aeroportuario Norte S.A.B. de CV | 9,800 | | 50,407 |
Grupo Comercial Chedraui S.A.B. de CV | 34,576 | | 95,662 |
Grupo Financiero Banorte S.A.B. de CV Series O | 96,924 | | 521,945 |
Grupo Financiero Santander Mexico S.A.B. de CV | 44,200 | | 81,214 |
Infraestructura Energetica Nova S.A.B. de CV | 11,900 | | 57,383 |
Macquarie Mexican (REIT) | 227,130 | | 315,302 |
Promotora y Operadora de Infraestructura S.A.B. de CV (a) | 6,200 | | 77,739 |
Tenedora Nemak SA de CV (a) | 53,900 | | 77,957 |
Wal-Mart de Mexico SA de CV Series V | 137,800 | | 363,567 |
TOTAL MEXICO | | 2,316,432 |
Netherlands - 0.3% |
Cnova NV (a) | 6,600 | | 19,800 |
Hangzhou Hikvision Digital Technology Co. Ltd. ELS (BNP Paribas Arbitrage Warrant Program) warrants 10/21/16 (a) | 15,500 | | 84,430 |
Yandex NV (a) | 5,237 | | 84,316 |
TOTAL NETHERLANDS | | 188,546 |
Nigeria - 0.4% |
Guaranty Trust Bank PLC GDR (Reg. S) | 10,580 | | 60,835 |
Transnational Corp. of Nigeria PLC | 3,557,220 | | 32,346 |
Zenith Bank PLC | 1,780,503 | | 157,432 |
TOTAL NIGERIA | | 250,613 |
Common Stocks - continued |
| Shares | | Value |
Pakistan - 0.2% |
Habib Bank Ltd. | 66,300 | | $ 131,764 |
Panama - 0.1% |
Copa Holdings SA Class A | 2,000 | | 101,040 |
Philippines - 0.9% |
Alliance Global Group, Inc. | 321,850 | | 125,047 |
Metro Pacific Investments Corp. | 722,000 | | 80,328 |
Metropolitan Bank & Trust Co. | 80,721 | | 146,571 |
Robinsons Land Corp. | 410,280 | | 268,201 |
TOTAL PHILIPPINES | | 620,147 |
Russia - 1.6% |
E.ON Russia JSC (a) | 1,222,700 | | 58,169 |
Lukoil PJSC sponsored ADR | 9,600 | | 348,480 |
Mobile TeleSystems OJSC (a) | 24,172 | | 78,658 |
NOVATEK OAO GDR (Reg. S) | 2,600 | | 237,770 |
Sberbank of Russia (a) | 59,060 | | 83,738 |
Sberbank of Russia sponsored ADR | 32,984 | | 202,291 |
Sistema JSFC (a) | 169,200 | | 46,807 |
Sistema JSFC sponsored GDR | 3,860 | | 26,827 |
TOTAL RUSSIA | | 1,082,740 |
Singapore - 0.2% |
First Resources Ltd. | 90,100 | | 120,695 |
South Africa - 2.8% |
Aspen Pharmacare Holdings Ltd. | 8,021 | | 180,144 |
Barclays Africa Group Ltd. | 26,942 | | 345,755 |
Bidvest Group Ltd. | 6,756 | | 172,818 |
JSE Ltd. | 7,710 | | 74,376 |
Life Healthcare Group Holdings Ltd. | 46,600 | | 129,978 |
Naspers Ltd. Class N | 5,200 | | 761,645 |
Sasol Ltd. | 2,800 | | 89,717 |
Telkom SA Ltd. | 13,510 | | 70,972 |
TOTAL SOUTH AFRICA | | 1,825,405 |
Taiwan - 4.7% |
Advanced Semiconductor Engineering, Inc. | 44,000 | | 50,794 |
Advantech Co. Ltd. | 22,000 | | 158,232 |
ASUSTeK Computer, Inc. | 10,000 | | 89,635 |
Catcher Technology Co. Ltd. | 11,000 | | 108,424 |
E.SUN Financial Holdings Co. Ltd. | 368,946 | | 222,174 |
Hermes Microvision, Inc. | 1,000 | | 38,657 |
Hon Hai Precision Industry Co. Ltd. (Foxconn) | 39,555 | | 105,512 |
Common Stocks - continued |
| Shares | | Value |
Taiwan - continued |
Inotera Memories, Inc. (a) | 69,000 | | $ 53,347 |
King's Town Bank | 78,600 | | 62,706 |
Largan Precision Co. Ltd. | 2,000 | | 156,168 |
Taiwan Cement Corp. | 186,000 | | 207,399 |
Taiwan Fertilizer Co. Ltd. | 49,000 | | 62,712 |
Taiwan Semiconductor Manufacturing Co. Ltd. | 311,000 | | 1,310,382 |
Taiwan Semiconductor Manufacturing Co. Ltd. sponsored ADR | 1,542 | | 33,862 |
Unified-President Enterprises Corp. | 94,012 | | 159,269 |
Universal Cement Corp. | 97,654 | | 69,033 |
Vanguard International Semiconductor Corp. | 37,000 | | 47,810 |
Yuanta Financial Holding Co. Ltd. | 303,231 | | 119,555 |
TOTAL TAIWAN | | 3,055,671 |
Thailand - 1.5% |
Airports of Thailand PCL (For. Reg.) | 13,900 | | 116,191 |
Intouch Holdings PCL NVDR | 39,960 | | 84,214 |
Jasmine Broadband Internet Infrastructure Fund | 526,400 | | 153,998 |
Jasmine International Public Co. Ltd. | 84,500 | | 13,416 |
Kasikornbank PCL (For. Reg.) | 65,280 | | 315,778 |
PTT PCL (For. Reg.) | 22,900 | | 176,865 |
Thai Union Frozen Products PCL (For. Reg.) | 312,100 | | 155,058 |
TOTAL THAILAND | | 1,015,520 |
Turkey - 0.6% |
Aselsan A/S | 12,000 | | 57,419 |
Tupras Turkiye Petrol Rafinelleri A/S (a) | 7,000 | | 184,880 |
Turkiye Garanti Bankasi A/S | 47,864 | | 123,941 |
TOTAL TURKEY | | 366,240 |
United Arab Emirates - 0.6% |
DP World Ltd. | 4,418 | | 89,288 |
Emaar Properties PJSC | 53,120 | | 93,282 |
Emirates Telecommunications Corp. | 3,488 | | 14,529 |
First Gulf Bank PJSC | 63,878 | | 214,782 |
TOTAL UNITED ARAB EMIRATES | | 411,881 |
United Kingdom - 0.3% |
Fresnillo PLC | 8,200 | | 92,280 |
HSBC Holdings PLC (Hong Kong) | 16,000 | | 125,102 |
TOTAL UNITED KINGDOM | | 217,382 |
Common Stocks - continued |
| Shares | | Value |
United States of America - 0.3% |
Cognizant Technology Solutions Corp. Class A (a) | 2,620 | | $ 178,448 |
TOTAL COMMON STOCKS (Cost $31,801,701) |
34,092,740
|
Nonconvertible Preferred Stocks - 2.4% |
| | | |
Brazil - 1.2% |
Banco Bradesco SA (PN) sponsored ADR | 18,930 | | 102,979 |
Banco do Estado Rio Grande do Sul SA | 28,720 | | 44,608 |
Companhia Paranaense de Energia-Copel: | | | |
(PN-B) | 515 | | 4,340 |
(PN-B) sponsored | 8,502 | | 70,227 |
Itau Unibanco Holding SA sponsored ADR | 38,688 | | 265,013 |
Petroleo Brasileiro SA - Petrobras (PN) sponsored (non-vtg.) (a) | 37,506 | | 149,649 |
Telefonica Brasil SA | 4,890 | | 50,656 |
Vale SA (PN-A) sponsored ADR | 25,500 | | 91,800 |
TOTAL BRAZIL | | 779,272 |
Korea (South) - 1.0% |
Hyundai Motor Co. Series 2 | 2,535 | | 253,107 |
Samsung Electronics Co. Ltd. | 283 | | 296,194 |
Samsung Fire & Marine Insurance Co. Ltd. | 630 | | 110,631 |
TOTAL KOREA (SOUTH) | | 659,932 |
Russia - 0.2% |
Surgutneftegas OJSC (a) | 145,800 | | 99,386 |
TOTAL NONCONVERTIBLE PREFERRED STOCKS (Cost $2,121,719) |
1,538,590
|
Nonconvertible Bonds - 16.4% |
| Principal Amount | | |
Azerbaijan - 1.1% |
International Bank of Azerbaijan OJSC 5.625% 6/11/19 (Reg. S) | | $ 200,000 | | 184,016 |
State Oil Co. of Azerbaijan Republic: | | | | |
4.75% 3/13/23 (Reg. S) | | 325,000 | | 280,448 |
6.95% 3/18/30 (Reg. S) | | 275,000 | | 257,675 |
TOTAL AZERBAIJAN | | 722,139 |
Nonconvertible Bonds - continued |
| Principal Amount | | Value |
Brazil - 0.4% |
Caixa Economica Federal 3.5% 11/7/22 (d) | | $ 300,000 | | $ 241,500 |
Canada - 0.1% |
First Quantum Minerals Ltd. 7% 2/15/21 (d) | | 100,000 | | 74,000 |
Cayman Islands - 1.7% |
Lamar Funding Ltd. 3.958% 5/7/25 (d) | | 200,000 | | 187,340 |
Petrobras International Finance Co. Ltd.: | | | | |
3.5% 2/6/17 | | 200,000 | | 193,300 |
5.375% 1/27/21 | | 530,000 | | 431,288 |
8.375% 12/10/18 | | 300,000 | | 299,778 |
TOTAL CAYMAN ISLANDS | | 1,111,706 |
Chile - 0.3% |
Corporacion Nacional del Cobre de Chile (Codelco) 4.5% 9/16/25 (d) | | 200,000 | | 198,376 |
Indonesia - 1.9% |
PT Pertamina Persero: | | | | |
4.875% 5/3/22 (d) | | 275,000 | | 270,738 |
5.25% 5/23/21 (d) | | 200,000 | | 204,846 |
5.625% 5/20/43 (d) | | 200,000 | | 169,000 |
6% 5/3/42 (d) | | 400,000 | | 347,000 |
6.5% 5/27/41 (d) | | 275,000 | | 256,137 |
TOTAL INDONESIA | | 1,247,721 |
Ireland - 0.5% |
Vnesheconombank Via VEB Finance PLC: | | | | |
5.375% 2/13/17 (d) | | 250,000 | | 253,125 |
6.8% 11/22/25 (d) | | 100,000 | | 98,100 |
TOTAL IRELAND | | 351,225 |
Israel - 0.9% |
B Communications Ltd. 7.375% 2/15/21 (d) | | 300,000 | | 325,500 |
Israel Electric Corp. Ltd. 7.25% 1/15/19 (Reg. S) | | 250,000 | | 280,812 |
TOTAL ISRAEL | | 606,312 |
Kazakhstan - 1.9% |
Kazagro National Management Holding JSC 4.625% 5/24/23 (d) | | 400,000 | | 324,160 |
KazMunaiGaz Finance Sub BV: | | | | |
6% 11/7/44 (d) | | 200,000 | | 156,304 |
9.125% 7/2/18 (d) | | 200,000 | | 220,556 |
Nonconvertible Bonds - continued |
| Principal Amount | | Value |
Kazakhstan - continued |
KazMunaiGaz National Co. 5.75% 4/30/43 (d) | | $ 300,000 | | $ 230,926 |
Zhaikmunai International BV 7.125% 11/13/19 (d) | | 350,000 | | 285,250 |
TOTAL KAZAKHSTAN | | 1,217,196 |
Luxembourg - 0.9% |
RSHB Capital SA: | | | | |
5.1% 7/25/18 (d) | | 400,000 | | 398,500 |
6.299% 5/15/17 (Reg. S) | | 200,000 | | 204,152 |
TOTAL LUXEMBOURG | | 602,652 |
Mexico - 2.4% |
Pemex Project Funding Master Trust 6.625% 6/15/35 | | 350,000 | | 344,313 |
Petroleos Mexicanos: | | | | |
6.5% 6/2/41 | | 425,000 | | 407,915 |
6.625% (d)(e) | | 850,000 | | 838,525 |
TOTAL MEXICO | | 1,590,753 |
Netherlands - 0.6% |
Petrobras Global Finance BV: | | | | |
6.85% 6/5/2115 | | 215,000 | | 147,533 |
7.25% 3/17/44 | | 300,000 | | 223,200 |
TOTAL NETHERLANDS | | 370,733 |
South Africa - 0.4% |
Eskom Holdings SOC Ltd. 6.75% 8/6/23 (d) | | 300,000 | | 278,550 |
Trinidad & Tobago - 0.3% |
Petroleum Co. of Trinidad & Tobago Ltd. 9.75% 8/14/19 (d) | | 150,000 | | 160,500 |
Tunisia - 0.3% |
Banque Centrale de Tunisie 5.75% 1/30/25 (d) | | 200,000 | | 187,532 |
Turkey - 0.4% |
Arcelik A/S 5% 4/3/23 (d) | | 300,000 | | 280,860 |
United Kingdom - 0.2% |
Biz Finance PLC 9.625% 4/27/22 (d) | | 150,000 | | 136,088 |
Venezuela - 2.1% |
Petroleos de Venezuela SA: | | | | |
5.25% 4/12/17 | | 300,000 | | 168,750 |
5.5% 4/12/37 | | 500,000 | | 171,000 |
6% 11/15/26 (Reg. S) | | 700,000 | | 247,380 |
8.5% 11/2/17 (d) | | 250,000 | | 151,850 |
9% 11/17/21 (Reg. S) | | 550,000 | | 227,040 |
Nonconvertible Bonds - continued |
| Principal Amount | | Value |
Venezuela - continued |
Petroleos de Venezuela SA: - continued | | | | |
9.75% 5/17/35 (d) | | $ 300,000 | | $ 124,500 |
12.75% 2/17/22 (d) | | 600,000 | | 298,500 |
TOTAL VENEZUELA | | 1,389,020 |
TOTAL NONCONVERTIBLE BONDS (Cost $11,880,507) |
10,766,863
|
Government Obligations - 24.5% |
|
Armenia - 0.5% |
Republic of Armenia 6% 9/30/20 (d) | | 325,000 | | 321,250 |
Barbados - 0.5% |
Barbados Government 7% 8/4/22 (d) | | 350,000 | | 344,920 |
Belize - 0.4% |
Belize Government 5% 2/20/38 (c)(d) | | 332,500 | | 243,556 |
Bolivia - 0.3% |
Plurinational State of Bolivia 4.875% 10/29/22 (d) | | 200,000 | | 200,750 |
Brazil - 2.0% |
Brazilian Federative Republic: | | | | |
4.25% 1/7/25 | | 850,000 | | 753,313 |
7.125% 1/20/37 | | 100,000 | | 97,250 |
8.25% 1/20/34 | | 275,000 | | 293,563 |
12.25% 3/6/30 | | 100,000 | | 152,750 |
TOTAL BRAZIL | | 1,296,876 |
Colombia - 0.4% |
Colombian Republic 7.375% 9/18/37 | | 225,000 | | 261,000 |
Congo - 0.4% |
Congo Republic 4% 6/30/29 (c) | | 299,250 | | 245,385 |
Costa Rica - 0.8% |
Costa Rican Republic: | | | | |
4.375% 4/30/25 (d) | | 225,000 | | 194,625 |
7% 4/4/44 (d) | | 200,000 | | 180,000 |
7.158% 3/12/45 (d) | | 200,000 | | 180,500 |
TOTAL COSTA RICA | | 555,125 |
Government Obligations - continued |
| Principal Amount | | Value |
Dominican Republic - 0.5% |
Dominican Republic: | | | | |
6.6% 1/28/24 (d) | | $ 100,000 | | $ 106,250 |
7.45% 4/30/44 (d) | | 200,000 | | 211,000 |
TOTAL DOMINICAN REPUBLIC | | 317,250 |
Ecuador - 0.2% |
Ecuador Republic 7.95% 6/20/24 (d) | | 200,000 | | 152,000 |
Egypt - 0.2% |
Arab Republic of Egypt 6.875% 4/30/40 (d) | | 150,000 | | 134,400 |
El Salvador - 0.4% |
El Salvador Republic: | | | | |
7.375% 12/1/19 | | 100,000 | | 102,375 |
7.625% 2/1/41 (d) | | 150,000 | | 133,500 |
TOTAL EL SALVADOR | | 235,875 |
Ethiopia - 0.3% |
Federal Democratic Republic of Ethiopia 6.625% 12/11/24 (d) | | 200,000 | | 186,500 |
Gabon - 0.3% |
Gabonese Republic 6.375% 12/12/24 (d) | | 200,000 | | 172,000 |
Georgia - 0.3% |
Georgia Republic 6.875% 4/12/21 (d) | | 200,000 | | 213,350 |
Ghana - 0.8% |
Ghana Republic: | | | | |
7.875% 8/7/23 (Reg.S) | | 200,000 | | 171,564 |
8.125% 1/18/26 (d) | | 200,000 | | 169,850 |
10.75% 10/14/30 (d) | | 200,000 | | 211,800 |
TOTAL GHANA | | 553,214 |
Hungary - 0.3% |
Hungarian Republic 5.75% 11/22/23 | | 200,000 | | 225,250 |
Iraq - 0.3% |
Republic of Iraq 5.8% 1/15/28 (Reg. S) | | 250,000 | | 183,125 |
Ivory Coast - 0.6% |
Ivory Coast: | | | | |
5.375% 7/23/24 (d) | | 200,000 | | 178,000 |
5.75% 12/31/32 | | 275,000 | | 244,750 |
TOTAL IVORY COAST | | 422,750 |
Government Obligations - continued |
| Principal Amount | | Value |
Jamaica - 0.2% |
Jamaican Government 8% 6/24/19 | | $ 150,000 | | $ 163,500 |
Kenya - 0.3% |
Republic of Kenya 6.875% 6/24/24 (d) | | 200,000 | | 185,450 |
Lebanon - 1.0% |
Lebanese Republic: | | | | |
5% 10/12/17 | | 100,000 | | 99,864 |
6.1% 10/4/22 | | 150,000 | | 149,100 |
6.65% 2/26/30(Reg. S) | | 125,000 | | 123,750 |
11.625% 5/11/16 (Reg. S) | | 250,000 | | 259,008 |
TOTAL LEBANON | | 631,722 |
Mexico - 0.3% |
United Mexican States 5.75% 10/12/2110 | | 200,000 | | 195,500 |
Mongolia - 0.3% |
Mongolian People's Republic 5.125% 12/5/22 (Reg. S) | | 200,000 | | 166,737 |
Netherlands - 0.4% |
Republic of Angola 7% 8/16/19 (Issued by Northern Lights III BV for Republic of Angola) (Reg. S) | | 250,000 | | 243,125 |
Pakistan - 0.3% |
Islamic Republic of Pakistan 7.25% 4/15/19 (d) | | 200,000 | | 207,800 |
Panama - 0.4% |
Panamanian Republic 8.875% 9/30/27 | | 200,000 | | 282,500 |
Philippines - 0.9% |
Philippine Republic 9.5% 2/2/30 | | 350,000 | | 564,088 |
Qatar - 0.5% |
State of Qatar 5.75% 1/20/42 (d) | | 250,000 | | 310,625 |
Romania - 0.3% |
Romanian Republic 6.75% 2/7/22 (d) | | 170,000 | | 202,640 |
Russia - 2.9% |
Russian Federation: | | | | |
5% 4/29/20 (d) | | 225,000 | | 236,531 |
5.625% 4/4/42 (d) | | 200,000 | | 199,300 |
5.875% 9/16/43 (d) | | 200,000 | | 205,300 |
7.5% 3/31/30 (Reg. S) | | 490,875 | | 583,826 |
12.75% 6/24/28 (Reg. S) | | 425,000 | | 692,750 |
TOTAL RUSSIA | | 1,917,707 |
Senegal - 0.3% |
Republic of Senegal 8.75% 5/13/21 (d) | | 200,000 | | 214,800 |
Government Obligations - continued |
| Principal Amount | | Value |
Serbia - 0.5% |
Republic of Serbia 7.25% 9/28/21 (d) | | $ 260,000 | | $ 297,154 |
South Africa - 0.4% |
South African Republic 5.875% 9/16/25 | | 250,000 | | 271,688 |
Sri Lanka - 0.5% |
Democratic Socialist Republic of Sri Lanka 6.25% 10/4/20 (d) | | 300,000 | | 301,200 |
Tanzania - 0.3% |
United Republic of Tanzania 6.5375% 3/9/20 (g) | | 200,000 | | 193,750 |
Turkey - 1.7% |
Turkish Republic: | | | | |
6.25% 9/26/22 | | 200,000 | | 222,000 |
7% 6/5/20 | | 250,000 | | 283,238 |
7.375% 2/5/25 | | 300,000 | | 358,821 |
11.875% 1/15/30 | | 165,000 | | 275,550 |
TOTAL TURKEY | | 1,139,609 |
Ukraine - 1.1% |
Ukraine Government: | | | | |
6.58% 11/21/16 (d) | | 250,000 | | 190,052 |
6.75% 11/14/17 (d) | | 200,000 | | 151,413 |
7.5% 4/17/23 (Reg. S) | | 250,000 | | 197,292 |
9.25% 7/24/17 (d) | | 200,000 | | 151,413 |
TOTAL UKRAINE | | 690,170 |
United States of America - 0.1% |
U.S. Treasury Bills, yield at date of purchase 0.01% to 0.04% 12/3/15 (f) | | 60,000 | | 59,999 |
Venezuela - 1.5% |
Venezuelan Republic: | | | | |
7% 3/31/38 | | 650,000 | | 242,125 |
8.25% 10/13/24 | | 300,000 | | 114,000 |
9% 5/7/23 (Reg. S) | | 300,000 | | 117,750 |
9.25% 9/15/27 | | 650,000 | | 284,375 |
9.25% 5/7/28 (Reg. S) | | 250,000 | | 98,125 |
12.75% 8/23/22 | | 325,000 | | 154,375 |
TOTAL VENEZUELA | | 1,010,750 |
Vietnam - 0.3% |
Vietnamese Socialist Republic 6.75% 1/29/20 (d) | | 200,000 | | 221,557 |
Government Obligations - continued |
| Principal Amount | | Value |
Zambia - 0.5% |
Republic of Zambia: | | | | |
5.375% 9/20/22 (d) | | $ 200,000 | | $ 148,000 |
8.97% 7/30/27 (d) | | 200,000 | | 167,500 |
TOTAL ZAMBIA | | 315,500 |
TOTAL GOVERNMENT OBLIGATIONS (Cost $16,800,604) |
16,052,147
|
Preferred Securities - 0.6% |
|
China - 0.5% |
Sinochem Group 5% (d)(e)(f) | | 300,000 | | 312,349 |
Colombia - 0.1% |
Colombia Telecomunicacines SA 8.5% (d)(e)(f) | | 100,000 | | 90,122 |
TOTAL PREFERRED SECURITIES (Cost $403,473) |
402,471
|
Money Market Funds - 2.2% |
| Shares | | |
Fidelity Cash Central Fund, 0.18% (b)
(Cost $1,436,463) | 1,436,463 | |
1,436,463
|
TOTAL INVESTMENT PORTFOLIO - 98.2% (Cost $64,444,467) | | 64,289,274 |
NET OTHER ASSETS (LIABILITIES) - 1.8% | | 1,203,567 |
NET ASSETS - 100% | $ 65,492,841 |
Futures Contracts |
| Expiration Date | | Underlying Face Amount at Value | | Unrealized Appreciation/
(Depreciation) |
Purchased |
Equity Index Contracts |
12 ICE E-mini MSCI Emerging Markets Index Contracts (United States) | Dec. 2015 | | $ 506,220 | | $ 22,118 |
|
The face value of futures purchased as a percentage of net assets is 0.8% |
Security Type Abbreviations |
ELS | - | Equity-Linked Security |
Legend |
(a) Non-income producing |
(b) Affiliated fund that is generally available only to investment companies and other accounts managed by Fidelity Investments. The rate quoted is the annualized seven-day yield of the fund at period end. A complete unaudited listing of the fund's holdings as of its most recent quarter end is available upon request. In addition, each Fidelity Central Fund's financial statements, which are not covered by the Fund's Report of Independent Registered Public Accounting Firm, are available on the SEC's website or upon request. |
(c) Security initially issued at one coupon which converts to a higher coupon at a specified date. The rate shown is the rate at period end. |
(d) Security exempt from registration under Rule 144A of the Securities Act of 1933. These securities may be resold in transactions exempt from registration, normally to qualified institutional buyers. At the end of the period, the value of these securities amounted to $14,025,720 or 21.4% of net assets. |
(e) Security is perpetual in nature with no stated maturity date. |
(f) Security or a portion of the security was pledged to cover margin requirements for futures contracts. At period end, the value of securities pledged amounted to $59,999. |
(g) Coupon rates for floating and adjustable rate securities reflect the rates in effect at period end. |
Affiliated Central Funds |
Information regarding fiscal year to date income earned by the Fund from investments in Fidelity Central Funds is as follows: |
Fund | Income earned |
Fidelity Cash Central Fund | $ 2,500 |
Fidelity Securities Lending Cash Central Fund | 640 |
Total | $ 3,140 |
Other Information |
Categorizations in the Schedule of Investments are based on country or territory of incorporation. |
The following is a summary of the inputs used, as of October 31, 2015, involving the Fund's assets and liabilities carried at fair value. The inputs or methodology used for valuing securities may not be an indication of the risk associated with investing in those securities. For more information on valuation inputs, and their aggregation into the levels used in the tables below, please refer to the Investment Valuation section in the accompanying Notes to Financial Statements. |
Valuation Inputs at Reporting Date: |
Description | Total | Level 1 | Level 2 | Level 3 |
Investments in Securities: | | | | |
Equities: | | | | |
Consumer Discretionary | $ 3,430,635 | $ 2,766,666 | $ 445,206 | $ 218,763 |
Consumer Staples | 3,401,056 | 1,716,848 | 1,684,208 | - |
Energy | 2,685,230 | 1,211,182 | 1,474,048 | - |
Financials | 9,828,939 | 4,391,939 | 5,437,000 | - |
Health Care | 736,763 | 310,122 | 426,641 | - |
Industrials | 2,457,584 | 1,363,799 | 1,093,785 | - |
Information Technology | 7,039,412 | 4,013,829 | 3,025,583 | - |
Materials | 2,498,684 | 1,688,631 | 810,053 | - |
Telecommunication Services | 2,424,618 | 1,612,438 | 812,180 | - |
Utilities | 1,128,409 | 359,421 | 768,988 | - |
Corporate Bonds | 10,766,863 | - | 10,766,863 | - |
Government Obligations | 16,052,147 | - | 16,052,147 | - |
Preferred Securities | 402,471 | - | 402,471 | - |
Money Market Funds | 1,436,463 | 1,436,463 | - | - |
Total Investments in Securities: | $ 64,289,274 | $ 20,871,338 | $ 43,199,173 | $ 218,763 |
Derivative Instruments: | | | | |
Assets | | | | |
Futures Contracts | $ 22,118 | $ 22,118 | $ - | $ - |
The following is a summary of transfers between Level 1 and Level 2 for the period ended October 31, 2015. Transfers are assumed to have occurred at the beginning of the period, and are primarily attributable to the valuation techniques used for foreign equity securities, as discussed in the accompanying Notes to Financial Statements: |
Transfers | Total |
Level 1 to Level 2 | $ 695,622 |
Level 2 to Level 1 | $ 2,488,814 |
Value of Derivative Instruments |
The following table is a summary of the Fund's value of derivative instruments by primary risk exposure as of October 31, 2015. For additional information on derivative instruments, please refer to the Derivative Instruments section in the accompanying Notes to Financial Statements. |
Primary Risk Exposure /
Derivative Type | Value |
| Asset | Liability |
Equity Risk | | |
Futures Contracts (a) | $ 22,118 | $ - |
(a) Reflects gross cumulative appreciation (depreciation) on futures contracts as presented in the Schedule of Investments. Only the period end receivable or payable for daily variation margin and net unrealized appreciation (depreciation) are presented in the Statement of Assets and Liabilities. |
Other Information |
The composition of credit quality ratings as a percentage of net assets is as follows (Unaudited): |
AAA,AA,A | 3.8% |
BBB | 10.8% |
BB | 12.3% |
B | 7.4% |
CCC,CC,C | 5.1% |
Not Rated | 2.0% |
Equities | 54.5% |
Short-Term Investments and Net Other Assets | 4.1% |
| 100.0% |
We have used ratings from Moody's Investors Service, Inc. Where Moody's® ratings are not available, we have used S&P® ratings. All ratings are as of the date indicated and do not reflect subsequent changes. |
See accompanying notes which are an integral part of the financial statements.
Annual Report
Fidelity Total Emerging Markets Fund
Statement of Assets and Liabilities
| | October 31, 2015 |
| | |
Assets | | |
Investment in securities, at value - See accompanying schedule: Unaffiliated issuers (cost $63,008,004) | $ 62,852,811 | |
Fidelity Central Funds (cost $1,436,463) | 1,436,463 | |
Total Investments (cost $64,444,467) | | $ 64,289,274 |
Cash | | 362,836 |
Foreign currency held at value (cost $65,956) | | 65,977 |
Receivable for investments sold | | 555,312 |
Receivable for fund shares sold | | 101,694 |
Dividends receivable | | 12,507 |
Interest receivable | | 575,898 |
Distributions receivable from Fidelity Central Funds | | 286 |
Receivable for daily variation margin for derivative instruments | | 1,896 |
Prepaid expenses | | 183 |
Receivable from investment adviser for expense reductions | | 28,742 |
Other receivables | | 27,900 |
Total assets | | 66,022,505 |
| | |
Liabilities | | |
Payable for investments purchased | $ 313,888 | |
Payable for fund shares redeemed | 59,882 | |
Accrued management fee | 43,392 | |
Distribution and service plan fees payable | 10,104 | |
Other affiliated payables | 15,645 | |
Other payables and accrued expenses | 86,753 | |
Total liabilities | | 529,664 |
| | |
Net Assets | | $ 65,492,841 |
Net Assets consist of: | | |
Paid in capital | | $ 65,852,157 |
Undistributed net investment income | | 1,546,081 |
Accumulated undistributed net realized gain (loss) on investments and foreign currency transactions | | (1,767,162) |
Net unrealized appreciation (depreciation) on investments and assets and liabilities in foreign currencies | | (138,235) |
Net Assets | | $ 65,492,841 |
See accompanying notes which are an integral part of the financial statements.
Annual Report
Statement of Assets and Liabilities - continued
| | October 31, 2015 |
Calculation of Maximum Offering Price | | |
Class A: | | |
Net Asset Value and redemption price per share ($10,164,340 ÷ 982,497 shares) | | $ 10.35 |
| | |
Maximum offering price per share (100/94.25 of $10.35) | | $ 10.98 |
Class T: | | |
Net Asset Value and redemption price per share ($3,331,226 ÷ 322,484 shares) | | $ 10.33 |
| | |
Maximum offering price per share (100/96.50 of $10.33) | | $ 10.70 |
Class C: | | |
Net Asset Value and offering price per share ($7,735,733 ÷ 754,353 shares)A | | $ 10.25 |
| | |
Total Emerging Markets: | | |
Net Asset Value, offering price and redemption price per share ($37,918,319 ÷ 3,652,776 shares) | | $ 10.38 |
| | |
Class I: | | |
Net Asset Value, offering price and redemption price per share ($6,343,223 ÷ 611,457 shares) | | $ 10.37 |
A Redemption price per share is equal to net asset value less any applicable contingent deferred sales charge.
See accompanying notes which are an integral part of the financial statements.
Annual Report
Fidelity Total Emerging Markets Fund
Financial Statements - continued
Statement of Operations
| Year ended October 31, 2015 |
| | |
Investment Income | | |
Dividends | | $ 1,105,140 |
Interest | | 1,976,845 |
Income from Fidelity Central Funds | | 3,140 |
Income before foreign taxes withheld | | 3,085,125 |
Less foreign taxes withheld | | (111,245) |
Total income | | 2,973,880 |
| | |
Expenses | | |
Management fee | $ 564,291 | |
Transfer agent fees | 172,623 | |
Distribution and service plan fees | 148,766 | |
Accounting and security lending fees | 36,603 | |
Custodian fees and expenses | 262,557 | |
Independent trustees' compensation | 305 | |
Registration fees | 64,805 | |
Audit | 94,841 | |
Legal | 176 | |
Miscellaneous | 612 | |
Total expenses before reductions | 1,345,579 | |
Expense reductions | (217,505) | 1,128,074 |
Net investment income (loss) | | 1,845,806 |
Realized and Unrealized Gain (Loss) | | |
Net realized gain (loss) on: | | |
Investment securities: | | |
Unaffiliated issuers (net of foreign taxes of $51,537) | (1,335,001) | |
Foreign currency transactions | (33,466) | |
Futures contracts | 28,498 | |
Total net realized gain (loss) | | (1,339,969) |
Change in net unrealized appreciation (depreciation) on: Investment securities (net of decrease in deferred foreign taxes of $94,055) | (7,238,306) | |
Assets and liabilities in foreign currencies | 2,727 | |
Futures contracts | 21,984 | |
Total change in net unrealized appreciation (depreciation) | | (7,213,595) |
Net gain (loss) | | (8,553,564) |
Net increase (decrease) in net assets resulting from operations | | $ (6,707,758) |
See accompanying notes which are an integral part of the financial statements.
Annual Report
Statement of Changes in Net Assets
| Year ended
October 31,
2015 | Year ended
October 31,
2014 |
Increase (Decrease) in Net Assets | | |
Operations | | |
Net investment income (loss) | $ 1,845,806 | $ 1,316,375 |
Net realized gain (loss) | (1,339,969) | 3,140,986 |
Change in net unrealized appreciation (depreciation) | (7,213,595) | (2,656,389) |
Net increase (decrease) in net assets resulting from operations | (6,707,758) | 1,800,972 |
Distributions to shareholders from net investment income | (1,198,750) | (1,381,318) |
Distributions to shareholders from net realized gain | (136,019) | - |
Total distributions | (1,334,769) | (1,381,318) |
Share transactions - net increase (decrease) | (6,024,786) | (8,457,450) |
Redemption fees | 16,471 | 27,840 |
Total increase (decrease) in net assets | (14,050,842) | (8,009,956) |
| | |
Net Assets | | |
Beginning of period | 79,543,683 | 87,553,639 |
End of period (including undistributed net investment income of $1,546,081 and undistributed net investment income of $1,150,725, respectively) | $ 65,492,841 | $ 79,543,683 |
See accompanying notes which are an integral part of the financial statements.
Annual Report
Financial Highlights - Fidelity Total Emerging Markets Fund Class A
Years ended October 31, | 2015 | 2014 | 2013 | 2012 F |
Selected Per-Share Data | | | | |
Net asset value, beginning of period | $ 11.56 | $ 11.37 | $ 10.86 | $ 10.00 |
Income from Investment Operations | | | | |
Net investment income (loss) C | .28 | .18 | .18 | .20 |
Net realized and unrealized gain (loss) | (1.30) | .19 | .48 | .68 |
Total from investment operations | (1.02) | .37 | .66 | .88 |
Distributions from net investment income | (.17) | (.18) | (.15) | (.02) |
Distributions from net realized gain | (.02) | - | (.01) | - |
Total distributions | (.19) | (.18) | (.16) | (.02) |
Redemption fees added to paid in capitalC | - H | - H | .01 | -H |
Net asset value, end of period | $ 10.35 | $ 11.56 | $ 11.37 | $ 10.86 |
Total ReturnA, B | (8.92)% | 3.30% | 6.23% | 8.80% |
Ratios to Average Net AssetsD, G | | | | |
Expenses before reductions | 1.93% | 1.98% | 1.89% | 1.87% |
Expenses net of fee waivers, if any | 1.65% | 1.65% | 1.65% | 1.65% |
Expenses net of all reductions | 1.64% | 1.65% | 1.62% | 1.62% |
Net investment income (loss) | 2.58% | 1.61% | 1.61% | 1.92% |
Supplemental Data | | | | |
Net assets, end of period (000 omitted) | $ 10,164 | $ 13,627 | $ 18,837 | $ 7,675 |
Portfolio turnover rateE | 80% | 102% | 120% | 70% |
A Total returns would have been lower if certain expenses had not been reduced during the applicable periods shown.
B Total returns do not include the effect of the sales charges.
C Calculated based on average shares outstanding during the period.
D Fees and expenses of any underlying Fidelity Central Funds are not included in the Fund's expense ratio. The Fund indirectly bears its proportionate share of the expenses of any underlying Fidelity Central Funds.
E Amount does not include the portfolio activity of any underlying Fidelity Central Funds.
F For the period November 1, 2011 (commencement of operations) to October 31, 2012.
G Expense ratios reflect operating expenses of the class. Expenses before reductions do not reflect amounts reimbursed by the investment adviser or reductions from brokerage service arrangements or reductions from other expense offset arrangements and do not represent the amount paid by the class during periods when reimbursements or reductions occur. Expense ratios before reductions for start-up periods may not be representative of longer-term operating periods. Expenses net of fee waivers reflect expenses after reimbursement by the investment adviser but prior to reductions from brokerage service arrangements or other expense offset arrangements. Expenses net of all reductions represent the net expenses paid by the class.
H Amount represents less than $.005 per share.
See accompanying notes which are an integral part of the financial statements.
Annual Report
Financial Highlights - Fidelity Total Emerging Markets Fund Class T
Years ended October 31, | 2015 | 2014 | 2013 | 2012 G |
Selected Per-Share Data | | | | |
Net asset value, beginning of period | $ 11.54 | $ 11.34 | $ 10.84 | $ 10.00 |
Income from Investment Operations | | | | |
Net investment income (loss) C | .25 | .15 | .15 | .17 |
Net realized and unrealized gain (loss) | (1.30) | .19 | .48 | .68 |
Total from investment operations | (1.05) | .34 | .63 | .85 |
Distributions from net investment income | (.14) | (.14) | (.12) | (.01) |
Distributions from net realized gain | (.02) | - | (.01) | - |
Total distributions | (.16) | (.14) | (.14) F | (.01) |
Redemption fees added to paid in capitalC | -I | -I | .01 | -I |
Net asset value, end of period | $ 10.33 | $ 11.54 | $ 11.34 | $ 10.84 |
Total ReturnA, B | (9.18)% | 3.04% | 5.93% | 8.56% |
Ratios to Average Net AssetsD, H | | | | |
Expenses before reductions | 2.27% | 2.32% | 2.13% | 2.10% |
Expenses net of fee waivers, if any | 1.90% | 1.90% | 1.90% | 1.90% |
Expenses net of all reductions | 1.89% | 1.90% | 1.88% | 1.87% |
Net investment income (loss) | 2.33% | 1.36% | 1.36% | 1.67% |
Supplemental Data | | | | |
Net assets, end of period (000 omitted) | $ 3,331 | $ 5,277 | $ 5,967 | $ 5,823 |
Portfolio turnover rateE | 80% | 102% | 120% | 70% |
A Total returns would have been lower if certain expenses had not been reduced during the applicable periods shown.
B Total returns do not include the effect of the sales charges.
C Calculated based on average shares outstanding during the period.
D Fees and expenses of any underlying Fidelity Central Funds are not included in the Fund's expense ratio. The Fund indirectly bears its proportionate share of the expenses of any underlying Fidelity Central Funds.
E Amount does not include the portfolio activity of any underlying Fidelity Central Funds.
F Total distributions of $.14 per share is comprised of distributions from net investment income of $.124 and distributions from net realized gain of $.014 per share.
G For the period November 1, 2011 (commencement of operations) to October 31, 2012.
H Expense ratios reflect operating expenses of the class. Expenses before reductions do not reflect amounts reimbursed by the investment adviser or reductions from brokerage service arrangements or reductions from other expense offset arrangements and do not represent the amount paid by the class during periods when reimbursements or reductions occur. Expense ratios before reductions for start-up periods may not be representative of longer-term operating periods. Expenses net of fee waivers reflect expenses after reimbursement by the investment adviser but prior to reductions from brokerage service arrangements or other expense offset arrangements. Expenses net of all reductions represent the net expenses paid by the class.
I Amount represents less than $.005 per share.
See accompanying notes which are an integral part of the financial statements.
Annual Report
Financial Highlights - Fidelity Total Emerging Markets Fund Class C
Years ended October 31, | 2015 | 2014 | 2013 | 2012 F |
Selected Per-Share Data | | | | |
Net asset value, beginning of period | $ 11.47 | $ 11.29 | $ 10.80 | $ 10.00 |
Income from Investment Operations | | | | |
Net investment income (loss) C | .20 | .10 | .09 | .12 |
Net realized and unrealized gain (loss) | (1.30) | .19 | .47 | .69 |
Total from investment operations | (1.10) | .29 | .56 | .81 |
Distributions from net investment income | (.10) | (.11) | (.07) | (.01) |
Distributions from net realized gain | (.02) | - | (.01) | - |
Total distributions | (.12) | (.11) | (.08) | (.01) |
Redemption fees added to paid in capitalC | -H | -H | .01 | -H |
Net asset value, end of period | $ 10.25 | $ 11.47 | $ 11.29 | $ 10.80 |
Total ReturnA, B | (9.68)% | 2.56% | 5.31% | 8.07% |
Ratios to Average Net AssetsD, G | | | | |
Expenses before reductions | 2.68% | 2.72% | 2.65% | 2.63% |
Expenses net of fee waivers, if any | 2.40% | 2.40% | 2.40% | 2.40% |
Expenses net of all reductions | 2.39% | 2.40% | 2.37% | 2.37% |
Net investment income (loss) | 1.83% | .86% | .86% | 1.17% |
Supplemental Data | | | | |
Net assets, end of period (000 omitted) | $ 7,736 | $ 10,104 | $ 7,436 | $ 5,824 |
Portfolio turnover rateE | 80% | 102% | 120% | 70% |
A Total returns would have been lower if certain expenses had not been reduced during the applicable periods shown.
B Total returns do not include the effect of the contingent deferred sales charge.
C Calculated based on average shares outstanding during the period.
D Fees and expenses of any underlying Fidelity Central Funds are not included in the Fund's expense ratio. The Fund indirectly bears its proportionate share of the expenses of any underlying Fidelity Central Funds.
E Amount does not include the portfolio activity of any underlying Fidelity Central Funds.
F For the period November 1, 2011 (commencement of operations) to October 31, 2012.
G Expense ratios reflect operating expenses of the class. Expenses before reductions do not reflect amounts reimbursed by the investment adviser or reductions from brokerage service arrangements or reductions from other expense offset arrangements and do not represent the amount paid by the class during periods when reimbursements or reductions occur. Expense ratios before reductions for start-up periods may not be representative of longer-term operating periods. Expenses net of fee waivers reflect expenses after reimbursement by the investment adviser but prior to reductions from brokerage service arrangements or other expense offset arrangements. Expenses net of all reductions represent the net expenses paid by the class.
H Amount represents less than $.005 per share.
See accompanying notes which are an integral part of the financial statements.
Annual Report
Financial Highlights - Fidelity Total Emerging Markets Fund
Years ended October 31, | 2015 | 2014 | 2013 | 2012 E |
Selected Per-Share Data | | | | |
Net asset value, beginning of period | $ 11.60 | $ 11.40 | $ 10.89 | $ 10.00 |
Income from Investment Operations | | | | |
Net investment income (loss) B | .31 | .21 | .21 | .22 |
Net realized and unrealized gain (loss) | (1.31) | .19 | .47 | .69 |
Total from investment operations | (1.00) | .40 | .68 | .91 |
Distributions from net investment income | (.20) | (.20) | (.17) | (.02) |
Distributions from net realized gain | (.02) | - | (.01) | - |
Total distributions | (.22) | (.20) | (.18) | (.02) |
Redemption fees added to paid in capitalB | -G | -G | .01 | -G |
Net asset value, end of period | $ 10.38 | $ 11.60 | $ 11.40 | $ 10.89 |
Total ReturnA | (8.74)% | 3.56% | 6.44% | 9.15% |
Ratios to Average Net AssetsC, F | | | | |
Expenses before reductions | 1.72% | 1.73% | 1.56% | 1.60% |
Expenses net of fee waivers, if any | 1.40% | 1.40% | 1.40% | 1.40% |
Expenses net of all reductions | 1.39% | 1.40% | 1.38% | 1.38% |
Net investment income (loss) | 2.83% | 1.86% | 1.85% | 2.16% |
Supplemental Data | | | | |
Net assets, end of period (000 omitted) | $ 37,918 | $ 45,763 | $ 49,959 | $ 81,416 |
Portfolio turnover rateD | 80% | 102% | 120% | 70% |
A Total returns would have been lower if certain expenses had not been reduced during the applicable periods shown.
B Calculated based on average shares outstanding during the period.
C Fees and expenses of any underlying Fidelity Central Funds are not included in the Fund's expense ratio. The Fund indirectly bears its proportionate share of the expenses of any underlying Fidelity Central Funds.
D Amount does not include the portfolio activity of any underlying Fidelity Central Funds.
E For the period November 1, 2011 (commencement of operations) to October 31, 2012.
F Expense ratios reflect operating expenses of the class. Expenses before reductions do not reflect amounts reimbursed by the investment adviser or reductions from brokerage service arrangements or reductions from other expense offset arrangements and do not represent the amount paid by the class during periods when reimbursements or reductions occur. Expense ratios before reductions for start-up periods may not be representative of longer-term operating periods. Expenses net of fee waivers reflect expenses after reimbursement by the investment adviser but prior to reductions from brokerage service arrangements or other expense offset arrangements. Expenses net of all reductions represent the net expenses paid by the class.
G Amount represents less than $.005 per share.
See accompanying notes which are an integral part of the financial statements.
Annual Report
Financial Highlights - Fidelity Total Emerging Markets Fund Class I
Years ended October 31, | 2015 | 2014 | 2013 | 2012 E |
Selected Per-Share Data | | | | |
Net asset value, beginning of period | $ 11.59 | $ 11.40 | $ 10.89 | $ 10.00 |
Income from Investment Operations | | | | |
Net investment income (loss) B | .31 | .21 | .20 | .22 |
Net realized and unrealized gain (loss) | (1.31) | .18 | .48 | .69 |
Total from investment operations | (1.00) | .39 | .68 | .91 |
Distributions from net investment income | (.20) | (.20) | (.17) | (.02) |
Distributions from net realized gain | (.02) | - | (.01) | - |
Total distributions | (.22) | (.20) | (.18) | (.02) |
Redemption fees added to paid in capitalB | -G | -G | .01 | -G |
Net asset value, end of period | $ 10.37 | $ 11.59 | $ 11.40 | $ 10.89 |
Total ReturnA | (8.74)% | 3.51% | 6.44% | 9.15% |
Ratios to Average Net AssetsC, F | | | | |
Expenses before reductions | 1.58% | 1.71% | 1.63% | 1.62% |
Expenses net of fee waivers, if any | 1.40% | 1.40% | 1.40% | 1.40% |
Expenses net of all reductions | 1.39% | 1.40% | 1.37% | 1.37% |
Net investment income (loss) | 2.83% | 1.86% | 1.86% | 2.17% |
Supplemental Data | | | | |
Net assets, end of period (000 omitted) | $ 6,343 | $ 4,773 | $ 5,354 | $ 2,287 |
Portfolio turnover rateD | 80% | 102% | 120% | 70% |
A Total returns would have been lower if certain expenses had not been reduced during the applicable periods shown.
B Calculated based on average shares outstanding during the period.
C Fees and expenses of any underlying Fidelity Central Funds are not included in the Fund's expense ratio. The Fund indirectly bears its proportionate share of the expenses of any underlying Fidelity Central Funds.
D Amount does not include the portfolio activity of any underlying Fidelity Central Funds.
E For the period November 1, 2011 (commencement of operations) to October 31, 2012.
F Expense ratios reflect operating expenses of the class. Expenses before reductions do not reflect amounts reimbursed by the investment adviser or reductions from brokerage service arrangements or reductions from other expense offset arrangements and do not represent the amount paid by the class during periods when reimbursements or reductions occur. Expense ratios before reductions for start-up periods may not be representative of longer-term operating periods. Expenses net of fee waivers reflect expenses after reimbursement by the investment adviser but prior to reductions from brokerage service arrangements or other expense offset arrangements. Expenses net of all reductions represent the net expenses paid by the class.
G Amount represents less than $.005 per share.
See accompanying notes which are an integral part of the financial statements.
Annual Report
For the period ended October 31, 2015
1. Organization.
Fidelity Total Emerging Markets Fund (the Fund) is a fund of Fidelity Investment Trust (the Trust) and is authorized to issue an unlimited number of shares. The Trust is registered under the Investment Company Act of 1940, as amended (the 1940 Act), as an open-end management investment company organized as a Massachusetts business trust. The Fund offers Class A, Class T, Class C, Total Emerging Markets and Class I (formerly Institutional Class) shares, each of which has equal rights as to assets and voting privileges. Each class has exclusive voting rights with respect to matters that affect that class. The Fund's investments in emerging markets can be subject to social, economic, regulatory, and political uncertainties and can be extremely volatile.
2. Investments in Fidelity Central Funds.
The Fund invests in Fidelity Central Funds, which are open-end investment companies generally available only to other investment companies and accounts managed by the investment adviser and its affiliates. The Fund's Schedule of Investments lists each of the Fidelity Central Funds held as of period end, if any, as an investment of the Fund, but does not include the underlying holdings of each Fidelity Central Fund. As an Investing Fund, the Fund indirectly bears its proportionate share of the expenses of the underlying Fidelity Central Funds.
The Money Market Central Funds seek preservation of capital and current income and are managed by Fidelity Investments Money Management, Inc. (FIMM), an affiliate of the investment adviser. Annualized expenses of the Money Market Central Funds as of their most recent shareholder report date are less than .005%.
A complete unaudited list of holdings for each Fidelity Central Fund is available upon request or at the Securities and Exchange Commission (the SEC) website at www.sec.gov. In addition, the financial statements of the Fidelity Central Funds, which are not covered by the Fund's Report of Independent Registered Public Accounting Firm, are available on the SEC website or upon request.
3. Significant Accounting Policies.
The financial statements have been prepared in conformity with accounting principles generally accepted in the United States of America (GAAP), which require management to make certain estimates and assumptions at the date of the financial statements. Actual results could differ from those estimates. Subsequent events, if any, through the date that the financial statements were issued have been evaluated in the preparation of
Annual Report
3. Significant Accounting Policies - continued
the financial statements. The following summarizes the significant accounting policies of the Fund:
Investment Valuation. Investments are valued as of 4:00 p.m. Eastern time on the last calendar day of the period. The Board of Trustees (the Board) has delegated the day to day responsibility for the valuation of the Fund's investments to the Fidelity Management & Research Company (FMR) Fair Value Committee (the Committee). In accordance with valuation policies and procedures approved by the Board, the Fund attempts to obtain prices from one or more third party pricing vendors or brokers to value its investments. When current market prices, quotations or currency exchange rates are not readily available or reliable, investments will be fair valued in good faith by the Committee, in accordance with procedures adopted by the Board. Factors used in determining fair value vary by investment type and may include market or investment specific events, changes in interest rates and credit quality. The frequency with which these procedures are used cannot be predicted and they may be utilized to a significant extent. The Committee oversees the Fund's valuation policies and procedures and reports to the Board on the Committee's activities and fair value determinations. The Board monitors the appropriateness of the procedures used in valuing the Fund's investments and ratifies the fair value determinations of the Committee.
The Fund categorizes the inputs to valuation techniques used to value its investments into a disclosure hierarchy consisting of three levels as shown below:
Level 1 - quoted prices in active markets for identical investments
Level 2 - other significant observable inputs (including quoted prices for similar investments, interest rates, prepayment speeds, etc.)
Level 3 - unobservable inputs (including the Fund's own assumptions based on the best information available)
Valuation techniques used to value the Fund's investments by major category are as follows:
Equity securities, including restricted securities, for which market quotations are readily available, are valued at the last reported sale price or official closing price as reported by a third party pricing vendor on the primary market or exchange on which they are traded and are categorized as Level 1 in the hierarchy. In the event there were no sales during the day or closing prices are not available, securities are valued at the last quoted bid price or may be valued using the last available price and are generally categorized as Level 2 in the hierarchy. For foreign equity securities, when market or security specific events arise, comparisons to the valuation of American Depositary Receipts (ADRs), futures contracts, Exchange-Traded Funds (ETFs) and certain indexes as well as quoted prices for similar securities may be used and would be categorized as Level 2 in the hierarchy. Utilizing these techniques may result in transfers between Level 1 and Level 2.
Annual Report
Notes to Financial Statements - continued
3. Significant Accounting Policies - continued
Investment Valuation - continued
For equity securities, including restricted securities, where observable inputs are limited, assumptions about market activity and risk are used and these securities may be categorized as Level 3 in the hierarchy.
Debt securities, including restricted securities, are valued based on evaluated prices received from third party pricing vendors or from brokers who make markets in such securities. Corporate bonds, foreign government and government agency obligations, preferred securities and U.S. government and government agency obligations are valued by pricing vendors who utilize matrix pricing which considers yield or price of bonds of comparable quality, coupon, maturity and type or by broker-supplied prices. When independent prices are unavailable or unreliable, debt securities may be valued utilizing pricing methodologies which consider similar factors that would be used by third party pricing vendors. Debt securities are generally categorized as Level 2 in the hierarchy but may be Level 3 depending on the circumstances.
Futures contracts are valued at the settlement price established each day by the board of trade or exchange on which they are traded and are categorized as Level 1 in the hierarchy. Investments in open-end mutual funds, including the Fidelity Central Funds, are valued at their closing net asset value (NAV) each business day and are categorized as Level 1 in the hierarchy.
Changes in valuation techniques may result in transfers in or out of an assigned level within the disclosure hierarchy. The aggregate value of investments by input level as of October 31, 2015, including information on transfers between Levels 1 and 2, is included at the end of the Fund's Schedule of Investments.
Foreign Currency. The Fund may use foreign currency contracts to facilitate transactions in foreign-denominated securities. Gains and losses from these transactions may arise from changes in the value of the foreign currency or if the counterparties do not perform under the contracts' terms.
Foreign-denominated assets, including investment securities, and liabilities are translated into U.S. dollars at the exchange rates at period end. Purchases and sales of investment securities, income and dividends received and expenses denominated in foreign currencies are translated into U.S. dollars at the exchange rate in effect on the transaction date.
The effects of exchange rate fluctuations on investments are included with the net realized and unrealized gain (loss) on investment securities. Other foreign currency transactions resulting in realized and unrealized gain (loss) are disclosed separately.
Annual Report
3. Significant Accounting Policies - continued
Investment Transactions and Income. For financial reporting purposes, the Fund's investment holdings and NAV include trades executed through the end of the last business day of the period. The NAV per share for processing shareholder transactions is calculated as of the close of business of the New York Stock Exchange (NYSE), normally 4:00 p.m. Eastern time and includes trades executed through the end of the prior business day. Gains and losses on securities sold are determined on the basis of identified cost. Dividend income is recorded on the ex-dividend date, except for certain dividends from foreign securities where the ex-dividend date may have passed, which are recorded as soon as the Fund is informed of the ex-dividend date. Non-cash dividends included in dividend income, if any, are recorded at the fair market value of the securities received. Income and capital gain distributions from Fidelity Central Funds, if any, are recorded on the ex-dividend date. Distributions received on securities that represent a return of capital or capital gain are recorded as a reduction of cost of investments and/or as a realized gain. Subsequent to ex-dividend date the Fund determines the components of these distributions, based upon receipt of tax filings or other correspondence relating to the underlying investment. Interest income is accrued as earned and includes coupon interest and amortization of premium and accretion of discount on debt securities as applicable. Investment income is recorded net of foreign taxes withheld where recovery of such taxes is uncertain.
Class Allocations and Expenses. Investment income, realized and unrealized capital gains and losses, common expenses of the Fund, and certain fund-level expense reductions, if any, are allocated daily on a pro-rata basis to each class based on the relative net assets of each class to the total net assets of the Fund. Each class differs with respect to transfer agent and distribution and service plan fees incurred. Certain expense reductions may also differ by class. For the reporting period, the allocated portion of income and expenses to each class as a percent of its average net assets may vary due to the timing of recording these transactions in relation to fluctuating net assets of the classes. Expenses directly attributable to a fund are charged to that fund. Expenses attributable to more than one fund are allocated among the respective funds on the basis of relative net assets or other appropriate methods. Expense estimates are accrued in the period to which they relate and adjustments are made when actual amounts are known.
Income Tax Information and Distributions to Shareholders. Each year, the Fund intends to qualify as a regulated investment company under Subchapter M of the Internal Revenue Code, including distributing substantially all of its taxable income and realized gains. As a result, no provision for U.S. Federal income taxes is required. As of October 31, 2015, the Fund did not have any unrecognized tax benefits in the financial statements; nor is the Fund aware of any tax positions for which it is reasonably possible that the total amounts of unrecognized tax benefits will significantly change in the next twelve months. The Fund files a U.S. federal tax return, in addition to state and local tax
Annual Report
Notes to Financial Statements - continued
3. Significant Accounting Policies - continued
Income Tax Information and Distributions to Shareholders - continued
returns as required. The Fund's federal income tax returns are subject to examination by the Internal Revenue Service (IRS) for a period of three fiscal years after they are filed. State and local tax returns may be subject to examination for an additional fiscal year depending on the jurisdiction. Foreign taxes are provided for based on the Fund's understanding of the tax rules and rates that exist in the foreign markets in which it invests. The Fund is subject to a tax imposed on capital gains by certain countries in which it invests. An estimated deferred tax liability for net unrealized appreciation on the applicable securities is included in Other payables and accrued expenses on the Statement of Assets & Liabilities.
Distributions are declared and recorded on the ex-dividend date. Income dividends and capital gain distributions are declared separately for each class. Income and capital gain distributions are determined in accordance with income tax regulations, which may differ from GAAP. In addition, the Fund claimed a portion of the payment made to redeeming shareholders as a distribution for income tax purposes.
Capital accounts within the financial statements are adjusted for permanent book-tax differences. These adjustments have no impact on net assets or the results of operations. Capital accounts are not adjusted for temporary book-tax differences which will reverse in a subsequent period.
Book-tax differences are primarily due to foreign currency transactions, futures contracts, certain foreign taxes, market discount, passive foreign investment companies (PFIC), capital loss carryforward and losses deferred due to wash sales.
The federal tax cost of investment securities and unrealized appreciation (depreciation) as of period end were as follows:
Gross unrealized appreciation | $ 6,232,395 |
Gross unrealized depreciation | (6,504,580) |
Net unrealized appreciation (depreciation) on securities | $ (272,185) |
Tax Cost | $ 64,561,459 |
The tax-based components of distributable earnings as of period end were as follows:
Undistributed ordinary income | $ 1,285,899 |
Capital loss carryforward | $ (1,367,584) |
Net unrealized appreciation (depreciation) on securities and other investments | $ (274,699) |
Annual Report
3. Significant Accounting Policies - continued
Income Tax Information and Distributions to Shareholders - continued
Capital loss carryforwards are only available to offset future capital gains of the Fund to the extent provided by regulations and may be limited. Under the Regulated Investment Company Modernization Act of 2010 (the Act), the Fund is permitted to carry forward capital losses incurred in taxable years beginning after December 22, 2010 for an unlimited period and such capital losses are required to be used prior to any losses that expire. The capital loss carryforward information presented below, including any applicable limitation, is estimated as of fiscal period end and is subject to adjustment.
No expiration | |
Short-term | $ (1,367,584) |
The tax character of distributions paid was as follows:
| October 31, 2015 | October 31, 2014 |
Ordinary Income | $ 1,198,749 | $ 1,381,317 |
Long-term Capital Gain | 136,020 | - |
Total | $ 1,334,769 | $ 1,381,317 |
Short-Term Trading (Redemption) Fees. Shares held by investors in the Fund less than 90 days may have been subject to a redemption fee equal to 1.50% of the NAV of shares redeemed. All redemption fees, which reduce the proceeds of the shareholder redemption, are retained by the Fund and accounted for as an addition to paid in capital.
Restricted Securities. The Fund may invest in securities that are subject to legal or contractual restrictions on resale. These securities generally may be resold in transactions exempt from registration or to the public if the securities are registered. Disposal of these securities may involve time-consuming negotiations and expense, and prompt sale at an acceptable price may be difficult. Information regarding restricted securities is included at the end of the Fund's Schedule of Investments.
4. Derivative Instruments.
Risk Exposures and the Use of Derivative Instruments. The Fund's investment objective allows the Fund to enter into various types of derivative contracts, including futures contracts. Derivatives are investments whose value is primarily derived from underlying assets, indices or reference rates and may be transacted on an exchange or over-the-counter (OTC). Derivatives may involve a future commitment to buy or sell a specified asset based on specified terms, to exchange future cash flows at periodic intervals based on a notional principal amount, or for one party to make one or more payments upon the occurrence of specified events in exchange for periodic payments from the other party.
Annual Report
Notes to Financial Statements - continued
4. Derivative Instruments - continued
Risk Exposures and the Use of Derivative Instruments - continued
The Fund used derivatives to increase returns and to manage exposure to certain risks as defined below. The success of any strategy involving derivatives depends on analysis of numerous economic factors, and if the strategies for investment do not work as intended, the Fund may not achieve its objectives.
The Fund's use of derivatives increased or decreased its exposure to the following risks:
Equity Risk | Equity risk relates to the fluctuations in the value of financial instruments as a result of changes in market prices (other than those arising from interest rate risk or foreign exchange risk), whether caused by factors specific to an individual investment, its issuer, or all factors affecting all instruments traded in a market or market segment. |
The Fund is also exposed to additional risks from investing in derivatives, such as liquidity risk and counterparty credit risk. Liquidity risk is the risk that the Fund will be unable to close out the derivative in the open market in a timely manner. Counterparty credit risk is the risk that the counterparty will not be able to fulfill its obligation to the Fund. Counterparty credit risk related to exchange-traded futures contracts may be mitigated by the protection provided by the exchange on which they trade.
Investing in derivatives may involve greater risks than investing in the underlying assets directly and, to varying degrees, may involve risk of loss in excess of any initial investment and collateral received and amounts recognized in the Statement of Assets and Liabilities. In addition, there may be the risk that the change in value of the derivative contract does not correspond to the change in value of the underlying instrument.
Futures Contracts. A futures contract is an agreement between two parties to buy or sell a specified underlying instrument for a fixed price at a specified future date. The Fund used futures contracts to manage its exposure to the stock market.
Upon entering into a futures contract, a fund is required to deposit either cash or securities (initial margin) with a clearing broker in an amount equal to a certain percentage of the face value of the contract. Futures contracts are marked-to-market daily and subsequent daily payments (variation margin) are made or received by a fund depending on the daily fluctuations in the value of the futures contracts and are recorded as unrealized appreciation or (depreciation). This receivable and/or payable, if any, is included in daily variation margin for derivative instruments in the Statement of Assets and Liabilities. Realized gain or (loss) is recorded upon the expiration or closing of a futures contract.
Any open futures contracts at period end are presented in the Schedule of Investments under the caption "Futures Contracts." The underlying face amount at value reflects each contract's exposure to the underlying instrument or index at period end and is
Annual Report
4. Derivative Instruments - continued
Futures Contracts - continued
representative of volume of activity during the period. Securities deposited to meet initial margin requirements are identified in the Schedule of Investments.
During the period the Fund recognized net realized gain (loss) of $28,498 and a change in net unrealized appreciation (depreciation) of $21,984 related to its investment in futures contracts. These amounts are included in the Statement of Operations.
5. Purchases and Sales of Investments.
Purchases and sales of securities, other than short-term securities and U.S. government securities, aggregated $54,530,477 and $61,528,390, respectively.
6. Fees and Other Transactions with Affiliates.
Management Fee. Fidelity Management & Research Company (the investment adviser) and its affiliates provide the Fund with investment management related services for which the Fund pays a monthly management fee. The management fee is the sum of an individual fund fee rate that is based on an annual rate of .55% of the Fund's average net assets and an annualized group fee rate that averaged .25% during the period. The group fee rate is based upon the average net assets of all the mutual funds advised by the investment adviser, including any mutual funds previously advised by the investment adviser that are currently advised by Fidelity SelectCo, LLC, an affiliate of the investment adviser. The group fee rate decreases as assets under management increase and increases as assets under management decrease. For the reporting period, the total annual management fee rate was .80% of the Fund's average net assets.
Distribution and Service Plan Fees. In accordance with Rule 12b-1 of the 1940 Act, the Fund has adopted separate Distribution and Service Plans for each class of shares. Certain classes pay Fidelity Distributors Corporation (FDC), an affiliate of the investment adviser, separate Distribution and Service Fees, each of which is based on an annual percentage of each class' average net assets. In addition, FDC may pay financial intermediaries for selling shares of the Fund and providing shareholder support services. For the period, the Distribution and Service Fee rates, total fees and amounts retained by FDC were as follows:
| Distribution
Fee | Service
Fee | Total Fees | Retained
by FDC |
Class A | -% | .25% | $ 31,934 | $ 8,405 |
Class T | .25% | .25% | 22,488 | 8,147 |
Class C | .75% | .25% | 94,344 | 49,446 |
| | | $ 148,766 | $ 65,998 |
Annual Report
Notes to Financial Statements - continued
6. Fees and Other Transactions with Affiliates - continued
Sales Load. FDC may receive a front-end sales charge of up to 5.75% for selling Class A shares and 3.50% for selling Class T shares, some of which is paid to financial intermediaries for selling shares of the Fund. Depending on the holding period, FDC may receive contingent deferred sales charges levied on Class A, Class T, and Class C redemptions. The deferred sales charges are 1.00% for Class C shares, 1.00% for certain purchases of Class A shares and .25% for certain purchases of Class T shares.
For the period, sales charge amounts retained by FDC were as follows:
| Retained
by FDC |
Class A | $ 4,577 |
Class T | 1,143 |
Class CA | 5,625 |
| $ 11,345 |
A When Class C shares are initially sold, FDC pays commissions from its own resources to financial intermediaries through which the sales are made.
Transfer Agent Fees. Fidelity Investments Institutional Operations Company, Inc., (FIIOC), an affiliate of the investment adviser, is the transfer, dividend disbursing and shareholder servicing agent for each class of the Fund. FIIOC receives account fees and asset-based fees that vary according to the account size and type of account of the shareholders of the respective classes of the Fund. FIIOC pays for typesetting, printing and mailing of shareholder reports, except proxy statements.
For the period, transfer agent fees for each class were as follows:
| Amount | % of
Class-Level Average
Net Assets |
Class A | $ 29,046 | .23 |
Class T | 14,108 | .31 |
Class C | 21,328 | .23 |
Total Emerging Markets | 97,762 | .26 |
Class I | 10,379 | .16 |
| $ 172,623 | |
Accounting and Security Lending Fees. Fidelity Service Company, Inc. (FSC), an affiliate of the investment adviser, maintains the Fund's accounting records. The accounting fee is based on the level of average net assets for each month. Under a separate contract, FSC administers the security lending program. The security lending fee is based on the number and duration of lending transactions.
Annual Report
6. Fees and Other Transactions with Affiliates - continued
Brokerage Commissions. The Fund placed a portion of its portfolio transactions with brokerage firms which are affiliates of the investment adviser. Brokerage commissions are included in net realized gain (loss) and change in net unrealized appreciation (depreciation) in the Statement of Operations. The commissions paid to these affiliated firms were $434 for the period.
7. Committed Line of Credit.
The Fund participates with other funds managed by the investment adviser or an affiliate in a $4.25 billion credit facility (the "line of credit") to be utilized for temporary or emergency purposes to fund shareholder redemptions or for other short-term liquidity purposes. The Fund has agreed to pay commitment fees on its pro-rata portion of the line of credit, which amounted to $104 and is reflected in Miscellaneous expenses on the Statement of Operations. During the period, the Fund did not borrow on this line of credit.
8. Security Lending.
The Fund lends portfolio securities through a lending agent from time to time in order to earn additional income. For equity securities, a lending agent is used and may loan securities to certain qualified borrowers, including Fidelity Capital Markets (FCM), a broker-dealer affiliated with the Fund. On the settlement date of the loan, the Fund receives collateral (in the form of U.S. Treasury obligations, letters of credit and/or cash) against the loaned securities and maintains collateral in an amount not less than 100% of the market value of the loaned securities during the period of the loan. The market value of the loaned securities is determined at the close of business of the Fund and any additional required collateral is delivered to the Fund on the next business day. The Fund or borrower may terminate the loan at any time, and if the borrower defaults on its obligation to return the securities loaned because of insolvency or other reasons, the Fund may apply collateral received from the borrower against the obligation. The Fund may experience delays and costs in recovering the securities loaned. Any cash collateral received is invested in the Fidelity Securities Lending Cash Central Fund. At period end, there were no security loans outstanding. Security lending income represents the income earned on investing cash collateral, less rebates paid to borrowers and any lending agent fees associated with the loan, plus any premium payments received for lending certain types of securities. Security lending income is presented in the Statement of Operations as a component of income from Fidelity Central Funds. Total security lending income during the period amounted to $640. During the period, there were no securities loaned to FCM.
Annual Report
Notes to Financial Statements - continued
9. Expense Reductions.
The investment adviser contractually agreed to reimburse each class to the extent annual operating expenses exceeded certain levels of average net assets as noted in the table below. This reimbursement will remain in place through December 31, 2016. Some expenses, for example interest expense, including commitment fees, are excluded from this reimbursement.
The following classes were in reimbursement during the period:
| Expense
Limitations | Reimbursement |
Class A | 1.65% | $ 35,348 |
Class T | 1.90% | 16,501 |
Class C | 2.40% | 26,141 |
Total Emerging Markets | 1.40% | 119,637 |
Class I | 1.40% | 11,808 |
| | $ 209,435 |
Commissions paid to certain brokers with whom the investment adviser, or its affiliates, places trades on behalf of the Fund include an amount in addition to trade execution, which may be rebated back to the Fund to offset certain expenses. This amount totaled $5,745 for the period. In addition, through arrangements with the Fund's custodian, credits realized as a result of certain uninvested cash balances were used to reduce the Fund's expenses. During the period, these credits reduced the Fund's custody expenses by $199.
In addition, during the period the investment adviser reimbursed and/or waived a portion of fund-level operating expenses in the amount of $278 and a portion of class-level operating expenses as follows:
| Amount |
Class A | $ 359 |
Class T | 94 |
Class C | 192 |
Total Emerging Markets | 1,090 |
Class I | 113 |
| $ 1,848 |
Annual Report
10. Distributions to Shareholders.
Distributions to shareholders of each class were as follows:
Years ended October 31, | 2015 | 2014 |
From net investment income | | |
Class A | $ 211,944 | $ 298,475 |
Class T | 63,689 | 72,882 |
Class C | 88,937 | 71,691 |
Total Emerging Markets | 751,293 | 837,446 |
Class I | 82,887 | 100,824 |
Total | $ 1,198,750 | $ 1,381,318 |
From net realized gain | | |
Class A | $ 24,934 | $ - |
Class T | 9,098 | - |
Class C | 18,150 | - |
Total Emerging Markets | 75,507 | - |
Class I | 8,330 | - |
Total | $ 136,019 | $ - |
11. Share Transactions.
Share transactions for each class were as follows and may contain automatic conversions between classes or exchanges between funds:
| Shares | Dollars |
Years ended October 31, | 2015 | 2014 | 2015 | 2014 |
Class A | | | | |
Shares sold | 251,231 | 374,099 | $ 2,772,246 | $ 4,265,512 |
Reinvestment of distributions | 21,174 | 24,147 | 232,918 | 267,553 |
Shares redeemed | (469,131) | (876,261) | (4,963,727) | (9,758,391) |
Net increase (decrease) | (196,726) | (478,015) | $ (1,958,563) | $ (5,225,326) |
Class T | | | | |
Shares sold | 45,171 | 73,071 | $ 491,646 | $ 838,229 |
Reinvestment of distributions | 6,566 | 6,487 | 72,226 | 71,875 |
Shares redeemed | (186,633) | (148,531) | (1,964,687) | (1,659,489) |
Net increase (decrease) | (134,896) | (68,973) | $ (1,400,815) | $ (749,385) |
Class C | | | | |
Shares sold | 198,104 | 312,027 | $ 2,115,228 | $ 3,545,260 |
Reinvestment of distributions | 9,691 | 6,236 | 106,316 | 69,031 |
Shares redeemed | (334,580) | (95,617) | (3,520,139) | (1,079,948) |
Net increase (decrease) | (126,785) | 222,646 | $ (1,298,595) | $ 2,534,343 |
Annual Report
Notes to Financial Statements - continued
11. Share Transactions - continued
| Shares | Dollars |
Years ended October 31, | 2015 | 2014 | 2015 | 2014 |
Total Emerging Markets | | | | |
Shares sold | 1,772,167 | 1,227,986 | $ 18,534,579 | $ 14,240,572 |
Reinvestment of distributions | 70,595 | 69,851 | 777,256 | 774,644 |
Shares redeemed | (2,136,425) | (1,734,596) | (22,904,245) | (19,517,156) |
Net increase (decrease) | (293,663) | (436,759) | $ (3,592,410) | $ (4,501,940) |
Class I | | | | |
Shares sold | 421,240 | 216,506 | $ 4,563,340 | $ 2,508,322 |
Reinvestment of distributions | 8,237 | 8,910 | 90,609 | 98,814 |
Shares redeemed | (229,844) | (283,392) | (2,428,352) | (3,122,278) |
Net increase (decrease) | 199,633 | (57,976) | $ 2,225,597 | $ (515,142) |
12. Other.
The Fund's organizational documents provide former and current trustees and officers with a limited indemnification against liabilities arising in connection with the performance of their duties to the Fund. In the normal course of business, the Fund may also enter into contracts that provide general indemnifications. The Fund's maximum exposure under these arrangements is unknown as this would be dependent on future claims that may be made against the Fund. The risk of material loss from such claims is considered remote.
At the end of the period, the investment adviser or its affiliates were the owners of record of 13% of the total outstanding shares of the fund.
Annual Report
To the Trustees of Fidelity Investment Trust and the Shareholders of Fidelity Emerging Markets Discovery Fund:
In our opinion, the accompanying statement of assets and liabilities, including the schedule of investments, and the related statements of operations and of changes in net assets and the financial highlights present fairly, in all material respects, the financial position of Fidelity Emerging Markets Discovery Fund (a fund of Fidelity Investment Trust) at October 31, 2015, the results of its operations for the year then ended, the changes in its net assets for each of the two years in the period then ended and the financial highlights for each of the periods indicated, in conformity with accounting principles generally accepted in the United States of America. These financial statements and financial highlights (hereafter referred to as "financial statements") are the responsibility of the Fidelity Emerging Markets Discovery Fund's management. Our responsibility is to express an opinion on these financial statements based on our audits. We conducted our audits of these financial statements in accordance with the standards of the Public Company Accounting Oversight Board (United States). Those standards require that we plan and perform the audit to obtain reasonable assurance about whether the financial statements are free of material misstatement. An audit includes examining, on a test basis, evidence supporting the amounts and disclosures in the financial statements, assessing the accounting principles used and significant estimates made by management, and evaluating the overall financial statement presentation. We believe that our audits, which included confirmation of securities at October 31, 2015 by correspondence with the custodian and brokers, provide a reasonable basis for our opinion.
PricewaterhouseCoopers LLP
Boston, Massachusetts
December 18, 2015
Annual Report
Report of Independent Registered Public Accounting Firm
To the Trustees of Fidelity Investment Trust and the Shareholders of Fidelity Total Emerging Markets Fund:
In our opinion, the accompanying statement of assets and liabilities, including the schedule of investments, and the related statements of operations and of changes in net assets and the financial highlights present fairly, in all material respects, the financial position of Fidelity Total Emerging Markets Fund (a fund of Fidelity Investment Trust) at October 31, 2015, the results of its operations for the year then ended, the changes in its net assets for each of the two years in the period then ended and the financial highlights for each of the periods indicated, in conformity with accounting principles generally accepted in the United States of America. These financial statements and financial highlights (hereafter referred to as "financial statements") are the responsibility of the Fidelity Total Emerging Markets Fund's management. Our responsibility is to express an opinion on these financial statements based on our audits. We conducted our audits of these financial statements in accordance with the standards of the Public Company Accounting Oversight Board (United States). Those standards require that we plan and perform the audit to obtain reasonable assurance about whether the financial statements are free of material misstatement. An audit includes examining, on a test basis, evidence supporting the amounts and disclosures in the financial statements, assessing the accounting principles used and significant estimates made by management, and evaluating the overall financial statement presentation. We believe that our audits, which included confirmation of securities at October 31, 2015 by correspondence with the custodian and brokers, provide a reasonable basis for our opinion.
PricewaterhouseCoopers LLP
Boston, Massachusetts
December 18, 2015
Annual Report
The Trustees, Member of the Advisory Board, and officers of the trust and funds, as applicable, are listed below. The Board of Trustees governs each fund and is responsible for protecting the interests of shareholders. The Trustees are experienced executives who meet periodically throughout the year to oversee each fund's activities, review contractual arrangements with companies that provide services to each fund, oversee management of the risks associated with such activities and contractual arrangements, and review each fund's performance. Each of the Trustees oversees 170 funds.
The Trustees hold office without limit in time except that (a) any Trustee may resign; (b) any Trustee may be removed by written instrument, signed by at least two-thirds of the number of Trustees prior to such removal; (c) any Trustee who requests to be retired or who has become incapacitated by illness or injury may be retired by written instrument signed by a majority of the other Trustees; and (d) any Trustee may be removed at any special meeting of shareholders by a two-thirds vote of the outstanding voting securities of the trust. Each Trustee who is not an interested person (as defined in the 1940 Act) of the trust and the funds (Independent Trustee), shall retire not later than the last day of the calendar year in which his or her 75th birthday occurs. The Independent Trustees may waive this mandatory retirement age policy with respect to individual Trustees. The officers and Advisory Board Member hold office without limit in time, except that any officer and Advisory Board Member may resign or may be removed by a vote of a majority of the Trustees at any regular meeting or any special meeting of the Trustees. Except as indicated, each individual has held the office shown or other offices in the same company for the past five years.
Experience, Skills, Attributes, and Qualifications of the Funds' Trustees. The Governance and Nominating Committee has adopted a statement of policy that describes the experience, qualifications, attributes, and skills that are necessary and desirable for potential Independent Trustee candidates (Statement of Policy). The Board believes that each Trustee satisfied at the time he or she was initially elected or appointed a Trustee, and continues to satisfy, the standards contemplated by the Statement of Policy. The Governance and Nominating Committee also engages professional search firms to help identify potential Independent Trustee candidates who have the experience, qualifications, attributes, and skills consistent with the Statement of Policy. From time to time, additional criteria based on the composition and skills of the current Independent Trustees, as well as experience or skills that may be appropriate in light of future changes to board composition, business conditions, and regulatory or other developments, have also been considered by the professional search firms and the Governance and Nominating Committee. In addition, the Board takes into account the Trustees' commitment and participation in Board and committee meetings, as well as their leadership of standing and ad hoc committees throughout their tenure.
In determining that a particular Trustee was and continues to be qualified to serve as a Trustee, the Board has considered a variety of criteria, none of which, in isolation, was controlling. The Board believes that, collectively, the Trustees have balanced and diverse experience, qualifications, attributes, and skills, which allow the Board to operate effectively in governing each fund and protecting the interests of shareholders. Information about the specific experience, skills, attributes, and qualifications of each Trustee, which in each case led to the Board's conclusion that the Trustee should serve (or continue to serve) as a trustee of the funds, is provided below.
Annual Report
Board Structure and Oversight Function. James C. Curvey is an interested person (as defined in the 1940 Act) and currently serves as Chairman. The Trustees have determined that an interested Chairman is appropriate and benefits shareholders because an interested Chairman has a personal and professional stake in the quality and continuity of services provided to the funds. Independent Trustees exercise their informed business judgment to appoint an individual of their choosing to serve as Chairman, regardless of whether the Trustee happens to be independent or a member of management. The Independent Trustees have determined that they can act independently and effectively without having an Independent Trustee serve as Chairman and that a key structural component for assuring that they are in a position to do so is for the Independent Trustees to constitute a substantial majority for the Board. The Independent Trustees also regularly meet in executive session. Ned C. Lautenbach serves as Chairman of the Independent Trustees and as such (i) acts as a liaison between the Independent Trustees and management with respect to matters important to the Independent Trustees and (ii) with management prepares agendas for Board meetings.
Fidelity funds are overseen by different Boards of Trustees. The funds' Board oversees Fidelity's high income and certain equity funds, and other Boards oversee Fidelity's investment-grade bond, money market, asset allocation, and sector funds. The asset allocation funds may invest in Fidelity funds overseen by the funds' Board. The use of separate Boards, each with its own committee structure, allows the Trustees of each group of Fidelity funds to focus on the unique issues of the funds they oversee, including common research, investment, and operational issues. On occasion, the separate Boards establish joint committees to address issues of overlapping consequences for the Fidelity funds overseen by each Board.
The Trustees operate using a system of committees to facilitate the timely and efficient consideration of all matters of importance to the Trustees, each fund, and fund shareholders and to facilitate compliance with legal and regulatory requirements and oversight of the funds' activities and associated risks. The Board, acting through its committees, has charged FMR and its affiliates with (i) identifying events or circumstances the occurrence of which could have demonstrably adverse effects on the funds' business and/or reputation; (ii) implementing processes and controls to lessen the possibility that such events or circumstances occur or to mitigate the effects of such events or circumstances if they do occur; and (iii) creating and maintaining a system designed to evaluate continuously business and market conditions in order to facilitate the identification and implementation processes described in (i) and (ii) above. Because the day-to-day operations and activities of the funds are carried out by or through FMR, its affiliates and other service providers, the funds' exposure to risks is mitigated but not eliminated by the processes overseen by the Trustees. While each of the Board's committees has responsibility for overseeing different aspects of the funds' activities, oversight is exercised primarily through the Operations, Audit, and Compliance Committees. In addition, the Independent Trustees have worked with FMR to enhance the Board's oversight of investment and financial risks, legal and regulatory risks, technology risks, and operational risks, including the development of additional risk reporting to the Board. For example, a working group comprised of Independent Trustees and FMR has worked and continues to work to review the Fidelity funds' valuation-related activities, reporting and risk management. Appropriate personnel, including but not limited to the funds' Chief Compliance Officer (CCO), FMR's internal auditor, the independent accountants, the funds' Treasurer and portfolio management personnel, make periodic reports to the Board's committees, as appropriate, including an annual review of Fidelity's risk management program for the Fidelity funds. The responsibilities of each standing committee, including their oversight responsibilities, are described further under "Standing Committees of the Funds' Trustees."
Annual Report
Trustees and Officers - continued
The funds' Statement of Additional Information (SAI) includes more information about the Trustees. To request a free copy, call Fidelity at 1-800-544-8544.
Interested Trustees*:
Correspondence intended for each Trustee who is an interested person may be sent to Fidelity Investments, 245 Summer Street, Boston, Massachusetts 02210.
Name, Year of Birth; Principal Occupations and Other Relevant Experience+ |
James C. Curvey (1935) |
Year of Election or Appointment: 2007 Trustee Chairman of the Board of Trustees |
| Mr. Curvey also serves as Trustee of other Fidelity funds. Mr. Curvey is a Director of Fidelity Research & Analysis Co. (investment adviser firm, 2009-present), and Vice Chairman (2007-present) and Director of FMR LLC (diversified financial services company). In addition, Mr. Curvey serves as an Overseer for the Boston Symphony Orchestra and a member of the board of Artis-Naples, Naples, Florida, and as a Trustee for Brewster Academy, Wolfeboro, New Hampshire. Previously, Mr. Curvey served as a Director of Fidelity Investments Money Management, Inc. (investment adviser firm, 2009-2014) and a Director of FMR and FMR Co., Inc. (investment adviser firms, 2007-2014). |
Charles S. Morrison (1960) |
Year of Election or Appointment: 2014 Trustee |
| Mr. Morrison also serves as Trustee of other funds. He serves as a Director of Fidelity Investments Money Management, Inc. (FIMM) (investment adviser firm, 2014-present), Director of Fidelity SelectCo, LLC (investment adviser firm, 2014-present), President, Asset Management (2014-present), and is an employee of Fidelity Investments. Previously, Mr. Morrison served as Vice President of Fidelity's Fixed Income and Asset Allocation Funds (2012-2014), President, Fixed Income (2011-2014), Vice President of Fidelity's Money Market Funds (2005-2009), President, Money Market Group Leader of FMR (investment adviser firm, 2009), and Senior Vice President, Money Market Group of FMR (2004-2009). Mr. Morrison also served as Vice President of Fidelity's Bond Funds (2002-2005), certain Balanced Funds (2002-2005), and certain Asset Allocation Funds (2002-2007), and as Senior Vice President (2002-2005) of Fidelity's Bond Division. |
* Trustees have been determined to be "Interested Trustees" by virtue of, among other things, their affiliation with the trust or various entities under common control with FMR.
+ The information above includes each Trustee's principal occupation during the last five years and other information relating to the experience, attributes, and skills relevant to each Trustee's qualifications to serve as a Trustee, which led to the conclusion that each Trustee should serve as a Trustee for each fund.
Annual Report
Trustees and Officers - continued
Independent Trustees:
Correspondence intended for each Independent Trustee (that is, the Trustees other than the Interested Trustees) may be sent to Fidelity Investments, P.O. Box 55235, Boston, Massachusetts 02205-5235.
Name, Year of Birth; Principal Occupations and Other Relevant Experience+ |
Dennis J. Dirks (1948) |
Year of Election or Appointment: 2005 Trustee |
| Mr. Dirks also serves as Trustee of other Fidelity funds. Prior to his retirement in May 2003, Mr. Dirks was Chief Operating Officer and a member of the Board of The Depository Trust & Clearing Corporation (DTCC). He also served as President, Chief Operating Officer, and Board member of The Depository Trust Company (DTC) and President and Board member of the National Securities Clearing Corporation (NSCC). In addition, Mr. Dirks served as Chief Executive Officer and Board member of the Government Securities Clearing Corporation, Chief Executive Officer and Board member of the Mortgage-Backed Securities Clearing Corporation, as a Trustee and a member of the Finance Committee of Manhattan College (2005-2008), as a Trustee and a member of the Finance Committee of AHRC of Nassau County (2006-2008), and as a member of the Independent Directors Council (IDC) Governing Council (2010-2015). Mr. Dirks is a member of the Board of Directors for The Brookville Center for Children's Services, Inc. (2009-present). |
Alan J. Lacy (1953) |
Year of Election or Appointment: 2008 Trustee |
| Mr. Lacy also serves as Trustee of other Fidelity funds. Mr. Lacy serves as a member of the Board of Directors of Dave & Buster's Entertainment, Inc. (restaurant and entertainment complexes, 2010-present) and Bristol-Myers Squibb Company (global pharmaceuticals, 2008-present). In addition, Mr. Lacy served as Senior Adviser (2007-2014) of Oak Hill Capital Partners, L.P. (private equity) and also served as Chief Executive Officer (2000-2005) and Vice Chairman (2005-2006) of Sears Holdings Corporation and Sears, Roebuck and Co. (retail). Mr. Lacy is a member of the Board of Trustees of The National Parks Conservation Association (2006-present). Previously, Mr. Lacy served as Chairman of the Board of Trustees of the National Parks Conservation Association (2008-2011) and as a member of the Board of Directors for The Western Union Company (global money transfer, 2006-2011), The Hillman Companies, Inc. (hardware wholesalers, 2010-2014), and Earth Fare, Inc. (retail grocery, 2010-2014). |
Ned C. Lautenbach (1944) |
Year of Election or Appointment: 2000 Trustee Chairman of the Independent Trustees |
| Mr. Lautenbach also serves as Trustee of other Fidelity funds. Mr. Lautenbach currently serves as the Lead Director of the Eaton Corporation Board of Directors (diversified industrial, 1997-present). Mr. Lautenbach is Chairman of the Board of Directors of Artis-Naples in Naples, Florida (2012-present), a member of the Council on Foreign Relations (1994-present), and a member of the Board of Governors, State University System of Florida (2013-present). Previously, Mr. Lautenbach was a Partner/Advisory Partner at Clayton, Dubilier & Rice, LLC (private equity investment, 1998-2010), as well as a Director of Sony Corporation (2006-2007). |
Joseph Mauriello (1944) |
Year of Election or Appointment: 2008 Trustee |
| Mr. Mauriello also serves as Trustee of other Fidelity funds. Prior to his retirement in January 2006, Mr. Mauriello served in numerous senior management positions including Deputy Chairman and Chief Operating Officer (2004-2005), and Vice Chairman of Financial Services (2002-2004) of KPMG LLP US (professional services, 1965-2005). Mr. Mauriello currently serves as a member of the Board of Directors of XL Group plc. (global insurance and re-insurance, 2006-present) and the Independent Directors Council (IDC) Governing Council (2015-present). Previously, Mr. Mauriello served as a Director of the Hamilton Funds of the Bank of New York (2006-2007) and of Arcadia Resources Inc. (health care services and products, 2007-2012). |
Robert W. Selander (1950) |
Year of Election or Appointment: 2011 Trustee |
| Mr. Selander also serves as Trustee of other Fidelity funds. Mr. Selander serves as a Director of The Western Union Company (global money transfer, 2014-present). Previously, Mr. Selander served as a Member of the Advisory Board of other Fidelity funds (2011), and Executive Vice Chairman (2010), Chief Executive Officer (2009-2010), and President and Chief Executive Officer (1997-2009) of Mastercard, Inc. |
Cornelia M. Small (1944) |
Year of Election or Appointment: 2005 Trustee |
| Ms. Small also serves as Trustee of other Fidelity funds. Ms. Small is a member of the Board of Directors (2009-present) and Chair of the Investment Committee (2010-present) of the Teagle Foundation. Ms. Small also serves on the Investment Committee of the Berkshire Taconic Community Foundation (2008-present). Previously, Ms. Small served as Chairperson (2002-2008) and a member of the Investment Committee and Chairperson (2008-2012) and a member of the Board of Trustees of Smith College. In addition, Ms. Small served as Chief Investment Officer, Director of Global Equity Investments, and a member of the Board of Directors of Scudder, Stevens & Clark and Scudder Kemper Investments. |
William S. Stavropoulos (1939) |
Year of Election or Appointment: 2001 Trustee Vice Chairman of the Independent Trustees |
| Mr. Stavropoulos also serves as Trustee of other Fidelity funds. Mr. Stavropoulos serves as President and Founder of the Michigan Baseball Foundation, the Great Lakes Loons (2007-present). Mr. Stavropoulos is Chairman Emeritus of the Board of Directors of The Dow Chemical Company, where he previously served in numerous senior management positions, including President, CEO (1995-2000; 2002-2004), Chairman of the Executive Committee (2000-2006), and as a member of the Board of Directors (1990-2006). Currently, Mr. Stavropoulos is Chairman of the Board of Directors of Univar Inc. (global distributor of commodity and specialty chemicals), a Director of Teradata Corporation (data warehousing and technology solutions), and Maersk Inc. (industrial conglomerate), and a member of the Advisory Board for Metalmark Capital LLC (private equity investment, 2005-present). Mr. Stavropoulos is an operating advisor to Clayton, Dubilier & Rice, LLC (private equity investment). In addition, Mr. Stavropoulos is a member of the University of Notre Dame Advisory Council for the College of Science, a Trustee of the Rollin L. Gerstacker Foundation, and a Director of the Naples Philharmonic Center for the Arts. Previously, Mr. Stavropoulos served as a Director of Chemical Financial Corporation (bank holding company, 1993-2012) and Tyco International, Ltd. (multinational manufacturing and services, 2007-2012). |
David M. Thomas (1949) |
Year of Election or Appointment: 2008 Trustee |
| Mr. Thomas also serves as Trustee of other Fidelity funds. Mr. Thomas serves as Non-Executive Chairman of the Board of Directors of Fortune Brands Home and Security (home and security products, 2011-present), as a member of the Board of Directors (2004-present) and Presiding Director (2013-present) of Interpublic Group of Companies, Inc. (marketing communication), and as a member of the Board of Trustees of the University of Florida (2013-present). Previously, Mr. Thomas served as Executive Chairman (2005-2006) and Chairman and Chief Executive Officer (2000-2005) of IMS Health, Inc. (pharmaceutical and healthcare information solutions), and a Director of Fortune Brands, Inc. (consumer products, 2000-2011). |
+ The information above includes each Trustee's principal occupation during the last five years and other information relating to the experience, attributes, and skills relevant to each Trustee's qualifications to serve as a Trustee, which led to the conclusion that each Trustee should serve as a Trustee for each fund.
Advisory Board Member and Officers:
Correspondence intended for each officer and Peter S. Lynch may be sent to Fidelity Investments, 245 Summer Street, Boston, Massachusetts 02210. Officers appear below in alphabetical order.
Name, Year of Birth; Principal Occupation |
Peter S. Lynch (1944) |
Year of Election or Appointment: 2003 Member of the Advisory Board |
| Mr. Lynch also serves as Member of the Advisory Board of other Fidelity funds. Mr. Lynch is Vice Chairman and a Director of FMR (investment adviser firm) and FMR Co., Inc. (investment adviser firm). In addition, Mr. Lynch serves as a Trustee of Boston College and as the Chairman of the Inner-City Scholarship Fund. Previously, Mr. Lynch served on the Special Olympics International Board of Directors (1997-2006). |
Elizabeth Paige Baumann (1968) |
Year of Election or Appointment: 2012 Anti-Money Laundering (AML) Officer |
| Ms. Baumann also serves as AML Officer of other funds. She is Chief AML Officer of FMR LLC (diversified financial services company, 2012-present) and is an employee of Fidelity Investments. Previously, Ms. Baumann served as Vice President and Deputy Anti-Money Laundering Officer (2007-2012). |
Marc R. Bryant (1966) |
Year of Election or Appointment: 2015 Secretary and Chief Legal Officer (CLO) |
| Mr. Bryant also serves as Secretary and CLO of other funds. Mr. Bryant serves as CLO, Secretary, and Senior Vice President of Fidelity Management & Research Company (investment adviser firm, 2015-present) and FMR Co., Inc. (investment adviser firm, 2015-present); Secretary of Fidelity SelectCo, LLC (investment adviser firm, 2015-present) and Fidelity Investments Money Management, Inc. (investment adviser firm, 2015-present); and CLO of Fidelity Management & Research (Hong Kong) Limited (investment adviser firm, 2015-present). He is Senior Vice President and Deputy General Counsel of FMR LLC (diversified financial services company). Previously, Mr. Bryant served as Secretary and Chief Legal Officer of Fidelity Rutland Square Trust II (2010-2014) and Assistant Secretary of Fidelity's Fixed Income and Asset Allocation Funds (2013-2015). Prior to joining Fidelity Investments, Mr. Bryant served as a Senior Vice President and the Head of Global Retail Legal for AllianceBernstein L.P. (2006-2010), and as the General Counsel for ProFund Advisors LLC (2001-2006). |
William C. Coffey (1969) |
Year of Election or Appointment: 2009 Assistant Secretary |
| Mr. Coffey also serves as Assistant Secretary of other funds. He is Senior Vice President and Deputy General Counsel of FMR LLC (diversified financial services company, 2010-present), and is an employee of Fidelity Investments. Previously, Mr. Coffey served as Vice President and Associate General Counsel of FMR LLC (2005-2009). |
Timothy M. Cohen (1969) |
Year of Election or Appointment: 2014 Vice President of certain Equity Funds |
| Mr. Cohen also serves as Vice President of other funds. Mr. Cohen serves as Chief Compliance Officer of FMR Investment Management (U.K.) Limited (investment adviser firm, 2013-present) and is an employee of Fidelity Investments. Previously, Mr. Cohen served as a Director of FMR Investment Management (U.K.) Limited (2013-2015). |
Jonathan Davis (1968) |
Year of Election or Appointment: 2010 Assistant Treasurer |
| Mr. Davis also serves as Assistant Treasurer of other funds, and is an employee of Fidelity Investments. Previously, Mr. Davis served as Vice President and Associate General Counsel of FMR LLC (diversified financial services company, 2003-2010). |
Adrien E. Deberghes (1967) |
Year of Election or Appointment: 2008 Deputy Treasurer |
| Mr. Deberghes also serves as an officer of other funds. He is an employee of Fidelity Investments (2008-present). Prior to joining Fidelity Investments, Mr. Deberghes was Senior Vice President of Mutual Fund Administration at State Street Corporation (2007-2008), Senior Director of Mutual Fund Administration at Investors Bank & Trust (2005-2007), and Director of Finance for Dunkin' Brands (2000-2005). |
Stephanie J. Dorsey (1969) |
Year of Election or Appointment: 2010 Assistant Treasurer |
| Ms. Dorsey also serves as an officer of other funds. She is an employee of Fidelity Investments (2008-present) and has served in other fund officer roles. Prior to joining Fidelity Investments, Ms. Dorsey served as Treasurer (2004-2008) of the JPMorgan Mutual Funds and Vice President (2004-2008) of JPMorgan Chase Bank. |
Howard J. Galligan III (1966) |
Year of Election or Appointment: 2014 Chief Financial Officer |
| Mr. Galligan also serves as Chief Financial Officer of other funds. Mr. Galligan serves as President of Fidelity Pricing and Cash Management Services (FPCMS) (2014-present) and as a Director of Strategic Advisers, Inc. (investment adviser firm, 2008-present). Previously, Mr. Galligan served as Chief Administrative Officer of Asset Management (2011-2014) and Chief Operating Officer and Senior Vice President of Investment Support for Strategic Advisers, Inc. (2003-2011). |
Scott C. Goebel (1968) |
Year of Election or Appointment: 2015 Vice President |
| Mr. Goebel serves as Vice President of other funds and is an employee of Fidelity Investments (2001-present). Previously, Mr. Goebel served as Secretary of Fidelity SelectCo, LLC (investment adviser firm, 2013-2015), Fidelity Investments Money Management, Inc. (FIMM) (investment adviser firm, 2010-2015), and Fidelity Research and Analysis Company (FRAC) (investment adviser firm, 2010-2015); General Counsel, Secretary, and Senior Vice President of Fidelity Management & Research Company (investment adviser firm, 2008-2015) and FMR Co., Inc. (investment adviser firm, 2008-2015); Assistant Secretary of Fidelity Management & Research (Japan) Limited (investment adviser firm, 2008-2015) and FMR Investment Management (U.K.) Limited (investment adviser firm, 2008-2015); Chief Legal Officer (CLO) of Fidelity Management & Research (Hong Kong) Limited (investment adviser firm, 2008-2015); Secretary and CLO of certain Fidelity funds (2008-2015); Assistant Secretary of FIMM (2008-2010), FRAC (2008-2010), and certain funds (2007-2008); and as Vice President and Secretary of Fidelity Distributors Corporation (FDC) (2005-2007). |
Brian B. Hogan (1964) |
Year of Election or Appointment: 2009 Vice President |
| Mr. Hogan also serves as Trustee or Vice President of other funds. Mr. Hogan serves as a Director of Fidelity SelectCo, LLC (investment adviser firm, 2014-present) and President of the Equity Division of FMR (investment adviser firm, 2009-present). Previously, Mr. Hogan served as Senior Vice President, Equity Research of FMR (2006-2009) and as a portfolio manager. |
Chris Maher (1972) |
Year of Election or Appointment: 2013 Assistant Treasurer |
| Mr. Maher serves as Assistant Treasurer of other funds. Mr. Maher is Vice President of Valuation Oversight and is an employee of Fidelity Investments. Previously, Mr. Maher served as Vice President of Asset Management Compliance (2013), Vice President of the Program Management Group of FMR (investment adviser firm, 2010-2013), and Vice President of Valuation Oversight (2008-2010). |
Kenneth B. Robins (1969) |
Year of Election or Appointment: 2008 President and Treasurer |
| Mr. Robins also serves as an officer of other funds. Mr. Robins serves as Executive Vice President of Fidelity Investments Money Management, Inc. (FIMM) (investment adviser firm, 2013-present) and is an employee of Fidelity Investments (2004-present). Previously, Mr. Robins served in other fund officer roles. |
Stacie M. Smith (1974) |
Year of Election or Appointment: 2013 Deputy Treasurer |
| Ms. Smith also serves as an officer of other funds. She is an employee of Fidelity Investments (2009-present) and has served in other fund officer roles. Prior to joining Fidelity Investments, Ms. Smith served as Senior Audit Manager of Ernst & Young LLP (1996-2009). |
Renee Stagnone (1975) |
Year of Election or Appointment: 2013 Deputy Treasurer |
| Ms. Stagnone also serves as Deputy Treasurer of other funds. Ms. Stagnone is an employee of Fidelity Investments (1997-present). |
Linda J. Wondrack (1964) |
Year of Election or Appointment: 2014 Chief Compliance Officer |
| Ms. Wondrack also serves as Chief Compliance Officer of other funds. Ms. Wondrack is Executive Vice President and head of the Ethics Office and Asset Management Compliance for Fidelity Investments (2012-present). Ms. Wondrack also serves as Chief Compliance Officer of Fidelity SelectCo, LLC (investment adviser firm, 2014-present); Chief Compliance Officer of Impresa Management LLC (2013-present); and Chief Compliance Officer of FMR Co., Inc. (investment adviser firm), Fidelity Investments Money Management, Inc. (investment adviser firm), Fidelity Management & Research (Japan) Limited (investment adviser firm), FMR Investment Management (U.K.) Limited (investment adviser firm), Fidelity Management & Research (Hong Kong) (investment adviser firm), Fidelity Management & Research Company (investment adviser firm), FIAM LLC (investment adviser firm), and Strategic Advisers, Inc. (investment adviser firm), Ballyrock Investment Advisors LLC, and Northern Neck Investors LLC (2012-present). Previously, Ms. Wondrack served as Senior Vice President and Chief Compliance Officer for Columbia Management Investment Advisers, LLC (2005-2012); Chief Compliance Officer for certain funds within the Columbia Family of Funds (2007-2012); and Senior Vice President of Compliance Risk Management at Bank of America (2005-2010). |
Joseph F. Zambello (1957) |
Year of Election or Appointment: 2011 Deputy Treasurer |
| Mr. Zambello also serves as Deputy Treasurer of other funds. Mr. Zambello is an employee of Fidelity Investments (1991-present). Previously, Mr. Zambello served as Vice President of the Program Management Group of FMR (investment adviser firm, 2009-2011) and Vice President of the Transfer Agent Oversight Group (2005-2009). |
Annual Report
A percentage of the dividends distributed during the fiscal year for the following funds may be taken into account as a dividend for purposes of the maximum rate under section 1(h)(11) of the Internal Revenue Code.
| December 2014 | | |
Total Emerging Markets | 61% | | |
The amounts per share which represent income derived from sources within, and taxes paid to, foreign countries or possessions of the United States are as follows:
| Pay Date | Income | Taxes |
Total Emerging Markets | 12/08/14 | $0.2241 | $0.0251 |
The funds will notify shareholders in January 2016 of amounts for use in preparing 2015 income tax returns.
Annual Report
Fidelity Emerging Markets Discovery Fund
Fidelity Total Emerging Markets Fund
Each year, the Board of Trustees, including the Independent Trustees (together, the Board), votes on the renewal of the management contract with Fidelity Management & Research Company (FMR) and the sub-advisory agreements (together, the Advisory Contracts) for each fund. The Board, assisted by the advice of fund counsel and Independent Trustees' counsel, requests and considers a broad range of information relevant to the renewal of the Advisory Contracts throughout the year.
The Board meets regularly and, at each of its meetings, covers an extensive agenda of topics and materials and considers factors that are relevant to its annual consideration of the renewal of each fund's Advisory Contracts, including the services and support provided to each fund and its shareholders. The Board has established various standing committees (Committees), each composed of and chaired by Independent Trustees with varying backgrounds, to which the Board has assigned specific subject matter responsibilities in order to enhance effective decision-making by the Board. The Board, acting directly and through its Committees, requests and receives information concerning the annual consideration of the renewal of each fund's Advisory Contracts. The Board also meets as needed to consider matters specifically related to the Board's annual consideration of the renewal of the Advisory Contracts. Members of the Board may also meet with trustees of other Fidelity funds through ad hoc joint committees to discuss certain matters relevant to all of the Fidelity funds.
At its July 2015 meeting, the Board unanimously determined to renew each fund's Advisory Contracts. In reaching its determination, the Board considered all factors it believed relevant, including (i) the nature, extent, and quality of the services to be provided to each fund and its shareholders (including the investment performance of each fund); (ii) the competitiveness of each fund's management fee and total expense ratio relative to peer funds; (iii) the total costs of the services to be provided by and the profits to be realized by Fidelity from its relationship with each fund; and (iv) the extent to which (if any) economies of scale exist and would be realized as each fund grows, and whether any economies of scale are appropriately shared with fund shareholders.
In considering whether to renew the Advisory Contracts for each fund, the Board reached a determination, with the assistance of fund counsel and Independent Trustees' counsel and through the exercise of its business judgment, that the renewal of the Advisory Contracts was in the best interests of each fund and its shareholders and that the compensation payable under the Advisory Contracts was fair and reasonable. The Board's decision to renew the Advisory Contracts was not based on any single factor, but rather was based on a comprehensive consideration of all the information provided to the Board at its meetings throughout the year. The Board, in reaching its determination to renew the Advisory Contracts, was aware that shareholders of each fund have a broad range of investment choices available to them, including a wide choice among funds offered by Fidelity's competitors, and that each fund's shareholders, who have the opportunity to review and weigh the disclosure provided by the fund in its prospectus and other public disclosures, have chosen to invest in that fund, which is part of the Fidelity family of funds.
Annual Report
Nature, Extent, and Quality of Services Provided. The Board considered Fidelity's staffing as it relates to the funds, including the backgrounds of investment personnel of Fidelity, and also considered the funds' investment objectives, strategies, and related investment philosophies. The Independent Trustees also had discussions with senior management of Fidelity's investment operations and investment groups. The Board considered the structure of the portfolio manager compensation program and whether this structure provides appropriate incentives to act in the best interests of each fund. Additionally, the Board considered the portfolio managers' investments, if any, in the funds that they manage.
Resources Dedicated to Investment Management and Support Services. The Board and the Fund Oversight and Research Committees reviewed the general qualifications and capabilities of Fidelity's investment staff, including its size, education, experience, and resources, as well as Fidelity's approach to recruiting, training, managing, and compensating investment personnel. The Board noted that Fidelity has continued to increase the resources devoted to non-U.S. offices, including expansion of Fidelity's global investment organization. The Board also noted that Fidelity's analysts have extensive resources, tools and capabilities that allow them to conduct sophisticated quantitative and fundamental analysis, as well as credit analysis of issuers, counterparties and guarantors. Further, the Board considered that Fidelity's investment professionals have sufficient access to global information and data so as to provide competitive investment results over time, and that those professionals also have access to sophisticated tools that permit them to assess portfolio construction and risk and performance attribution characteristics continuously, as well as to transmit new information and research conclusions rapidly around the world. Additionally, in its deliberations, the Board considered Fidelity's trading, risk management, and compliance capabilities and resources, which are integral parts of the investment management process.
Shareholder and Administrative Services. The Board considered (i) the nature, extent, quality, and cost of advisory, administrative, and shareholder services performed by FMR, the sub-advisers (together with FMR, the Investment Advisers), and their affiliates under the Advisory Contracts and under separate agreements covering transfer agency, pricing and bookkeeping, and securities lending services for each fund; (ii) the nature and extent of the supervision of third party service providers, principally custodians and subcustodians; and (iii) the resources devoted to, and the record of compliance with, each fund's compliance policies and procedures. The Board also reviewed the allocation of fund brokerage, including allocations to brokers affiliated with the Investment Advisers, the use of brokerage commissions to pay fund expenses, and the use of "soft" commission dollars to pay for research services.
Annual Report
Board Approval of Investment Advisory Contracts and
Management Fees - continued
The Board noted that the growth of fund assets over time across the complex allows Fidelity to reinvest in the development of services designed to enhance the value or convenience of the Fidelity funds as investment vehicles. These services include 24-hour access to account information and market information through telephone representatives and over the Internet, investor education materials and asset allocation tools, and the expanded availability of Fidelity Investor Centers.
In 2014, the Board formed an ad hoc Committee on Transfer Agency Fees to review the variety of transfer agency fee structures throughout the industry and Fidelity's competitive positioning with respect to industry participants.
Investment in a Large Fund Family. The Board considered the benefits to shareholders of investing in a Fidelity fund, including the benefits of investing in a fund that is part of a large family of funds offering a variety of investment disciplines and providing a large variety of mutual fund investor services. The Board noted that Fidelity had taken, or had made recommendations that resulted in the Fidelity funds taking, a number of actions over the previous year that benefited particular funds, including (i) continuing to dedicate additional resources to investment research and to the support of the senior management team that oversees asset management; (ii) continuing efforts to enhance Fidelity's global research capabilities; (iii) launching new funds and making other enhancements to meet client needs; (iv) reducing management fees and total expenses for certain index funds and diversified international funds; (v) continuing to launch dedicated lower cost underlying funds to meet portfolio construction needs related to expanding underlying fund options for Fidelity funds of funds, specifically for the Freedom Fund product lines; (vi) rationalizing product lines and gaining increased efficiencies through fund mergers; (vii) launching active fixed-income exchange-traded funds; (viii) continuing to develop, acquire and implement systems and technology to improve services to the funds and information security and to increase efficiency; (ix) implementing investment enhancements to further strengthen Fidelity's target date product line to increase investors' probability of success in achieving their goals; (x) modifying the eligibility criteria for certain share classes to accommodate roll-over assets from employer-sponsored retirement plans; (xi) launching a new Class W of the Freedom Index Funds to attract and retain Fidelity record-kept retirement plan assets; and (xii) implementing changes to Fidelity's money market product line in response to recent money market regulatory reforms.
Annual Report
Investment Performance. The Board considered whether each fund has operated in accordance with its investment objective, as well as its record of compliance with its investment restrictions and its performance history. The Board noted that there was a portfolio management change for Fidelity Total Emerging Markets Fund in September 2014.
The Board took into account discussions with representatives of the Investment Advisers about fund investment performance that occur at Board meetings throughout the year. In this regard the Board noted that as part of regularly scheduled fund reviews and other reports to the Board on fund performance, the Board considers annualized return information for each fund, for different time periods, measured against a securities market index ("benchmark index") and a peer group of funds with similar objectives ("peer group"), if any. In its evaluation of fund investment performance, the Board gave particular attention to information indicating changes in performance of certain Fidelity funds for specific time periods and discussed with the Investment Advisers the reasons for any overperformance or underperformance.
In addition to reviewing absolute and relative fund performance, the Independent Trustees periodically consider the appropriateness of fund performance metrics in evaluating the results achieved. In general, the Independent Trustees believe that fund performance should be evaluated based on net performance (after fees and expenses) of both the highest performing and lowest performing fund share classes, where applicable, compared to appropriate benchmark indices, over appropriate time periods that may include full market cycles, and compared to peer groups, as applicable, over the same periods, taking into account relevant factors including the following: general market conditions; issuer-specific information; and fund cash flows and other factors.
The Independent Trustees recognize that shareholders evaluate performance on a net basis over their own holding periods, for which one-, three-, and five-year periods are often used as a proxy. For this reason, the performance information reviewed by the Board also included net cumulative calendar year total return information for each fund and an appropriate benchmark index and, in the case of Fidelity Emerging Markets Discovery Fund, peer group for the most recent one- and three-year periods, as shown below. Returns are shown compared to the 25th percentile (top of box, 75% beaten) and 75th percentile (bottom of box, 25% beaten) of the peer universe. For Fidelity Total Emerging Markets Fund, a peer group is not shown below because the fund does not generally utilize a peer group for performance comparison purposes.
Annual Report
Board Approval of Investment Advisory Contracts and
Management Fees - continued
Fidelity Emerging Markets Discovery Fund
Fidelity Total Emerging Markets Fund
Based on its review, the Board concluded that the nature, extent, and quality of services provided to each fund under the Advisory Contracts should benefit the shareholders of each fund.
Annual Report
Competitiveness of Management Fee and Total Expense Ratio. The Board considered each fund's management fee and total expense ratio compared to "mapped groups" of competitive funds and classes created for the purpose of facilitating the Trustees' competitive analysis of management fees and total expenses. Fidelity creates "mapped groups" by combining similar Lipper investment objective categories that have comparable investment mandates. Combining Lipper investment objective categories aids the Board's management fee and total expense ratio comparisons by broadening the competitive group used for comparison.
Management Fee. The Board considered two proprietary management fee comparisons for the 12-month (or shorter) periods shown in basis points (BP) in the charts below. The group of Lipper funds used by the Board for management fee comparisons is referred to below as the "Total Mapped Group." The Total Mapped Group comparison focuses on a fund's standing in terms of gross management fees before expense reimbursements or caps relative to the total universe of funds with comparable investment mandates, regardless of whether their management fee structures also are comparable. Funds with comparable investment mandates offer exposure to similar types of securities. Funds with comparable management fee structures have similar management fee contractual arrangements (e.g., flat rate charged for advisory services, all-inclusive fee rate, etc.). "TMG %" represents the percentage of funds in the Total Mapped Group that had management fees that were lower than a fund's. For example, a hypothetical TMG % of 20% would mean that 80% of the funds in the Total Mapped Group had higher, and 20% had lower, management fees than a fund. The funds' actual TMG %s and the number of funds in the Total Mapped Group are in the charts below. The "Asset-Size Peer Group" (ASPG) comparison focuses on a fund's standing relative to a subset of non-Fidelity funds within the Total Mapped Group that are similar in size and management fee structure without taking into account performance adjustments, if any. For example, if a fund is in the first quartile of the ASPG, the fund's management fee ranks in the least expensive or lowest 25% of funds in the ASPG. The ASPG represents at least 15% of the funds in the Total Mapped Group with comparable asset size and management fee structures, subject to a minimum of 50 funds (or all funds in the Total Mapped Group if fewer than 50). Additional information, such as the ASPG quartile in which a fund's management fee rate ranked, is also included in the charts and considered by the Board.
Annual Report
Board Approval of Investment Advisory Contracts and
Management Fees - continued
Fidelity Emerging Markets Discovery Fund

Fidelity Total Emerging Markets Fund

The Board noted that each fund's management fee rate ranked below the median of its Total Mapped Group and below the median of its ASPG for 2014.
The Board noted that, in 2014, the ad hoc Committee on Group Fee was formed by it and other Fidelity fund boards to conduct an in-depth review of the "group fee" component of the management fee of funds with such management fee structures. Committee focus included the mechanics of the group fee, the competitive landscape of group fee structures, Fidelity funds with no group fee component and investment products not included in group fee assets. The Board also considered that, for funds subject to the group fee, FMR agreed to voluntarily waive fees over a specified period of time in amounts designed to account for assets converted from certain funds to certain collective investment trusts.
Annual Report
The Board also noted that, in 2013, the ad hoc Committee on Management Fees was formed to conduct an in-depth review of the management fee rates of Fidelity's active equity mutual funds. The Committee focused on the following areas: (i) standard fee structures; (ii) research consumption and trading evolution; (iii) management fee competitiveness/profitability by category; and (iv) factors that drive institutional pricing.
Based on its review, the Board concluded that each fund's management fee is fair and reasonable in light of the services that the fund receives and the other factors considered.
Total Expense Ratio. In its review of the total expense ratio of each class of each fund, the Board considered the fund's management fee as well as other fund or class expenses, as applicable, such as transfer agent fees, pricing and bookkeeping fees, fund-paid 12b-1 fees, and custodial, legal, and audit fees. The Board also noted that Fidelity may agree to waive fees and expenses from time to time, and the extent to which, if any, it has done so for the funds. As part of its review, the Board also considered the current and historical total expense ratios of each class of each fund compared to competitive fund median expenses. Each class of each fund is compared to those funds and classes in the Total Mapped Group (used by the Board for management fee comparisons) that have a similar sales load structure.
The Board noted that each fund offers multiple classes, each of which has a different sales load and 12b-1 fee structure, and that the multiple structures are intended to offer a range of pricing options for the intermediary market. The Board also noted that the total expense ratios of the classes of each fund vary primarily by the level of their 12b-1 fees, although differences in transfer agent fees may also cause expenses to vary from class to class.
The Board noted that the total expense ratio of the retail class of Fidelity Emerging Markets Discovery Fund ranked equal to its competitive median for 2014 and the total expense ratio of each of Class A, Class T, Class C, and Class I ranked above its competitive median for 2014. The Board considered that, in general, various factors can affect total expense ratios.
The Board noted that the total expense ratio of each of Class A and the retail class of Fidelity Total Emerging Markets Fund ranked below its competitive median for 2014 and the total expense ratio of each of Class T, Class C, and Class I ranked above its competitive median for 2014.
Annual Report
Board Approval of Investment Advisory Contracts and
Management Fees - continued
The Board considered that, in general, various factors can affect total expense ratios. The Board noted that the total expense ratio of Class T of each fund was above the competitive median primarily because of higher 12b-1 fees on Class T as compared to most competitor funds. Class T has a higher 12b-1 fee, but a lower front-end sales charge, than traditionally priced front-end sales charge classes. The Board considered that Class T is primarily sold load-waived in the retirement plan market where its 0.50% 12b-1 fee is comparable to competing no-load, higher 12b-1 fee classes designed specifically for retirement plans. The Board noted that each Fund offers multiple classes, each of which has a different sales load and 12b-1 fee structure, and that the multiple structures are intended to offer a range of pricing options for the intermediary market. The Board also noted that the total expense ratios of the classes of each fund vary primarily by the level of their 12b-1 fees, although differences in transfer agent fees may also cause expenses to vary from class to class.
The Board further considered that FMR contractually agreed to reimburse Class A, Class T, Class C, Class I and the retail class of Fidelity Emerging Markets Discovery Fund to the extent that total operating expenses (excluding interest, certain taxes, certain securities lending costs, brokerage commissions, extraordinary expenses, and acquired fund fees and expenses, if any), as a percentage of their respective average net assets, exceed 1.70%, 1.95%, 2.45%, 1.45%, and 1.45% through December 31, 2015.
The Board further considered that FMR contractually agreed to reimburse Class A, Class T, Class C, Class I, and the retail class of Fidelity Total Emerging Markets Fund to the extent that total operating expenses (excluding interest, certain taxes, certain securities lending costs, brokerage commissions, extraordinary expenses, and acquired fund fees and expenses, if any), as a percentage of their respective average net assets, exceed 1.65%, 1.90%, 2.40%, 1.40%, and 1.40% through December 31, 2015.
Fees Charged to Other Fidelity Clients. The Board also considered Fidelity fee structures and other information with respect to clients of Fidelity, such as other funds advised or subadvised by Fidelity, pension plan clients, and other institutional clients with similar mandates. The Board noted the findings of the 2013 ad hoc joint committee (created with the board of other Fidelity funds), which reviewed and compared Fidelity's institutional investment advisory business with its business of providing services to the Fidelity funds, including the differences in services provided, fees charged, and costs incurred, as well as competition in their respective marketplaces.
Based on its review of total expense ratios and fees charged to other Fidelity clients, the Board concluded that, although in some cases above the median of the universe presented for comparison, the total expense ratio of each class of each fund was reasonable in light of the services that the fund and its shareholders receive and the other factors considered.
Annual Report
Costs of the Services and Profitability. The Board considered the revenues earned and the expenses incurred by Fidelity in conducting the business of developing, marketing, distributing, managing, administering and servicing each fund and servicing each fund's shareholders. The Board also considered the level of Fidelity's profits in respect of all the Fidelity funds.
On an annual basis, Fidelity presents to the Board information about the profitability of its relationship with each fund. Fidelity calculates profitability information for each fund, as well as aggregate profitability information for groups of Fidelity funds and all Fidelity funds, using a series of detailed revenue and cost allocation methodologies which originate with the books and records of Fidelity on which Fidelity's audited financial statements are based. The Audit Committee of the Board reviews any significant changes from the prior year's methodologies.
PricewaterhouseCoopers LLP (PwC), independent registered public accounting firm and auditor to Fidelity and certain Fidelity funds, has been engaged annually by the Board as part of the Board's assessment of Fidelity's profitability analysis. PwC's engagement includes the review and assessment of the methodologies used by Fidelity in determining the revenues and expenses attributable to Fidelity's mutual fund business, and completion of agreed-upon procedures in respect of the mathematical accuracy of fund profitability and its conformity to established allocation methodologies. After considering PwC's reports issued under the engagement and information provided by Fidelity, the Board concluded that while other allocation methods may also be reasonable, Fidelity's profitability methodologies are reasonable in all material respects.
The Board also reviewed Fidelity's non-fund businesses and fall-out benefits related to the mutual fund business as well as cases where Fidelity's affiliates may benefit from or be related to the funds' business.
The Board considered the costs of the services provided by and the profits realized by Fidelity in connection with the operation of each fund and was satisfied that the profitability was not excessive.
Economies of Scale. The Board considered whether there have been economies of scale in respect of the management of the Fidelity funds, whether the Fidelity funds (including each fund) have appropriately benefited from any such economies of scale, and whether there is potential for realization of any further economies of scale. The Board considered the extent to which each fund will benefit from economies of scale as assets grow through increased services to the fund, through waivers or reimbursements, or through fee or expense ratio reductions. The Board also noted that in 2013, it and the boards of other Fidelity funds created an ad hoc committee (the Economies of Scale Committee) to analyze whether Fidelity attains economies of scale in respect of the management and servicing of the Fidelity funds, whether the Fidelity funds have appropriately benefited from such economies of scale, and whether there is potential for realization of any further economies of scale.
Annual Report
Board Approval of Investment Advisory Contracts and
Management Fees - continued
The Board recognized that each fund's management contract incorporates a "group fee" structure, which provides for lower group fee rates as total group assets increase, and for higher group fee rates as total group assets decrease (with "group assets" defined to include fund assets under FMR's management plus sector fund assets previously under FMR's management and currently managed by Fidelity SelectCo, LLC). FMR calculates the group fee rates based on a tiered asset "breakpoint" schedule that varies based on asset class. The Board considered that the group fee is designed to deliver the benefits of economies of scale to fund shareholders when total Fidelity fund assets increase, even if assets of any particular fund are unchanged or have declined, because some portion of Fidelity's costs are attributable to services provided to all Fidelity funds, and all funds benefit if those costs can be allocated among more assets. The Board concluded that, given the group fee structure, fund shareholders will benefit from lower management fees as group assets increase at the fund complex level, regardless of whether Fidelity achieves any such economies of scale.
The Board concluded, taking into account the analysis of the Economies of Scale Committee, that economies of scale, if any, are being appropriately shared between fund shareholders and Fidelity.
Additional Information Requested by the Board. In order to develop fully the factual basis for consideration of the Fidelity funds' Advisory Contracts, the Board requested and received additional information on certain topics, including: (i) fund performance trends and Fidelity's long-term strategies for certain funds; (ii) the various share classes employed by Fidelity and the attributes of each class, together with similar information on the distribution and servicing payments made by Fidelity or the funds to third-party participants in the distribution channels; (iii) fund profitability, and fund performance in relation to fund profitability; (iv) the methodology with respect to evaluating competitive fund data and peer group classifications and fee comparisons; (v) annual fund profitability margins, with particular focus on certain funds with negative margins; (vi) the realization of fall-out benefits in certain Fidelity business units; (vii) economies of scale and the way in which they are shared with fund shareholders; (viii) Fidelity's group fee structures, including the group fee schedule of breakpoints; (ix) the impact of cost containment measures on the funds; and (x) the transfer agent fee structure.
Based on its evaluation of all of the conclusions noted above, and after considering all factors it believed relevant, the Board concluded that the advisory fee structures are fair and reasonable, and that each fund's Advisory Contracts should be renewed.
Annual Report
Investment Adviser
Fidelity Management &
Research Company
Boston, MA
Investment Sub-Advisers
FMR Co., Inc.
FMR Investment Management
(U.K.) Limited
Fidelity Management & Research
(Hong Kong) Limited
Fidelity Management & Research
(Japan) Limited
FIL Investments (Japan) Limited
FIL Investment Advisors
FIL Investment Advisors
(UK) Limited
General Distributor
Fidelity Distributors Corporation
Smithfield, RI
Transfer and Service Agents
Fidelity Investments Institutional
Operations Company, Inc.
Boston, MA
Fidelity Service Company, Inc.
Boston, MA
Custodian
The Northern Trust Company
Chicago, IL
The Fidelity Telephone Connection
Mutual Fund 24-Hour Service
Exchanges/Redemptions
and Account Assistance 1-800-544-6666
Product Information 1-800-544-6666
Retirement Accounts 1-800-544-4774
(8 a.m. - 9 p.m.)
TDD Service 1-800-544-0118
for the deaf and hearing impaired
(9 a.m. - 9 p.m. Eastern time)
Fidelity Automated Service
Telephone (FAST®)
1-800-544-5555

Automated line for quickest service
(Fidelity Investment logo)(registered trademark)
Corporate Headquarters
245 Summer St., Boston, MA 02210
www.fidelity.com
EMD-TEK-UANN-1215
1.931236.103
ContentsShareholder Expense ExamplePerformance: The Bottom LineManagement's Discussion of Fund PerformanceInvestment Changes (Unaudited)Investments October 31, 2015Financial StatementsPerformance: The Bottom LineManagement's Discussion of Fund PerformanceInvestment Changes (Unaudited)Investments October 31, 2015Financial StatementsPerformance: The Bottom LineManagement's Discussion of Fund PerformanceInvestment Changes (Unaudited)Investments October 31, 2015Financial StatementsPerformance: The Bottom LineManagement's Discussion of Fund PerformanceInvestment Changes (Unaudited)Investments October 31, 2015Financial StatementsNotes to Financial StatementsReport of Independent Registered Public Accounting FirmReport of Independent Registered Public Accounting FirmTrustees and OfficersDistributions (Unaudited)Board Approval of Investment Advisory Contracts and Management Fees
Fidelity®
Series Emerging Markets
Series International Growth
Series International Small Cap
Series International Value
Funds -
Fidelity Series Emerging Markets Fund
Fidelity Series International Growth Fund
Fidelity Series International Small Cap Fund
Fidelity Series International Value Fund
Class F
Annual Report
October 31, 2015
(Fidelity Cover Art)
Contents
Shareholder Expense Example | (Click Here) | An example of shareholder expenses. |
Fidelity® Series Emerging Markets Fund |
Performance | (Click Here) | How the fund has done over time. |
Management's Discussion of Fund Performance | (Click Here) | The Portfolio Manager's review of fund performance and strategy. |
Investment Changes | (Click Here) | A summary of major shifts in the Fund's investments over the past six months. |
Investments | (Click Here) | A complete list of the fund's investments with their market values. |
Financial Statements | (Click Here) | Statements of assets and liabilities, operations, and changes in net assets, as well as financial highlights. |
Fidelity Series International Growth Fund |
Performance | (Click Here) | How the fund has done over time. |
Management's Discussion of Fund Performance | (Click Here) | The Portfolio Manager's review of fund performance and strategy. |
Investment Changes | (Click Here) | A summary of major shifts in the Fund's investments over the past six months. |
Investments | (Click Here) | A complete list of the fund's investments with their market values. |
Financial Statements | (Click Here) | Statements of assets and liabilities, operations, and changes in net assets, as well as financial highlights. |
Fidelity Series International Small Cap Fund |
Performance | (Click Here) | How the fund has done over time. |
Management's Discussion of Fund Performance | (Click Here) | The Portfolio Manager's review of fund performance and strategy. |
Investment Changes | (Click Here) | A summary of major shifts in the Fund's investments over the past six months. |
Investments | (Click Here) | A complete list of the fund's investments with their market values. |
Financial Statements | (Click Here) | Statements of assets and liabilities, operations, and changes in net assets, as well as financial highlights. |
Fidelity Series International Value Fund |
Performance | (Click Here) | How the fund has done over time. |
Management's Discussion of Fund Performance | (Click Here) | The Portfolio Manager's review of fund performance and strategy. |
Investment Changes | (Click Here) | A summary of major shifts in the Fund's investments over the past six months. |
Investments | (Click Here) | A complete list of the fund's investments with their market values. |
Financial Statements | (Click Here) | Statements of assets and liabilities, operations, and changes in net assets, as well as financial highlights. |
Notes | (Click Here) | Notes to the Financial Statements. |
Report of Independent Registered Public Accounting Firm | (Click Here) | |
Trustees and Officers | (Click Here) | |
Distributions | (Click Here) | |
Board Approval of Investment Advisory Contracts and Management Fees | (Click Here) | |
To view a fund's proxy voting guidelines and proxy voting record for the 12-month period ended June 30, visit http://www.fidelity.com/proxyvotingresults or visit the Securities and Exchange Commission's (SEC) web site at http://www.sec.gov. You may also call 1-800-544-8544 for Fidelity® Series Emerging Markets Fund, Fidelity Series International Growth Fund, Fidelity Series International Small Cap Fund, and Fidelity Series International Value Fund or 1-800-835-5092 for Class F of each fund to request a free copy of the proxy voting guidelines.
Standard & Poor's, S&P and S&P 500 are registered service marks of The McGraw-Hill Companies, Inc. and have been licensed for use by Fidelity Distributors Corporation.
Other third-party marks appearing herein are the property of their respective owners.
All other marks appearing herein are registered or unregistered trademarks or service marks of FMR LLC or an affiliated company. © 2015 FMR LLC. All rights reserved.
Annual Report
This report and the financial statements contained herein are submitted for the general information of the shareholders of the funds. This report is not authorized for distribution to prospective investors in the funds unless preceded or accompanied by an effective prospectus.
A fund files its complete schedule of portfolio holdings with the SEC for the first and third quarters of each fiscal year on Form N-Q. Forms N-Q are available on the SEC's web site at http://www.sec.gov. A fund's Forms N-Q may be reviewed and copied at the SEC's Public Reference Room in Washington, DC. Information regarding the operation of the SEC's Public Reference Room may be obtained by calling 1-800-SEC-0330. For a complete list of a fund's portfolio holdings, view the most recent holdings listing, semiannual report, or annual report on Fidelity's web site at http://www.fidelity.com, http://www.advisor.fidelity.com, or http://www.401k.com, as applicable.
NOT FDIC INSURED • MAY LOSE VALUE • NO BANK GUARANTEE
Neither the funds nor Fidelity Distributors Corporation is a bank.
Annual Report
Shareholder Expense Example
As a shareholder of a Fund, you incur two types of costs: (1) transaction costs, and (2) ongoing costs, including management fees and other Fund expenses. This Example is intended to help you understand your ongoing costs (in dollars) of investing in the Funds and to compare these costs with the ongoing costs of investing in other mutual funds.
The Example is based on an investment of $1,000 invested at the beginning of the period and held for the entire period (May 1, 2015 to October 31, 2015).
Actual Expenses
The first line of the accompanying table for each class of each fund provides information about actual account values and actual expenses. You may use the information in this line, together with the amount you invested, to estimate the expenses that you paid over the period. Simply divide your account value by $1,000.00 (for example, an $8,600 account value divided by $1,000.00 = 8.6), then multiply the result by the number in the first line for a class of the fund under the heading entitled "Expenses Paid During Period" to estimate the expenses you paid on your account during this period. In addition, each Fund, as a shareholder in the underlying Fidelity Central Funds, will indirectly bear its pro-rata share of the fees and expenses incurred by the underlying Fidelity Central Funds. These fees and expenses are not included in the Fund's annualized expense ratio used to calculate the expense estimate in the table below.
Hypothetical Example for Comparison Purposes
The second line of the accompanying table for each class of each fund provides information about hypothetical account values and hypothetical expenses based on a Class' actual expense ratio and an assumed rate of return of 5% per year before expenses, which is not the Class' actual return. The hypothetical account values and expenses may not be used to estimate the actual ending account balance or expenses you paid for the period. You may use this information to compare the ongoing costs of investing in the Fund and other funds. To do so, compare this 5% hypothetical example with the 5% hypothetical examples that appear in the shareholder reports of the other funds. In addition, each Fund, as a shareholder in the underlying Fidelity Central Funds, will indirectly bear its pro-rata share of the fees and expenses incurred by the underlying Fidelity Central Funds. These fees and expenses are not included in the Fund's annualized expense ratio used to calculate the expense estimate in the table below.
Please note that the expenses shown in the table are meant to highlight your ongoing costs only and do not reflect any transaction costs. Therefore, the second line of the table is useful in comparing ongoing costs only, and will not help you determine the relative total costs of owning different funds.
Annual Report
Shareholder Expense Example - continued
| Annualized
Expense RatioB | Beginning
Account Value
May 1, 2015 | Ending
Account Value
October 31, 2015 | Expenses Paid
During PeriodC
May 1, 2015 to
October 31, 2015 |
Fidelity Series Emerging Markets Fund | | | | |
Series Emerging Markets | 1.04% | | | |
Actual | | $ 1,000.00 | $ 849.60 | $ 4.85 |
HypotheticalA | | $ 1,000.00 | $ 1,019.96 | $ 5.30 |
Class F | .88% | | | |
Actual | | $ 1,000.00 | $ 850.00 | $ 4.10 |
HypotheticalA | | $ 1,000.00 | $ 1,020.77 | $ 4.48 |
Fidelity Series International Growth Fund | | | | |
Series International Growth | .89% | | | |
Actual | | $ 1,000.00 | $ 970.80 | $ 4.42 |
HypotheticalA | | $ 1,000.00 | $ 1,020.72 | $ 4.53 |
Class F | .73% | | | |
Actual | | $ 1,000.00 | $ 971.50 | $ 3.63 |
HypotheticalA | | $ 1,000.00 | $ 1,021.53 | $ 3.72 |
Fidelity Series International Small Cap Fund | | | | |
Series International Small Cap | 1.07% | | | |
Actual | | $ 1,000.00 | $ 982.30 | $ 5.35 |
HypotheticalA | | $ 1,000.00 | $ 1,019.81 | $ 5.45 |
Class F | .90% | | | |
Actual | | $ 1,000.00 | $ 983.60 | $ 4.50 |
HypotheticalA | | $ 1,000.00 | $ 1,020.67 | $ 4.58 |
Fidelity Series International Value Fund | | | | |
Series International Value | .88% | | | |
Actual | | $ 1,000.00 | $ 943.80 | $ 4.31 |
HypotheticalA | | $ 1,000.00 | $ 1,020.77 | $ 4.48 |
Class F | .72% | | | |
Actual | | $ 1,000.00 | $ 944.90 | $ 3.53 |
HypotheticalA | | $ 1,000.00 | $ 1,021.58 | $ 3.67 |
A 5% return per year before expenses
B Annualized expense ratio reflects expenses net of applicable fee waivers.
C Expenses are equal to each Class' annualized expense ratio, multiplied by the average account value over the period, multiplied by 184/ 365 (to reflect the one-half year period).
Annual Report
Fidelity® Series Emerging Markets Fund
Average annual total return reflects the change in the value of an investment, assuming reinvestment of the class' distributions from dividend income and capital gains (the profits earned upon the sale of securities that have grown in value, if any) and assuming a constant rate of performance each year. The $10,000 table and the fund's returns do not reflect the deduction of taxes that a shareholder would pay on fund distributions or the redemption of fund shares. During periods of reimbursement by Fidelity, a fund's total return will be greater than it would be had the reimbursement not occurred. How a fund did yesterday is no guarantee of how it will do tomorrow.
Average Annual Total Returns
Periods ended October 31, 2015 | Past 1
year | Past 5
years | Life of
fund A |
Fidelity Series Emerging Markets Fund | -13.14% | -1.87% | 9.79% |
Class F B | -13.02% | -1.69% | 9.99% |
A From December 9, 2008.
B The initial offering of Class F shares took place on June 26, 2009. Returns prior to June 26, 2009, are those of Fidelity Series Emerging Markets Fund, the original class of the fund.
$10,000 Over Life of Fund
Let's say hypothetically that $10,000 was invested in Fidelity Series Emerging Markets Fund, a class of the fund, on December 9, 2008, when the fund started. The chart shows how the value of your investment would have changed, and also shows how the MSCI Emerging Markets Index performed over the same period.
Annual Report
Fidelity Series Emerging Markets Fund
Market Recap: International equities suffered a moderate setback for the 12 months ending October 31, 2015, held back by a collapse in commodities prices that hurt resources-related sectors and geographies. The MSCI ACWI (All Country World Index) ex USA Index returned -4.55% for the period, affected also by concerns about global economic growth. Commodity producers remained under pressure for much of the past year, largely related to economic deceleration in China (-1%), the world's second-largest economy and a leading consumer of raw materials. This effect was exacerbated by U.S. dollar strength relative to global currencies, which weighed on commodities priced in dollars and acutely impacted equity returns within regions most exposed to resources prices. The emerging-markets group, for example, returned about -15% this period. Canada, a significant energy producer, returned roughly -17%. Net energy consumer Japan (+9%) was the best-performing region by far. Only about a quarter of the nearly 50 index countries managed a gain this period: Ireland (+19%) - the EU's fastest-growing economy - and Israel (+17%) proved top performers; Greece (-56%) and Brazil (-46%), among the worst. As for sectors, energy (-25%) and materials (-16%) declined sharply, whereas the two consumer sectors each gained about 6%.
Comments from Co-Portfolio Managers Tim Gannon, Samuel Polyak, Greg Lee and James Hayes: For the year, the fund's share classes turned in low-double-digit declines, outpacing the -14.22% return of the benchmark MSCI Emerging Markets Index. From a geographical perspective, positioning in India, Malaysia and Mexico were helpful versus the benchmark. On the flip side, picks in Russia dragged on relative performance. Among sectors, picks in telecommunication services, consumer staples and information technology lifted results most, whereas choices in health care and industrials hurt. Looking at individual stocks, our substantial overweighting in China Life Insurance was the top relative contributor this period, followed by Bharti Infratel, a leading tower infrastructure provider in India. Bharti was propelled by a generally favorable Indian market earlier in the period. Conversely, an overweighting in underperforming Daewoo International, South Korea's largest trading company, was the fund's biggest individual relative detractor. The stock underperformed due to its link to global oil prices, which fell by about 44% the past 12 months.
Note to shareholders: Xiaoting Zhao was named Co-Manager of the fund, effective October 1, 2015.
The views expressed above reflect those of the portfolio manager(s) only through the end of the period as stated on the cover of this report and do not necessarily represent the views of Fidelity or any other person in the Fidelity organization. Any such views are subject to change at any time based upon market or other conditions and Fidelity disclaims any responsibility to update such views. These views may not be relied on as investment advice and, because investment decisions for a Fidelity fund are based on numerous factors, may not be relied on as an indication of trading intent on behalf of any Fidelity fund.
Annual Report
Fidelity Series Emerging Markets Fund
Investment Changes (Unaudited)
Annual Report
Asset Allocation as of October 31, 2015 |
| % of fund's
net assets | % of fund's net assets 6 months ago |
Stocks and Equity Futures | 96.6 | 98.4 |
Short-Term Investments and Net Other Assets (Liabilities) | 3.4 | 1.6 |
Top Ten Stocks as of October 31, 2015 |
| % of fund's
net assets | % of fund's net assets 6 months ago |
Taiwan Semiconductor Manufacturing Co. Ltd. (Taiwan, Semiconductors & Semiconductor Equipment) | 3.4 | 3.7 |
Tencent Holdings Ltd. (Cayman Islands, Internet Software & Services) | 2.9 | 2.5 |
Samsung Electronics Co. Ltd. (Korea (South), Technology Hardware, Storage & Peripherals) | 2.4 | 4.1 |
Industrial & Commercial Bank of China Ltd. (H Shares) (China, Banks) | 2.2 | 2.2 |
Naspers Ltd. Class N (South Africa, Media) | 2.0 | 1.8 |
China Mobile Ltd. (Hong Kong, Wireless Telecommunication Services) | 1.9 | 2.0 |
Hyundai Mobis (Korea (South), Auto Components) | 1.8 | 1.6 |
Grupo Financiero Banorte S.A.B. de CV Series O (Mexico, Banks) | 1.4 | 1.0 |
China Pacific Insurance (Group) Co. Ltd. (H Shares) (China, Insurance) | 1.3 | 0.9 |
Shinhan Financial Group Co. Ltd. (Korea (South), Banks) | 1.2 | 1.1 |
| 20.5 | |
Market Sectors as of October 31, 2015 |
| % of fund's
net assets | % of fund's net assets 6 months ago |
Financials | 26.6 | 27.9 |
Information Technology | 18.1 | 19.5 |
Consumer Discretionary | 9.2 | 8.4 |
Consumer Staples | 8.0 | 7.5 |
Industrials | 7.3 | 7.5 |
Energy | 7.0 | 7.5 |
Materials | 5.9 | 6.9 |
Telecommunication Services | 5.9 | 6.2 |
Utilities | 3.1 | 3.3 |
Health Care | 2.5 | 2.1 |
Annual Report
Fidelity Series Emerging Markets Fund
Investments October 31, 2015
Showing Percentage of Net Assets
Common Stocks - 89.4% |
| Shares | | Value |
Argentina - 0.5% |
Telecom Argentina SA Class B sponsored ADR | 672,423 | | $ 13,118,973 |
YPF SA Class D sponsored ADR | 1,874,200 | | 40,032,912 |
TOTAL ARGENTINA | | 53,151,885 |
Austria - 0.3% |
Erste Group Bank AG (a) | 1,007,600 | | 29,550,556 |
Bermuda - 1.2% |
Aquarius Platinum Ltd. (Australia) (a)(e) | 91,132,865 | | 15,805,131 |
China Resource Gas Group Ltd. | 7,810,000 | | 21,423,186 |
Credicorp Ltd. (United States) | 429,140 | | 48,570,065 |
GP Investments Ltd. Class A (depositary receipt) (a)(e) | 9,583,037 | | 17,741,993 |
Shangri-La Asia Ltd. | 37,944,000 | | 34,725,070 |
TOTAL BERMUDA | | 138,265,445 |
Brazil - 2.7% |
B2W Companhia Global do Varejo (a) | 2,234,900 | | 8,449,221 |
BB Seguridade Participacoes SA | 4,744,500 | | 32,724,508 |
CCR SA | 11,639,900 | | 36,580,775 |
Cielo SA | 4,442,338 | | 42,170,851 |
Companhia de Saneamento de Minas Gerais | 3,616,610 | | 12,191,189 |
Cosan SA Industria e Comercio | 4,886,600 | | 31,309,820 |
Direcional Engenharia SA (e) | 14,135,000 | | 12,974,783 |
Fibria Celulose SA | 4,453,300 | | 60,785,342 |
FPC Par Corretora de Seguros | 7,770,100 | | 21,739,477 |
Minerva SA (a)(e) | 12,206,200 | | 40,386,125 |
Smiles SA | 2,973,100 | | 23,204,758 |
TOTAL BRAZIL | | 322,516,849 |
British Virgin Islands - 0.1% |
Mail.Ru Group Ltd. GDR (Reg. S) (a) | 761,675 | | 14,852,663 |
Canada - 0.4% |
Goldcorp, Inc. | 860,900 | | 11,014,727 |
Pan American Silver Corp. | 4,015,100 | | 30,394,307 |
Torex Gold Resources, Inc. (a) | 10,134,400 | | 9,610,474 |
TOTAL CANADA | | 51,019,508 |
Cayman Islands - 9.0% |
51job, Inc. sponsored ADR (a)(d) | 839,512 | | 28,383,901 |
58.com, Inc. ADR (a)(d) | 1,742,507 | | 91,464,192 |
AAC Technology Holdings, Inc. | 3,283,000 | | 20,820,070 |
Alibaba Group Holding Ltd. sponsored ADR (a)(d) | 1,422,800 | | 119,273,324 |
Baidu.com, Inc. sponsored ADR (a) | 63,000 | | 11,810,610 |
Common Stocks - continued |
| Shares | | Value |
Cayman Islands - continued |
Bitauto Holdings Ltd. ADR (a) | 315,300 | | $ 10,058,070 |
China ZhengTong Auto Services Holdings Ltd. | 50,477,800 | | 22,589,961 |
Ctrip.com International Ltd. sponsored ADR (a)(d) | 353,300 | | 32,846,301 |
ENN Energy Holdings Ltd. | 10,716,520 | | 61,391,123 |
Eurasia Drilling Co. Ltd. GDR (Reg. S) | 1,565,600 | | 17,769,560 |
Haitian International Holdings Ltd. | 9,987,000 | | 17,474,250 |
Hengan International Group Co. Ltd. | 4,822,500 | | 52,075,425 |
Leju Holdings Ltd. ADR (d) | 2,096,200 | | 15,092,640 |
NetEase, Inc. sponsored ADR | 45,400 | | 6,561,662 |
Qunar Cayman Islands Ltd. sponsored ADR (a)(d) | 1,368,200 | | 66,412,428 |
SINA Corp. (a) | 243,200 | | 11,586,048 |
Sino Biopharmaceutical Ltd. | 31,252,000 | | 38,836,870 |
SouFun Holdings Ltd. ADR | 1,386,400 | | 9,801,848 |
Sunny Optical Technology Group Co. Ltd. | 9,430,000 | | 21,925,878 |
Tencent Holdings Ltd. | 18,451,500 | | 347,799,313 |
Uni-President China Holdings Ltd. (d) | 86,051,000 | | 70,477,975 |
TOTAL CAYMAN ISLANDS | | 1,074,451,449 |
Chile - 1.7% |
Compania Cervecerias Unidas SA sponsored ADR | 2,064,000 | | 49,474,080 |
Empresas CMPC SA | 14,857,790 | | 36,610,041 |
Enersis SA | 128,171,559 | | 33,917,136 |
Inversiones La Construccion SA | 2,590,268 | | 29,440,397 |
Vina Concha y Toro SA | 34,037,884 | | 57,980,807 |
TOTAL CHILE | | 207,422,461 |
China - 10.1% |
Anhui Conch Cement Co. Ltd. (H Shares) | 17,604,500 | | 53,716,608 |
BBMG Corp. (H Shares) | 74,440,000 | | 52,165,848 |
China Cinda Asset Management Co. Ltd. (H Shares) | 69,390,000 | | 26,978,565 |
China Life Insurance Co. Ltd. (H Shares) | 34,924,900 | | 125,942,135 |
China Longyuan Power Grid Corp. Ltd. (H Shares) | 21,318,910 | | 19,490,736 |
China Machinery Engineering Co. (H Shares) | 28,202,000 | | 24,476,611 |
China Pacific Insurance (Group) Co. Ltd. (H Shares) | 39,491,250 | | 157,309,303 |
China Petroleum & Chemical Corp. (H Shares) | 48,158,000 | | 34,714,409 |
China Suntien Green Energy Corp. Ltd. (H Shares) (d)(e) | 103,603,060 | | 18,471,705 |
China Telecom Corp. Ltd. (H Shares) | 127,434,882 | | 66,472,867 |
Daqin Railway Co. Ltd. (A Shares) | 21,353,347 | | 30,766,909 |
Industrial & Commercial Bank of China Ltd. (H Shares) | 412,445,400 | | 261,616,503 |
Inner Mongoli Yili Industries Co. Ltd. | 21,105,327 | | 53,087,961 |
Kweichow Moutai Co. Ltd. | 2,570,665 | | 86,795,383 |
Maanshan Iron & Steel Ltd. (H Shares) (a)(d) | 71,616,000 | | 15,331,744 |
Common Stocks - continued |
| Shares | | Value |
China - continued |
PetroChina Co. Ltd. (H Shares) | 42,748,000 | | $ 33,467,583 |
Qingdao Haier Co. Ltd. | 44,675,277 | | 68,011,721 |
Zhengzhou Yutong Bus Co. Ltd. | 11,129,454 | | 38,333,188 |
Zhuzhou CSR Times Electric Co. Ltd. (H Shares) | 5,932,500 | | 38,403,702 |
TOTAL CHINA | | 1,205,553,481 |
Colombia - 0.4% |
Bancolombia SA sponsored ADR (d) | 1,194,911 | | 41,367,819 |
Egypt - 0.1% |
Citadel Capital Corp. (a) | 55,002,700 | | 12,603,280 |
Greece - 0.4% |
Public Power Corp. of Greece | 768,912 | | 4,430,599 |
Titan Cement Co. SA (Reg.) | 2,181,500 | | 47,857,785 |
TOTAL GREECE | | 52,288,384 |
Hong Kong - 5.8% |
AIA Group Ltd. | 7,901,400 | | 46,328,526 |
China Mobile Ltd. | 4,455,795 | | 53,424,514 |
China Mobile Ltd. sponsored ADR | 2,794,400 | | 168,530,264 |
China Resources Beer Holdings Co. Ltd. | 21,380,000 | | 40,369,080 |
China Resources Power Holdings Co. Ltd. | 14,005,976 | | 31,683,865 |
China Unicom Ltd. | 3,219,850 | | 3,923,995 |
China Unicom Ltd. sponsored ADR (d) | 1,593,990 | | 19,574,197 |
CNOOC Ltd. | 100,120,000 | | 113,086,728 |
CNOOC Ltd. sponsored ADR | 16,600 | | 1,887,088 |
Far East Horizon Ltd. | 126,079,750 | | 104,869,983 |
Lenovo Group Ltd. | 15,898,000 | | 14,771,418 |
Sinotruk Hong Kong Ltd. | 41,464,000 | | 17,258,840 |
Techtronic Industries Co. Ltd. | 20,554,000 | | 75,138,794 |
TOTAL HONG KONG | | 690,847,292 |
India - 9.3% |
Adani Ports & Special Economic Zone (a) | 9,233,978 | | 41,692,222 |
Axis Bank Ltd. (a) | 12,045,606 | | 87,240,150 |
Bharti Airtel Ltd. | 2,754,366 | | 14,672,061 |
Bharti Infratel Ltd. (a) | 7,350,054 | | 43,654,321 |
Coal India Ltd. | 16,841,328 | | 82,201,204 |
Edelweiss Financial Services Ltd. | 17,614,070 | | 15,986,196 |
Eicher Motors Ltd. (a) | 128,636 | | 34,839,103 |
Grasim Industries Ltd. | 1,132,339 | | 64,272,060 |
ITC Ltd. | 20,130,262 | | 102,804,007 |
Common Stocks - continued |
| Shares | | Value |
India - continued |
JK Cement Ltd. | 3,139,049 | | $ 32,815,318 |
Larsen & Toubro Ltd. (a) | 2,070,480 | | 44,593,687 |
LIC Housing Finance Ltd. (a) | 4,800,143 | | 35,048,268 |
Lupin Ltd. | 3,827,207 | | 112,685,971 |
NTPC Ltd. | 4,301,139 | | 8,726,758 |
Oil & Natural Gas Corp. Ltd. | 9,850,411 | | 37,160,196 |
Petronet LNG Ltd. | 9,198,040 | | 27,260,217 |
Phoenix Mills Ltd. (a) | 6,788,079 | | 34,645,464 |
Power Grid Corp. of India Ltd. | 25,775,002 | | 50,667,868 |
SREI Infrastructure Finance Ltd. (a)(e) | 44,161,318 | | 30,184,892 |
State Bank of India (a) | 21,519,456 | | 77,716,542 |
Tata Consultancy Services Ltd. | 2,760,771 | | 105,185,261 |
Yes Bank Ltd. (a) | 2,361,958 | | 27,297,879 |
TOTAL INDIA | | 1,111,349,645 |
Indonesia - 1.0% |
PT Bank Mandiri (Persero) Tbk | 63,613,400 | | 40,259,009 |
PT Bank Rakyat Indonesia Tbk | 56,019,400 | | 42,874,789 |
PT Kalbe Farma Tbk | 269,313,700 | | 28,047,913 |
PT Perusahaan Gas Negara Tbk Series B | 46,117,900 | | 10,073,037 |
TOTAL INDONESIA | | 121,254,748 |
Israel - 0.7% |
Bezeq The Israel Telecommunication Corp. Ltd. | 34,574,853 | | 74,338,861 |
Partner Communications Co. Ltd. (a) | 774,778 | | 3,516,302 |
TOTAL ISRAEL | | 77,855,163 |
Korea (South) - 14.3% |
AMOREPACIFIC Group, Inc. | 451,033 | | 63,599,773 |
BGFretail Co. Ltd. | 183,742 | | 27,357,646 |
Daewoo International Corp. | 2,994,022 | | 52,314,160 |
DOUBLEUGAMES Co. Ltd. | 85,390 | | 4,861,180 |
E-Mart Co. Ltd. | 405,779 | | 75,521,373 |
Fila Korea Ltd. (e) | 661,301 | | 57,918,933 |
Hanon Systems | 695,618 | | 27,355,114 |
Hyundai Glovis Co. Ltd. | 458,815 | | 78,962,617 |
Hyundai Industrial Development & Construction Co. | 1,513,165 | | 61,029,146 |
Hyundai Mobis | 1,001,671 | | 210,551,197 |
KB Financial Group, Inc. | 1,900,120 | | 60,107,746 |
Korea Electric Power Corp. | 833,064 | | 37,451,848 |
Korea Zinc Co. Ltd. | 82,514 | | 34,255,267 |
Korean Reinsurance Co. (e) | 6,342,344 | | 75,545,757 |
Common Stocks - continued |
| Shares | | Value |
Korea (South) - continued |
LG Chemical Ltd. | 402,112 | | $ 107,239,728 |
NAVER Corp. | 133,708 | | 70,263,538 |
NCSOFT Corp. | 96,229 | | 15,971,164 |
Samsung Electronics Co. Ltd. | 237,157 | | 284,978,064 |
Samsung Fire & Marine Insurance Co. Ltd. | 86,406 | | 24,178,878 |
Samsung Life Insurance Co. Ltd. | 461,330 | | 44,041,243 |
Samsung SDI Co. Ltd. | 109,328 | | 10,197,704 |
Shinhan Financial Group Co. Ltd. | 3,602,071 | | 137,266,921 |
SK Hynix, Inc. | 3,950,963 | | 106,233,798 |
SK Telecom Co. Ltd. | 23,478 | | 4,964,268 |
SK Telecom Co. Ltd. sponsored ADR (d) | 1,462,000 | | 34,444,720 |
TOTAL KOREA (SOUTH) | | 1,706,611,783 |
Mauritius - 0.1% |
MakeMyTrip Ltd. (a) | 501,900 | | 8,010,324 |
Mexico - 5.8% |
America Movil S.A.B. de CV Series L sponsored ADR | 4,884,120 | | 86,986,177 |
Banregio Grupo Financiero S.A.B. de CV | 3,682,850 | | 19,868,188 |
El Puerto de Liverpool S.A.B. de CV Class C | 4,168,800 | | 57,893,971 |
Grupo Aeroportuario del Pacifico SA de CV Series B | 4,901,000 | | 44,141,579 |
Grupo Aeroportuario Norte S.A.B. de CV | 3,436,600 | | 17,676,297 |
Grupo Comercial Chedraui S.A.B. de CV | 9,989,688 | | 27,638,592 |
Grupo Financiero Banorte S.A.B. de CV Series O | 31,477,900 | | 169,511,630 |
Grupo Financiero Santander Mexico S.A.B. de CV | 5,823,465 | | 10,700,103 |
Infraestructura Energetica Nova S.A.B. de CV | 3,760,700 | | 18,134,361 |
Macquarie Mexican (REIT) (e) | 71,952,748 | | 99,884,761 |
Promotora y Operadora de Infraestructura S.A.B. de CV (a) | 847,470 | | 10,626,083 |
Tenedora Nemak SA de CV (a) | 18,978,000 | | 27,448,233 |
Wal-Mart de Mexico SA de CV Series V | 39,792,900 | | 104,988,230 |
TOTAL MEXICO | | 695,498,205 |
Netherlands - 0.5% |
Cnova NV (a)(d) | 1,764,194 | | 5,292,582 |
Hangzhou Hikvision Digital Technology Co. Ltd. ELS (BNP Paribas Arbitrage Warrant Program) warrants 10/21/16 (a) | 4,581,900 | | 24,958,159 |
Yandex NV (a) | 1,546,300 | | 24,895,430 |
TOTAL NETHERLANDS | | 55,146,171 |
Nigeria - 0.7% |
Guaranty Trust Bank PLC GDR (Reg. S) | 3,427,277 | | 19,706,843 |
Common Stocks - continued |
| Shares | | Value |
Nigeria - continued |
Transnational Corp. of Nigeria PLC | 1,099,719,442 | | $ 9,999,961 |
Zenith Bank PLC | 574,561,345 | | 50,802,711 |
TOTAL NIGERIA | | 80,509,515 |
Pakistan - 0.3% |
Habib Bank Ltd. | 20,682,900 | | 41,105,083 |
Panama - 0.3% |
Copa Holdings SA Class A | 678,400 | | 34,272,768 |
Philippines - 1.7% |
Alliance Global Group, Inc. | 111,153,050 | | 43,185,885 |
Metro Pacific Investments Corp. | 227,474,356 | | 25,308,239 |
Metropolitan Bank & Trust Co. | 26,029,517 | | 47,263,605 |
Robinsons Land Corp. | 137,775,870 | | 90,064,476 |
TOTAL PHILIPPINES | | 205,822,205 |
Russia - 2.8% |
E.ON Russia JSC (a) | 379,920,400 | | 18,074,302 |
Lukoil PJSC sponsored ADR | 3,034,700 | | 110,159,610 |
Mobile TeleSystems OJSC (a) | 7,119,510 | | 23,167,686 |
NOVATEK OAO GDR (Reg. S) | 834,500 | | 76,315,025 |
Sberbank of Russia (a) | 19,059,020 | | 27,022,708 |
Sberbank of Russia sponsored ADR | 10,711,231 | | 65,691,980 |
Sistema JSFC (a) | 45,065,300 | | 12,466,860 |
Sistema JSFC sponsored GDR | 779,100 | | 5,414,745 |
TOTAL RUSSIA | | 338,312,916 |
Singapore - 0.3% |
First Resources Ltd. | 25,710,500 | | 34,440,969 |
South Africa - 5.2% |
Aspen Pharmacare Holdings Ltd. | 3,372,482 | | 75,742,549 |
Barclays Africa Group Ltd. | 8,651,969 | | 111,033,290 |
Bidvest Group Ltd. | 2,390,145 | | 61,139,629 |
JSE Ltd. | 2,505,492 | | 24,169,606 |
Life Healthcare Group Holdings Ltd. | 19,252,300 | | 53,698,879 |
Naspers Ltd. Class N | 1,630,000 | | 238,746,297 |
Sasol Ltd. | 882,900 | | 28,289,611 |
Telkom SA Ltd. | 4,489,028 | | 23,582,075 |
TOTAL SOUTH AFRICA | | 616,401,936 |
Taiwan - 7.8% |
Advanced Semiconductor Engineering, Inc. | 13,460,000 | | 15,538,246 |
Common Stocks - continued |
| Shares | | Value |
Taiwan - continued |
Advantech Co. Ltd. | 7,213,000 | | $ 51,878,500 |
ASUSTeK Computer, Inc. | 3,140,000 | | 28,145,387 |
Catcher Technology Co. Ltd. | 3,474,000 | | 34,242,415 |
E.SUN Financial Holdings Co. Ltd. | 119,286,528 | | 71,832,793 |
Hermes Microvision, Inc. | 438,000 | | 16,931,773 |
Hon Hai Precision Industry Co. Ltd. (Foxconn) | 12,184,644 | | 32,502,392 |
Inotera Memories, Inc. (a) | 20,826,000 | | 16,101,420 |
King's Town Bank | 25,006,000 | | 19,949,342 |
Largan Precision Co. Ltd. | 537,000 | | 41,931,157 |
Taiwan Cement Corp. | 54,510,000 | | 60,781,211 |
Taiwan Fertilizer Co. Ltd. | 14,280,000 | | 18,276,113 |
Taiwan Semiconductor Manufacturing Co. Ltd. | 94,316,284 | | 397,399,240 |
Taiwan Semiconductor Manufacturing Co. Ltd. sponsored ADR | 469,701 | | 10,314,634 |
Unified-President Enterprises Corp. | 27,227,942 | | 46,127,732 |
Universal Cement Corp. | 26,528,559 | | 18,753,440 |
Vanguard International Semiconductor Corp. | 11,370,000 | | 14,691,868 |
Yuanta Financial Holding Co. Ltd. | 98,320,206 | | 38,764,782 |
TOTAL TAIWAN | | 934,162,445 |
Thailand - 2.7% |
Airports of Thailand PCL (For. Reg.) | 4,918,400 | | 41,113,127 |
Intouch Holdings PCL NVDR | 11,647,990 | | 24,547,635 |
Jasmine Broadband Internet Infrastructure Fund | 155,340,300 | | 45,444,593 |
Jasmine International Public Co. Ltd. | 24,870,000 | | 3,948,524 |
Kasikornbank PCL (For. Reg.) | 21,212,004 | | 102,608,440 |
PTT PCL (For. Reg.) | 7,238,100 | | 55,902,622 |
Thai Union Frozen Products PCL (For. Reg.) | 90,081,600 | | 44,754,411 |
TOTAL THAILAND | | 318,319,352 |
Turkey - 1.0% |
Aselsan A/S | 4,268,000 | | 20,422,103 |
Tupras Turkiye Petrol Rafinelleri A/S (a) | 2,216,196 | | 58,532,994 |
Turkiye Garanti Bankasi A/S | 15,501,500 | | 40,140,069 |
TOTAL TURKEY | | 119,095,166 |
United Arab Emirates - 1.1% |
DP World Ltd. | 1,559,621 | | 31,519,940 |
Emaar Properties PJSC | 16,429,389 | | 28,850,955 |
Emirates Telecommunications Corp. | 894,754 | | 3,727,127 |
First Gulf Bank PJSC | 20,730,317 | | 69,703,081 |
TOTAL UNITED ARAB EMIRATES | | 133,801,103 |
Common Stocks - continued |
| Shares | | Value |
United Kingdom - 0.6% |
Fresnillo PLC | 2,398,100 | | $ 26,987,450 |
HSBC Holdings PLC (Hong Kong) | 5,164,800 | | 40,382,919 |
TOTAL UNITED KINGDOM | | 67,370,369 |
United States of America - 0.5% |
Cognizant Technology Solutions Corp. Class A (a) | 796,372 | | 54,240,897 |
TOTAL COMMON STOCKS (Cost $10,466,199,277) |
10,647,471,835
|
Nonconvertible Preferred Stocks - 4.2% |
| | | |
Brazil - 2.0% |
Banco Bradesco SA (PN) sponsored ADR (d) | 6,101,500 | | 33,192,160 |
Banco do Estado Rio Grande do Sul SA | 9,237,636 | | 14,347,912 |
Companhia Paranaense de Energia-Copel: | | | |
(PN-B) | 155,300 | | 1,308,747 |
(PN-B) sponsored (d) | 2,648,239 | | 21,874,454 |
Itau Unibanco Holding SA sponsored ADR | 12,494,586 | | 85,587,914 |
Petroleo Brasileiro SA - Petrobras (PN) sponsored (non-vtg.) (a) | 11,840,600 | | 47,243,994 |
Telefonica Brasil SA | 1,284,300 | | 13,304,063 |
Vale SA (PN-A) sponsored ADR (d) | 7,489,800 | | 26,963,280 |
TOTAL BRAZIL | | 243,822,524 |
Cayman Islands - 0.2% |
China Internet Plus Holdings Ltd. (f) | 7,577,282 | | 29,248,309 |
Korea (South) - 1.7% |
Hyundai Motor Co. Series 2 | 787,195 | | 78,597,467 |
Samsung Electronics Co. Ltd. | 86,532 | | 90,566,174 |
Samsung Fire & Marine Insurance Co. Ltd. | 180,303 | | 31,662,026 |
TOTAL KOREA (SOUTH) | | 200,825,667 |
Russia - 0.3% |
Surgutneftegas OJSC (a) | 43,209,500 | | 29,454,301 |
TOTAL NONCONVERTIBLE PREFERRED STOCKS (Cost $693,306,750) |
503,350,801
|
Money Market Funds - 4.5% |
| Shares | | Value |
Fidelity Cash Central Fund, 0.18% (b) | 432,677,972 | | $ 432,677,972 |
Fidelity Securities Lending Cash Central Fund, 0.19% (b)(c) | 106,637,243 | | 106,637,243 |
TOTAL MONEY MARKET FUNDS (Cost $539,315,215) |
539,315,215
|
TOTAL INVESTMENT PORTFOLIO - 98.1% (Cost $11,698,821,242) | 11,690,137,851 |
NET OTHER ASSETS (LIABILITIES) - 1.9% | 222,102,808 |
NET ASSETS - 100% | $ 11,912,240,659 |
Futures Contracts |
| Expiration Date | | Underlying Face Amount at Value | | Unrealized Appreciation/
(Depreciation) |
Purchased |
Equity Index Contracts |
8,417 ICE E-mini MSCI Emerging Markets Index Contracts (United States) | Dec. 2015 | | $ 355,071,145 | | $ 5,308,369 |
|
The face value of futures purchased as a percentage of net assets is 3% |
Security Type Abbreviations |
ELS | - | Equity-Linked Security |
Legend |
(a) Non-income producing |
(b) Affiliated fund that is generally available only to investment companies and other accounts managed by Fidelity Investments. The rate quoted is the annualized seven-day yield of the fund at period end. A complete unaudited listing of the fund's holdings as of its most recent quarter end is available upon request. In addition, each Fidelity Central Fund's financial statements, which are not covered by the Fund's Report of Independent Registered Public Accounting Firm, are available on the SEC's website or upon request. |
(c) Investment made with cash collateral received from securities on loan. |
(d) Security or a portion of the security is on loan at period end. |
(e) Affiliated company |
(f) Restricted securities - Investment in securities not registered under the Securities Act of 1933 (excluding 144A issues). At the end of the period, the value of restricted securities (excluding 144A issues) amounted to $29,248,309 or 0.2% of net assets. |
Additional information on each restricted holding is as follows: |
Security | Acquisition Date | Acquisition Cost |
China Internet Plus Holdings Ltd. | 1/26/15 | $ 23,950,652 |
Affiliated Central Funds |
Information regarding fiscal year to date income earned by the Fund from investments in Fidelity Central Funds is as follows: |
Fund | Income earned |
Fidelity Cash Central Fund | $ 733,254 |
Fidelity Securities Lending Cash Central Fund | 615,140 |
Total | $ 1,348,394 |
Other Affiliated Issuers |
An affiliated company is a company in which the Fund has ownership of at least 5% of the voting securities. Fiscal year to date transactions with companies which are or were affiliates are as follows: |
Affiliate | Value, beginning of period | Purchases | Sales Proceeds | Dividend Income | Value,
end of
period |
Aquarius Platinum Ltd. (Australia) | $ 18,498,158 | $ 4,236,396 | $ - | $ - | $ 15,805,131 |
Direcional Engenharia SA | - | 27,357,077 | - | 1,363,653 | 12,974,783 |
Fila Korea Ltd. | 33,462,090 | 32,477,582 | - | 64,231 | 57,918,933 |
GP Investments Ltd. Class A (depositary receipt) | 23,311,870 | - | 4,262,323 | - | 17,741,993 |
Korean Reinsurance Co. | 54,409,675 | 13,901,513 | 2,550,866 | 947,602 | 75,545,757 |
Macquarie Mexican (REIT) | 48,149,486 | 74,717,451 | 2,947,168 | 4,691,947 | 99,884,761 |
Affiliate | Value, beginning of period | Purchases | Sales Proceeds | Dividend Income | Value,
end of
period |
Minerva SA | $ 50,188,557 | $ 8,281,160 | $ - | $ - | $ 40,386,125 |
SREI Infrastructure Finance Ltd. | 36,691,182 | - | 2,762,936 | 372,954 | 30,184,892 |
T4F Entretenimento SA | 5,103,986 | 21,144 | 3,449,329 | - | - |
Total | $ 269,815,004 | $ 160,992,323 | $ 15,972,622 | $ 7,440,387 | $ 350,442,375 |
Other Information |
Categorizations in the Schedule of Investments are based on country or territory of incorporation. |
The following is a summary of the inputs used, as of October 31, 2015, involving the Fund's assets and liabilities carried at fair value. The inputs or methodology used for valuing securities may not be an indication of the risk associated with investing in those securities. For more information on valuation inputs, and their aggregation into the levels used in the tables below, please refer to the Investment Valuation section in the accompanying Notes to Financial Statements. |
Valuation Inputs at Reporting Date: |
Description | Total | Level 1 | Level 2 | Level 3 |
Investments in Securities: | | | | |
Equities: | | | | |
Consumer Discretionary | $ 1,090,276,644 | $ 855,701,609 | $ 137,315,005 | $ 97,260,030 |
Consumer Staples | 977,879,569 | 493,074,358 | 484,805,211 | - |
Energy | 843,259,579 | 383,251,003 | 460,008,576 | - |
Financials | 3,148,735,173 | 1,393,869,094 | 1,754,866,079 | - |
Health Care | 309,012,182 | 129,441,428 | 179,570,754 | - |
Industrials | 849,206,522 | 477,068,998 | 372,137,524 | - |
Information Technology | 2,160,197,649 | 1,236,758,223 | 923,439,426 | - |
Materials | 723,635,874 | 489,529,165 | 234,106,709 | - |
Telecommunication Services | 697,780,235 | 459,004,364 | 238,775,871 | - |
Utilities | 350,839,209 | 109,930,788 | 240,908,421 | - |
Money Market Funds | 539,315,215 | 539,315,215 | - | - |
Total Investments in Securities: | $ 11,690,137,851 | $ 6,566,944,245 | $ 5,025,933,558 | $ 97,260,030 |
Derivative Instruments: | | | | |
Assets | | | | |
Futures Contracts | $ 5,308,369 | $ 5,308,369 | $ - | $ - |
The following is a summary of transfers between Level 1 and Level 2 for the period ended October 31, 2015. Transfers are assumed to have occurred at the beginning of the period, and are primarily attributable to the valuation techniques used for foreign equity securities, as discussed in the accompanying Notes to Financial Statements: |
Transfers | Total |
Level 1 to Level 2 | $ 110,091,668 |
Level 2 to Level 1 | $ 392,376,754 |
Value of Derivative Instruments |
The following table is a summary of the Fund's value of derivative instruments by primary risk exposure as of October 31, 2015. For additional information on derivative instruments, please refer to the Derivative Instruments section in the accompanying Notes to Financial Statements. |
Primary Risk Exposure /
Derivative Type | Value |
| Asset | Liability |
Equity Risk | | |
Futures Contracts (a) | $ 5,308,369 | $ - |
Total Value of Derivatives | $ 5,308,369 | $ - |
(a) Reflects gross cumulative appreciation (depreciation) on futures contracts as presented in the Schedule of Investments. Only the period end receivable or payable for daily variation margin and net unrealized appreciation (depreciation) are presented in the Statement of Assets and Liabilities. |
See accompanying notes which are an integral part of the financial statements.
Annual Report
Fidelity Series Emerging Markets Fund
Statement of Assets and Liabilities
| | October 31, 2015 |
Assets | | |
Investment in securities, at value (including securities loaned of $105,908,919) - See accompanying schedule: Unaffiliated issuers (cost $10,724,710,961) | $ 10,800,380,261 | |
Fidelity Central Funds (cost $539,315,215) | 539,315,215 | |
Other affiliated issuers (cost $434,795,066) | 350,442,375 | |
Total Investments (cost $11,698,821,242) | | $ 11,690,137,851 |
Segregated cash with brokers for derivative instruments | | 8,127,100 |
Foreign currency held at value (cost $21,339,829) | | 21,362,660 |
Receivable for investments sold | | 171,301,997 |
Receivable for fund shares sold | | 211,267,870 |
Dividends receivable | | 3,266,461 |
Distributions receivable from Fidelity Central Funds | | 137,521 |
Receivable for daily variation margin for derivative instruments | | 387,328 |
Prepaid expenses | | 29,958 |
Other receivables | | 137,329 |
Total assets | | 12,106,156,075 |
| | |
Liabilities | | |
Payable to custodian bank | $ 2,708,860 | |
Payable for investments purchased | 73,173,155 | |
Payable for fund shares redeemed | 405,996 | |
Accrued management fee | 7,812,314 | |
Other affiliated payables | 871,977 | |
Other payables and accrued expenses | 2,305,871 | |
Collateral on securities loaned, at value | 106,637,243 | |
Total liabilities | | 193,915,416 |
| | |
Net Assets | | $ 11,912,240,659 |
Net Assets consist of: | | |
Paid in capital | | $ 12,785,037,799 |
Undistributed net investment income | | 129,474,166 |
Accumulated undistributed net realized gain (loss) on investments and foreign currency transactions | | (998,056,500) |
Net unrealized appreciation (depreciation) on investments and assets and liabilities in foreign currencies | | (4,214,806) |
Net Assets | | $ 11,912,240,659 |
See accompanying notes which are an integral part of the financial statements.
Annual Report
Statement of Assets and Liabilities - continued
| | October 31, 2015 |
Series Emerging Markets: | | |
Net Asset Value, offering price and redemption price per share ($5,571,492,867 ÷ 364,013,102 shares) | | $ 15.31 |
| | |
Class F: | | |
Net Asset Value, offering price and redemption price per share ($6,340,747,792 ÷ 412,812,145 shares) | | $ 15.36 |
See accompanying notes which are an integral part of the financial statements.
Annual Report
Fidelity Series Emerging Markets Fund
Financial Statements - continued
Statement of Operations
| Year ended October 31, 2015 |
Investment Income | | |
Dividends (including $7,440,387 earned from other affiliated issuers) | | $ 254,578,205 |
Special dividends | | 31,262,431 |
Interest | | 4,449 |
Income from Fidelity Central Funds | | 1,348,394 |
Income before foreign taxes withheld | | 287,193,479 |
Less foreign taxes withheld | | (28,773,341) |
Total income | | 258,420,138 |
| | |
Expenses | | |
Management fee | $ 89,014,732 | |
Transfer agent fees | 8,729,015 | |
Accounting and security lending fees | 1,836,056 | |
Custodian fees and expenses | 6,756,875 | |
Independent trustees' compensation | 46,542 | |
Audit | 100,250 | |
Legal | 25,969 | |
Miscellaneous | 79,131 | |
Total expenses before reductions | 106,588,570 | |
Expense reductions | (1,163,374) | 105,425,196 |
Net investment income (loss) | | 152,994,942 |
Realized and Unrealized Gain (Loss) | | |
Net realized gain (loss) on: | | |
Investment securities: | | |
Unaffiliated issuers (net of foreign taxes of
$9,012,228) | (650,943,206) | |
Other affiliated issuers | (12,942,060) | |
Foreign currency transactions | (13,820,516) | |
Futures contracts | (57,461,053) | |
Total net realized gain (loss) | | (735,166,835) |
Change in net unrealized appreciation (depreciation) on: Investment securities (net of decrease in deferred foreign taxes of $17,008,398) | (959,562,613) | |
Assets and liabilities in foreign currencies | 1,231,430 | |
Futures contracts | (2,742,877) | |
Total change in net unrealized appreciation (depreciation) | | (961,074,060) |
Net gain (loss) | | (1,696,240,895) |
Net increase (decrease) in net assets resulting from operations | | $ (1,543,245,953) |
See accompanying notes which are an integral part of the financial statements.
Annual Report
Statement of Changes in Net Assets
| Year ended
October 31,
2015 | Year ended
October 31,
2014 |
Increase (Decrease) in Net Assets | | |
Operations | | |
Net investment income (loss) | $ 152,994,942 | $ 107,299,325 |
Net realized gain (loss) | (735,166,832) | 48,289,090 |
Change in net unrealized appreciation (depreciation) | (961,074,063) | (14,060,354) |
Net increase (decrease) in net assets resulting from operations | (1,543,245,953) | 141,528,061 |
Distributions to shareholders from net investment income | (89,825,646) | (82,603,080) |
Distributions to shareholders from net realized gain | - | (2,770,030) |
Total distributions | (89,825,646) | (85,373,110) |
Share transactions - net increase (decrease) | 3,499,387,207 | 2,875,521,339 |
Total increase (decrease) in net assets | 1,866,315,608 | 2,931,676,290 |
| | |
Net Assets | | |
Beginning of period | 10,045,925,051 | 7,114,248,761 |
End of period (including undistributed net investment income of $129,474,166 and undistributed net investment income of $76,236,490, respectively) | $ 11,912,240,659 | $ 10,045,925,051 |
See accompanying notes which are an integral part of the financial statements.
Annual Report
Financial Highlights - Fidelity Series Emerging Markets
Years ended October 31, | 2015 | 2014 | 2013 | 2012 | 2011 |
Selected Per-Share Data | | | | | |
Net asset value, beginning of period | $ 17.77 | $ 17.56 | $ 16.25 | $ 16.06 | $ 18.85 |
Income from Investment Operations | | | | | |
Net investment income (loss)B | .21E | .21 | .20 | .21 | .18 |
Net realized and unrealized gain (loss) | (2.53) | .17 | 1.34 | .59 | (2.19) |
Total from investment operations | (2.32) | .38 | 1.54 | .80 | (2.01) |
Distributions from net investment income | (.14) | (.17) | (.22) | (.09) | (.10) |
Distributions from net realized gain | - | (.01) | (.01) | (.52) | (.68) |
Total distributions | (.14) | (.17)G | (.23) | (.61) | (.78) |
Net asset value, end of period | $ 15.31 | $ 17.77 | $ 17.56 | $ 16.25 | $ 16.06 |
Total ReturnA | (13.14)% | 2.20% | 9.59% | 5.40% | (11.26)% |
Ratios to Average Net AssetsC, F | | | | |
Expenses before reductions | 1.04% | 1.06% | 1.09% | 1.10% | 1.12% |
Expenses net of fee waivers, if any | 1.04% | 1.06% | 1.09% | 1.10% | 1.12% |
Expenses net of all reductions | 1.03% | 1.06% | 1.06% | 1.07% | 1.07% |
Net investment income (loss) | 1.29%E | 1.18% | 1.22% | 1.37% | 1.00% |
Supplemental Data | | | | | |
Net assets, end of period (000 omitted) | $ 5,571,493 | $ 4,837,497 | $ 3,623,928 | $ 3,182,644 | $ 3,384,616 |
Portfolio turnover rateD | 64% | 93% | 79% | 80% | 104% |
A Total returns would have been lower if certain expenses had not been reduced during the applicable periods shown.
B Calculated based on average shares outstanding during the period.
C Fees and expenses of any underlying Fidelity Central Funds are not included in the Fund's expense ratio. The Fund indirectly bears its proportionate share of the expenses of any underlying Fidelity Central Funds.
D Amount does not include the portfolio activity of any underlying Fidelity Central Funds.
E Investment income per share reflects a large, non-recurring dividend which amounted to $.05 per share. Excluding this non-recurring dividend, the ratio of net investment income (loss) to average net assets would have been 1.00%.
F Expense ratios reflect operating expenses of the class. Expenses before reductions do not reflect amounts reimbursed by the investment adviser or reductions from brokerage service arrangements or reductions from other expense offset arrangements and do not represent the amount paid by the class during periods when reimbursements or reductions occur. Expense ratios before reductions for start-up periods may not be representative of longer-term operating periods. Expenses net of fee waivers reflect expenses after reimbursement by the investment adviser but prior to reductions from brokerage service arrangements or other expense offset arrangements. Expenses net of all reductions represent the net expenses paid by the class.
G Total distributions of $.17 per share is comprised of distributions from net investment income of $.166 and distributions from net realized gain of $.006 per share.
See accompanying notes which are an integral part of the financial statements.
Annual Report
Financial Highlights - Fidelity Series Emerging Markets Fund Class F
Years ended October 31, | 2015 | 2014 | 2013 | 2012 | 2011 |
Selected Per-Share Data | | | | | |
Net asset value, beginning of period | $ 17.83 | $ 17.62 | $ 16.30 | $ 16.11 | $ 18.90 |
Income from Investment Operations | | | | | |
Net investment income (loss)B | .24E | .24 | .23 | .25 | .21 |
Net realized and unrealized gain (loss) | (2.54) | .17 | 1.35 | .58 | (2.19) |
Total from investment operations | (2.30) | .41 | 1.58 | .83 | (1.98) |
Distributions from net investment income | (.17) | (.19) | (.26) | (.12) | (.13) |
Distributions from net realized gain | - | (.01) | (.01) | (.52) | (.68) |
Total distributions | (.17) | (.20) | (.26)G | (.64) | (.81) |
Net asset value, end of period | $ 15.36 | $ 17.83 | $ 17.62 | $ 16.30 | $ 16.11 |
Total ReturnA | (13.02)% | 2.35% | 9.84% | 5.60% | (11.07)% |
Ratios to Average Net AssetsC, F | | | | | |
Expenses before reductions | .88% | .89% | .90% | .90% | .91% |
Expenses net of fee waivers, if any | .88% | .89% | .90% | .90% | .91% |
Expenses net of all reductions | .87% | .89% | .88% | .87% | .86% |
Net investment income (loss) | 1.45%E | 1.35% | 1.40% | 1.57% | 1.21% |
Supplemental Data | | | | | |
Net assets, end of period (000 omitted) | $ 6,340,748 | $ 5,208,429 | $ 3,490,320 | $ 2,570,780 | $ 1,471,427 |
Portfolio turnover rateD | 64% | 93% | 79% | 80% | 104% |
A Total returns would have been lower if certain expenses had not been reduced during the applicable periods shown.
B Calculated based on average shares outstanding during the period.
C Fees and expenses of any underlying Fidelity Central Funds are not included in the Fund's expense ratio. The Fund indirectly bears its proportionate share of the expenses of any underlying Fidelity Central Funds.
D Amount does not include the portfolio activity of any underlying Fidelity Central Funds.
E Investment income per share reflects a large, non-recurring dividend which amounted to $.05 per share. Excluding this non-recurring dividend, the ratio of net investment income (loss) to average net assets would have been 1.17%.
F Expense ratios reflect operating expenses of the class. Expenses before reductions do not reflect amounts reimbursed by the investment adviser or reductions from brokerage service arrangements or reductions from other expense offset arrangements and do not represent the amount paid by the class during periods when reimbursements or reductions occur. Expense ratios before reductions for start-up periods may not be representative of longer-term operating periods. Expenses net of fee waivers reflect expenses after reimbursement by the investment adviser but prior to reductions from brokerage service arrangements or other expense offset arrangements. Expenses net of all reductions represent the net expenses paid by the class.
G Total distributions of $.26 per share is comprised of distributions from net investment income of $.255 and distributions from net realized gain of $.009 per share.
See accompanying notes which are an integral part of the financial statements.
Annual Report
Fidelity Series International Growth Fund
Average annual total return reflects the change in the value of an investment, assuming reinvestment of the class' distributions from dividend income and capital gains (the profits earned upon the sale of securities that have grown in value, if any) and assuming a constant rate of performance each year. The $10,000 table and the fund's returns do not reflect the deduction of taxes that a shareholder would pay on fund distributions or the redemption of fund shares. During periods of reimbursement by Fidelity, a fund's total return will be greater than it would be had the reimbursement not occurred. How a fund did yesterday is no guarantee of how it will do tomorrow.
Average Annual Total Returns
Periods ended October 31, 2015 | Past 1
year | Past 5
years | Life of
fund A |
Fidelity Series International Growth Fund | 3.65% | 7.10% | 7.51% |
Class F | 3.83% | 7.30% | 7.71% |
A From December 3, 2009.
$10,000 Over Life of Fund
Let's say hypothetically that $10,000 was invested in Fidelity Series International Growth Fund, a class of the fund, on December 3, 2009, when the fund started. The chart shows how the value of your investment would have changed, and also shows how the MSCI EAFE Growth Index performed over the same period.
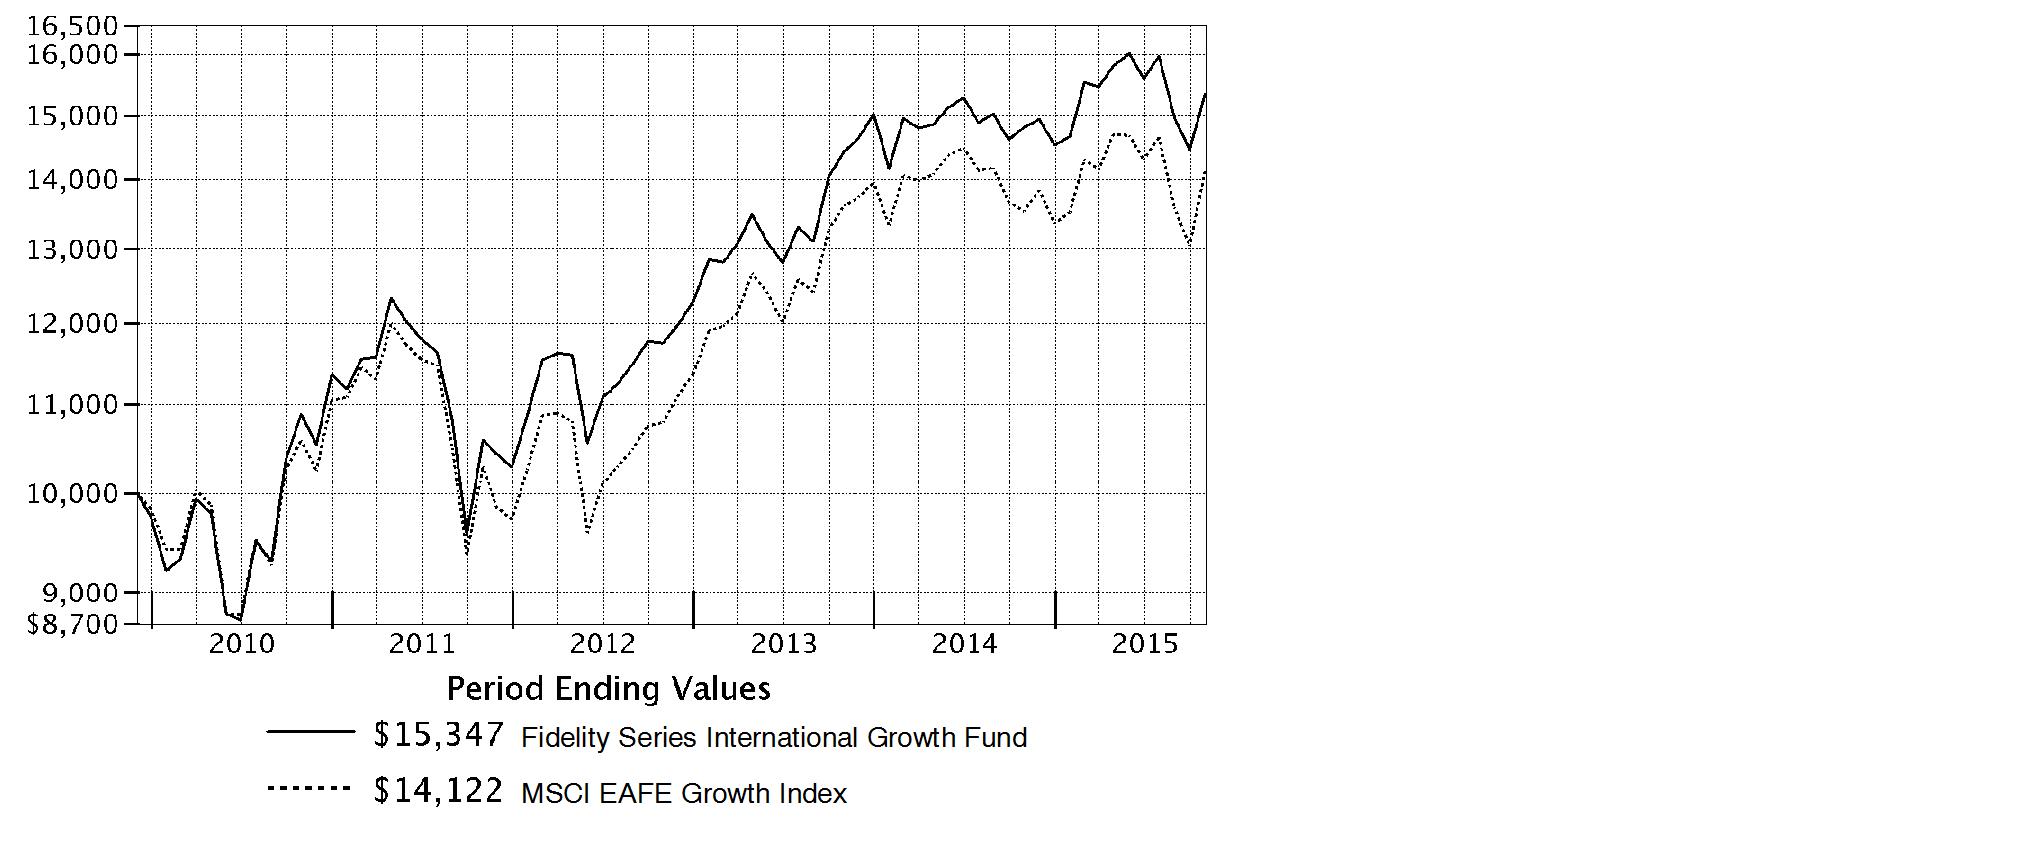
Annual Report
Fidelity Series International Growth Fund
Market Recap: International equities suffered a moderate setback for the 12 months ending October 31, 2015, held back by a collapse in commodities prices that hurt resources-related sectors and geographies. The MSCI ACWI (All Country World Index) ex USA Index returned -4.55% for the period, affected also by concerns about global economic growth. Commodity producers remained under pressure for much of the past year, largely related to economic deceleration in China (-1%), the world's second-largest economy and a leading consumer of raw materials. This effect was exacerbated by U.S. dollar strength relative to global currencies, which weighed on commodities priced in dollars and acutely impacted equity returns within regions most exposed to resources prices. The emerging-markets group, for example, returned about -15% this period. Canada, a significant energy producer, returned roughly -17%. Net energy consumer Japan (+9%) was the best-performing region by far. Only about a quarter of the nearly 50 index countries managed a gain this period: Ireland (+19%) - the EU's fastest-growing economy - and Israel (+17%) proved top performers; Greece (-56%) and Brazil (-46%), among the worst. As for sectors, energy (-25%) and materials (-16%) declined sharply, whereas the two consumer sectors each gained about 6%.
Comments from Portfolio Manager Jed Weiss: For the year, the fund's share classes produced low-single-digit gains, underperforming the 4.28% return of the benchmark MSCI EAFE Growth Index. The fund underperformed largely for idiosyncratic reasons, and also was affected by a downward fair-value pricing adjustment and unfavorable currency movements. Security selection was helpful, especially in materials and financials. Conversely, picks in health care hampered results. In country terms, stock picking was strong in Australia, Spain and Switzerland, but weak in Hong Kong and Germany, as well as in the United States, where some of the fund's globally oriented stocks are based. The fund's two biggest individual detractors were Wynn Macau and Sands China, owners of casino properties in Macau. These stocks struggled for various reasons, and I eliminated the fund's stake in both. Another negative was Turkey-based Coca-Cola Icecek Sanayi. I reduced the fund's stake in this owner of the Coca-Cola bottling franchise in various emerging markets and reinvested the proceeds in other stocks I thought offered a better risk/reward balance. In contrast, our biggest contributor was Industria de Diseño Textil (Inditex), a Spanish clothing company, while Visa and MasterCard, two U.S.-based payment processors, also contributed. These last two names were not in the benchmark.
The views expressed above reflect those of the portfolio manager(s) only through the end of the period as stated on the cover of this report and do not necessarily represent the views of Fidelity or any other person in the Fidelity organization. Any such views are subject to change at any time based upon market or other conditions and Fidelity disclaims any responsibility to update such views. These views may not be relied on as investment advice and, because investment decisions for a Fidelity fund are based on numerous factors, may not be relied on as an indication of trading intent on behalf of any Fidelity fund.
Annual Report
Fidelity Series International Growth Fund
Investment Changes (Unaudited)
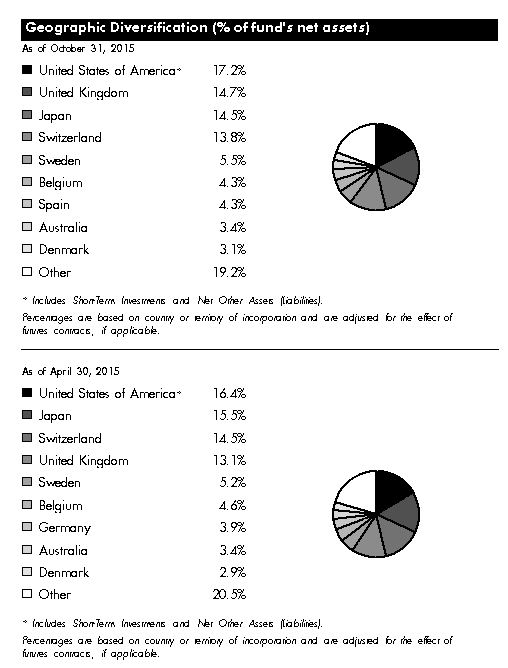
Annual Report
Asset Allocation as of October 31, 2015 |
| % of fund's
net assets | % of fund's net assets
6 months ago |
Stocks | 98.0 | 98.8 |
Short-Term Investments and Net Other Assets (Liabilities) | 2.0 | 1.2 |
Top Ten Stocks as of October 31, 2015 |
| % of fund's
net assets | % of fund's net assets
6 months ago |
Novartis AG (Switzerland, Pharmaceuticals) | 3.8 | 3.9 |
Roche Holding AG (participation certificate) (Switzerland, Pharmaceuticals) | 3.6 | 3.9 |
Nestle SA (Switzerland, Food Products) | 3.0 | 3.6 |
Reckitt Benckiser Group PLC (United Kingdom, Household Products) | 2.8 | 2.2 |
Anheuser-Busch InBev SA NV (Belgium, Beverages) | 2.7 | 2.9 |
Inditex SA (Spain, Specialty Retail) | 2.6 | 2.0 |
Novo Nordisk A/S Series B sponsored ADR (Denmark, Pharmaceuticals) | 2.4 | 2.3 |
CSL Ltd. (Australia, Biotechnology) | 2.2 | 2.2 |
Visa, Inc. Class A (United States of America, IT Services) | 2.1 | 1.7 |
DENSO Corp. (Japan, Auto Components) | 2.1 | 2.6 |
| 27.3 | |
Market Sectors as of October 31, 2015 |
| % of fund's
net assets | % of fund's net assets
6 months ago |
Health Care | 18.8 | 17.8 |
Financials | 18.2 | 17.5 |
Consumer Staples | 15.9 | 14.6 |
Consumer Discretionary | 15.1 | 15.5 |
Industrials | 12.1 | 14.4 |
Information Technology | 11.3 | 10.6 |
Materials | 6.0 | 6.3 |
Energy | 0.4 | 1.5 |
Telecommunication Services | 0.2 | 0.6 |
Annual Report
Fidelity Series International Growth Fund
Investments October 31, 2015
Showing Percentage of Net Assets
Common Stocks - 98.0% |
| Shares | | Value |
Australia - 3.4% |
CSL Ltd. | 3,963,835 | | $ 263,477,329 |
Sydney Airport unit | 14,361,827 | | 65,635,099 |
Transurban Group unit | 11,372,813 | | 84,273,069 |
TOTAL AUSTRALIA | | 413,385,497 |
Austria - 1.1% |
Andritz AG | 2,522,198 | | 127,027,904 |
Bailiwick of Jersey - 1.4% |
Shire PLC | 2,179,900 | | 165,085,740 |
Belgium - 4.3% |
Anheuser-Busch InBev SA NV | 2,697,881 | | 321,923,578 |
KBC Groep NV | 3,199,019 | | 194,886,188 |
TOTAL BELGIUM | | 516,809,766 |
Canada - 0.4% |
Pason Systems, Inc. | 2,033,869 | | 29,926,307 |
ShawCor Ltd. Class A | 683,400 | | 14,503,174 |
TOTAL CANADA | | 44,429,481 |
Cayman Islands - 1.0% |
58.com, Inc. ADR (a) | 653,900 | | 34,323,211 |
Alibaba Group Holding Ltd. sponsored ADR (a) | 1,026,500 | | 86,051,495 |
TOTAL CAYMAN ISLANDS | | 120,374,706 |
Denmark - 3.1% |
Jyske Bank A/S (Reg.) (a) | 1,707,200 | | 83,341,898 |
Novo Nordisk A/S Series B sponsored ADR | 5,444,281 | | 289,526,864 |
TOTAL DENMARK | | 372,868,762 |
Finland - 0.3% |
Tikkurila Oyj | 1,665,679 | | 30,570,471 |
France - 1.0% |
Safran SA | 1,590,086 | | 120,773,492 |
Germany - 3.1% |
Bayer AG | 1,369,100 | | 182,696,164 |
Linde AG | 1,067,819 | | 185,234,334 |
TOTAL GERMANY | | 367,930,498 |
Hong Kong - 1.8% |
AIA Group Ltd. | 35,902,000 | | 210,505,319 |
India - 0.7% |
Housing Development Finance Corp. Ltd. | 4,640,219 | | 88,883,812 |
Common Stocks - continued |
| Shares | | Value |
Ireland - 2.7% |
CRH PLC sponsored ADR | 5,404,305 | | $ 147,861,785 |
James Hardie Industries PLC CDI | 13,334,050 | | 172,610,610 |
TOTAL IRELAND | | 320,472,395 |
Israel - 0.3% |
Azrieli Group | 1,019,186 | | 39,933,473 |
Italy - 0.7% |
Azimut Holding SpA | 1,613,606 | | 38,841,656 |
Interpump Group SpA | 3,440,349 | | 50,694,609 |
TOTAL ITALY | | 89,536,265 |
Japan - 14.5% |
Astellas Pharma, Inc. | 15,382,300 | | 223,266,082 |
Coca-Cola Central Japan Co. Ltd. | 2,797,500 | | 39,317,114 |
DENSO Corp. | 5,365,400 | | 250,149,366 |
East Japan Railway Co. | 1,028,100 | | 97,747,215 |
Fast Retailing Co. Ltd. | 262,800 | | 95,996,218 |
Hoya Corp. | 2,745,700 | | 113,306,190 |
Japan Tobacco, Inc. | 2,710,100 | | 93,801,409 |
Keyence Corp. | 281,700 | | 146,655,414 |
Mitsui Fudosan Co. Ltd. | 5,454,000 | | 148,423,264 |
Nintendo Co. Ltd. | 377,400 | | 60,333,660 |
OSG Corp. | 1,522,800 | | 28,644,132 |
Seven Bank Ltd. | 23,893,600 | | 108,872,518 |
Shinsei Bank Ltd. | 36,832,000 | | 77,228,353 |
SHO-BOND Holdings Co. Ltd. (e) | 1,557,600 | | 61,860,089 |
USS Co. Ltd. | 9,985,600 | | 176,284,630 |
Yamato Kogyo Co. Ltd. | 537,700 | | 14,322,784 |
TOTAL JAPAN | | 1,736,208,438 |
Kenya - 0.2% |
Safaricom Ltd. | 186,127,600 | | 26,172,769 |
Korea (South) - 0.8% |
BGFretail Co. Ltd. | 307,254 | | 45,747,550 |
NAVER Corp. | 106,161 | | 55,787,593 |
TOTAL KOREA (SOUTH) | | 101,535,143 |
Mexico - 0.5% |
Fomento Economico Mexicano S.A.B. de CV sponsored ADR | 647,412 | | 64,152,055 |
Netherlands - 1.0% |
ING Groep NV (Certificaten Van Aandelen) | 8,080,704 | | 117,605,497 |
Common Stocks - continued |
| Shares | | Value |
South Africa - 1.2% |
Clicks Group Ltd. | 6,902,484 | | $ 50,425,691 |
Naspers Ltd. Class N | 666,610 | | 97,638,447 |
TOTAL SOUTH AFRICA | | 148,064,138 |
Spain - 4.3% |
Amadeus IT Holding SA Class A | 2,739,400 | | 116,759,895 |
Hispania Activos Inmobiliarios SA (a) | 1,884,200 | | 28,385,859 |
Inditex SA (d) | 8,248,319 | | 309,341,352 |
Merlin Properties Socimi SA | 2,598,300 | | 33,315,192 |
Prosegur Compania de Seguridad SA (Reg.) | 6,229,789 | | 27,744,879 |
TOTAL SPAIN | | 515,547,177 |
Sweden - 5.5% |
ASSA ABLOY AB (B Shares) | 11,808,417 | | 234,905,798 |
Atlas Copco AB (A Shares) (d) | 3,866,732 | | 100,927,745 |
H&M Hennes & Mauritz AB (B Shares) | 3,287,901 | | 127,882,379 |
Intrum Justitia AB | 1,453,000 | | 52,211,434 |
Svenska Handelsbanken AB (A Shares) | 10,470,713 | | 142,207,781 |
TOTAL SWEDEN | | 658,135,137 |
Switzerland - 13.8% |
Credit Suisse Group AG (f)(g) | 1,666,763 | | 38,361,939 |
Nestle SA | 4,691,142 | | 358,281,263 |
Novartis AG | 5,010,410 | | 453,886,702 |
Roche Holding AG (participation certificate) | 1,601,612 | | 434,835,836 |
Schindler Holding AG: | | | |
(participation certificate) | 688,219 | | 111,819,486 |
(Reg.) | 154,309 | | 25,102,825 |
UBS Group AG | 11,434,413 | | 229,031,292 |
TOTAL SWITZERLAND | | 1,651,319,343 |
Taiwan - 0.8% |
Taiwan Semiconductor Manufacturing Co. Ltd. | 23,856,000 | | 100,516,644 |
Turkey - 0.2% |
Coca-Cola Icecek Sanayi A/S | 2,021,838 | | 25,624,928 |
United Kingdom - 14.7% |
Associated British Foods PLC | 2,563,800 | | 136,553,833 |
Babcock International Group PLC | 5,008,561 | | 74,432,345 |
BAE Systems PLC | 12,498,100 | | 84,543,311 |
Berendsen PLC | 4,218,000 | | 66,650,305 |
Informa PLC | 9,170,180 | | 80,296,737 |
Common Stocks - continued |
| Shares | | Value |
United Kingdom - continued |
InterContinental Hotel Group PLC ADR | 6,230,227 | | $ 248,461,453 |
Johnson Matthey PLC | 1,633,327 | | 65,088,669 |
Lloyds Banking Group PLC | 83,499,500 | | 94,772,953 |
Prudential PLC | 8,498,546 | | 198,496,251 |
Reckitt Benckiser Group PLC | 3,452,387 | | 336,920,236 |
Rightmove PLC | 100,000 | | 5,918,202 |
Rolls-Royce Group PLC | 4,234,411 | | 44,776,850 |
SABMiller PLC | 3,867,836 | | 238,208,106 |
Shaftesbury PLC | 3,385,400 | | 49,084,061 |
Unite Group PLC | 4,544,258 | | 46,586,097 |
TOTAL UNITED KINGDOM | | 1,770,789,409 |
United States of America - 15.2% |
Alphabet, Inc. Class A (a) | 216,094 | | 159,345,555 |
Autoliv, Inc. (d) | 1,294,227 | | 156,912,081 |
Berkshire Hathaway, Inc. Class B (a) | 789,350 | | 107,367,387 |
BorgWarner, Inc. | 1,640,214 | | 70,233,963 |
China Biologic Products, Inc. (a) | 505,000 | | 57,539,700 |
Domino's Pizza, Inc. | 281,940 | | 30,074,540 |
Martin Marietta Materials, Inc. | 419,600 | | 65,100,940 |
MasterCard, Inc. Class A | 2,333,510 | | 230,994,155 |
McGraw Hill Financial, Inc. | 726,271 | | 67,281,745 |
Mohawk Industries, Inc. (a) | 793,915 | | 155,210,383 |
Moody's Corp. | 507,700 | | 48,820,432 |
Philip Morris International, Inc. | 1,625,292 | | 143,675,813 |
PriceSmart, Inc. | 636,075 | | 54,689,729 |
ResMed, Inc. (d) | 1,009,400 | | 58,151,534 |
Sherwin-Williams Co. | 125,000 | | 33,353,750 |
SS&C Technologies Holdings, Inc. | 1,758,844 | | 130,418,283 |
Visa, Inc. Class A | 3,293,296 | | 255,493,904 |
TOTAL UNITED STATES OF AMERICA | | 1,824,663,894 |
TOTAL COMMON STOCKS (Cost $8,863,168,428) |
11,768,922,153
|
Nonconvertible Preferred Stocks - 0.0% |
| | | |
United Kingdom - 0.0% |
Rolls-Royce Group PLC
(Cost $604,241) | 392,529,899 | |
605,124
|
Money Market Funds - 8.6% |
| Shares | | Value |
Fidelity Cash Central Fund, 0.18% (b) | 463,650,878 | | $ 463,650,878 |
Fidelity Securities Lending Cash Central Fund, 0.19% (b)(c) | 563,794,313 | | 563,794,313 |
TOTAL MONEY MARKET FUNDS (Cost $1,027,445,191) |
1,027,445,191
|
TOTAL INVESTMENT PORTFOLIO - 106.6% (Cost $9,891,217,860) | | 12,796,972,468 |
NET OTHER ASSETS (LIABILITIES) - (6.6)% | | (788,985,522) |
NET ASSETS - 100% | $ 12,007,986,946 |
Legend |
(a) Non-income producing |
(b) Affiliated fund that is generally available only to investment companies and other accounts managed by Fidelity Investments. The rate quoted is the annualized seven-day yield of the fund at period end. A complete unaudited listing of the fund's holdings as of its most recent quarter end is available upon request. In addition, each Fidelity Central Fund's financial statements, which are not covered by the Fund's Report of Independent Registered Public Accounting Firm, are available on the SEC's website or upon request. |
(c) Investment made with cash collateral received from securities on loan. |
(d) Security or a portion of the security is on loan at period end. |
(e) Affiliated company |
(f) Security or a portion of the security purchased on a delayed delivery or when-issued basis. |
(g) Restricted securities - Investment in securities not registered under the Securities Act of 1933 (excluding 144A issues). At the end of the period, the value of restricted securities (excluding 144A issues) amounted to $38,361,939 or 0.3% of net assets. |
Additional information on each restricted holding is as follows: |
Security | Acquisition Date | Acquisition Cost |
Credit Suisse Group AG | 10/21/15 | $ 39,521,453 |
Affiliated Central Funds |
Information regarding fiscal year to date income earned by the Fund from investments in Fidelity Central Funds is as follows: |
Fund | Income earned |
Fidelity Cash Central Fund | $ 342,563 |
Fidelity Securities Lending Cash Central Fund | 2,654,510 |
Total | $ 2,997,073 |
Other Affiliated Issuers |
An affiliated company is a company in which the Fund has ownership of at least 5% of the voting securities. Fiscal year to date transactions with companies which are or were affiliates are as follows: |
Affiliate | Value, beginning of period | Purchases | Sales Proceeds | Dividend Income | Value,
end of
period |
SHO-BOND Holdings Co. Ltd. | $ 64,629,702 | $ - | $ 4,573,692 | $ 956,187 | $ 61,860,089 |
Other Information |
Categorizations in the Schedule of Investments are based on country or territory of incorporation. |
The following is a summary of the inputs used, as of October 31, 2015, involving the Fund's assets and liabilities carried at fair value. The inputs or methodology used for valuing securities may not be an indication of the risk associated with investing in those securities. For more information on valuation inputs, and their aggregation into the levels used in the tables below, please refer to the Investment Valuation section in the accompanying Notes to Financial Statements. |
Valuation Inputs at Reporting Date: |
Description | Total | Level 1 | Level 2 | Level 3 |
Investments in Securities: | | | | |
Equities: | | | | |
Consumer Discretionary | $ 1,804,399,751 | $ 1,281,969,537 | $ 522,430,214 | $ - |
Consumer Staples | 1,909,321,305 | 759,077,705 | 1,150,243,600 | - |
Energy | 44,429,481 | 44,429,481 | - | - |
Financials | 2,192,232,967 | 1,084,480,777 | 1,107,752,190 | - |
Health Care | 2,241,772,141 | 587,914,262 | 1,653,857,879 | - |
Industrials | 1,460,375,711 | 637,216,656 | 823,159,055 | - |
Information Technology | 1,376,679,809 | 1,069,174,091 | 307,505,718 | - |
Materials | 714,143,343 | 527,209,949 | 186,933,394 | - |
Telecommunication Services | 26,172,769 | 26,172,769 | - | - |
Money Market Funds | 1,027,445,191 | 1,027,445,191 | - | - |
Total Investments in Securities: | $ 12,796,972,468 | $ 7,045,090,418 | $ 5,751,882,050 | $ - |
The following is a summary of transfers between Level 1 and Level 2 for the period ended October 31, 2015. Transfers are assumed to have occurred at the beginning of the period, and are primarily attributable to the valuation techniques used for foreign equity securities, as discussed in the accompanying Notes to Financial Statements: |
Transfers | Total |
Level 1 to Level 2 | $ 952,102,988 |
Level 2 to Level 1 | $ 208,033,394 |
See accompanying notes which are an integral part of the financial statements.
Annual Report
Fidelity Series International Growth Fund
Statement of Assets and Liabilities
| | October 31, 2015 |
| | |
Assets | | |
Investment in securities, at value (including securities loaned of $543,197,939) - See accompanying schedule: Unaffiliated issuers (cost $8,816,728,233) | $ 11,707,667,188 | |
Fidelity Central Funds (cost $1,027,445,191) | 1,027,445,191 | |
Other affiliated issuers (cost $47,044,436) | 61,860,089 | |
Total Investments (cost $9,891,217,860) | | $ 12,796,972,468 |
Receivable for investments sold | | 1,616,314 |
Receivable for fund shares sold | | 1,083,734 |
Dividends receivable | | 33,700,563 |
Distributions receivable from Fidelity Central Funds | | 253,383 |
Prepaid expenses | | 33,641 |
Other receivables | | 90,155 |
Total assets | | 12,833,750,258 |
| | |
Liabilities | | |
Payable for investments purchased on a delayed delivery basis | $ 38,361,939 | |
Payable for fund shares redeemed | 215,342,563 | |
Accrued management fee | 7,118,052 | |
Other affiliated payables | 917,238 | |
Other payables and accrued expenses | 229,207 | |
Collateral on securities loaned, at value | 563,794,313 | |
Total liabilities | | 825,763,312 |
| | |
Net Assets | | $ 12,007,986,946 |
Net Assets consist of: | | |
Paid in capital | | $ 8,725,872,040 |
Undistributed net investment income | | 134,692,373 |
Accumulated undistributed net realized gain (loss) on investments and foreign currency transactions | | 241,492,350 |
Net unrealized appreciation (depreciation) on investments and assets and liabilities in foreign currencies | | 2,905,930,183 |
Net Assets | | $ 12,007,986,946 |
See accompanying notes which are an integral part of the financial statements.
Annual Report
Statement of Assets and Liabilities - continued
| | October 31, 2015 |
| | |
Series International Growth: | | |
Net Asset Value, offering price and redemption price per share ($5,563,673,805 ÷ 389,711,958 shares) | | $ 14.28 |
| | |
Class F: | | |
Net Asset Value, offering price and redemption price per share ($6,444,313,141 ÷ 449,944,973 shares) | | $ 14.32 |
See accompanying notes which are an integral part of the financial statements.
Annual Report
Fidelity Series International Growth Fund
Financial Statements - continued
Statement of Operations
| Year ended October 31, 2015 |
Investment Income | | |
Dividends (including $956,187 earned from other affiliated issuers) | | $ 268,540,623 |
Interest | | 597 |
Income from Fidelity Central Funds | | 2,997,073 |
Income before foreign taxes withheld | | 271,538,293 |
Less foreign taxes withheld | | (23,605,079) |
Total income | | 247,933,214 |
| | |
Expenses | | |
Management fee | | |
Basic fee | $ 87,929,252 | |
Performance adjustment | 3,106,938 | |
Transfer agent fees | 9,807,217 | |
Accounting and security lending fees | 1,925,059 | |
Custodian fees and expenses | 1,105,044 | |
Independent trustees' compensation | 53,566 | |
Audit | 81,771 | |
Legal | 32,444 | |
Miscellaneous | 104,687 | |
Total expenses before reductions | 104,145,978 | |
Expense reductions | (667,940) | 103,478,038 |
Net investment income (loss) | | 144,455,176 |
Realized and Unrealized Gain (Loss) | | |
Net realized gain (loss) on: | | |
Investment securities: | | |
Unaffiliated issuers | 263,160,757 | |
Other affiliated issuers | (779,880) | |
Foreign currency transactions | (2,378,403) | |
Total net realized gain (loss) | | 260,002,474 |
Change in net unrealized appreciation (depreciation) on: Investment securities | 70,871,978 | |
Assets and liabilities in foreign currencies | 1,185,816 | |
Total change in net unrealized appreciation (depreciation) | | 72,057,794 |
Net gain (loss) | | 332,060,268 |
Net increase (decrease) in net assets resulting from operations | | $ 476,515,444 |
See accompanying notes which are an integral part of the financial statements.
Annual Report
Statement of Changes in Net Assets
| Year ended
October 31,
2015 | Year ended
October 31,
2014 |
Increase (Decrease) in Net Assets | | |
Operations | | |
Net investment income (loss) | $ 144,455,176 | $ 172,847,839 |
Net realized gain (loss) | 260,002,474 | 188,600,604 |
Change in net unrealized appreciation (depreciation) | 72,057,794 | 11,265,981 |
Net increase (decrease) in net assets resulting from operations | 476,515,444 | 372,714,424 |
Distributions to shareholders from net investment income | (177,438,330) | (98,329,968) |
Distributions to shareholders from net realized gain | (186,668,096) | (45,984,907) |
Total distributions | (364,106,426) | (144,314,875) |
Share transactions - net increase (decrease) | (731,969,049) | 1,220,764,933 |
Total increase (decrease) in net assets | (619,560,031) | 1,449,164,482 |
| | |
Net Assets | | |
Beginning of period | 12,627,546,977 | 11,178,382,495 |
End of period (including undistributed net investment income of $134,692,373 and undistributed net investment income of $167,671,083, respectively) | $ 12,007,986,946 | $ 12,627,546,977 |
See accompanying notes which are an integral part of the financial statements.
Annual Report
Financial Highlights - Fidelity Series International Growth
Years ended October 31, | 2015 | 2014 | 2013 | 2012 | 2011 |
Selected Per-Share Data | | | | | |
Net asset value, beginning of period | $ 14.17 | $ 13.95 | $ 11.55 | $ 10.53 | $ 10.89 |
Income from Investment Operations | | | | | |
Net investment income (loss) B | .15 | .17 | .16 | .15 | .16 |
Net realized and unrealized gain (loss) | .36 | .20 | 2.43 | .99 | (.46) |
Total from investment operations | .51 | .37 | 2.59 | 1.14 | (.30) |
Distributions from net investment income | (.19) | (.10) | (.19) | (.12) | (.05) |
Distributions from net realized gain | (.21) | (.05) | - | (.01) | (.01) |
Total distributions | (.40) | (.15) | (.19) | (.12) F | (.06) |
Net asset value, end of period | $ 14.28 | $ 14.17 | $ 13.95 | $ 11.55 | $ 10.53 |
Total ReturnA | 3.65% | 2.66% | 22.72% | 11.00% | (2.77)% |
Ratios to Average Net AssetsC, E | | | | | |
Expenses before reductions | .92% | .97% | 1.04% | 1.05% | 1.00% |
Expenses net of fee waivers, if any | .91% | .97% | 1.04% | 1.05% | 1.00% |
Expenses net of all reductions | .91% | .97% | 1.02% | 1.04% | .98% |
Net investment income (loss) | 1.06% | 1.23% | 1.26% | 1.38% | 1.40% |
Supplemental Data | | | | | |
Net assets, end of period (000 omitted) | $ 5,563,674 | $ 6,049,347 | $ 5,642,298 | $ 5,045,151 | $ 4,996,927 |
Portfolio turnover rateD | 24% | 33% | 41% | 27% | 23% |
A Total returns would have been lower if certain expenses had not been reduced during the applicable periods shown.
B Calculated based on average shares outstanding during the period.
C Fees and expenses of any underlying Fidelity Central Funds are not included in the Fund's expense ratio. The Fund indirectly bears its proportionate share of the expenses of any underlying Fidelity Central Funds.
D Amount does not include the portfolio activity of any underlying Fidelity Central Funds.
E Expense ratios reflect operating expenses of the class. Expenses before reductions do not reflect amounts reimbursed by the investment adviser or reductions from brokerage service arrangements or reductions from other expense offset arrangements and do not represent the amount paid by the class during periods when reimbursements or reductions occur. Expense ratios before reductions for start-up periods may not be representative of longer-term operating periods. Expenses net of fee waivers reflect expenses after reimbursement by the investment adviser but prior to reductions from brokerage service arrangements or other expense offset arrangements. Expenses net of all reductions represent the net expenses paid by the class.
F Total distributions of $.12 per share is comprised of distributions from net investment income of $.115 and distributions from net realized gain of $.007 per share.
See accompanying notes which are an integral part of the financial statements.
Annual Report
Financial Highlights - Fidelity Series International Growth Fund Class F
Years ended October 31, | 2015 | 2014 | 2013 | 2012 | 2011 |
Selected Per-Share Data | | | | | |
Net asset value, beginning of period | $ 14.21 | $ 13.99 | $ 11.59 | $ 10.57 | $ 10.91 |
Income from Investment Operations | | | | | |
Net investment income (loss) B | .18 | .20 | .18 | .17 | .18 |
Net realized and unrealized gain (loss) | .35 | .19 | 2.43 | 1.00 | (.45) |
Total from investment operations | .53 | .39 | 2.61 | 1.17 | (.27) |
Distributions from net investment income | (.21) | (.12) | (.21) | (.14) | (.06) |
Distributions from net realized gain | (.21) | (.05) | - | (.01) | (.01) |
Total distributions | (.42) | (.17) | (.21) | (.15) | (.07) |
Net asset value, end of period | $ 14.32 | $ 14.21 | $ 13.99 | $ 11.59 | $ 10.57 |
Total ReturnA | 3.83% | 2.80% | 22.88% | 11.23% | (2.50)% |
Ratios to Average Net AssetsC, E | | | | | |
Expenses before reductions | .75% | .80% | .85% | .85% | .79% |
Expenses net of fee waivers, if any | .75% | .80% | .85% | .85% | .79% |
Expenses net of all reductions | .75% | .80% | .84% | .84% | .77% |
Net investment income (loss) | 1.23% | 1.40% | 1.44% | 1.58% | 1.62% |
Supplemental Data | | | | | |
Net assets, end of period (000 omitted) | $ 6,444,313 | $ 6,578,200 | $ 5,536,085 | $ 4,064,357 | $ 2,165,942 |
Portfolio turnover rateD | 24% | 33% | 41% | 27% | 23% |
A Total returns would have been lower if certain expenses had not been reduced during the applicable periods shown.
B Calculated based on average shares outstanding during the period.
C Fees and expenses of any underlying Fidelity Central Funds are not included in the Fund's expense ratio. The Fund indirectly bears its proportionate share of the expenses of any underlying Fidelity Central Funds.
D Amount does not include the portfolio activity of any underlying Fidelity Central Funds.
E Expense ratios reflect operating expenses of the class. Expenses before reductions do not reflect amounts reimbursed by the investment adviser or reductions from brokerage service arrangements or reductions from other expense offset arrangements and do not represent the amount paid by the class during periods when reimbursements or reductions occur. Expense ratios before reductions for start-up periods may not be representative of longer-term operating periods. Expenses net of fee waivers reflect expenses after reimbursement by the investment adviser but prior to reductions from brokerage service arrangements or other expense offset arrangements. Expenses net of all reductions represent the net expenses paid by the class.
See accompanying notes which are an integral part of the financial statements.
Annual Report
Fidelity Series International Small Cap Fund
Average annual total return reflects the change in the value of an investment, assuming reinvestment of the class' distributions from dividend income and capital gains (the profits earned upon the sale of securities that have grown in value, if any) and assuming a constant rate of performance each year. The $10,000 table and the fund's returns do not reflect the deduction of taxes that a shareholder would pay on fund distributions or the redemption of fund shares. During periods of reimbursement by Fidelity, a fund's total return will be greater than it would be had the reimbursement not occurred. How a fund did yesterday is no guarantee of how it will do tomorrow.
Average Annual Total Returns
Periods ended October 31, 2015 | Past 1
year | Past 5
years | Life of
fund A |
Fidelity Series International Small Cap Fund | 8.36% | 9.21% | 10.15% |
Class F | 8.49% | 9.40% | 10.36% |
A From December 3, 2009.
$10,000 Over Life of Fund
Let's say hypothetically that $10,000 was invested in Fidelity Series International Small Cap Fund, a class of the fund, on December 3, 2009, when the fund started. The chart shows how the value of your investment would have changed, and also shows how the MSCI EAFE Small Cap Index performed over the same period.
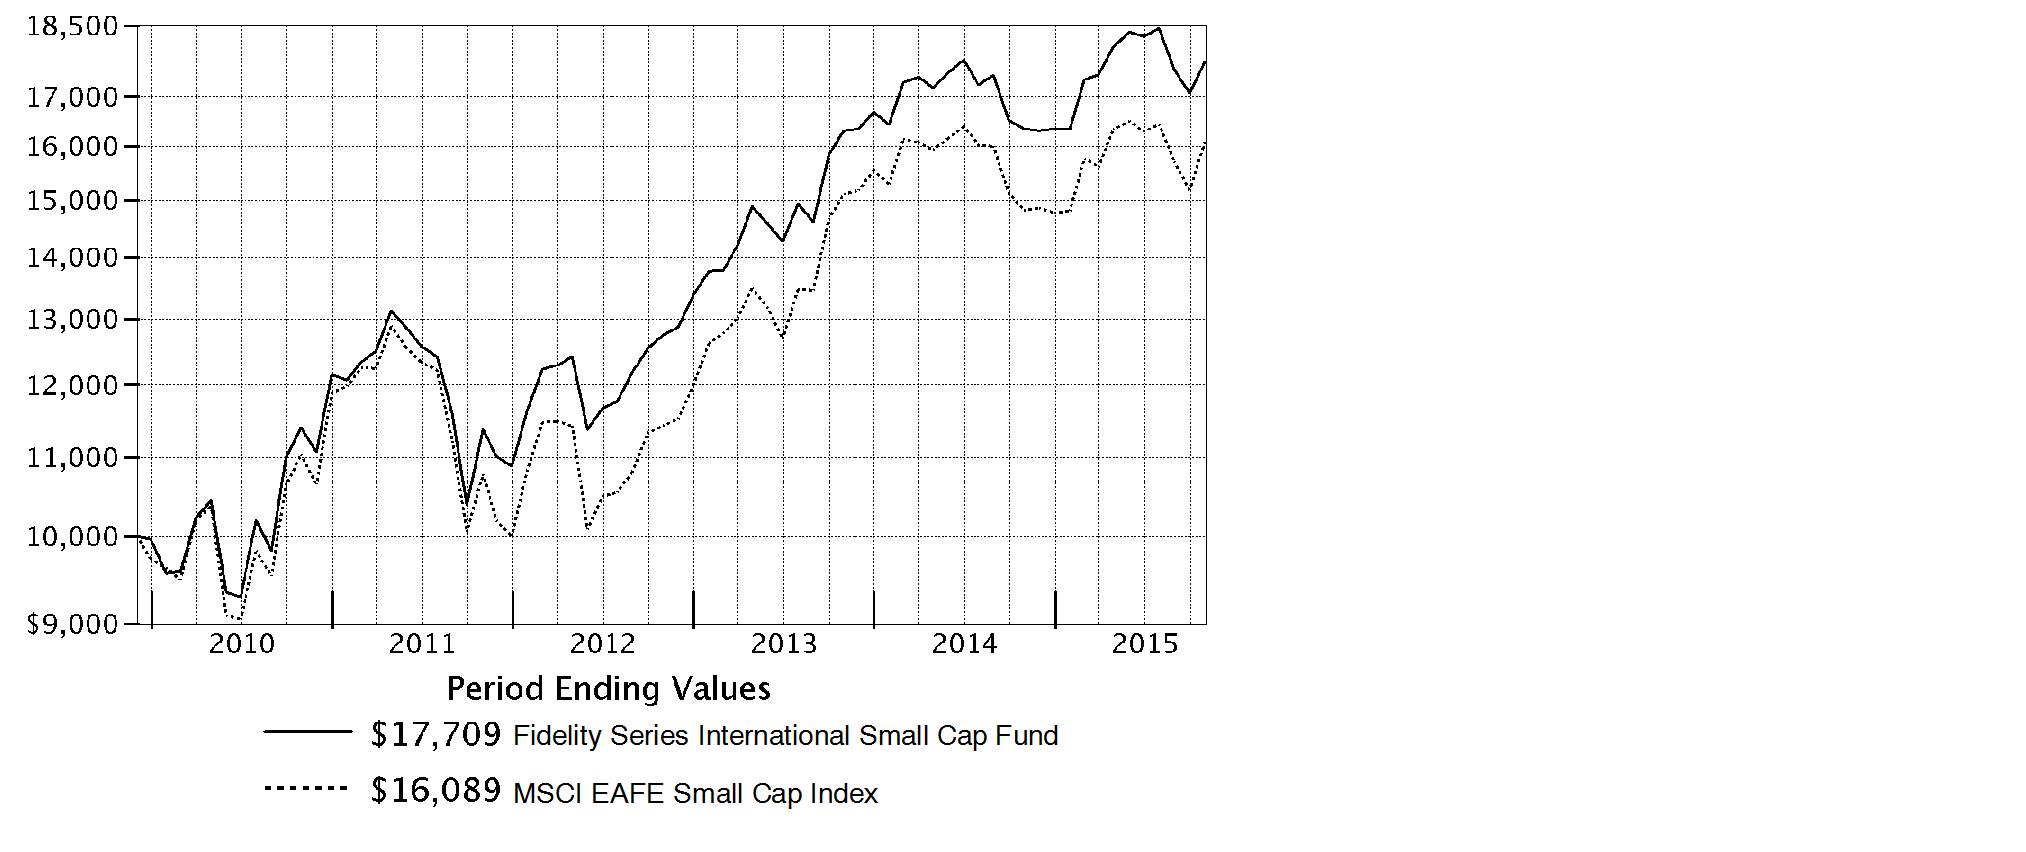
Annual Report
Fidelity Series International Small Cap Fund
Market Recap: International equities suffered a moderate setback for the 12 months ending October 31, 2015, held back by a collapse in commodities prices that hurt resources-related sectors and geographies. The MSCI ACWI (All Country World Index) ex USA Index returned -4.55% for the period, affected also by concerns about global economic growth. Commodity producers remained under pressure for much of the past year, largely related to economic deceleration in China (-1%), the world's second-largest economy and a leading consumer of raw materials. This effect was exacerbated by U.S. dollar strength relative to global currencies, which weighed on commodities priced in dollars and acutely impacted equity returns within regions most exposed to resources prices. The emerging-markets group, for example, returned about -15% this period. Canada, a significant energy producer, returned roughly -17%. Net energyconsumer Japan (+9%) was the best-performing region by far. Only about a quarter of the nearly 50 index countries managed a gain this period: Ireland (+19%) - the EU's fastest-growing economy - and Israel (+17%) proved top performers; Greece (-56%) and Brazil (-46%), among the worst. As for sectors, energy (-25%) and materials (-16%) declined sharply, whereas the two consumer sectors each gained about 6%.
Comments from Portfolio Manager Jed Weiss: For the year, the fund's share classes produced solid gains that were roughly in line with the 8.55% return of the benchmark MSCI EAFE Small Cap Index. Relative to the index, stock picking in the consumer discretionary and information technology sectors was strong, while security selection in materials hurt. In country terms, the fund's positioning in Australia was helpful, as were relative underweightings in Hong Kong and Singapore. Conversely, positioning in Canada detracted, along with security selection in Japan and several European markets. The fund also was affected by a downward fair-value pricing adjustment. In individual terms, the fund was hurt by non-index positions in energy companies Pason Systems and Shawcor, which struggled along with energy prices. Another negative was Turkey-based Coca-Cola Icecek Sanayi. I significantly reduced the fund's out-of-benchmark stake in this owner of the Coca-Cola bottling franchise in various emerging markets and reinvested the proceeds in other stocks I thought offered a better risk/reward balance. On the positive side, the fund's leading contributor was BGF Retail, a South Korean convenience-store retailer that wasn't part of our benchmark. Also adding value was SS&C Technologies Holdings, a provider of backoffice software for asset managers.
The views expressed above reflect those of the portfolio manager(s) only through the end of the period as stated on the cover of this report and do not necessarily represent the views of Fidelity or any other person in the Fidelity organization. Any such views are subject to change at any time based upon market or other conditions and Fidelity disclaims any responsibility to update such views. These views may not be relied on as investment advice and, because investment decisions for a Fidelity fund are based on numerous factors, may not be relied on as an indication of trading intent on behalf of any Fidelity fund.
Annual Report
Fidelity Series International Small Cap Fund
Investment Changes (Unaudited)
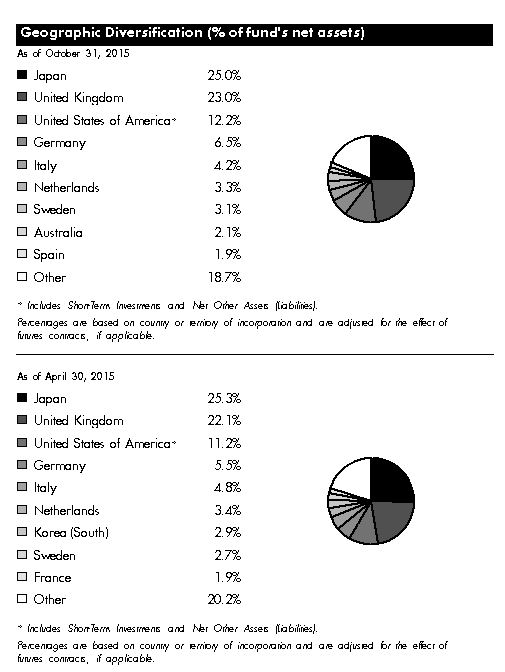
Asset Allocation as of October 31, 2015 |
| % of fund's
net assets | % of fund's net assets
6 months ago |
Stocks | 95.5 | 97.5 |
Short-Term Investments and Net Other Assets (Liabilities) | 4.5 | 2.5 |
Top Ten Stocks as of October 31, 2015 |
| % of fund's
net assets | % of fund's net assets
6 months ago |
USS Co. Ltd. (Japan, Specialty Retail) | 2.2 | 2.3 |
CTS Eventim AG (Germany, Media) | 2.1 | 1.8 |
Unite Group PLC (United Kingdom, Real Estate Management & Development) | 2.1 | 1.9 |
OBIC Co. Ltd. (Japan, IT Services) | 1.8 | 1.3 |
Berendsen PLC (United Kingdom, Commercial Services & Supplies) | 1.7 | 1.4 |
Spirax-Sarco Engineering PLC (United Kingdom, Machinery) | 1.7 | 1.7 |
Intrum Justitia AB (Sweden, Commercial Services & Supplies) | 1.7 | 1.3 |
Sartorius AG (non-vtg.) (Germany, Health Care Equipment & Supplies) | 1.7 | 1.2 |
Aalberts Industries NV (Netherlands, Machinery) | 1.6 | 1.4 |
SS&C Technologies Holdings, Inc. (United States of America, Software) | 1.6 | 1.6 |
| 18.2 | |
Market Sectors as of October 31, 2015 |
| % of fund's
net assets | % of fund's net assets
6 months ago |
Consumer Discretionary | 20.8 | 18.7 |
Financials | 19.9 | 20.8 |
Industrials | 18.8 | 20.4 |
Information Technology | 9.9 | 10.2 |
Health Care | 9.2 | 7.1 |
Consumer Staples | 8.3 | 9.1 |
Materials | 7.3 | 8.8 |
Energy | 1.3 | 2.4 |
Annual Report
Fidelity Series International Small Cap Fund
Investments October 31, 2015
Showing Percentage of Net Assets
Common Stocks - 93.8% |
| Shares | | Value |
Australia - 2.1% |
DuluxGroup Ltd. | 3,519,963 | | $ 14,716,382 |
Imdex Ltd. (a) | 8,252,948 | | 1,316,220 |
RCG Corp. Ltd. | 16,053,658 | | 16,364,559 |
Sydney Airport unit | 2,789,707 | | 12,749,262 |
TFS Corp. Ltd. (d) | 9,181,386 | | 11,460,970 |
TOTAL AUSTRALIA | | 56,607,393 |
Austria - 1.2% |
Andritz AG | 411,024 | | 20,700,800 |
Zumtobel AG | 488,819 | | 11,126,867 |
TOTAL AUSTRIA | | 31,827,667 |
Bailiwick of Jersey - 0.4% |
Integrated Diagnostics Holdings PLC (a) | 2,149,365 | | 11,843,001 |
Belgium - 1.5% |
Gimv NV | 190,309 | | 8,942,248 |
KBC Ancora | 779,573 | | 30,964,139 |
TOTAL BELGIUM | | 39,906,387 |
Bermuda - 0.5% |
Petra Diamonds Ltd. (d) | 4,654,491 | | 5,356,409 |
Vostok New Ventures Ltd. SDR (a) | 1,381,642 | | 8,813,607 |
TOTAL BERMUDA | | 14,170,016 |
British Virgin Islands - 0.1% |
Gem Diamonds Ltd. | 2,460,051 | | 3,754,490 |
Canada - 1.6% |
Cara Operations Ltd. | 581,000 | | 15,755,782 |
McCoy Global, Inc. | 1,108,950 | | 2,510,318 |
New Look Vision Group, Inc. | 315,800 | | 7,245,335 |
Pason Systems, Inc. | 842,200 | | 12,392,114 |
ShawCor Ltd. Class A | 346,200 | | 7,347,086 |
TOTAL CANADA | | 45,250,635 |
Cayman Islands - 0.6% |
58.com, Inc. ADR (a) | 158,600 | | 8,324,914 |
Value Partners Group Ltd. | 7,116,000 | | 7,535,254 |
TOTAL CAYMAN ISLANDS | | 15,860,168 |
Common Stocks - continued |
| Shares | | Value |
Denmark - 1.8% |
Jyske Bank A/S (Reg.) (a) | 571,719 | | $ 27,910,114 |
Spar Nord Bank A/S | 2,292,747 | | 21,972,997 |
TOTAL DENMARK | | 49,883,111 |
Finland - 0.5% |
Tikkurila Oyj | 724,530 | | 13,297,414 |
France - 1.7% |
Coface SA | 331,300 | | 2,682,444 |
Laurent-Perrier Group SA | 130,224 | | 11,282,793 |
Vetoquinol SA | 208,127 | | 8,731,271 |
Virbac SA (d) | 120,100 | | 23,950,525 |
TOTAL FRANCE | | 46,647,033 |
Germany - 4.8% |
alstria office REIT-AG (d) | 659,329 | | 9,204,270 |
CompuGroup Medical AG | 1,273,715 | | 37,537,171 |
CTS Eventim AG | 1,480,124 | | 57,951,351 |
Fielmann AG (d) | 383,190 | | 26,862,649 |
TOTAL GERMANY | | 131,555,441 |
Greece - 0.4% |
Titan Cement Co. SA (Reg.) | 534,299 | | 11,721,461 |
India - 0.6% |
Jyothy Laboratories Ltd. | 3,766,337 | | 17,665,943 |
Ireland - 1.7% |
Dalata Hotel Group PLC (a) | 99,000 | | 492,071 |
FBD Holdings PLC | 1,298,400 | | 9,923,110 |
James Hardie Industries PLC CDI | 2,776,486 | | 35,941,889 |
TOTAL IRELAND | | 46,357,070 |
Isle of Man - 0.2% |
Playtech Ltd. | 386,019 | | 5,093,944 |
Israel - 1.7% |
Azrieli Group | 399,179 | | 15,640,525 |
Ituran Location & Control Ltd. | 461,231 | | 9,409,112 |
Sarine Technologies Ltd. | 5,308,800 | | 5,900,856 |
Strauss Group Ltd. (a) | 1,072,955 | | 15,371,308 |
TOTAL ISRAEL | | 46,321,801 |
Italy - 4.2% |
Azimut Holding SpA | 1,508,364 | | 36,308,340 |
Common Stocks - continued |
| Shares | | Value |
Italy - continued |
Beni Stabili SpA SIIQ (d) | 43,666,820 | | $ 35,965,646 |
Interpump Group SpA | 2,933,666 | | 43,228,478 |
TOTAL ITALY | | 115,502,464 |
Japan - 25.0% |
Artnature, Inc. (e) | 1,804,500 | | 17,350,955 |
Asahi Co. Ltd. | 1,235,100 | | 12,131,394 |
Autobacs Seven Co. Ltd. | 811,000 | | 14,221,350 |
Azbil Corp. | 1,207,100 | | 30,454,161 |
Broadleaf Co. Ltd. | 270,400 | | 3,097,321 |
Coca-Cola Central Japan Co. Ltd. | 1,162,800 | | 16,342,427 |
Daiichikosho Co. Ltd. | 498,600 | | 16,629,329 |
Daikokutenbussan Co. Ltd. | 567,600 | | 19,498,269 |
GCA Savvian Group Corp. | 1,031,200 | | 12,107,688 |
Glory Ltd. | 802,600 | | 20,305,238 |
Goldcrest Co. Ltd. | 1,371,210 | | 25,656,005 |
Iwatsuka Confectionary Co. Ltd. (d) | 164,700 | | 8,513,197 |
Japan Digital Laboratory Co. | 931,900 | | 11,915,944 |
Kobayashi Pharmaceutical Co. Ltd. | 323,800 | | 25,103,657 |
Koshidaka Holdings Co. Ltd. (d) | 384,200 | | 6,955,142 |
Lasertec Corp. (d) | 903,200 | | 9,856,692 |
Medikit Co. Ltd. | 269,500 | | 8,035,913 |
Meiko Network Japan Co. Ltd. | 514,400 | | 6,107,080 |
Miraial Co. Ltd. (d) | 301,300 | | 2,922,802 |
Nagaileben Co. Ltd. | 1,329,300 | | 22,657,734 |
ND Software Co. Ltd. | 222,536 | | 2,568,754 |
Nihon Parkerizing Co. Ltd. | 3,101,000 | | 27,584,221 |
Nippon Seiki Co. Ltd. | 489,000 | | 10,247,467 |
NS Tool Co. Ltd. | 2,000 | | 34,725 |
OBIC Co. Ltd. | 923,400 | | 48,734,274 |
OSG Corp. | 1,928,300 | | 36,271,657 |
Paramount Bed Holdings Co. Ltd. | 538,100 | | 17,259,642 |
Pronexus Inc. | 497,500 | | 3,666,815 |
San-Ai Oil Co. Ltd. | 1,783,000 | | 13,618,693 |
Seven Bank Ltd. | 8,406,500 | | 38,304,685 |
SHO-BOND Holdings Co. Ltd. | 778,800 | | 30,930,045 |
Shoei Co. Ltd. (d)(e) | 697,000 | | 12,037,779 |
SK Kaken Co. Ltd. | 119,000 | | 11,590,011 |
Software Service, Inc. | 175,900 | | 6,630,187 |
Techno Medica Co. Ltd. | 283,000 | | 6,461,755 |
The Nippon Synthetic Chemical Industry Co. Ltd. | 1,670,000 | | 12,369,245 |
TKC Corp. | 684,400 | | 16,132,343 |
Common Stocks - continued |
| Shares | | Value |
Japan - continued |
Tocalo Co. Ltd. | 458,400 | | $ 9,201,609 |
Tsutsumi Jewelry Co. Ltd. | 299,800 | | 5,958,610 |
USS Co. Ltd. | 3,418,000 | | 60,340,975 |
Workman Co. Ltd. | 234,000 | | 14,420,784 |
Yamato Kogyo Co. Ltd. | 546,400 | | 14,554,527 |
TOTAL JAPAN | | 688,781,101 |
Korea (South) - 1.6% |
BGFretail Co. Ltd. | 182,008 | | 27,099,468 |
Coway Co. Ltd. | 130,384 | | 9,729,382 |
Leeno Industrial, Inc. | 149,988 | | 5,747,195 |
TOTAL KOREA (SOUTH) | | 42,576,045 |
Mexico - 0.6% |
Consorcio ARA S.A.B. de CV (a) | 42,160,327 | | 15,799,466 |
Netherlands - 3.3% |
Aalberts Industries NV | 1,369,900 | | 44,537,027 |
Heijmans NV (Certificaten Van Aandelen) (a)(d) | 1,131,571 | | 9,519,140 |
VastNed Retail NV (d) | 761,955 | | 37,076,359 |
TOTAL NETHERLANDS | | 91,132,526 |
Norway - 0.3% |
Kongsberg Gruppen ASA | 595,848 | | 9,326,835 |
Philippines - 0.4% |
Jollibee Food Corp. | 2,720,820 | | 11,958,290 |
South Africa - 0.9% |
Alexander Forbes Group Holding | 11,130,704 | | 7,013,494 |
Clicks Group Ltd. | 2,067,421 | | 15,103,422 |
Nampak Ltd. | 2,135,270 | | 3,460,807 |
TOTAL SOUTH AFRICA | | 25,577,723 |
Spain - 1.9% |
Hispania Activos Inmobiliarios SA (a) | 821,600 | | 12,377,572 |
Merlin Properties Socimi SA | 1,487,900 | | 19,077,733 |
Prosegur Compania de Seguridad SA (Reg.) | 4,722,986 | | 21,034,208 |
TOTAL SPAIN | | 52,489,513 |
Sweden - 3.1% |
Fagerhult AB (e) | 2,218,495 | | 37,911,673 |
Intrum Justitia AB | 1,296,003 | | 46,569,976 |
TOTAL SWEDEN | | 84,481,649 |
Common Stocks - continued |
| Shares | | Value |
Taiwan - 0.4% |
Addcn Technology Co. Ltd. | 1,141,400 | | $ 11,092,306 |
Turkey - 0.0% |
Coca-Cola Icecek Sanayi A/S | 65,701 | | 832,699 |
United Kingdom - 23.0% |
AA PLC | 3,316,661 | | 14,157,799 |
Babcock International Group PLC | 811,700 | | 12,062,693 |
Bellway PLC | 1,084,900 | | 43,417,629 |
Berendsen PLC | 3,002,709 | | 47,447,006 |
Britvic PLC | 2,218,612 | | 23,907,284 |
Dechra Pharmaceuticals PLC | 1,595,563 | | 23,846,985 |
Derwent London PLC | 267,190 | | 15,981,724 |
Elementis PLC | 6,639,782 | | 24,013,393 |
Great Portland Estates PLC | 2,334,200 | | 32,007,792 |
H&T Group PLC | 1,288,592 | | 3,893,527 |
Hilton Food Group PLC | 906,338 | | 6,497,030 |
Howden Joinery Group PLC | 3,646,400 | | 26,060,302 |
Informa PLC | 4,000,785 | | 35,032,026 |
InterContinental Hotel Group PLC ADR | 524,546 | | 20,918,894 |
ITE Group PLC | 4,806,372 | | 10,391,828 |
JUST EAT Ltd. (a) | 2,283,725 | | 14,997,715 |
Meggitt PLC | 2,003,845 | | 10,923,155 |
Rightmove PLC | 405,700 | | 24,010,147 |
Shaftesbury PLC | 2,510,255 | | 36,395,555 |
Spectris PLC | 1,143,816 | | 29,394,323 |
Spirax-Sarco Engineering PLC | 1,006,228 | | 47,172,025 |
Taylor Wimpey PLC | 5,080,800 | | 15,508,471 |
Ted Baker PLC | 559,367 | | 26,102,431 |
Topps Tiles PLC | 3,425,300 | | 7,683,044 |
Ultra Electronics Holdings PLC | 959,010 | | 24,881,637 |
Unite Group PLC | 5,534,163 | | 56,734,247 |
TOTAL UNITED KINGDOM | | 633,438,662 |
United States of America - 7.7% |
ANSYS, Inc. (a) | 81,715 | | 7,788,257 |
Autoliv, Inc. | 151,500 | | 18,367,860 |
Broadridge Financial Solutions, Inc. | 236,895 | | 14,114,204 |
China Biologic Products, Inc. (a) | 218,808 | | 24,930,984 |
Kennedy-Wilson Holdings, Inc. | 1,225,688 | | 30,053,870 |
Martin Marietta Materials, Inc. | 69,080 | | 10,717,762 |
Mohawk Industries, Inc. (a) | 111,362 | | 21,771,271 |
PriceSmart, Inc. (d) | 338,561 | | 29,109,475 |
Common Stocks - continued |
| Shares | | Value |
United States of America - continued |
ResMed, Inc. | 214,700 | | $ 12,368,867 |
SS&C Technologies Holdings, Inc. | 589,688 | | 43,725,365 |
TOTAL UNITED STATES OF AMERICA | | 212,947,915 |
TOTAL COMMON STOCKS (Cost $1,949,348,452) |
2,583,700,169
|
Nonconvertible Preferred Stocks - 1.7% |
| | | |
Germany - 1.7% |
Sartorius AG (non-vtg.)
(Cost $22,934,818) | 204,293 | |
46,233,134
|
Money Market Funds - 4.0% |
| | | |
Fidelity Cash Central Fund, 0.18% (b) | 84,646,444 | | 84,646,444 |
Fidelity Securities Lending Cash Central Fund, 0.19% (b)(c) | 24,091,257 | | 24,091,257 |
TOTAL MONEY MARKET FUNDS (Cost $108,737,701) |
108,737,701
|
TOTAL INVESTMENT PORTFOLIO - 99.5% (Cost $2,081,020,971) | | 2,738,671,004 |
NET OTHER ASSETS (LIABILITIES) - 0.5% | | 14,484,462 |
NET ASSETS - 100% | $ 2,753,155,466 |
Legend |
(a) Non-income producing |
(b) Affiliated fund that is generally available only to investment companies and other accounts managed by Fidelity Investments. The rate quoted is the annualized seven-day yield of the fund at period end. A complete unaudited listing of the fund's holdings as of its most recent quarter end is available upon request. In addition, each Fidelity Central Fund's financial statements, which are not covered by the Fund's Report of Independent Registered Public Accounting Firm, are available on the SEC's website or upon request. |
(c) Investment made with cash collateral received from securities on loan. |
(d) Security or a portion of the security is on loan at period end. |
(e) Affiliated company |
Affiliated Central Funds |
Information regarding fiscal year to date income earned by the Fund from investments in Fidelity Central Funds is as follows: |
Fund | Income earned |
Fidelity Cash Central Fund | $ 99,119 |
Fidelity Securities Lending Cash Central Fund | 518,082 |
Total | $ 617,201 |
Other Affiliated Issuers |
An affiliated company is a company in which the Fund has ownership of at least 5% of the voting securities. Fiscal year to date transactions with companies which are or were affiliates are as follows: |
Affiliate | Value,
beginning of
period | Purchases | Sales
Proceeds | Dividend
Income | Value,
end of
period |
Artnature, Inc. | $ 16,652,883 | $ 5,255,089 | $ - | $ 344,387 | $ 17,350,955 |
Fagerhult AB | 44,153,831 | 161,326 | 3,278,435 | 702,878 | 37,911,673 |
RCG Corp. Ltd. | 8,273,270 | 418,606 | - | 519,722 | - |
Shoei Co. Ltd. | 8,406,703 | 2,495,293 | - | 343,145 | 12,037,779 |
Total | $ 77,486,687 | $ 8,330,314 | $ 3,278,435 | $ 1,910,132 | $ 67,300,407 |
Other Information |
Categorizations in the Schedule of Investments are based on country or territory of incorporation. |
The following is a summary of the inputs used, as of October 31, 2015, involving the Fund's assets and liabilities carried at fair value. The inputs or methodology used for valuing securities may not be an indication of the risk associated with investing in those securities. For more information on valuation inputs, and their aggregation into the levels used in the table below, please refer to the Investment Valuation section in the accompanying Notes to Financial Statements. |
Valuation Inputs at Reporting Date: |
Description | Total | Level 1 | Level 2 | Level 3 |
Investments in Securities: | | | | |
Equities: | | | | |
Consumer Discretionary | $ 570,472,698 | $ 383,099,939 | $ 187,372,759 | $ - |
Consumer Staples | 233,677,927 | 129,203,479 | 104,474,448 | - |
Energy | 35,868,211 | 22,249,518 | 13,618,693 | - |
Financials | 542,542,945 | 458,939,313 | 83,603,632 | - |
Health Care | 253,055,923 | 189,441,938 | 63,613,985 | - |
Industrials | 519,659,526 | 400,599,319 | 119,060,207 | - |
Information Technology | 272,800,872 | 149,687,335 | 123,113,537 | - |
Materials | 201,855,201 | 72,321,736 | 129,533,465 | - |
Money Market Funds | 108,737,701 | 108,737,701 | - | - |
Total Investments in Securities: | $ 2,738,671,004 | $ 1,914,280,278 | $ 824,390,726 | $ - |
See accompanying notes which are an integral part of the financial statements.
Annual Report
Fidelity Series International Small Cap Fund
Statement of Assets and Liabilities
| | October 31, 2015 |
| | |
Assets | | |
Investment in securities, at value (including securities loaned of $22,673,544) - See accompanying schedule: Unaffiliated issuers (cost $1,924,261,042) | $ 2,562,632,896 | |
Fidelity Central Funds (cost $108,737,701) | 108,737,701 | |
Other affiliated issuers (cost $48,022,228) | 67,300,407 | |
Total Investments (cost $2,081,020,971) | | $ 2,738,671,004 |
Receivable for investments sold | | 1,915,525 |
Receivable for fund shares sold | | 36,443,959 |
Dividends receivable | | 8,320,105 |
Distributions receivable from Fidelity Central Funds | | 34,821 |
Prepaid expenses | | 7,711 |
Other receivables | | 5,871 |
Total assets | | 2,785,398,996 |
| | |
Liabilities | | |
Payable for investments purchased | $ 5,296,611 | |
Payable for fund shares redeemed | 652,648 | |
Accrued management fee | 1,832,129 | |
Other affiliated payables | 273,334 | |
Other payables and accrued expenses | 97,551 | |
Collateral on securities loaned, at value | 24,091,257 | |
Total liabilities | | 32,243,530 |
| | |
Net Assets | | $ 2,753,155,466 |
Net Assets consist of: | | |
Paid in capital | | $ 1,938,080,471 |
Undistributed net investment income | | 26,891,199 |
Accumulated undistributed net realized gain (loss) on investments and foreign currency transactions | | 130,573,320 |
Net unrealized appreciation (depreciation) on investments and assets and liabilities in foreign currencies | | 657,610,476 |
Net Assets | | $ 2,753,155,466 |
See accompanying notes which are an integral part of the financial statements.
Annual Report
Fidelity Series International Small Cap Fund
Financial Statements - continued
Statement of Assets and Liabilities - continued
| | October 31, 2015 |
| | |
Series International Small Cap:
Net Asset Value, offering price and redemption price per share ($1,276,569,830 ÷ 79,246,928 shares) | | $ 16.11 |
| | |
Class F:
Net Asset Value, offering price and redemption price per share ($1,476,585,636 ÷ 91,395,519 shares) | | $ 16.16 |
See accompanying notes which are an integral part of the financial statements.
Annual Report
Statement of Operations
| Year ended October 31, 2015 |
| | |
Investment Income | | |
Dividends (including $1,910,132 earned from other affiliated issuers) | | $ 61,134,850 |
Interest | | 144 |
Income from Fidelity Central Funds | | 617,201 |
Income before foreign taxes withheld | | 61,752,195 |
Less foreign taxes withheld | | (4,996,818) |
Total income | | 56,755,377 |
| | |
Expenses | | |
Management fee | | |
Basic fee | $ 24,231,139 | |
Performance adjustment | 777,463 | |
Transfer agent fees | 2,230,479 | |
Accounting and security lending fees | 1,246,968 | |
Custodian fees and expenses | 330,808 | |
Independent trustees' compensation | 12,156 | |
Audit | 66,962 | |
Legal | 7,275 | |
Interest | 760 | |
Miscellaneous | 24,244 | |
Total expenses before reductions | 28,928,254 | |
Expense reductions | (120,269) | 28,807,985 |
Net investment income (loss) | | 27,947,392 |
Realized and Unrealized Gain (Loss) | | |
Net realized gain (loss) on: | | |
Investment securities: | | |
Unaffiliated issuers | 146,892,952 | |
Other affiliated issuers | 990,847 | |
Foreign currency transactions | (579,993) | |
Total net realized gain (loss) | | 147,303,806 |
Change in net unrealized appreciation (depreciation) on: Investment securities (net of decrease in deferred foreign taxes of $57,160) | 59,514,144 | |
Assets and liabilities in foreign currencies | 153,069 | |
Total change in net unrealized appreciation (depreciation) | | 59,667,213 |
Net gain (loss) | | 206,971,019 |
Net increase (decrease) in net assets resulting from operations | | $ 234,918,411 |
See accompanying notes which are an integral part of the financial statements.
Annual Report
Fidelity Series International Small Cap Fund
Financial Statements - continued
Statement of Changes in Net Assets
| Year ended
October 31,
2015 | Year ended
October 31,
2014 |
Increase (Decrease) in Net Assets | | |
Operations | | |
Net investment income (loss) | $ 27,947,392 | $ 27,564,526 |
Net realized gain (loss) | 147,303,806 | 36,236,413 |
Change in net unrealized appreciation (depreciation) | 59,667,213 | (48,773,803) |
Net increase (decrease) in net assets resulting from operations | 234,918,411 | 15,027,136 |
Distributions to shareholders from net investment income | (28,569,877) | (22,654,352) |
Distributions to shareholders from net realized gain | (36,994,296) | (73,752,533) |
Total distributions | (65,564,173) | (96,406,885) |
Share transactions - net increase (decrease) | (195,735,081) | 555,726,987 |
Total increase (decrease) in net assets | (26,380,843) | 474,347,238 |
| | |
Net Assets | | |
Beginning of period | 2,779,536,309 | 2,305,189,071 |
End of period (including undistributed net investment income of $26,891,199 and undistributed net investment income of $27,520,165, respectively) | $ 2,753,155,466 | $ 2,779,536,309 |
See accompanying notes which are an integral part of the financial statements.
Annual Report
Financial Highlights - Series International Small Cap
Years ended October 31, | 2015 | 2014 | 2013 | 2012 | 2011 |
Selected Per-Share Data | | | | | |
Net asset value, beginning of period | $ 15.21 | $ 15.75 | $ 12.44 | $ 11.22 | $ 11.40 |
Income from Investment Operations | | | | | |
Net investment income (loss)B | .14 | .14 | .15 | .15 | .17E |
Net realized and unrealized gain (loss) | 1.10 | (.11) | 3.29 | 1.19 | (.19) |
Total from investment operations | 1.24 | .03 | 3.44 | 1.34 | (.02) |
Distributions from net investment income | (.14) | (.13) | (.12) | (.11) | (.09) |
Distributions from net realized gain | (.20) | (.44) | (.01) | (.01) | (.07) |
Total distributions | (.34) | (.57) | (.13) | (.12) | (.16) |
Net asset value, end of period | $ 16.11 | $ 15.21 | $ 15.75 | $ 12.44 | $ 11.22 |
Total ReturnA | 8.36% | .21% | 27.95% | 12.07% | (.23)% |
Ratios to Average Net AssetsC, F | | | | |
Expenses before reductions | 1.10% | 1.18% | 1.23% | 1.22% | 1.14% |
Expenses net of fee waivers, if any | 1.10% | 1.18% | 1.23% | 1.22% | 1.14% |
Expenses net of all reductions | 1.10% | 1.18% | 1.22% | 1.22% | 1.13% |
Net investment income (loss) | .89% | .86% | 1.05% | 1.27% | 1.47%E |
Supplemental Data | | | | | |
Net assets, end of period (000 omitted) | $ 1,276,570 | $ 1,330,809 | $ 1,163,381 | $ 1,040,585 | $ 1,107,242 |
Portfolio turnover rateD | 16% | 18% | 29% | 25% | 22% |
A Total returns would have been lower if certain expenses had not been reduced during the applicable periods shown.
B Calculated based on average shares outstanding during the period.
C Fees and expenses of any underlying Fidelity Central Funds are not included in the Fund's expense ratio. The Fund indirectly bears its proportionate share of the expenses of any underlying Fidelity Central Funds.
D Amount does not include the portfolio activity of any underlying Fidelity Central Funds.
E Investment income per share reflects a large, non-recurring dividend which amounted to $.06 per share. Excluding this non-recurring dividend, the ratio of net investment income (loss) to average net assets would have been 1.00%.
F Expense ratios reflect operating expenses of the class. Expenses before reductions do not reflect amounts reimbursed by the investment adviser or reductions from brokerage service arrangements or reductions from other expense offset arrangements and do not represent the amount paid by the class during periods when reimbursements or reductions occur. Expense ratios before reductions for start-up periods may not be representative of longer-term operating periods. Expenses net of fee waivers reflect expenses after reimbursement by the investment adviser but prior to reductions from brokerage service arrangements or other expense offset arrangements. Expenses net of all reductions represent the net expenses paid by the class.
See accompanying notes which are an integral part of the financial statements.
Annual Report
Financial Highlights - Fidelity Series International Small Cap Fund Class F
Years ended October 31, | 2015 | 2014 | 2013 | 2012 | 2011 |
Selected Per-Share Data | | | | | |
Net asset value, beginning of period | $ 15.27 | $ 15.79 | $ 12.48 | $ 11.26 | $ 11.43 |
Income from Investment Operations | | | | | |
Net investment income (loss)B | .17 | .16 | .17 | .17 | .20E |
Net realized and unrealized gain (loss) | 1.10 | (.09) | 3.30 | 1.19 | (.20) |
Total from investment operations | 1.27 | .07 | 3.47 | 1.36 | - |
Distributions from net investment income | (.17) | (.15) | (.15) | (.13) | (.10) |
Distributions from net realized gain | (.20) | (.44) | (.01) | (.01) | (.07) |
Total distributions | (.38)G | (.59) | (.16) | (.14) | (.17) |
Net asset value, end of period | $ 16.16 | $ 15.27 | $ 15.79 | $ 12.48 | $ 11.26 |
Total ReturnA | 8.49% | .47% | 28.14% | 12.25% | (.03)% |
Ratios to Average Net AssetsC, F | | | | |
Expenses before reductions | .94% | 1.01% | 1.04% | 1.02% | .93% |
Expenses net of fee waivers, if any | .93% | 1.01% | 1.04% | 1.02% | .93% |
Expenses net of all reductions | .93% | 1.01% | 1.03% | 1.01% | .92% |
Net investment income (loss) | 1.06% | 1.04% | 1.24% | 1.47% | 1.68%E |
Supplemental Data | | | | | |
Net assets, end of period (000 omitted) | $ 1,476,586 | $ 1,448,727 | $ 1,141,808 | $ 836,468 | $ 480,498 |
Portfolio turnover rateD | 16% | 18% | 29% | 25% | 22% |
A Total returns would have been lower if certain expenses had not been reduced during the applicable periods shown.
B Calculated based on average shares outstanding during the period.
C Fees and expenses of any underlying Fidelity Central Funds are not included in the Fund's expense ratio. The Fund indirectly bears its proportionate share of the expenses of any underlying Fidelity Central Funds.
D Amount does not include the portfolio activity of any underlying Fidelity Central Funds.
E Investment income per share reflects a large, non-recurring dividend which amounted to $.06 per share. Excluding this non-recurring dividend, the ratio of net investment income (loss) to average net assets would have been 1.21%.
F Expense ratios reflect operating expenses of the class. Expenses before reductions do not reflect amounts reimbursed by the investment adviser or reductions from brokerage service arrangements or reductions from other expense offset arrangements and do not represent the amount paid by the class during periods when reimbursements or reductions occur. Expense ratios before reductions for start-up periods may not be representative of longer-term operating periods. Expenses net of fee waivers reflect expenses after reimbursement by the investment adviser but prior to reductions from brokerage service arrangements or other expense offset arrangements. Expenses net of all reductions represent the net expenses paid by the class.
G Total distributions of $.38 per share is comprised of distributions from net investment income of $.172 and distributions from net realized gain of $.203 per share.
See accompanying notes which are an integral part of the financial statements.
Annual Report
Fidelity Series International Value Fund
Average annual total return reflects the change in the value of an investment, assuming reinvestment of the class' distributions from dividend income and capital gains (the profits earned upon the sale of securities that have grown in value, if any) and assuming a constant rate of performance each year. The $10,000 table and the fund's returns do not reflect the deduction of taxes that a shareholder would pay on fund distributions or the redemption of fund shares. During periods of reimbursement by Fidelity, a fund's total return will be greater than it would be had the reimbursement not occurred. How a fund did yesterday is no guarantee of how it will do tomorrow.
Average Annual Total Returns
Periods ended October 31, 2015 | Past 1
year | Past 5
years | Life of
fund A |
Fidelity Series International Value Fund | -0.65% | 3.58% | 2.86% |
Class F | -0.46% | 3.77% | 3.05% |
A From December 3, 2009.
$10,000 Over Life of Fund
Let's say hypothetically that $10,000 was invested in Fidelity Series International Value Fund, a class of the fund, on December 3, 2009, when the fund started. The chart shows how the value of your investment would have changed, and also shows how the MSCI EAFE Value Index performed over the same period.
Annual Report
Fidelity Series International Value Fund
Market Recap: International equities suffered a moderate setback for the 12 months ending October 31, 2015, held back by a collapse in commodities prices that hurt resources-related sectors and geographies. The MSCI ACWI (All Country World Index) ex USA Index returned -4.55% for the period, affected also by concerns about global economic growth. Commodity producers remained under pressure for much of the past year, largely related to economic deceleration in China (-1%), the world's second-largest economy and a leading consumer of raw materials. This effect was exacerbated by U.S. dollar strength relative to global currencies, which weighed on commodities priced in dollars and acutely impacted equity returns within regions most exposed to resources prices. The emerging-markets group, for example, returned about -15% this period. Canada, a significant energy producer, returned roughly -17%. Net energy consumer Japan (+9%) was the best-performing region by far. Only about a quarter of the nearly 50 index countries managed a gain this period: Ireland (+19%) - the EU's fastest-growing economy - and Israel (+17%) proved top performers; Greece (-56%) and Brazil (-46%), among the worst. As for sectors, energy (-25%) and materials (-16%) declined sharply, whereas the two consumer sectors each gained about 6%.
Comments from Portfolio Manager Alex Zavratsky: For the year, the fund's share classes declined modestly, outperforming the -4.09% result of the benchmark MSCI EAFE Value Index. Versus the benchmark, key contributors included stock selection in various countries throughout Europe, especially France and Switzerland, as well as in the United Kingdom. Conversely, positioning in Japan detracted. The fund also was affected by a downward fair-value pricing adjustment, largely related to the fund's Japan-based investments. Looking at individual stocks, largely avoiding U.K-based oil giant and index component Royal Dutch Shell helped most. The fund started the review period with an underweighted position, later eliminated. Shares of Royal Dutch Shell returned roughly -23% amid disappointing financial results, weakening oil prices and high capital expenditures, and our decisions here proved the biggest contributor to relative results this period. Avoiding Spain's Banco Santander, a benchmark constituent, also was a good call. Conversely, the fund's position in French bank BNP Paribas was the biggest relative detractor the past year. We held an underweighted position in the stock earlier in the period and sold it once the stock no longer fit our investment criteria. This stance hurt the fund because BNP outpaced the market the past year.
The views expressed above reflect those of the portfolio manager(s) only through the end of the period as stated on the cover of this report and do not necessarily represent the views of Fidelity or any other person in the Fidelity organization. Any such views are subject to change at any time based upon market or other conditions and Fidelity disclaims any responsibility to update such views. These views may not be relied on as investment advice and, because investment decisions for a Fidelity fund are based on numerous factors, may not be relied on as an indication of trading intent on behalf of any Fidelity fund.
Annual Report
Fidelity Series International Value Fund
Investment Changes (Unaudited)
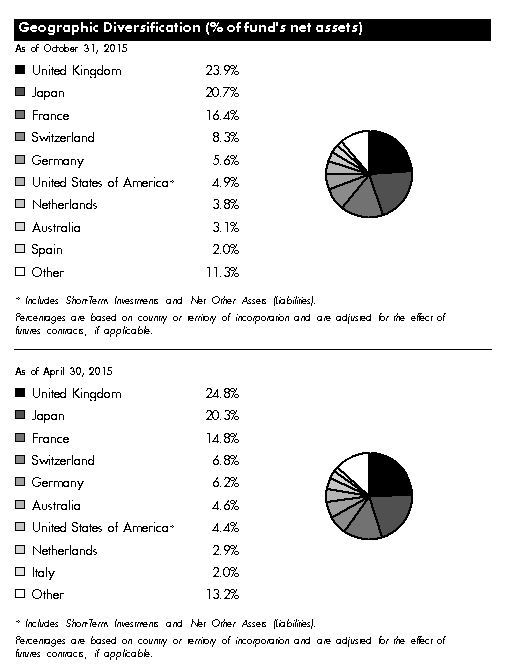
Asset Allocation as of October 31, 2015 |
| % of fund's
net assets | % of fund's net assets
6 months ago |
Stocks | 98.7 | 98.7 |
Short-Term Investments and Net Other Assets (Liabilities) | 1.3 | 1.3 |
Top Ten Stocks as of October 31, 2015 |
| % of fund's
net assets | % of fund's net assets
6 months ago |
Total SA (France, Oil, Gas & Consumable Fuels) | 3.1 | 2.8 |
Nestle SA (Switzerland, Food Products) | 2.7 | 2.0 |
Sanofi SA (France, Pharmaceuticals) | 2.6 | 2.4 |
Novartis AG (Switzerland, Pharmaceuticals) | 2.5 | 1.6 |
Toyota Motor Corp. (Japan, Automobiles) | 2.4 | 2.7 |
Mitsubishi UFJ Financial Group, Inc. (Japan, Banks) | 2.0 | 2.6 |
BP PLC sponsored ADR (United Kingdom, Oil, Gas & Consumable Fuels) | 2.0 | 2.8 |
HSBC Holdings PLC sponsored ADR (United Kingdom, Banks) | 1.9 | 2.1 |
Vodafone Group PLC sponsored ADR (United Kingdom, Wireless Telecommunication Services) | 1.8 | 1.9 |
Imperial Tobacco Group PLC (United Kingdom, Tobacco) | 1.8 | 1.2 |
| 22.8 | |
Market Sectors as of October 31, 2015 |
| % of fund's
net assets | % of fund's net assets
6 months ago |
Financials | 26.7 | 27.6 |
Health Care | 16.0 | 14.1 |
Consumer Discretionary | 14.5 | 15.5 |
Consumer Staples | 9.3 | 7.1 |
Industrials | 8.2 | 7.7 |
Energy | 6.7 | 6.8 |
Telecommunication Services | 6.1 | 7.0 |
Materials | 4.3 | 4.9 |
Information Technology | 3.8 | 5.6 |
Utilities | 3.1 | 2.4 |
Annual Report
Fidelity Series International Value Fund
Investments October 31, 2015
Showing Percentage of Net Assets
Common Stocks - 98.3% |
| Shares | | Value |
Australia - 3.1% |
Ansell Ltd. | 3,467,096 | | $ 49,336,704 |
Macquarie Group Ltd. | 1,088,629 | | 65,915,262 |
Telstra Corp. Ltd. | 7,025,653 | | 26,919,811 |
Transurban Group unit | 6,955,900 | | 51,543,540 |
Westpac Banking Corp. | 8,070,888 | | 179,771,142 |
TOTAL AUSTRALIA | | 373,486,459 |
Bailiwick of Jersey - 1.4% |
Shire PLC | 754,200 | | 57,116,228 |
Wolseley PLC | 1,803,216 | | 105,869,207 |
TOTAL BAILIWICK OF JERSEY | | 162,985,435 |
Belgium - 0.5% |
Anheuser-Busch InBev SA NV | 535,830 | | 63,937,702 |
Canada - 0.8% |
Imperial Oil Ltd. | 1,760,700 | | 58,586,767 |
Potash Corp. of Saskatchewan, Inc. | 1,948,800 | | 39,464,839 |
TOTAL CANADA | | 98,051,606 |
Denmark - 0.3% |
Topdanmark A/S (a) | 1,229,079 | | 32,705,916 |
Finland - 1.2% |
Sampo Oyj (A Shares) | 2,884,113 | | 141,068,981 |
France - 16.4% |
Atos Origin SA | 1,493,763 | | 119,171,825 |
AXA SA | 6,747,073 | | 180,066,650 |
Capgemini SA | 1,666,305 | | 148,475,506 |
Havas SA | 8,504,342 | | 73,785,699 |
Orange SA | 7,079,500 | | 124,823,540 |
Renault SA | 671,392 | | 63,294,134 |
Sanofi SA | 3,053,708 | | 308,045,425 |
Societe Generale Series A | 2,765,700 | | 128,448,030 |
Total SA (d) | 7,811,190 | | 377,740,081 |
Unibail-Rodamco | 501,800 | | 140,213,490 |
VINCI SA | 2,420,900 | | 163,402,318 |
Vivendi SA | 5,918,981 | | 142,391,807 |
TOTAL FRANCE | | 1,969,858,505 |
Germany - 5.2% |
Axel Springer Verlag AG | 899,600 | | 50,589,996 |
BASF AG | 2,514,798 | | 206,021,941 |
Common Stocks - continued |
| Shares | | Value |
Germany - continued |
Bayer AG | 630,214 | | $ 84,097,349 |
Continental AG | 244,333 | | 58,760,487 |
Fresenius SE & Co. KGaA | 1,915,400 | | 140,748,177 |
GEA Group AG | 670,273 | | 26,877,101 |
SAP AG | 700,973 | | 55,261,272 |
TOTAL GERMANY | | 622,356,323 |
Hong Kong - 0.2% |
Power Assets Holdings Ltd. | 1,903,000 | | 18,928,020 |
Ireland - 1.4% |
Allergan PLC (a) | 304,800 | | 94,021,656 |
Medtronic PLC | 1,005,500 | | 74,326,560 |
TOTAL IRELAND | | 168,348,216 |
Israel - 1.4% |
Teva Pharmaceutical Industries Ltd. sponsored ADR | 2,824,992 | | 167,211,276 |
Italy - 1.7% |
Intesa Sanpaolo SpA | 27,259,000 | | 94,961,938 |
Mediaset SpA | 11,889,200 | | 60,401,689 |
Telecom Italia SpA (a) | 35,609,700 | | 49,678,486 |
TOTAL ITALY | | 205,042,113 |
Japan - 20.7% |
Astellas Pharma, Inc. | 8,190,100 | | 118,875,041 |
Dentsu, Inc. | 2,241,900 | | 126,035,443 |
East Japan Railway Co. | 1,297,800 | | 123,389,101 |
Hoya Corp. | 3,406,300 | | 140,567,023 |
Itochu Corp. | 8,020,400 | | 100,359,132 |
Japan Tobacco, Inc. | 4,569,900 | | 158,172,414 |
KDDI Corp. | 5,184,300 | | 125,451,426 |
Makita Corp. | 1,266,800 | | 69,411,559 |
Mitsubishi UFJ Financial Group, Inc. | 37,170,100 | | 240,398,905 |
Nippon Prologis REIT, Inc. | 24,562 | | 43,194,249 |
Nippon Telegraph & Telephone Corp. | 4,304,700 | | 157,816,333 |
OBIC Co. Ltd. | 1,364,500 | | 72,014,205 |
Olympus Corp. | 2,355,300 | | 79,447,401 |
ORIX Corp. | 7,319,600 | | 106,893,835 |
Seven & i Holdings Co. Ltd. | 2,377,900 | | 108,015,670 |
Seven Bank Ltd. | 16,189,300 | | 73,767,446 |
Sony Corp. | 2,929,700 | | 83,277,978 |
Sony Financial Holdings, Inc. | 4,784,200 | | 85,745,253 |
Common Stocks - continued |
| Shares | | Value |
Japan - continued |
Sumitomo Mitsui Financial Group, Inc. | 4,567,900 | | $ 182,230,289 |
Toyota Motor Corp. | 4,625,900 | | 283,403,159 |
TOTAL JAPAN | | 2,478,465,862 |
Luxembourg - 0.5% |
RTL Group SA | 696,539 | | 60,203,600 |
Netherlands - 3.8% |
ING Groep NV (Certificaten Van Aandelen) | 11,122,534 | | 161,875,888 |
Koninklijke KPN NV | 13,782,545 | | 50,502,014 |
Mylan N.V. | 838,900 | | 36,987,101 |
PostNL NV (a) | 5,580,449 | | 23,048,847 |
RELX NV (d) | 10,694,953 | | 182,878,963 |
TOTAL NETHERLANDS | | 455,292,813 |
Singapore - 0.3% |
UOL Group Ltd. | 7,976,626 | | 37,225,002 |
Spain - 2.0% |
Iberdrola SA | 25,598,357 | | 182,885,568 |
Mediaset Espana Comunicacion SA | 5,072,600 | | 61,665,725 |
TOTAL SPAIN | | 244,551,293 |
Sweden - 1.6% |
Nordea Bank AB | 12,899,933 | | 142,685,847 |
Sandvik AB | 5,780,400 | | 54,058,788 |
TOTAL SWEDEN | | 196,744,635 |
Switzerland - 8.3% |
Credit Suisse Group AG | 326,913 | | 8,153,613 |
Credit Suisse Group AG (e)(f) | 4,042,000 | | 93,029,996 |
Nestle SA | 4,174,441 | | 318,818,742 |
Novartis AG | 3,362,844 | | 304,635,782 |
Syngenta AG (Switzerland) | 199,177 | | 66,917,582 |
UBS Group AG | 2,404,671 | | 48,165,560 |
Zurich Insurance Group AG | 566,015 | | 149,371,445 |
TOTAL SWITZERLAND | | 989,092,720 |
United Kingdom - 23.9% |
AstraZeneca PLC (United Kingdom) | 3,262,691 | | 207,939,715 |
Aviva PLC | 18,112,939 | | 135,368,438 |
BAE Systems PLC | 17,011,150 | | 115,071,806 |
Barclays PLC | 47,886,236 | | 170,608,209 |
Common Stocks - continued |
| Shares | | Value |
United Kingdom - continued |
BG Group PLC | 4,777,500 | | $ 75,477,509 |
BP PLC sponsored ADR | 6,674,296 | | 238,272,367 |
Bunzl PLC | 4,348,005 | | 124,606,623 |
Compass Group PLC | 7,646,317 | | 131,447,111 |
HSBC Holdings PLC sponsored ADR (d) | 5,826,188 | | 227,629,165 |
Imperial Tobacco Group PLC | 3,968,545 | | 214,065,635 |
Informa PLC | 10,049,005 | | 87,991,982 |
ITV PLC | 38,804,985 | | 150,990,134 |
Liberty Global PLC: | | | |
Class A (a) | 1,373,900 | | 61,166,028 |
LiLAC Class A (a) | 402,069 | | 15,527,905 |
Lloyds Banking Group PLC | 148,777,300 | | 168,864,053 |
Meggitt PLC | 4,605,141 | | 25,103,073 |
Micro Focus International PLC | 3,275,200 | | 63,416,047 |
National Grid PLC | 11,637,200 | | 165,770,594 |
Prudential PLC | 2,884,996 | | 67,383,396 |
Rio Tinto PLC | 5,510,776 | | 200,841,727 |
Vodafone Group PLC sponsored ADR | 6,622,266 | | 218,336,110 |
TOTAL UNITED KINGDOM | | 2,865,877,627 |
United States of America - 3.6% |
Altria Group, Inc. | 1,307,500 | | 79,064,525 |
Chevron Corp. | 730,200 | | 66,360,576 |
Constellation Brands, Inc. Class A (sub. vtg.) | 908,200 | | 122,425,360 |
Edgewell Personal Care Co. (a) | 536,100 | | 45,413,031 |
McGraw Hill Financial, Inc. | 820,900 | | 76,048,176 |
ResMed, Inc. CDI | 7,967,510 | | 45,256,618 |
TOTAL UNITED STATES OF AMERICA | | 434,568,286 |
TOTAL COMMON STOCKS (Cost $11,019,927,709) |
11,786,002,390
|
Nonconvertible Preferred Stocks - 0.4% |
| | | |
Germany - 0.4% |
Volkswagen AG
(Cost $94,866,859) | 462,290 | |
55,491,015
|
Money Market Funds - 2.4% |
| Shares | | Value |
Fidelity Cash Central Fund, 0.18% (b) | 268,151,896 | | $ 268,151,896 |
Fidelity Securities Lending Cash Central Fund, 0.19% (b)(c) | 20,284,471 | | 20,284,471 |
TOTAL MONEY MARKET FUNDS (Cost $288,436,367) |
288,436,367
|
TOTAL INVESTMENT PORTFOLIO - 101.1% (Cost $11,403,230,935) | | 12,129,929,772 |
NET OTHER ASSETS (LIABILITIES) - (1.1)% | | (136,877,418) |
NET ASSETS - 100% | $ 11,993,052,354 |
Legend |
(a) Non-income producing |
(b) Affiliated fund that is generally available only to investment companies and other accounts managed by Fidelity Investments. The rate quoted is the annualized seven-day yield of the fund at period end. A complete unaudited listing of the fund's holdings as of its most recent quarter end is available upon request. In addition, each Fidelity Central Fund's financial statements, which are not covered by the Fund's Report of Independent Registered Public Accounting Firm, are available on the SEC's website or upon request. |
(c) Investment made with cash collateral received from securities on loan. |
(d) Security or a portion of the security is on loan at period end. |
(e) Security or a portion of the security purchased on a delayed delivery or when-issued basis. Interest rate to be determined at settlement date. |
(f) Restricted securities - Investment in securities not registered under the Securities Act of 1933 (excluding 144A issues). At the end of the period, the value of restricted securities (excluding 144A issues) amounted to $93,029,996 or 0.8% of net assets. |
Additional information on each restricted holding is as follows: |
Security | Acquisition Date | Acquisition Cost |
Credit Suisse Group AG | 10/21/15 | $ 95,841,889 |
Affiliated Central Funds |
Information regarding fiscal year to date income earned by the Fund from investments in Fidelity Central Funds is as follows: |
Fund | Income earned |
Fidelity Cash Central Fund | $ 199,505 |
Fidelity Securities Lending Cash Central Fund | 7,952,590 |
Total | $ 8,152,095 |
Other Affiliated Issuers |
An affiliated company is a company in which the Fund has ownership of at least 5% of the voting securities. Fiscal year to date transactions with companies which are or were affiliates are as follows: |
Affiliate | Value,
beginning of
period | Purchases | Sales
Proceeds | Dividend
Income | Value,
end of
period |
ResMed, Inc. CDI | $ 65,708,901 | $ 6,132,549 | $ 32,222,925 | $ 1,353,471 | $ - |
Other Information |
Categorizations in the Schedule of Investments are based on country or territory of incorporation. |
The following is a summary of the inputs used, as of October 31, 2015, involving the Fund's assets and liabilities carried at fair value. The inputs or methodology used for valuing securities may not be an indication of the risk associated with investing in those securities. For more information on valuation inputs, and their aggregation into the levels used in the tables below, please refer to the Investment Valuation section in the accompanying Notes to Financial Statements. |
Valuation Inputs at Reporting Date: |
Description | Total | Level 1 | Level 2 | Level 3 |
Investments in Securities: | | | | |
Equities: | | | | |
Consumer Discretionary | $ 1,749,302,855 | $ 927,256,342 | $ 822,046,513 | $ - |
Consumer Staples | 1,109,913,079 | 460,968,551 | 648,944,528 | - |
Energy | 816,437,300 | 363,219,710 | 453,217,590 | - |
Financials | 3,181,790,174 | 1,032,649,045 | 2,149,141,129 | - |
Health Care | 1,908,612,056 | 456,643,942 | 1,451,968,114 | - |
Industrials | 982,741,095 | 417,096,750 | 565,644,345 | - |
Information Technology | 458,338,855 | 331,063,378 | 127,275,477 | - |
Materials | 513,246,089 | 39,464,839 | 473,781,250 | - |
Telecommunication Services | 753,527,720 | 218,336,110 | 535,191,610 | - |
Utilities | 367,584,182 | 182,885,568 | 184,698,614 | - |
Money Market Funds | 288,436,367 | 288,436,367 | - | - |
Total Investments in Securities: | $ 12,129,929,772 | $ 4,718,020,602 | $ 7,411,909,170 | $ - |
The following is a summary of transfers between Level 1 and Level 2 for the period ended October 31, 2015. Transfers are assumed to have occurred at the beginning of the period, and are primarily attributable to the valuation techniques used for foreign equity securities, as discussed in the accompanying Notes to Financial Statements: |
Transfers | Total |
Level 1 to Level 2 | $ 1,037,873,973 |
Level 2 to Level 1 | $ 233,839,580 |
See accompanying notes which are an integral part of the financial statements.
Annual Report
Fidelity Series International Value Fund
Statement of Assets and Liabilities
| | October 31, 2015 |
| | |
Assets | | |
Investment in securities, at value (including securities loaned of $19,642,481) - See accompanying schedule: Unaffiliated issuers (cost $11,114,794,568) | $ 11,841,493,405 | |
Fidelity Central Funds (cost $288,436,367) | 288,436,367 | |
Total Investments (cost $11,403,230,935) | | $ 12,129,929,772 |
Foreign currency held at value (cost $75) | | 30 |
Receivable for investments sold | | 122,651,305 |
Receivable for fund shares sold | | 13,162,813 |
Dividends receivable | | 37,372,628 |
Distributions receivable from Fidelity Central Funds | | 84,408 |
Prepaid expenses | | 33,601 |
Other receivables | | 43,146 |
Total assets | | 12,303,277,703 |
| | |
Liabilities | | |
Payable for investments purchased | | |
Regular delivery | $ 28,416,662 | |
Delayed delivery | 93,029,996 | |
Payable for fund shares redeemed | 159,997,363 | |
Accrued management fee | 7,401,469 | |
Other affiliated payables | 908,095 | |
Other payables and accrued expenses | 187,293 | |
Collateral on securities loaned, at value | 20,284,471 | |
Total liabilities | | 310,225,349 |
| | |
Net Assets | | $ 11,993,052,354 |
Net Assets consist of: | | |
Paid in capital | | $ 11,397,906,154 |
Undistributed net investment income | | 234,573,457 |
Accumulated undistributed net realized gain (loss) on investments and foreign currency transactions | | (368,270,868) |
Net unrealized appreciation (depreciation) on investments and assets and liabilities in foreign currencies | | 728,843,611 |
Net Assets | | $ 11,993,052,354 |
See accompanying notes which are an integral part of the financial statements.
Annual Report
Fidelity Series International Value Fund
Financial Statements - continued
Statement of Assets and Liabilities - continued
| | October 31, 2015 |
| | |
Series International Value:
Net Asset Value, offering price and redemption price per share ($5,556,956,725 ÷ 560,590,766 shares) | | $ 9.91 |
| | |
Class F:
Net Asset Value, offering price and redemption price per share ($6,436,095,629 ÷ 647,175,500 shares) | | $ 9.94 |
See accompanying notes which are an integral part of the financial statements.
Annual Report
Statement of Operations
| Year ended October 31, 2015 |
| | |
Investment Income | | |
Dividends (including $1,353,471 earned from other affiliated issuers) | | $ 394,655,970 |
Interest | | 12,038 |
Income from Fidelity Central Funds | | 8,152,095 |
Income before foreign taxes withheld | | 402,820,103 |
Less foreign taxes withheld | | (28,976,423) |
Total income | | 373,843,680 |
| | |
Expenses | | |
Management fee | | |
Basic fee | $ 86,978,752 | |
Performance adjustment | 743,956 | |
Transfer agent fees | 9,677,334 | |
Accounting and security lending fees | 1,906,165 | |
Custodian fees and expenses | 927,114 | |
Independent trustees' compensation | 52,995 | |
Audit | 82,364 | |
Legal | 31,968 | |
Interest | 1,545 | |
Miscellaneous | 104,748 | |
Total expenses before reductions | 100,506,941 | |
Expense reductions | (1,147,712) | 99,359,229 |
Net investment income (loss) | | 274,484,451 |
Realized and Unrealized Gain (Loss) | | |
Net realized gain (loss) on: | | |
Investment securities: | | |
Unaffiliated issuers | (307,750,992) | |
Other affiliated issuers | 5,719,082 | |
Foreign currency transactions | (7,966,842) | |
Total net realized gain (loss) | | (309,998,752) |
Change in net unrealized appreciation (depreciation) on: Investment securities | (10,590,952) | |
Assets and liabilities in foreign currencies | 3,324,493 | |
Total change in net unrealized appreciation (depreciation) | | (7,266,459) |
Net gain (loss) | | (317,265,211) |
Net increase (decrease) in net assets resulting from operations | | $ (42,780,760) |
See accompanying notes which are an integral part of the financial statements.
Annual Report
Fidelity Series International Value Fund
Financial Statements - continued
Statement of Changes in Net Assets
| Year ended
October 31,
2015 | Year ended
October 31,
2014 |
Increase (Decrease) in Net Assets | | |
Operations | | |
Net investment income (loss) | $ 274,484,451 | $ 545,342,055 |
Net realized gain (loss) | (309,998,752) | 402,652,013 |
Change in net unrealized appreciation (depreciation) | (7,266,459) | (1,082,222,300) |
Net increase (decrease) in net assets resulting from
operations | (42,780,760) | (134,228,232) |
Distributions to shareholders from net investment income | (519,162,017) | (280,500,370) |
Distributions to shareholders from net realized gain | (371,264,934) | (41,143,110) |
Total distributions | (890,426,951) | (321,643,480) |
Share transactions - net increase (decrease) | 487,487,592 | 1,583,070,862 |
Total increase (decrease) in net assets | (445,720,119) | 1,127,199,150 |
| | |
Net Assets | | |
Beginning of period | 12,438,772,473 | 11,311,573,323 |
End of period (including undistributed net investment income of $234,573,457 and undistributed net investment income of $485,385,663, respectively) | $ 11,993,052,354 | $ 12,438,772,473 |
See accompanying notes which are an integral part of the financial statements.
Annual Report
Financial Highlights - Fidelity Series International Value
Years ended October 31, | 2015 | 2014 | 2013 | 2012 | 2011 |
Selected Per-Share Data | | | | | |
Net asset value, beginning of period | $ 10.73 | $ 11.14 | $ 9.16 | $ 8.59 | $ 9.91 |
Income from Investment Operations | | | | | |
Net investment income (loss)B | .22 | .45E | .26 | .29 | .30 |
Net realized and unrealized gain (loss) | (.28) | (.59) | 2.03 | .50 | (1.45) |
Total from investment operations | (.06) | (.14) | 2.29 | .79 | (1.15) |
Distributions from net investment income | (.44) | (.24) | (.26) | (.22) | (.13) |
Distributions from net realized gain | (.32) | (.04) | (.06) | - | (.04) |
Total distributions | (.76) | (.27)G | (.31)H | (.22) | (.17) |
Net asset value, end of period | $ 9.91 | $ 10.73 | $ 11.14 | $ 9.16 | $ 8.59 |
Total ReturnA | (.65)% | (1.25)% | 25.78% | 9.56% | (11.84)% |
Ratios to Average Net AssetsC, F | | | | |
Expenses before reductions | .89% | .82% | .88% | .90% | .95% |
Expenses net of fee waivers, if any | .89% | .82% | .88% | .90% | .95% |
Expenses net of all reductions | .88% | .81% | .85% | .87% | .93% |
Net investment income (loss) | 2.12% | 4.05%E | 2.58% | 3.35% | 3.05% |
Supplemental Data | | | | | |
Net assets, end of period (000 omitted) | $ 5,556,957 | $ 5,971,189 | $ 5,710,397 | $ 5,107,633 | $ 4,503,487 |
Portfolio turnover rateD | 44% | 70% | 80% | 63% | 78% |
A Total returns would have been lower if certain expenses had not been reduced during the applicable periods shown.
B Calculated based on average shares outstanding during the period.
C Fees and expenses of any underlying Fidelity Central Funds are not included in the Fund's expense ratio. The Fund indirectly bears its proportionate share of the expenses of any underlying Fidelity Central Funds.
D Amount does not include the portfolio activity of any underlying Fidelity Central Funds.
E Investment income per share reflects a large, non-recurring dividend which amounted to $.18 per share. Excluding this non-recurring dividend, the ratio of net investment income (loss) to average net assets would have been 2.46%.
F Expense ratios reflect operating expenses of the class. Expenses before reductions do not reflect amounts reimbursed by the investment adviser or reductions from brokerage service arrangements or reductions from other expense offset arrangements and do not represent the amount paid by the class during periods when reimbursements or reductions occur. Expense ratios before reductions for start-up periods may not be representative of longer-term operating periods. Expenses net of fee waivers reflect expenses after reimbursement by the investment adviser but prior to reductions from brokerage service arrangements or other expense offset arrangements. Expenses net of all reductions represent the net expenses paid by the class.
G Total distributions of $.27 per share is comprised of distributions from net investment income of $.237 and distributions from net realized gain of $.036 per share.
H Total distributions of $.31 per share is comprised of distributions from net investment income of $.256 and distributions from net realized gain of $.057 per share.
See accompanying notes which are an integral part of the financial statements.
Annual Report
Financial Highlights - Fidelity Series International Value Fund Class F
Years ended October 31, | 2015 | 2014 | 2013 | 2012 | 2011 |
Selected Per-Share Data | | | | | |
Net asset value, beginning of period | $ 10.76 | $ 11.18 | $ 9.19 | $ 8.62 | $ 9.93 |
Income from Investment Operations | | | | | |
Net investment income (loss)B | .23 | .47E | .28 | .30 | .31 |
Net realized and unrealized gain (loss) | (.27) | (.60) | 2.04 | .51 | (1.44) |
Total from investment operations | (.04) | (.13) | 2.32 | .81 | (1.13) |
Distributions from net investment income | (.46) | (.25) | (.27) | (.24) | (.14) |
Distributions from net realized gain | (.32) | (.04) | (.06) | - | (.04) |
Total distributions | (.78) | (.29) | (.33) | (.24) | (.18) |
Net asset value, end of period | $ 9.94 | $ 10.76 | $ 11.18 | $ 9.19 | $ 8.62 |
Total ReturnA | (.46)% | (1.18)% | 26.05% | 9.77% | (11.61)% |
Ratios to Average Net AssetsC, F | | | | |
Expenses before reductions | .73% | .65% | .69% | .70% | .74% |
Expenses net of fee waivers, if any | .73% | .65% | .69% | .70% | .74% |
Expenses net of all reductions | .72% | .64% | .67% | .67% | .72% |
Net investment income (loss) | 2.28% | 4.22%E | 2.76% | 3.55% | 3.26% |
Supplemental Data | | | | | |
Net assets, end of period (000 omitted) | $ 6,436,096 | $ 6,467,583 | $ 5,601,176 | $ 4,114,635 | $ 1,955,967 |
Portfolio turnover rateD | 44% | 70% | 80% | 63% | 78% |
A Total returns would have been lower if certain expenses had not been reduced during the applicable periods shown.
B Calculated based on average shares outstanding during the period.
C Fees and expenses of any underlying Fidelity Central Funds are not included in the Fund's expense ratio. The Fund indirectly bears its proportionate share of the expenses of any underlying Fidelity Central Funds.
D Amount does not include the portfolio activity of any underlying Fidelity Central Funds.
E Investment income per share reflects a large, non-recurring dividend which amounted to $.18 per share. Excluding this non-recurring dividend, the ratio of net investment income (loss) to average net assets would have been 2.64%.
F Expense ratios reflect operating expenses of the class. Expenses before reductions do not reflect amounts reimbursed by the investment adviser or reductions from brokerage service arrangements or reductions from other expense offset arrangements and do not represent the amount paid by the class during periods when reimbursements or reductions occur. Expense ratios before reductions for start-up periods may not be representative of longer-term operating periods. Expenses net of fee waivers reflect expenses after reimbursement by the investment adviser but prior to reductions from brokerage service arrangements or other expense offset arrangements. Expenses net of all reductions represent the net expenses paid by the class.
See accompanying notes which are an integral part of the financial statements.
Annual Report
For the period ended October 31, 2015
1. Organization.
Fidelity Series Emerging Markets Fund, Fidelity Series International Growth Fund, Fidelity Series International Small Cap Fund and Fidelity Series International Value Fund (the Funds) are funds of Fidelity Investment Trust (the Trust). The Trust is registered under the Investment Company Act of 1940, as amended (the 1940 Act), as an open-end management investment company organized as a Massachusetts business trust. Each Fund is authorized to issue an unlimited number of shares. Shares of the Funds are only available for purchase by mutual funds for which Fidelity Management & Research Company (FMR) or an affiliate serves as an investment manager. Fidelity Series Emerging Markets Fund offers Series Emerging Markets shares and Class F shares. Fidelity Series International Growth Fund offers Series International Growth shares and Class F shares. Fidelity Series International Small Cap Fund offers Series International Small Cap shares and Class F shares. Fidelity Series International Value Fund offers Series International Value shares and Class F shares. All classes have equal rights as to assets and voting privileges. Each class has exclusive voting rights with respect to matters that affect that class. The Funds' investments in emerging markets can be subject to social, economic, regulatory, and political uncertainties and can be extremely volatile.
2. Investments in Fidelity Central Funds.
The Funds in Fidelity Central Funds, which are open-end investment companies generally available only to other investment companies and accounts managed by the investment adviser and its affiliates. The Funds' Schedules of Investments list each of the Fidelity Central Funds held as of period end, if any, as an investment of each Fund, but do not include the underlying holdings of each Fidelity Central Fund. As an Investing Fund, each Fund indirectly bears its proportionate share of the expenses of the underlying Fidelity Central Funds.
The Money Market Central Funds seek preservation of capital and current income and are managed by Fidelity Investments Money Management, Inc. (FIMM), an affiliate of the investment adviser. Annualized expenses of the Money Market Central Funds as of their most recent shareholder report date are less than .005%.
A complete unaudited list of holdings for each Fidelity Central Fund is available upon request or at the Securities and Exchange Commission (the SEC) website at www.sec.gov. In addition, the financial statements of the Fidelity Central Funds, which are not covered by the Funds' Report of Independent Registered Public Accounting Firm, are available on the SEC website or upon request.
Annual Report
Notes to Financial Statements - continued
3. Significant Accounting Policies.
The financial statements have been prepared in conformity with accounting principles generally accepted in the United States of America (GAAP), which require management to make certain estimates and assumptions at the date of the financial statements. Actual results could differ from those estimates. Subsequent events, if any, through the date that the financial statements were issued have been evaluated in the preparation of the financial statements. The following summarizes the significant accounting policies of the Funds:
Investment Valuation. Investments are valued as of 4:00 p.m. Eastern time on the last calendar day of the period. The Board of Trustees (the Board) has delegated the day to day responsibility for the valuation of each Fund's investments to the FMR Fair Value Committee (the Committee). In accordance with valuation policies and procedures approved by the Board, each Fund attempts to obtain prices from one or more third party pricing vendors or brokers to value its investments. When current market prices, quotations or currency exchange rates are not readily available or reliable, investments will be fair valued in good faith by the Committee, in accordance with procedures adopted by the Board. Factors used in determining fair value vary by investment type and may include market or investment specific events, changes in interest rates and credit quality. The frequency with which these procedures are used cannot be predicted and they may be utilized to a significant extent. The Committee oversees each Fund's valuation policies and procedures and reports to the Board on the Committee's activities and fair value determinations. The Board monitors the appropriateness of the procedures used in valuing each Fund's investments and ratifies the fair value determinations of the Committee.
Each Fund categorizes the inputs to valuation techniques used to value its investments into a disclosure hierarchy consisting of three levels as shown below:
Level 1 - quoted prices in active markets for identical investments
Level 2 - other significant observable inputs (including quoted prices for similar investments, interest rates, prepayment speeds, etc.)
Level 3 - unobservable inputs (including the Fund's own assumptions based on the best information available)
Valuation techniques used to value each Fund's investments by major category are as follows:
Equity securities, including restricted securities, for which market quotations are readily available, are valued at the last reported sale price or official closing price as reported by a third party pricing vendor on the primary market or exchange on which they are traded and are categorized as Level 1 in the hierarchy. In the event there were no sales during
Annual Report
3. Significant Accounting Policies - continued
Investment Valuation - continued
the day or closing prices are not available, securities are valued at the last quoted bid price or may be valued using the last available price and are generally categorized as Level 2 in the hierarchy. For foreign equity securities, when market or security specific events arise, comparisons to the valuation of American Depositary Receipts (ADRs), futures contracts, Exchange-Traded Funds (ETFs) and certain indexes as well as quoted prices for similar securities may be used and would be categorized as Level 2 in the hierarchy. Utilizing these techniques may result in transfers between Level 1 and Level 2. For equity securities, including restricted securities, where observable inputs are limited, assumptions about market activity and risk are used and these securities may be categorized as Level 3 in the hierarchy.
Futures contracts are valued at the settlement price established each day by the board of trade or exchange on which they are traded and are categorized as Level 1 in the hierarchy. Investments in open-end mutual funds, including the Fidelity Central Funds, are valued at their closing net asset value (NAV) each business day and are categorized as Level 1 in the hierarchy.
Changes in valuation techniques may result in transfers in or out of an assigned level within the disclosure hierarchy. The aggregate value of investments by input level as of October 31, 2015 , including information on transfers between Levels 1 and 2 is included at the end of each applicable Fund's Schedule of Investments.
Foreign Currency. The Funds may use foreign currency contracts to facilitate transactions in foreign-denominated securities. Gains and losses from these transactions may arise from changes in the value of the foreign currency or if the counterparties do not perform under the contracts' terms.
Foreign-denominated assets, including investment securities, and liabilities are translated into U.S. dollars at the exchange rates at period end. Purchases and sales of investment securities, income and dividends received and expenses denominated in foreign currencies are translated into U.S. dollars at the exchange rate in effect on the transaction date.
Annual Report
Notes to Financial Statements - continued
3. Significant Accounting Policies - continued
Foreign Currency - continued
The effects of exchange rate fluctuations on investments are included with the net realized and unrealized gain (loss) on investment securities. Other foreign currency transactions resulting in realized and unrealized gain (loss) are disclosed separately.
Investment Transactions and Income. For financial reporting purposes, the Funds' investment holdings and NAV include trades executed through the end of the last business day of the period. The NAV per share for processing shareholder transactions is calculated as of the close of business of the New York Stock Exchange (NYSE), normally 4:00 p.m. Eastern time and includes trades executed through the end of the prior business day. Gains and losses on securities sold are determined on the basis of identified cost and may include proceeds received from litigation. Dividend income is recorded on the ex-dividend date, except for certain dividends from foreign securities where the ex-dividend date may have passed, which are recorded as soon as the Funds are informed of the ex-dividend date. Non-cash dividends included in dividend income, if any, are recorded at the fair market value of the securities received. Income and capital gain distributions from Fidelity Central Funds, if any, are recorded on the ex-dividend date. Distributions received on securities that represent a return of capital or capital gain are recorded as a reduction of cost of investments and/or as a realized gain. Subsequent to ex-dividend date the Funds determine the components of these distributions, based upon receipt of tax filings or other correspondence relating to the underlying investment. Large, non-recurring dividends recognized by a Fund are presented separately on the Statement of Operations as "Special Dividends" and the impact of these dividends is presented in the Financial Highlights. Interest income is accrued as earned and includes coupon interest and amortization of premium and accretion of discount on debt securities as applicable. Investment income is recorded net of foreign taxes withheld where recovery of such taxes is uncertain.
Class Allocations and Expenses. Investment income, realized and unrealized capital gains and losses, common expenses of each Fund, and certain fund-level expense reductions, if any, are allocated daily on a pro-rata basis to each class based on the relative net assets of each class to the total net assets of each Fund. Each class differs with respect to transfer agent fees incurred. Certain expense reductions may also differ by class. For the reporting period, the allocated portion of income and expenses to each class as a percent of its average net assets may vary due to the timing of recording these transactions in relation to fluctuating net assets of the classes. Expenses directly attributable to a fund are charged to that fund. Expenses attributable to more than one fund are allocated among the respective funds on the basis of relative net assets or other appropriate methods. Expense estimates are accrued in the period to which they relate and adjustments are made when actual amounts are known.
Annual Report
3. Significant Accounting Policies - continued
Income Tax Information and Distributions to Shareholders. Each year, each Fund intends to qualify as a regulated investment company under Subchapter M of the Internal Revenue Code, including distributing substantially all of its taxable income and realized gains. As a result, no provision for U.S. Federal income taxes is required. As of October 31, 2015, each Fund did not have any unrecognized tax benefits in the financial statements; nor is each Fund aware of any tax positions for which it is reasonably possible that the total amounts of unrecognized tax benefits will significantly change in the next twelve months. Each Fund files a U.S. federal tax return, in addition to state and local tax returns as required. Each Fund's federal income tax returns are subject to examination by the Internal Revenue Service (IRS) for a period of three fiscal years after they are filed. State and local tax returns may be subject to examination for an additional fiscal year depending on the jurisdiction. Foreign taxes are provided for based on each Fund's understanding of the tax rules and rates that exist in the foreign markets in which it invests. Fidelity Series Emerging Markets Fund and Fidelity Series International Small Cap Fund are subject to a tax imposed on capital gains by certain countries in which they invest. An estimated deferred tax liability for net unrealized appreciation on the applicable securities is included in Other payables and accrued expenses on each applicable Fund's Statement of Assets & Liabilities.
Distributions are declared and recorded on the ex-dividend date. Income dividends and capital gain distributions are declared separately for each class. Income and capital gain distributions are determined in accordance with income tax regulations, which may differ from GAAP.
Capital accounts within the financial statements are adjusted for permanent book-tax differences. These adjustments have no impact on net assets or the results of operations. Capital accounts are not adjusted for temporary book-tax differences which will reverse in a subsequent period.
Book-tax differences are primarily due to futures contracts, foreign currency transactions, certain foreign taxes, passive foreign investment companies (PFIC), partnerships, capital loss carryforwards and losses deferred due to wash sales.
Annual Report
Notes to Financial Statements - continued
3. Significant Accounting Policies - continued
Income Tax Information and Distributions to Shareholders - continued
The federal tax cost of investment securities and unrealized appreciation (depreciation) as of period end were as follows for each Fund:
| Tax cost | Gross unrealized
appreciation | Gross unrealized
depreciation | Net unrealized
appreciation
(depreciation) on
securities |
Fidelity Series Emerging Markets Fund | $ 11,783,376,570 | $ 1,347,050,584 | $ (1,440,289,303) | $ (93,238,719) |
Fidelity Series International Growth Fund | 9,919,709,234 | 3,104,443,530 | (227,180,296) | 2,877,263,234 |
Fidelity Series International Small Cap Fund | 2,112,721,227 | 766,795,543 | (140,845,766) | 625,949,777 |
Fidelity Series International Value Fund | 11,453,427,076 | 1,435,766,014 | (759,263,318) | 676,502,696 |
The tax-based components of distributable earnings as of period end were as follows for each Fund:
| Undistributed
ordinary
income | Undistributed
long-term
capital gain | Capital loss
carryforward | Net unrealized
appreciation
(depreciation) on securities and
other investments |
Fidelity Series Emerging Markets Fund | $ 129,549,443 | $ - | $ (908,192,802) | $ (93,350,845) |
Fidelity Series International Growth Fund | 145,651,124 | 259,029,593 | - | 2,877,434,183 |
Fidelity Series International Small Cap Fund | 42,492,293 | 146,692,628 | - | 625,890,075 |
Fidelity Series International Value Fund | 234,541,841 | - | (318,074,726) | 678,679,086 |
Capital loss carryforwards are only available to offset future capital gains of the Funds to the extent provided by regulations and may be limited. Under the Regulated Investment Company Modernization Act of 2010 (the Act), the Funds are permitted to carry forward capital losses incurred in taxable years beginning after December 22, 2010 for an unlimited period and such capital losses are required to be used prior to any losses that expire.
Annual Report
3. Significant Accounting Policies - continued
Income Tax Information and Distributions to Shareholders - continued
The capital loss carryforward information presented below, including any applicable limitation, is estimated as of fiscal period end and is subject to adjustment.
| No expiration | | | |
| Short-term | Long-term | Total no expiration | Total capital loss
carryfoward |
Fidelity Series Emerging Markets Fund | $ (786,915,902) | $ (121,276,901) | $ (908,192,803) | $ (908,192,803) |
Fidelity Series International Value Fund | (269,639,939) | (48,434,788) | (318,074,727) | (318,074,727) |
The tax character of distributions paid was as follows:
October 31, 2015 | | | |
| Ordinary Income | Long-term
Capital Gains | Total |
Fidelity Series Emerging
Markets Fund | $ 89,825,646 | $ - | $ 89,825,646 |
Fidelity Series International Growth Fund | 177,438,330 | 186,668,096 | 364,106,426 |
Fidelity Series International
Small Cap Fund | 31,850,159 | 33,714,014 | 65,564,173 |
Fidelity Series International
Value Fund | 519,162,017 | 371,264,934 | 890,426,951 |
October 31, 2014 | | | |
| Ordinary Income | Long-term
Capital Gains | Total |
Fidelity Series Emerging
Markets Fund | $ 85,373,110 | $ - | $ 85,373,110 |
Fidelity Series International Growth Fund | 98,329,968 | 45,984,907 | 144,314,875 |
Fidelity Series International
Small Cap Fund | 29,845,642 | 66,561,243 | 96,406,885 |
Fidelity Series International
Value Fund | 321,643,480 | - | 321,643,480 |
Delayed Delivery Transactions and When-Issued Securities. During the period, the Funds transacted in securities on a delayed delivery or when-issued basis. Payment and delivery may take place after the customary settlement period for that security. The price of the underlying securities and the date when the securities will be delivered and paid for are fixed at the time the transaction is negotiated. The securities purchased on a delayed delivery or when-issued basis are identified as such in each applicable Fund's
Annual Report
Notes to Financial Statements - continued
3. Significant Accounting Policies - continued
Delayed Delivery Transactions and When-Issued Securities - continued
Schedule of Investments. With respect to purchase commitments, each applicable Fund identifies securities as segregated in its records with a value at least equal to the amount of the commitment. Losses may arise due to changes in the value of the underlying securities or if the counterparty does not perform under the contract's terms, or if the issuer does not issue the securities due to political, economic, or other factors.
Restricted Securities. The Funds may invest in securities that are subject to legal or contractual restrictions on resale. These securities generally may be resold in transactions exempt from registration or to the public if the securities are registered. Disposal of these securities may involve time-consuming negotiations and expense, and prompt sale at an acceptable price may be difficult. Information regarding restricted securities is included at the end of each applicable Fund's Schedule of Investments.
4. Derivative Instruments.
Risk Exposures and the Use of Derivative Instruments. The Funds' investment objective allows the Funds to enter into various types of derivative contracts, including futures contracts. Derivatives are investments whose value is primarily derived from underlying assets, indices or reference rates and may be transacted on an exchange or over-the-counter (OTC). Derivatives may involve a future commitment to buy or sell a specified asset based on specified terms, to exchange future cash flows at periodic intervals based on a notional principal amount, or for one party to make one or more payments upon the occurrence of specified events in exchange for periodic payments from the other party.
The Funds used derivatives to increase returns and to manage exposure to certain risks as defined below. The success of any strategy involving derivatives depends on analysis of numerous economic factors, and if the strategies for investment do not work as intended, the Funds may not achieve their objectives.
The Funds' use of derivatives increased or decreased their exposure to the following risk:
Equity Risk | Equity risk relates to the fluctuations in the value of financial instruments as a result of changes in market prices (other than those arising from interest rate risk or foreign exchange risk), whether caused by factors specific to an individual investment, its issuer, or all factors affecting all instruments traded in a market or market segment. |
Annual Report
4. Derivative Instruments - continued
Risk Exposures and the Use of Derivative Instruments - continued
The Funds are also exposed to additional risks from investing in derivatives, such as liquidity risk and counterparty credit risk. Liquidity risk is the risk that the Funds will be unable to close out the derivative in the open market in a timely manner. Counterparty credit risk is the risk that the counterparty will not be able to fulfill its obligation to the Funds. Counterparty credit risk related to exchange-traded futures contracts may be mitigated by the protection provided by the exchange on which they trade.
Investing in derivatives may involve greater risks than investing in the underlying assets directly and, to varying degrees, may involve risk of loss in excess of any initial investment and collateral received and amounts recognized in the Statement of Assets and Liabilities. In addition, there may be the risk that the change in value of the derivative contract does not correspond to the change in value of the underlying instrument.
Futures Contracts. A futures contract is an agreement between two parties to buy or sell a specified underlying instrument for a fixed price at a specified future date. The Funds used futures contracts to manage their exposure to the stock market.
Upon entering into a futures contract, a fund is required to deposit either cash or securities (initial margin) with a clearing broker in an amount equal to a certain percentage of the face value of the contract. Futures contracts are marked-to-market daily and subsequent daily payments (variation margin) are made or received by a fund depending on the daily fluctuations in the value of the futures contracts and are recorded as unrealized appreciation or (depreciation). This receivable and/or payable, if any, is included in daily variation margin for derivative instruments in the Statement of Assets and Liabilities. Realized gain or (loss) is recorded upon the expiration or closing of a futures contract. The net realized gain (loss) and change in net unrealized appreciation (depreciation) on futures contracts during the period is included in the Statement of Operations.
Any open futures contracts at period end are presented in the Schedule of Investments under the caption "Futures Contracts". The underlying face amount at value reflects each contract's exposure to the underlying instrument or index at period end. Cash deposited to meet initial margin requirements is presented as segregated cash with brokers for derivative instruments in the Statement of Assets and Liabilities.
During the period the Fidelity Series Emerging Markets Fund recognized net realized gain (loss) of $(57,461,053) and a change in net unrealized appreciation (depreciation) of $(2,742,877) related to its investment in futures contracts. These amounts are included in the Statement of Operations.
Annual Report
Notes to Financial Statements - continued
5. Purchases and Sales of Investments.
Purchases and sales of securities, other than short-term securities, are noted in the table below.
| Purchases ($) | Sales ($) |
Fidelity Series Emerging Markets Fund | 10,186,085,424 | 6,835,844,346 |
Fidelity Series International Growth Fund | 2,897,009,841 | 3,948,704,506 |
Fidelity Series International Small Cap Fund | 448,719,495 | 767,222,486 |
Fidelity Series International Value Fund | 5,370,271,729 | 5,532,409,562 |
6. Fees and Other Transactions with Affiliates.
Management Fee. Fidelity Management & Research Company (the investment adviser) and its affiliates provide the Funds with investment management related services for which the Funds pay a monthly management fee. The management fee is the sum of an individual fund fee rate and an annualized group fee rate. The individual fund fee rate is applied to each Fund's average net assets. The group fee rate is based upon the average net assets of all the mutual funds advised by the investment adviser, including any mutual funds previously advised by the investment adviser that are currently advised by Fidelity SelectCo, LLC, an affiliate of the investment adviser. The group fee rate decreases as assets under management increase and increases as assets under management decrease. In addition, the management fee for Fidelity Series International Growth Fund, Fidelity Series International Small Cap Fund, Fidelity Series International Value Fund is subject to a performance adjustment (up to a maximum of ± .20% of each applicable Fund's average net assets over a 36 month performance period.) The upward or downward adjustment to the management fee is based on each fund's relative investment performance of the asset-weighted return of all classes as compared to its benchmark index over the same 36 month performance period. For the reporting period, each Fund's annual management fee rate expressed as a percentage of each Fund's average net assets, including the performance adjustment, if applicable was as follows. The performance adjustment included in the management fee rate may be higher or lower than the maximum performance adjustment rate due to the difference between the average net asset for the reporting and performance periods.
| Individual Rate | Group Rate | Total |
Fidelity Series Emerging Markets Fund | .55% | .25% | .80% |
Fidelity Series International Growth Fund | .45% | .25% | .72% |
Fidelity Series International Small Cap Fund | .60% | .25% | .88% |
Fidelity Series International Value Fund | .45% | .25% | .71% |
Annual Report
6. Fees and Other Transactions with Affiliates - continued
Management Fee - continued
| Performance Benchmark |
Fidelity Series International Growth Fund | MSCI EAFE Growth Index |
Fidelity Series International Small Cap Fund | MSCI EAFE Small Cap Index |
Fidelity Series International Value Fund | MSCI EAFE Value Index |
Transfer Agent Fees. Fidelity Investments Institutional Operations Company, Inc., (FIIOC), an affiliate of the investment adviser, is the transfer, dividend disbursing and shareholder servicing agent for each class of the Funds. FIIOC receives account fees and asset-based fees that vary according to the account size and type of account of the shareholders of the respective classes of each Fund, except for Class F. FIIOC receives no fees for providing transfer agency services to Class F. FIIOC pays for typesetting, printing and mailing of shareholder reports, except proxy statements. For the period, transfer agent fees for each applicable class were as follows:
Fidelity Series Emerging Markets Fund | Amount | % of
Class-Level Average
Net Assets |
Series Emerging Markets | $ 8,729,015 | .16 |
Fidelity Series International Growth Fund | | |
Series International Growth | 9,807,217 | .16 |
Fidelity Series International Small Cap Fund | | |
Series International Small Cap | 2,230,479 | .17 |
Fidelity Series International Value Fund | | |
Series International Value | 9,677,334 | .16 |
Accounting and Security Lending Fees. Fidelity Service Company, Inc. (FSC), an affiliate of the investment adviser, maintains each Fund's accounting records. The accounting fee is based on the level of average net assets for each month. Under a separate contract, FSC administers the security lending program. The security lending fee is based on the number and duration of lending transactions.
Brokerage Commissions. Certain Funds placed a portion of their portfolio transactions with brokerage firms which are affiliates of the investment adviser. Brokerage commissions are included in net realized gain (loss) and change in net unrealized appreciation (depreciation) in the Statement of Operations. The commissions paid to these affiliated firms were as follows:
| Amount |
Fidelity Series Emerging Markets Fund | $ 65,952 |
Fidelity Series International Growth Fund | 5,133 |
Fidelity Series International Small Cap Fund | 898 |
Fidelity Series International Value Fund | 7,796 |
Annual Report
Notes to Financial Statements - continued
6. Fees and Other Transactions with Affiliates - continued
Interfund Lending Program. Pursuant to an Exemptive Order issued by the SEC, the Funds, along with other registered investment companies having management contracts with FMR or other affiliated entities of FMR, may participate in an interfund lending program. This program provides an alternative credit facility allowing the funds to borrow from, or lend money to, other participating affiliated funds. At period end there were no interfund loans outstanding. Each applicable fund's activity in this program during the period for which loans were outstanding was as follows:
| Borrower or
Lender | Average Loan
Balance | Weighted
Average
Interest Rate | Interest
Expense |
Fidelity Series International Small Cap Fund | Borrower | $ 9,857,750 | .35% | $ 760 |
Fidelity Series International Value Fund | Borrower | $ 39,489,500 | .35% | $ 1,545 |
Other. During the period, the investment adviser reimbursed the Funds for certain losses as follows:
| Amount |
Fidelity Series Emerging Markets Fund | $ 7,749 |
Fidelity Series International Small Cap Fund | 23,635 |
Fidelity Series International Value Fund | 3,022 |
7. Committed Line of Credit.
Certain Funds participate with other funds managed by the investment adviser or an affiliate in a $4.25 billion credit facility (the "line of credit") to be utilized for temporary or emergency purposes to fund shareholder redemptions or for other short-term liquidity purposes. The participating funds have agreed to pay commitment fees on their pro-rata portion of the line of credit, which are reflected in Miscellaneous expenses on the Statement of Operations, and are as follows:
Fidelity Series Emerging Markets Fund | $ 15,659 |
Fidelity Series International Growth Fund | 18,092 |
Fidelity Series International Small Cap Fund | 4,096 |
Fidelity Series International Value Fund | 17,881 |
During the period, the Funds did not borrow on this line of credit.
Annual Report
8. Security Lending.
Certain Funds lend portfolio securities through a lending agent from time to time in order to earn additional income. For equity securities, a lending agent is used and may loan securities to certain qualified borrowers, including Fidelity Capital Markets (FCM), a broker-dealer affiliated with the Funds. On the settlement date of the loan, each applicable Fund receives collateral (in the form of U.S. Treasury obligations, letters of credit and/or cash) against the loaned securities and maintains collateral in an amount not less than 100% of the market value of the loaned securities during the period of the loan. The market value of the loaned securities is determined at the close of business of the Funds and any additional required collateral is delivered to the Funds on the next business day. The Funds or borrower may terminate the loan at any time, and if the borrower defaults on its obligation to return the securities loaned because of insolvency or other reasons, the Funds may apply collateral received from the borrower against the obligation. The Funds may experience delays and costs in recovering the securities loaned. Any cash collateral received is invested in the Fidelity Securities Lending Cash Central Fund. The value of loaned securities and cash collateral at period end are disclosed on each applicable Fund's Statement of Assets and Liabilities. Security lending income represents the income earned on investing cash collateral, less rebates paid to borrowers and any lending agent fees associated with the loan, plus any premium payments received for lending certain types of securities. Security lending income is presented on each applicable Fund's Statement of Operations as a component of income from Fidelity Central Funds. FCM security lending activity was as follows:
| Total Security
Lending
Income | Security Lending
Income From
Securities
Loaned to FCM | Value of
Securities
Loaned to FCM
at Period End |
Fidelity Series Emerging Markets Fund | $ 615,140 | $ 2,967 | $ 4,247,250 |
Fidelity Series International Growth Fund | $ 2,654,510 | $ 19,420 | $ 12,160,372 |
Fidelity Series International Small Cap Fund | $ 518,082 | $ 24,266 | $ - |
Fidelity Series International Value Fund | $ 7,952,590 | $ 15 | $ - |
9. Expense Reductions.
Commissions paid to certain brokers with whom the investment adviser, or its affiliates, places trades on behalf of Certain Funds include an amount in addition to trade execution, which may be rebated back to the Funds to offset certain expenses. In addition, through arrangements with each applicable Fund's custodian, credits realized as a result
Annual Report
Notes to Financial Statements - continued
9. Expense Reductions - continued
of certain uninvested cash balances were used to reduce the Fund's expenses. All of the applicable expense reductions are noted in the table below.
| Brokerage Service
reduction | Custody
Expense
reduction |
Fidelity Series Emerging Markets Fund | $ 1,021,034 | $ 603 |
Fidelity Series International Growth Fund | 480,022 | 26 |
Fidelity Series International Small Cap Fund | 78,560 | - |
Fidelity Series International Value Fund | 960,190 | 46 |
In addition, during the period the investment adviser reimbursed and/or waived a portion of fund-level operating expenses and a portion of class-level operating expenses as follows:
| Fund-Level Amount |
Fidelity Series Emerging Markets Fund | $ 47,291 |
Fidelity Series International Growth Fund | 51,176 |
Fidelity Series International Small Cap Fund | 12,004 |
Fidelity Series International Value Fund | 50,834 |
| Class-Level Amount |
Fidelity Series Emerging Markets Fund | |
Series Emerging Markets | $ 94,446 |
Fidelity Series International Growth Fund | |
Series International Growth | 136,716 |
Fidelity Series International Small Cap Fund | |
Series International Small Cap | 29,705 |
Fidelity Series International Value Fund | |
Series International Value | 136,642 |
10. Distributions to Shareholders.
Distributions to shareholders of each class were as follows:
Years ended October 31, | 2015 | 2014 |
Fidelity Series Emerging Markets Fund | | |
From net investment income | | |
Series Emerging Markets | $ 39,027,374 | $ 38,549,457 |
Class F | 50,798,272 | 44,053,623 |
Total | $ 89,825,646 | $ 82,603,080 |
Annual Report
10. Distributions to Shareholders - continued
Years ended October 31, | 2015 | 2014 |
Fidelity Series Emerging Markets Fund | | |
From net realized gain | | |
Series Emerging Markets | $ - | $ 1,393,354 |
Class F | - | 1,376,676 |
Total | $ - | $ 2,770,030 |
Fidelity Series International Growth Fund | | |
From net investment income | | |
Series International Growth | $ 78,746,368 | $ 44,982,373 |
Class F | 98,691,962 | 53,347,595 |
Total | $ 177,438,330 | $ 98,329,968 |
From net realized gain | | |
Series International Growth | $ 88,907,190 | $ 23,186,790 |
Class F | 97,760,906 | 22,798,117 |
Total | $ 186,668,096 | $ 45,984,907 |
Fidelity Series International Small Cap Fund | | |
From net investment income | | |
Series International Small Cap | $ 12,140,821 | $ 10,579,671 |
Class F | 16,429,056 | 12,074,681 |
Total | $ 28,569,877 | $ 22,654,352 |
From net realized gain | | |
Series International Small Cap | $ 17,604,190 | $ 37,028,847 |
Class F | 19,390,106 | 36,723,686 |
Total | $ 36,994,296 | $ 73,752,533 |
Fidelity Series International Value Fund | | |
From net investment income | | |
Series International Value | $ 241,458,154 | $ 136,444,048 |
Class F | 277,703,863 | 144,056,322 |
Total | $ 519,162,017 | $ 280,500,370 |
From net realized gain | | |
Series International Value | $ 176,811,463 | $ 20,725,678 |
Class F | 194,453,471 | 20,417,432 |
Total | $ 371,264,934 | $ 41,143,110 |
Annual Report
Notes to Financial Statements - continued
11. Share Transactions.
Transactions for each class of shares were as follows:
| Shares | Dollars |
Years ended October 31, | 2015 | 2014 | 2015 | 2014 |
Fidelity Series Emerging Markets Fund | | | | |
Series Emerging Markets | | | | |
Shares sold | 123,959,808 | 92,426,382 | $ 2,044,867,266 | $ 1,645,786,227 |
Reinvestment of distributions | 2,286,314 | 2,310,168 | 39,027,374 | 39,942,811 |
Shares redeemed | (34,411,277) | (28,925,774) | (566,233,556) | (505,237,270) |
Net increase (decrease) | 91,834,845 | 65,810,776 | $ 1,517,661,084 | $ 1,180,491,768 |
Class F | | | | |
Shares sold | 153,928,469 | 119,603,499 | $ 2,538,996,172 | $ 2,144,127,127 |
Reinvestment of distributions | 2,968,923 | 2,622,996 | 50,798,272 | 45,430,299 |
Shares redeemed | (36,125,669) | (28,307,280) | (608,068,321) | (494,527,855) |
Net increase (decrease) | 120,771,723 | 93,919,215 | $ 1,981,726,123 | $ 1,695,029,571 |
Fidelity Series International Growth Fund | | | | |
Series International Growth | | | | |
Shares sold | 25,324,796 | 111,100,310 | $ 359,926,491 | $ 1,551,845,942 |
Reinvestment of distributions | 12,078,787 | 4,921,961 | 167,653,558 | 68,169,163 |
Shares redeemed | (74,712,848) | (93,568,720) | (1,062,121,684) | (1,326,687,201) |
Net increase (decrease) | (37,309,265) | 22,453,551 | $ (534,541,635) | $ 293,327,904 |
Class F | | | | |
Shares sold | 48,332,641 | 144,005,124 | $ 686,631,779 | $ 2,024,480,402 |
Reinvestment of distributions | 14,123,139 | 5,489,958 | 196,452,868 | 76,145,712 |
Shares redeemed | (75,307,908) | (82,443,810) | (1,080,512,061) | (1,173,189,085) |
Net increase (decrease) | (12,852,128) | 67,051,272 | $ (197,427,414) | $ 927,437,029 |
Fidelity Series International Small Cap Fund | | | | |
Series International Small Cap | | | | |
Shares sold | 6,213,162 | 27,564,831 | $ 98,321,887 | $ 428,962,557 |
Reinvestment of distributions | 2,000,337 | 3,165,460 | 29,745,011 | 47,608,518 |
Shares redeemed | (16,436,223) | (17,122,638) | (261,823,586) | (270,568,578) |
Net increase (decrease) | (8,222,724) | 13,607,653 | $ (133,756,688) | $ 206,002,497 |
Annual Report
11. Share Transactions - continued
| Shares | Dollars |
Years ended October 31, | 2015 | 2014 | 2015 | 2014 |
Fidelity Series International Small Cap Fund | | | | |
Class F | | | | |
Shares sold | 11,766,506 | 33,881,109 | $ 186,255,220 | $ 531,825,078 |
Reinvestment of distributions | 2,405,585 | 3,238,113 | 35,819,162 | 48,798,367 |
Shares redeemed | (17,677,411) | (14,508,461) | (284,052,775) | (230,898,955) |
Net increase (decrease) | (3,505,320) | 22,610,761 | $ (61,978,393) | $ 349,724,490 |
Fidelity Series International Value Fund | | | | |
Series International Value | | | | |
Shares sold | 51,219,354 | 144,202,227 | $ 514,770,315 | $ 1,593,743,427 |
Reinvestment of distributions | 41,826,962 | 14,552,752 | 418,269,617 | 157,169,726 |
Shares redeemed | (89,083,944) | (114,686,628) | (900,543,214) | (1,270,496,899) |
Net increase (decrease) | 3,962,372 | 44,068,351 | $ 32,496,718 | $ 480,416,254 |
Class F | | | | |
Shares sold | 89,487,681 | 185,652,636 | $ 902,577,936 | $ 2,061,243,349 |
Reinvestment of distributions | 47,121,490 | 15,200,901 | 472,157,334 | 164,473,754 |
Shares redeemed | (90,319,635) | (101,157,768) | (919,744,396) | (1,123,062,495) |
Net increase (decrease) | 46,289,536 | 99,695,769 | $ 454,990,874 | $ 1,102,654,608 |
12. Other.
The Funds' organizational documents provide former and current trustees and officers with a limited indemnification against liabilities arising in connection with the performance of their duties to the Funds. In the normal course of business, the Funds may also enter into contracts that provide general indemnifications. The Funds' maximum exposure under these arrangements is unknown as this would be dependent on future claims that may be made against the Funds. The risk of material loss from such claims is considered remote.
At the end of the period, mutual funds managed by the investment adviser or its affiliates were the owners of record of all of the outstanding shares of the Funds.
Annual Report
To the Trustees of Fidelity Investment Trust and the Shareholders of Fidelity Series International Growth Fund:
In our opinion, the accompanying statement of assets and liabilities, including the schedule of investments, and the related statements of operations and of changes in net assets and the financial highlights present fairly, in all material respects, the financial position of Fidelity Series International Growth Fund (fund of Fidelity Investment Trust) at October 31, 2015, the results of its operations for the year then ended, the changes in its net assets for each of the two years in the period then ended and the financial highlights for each of the five years in the period then ended, in conformity with accounting principles generally accepted in the United States of America. These financial statements and financial highlights (hereafter referred to as "financial statements") are the responsibility of the Fidelity Series International Growth Fund's management. Our responsibility is to express an opinion on these financial statements based on our audits. We conducted our audits of these financial statements in accordance with the standards of the Public Company Accounting Oversight Board (United States). Those standards require that we plan and perform the audit to obtain reasonable assurance about whether the financial statements are free of material misstatement. An audit includes examining, on a test basis, evidence supporting the amounts and disclosures in the financial statements, assessing the accounting principles used and significant estimates made by management, and evaluating the overall financial statement presentation. We believe that our audits, which included confirmation of securities at October 31, 2015 by correspondence with the custodian and brokers, provide a reasonable basis for our opinion.
PricewaterhouseCoopers LLP
Boston, Massachusetts
December 21, 2015
Annual Report
Report of Independent Registered Public Accounting Firm
To the Trustees of Fidelity Investment Trust and the Shareholders of Fidelity Series Emerging Markets Fund, Fidelity Series International Small Cap Fund and Fidelity Series International Value Fund:
We have audited the accompanying statements of assets and liabilities of Fidelity Series Emerging Markets Fund, Fidelity Series International Small Cap Fund and Fidelity Series International Value Fund (funds of Fidelity Investment Trust), including the schedules of investments, as of October 31, 2015, and the related statements of operations for the year then ended, the statements of changes in net assets for each of the two years in the period then ended, and the financial highlights for each of the five years in the period then ended. These financial statements and financial highlights are the responsibility of the Funds' management. Our responsibility is to express an opinion on these financial statements and financial highlights based on our audits.
We conducted our audits in accordance with the standards of the Public Company Accounting Oversight Board (United States). Those standards require that we plan and perform the audit to obtain reasonable assurance about whether the financial statements and financial highlights are free of material misstatement. The Funds are not required to have, nor were we engaged to perform, an audit of their internal control over financial reporting. Our audits included consideration of internal control over financial reporting as a basis for designing audit procedures that are appropriate in the circumstances, but not for the purpose of expressing an opinion on the effectiveness of the Funds' internal control over financial reporting. Accordingly, we express no such opinion. An audit also includes examining, on a test basis, evidence supporting the amounts and disclosures in the financial statements, assessing the accounting principles used and significant estimates made by management, as well as evaluating the overall financial statement presentation. Our procedures included confirmation of securities owned as of October 31, 2015, by correspondence with the custodians and brokers; when replies were not received from brokers, we performed other auditing procedures. We believe that our audits provide a reasonable basis for our opinion.
In our opinion, such financial statements and financial highlights referred to above present fairly, in all material respects, the financial position of Fidelity Series Emerging Markets Fund, Fidelity Series International Small Cap Fund and Fidelity Series International Value Fund as of October 31, 2015, the results of their operations for the year then ended, the changes in their net assets for each of the two years in the period then ended, and the financial highlights for each of the five years in the period then ended, in conformity with accounting principles generally accepted in the United States of America.
DELOITTE & TOUCHE LLP
Boston, Massachusetts
December 21, 2015
Annual Report
The Trustees, Member of the Advisory Board, and officers of the trust and funds, as applicable, are listed below. The Board of Trustees governs each fund and is responsible for protecting the interests of shareholders. The Trustees are experienced executives who meet periodically throughout the year to oversee each fund's activities, review contractual arrangements with companies that provide services to each fund, oversee management of the risks associated with such activities and contractual arrangements, and review each fund's performance. Each of the Trustees oversees 170 funds.
The Trustees hold office without limit in time except that (a) any Trustee may resign; (b) any Trustee may be removed by written instrument, signed by at least two-thirds of the number of Trustees prior to such removal; (c) any Trustee who requests to be retired or who has become incapacitated by illness or injury may be retired by written instrument signed by a majority of the other Trustees; and (d) any Trustee may be removed at any special meeting of shareholders by a two-thirds vote of the outstanding voting securities of the trust. Each Trustee who is not an interested person (as defined in the 1940 Act) of the trust and the funds (Independent Trustee), shall retire not later than the last day of the calendar year in which his or her 75th birthday occurs. The Independent Trustees may waive this mandatory retirement age policy with respect to individual Trustees. The officers and Advisory Board Member hold office without limit in time, except that any officer and Advisory Board Member may resign or may be removed by a vote of a majority of the Trustees at any regular meeting or any special meeting of the Trustees. Except as indicated, each individual has held the office shown or other offices in the same company for the past five years.
Experience, Skills, Attributes, and Qualifications of the Funds' Trustees. The Governance and Nominating Committee has adopted a statement of policy that describes the experience, qualifications, attributes, and skills that are necessary and desirable for potential Independent Trustee candidates (Statement of Policy). The Board believes that each Trustee satisfied at the time he or she was initially elected or appointed a Trustee, and continues to satisfy, the standards contemplated by the Statement of Policy. The Governance and Nominating Committee also engages professional search firms to help identify potential Independent Trustee candidates who have the experience, qualifications, attributes, and skills consistent with the Statement of Policy. From time to time, additional criteria based on the composition and skills of the current Independent Trustees, as well as experience or skills that may be appropriate in light of future changes to board composition, business conditions, and regulatory or other developments, have also been considered by the professional search firms and the Governance and Nominating Committee. In addition, the Board takes into account the Trustees' commitment and participation in Board and committee meetings, as well as their leadership of standing and ad hoc committees throughout their tenure.
In determining that a particular Trustee was and continues to be qualified to serve as a Trustee, the Board has considered a variety of criteria, none of which, in isolation, was controlling. The Board believes that, collectively, the Trustees have balanced and diverse experience, qualifications, attributes, and skills, which allow the Board to operate effectively in governing each fund and protecting the interests of shareholders. Information about the specific experience, skills, attributes, and qualifications of each Trustee, which in each case led to the Board's conclusion that the Trustee should serve (or continue to serve) as a trustee of the funds, is provided below.
Annual Report
Board Structure and Oversight Function. James C. Curvey is an interested person (as defined in the 1940 Act) and currently serves as Chairman. The Trustees have determined that an interested Chairman is appropriate and benefits shareholders because an interested Chairman has a personal and professional stake in the quality and continuity of services provided to the funds. Independent Trustees exercise their informed business judgment to appoint an individual of their choosing to serve as Chairman, regardless of whether the Trustee happens to be independent or a member of management. The Independent Trustees have determined that they can act independently and effectively without having an Independent Trustee serve as Chairman and that a key structural component for assuring that they are in a position to do so is for the Independent Trustees to constitute a substantial majority for the Board. The Independent Trustees also regularly meet in executive session. Ned C. Lautenbach serves as Chairman of the Independent Trustees and as such (i) acts as a liaison between the Independent Trustees and management with respect to matters important to the Independent Trustees and (ii) with management prepares agendas for Board meetings.
Fidelity funds are overseen by different Boards of Trustees. The funds' Board oversees Fidelity's high income and certain equity funds, and other Boards oversee Fidelity's investment-grade bond, money market, asset allocation, and sector funds. The asset allocation funds may invest in Fidelity funds overseen by the funds' Board. The use of separate Boards, each with its own committee structure, allows the Trustees of each group of Fidelity funds to focus on the unique issues of the funds they oversee, including common research, investment, and operational issues. On occasion, the separate Boards establish joint committees to address issues of overlapping consequences for the Fidelity funds overseen by each Board.
The Trustees operate using a system of committees to facilitate the timely and efficient consideration of all matters of importance to the Trustees, each fund, and fund shareholders and to facilitate compliance with legal and regulatory requirements and oversight of the funds' activities and associated risks. The Board, acting through its committees, has charged FMR and its affiliates with (i) identifying events or circumstances the occurrence of which could have demonstrably adverse effects on the funds' business and/or reputation; (ii) implementing processes and controls to lessen the possibility that such events or circumstances occur or to mitigate the effects of such events or circumstances if they do occur; and (iii) creating and maintaining a system designed to evaluate continuously business and market conditions in order to facilitate the identification and implementation processes described in (i) and (ii) above. Because the day-to-day operations and activities of the funds are carried out by or through FMR, its affiliates and other service providers, the funds' exposure to risks is mitigated but not eliminated by the processes overseen by the Trustees. While each of the Board's committees has responsibility for overseeing different aspects of the funds' activities, oversight is exercised primarily through the Operations, Audit, and Compliance Committees. In addition, the Independent Trustees have worked with FMR to enhance the Board's oversight of investment and financial risks, legal and regulatory risks, technology risks, and operational risks, including the development of additional risk reporting to the Board. For example, a working group comprised of Independent Trustees and FMR has worked and continues to work to review the Fidelity funds' valuation-related activities, reporting and risk management. Appropriate personnel, including but not limited to the funds' Chief Compliance Officer (CCO), FMR's internal auditor, the independent accountants, the funds' Treasurer and portfolio management personnel, make periodic reports to the Board's committees, as appropriate, including an annual review of Fidelity's risk management program for the Fidelity funds. The responsibilities of each standing committee, including their oversight responsibilities, are described further under "Standing Committees of the Funds' Trustees."
Annual Report
Trustees and Officers - continued
The funds' Statements of Additional Information (SAIs) include more information about the Trustees. To request a free copy, call Fidelity at 1-800-544-8544 for Fidelity Series Emerging Markets Fund, Fidelity Series International Growth Fund, Fidelity Series International Small Cap Fund, and Fidelity Series International Value Fund or 1-800-835-5092 for Class F.
Interested Trustees*:
Correspondence intended for each Trustee who is an interested person may be sent to Fidelity Investments, 245 Summer Street, Boston, Massachusetts 02210.
Name, Year of Birth; Principal Occupations and Other Relevant Experience+ |
James C. Curvey (1935) |
Year of Election or Appointment: 2007 Trustee Chairman of the Board of Trustees |
| Mr. Curvey also serves as Trustee of other Fidelity funds. Mr. Curvey is a Director of Fidelity Research & Analysis Co. (investment adviser firm, 2009-present), and Vice Chairman (2007-present) and Director of FMR LLC (diversified financial services company). In addition, Mr. Curvey serves as an Overseer for the Boston Symphony Orchestra and a member of the board of Artis-Naples, Naples, Florida, and as a Trustee for Brewster Academy, Wolfeboro, New Hampshire. Previously, Mr. Curvey served as a Director of Fidelity Investments Money Management, Inc. (investment adviser firm, 2009-2014) and a Director of FMR and FMR Co., Inc. (investment adviser firms, 2007-2014). |
Charles S. Morrison (1960) |
Year of Election or Appointment: 2014 Trustee |
| Mr. Morrison also serves as Trustee of other funds. He serves as a Director of Fidelity Investments Money Management, Inc. (FIMM) (investment adviser firm, 2014-present), Director of Fidelity SelectCo, LLC (investment adviser firm, 2014-present), President, Asset Management (2014-present), and is an employee of Fidelity Investments. Previously, Mr. Morrison served as Vice President of Fidelity's Fixed Income and Asset Allocation Funds (2012-2014), President, Fixed Income (2011-2014), Vice President of Fidelity's Money Market Funds (2005-2009), President, Money Market Group Leader of FMR (investment adviser firm, 2009), and Senior Vice President, Money Market Group of FMR (2004-2009). Mr. Morrison also served as Vice President of Fidelity's Bond Funds (2002-2005), certain Balanced Funds (2002-2005), and certain Asset Allocation Funds (2002-2007), and as Senior Vice President (2002-2005) of Fidelity's Bond Division. |
* Trustees have been determined to be "Interested Trustees" by virtue of, among other things, their affiliation with the trust or various entities under common control with FMR.
+ The information above includes each Trustee's principal occupation during the last five years and other information relating to the experience, attributes, and skills relevant to each Trustee's qualifications to serve as a Trustee, which led to the conclusion that each Trustee should serve as a Trustee for each fund.
Annual Report
Trustees and Officers - continued
Independent Trustees:
Correspondence intended for each Independent Trustee (that is, the Trustees other than the Interested Trustees) may be sent to Fidelity Investments, P.O. Box 55235, Boston, Massachusetts 02205-5235.
Name, Year of Birth; Principal Occupations and Other Relevant Experience+ |
Dennis J. Dirks (1948) |
Year of Election or Appointment: 2005 Trustee |
| Mr. Dirks also serves as Trustee of other Fidelity funds. Prior to his retirement in May 2003, Mr. Dirks was Chief Operating Officer and a member of the Board of The Depository Trust & Clearing Corporation (DTCC). He also served as President, Chief Operating Officer, and Board member of The Depository Trust Company (DTC) and President and Board member of the National Securities Clearing Corporation (NSCC). In addition, Mr. Dirks served as Chief Executive Officer and Board member of the Government Securities Clearing Corporation, Chief Executive Officer and Board member of the Mortgage-Backed Securities Clearing Corporation, as a Trustee and a member of the Finance Committee of Manhattan College (2005-2008), as a Trustee and a member of the Finance Committee of AHRC of Nassau County (2006-2008), and as a member of the Independent Directors Council (IDC) Governing Council (2010-2015). Mr. Dirks is a member of the Board of Directors for The Brookville Center for Children's Services, Inc. (2009-present). |
Alan J. Lacy (1953) |
Year of Election or Appointment: 2008 Trustee |
| Mr. Lacy also serves as Trustee of other Fidelity funds. Mr. Lacy serves as a member of the Board of Directors of Dave & Buster's Entertainment, Inc. (restaurant and entertainment complexes, 2010-present) and Bristol-Myers Squibb Company (global pharmaceuticals, 2008-present). In addition, Mr. Lacy served as Senior Adviser (2007-2014) of Oak Hill Capital Partners, L.P. (private equity) and also served as Chief Executive Officer (2000-2005) and Vice Chairman (2005-2006) of Sears Holdings Corporation and Sears, Roebuck and Co. (retail). Mr. Lacy is a member of the Board of Trustees of The National Parks Conservation Association (2006-present). Previously, Mr. Lacy served as Chairman of the Board of Trustees of the National Parks Conservation Association (2008-2011) and as a member of the Board of Directors for The Western Union Company (global money transfer, 2006-2011), The Hillman Companies, Inc. (hardware wholesalers, 2010-2014), and Earth Fare, Inc. (retail grocery, 2010-2014). |
Ned C. Lautenbach (1944) |
Year of Election or Appointment: 2000 Trustee Chairman of the Independent Trustees |
| Mr. Lautenbach also serves as Trustee of other Fidelity funds. Mr. Lautenbach currently serves as the Lead Director of the Eaton Corporation Board of Directors (diversified industrial, 1997-present). Mr. Lautenbach is Chairman of the Board of Directors of Artis-Naples in Naples, Florida (2012-present), a member of the Council on Foreign Relations (1994-present), and a member of the Board of Governors, State University System of Florida (2013-present). Previously, Mr. Lautenbach was a Partner/Advisory Partner at Clayton, Dubilier & Rice, LLC (private equity investment, 1998-2010), as well as a Director of Sony Corporation (2006-2007). |
Joseph Mauriello (1944) |
Year of Election or Appointment: 2008 Trustee |
| Mr. Mauriello also serves as Trustee of other Fidelity funds. Prior to his retirement in January 2006, Mr. Mauriello served in numerous senior management positions including Deputy Chairman and Chief Operating Officer (2004-2005), and Vice Chairman of Financial Services (2002-2004) of KPMG LLP US (professional services, 1965-2005). Mr. Mauriello currently serves as a member of the Board of Directors of XL Group plc. (global insurance and re-insurance, 2006-present) and the Independent Directors Council (IDC) Governing Council (2015-present). Previously, Mr. Mauriello served as a Director of the Hamilton Funds of the Bank of New York (2006-2007) and of Arcadia Resources Inc. (health care services and products, 2007-2012). |
Robert W. Selander (1950) |
Year of Election or Appointment: 2011 Trustee |
| Mr. Selander also serves as Trustee of other Fidelity funds. Mr. Selander serves as a Director of The Western Union Company (global money transfer, 2014-present). Previously, Mr. Selander served as a Member of the Advisory Board of other Fidelity funds (2011), and Executive Vice Chairman (2010), Chief Executive Officer (2009-2010), and President and Chief Executive Officer (1997-2009) of Mastercard, Inc. |
Cornelia M. Small (1944) |
Year of Election or Appointment: 2005 Trustee |
| Ms. Small also serves as Trustee of other Fidelity funds. Ms. Small is a member of the Board of Directors (2009-present) and Chair of the Investment Committee (2010-present) of the Teagle Foundation. Ms. Small also serves on the Investment Committee of the Berkshire Taconic Community Foundation (2008-present). Previously, Ms. Small served as Chairperson (2002-2008) and a member of the Investment Committee and Chairperson (2008-2012) and a member of the Board of Trustees of Smith College. In addition, Ms. Small served as Chief Investment Officer, Director of Global Equity Investments, and a member of the Board of Directors of Scudder, Stevens & Clark and Scudder Kemper Investments. |
William S. Stavropoulos (1939) |
Year of Election or Appointment: 2001 Trustee Vice Chairman of the Independent Trustees |
| Mr. Stavropoulos also serves as Trustee of other Fidelity funds. Mr. Stavropoulos serves as President and Founder of the Michigan Baseball Foundation, the Great Lakes Loons (2007-present). Mr. Stavropoulos is Chairman Emeritus of the Board of Directors of The Dow Chemical Company, where he previously served in numerous senior management positions, including President, CEO (1995-2000; 2002-2004), Chairman of the Executive Committee (2000-2006), and as a member of the Board of Directors (1990-2006). Currently, Mr. Stavropoulos is Chairman of the Board of Directors of Univar Inc. (global distributor of commodity and specialty chemicals), a Director of Teradata Corporation (data warehousing and technology solutions), and Maersk Inc. (industrial conglomerate), and a member of the Advisory Board for Metalmark Capital LLC (private equity investment, 2005-present). Mr. Stavropoulos is an operating advisor to Clayton, Dubilier & Rice, LLC (private equity investment). In addition, Mr. Stavropoulos is a member of the University of Notre Dame Advisory Council for the College of Science, a Trustee of the Rollin L. Gerstacker Foundation, and a Director of the Naples Philharmonic Center for the Arts. Previously, Mr. Stavropoulos served as a Director of Chemical Financial Corporation (bank holding company, 1993-2012) and Tyco International, Ltd. (multinational manufacturing and services, 2007-2012). |
David M. Thomas (1949) |
Year of Election or Appointment: 2008 Trustee |
| Mr. Thomas also serves as Trustee of other Fidelity funds. Mr. Thomas serves as Non-Executive Chairman of the Board of Directors of Fortune Brands Home and Security (home and security products, 2011-present), as a member of the Board of Directors (2004-present) and Presiding Director (2013-present) of Interpublic Group of Companies, Inc. (marketing communication), and as a member of the Board of Trustees of the University of Florida (2013-present). Previously, Mr. Thomas served as Executive Chairman (2005-2006) and Chairman and Chief Executive Officer (2000-2005) of IMS Health, Inc. (pharmaceutical and healthcare information solutions), and a Director of Fortune Brands, Inc. (consumer products, 2000-2011). |
+ The information above includes each Trustee's principal occupation during the last five years and other information relating to the experience, attributes, and skills relevant to each Trustee's qualifications to serve as a Trustee, which led to the conclusion that each Trustee should serve as a Trustee for each fund.
Advisory Board Member and Officers:
Correspondence intended for each officer and Peter S. Lynch may be sent to Fidelity Investments, 245 Summer Street, Boston, Massachusetts 02210. Officers appear below in alphabetical order.
Name, Year of Birth; Principal Occupation |
Peter S. Lynch (1944) |
Year of Election or Appointment: 2003 Member of the Advisory Board |
| Mr. Lynch also serves as Member of the Advisory Board of other Fidelity funds. Mr. Lynch is Vice Chairman and a Director of FMR (investment adviser firm) and FMR Co., Inc. (investment adviser firm). In addition, Mr. Lynch serves as a Trustee of Boston College and as the Chairman of the Inner-City Scholarship Fund. Previously, Mr. Lynch served on the Special Olympics International Board of Directors (1997-2006). |
Elizabeth Paige Baumann (1968) |
Year of Election or Appointment: 2012 Anti-Money Laundering (AML) Officer |
| Ms. Baumann also serves as AML Officer of other funds. She is Chief AML Officer of FMR LLC (diversified financial services company, 2012-present) and is an employee of Fidelity Investments. Previously, Ms. Baumann served as Vice President and Deputy Anti-Money Laundering Officer (2007-2012). |
Marc R. Bryant (1966) |
Year of Election or Appointment: 2015 Secretary and Chief Legal Officer (CLO) |
| Mr. Bryant also serves as Secretary and CLO of other funds. Mr. Bryant serves as CLO, Secretary, and Senior Vice President of Fidelity Management & Research Company (investment adviser firm, 2015-present) and FMR Co., Inc. (investment adviser firm, 2015-present); Secretary of Fidelity SelectCo, LLC (investment adviser firm, 2015-present) and Fidelity Investments Money Management, Inc. (investment adviser firm, 2015-present); and CLO of Fidelity Management & Research (Hong Kong) Limited (investment adviser firm, 2015-present). He is Senior Vice President and Deputy General Counsel of FMR LLC (diversified financial services company). Previously, Mr. Bryant served as Secretary and Chief Legal Officer of Fidelity Rutland Square Trust II (2010-2014) and Assistant Secretary of Fidelity's Fixed Income and Asset Allocation Funds (2013-2015). Prior to joining Fidelity Investments, Mr. Bryant served as a Senior Vice President and the Head of Global Retail Legal for AllianceBernstein L.P. (2006-2010), and as the General Counsel for ProFund Advisors LLC (2001-2006). |
William C. Coffey (1969) |
Year of Election or Appointment: 2009 Assistant Secretary |
| Mr. Coffey also serves as Assistant Secretary of other funds. He is Senior Vice President and Deputy General Counsel of FMR LLC (diversified financial services company, 2010-present), and is an employee of Fidelity Investments. Previously, Mr. Coffey served as Vice President and Associate General Counsel of FMR LLC (2005-2009). |
Timothy M. Cohen (1969) |
Year of Election or Appointment: 2014 Vice President of certain Equity Funds |
| Mr. Cohen also serves as Vice President of other funds. Mr. Cohen serves as Chief Compliance Officer of FMR Investment Management (U.K.) Limited (investment adviser firm, 2013-present) and is an employee of Fidelity Investments. Previously, Mr. Cohen served as a Director of FMR Investment Management (U.K.) Limited (2013-2015). |
Jonathan Davis (1968) |
Year of Election or Appointment: 2010 Assistant Treasurer |
| Mr. Davis also serves as Assistant Treasurer of other funds, and is an employee of Fidelity Investments. Previously, Mr. Davis served as Vice President and Associate General Counsel of FMR LLC (diversified financial services company, 2003-2010). |
Adrien E. Deberghes (1967) |
Year of Election or Appointment: 2008 Deputy Treasurer |
| Mr. Deberghes also serves as an officer of other funds. He is an employee of Fidelity Investments (2008-present). Prior to joining Fidelity Investments, Mr. Deberghes was Senior Vice President of Mutual Fund Administration at State Street Corporation (2007-2008), Senior Director of Mutual Fund Administration at Investors Bank & Trust (2005-2007), and Director of Finance for Dunkin' Brands (2000-2005). |
Stephanie J. Dorsey (1969) |
Year of Election or Appointment: 2010 Assistant Treasurer |
| Ms. Dorsey also serves as an officer of other funds. She is an employee of Fidelity Investments (2008-present) and has served in other fund officer roles. Prior to joining Fidelity Investments, Ms. Dorsey served as Treasurer (2004-2008) of the JPMorgan Mutual Funds and Vice President (2004-2008) of JPMorgan Chase Bank. |
Howard J. Galligan III (1966) |
Year of Election or Appointment: 2014 Chief Financial Officer |
| Mr. Galligan also serves as Chief Financial Officer of other funds. Mr. Galligan serves as President of Fidelity Pricing and Cash Management Services (FPCMS) (2014-present) and as a Director of Strategic Advisers, Inc. (investment adviser firm, 2008-present). Previously, Mr. Galligan served as Chief Administrative Officer of Asset Management (2011-2014) and Chief Operating Officer and Senior Vice President of Investment Support for Strategic Advisers, Inc. (2003-2011). |
Scott C. Goebel (1968) |
Year of Election or Appointment: 2015 Vice President |
| Mr. Goebel serves as Vice President of other funds and is an employee of Fidelity Investments (2001-present). Previously, Mr. Goebel served as Secretary of Fidelity SelectCo, LLC (investment adviser firm, 2013-2015), Fidelity Investments Money Management, Inc. (FIMM) (investment adviser firm, 2010-2015), and Fidelity Research and Analysis Company (FRAC) (investment adviser firm, 2010-2015); General Counsel, Secretary, and Senior Vice President of Fidelity Management & Research Company (investment adviser firm, 2008-2015) and FMR Co., Inc. (investment adviser firm, 2008-2015); Assistant Secretary of Fidelity Management & Research (Japan) Limited (investment adviser firm, 2008-2015) and FMR Investment Management (U.K.) Limited (investment adviser firm, 2008-2015); Chief Legal Officer (CLO) of Fidelity Management & Research (Hong Kong) Limited (investment adviser firm, 2008-2015); Secretary and CLO of certain Fidelity funds (2008-2015); Assistant Secretary of FIMM (2008-2010), FRAC (2008-2010), and certain funds (2007-2008); and as Vice President and Secretary of Fidelity Distributors Corporation (FDC) (2005-2007). |
Brian B. Hogan (1964) |
Year of Election or Appointment: 2009 Vice President |
| Mr. Hogan also serves as Trustee or Vice President of other funds. Mr. Hogan serves as a Director of Fidelity SelectCo, LLC (investment adviser firm, 2014-present) and President of the Equity Division of FMR (investment adviser firm, 2009-present). Previously, Mr. Hogan served as Senior Vice President, Equity Research of FMR (2006-2009) and as a portfolio manager. |
Chris Maher (1972) |
Year of Election or Appointment: 2013 Assistant Treasurer |
| Mr. Maher serves as Assistant Treasurer of other funds. Mr. Maher is Vice President of Valuation Oversight and is an employee of Fidelity Investments. Previously, Mr. Maher served as Vice President of Asset Management Compliance (2013), Vice President of the Program Management Group of FMR (investment adviser firm, 2010-2013), and Vice President of Valuation Oversight (2008-2010). |
Kenneth B. Robins (1969) |
Year of Election or Appointment: 2008 President and Treasurer |
| Mr. Robins also serves as an officer of other funds. Mr. Robins serves as Executive Vice President of Fidelity Investments Money Management, Inc. (FIMM) (investment adviser firm, 2013-present) and is an employee of Fidelity Investments (2004-present). Previously, Mr. Robins served in other fund officer roles. |
Stacie M. Smith (1974) |
Year of Election or Appointment: 2013 Deputy Treasurer |
| Ms. Smith also serves as an officer of other funds. She is an employee of Fidelity Investments (2009-present) and has served in other fund officer roles. Prior to joining Fidelity Investments, Ms. Smith served as Senior Audit Manager of Ernst & Young LLP (1996-2009). |
Renee Stagnone (1975) |
Year of Election or Appointment: 2013 Deputy Treasurer |
| Ms. Stagnone also serves as Deputy Treasurer of other funds. Ms. Stagnone is an employee of Fidelity Investments (1997-present). |
Linda J. Wondrack (1964) |
Year of Election or Appointment: 2014 Chief Compliance Officer |
| Ms. Wondrack also serves as Chief Compliance Officer of other funds. Ms. Wondrack is Executive Vice President and head of the Ethics Office and Asset Management Compliance for Fidelity Investments (2012-present). Ms. Wondrack also serves as Chief Compliance Officer of Fidelity SelectCo, LLC (investment adviser firm, 2014-present); Chief Compliance Officer of Impresa Management LLC (2013-present); and Chief Compliance Officer of FMR Co., Inc. (investment adviser firm), Fidelity Investments Money Management, Inc. (investment adviser firm), Fidelity Management & Research (Japan) Limited (investment adviser firm), FMR Investment Management (U.K.) Limited (investment adviser firm), Fidelity Management & Research (Hong Kong) (investment adviser firm), Fidelity Management & Research Company (investment adviser firm), FIAM LLC (investment adviser firm), and Strategic Advisers, Inc. (investment adviser firm), Ballyrock Investment Advisors LLC, and Northern Neck Investors LLC (2012-present). Previously, Ms. Wondrack served as Senior Vice President and Chief Compliance Officer for Columbia Management Investment Advisers, LLC (2005-2012); Chief Compliance Officer for certain funds within the Columbia Family of Funds (2007-2012); and Senior Vice President of Compliance Risk Management at Bank of America (2005-2010). |
Joseph F. Zambello (1957) |
Year of Election or Appointment: 2011 Deputy Treasurer |
| Mr. Zambello also serves as Deputy Treasurer of other funds. Mr. Zambello is an employee of Fidelity Investments (1991-present). Previously, Mr. Zambello served as Vice President of the Program Management Group of FMR (investment adviser firm, 2009-2011) and Vice President of the Transfer Agent Oversight Group (2005-2009). |
Annual Report
The Board of Trustees of each fund voted to pay to shareholders of record at the opening of business on record date, the following distributions per share derived from capital gains realized from sales of portfolio securities, and dividends derived from net investment income:
Fund | Pay Date | Record Date | Dividends | Capital Gains |
Series Emerging Markets Fund | 12/07/15 | 12/04/15 | $0.182 | $0.000 |
Class F | 12/07/15 | 12/04/15 | $0.206 | $0.000 |
Series International Growth Fund | 12/07/15 | 12/04/15 | $0.156 | $0.326 |
Class F | 12/07/15 | 12/04/15 | $0.181 | $0.326 |
Series International Small Cap Fund | 12/07/15 | 12/04/15 | $0.147 | $0.963 |
Class F | 12/07/15 | 12/04/15 | $0.175 | $0.963 |
Series International Value Fund | 12/07/15 | 12/04/15 | $0.204 | $0.000 |
Class F | 12/07/15 | 12/04/15 | $0.222 | $0.000 |
The funds hereby designate as capital gain dividend the amounts noted below for the taxable year ended October 31, 2015, or, if subsequently determined to be different, the net capital gain of such year.
Fund | |
Series International Growth Fund | $259,543,716 |
Series International Small Cap Fund | $146,692,628 |
A percentage of the dividends distributed during the fiscal year for the following funds qualifies for the dividends-received deduction for corporate shareholders.
Fund | December 05, 2014 |
Series Emerging Markets Fund | 0% |
Class F | 0% |
Series International Growth Fund | 12% |
Class F | 10% |
Series International Small Cap Fund | 8% |
Class F | 7% |
Series International Value Fund | 1% |
Class F | 1% |
Annual Report
Distributions - continued
A percentage of the dividends distributed during the fiscal year for the following funds may be taken into account as a dividend for purposes of the maximum rate under section 1(h)(11) of the Internal Revenue Code.
Fund | December 05, 2014 |
Series Emerging Markets Fund | 100% |
Class F | 100% |
Series International Growth Fund | 100% |
Class F | 100% |
Series International Small Cap Fund | 100% |
Class F | 100% |
Series International Value Fund | 96% |
Class F | 92% |
The amounts per share which represent income derived from sources within, and taxes paid to, foreign countries or possessions of the United States are as follows:
Fund | Pay Date | Income | Taxes |
Series Emerging Markets Fund | 12/08/14 | $0.1773 | $0.0383 |
Class F | 12/08/14 | $0.2043 | $0.0383 |
Series International Growth Fund | 12/08/14 | $0.2019 | $0.0159 |
Class F | 12/08/14 | $0.2279 | $0.0159 |
Series International Small Cap Fund | 12/08/14 | $0.1813 | $0.0233 |
Class F | 12/08/14 | $0.2133 | $0.0233 |
Series International Value Fund | 12/08/14 | $0.4476 | $0.0106 |
Class F | 12/08/14 | $0.4676 | $0.0106 |
The fund will notify shareholders in January 2016 of amounts for use in preparing 2015 income tax returns.
Annual Report
Fidelity Series Emerging Markets Fund
Fidelity Series International Growth Fund
Fidelity Series International Small Cap Fund
Fidelity Series International Value Fund
Each year, the Board of Trustees, including the Independent Trustees (together, the Board), votes on the renewal of the management contract with Fidelity Management & Research Company (FMR) and the sub-advisory agreements (together, the Advisory Contracts) for each fund. The Board, assisted by the advice of fund counsel and Independent Trustees' counsel, requests and considers a broad range of information relevant to the renewal of the Advisory Contracts throughout the year.
The Board meets regularly and, at each of its meetings, covers an extensive agenda of topics and materials and considers factors that are relevant to its annual consideration of the renewal of each fund's Advisory Contracts, including the services and support provided to each fund and its shareholders. The Board has established various standing committees (Committees), each composed of and chaired by Independent Trustees with varying backgrounds, to which the Board has assigned specific subject matter responsibilities in order to enhance effective decision-making by the Board. The Board, acting directly and through its Committees, requests and receives information concerning the annual consideration of the renewal of each fund's Advisory Contracts. The Board also meets as needed to consider matters specifically related to the Board's annual consideration of the renewal of the Advisory Contracts. Members of the Board may also meet with trustees of other Fidelity funds through ad hoc joint committees to discuss certain matters relevant to all of the Fidelity funds.
At its July 2015 meeting, the Board unanimously determined to renew each fund's Advisory Contracts. In reaching its determination, the Board considered all factors it believed relevant, including (i) the nature, extent, and quality of the services to be provided to each fund and its shareholders (including the investment performance of each fund); (ii) the competitiveness of each fund's management fee and total expense ratio relative to peer funds; (iii) the total costs of the services to be provided by and the profits to be realized by Fidelity from its relationship with each fund; and (iv) the extent to which (if any) economies of scale exist and would be realized as each fund grows, and whether any economies of scale are appropriately shared with fund shareholders.
In considering whether to renew the Advisory Contracts for each fund, the Board reached a determination, with the assistance of fund counsel and Independent Trustees' counsel and through the exercise of its business judgment, that the renewal of the Advisory Contracts was in the best interests of each fund and its shareholders and that the compensation payable under the Advisory Contracts was fair and reasonable. The Board's decision to renew the Advisory Contracts was not based on any single factor, but rather was based on a comprehensive consideration of all the information provided to the Board at its meetings throughout the year. The Board, in reaching its determination to renew the Advisory Contracts, was aware that shareholders of each fund have a broad range of investment choices available to them, including a wide choice among funds offered by Fidelity's competitors, and that each fund's shareholders, who have the opportunity to review and weigh the disclosure provided by the fund in its prospectus and other public disclosures, have chosen to invest in that fund, which is part of the Fidelity family of funds.
Annual Report
Board Approval of Investment Advisory Contracts and
Management Fees - continued
Nature, Extent, and Quality of Services Provided. The Board considered Fidelity's staffing as it relates to the funds, including the backgrounds of investment personnel of Fidelity, and also considered the funds' investment objectives, strategies, and related investment philosophies. The Independent Trustees also had discussions with senior management of Fidelity's investment operations and investment groups. The Board considered the structure of the portfolio manager compensation program and whether this structure provides appropriate incentives to act in the best interests of each fund. Additionally, the Board considered the portfolio managers' investments, if any, in the funds that they manage.
Resources Dedicated to Investment Management and Support Services. The Board and the Fund Oversight and Research Committees reviewed the general qualifications and capabilities of Fidelity's investment staff, including its size, education, experience, and resources, as well as Fidelity's approach to recruiting, training, managing, and compensating investment personnel. The Board noted that Fidelity has continued to increase the resources devoted to non-U.S. offices, including expansion of Fidelity's global investment organization. The Board also noted that Fidelity's analysts have extensive resources, tools and capabilities that allow them to conduct sophisticated quantitative and fundamental analysis, as well as credit analysis of issuers, counterparties and guarantors. Further, the Board considered that Fidelity's investment professionals have sufficient access to global information and data so as to provide competitive investment results over time, and that those professionals also have access to sophisticated tools that permit them to assess portfolio construction and risk and performance attribution characteristics continuously, as well as to transmit new information and research conclusions rapidly around the world. Additionally, in its deliberations, the Board considered Fidelity's trading, risk management, and compliance capabilities and resources, which are integral parts of the investment management process.
Shareholder and Administrative Services. The Board considered (i) the nature, extent, quality, and cost of advisory, administrative, and shareholder services performed by FMR, the sub-advisers (together with FMR, the Investment Advisers), and their affiliates under the Advisory Contracts and under separate agreements covering transfer agency, pricing and bookkeeping, and securities lending services for each fund; (ii) the nature and extent of the supervision of third party service providers, principally custodians and subcustodians; and (iii) the resources devoted to, and the record of compliance with, each fund's compliance policies and procedures. The Board also reviewed the allocation of fund brokerage, including allocations to brokers affiliated with the Investment Advisers, the use of brokerage commissions to pay fund expenses, and the use of "soft" commission dollars to pay for research services.
Annual Report
The Board noted that the growth of fund assets over time across the complex allows Fidelity to reinvest in the development of services designed to enhance the value or convenience of the Fidelity funds as investment vehicles. These services include 24-hour access to account information and market information through telephone representatives and over the Internet, investor education materials and asset allocation tools, and the expanded availability of Fidelity Investor Centers.
In 2014, the Board formed an ad hoc Committee on Transfer Agency Fees to review the variety of transfer agency fee structures throughout the industry and Fidelity's competitive positioning with respect to industry participants.
Investment in a Large Fund Family. The Board considered the benefits to shareholders of investing in a Fidelity fund, including the benefits of investing in a fund that is part of a large family of funds offering a variety of investment disciplines and providing a large variety of mutual fund investor services. The Board noted that Fidelity had taken, or had made recommendations that resulted in the Fidelity funds taking, a number of actions over the previous year that benefited particular funds, including (i) continuing to dedicate additional resources to investment research and to the support of the senior management team that oversees asset management; (ii) continuing efforts to enhance Fidelity's global research capabilities; (iii) launching new funds and making other enhancements to meet client needs; (iv) reducing management fees and total expenses for certain index funds and diversified international funds; (v) continuing to launch dedicated lower cost underlying funds to meet portfolio construction needs related to expanding underlying fund options for Fidelity funds of funds, specifically for the Freedom Fund product lines; (vi) rationalizing product lines and gaining increased efficiencies through fund mergers; (vii) launching active fixed-income exchange-traded funds; (viii) continuing to develop, acquire and implement systems and technology to improve services to the funds and information security and to increase efficiency; (ix) implementing investment enhancements to further strengthen Fidelity's target date product line to increase investors' probability of success in achieving their goals; (x) modifying the eligibility criteria for certain share classes to accommodate roll-over assets from employer-sponsored retirement plans; (xi) launching a new Class W of the Freedom Index Funds to attract and retain Fidelity record-kept retirement plan assets; and (xii) implementing changes to Fidelity's money market product line in response to recent money market regulatory reforms.
Investment Performance. The Board considered whether each fund has operated in accordance with its investment objective, as well as its record of compliance with its investment restrictions and its performance history. The Board noted that there was a portfolio management change for Fidelity Series Emerging Markets Fund in May 2012, October 2013, and September 2014.
Annual Report
Board Approval of Investment Advisory Contracts and
Management Fees - continued
The Board took into account discussions with representatives of the Investment Advisers about fund investment performance that occur at Board meetings throughout the year. In this regard the Board noted that as part of regularly scheduled fund reviews and other reports to the Board on fund performance, the Board considers annualized return information for each fund, for different time periods, measured against a securities market index ("benchmark index") and a peer group of funds with similar objectives ("peer group"), if any. In its evaluation of fund investment performance, the Board gave particular attention to information indicating changes in performance of certain Fidelity funds for specific time periods and discussed with the Investment Advisers the reasons for any overperformance or underperformance.
In addition to reviewing absolute and relative fund performance, the Independent Trustees periodically consider the appropriateness of fund performance metrics in evaluating the results achieved. In general, the Independent Trustees believe that fund performance should be evaluated based on net performance (after fees and expenses) of both the highest performing and lowest performing fund share classes, where applicable, compared to appropriate benchmark indices, over appropriate time periods that may include full market cycles, and compared to peer groups, as applicable, over the same periods, taking into account relevant factors including the following: general market conditions; issuer-specific information; and fund cash flows and other factors.
The Independent Trustees recognize that shareholders evaluate performance on a net basis over their own holding periods, for which one-, three-, and five-year periods are often used as a proxy. For this reason, the performance information reviewed by the Board also included net cumulative calendar year total return information for each fund and an appropriate benchmark index and peer group for the most recent one-, three-, and five-year periods, as shown below. Returns are shown compared to the 25th percentile (top of box, 75% beaten) and 75th percentile (bottom of box, 25% beaten) of the peer universe. For each fund (except Fidelity Series Emerging Markets Fund), returns of the benchmark index are "net MA," i.e., adjusted for tax withholding rates applicable to U.S.-based funds organized as Massachusetts business trusts.
Annual Report
Fidelity Series Emerging Markets Fund
Fidelity Series International Growth Fund
Annual Report
Board Approval of Investment Advisory Contracts and
Management Fees - continued
Fidelity Series International Small Cap Fund
Fidelity Series International Value Fund
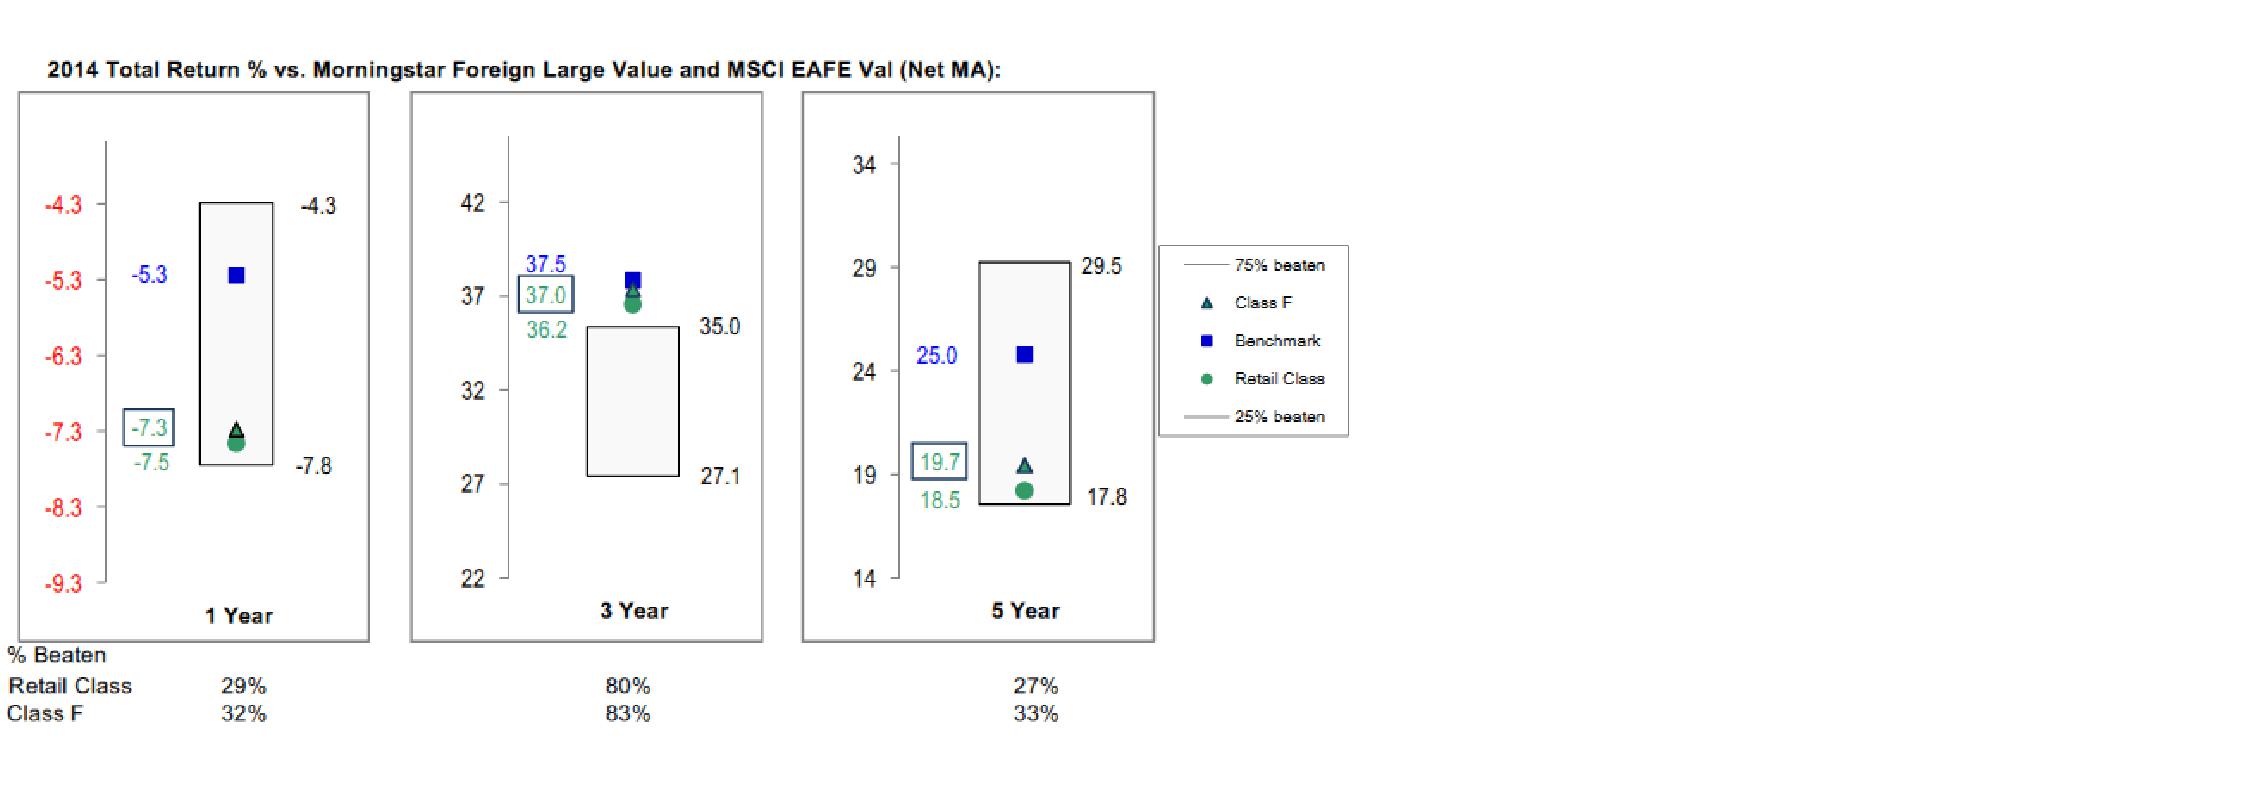
The Board also considered that each fund's (except Fidelity Series Emerging Markets Fund's) management fee is subject to upward or downward adjustment depending upon whether, and to what extent, the fund's investment performance for the performance period exceeds, or is exceeded by, a securities index, thus leading to a performance adjustment for the same period. The Board noted that the performance adjustment provides FMR with a strong economic incentive to seek to achieve superior performance for each fund's shareholders and helps to more closely align the interests of FMR and the shareholders of each fund.
Annual Report
Based on its review, the Board concluded that the nature, extent, and quality of services provided to each fund under the Advisory Contracts should benefit the shareholders of each fund.
Competitiveness of Management Fee and Total Expense Ratio. The Board considered each fund's management fee and total expense ratio compared to "mapped groups" of competitive funds and classes created for the purpose of facilitating the Trustees' competitive analysis of management fees and total expenses. Fidelity creates "mapped groups" by combining similar Lipper investment objective categories that have comparable investment mandates. Combining Lipper investment objective categories aids the Board's management fee and total expense ratio comparisons by broadening the competitive group used for comparison.
Management Fee. The Board considered two proprietary management fee comparisons for the 12-month periods shown in basis points (BP) in the charts below. The group of Lipper funds used by the Board for management fee comparisons is referred to below as the "Total Mapped Group." For Fidelity Series International Small Cap Fund, the Total Mapped Group is broader than the Lipper peer group used by the Board for performance comparisons because the Total Mapped Group combines several Lipper investment objective categories while the Lipper peer group does not. The Total Mapped Group comparison focuses on a fund's standing in terms of gross management fees before expense reimbursements or caps, and without giving effect to a fund's performance adjustment (if applicable), relative to the total universe of funds with comparable investment mandates, regardless of whether their management fee structures also are comparable. Funds with comparable investment mandates offer exposure to similar types of securities. Funds with comparable management fee structures have similar management fee contractual arrangements (e.g., flat rate charged for advisory services, all-inclusive fee rate, etc.). "TMG %" represents the percentage of funds in the Total Mapped Group that had management fees that were lower than a fund's. For example, a hypothetical TMG % of 20% would mean that 80% of the funds in the Total Mapped Group had higher, and 20% had lower, management fees than a fund. The funds' actual TMG %s and the number of funds in the Total Mapped Group are in the charts below. The "Asset-Size Peer Group" (ASPG) comparison focuses on a fund's standing relative to a subset of non-Fidelity funds within the Total Mapped Group that are similar in size and management fee structure without taking into account performance adjustments, if any. For example, if a fund is in the first quartile of the ASPG, the fund's management fee ranks in the least expensive or lowest 25% of funds in the ASPG. The ASPG represents at least 15% of the funds in the Total Mapped Group with comparable asset size and management fee structures, subject to a minimum of 50 funds (or all funds in the Total Mapped Group if fewer than 50). Additional information, such as the ASPG quartile in which a fund's management fee rate ranked and the impact of a fund's performance adjustment (if applicable), is also included in the charts and considered by the Board.
Annual Report
Board Approval of Investment Advisory Contracts and
Management Fees - continued
Fidelity Series Emerging Markets Fund
Fidelity Series International Growth Fund
Annual Report
Fidelity Series International Small Cap Fund
Fidelity Series International Value Fund
The Board noted that each fund's management fee rate ranked below the median of its Total Mapped Group and below the median of its ASPG for 2014. The Board also noted the effect of each of Fidelity Series International Growth Fund's, Fidelity Series International Small Cap Fund's, and Fidelity Series International Value Fund's performance adjustment, if any, on the fund's management fee ranking.
Annual Report
Board Approval of Investment Advisory Contracts and
Management Fees - continued
The Board noted that, in 2014, the ad hoc Committee on Group Fee was formed by it and other Fidelity fund boards to conduct an in-depth review of the "group fee" component of the management fee of funds with such management fee structures. Committee focus included the mechanics of the group fee, the competitive landscape of group fee structures, Fidelity funds with no group fee component and investment products not included in group fee assets. The Board also considered that, for funds subject to the group fee, FMR agreed to voluntarily waive fees over a specified period of time in amounts designed to account for assets converted from certain funds to certain collective investment trusts.
The Board also noted that, in 2013, the ad hoc Committee on Management Fees was formed to conduct an in-depth review of the management fee rates of Fidelity's active equity mutual funds. The Committee focused on the following areas: (i) standard fee structures; (ii) research consumption and trading evolution; (iii) management fee competitiveness/profitability by category; and (iv) factors that drive institutional pricing.
Based on its review, the Board concluded that each fund's management fee is fair and reasonable in light of the services that the fund receives and the other factors considered.
Total Expense Ratio. In its review of the total expense ratio of each class of each fund, the Board considered the fund's management fee as well as other fund or class expenses, as applicable, such as transfer agent fees, pricing and bookkeeping fees, and custodial, legal, and audit fees. The Board noted the impact of Fidelity Series International Growth Fund's, Fidelity Series International Small Cap Fund's, and Fidelity Series International Value Fund's performance adjustment. The Board also noted that Fidelity may agree to waive fees and expenses from time to time, and the extent to which, if any, it has done so for the funds. As part of its review, the Board also considered the current and historical total expense ratios of each class of each fund compared to competitive fund median expenses. Each class of each fund is compared to those funds and classes in the Total Mapped Group (used by the Board for management fee comparisons) that have a similar sales load structure.
The Board noted that the total expense ratio of each class of each fund ranked below its competitive median for 2014.
Fees Charged to Other Fidelity Clients. The Board also considered Fidelity fee structures and other information with respect to clients of Fidelity, such as other funds advised or subadvised by Fidelity, pension plan clients, and other institutional clients with similar mandates. The Board noted the findings of the 2013 ad hoc joint committee (created with the board of other Fidelity funds), which reviewed and compared Fidelity's institutional investment advisory business with its business of providing services to the Fidelity funds, including the differences in services provided, fees charged, and costs incurred, as well as competition in their respective marketplaces.
Annual Report
Based on its review of total expense ratios and fees charged to other Fidelity clients, the Board concluded that the total expense ratio of each class of each fund was reasonable in light of the services that the fund and its shareholders receive and the other factors considered.
Costs of the Services and Profitability. The Board considered the revenues earned and the expenses incurred by Fidelity in conducting the business of developing, marketing, distributing, managing, administering and servicing each fund and servicing each fund's shareholders. The Board also considered the level of Fidelity's profits in respect of all the Fidelity funds.
On an annual basis, Fidelity presents to the Board information about the profitability of its relationship with each fund. Fidelity calculates profitability information for each fund, as well as aggregate profitability information for groups of Fidelity funds and all Fidelity funds, using a series of detailed revenue and cost allocation methodologies which originate with the books and records of Fidelity on which Fidelity's audited financial statements are based. The Audit Committee of the Board reviews any significant changes from the prior year's methodologies.
PricewaterhouseCoopers LLP (PwC), independent registered public accounting firm and auditor to Fidelity and certain Fidelity funds, has been engaged annually by the Board as part of the Board's assessment of Fidelity's profitability analysis. PwC's engagement includes the review and assessment of the methodologies used by Fidelity in determining the revenues and expenses attributable to Fidelity's mutual fund business, and completion of agreed-upon procedures in respect of the mathematical accuracy of fund profitability and its conformity to established allocation methodologies. After considering PwC's reports issued under the engagement and information provided by Fidelity, the Board concluded that while other allocation methods may also be reasonable, Fidelity's profitability methodologies are reasonable in all material respects.
The Board also reviewed Fidelity's non-fund businesses and fall-out benefits related to the mutual fund business as well as cases where Fidelity's affiliates may benefit from or be related to the funds' business.
The Board considered the costs of the services provided by and the profits realized by Fidelity in connection with the operation of each fund and was satisfied that the profitability was not excessive.
Economies of Scale. The Board considered whether there have been economies of scale in respect of the management of the Fidelity funds, whether the Fidelity funds (including each fund) have appropriately benefited from any such economies of scale, and whether there is potential for realization of any further economies of scale. The Board considered the extent to which each fund will benefit from economies of scale as assets grow through increased services to the fund, through waivers or reimbursements, or through fee or expense ratio reductions. The Board also noted that in 2013, it and the boards of other Fidelity funds created an ad hoc committee (the Economies of Scale Committee) to analyze whether Fidelity attains economies of scale in respect of the management and servicing of the Fidelity funds, whether the Fidelity funds have appropriately benefited from such economies of scale, and whether there is potential for realization of any further economies of scale.
Annual Report
Board Approval of Investment Advisory Contracts and
Management Fees - continued
The Board recognized that each fund's management contract incorporates a "group fee" structure, which provides for lower group fee rates as total group assets increase, and for higher group fee rates as total group assets decrease (with "group assets" defined to include fund assets under FMR's management plus sector fund assets previously under FMR's management and currently managed by Fidelity SelectCo, LLC). FMR calculates the group fee rates based on a tiered asset "breakpoint" schedule that varies based on asset class. The Board considered that the group fee is designed to deliver the benefits of economies of scale to fund shareholders when total Fidelity fund assets increase, even if assets of any particular fund are unchanged or have declined, because some portion of Fidelity's costs are attributable to services provided to all Fidelity funds, and all funds benefit if those costs can be allocated among more assets. The Board also considered that although each fund is offered only to other Fidelity funds, it continues to incur investment management expenses. The Board further noted that each fund may continue to realize benefits from the group fee structure, even though assets may not be expected to grow significantly at the fund level. The Board concluded that, given the group fee structure, fund shareholders will benefit from lower management fees as group assets increase at the fund complex level, regardless of whether Fidelity achieves any such economies of scale.
The Board concluded, taking into account the analysis of the Economies of Scale Committee, that economies of scale, if any, are being appropriately shared between fund shareholders and Fidelity.
Additional Information Requested by the Board. In order to develop fully the factual basis for consideration of the Fidelity funds' Advisory Contracts, the Board requested and received additional information on certain topics, including: (i) fund performance trends and Fidelity's long-term strategies for certain funds; (ii) the various share classes employed by Fidelity and the attributes of each class, together with similar information on the distribution and servicing payments made by Fidelity or the funds to third-party participants in the distribution channels; (iii) fund profitability, and fund performance in relation to fund profitability; (iv) the methodology with respect to evaluating competitive fund data and peer group classifications and fee comparisons; (v) annual fund profitability margins, with particular focus on certain funds with negative margins; (vi) the realization of fall-out benefits in certain Fidelity business units; (vii) economies of scale and the way in which they are shared with fund shareholders; (viii) Fidelity's group fee structures, including the group fee schedule of breakpoints; (ix) the impact of cost containment measures on the funds; and (x) the transfer agent fee structure.
Annual Report
Based on its evaluation of all of the conclusions noted above, and after considering all factors it believed relevant, the Board concluded that the advisory fee structures are fair and reasonable, and that each fund's Advisory Contracts should be renewed.
Annual Report
Investment Adviser
Fidelity Management & Research Company
Boston, MA
Investment Sub-Advisers
FMR Co., Inc.
FMR Investment Management
(U.K.) Limited
Fidelity Management & Research (Hong Kong) Limited
Fidelity Management & Research (Japan) Limited
FIL Investment Advisors
FIL Investment Advisors (UK) Limited
FIL Investments (Japan) Limited
General Distributor
Fidelity Distributors Corporation
Smithfield, RI
Transfer and Service Agents
Fidelity Investments Institutional Operations Company, Inc.
Boston, MA
Fidelity Service Company, Inc.
Boston, MA
Custodians
The Northern Trust Company
Chicago, IL
Fidelity Series Emerging Markets Fund
State Street Bank and Trust Company
Quincy, MA
Fidelity Series International Growth Fund, Fidelity Series International Small Cap Fund, Fidelity Series International Value Fund
(Fidelity Investment logo)(registered trademark)
Corporate Headquarters
245 Summer St., Boston, MA 02210
www.fidelity.com
GSV-S-ANN-1215
1.907943.105
Item 2. Code of Ethics
As of the end of the period, October 31, 2015, Fidelity Investment Trust (the trust) has adopted a code of ethics, as defined in Item 2 of Form N-CSR, that applies to its President and Treasurer and its Chief Financial Officer. A copy of the code of ethics is filed as an exhibit to this Form N-CSR.
Item 3. Audit Committee Financial Expert
The Board of Trustees of the trust has determined that Joseph Mauriello is an audit committee financial expert, as defined in Item 3 of Form N-CSR. Mr. Mauriello is independent for purposes of Item 3 of Form N-CSR.
Item 4. Principal Accountant Fees and Services
Fees and Services
The following table presents fees billed by Deloitte & Touche LLP, the member firms of Deloitte Touche Tohmatsu, and their respective affiliates (collectively, "Deloitte Entities") in each of the last two fiscal years for services rendered to Fidelity Emerging Europe, Middle East, Africa (EMEA) Fund, Fidelity Global Equity Income Fund, Fidelity International Small Cap Fund, Fidelity International Small Cap Opportunities Fund, Fidelity International Value Fund, Fidelity Series Emerging Markets Fund, Fidelity Series International Small Cap Fund, Fidelity Series International Value Fund, and Fidelity Total International Equity Fund (the "Funds"):
Services Billed by Deloitte Entities
October 31, 2015 FeesA
| Audit Fees | Audit-Related Fees | Tax Fees | All Other Fees |
Fidelity Emerging Europe, Middle East, Africa (EMEA) Fund | $51,000 | $- | $6,000 | $600 |
Fidelity Global Equity Income Fund | $47,000 | $- | $6,000 | $600 |
Fidelity International Small Cap Fund | $127,000 | $- | $6,900 | $800 |
Fidelity International Small Cap Opportunities Fund | $52,000 | $- | $5,800 | $800 |
Fidelity International Value Fund | $50,000 | $- | $5,800 | $700 |
Fidelity Series Emerging Markets Fund | $44,000 | $- | $7,200 | $3,000 |
Fidelity Series International Small Cap Fund | $46,000 | $- | $5,800 | $1,200 |
Fidelity Series International Value Fund | $46,000 | $- | $5,800 | $3,300 |
Fidelity Total International Equity Fund | $60,000 | $- | $6,700 | $700 |
October 31, 2014 FeesA
| Audit Fees | Audit-Related Fees | Tax Fees | All Other Fees |
Fidelity Emerging Europe, Middle East, Africa (EMEA) Fund | $50,000 | $- | $6,000 | $600 |
Fidelity Global Equity Income Fund | $46,000 | $- | $6,000 | $600 |
Fidelity International Small Cap Fund | $124,000 | $- | $6,900 | $800 |
Fidelity International Small Cap Opportunities Fund | $50,000 | $- | $5,800 | $700 |
Fidelity International Value Fund | $48,000 | $- | $5,800 | $600 |
Fidelity Series Emerging Markets Fund | $42,000 | $- | $6,900 | $2,300 |
Fidelity Series International Small Cap Fund | $45,000 | $- | $5,800 | $1,200 |
Fidelity Series International Value Fund | $45,000 | $- | $5,800 | $3,300 |
Fidelity Total International Equity Fund | $57,000 | $- | $6,700 | $700 |
A Amounts may reflect rounding.
The following table presents fees billed by PricewaterhouseCoopers LLP ("PwC") in each of the last two fiscal years for services rendered to Fidelity Emerging Markets Discovery Fund, Fidelity Global Commodity Stock Fund, Fidelity International Discovery Fund, Fidelity International Growth Fund, Fidelity Series International Growth Fund, and Fidelity Total Emerging Markets Fund (the "Funds"):
Services Billed by PwC
October 31, 2015 FeesA
| Audit Fees | Audit-Related Fees | Tax Fees | All Other Fees |
Fidelity Emerging Markets Discovery Fund | $56,000 | $- | $5,200 | $1,800 |
Fidelity Global Commodity Stock Fund | $45,000 | $- | $3,200 | $1,800 |
Fidelity International Discovery Fund | $82,000 | $- | $23,500 | $5,700 |
Fidelity International Growth Fund | $59,000 | $- | $5,500 | $2,200 |
Fidelity Series International Growth Fund | $59,000 | $- | $10,500 | $6,200 |
Fidelity Total Emerging Markets Fund | $63,000 | $- | $4,400 | $1,800 |
October 31, 2014 FeesA
| Audit Fees | Audit-Related Fees | Tax Fees | All Other Fees |
Fidelity Emerging Markets Discovery Fund | $53,000 | $- | $5,300 | $1,700 |
Fidelity Global Commodity Stock Fund | $42,000 | $- | $3,000 | $1,800 |
Fidelity International Discovery Fund | $80,000 | $- | $11,300 | $5,600 |
Fidelity International Growth Fund | $56,000 | $- | $5,400 | $1,900 |
Fidelity Series International Growth Fund | $58,000 | $- | $10,000 | $6,100 |
Fidelity Total Emerging Markets Fund | $60,000 | $- | $4,500 | $1,700 |
A Amounts may reflect rounding.
The following table presents fees billed by PwC and Deloitte Entities that were required to be approved by the Audit Committee for services that relate directly to the operations and financial reporting of the Funds and that are rendered on behalf of Fidelity Management & Research Company ("FMR") and entities controlling, controlled by, or under common control with FMR (not including any sub-adviser whose role is primarily portfolio management and is subcontracted with or overseen by another investment adviser) that provide ongoing services to the Funds ("Fund Service Providers"):
Services Billed by Deloitte Entities
| October 31, 2015A | October 31, 2014A |
Audit-Related Fees | $- | $150,000 |
Tax Fees | $10,000 | $- |
All Other Fees | $60,000 | $590,000 |
A Amounts may reflect rounding.
Services Billed by PwC
| October 31, 2015A | October 31, 2014A |
Audit-Related Fees | $3,465,000 | $4,430,000 |
Tax Fees | $- | $- |
All Other Fees | $- | $- |
A Amounts may reflect rounding.
"Audit-Related Fees" represent fees billed for assurance and related services that are reasonably related to the performance of the fund audit or the review of the fund's financial statements and that are not reported under Audit Fees.
"Tax Fees" represent fees billed for tax compliance, tax advice or tax planning that relate directly to the operations and financial reporting of the fund.
"All Other Fees" represent fees billed for services provided to the fund or Fund Service Provider, a significant portion of which are assurance related, that relate directly to the operations and financial reporting of the fund, excluding those services that are reported under Audit Fees, Audit-Related Fees or Tax Fees.
Assurance services must be performed by an independent public accountant.
* * *
The aggregate non-audit fees billed by PwC and Deloitte Entities for services rendered to the Funds, FMR (not including any sub-adviser whose role is primarily portfolio management and is subcontracted with or overseen by another investment adviser), and any Fund Service Provider for each of the last two fiscal years of the Funds are as follows:
Billed By | October 31, 2015 A | October 31, 2014 A |
PwC | $4,835,000 | $5,700,000 |
Deloitte Entities | $240,000 | $1,890,000 |
A Amounts may reflect rounding.
The trust's Audit Committee has considered non-audit services that were not pre-approved that were provided by PwC and Deloitte Entities to Fund Service Providers to be compatible with maintaining the independence of PwC and Deloitte Entities in their audits of the Funds, taking into account representations from PwC and Deloitte Entities, in accordance with Public Company Accounting Oversight Board rules, regarding their independence from the Funds and their related entities and FMR's review of the appropriateness and permissibility under applicable law of such non-audit services prior to their provision to the Fund Service Providers.
Audit Committee Pre-Approval Policies and Procedures
The trust's Audit Committee must pre-approve all audit and non-audit services provided by a fund's independent registered public accounting firm relating to the operations or financial reporting of the fund. Prior to the commencement of any audit or non-audit services to a fund, the Audit Committee reviews the services to determine whether they are appropriate and permissible under applicable law.
The Audit Committee has adopted policies and procedures to, among other purposes, provide a framework for the Committee's consideration of non-audit services by the audit firms that audit the Fidelity funds. The policies and procedures require that any non-audit service provided by a fund audit firm to a Fidelity fund and any non-audit service provided by a fund auditor to a Fund Service Provider that relates directly to the operations and financial reporting of a Fidelity fund ("Covered Service") are subject to approval by the Audit Committee before such service is provided.
All Covered Services must be approved in advance of provision of the service either: (i) by formal resolution of the Audit Committee, or (ii) by oral or written approval of the service by the Chair of the Audit Committee (or if the Chair is unavailable, such other member of the Audit Committee as may be designated by the Chair to act in the Chair's absence). The approval contemplated by (ii) above is permitted where the Treasurer determines that action on such an engagement is necessary before the next meeting of the Audit Committee.
Non-audit services provided by a fund audit firm to a Fund Service Provider that do not relate directly to the operations and financial reporting of a Fidelity fund are reported to the Audit Committee on a periodic basis.
Non-Audit Services Approved Pursuant to Rule 2-01(c)(7)(i)(C) and (ii) of Regulation S-X ("De Minimis Exception")
There were no non-audit services approved or required to be approved by the Audit Committee pursuant to the De Minimis Exception during the Funds' last two fiscal years relating to services provided to (i) the Funds or (ii) any Fund Service Provider that relate directly to the operations and financial reporting of the Funds.
Item 5. Audit Committee of Listed Registrants
Not applicable.
Item 6. Investments
(a) Not applicable.
(b) Not applicable
Item 7. Disclosure of Proxy Voting Policies and Procedures for Closed-End Management Investment Companies
Not applicable.
Item 8. Portfolio Managers of Closed-End Management Investment Companies
Not applicable.
Item 9. Purchase of Equity Securities by Closed-End Management Investment Company and Affiliated Purchasers
Not applicable.
Item 10. Submission of Matters to a Vote of Security Holders
There were no material changes to the procedures by which shareholders may recommend nominees to the trust's Board of Trustees.
Item 11. Controls and Procedures
(a)(i) The President and Treasurer and the Chief Financial Officer have concluded that the trust's disclosure controls and procedures (as defined in Rule 30a-3(c) under the Investment Company Act) provide reasonable assurances that material information relating to the trust is made known to them by the appropriate persons, based on their evaluation of these controls and procedures as of a date within 90 days of the filing date of this report.
(a)(ii) There was no change in the trust's internal control over financial reporting (as defined in Rule 30a-3(d) under the Investment Company Act) that occurred during the second fiscal quarter of the period covered by this report that has materially affected, or is reasonably likely to materially affect, the trust's internal control over financial reporting.
Item 12. Exhibits
(a) | (1) | Code of Ethics pursuant to Item 2 of Form N-CSR is filed and attached hereto as EX-99.CODE ETH. |
(a) | (2) | Certification pursuant to Rule 30a-2(a) under the Investment Company Act of 1940 (17 CFR 270.30a-2(a)) is filed and attached hereto as Exhibit 99.CERT. |
(a) | (3) | Not applicable. |
(b) | | Certification pursuant to Rule 30a-2(b) under the Investment Company Act of 1940 (17 CFR 270.30a-2(b)) is furnished and attached hereto as Exhibit 99.906CERT. |
SIGNATURES
Pursuant to the requirements of the Securities Exchange Act of 1934 and the Investment Company Act of 1940, the registrant has duly caused this report to be signed on its behalf by the undersigned, thereunto duly authorized.
Fidelity Investment Trust
By: | /s/Kenneth B. Robins |
| Kenneth B. Robins |
| President and Treasurer |
| |
Date: | December 28, 2015 |
Pursuant to the requirements of the Securities Exchange Act of 1934 and the Investment Company Act of 1940, this report has been signed below by the following persons on behalf of the registrant and in the capacities and on the dates indicated.
By: | /s/Kenneth B. Robins |
| Kenneth B. Robins |
| President and Treasurer |
| |
Date: | December 28, 2015 |
By: | /s/Howard J. Galligan III |
| Howard J. Galligan III |
| Chief Financial Officer |
| |
Date: | December 28, 2015 |